Preprint
Article

Efficiency and Interference Verification of a HONO Collection System Using an Ultrasonic Nozzle Coupled with a Recirculating Spray Chamber for Ambient Air Monitoring

This version is not peer-reviewed.

Submitted:

04 September 2024

Posted:

05 September 2024

You are already at the latest version

A peer-reviewed article of this preprint also exists.

Abstract
This study explores the efficiency and applicability of a HONO collection system that incorporates an ultrasonic nozzle and spray chamber for the measurement of ambient air. The system demonstrates (1) a remarkable efficiency of 97.7% across two serial stages, (2) lower detection limits of 0.1 ppbv for HONO, and (3) absence of interference from NO2 or OH radicals. Practical ambient monitoring with the HONO collection system revealed typical diurnal variations in HONO, O3, and HNO3 concentrations, aligning with photolysis dynamics. Notably, HONO concentrations peaked at 0.37 ppb during nighttime and decreased to 0.27 ppb by midday. O3 demonstrated an inverse relationship with HONO, especially during ozone depletion phases, with r2 values of 0.94, 0.81, and 0.52 across various intervals. The HONO/NOx ratio during periods of enhanced HONO suggested the presence of additional formation mechanisms beyond heterogeneous NOx reactions. Moreover, ozone levels often fell below 20 ppb, indicating a consistent inverse correlation with HONO, thereby confirming periods and highlighting further mechanisms of HONO formation beyond heterogeneous NOx reactions. The real-time atmospheric chemical reactions involving HONO, monitored concurrently with O3 and NOx, were effectively validated by the HONO collection system employed in this investigation.
Keywords: 
Subject: 
Environmental and Earth Sciences  -   Environmental Science

1. Introduction

Nitrous acid (HONO) is acknowledged as a significant precursor of hydroxyl radicals, as suggested by [1,2]. Previous research highlights an average production rate of OH radicals stemming from HONO to be 0.63 ppb/hr, with its maximum contribution rate surpassing 90% [3]. Hendrick et al. [4] similarly pinpointed HONO as a dominant factor in OH radical production, underscoring its crucial role in their generation. Although the specific sources of atmospheric HONO remain somewhat ambiguous, the interaction between NO and OH is often cited as the principal pathway [2]. Potential sources also include emissions from asphalt surfaces [5], direct vehicular emissions from gasoline combustion [6], soil nitrite emissions [7], and biological nitrate reduction processes in soils [8].
Several methods exist for the collection and analysis of atmospheric HONO, typically divided into wet chemical and spectroscopic approaches. Table 1 details the variety of techniques previously employed. Prominent wet chemical methods encompass the Monitor for Aerosols and Gases in ambient Air (MARGA), the long-path absorption photometer (LOPAP), and denuder techniques, which capture HONO in a solution for subsequent analysis in a liquid phase [9,10,11,12,13]. In contrast, spectroscopic methods frequently involve Differential Optical Absorption Spectroscopy (DOAS) and tunable laser absorption spectroscopy (TLAS) [14,15].
Previous research has explored various strategies for measuring atmospheric HONO. Song et al. [16] documented HONO levels using a high-efficiency denuder scrubber paired with an ion chromatograph (IC), noting an average concentration of 0.36 ppb. Moreover, Gil et al. [17] utilized a quantum cascade-tunable infrared laser differential absorption spectrometer, recording an average concentration of 0.93 ppbv. Kim et al. [11] implemented MARGA to concurrently measure HNO3 and HONO at hourly intervals, finding concentrations that spanned roughly 1 to 7 µg/m3.
In this research, a spray chamber integrated with an ultrasonic nozzle system was developed to collect HONO, alongside comparisons with PM2.5 and other gaseous components. The ultrasonic nozzle system, applied in diverse fields such as food, pharmaceuticals, and coatings, is noted for its ability to generate droplets of consistent size [18,19,20]. This system offers economic benefits by facilitating the application of IC under similar conditions employed in conventional PM2.5 ion component analysis.

2. Methods

2.1. Sampling Site

HONO, PM2.5, and additional gases were sampled from the second floor of the College of Engineering Building No. 3 at Mokpo National University, Korea. A duct extending from the second-floor laboratory to the rooftop facilitated the transport of air, driven by a blower, to the measurement devices; these devices accessed the air via an inlet located within the duct (Figure 1). The sampling period occurred from 18:00 on December 11, 2023, to 15:00 on December 25, 2023. In this investigation, PM2.5 was analyzed at 1-hour intervals, while HONO and HNO3 were analyzed every 40 minutes, and other gases every minute. Meteorological data was acquired from a meteorological station located approximately 10 km away from the sampling site through the Open MET Data Portal (www.data.kma.go.kr).

2.2. Analytical Method for PM2.5 and Gaseous Compounds

The mass concentration of PM2.5 was determined using Teflon filter sampling and the beta-ray absorption method (5014i Beta Continuous Ambient Particulate Monitor, Thermo, USA). We conducted three-hour integrated sampling employing Teflon filters with a Mid-Volume Air Sampler (MAS-16, APM, Korea) coupled with a cyclone (URG-2000-30EC, URG Corp., USA), which operated at a flow rate of 42 L/min. The beta-ray absorption method involved collection at a flow rate of 16.7 L/min, with hourly mass concentrations adjusted based on the weight change of the Teflon filter pre-and post-sampling. To collect PM2.5 from the main duct on the roof, we adjusted the cross-sectional area of the inlet to achieve isokinetic sampling conditions. Subsequent analysis of three-hour integrated PM2.5 samples from Teflon filters included extraction and analysis for anions and cations. Each Teflon filter was placed in a 20 mL vial, moistened with 3 mL of MeOH, followed by the addition of 16 mL of water. Following 2 hours of sonication, the sample was filtered through a Polyvinylidene Fluoride (PVDF) syringe filter to prepare for IC analysis. Analyzed ionic components of PM2.5 included NH4+, NO3-, and SO42-. For the cation analysis, a Metrohm Metrosep C4 250/4.0 column was utilized alongside a 5 mM HNO3 eluent.
We measured gaseous concentrations using the same duct sampling inlet method as for PM2.5. The concentrations of NO-NO2 (42iQ NO-NO2-NOx Analyzer, Thermo Fisher Scientific, USA), CO (48iQ CO Analyzer, Thermo Fisher Scientific, USA), CO2 (410iQ CO2 Analyzer, Thermo Fisher Scientific, USA), O3 (49iQ O3 Analyzer, Thermo Fisher Scientific, USA), SO2 (43iQ SO2 Analyzer, Thermo Fisher Scientific, USA), and NH3 (LA331-EAA, ABB-Los Gatos Research, USA) were determined. All instruments were calibrated prior to measurements. Detailed methodologies and procedures on quality assurance/quality control (QA/QC) are documented in prior publications [30,31,32,33,34,35].

2.3. Configuration and Analytical Methods for HONO Collection Using Ultrasonic Nozzle Coupled with Spray Chamber and Ion Chromatography

The configuration of the HONO collection system using an ultrasonic nozzle is depicted in Figure 1. Air drawn through the inlet and duct system was first purified by a Teflon filter, which was replaced daily. Subsequently, the air was channeled into the first spray chamber and then directed to an impinger. This impinger, containing a specific volume of an absorbing solution, was designed to minimize mist carryover to subsequent stages, functioning similarly to the gas-liquid separator found in a stripping coil [13].
The experimental chamber featured a diameter of 40 mm and a height of 200 mm, with the absorbing solution being sprayed from the top, while air was introduced through a side branch. The duration of sampling using the spray chamber was set at 40 minutes. The impinger, equipped with branches on both sides, facilitated the transport and recirculation of absorbing solutions to the chamber for repeated spraying. Absorption solution circulation was achieved through a peristaltic pump connected to the impinger, maintaining a flow rate of approximately 13.06 mL/min. This recirculation aimed to reduce the method detection limits (MDLs) below those of previous real-time systems [9,10,11,12,13]. The spray nozzle, constructed from stainless steel with a height of 140 mm and a diameter of 66 mm, atomized the injected fluid using a vibration frequency of 120 kHz. Following a 40-minute sampling period, the sample was analyzed using an ion chromatograph (IC) during a concurrent 40-minute sampling session. HONO and HNO3 collected were analyzed as NO2 and NO3 ions, respectively, with the MDLs established at 0.1 ppbv for both HONO and HNO3, expressed as atmospheric volume concentrations. These MDLs represent a reduction of up to five times compared to those of prior real-time systems, as documented in Table 1.
In pursuit of higher efficiency, the configuration of the spray chamber and impinger was organized in two serial stages. Various absorbing solutions and probes have been employed for HONO collection in earlier studies, including boron dipyrromethene [36], pure water [13,37], 2,4-dinitrophenylhydrazine [38], and Azo dye [39]. In this study, a 25 μM Na2CO3 solution was utilized to minimize the interference from SO2 [13,26]. This solution was drawn into the ultrasonic nozzle via a peristaltic pump, ensuring consistent droplet formation irrespective of airflow rate variations during sampling. A total of 50 mL of absorbing solution was used, with a flow rate maintained at 6 L/min for a duration of 40 minutes. Previous studies established methods to assess the efficacy of wet chemical techniques [13,26,40]. This study applied those established methods, analyzing the absorbing solution collected from each of the two serially connected spray chambers in order to calculate the effectiveness.
The absorbing solution collected in the spray chamber was transferred into 60 mL vials and analyzed using ion chromatography (IC, 930 Compact IC Flex, Metrohm, Switzerland). For IC, a Metrohm Metrosep A Supp 5 150/4.0 column was utilized alongside 3.20 mM Na2CO3 and 1.00 mM NaHCO3 as the eluent, with H2SO4 (50 mM) acting as the suppressor. The processes of replenishing and retrieving the absorbing solution from the spray chamber, as well as conducting IC analysis, were automated by an autosampler (858 Professional Sample Processor, Metrohm, Switzerland).

3. Results

3.1. Efficiency and Interference Verification of a HONO Collection System

As previously described, the efficiency of the system was determined, resulting in 97.7 % for the two serial stages with MDLs of 0.15 ppbv for HONO and 0.11 ppbv for HNO3. The current spray chamber system exhibits enhanced performance in terms of both efficiency and MDLs. Concentrations have been corrected for efficiency in the ensuing results. To verify interference in the spray chamber, NO2 and O3 generators (49iQPS, Thermo Fisher Scientific, USA) were employed [41,42]. The setup of interference verification is shown at the bottom of Figure 1. In addition to NO2 interference, the potential formation of OH radicals by microdroplets, which could impact HONO measurement, was examined using an OH radical probe (terephthalic acid) [43,44]. The O3 generator produced a consistent O3 concentration using compressed air, mixed with the NO2 standard in a specially designed mixer. The mixed air was then collected and analyzed in the spray chamber to verify any interference. The air mixture used had final concentrations of 50 ppb for O3 and 33 ppb for NO2, and testing confirmed that there was no interference from either NO2 or OH radicals.

3.2. Ambient Air Measurement with a HONO Collection System

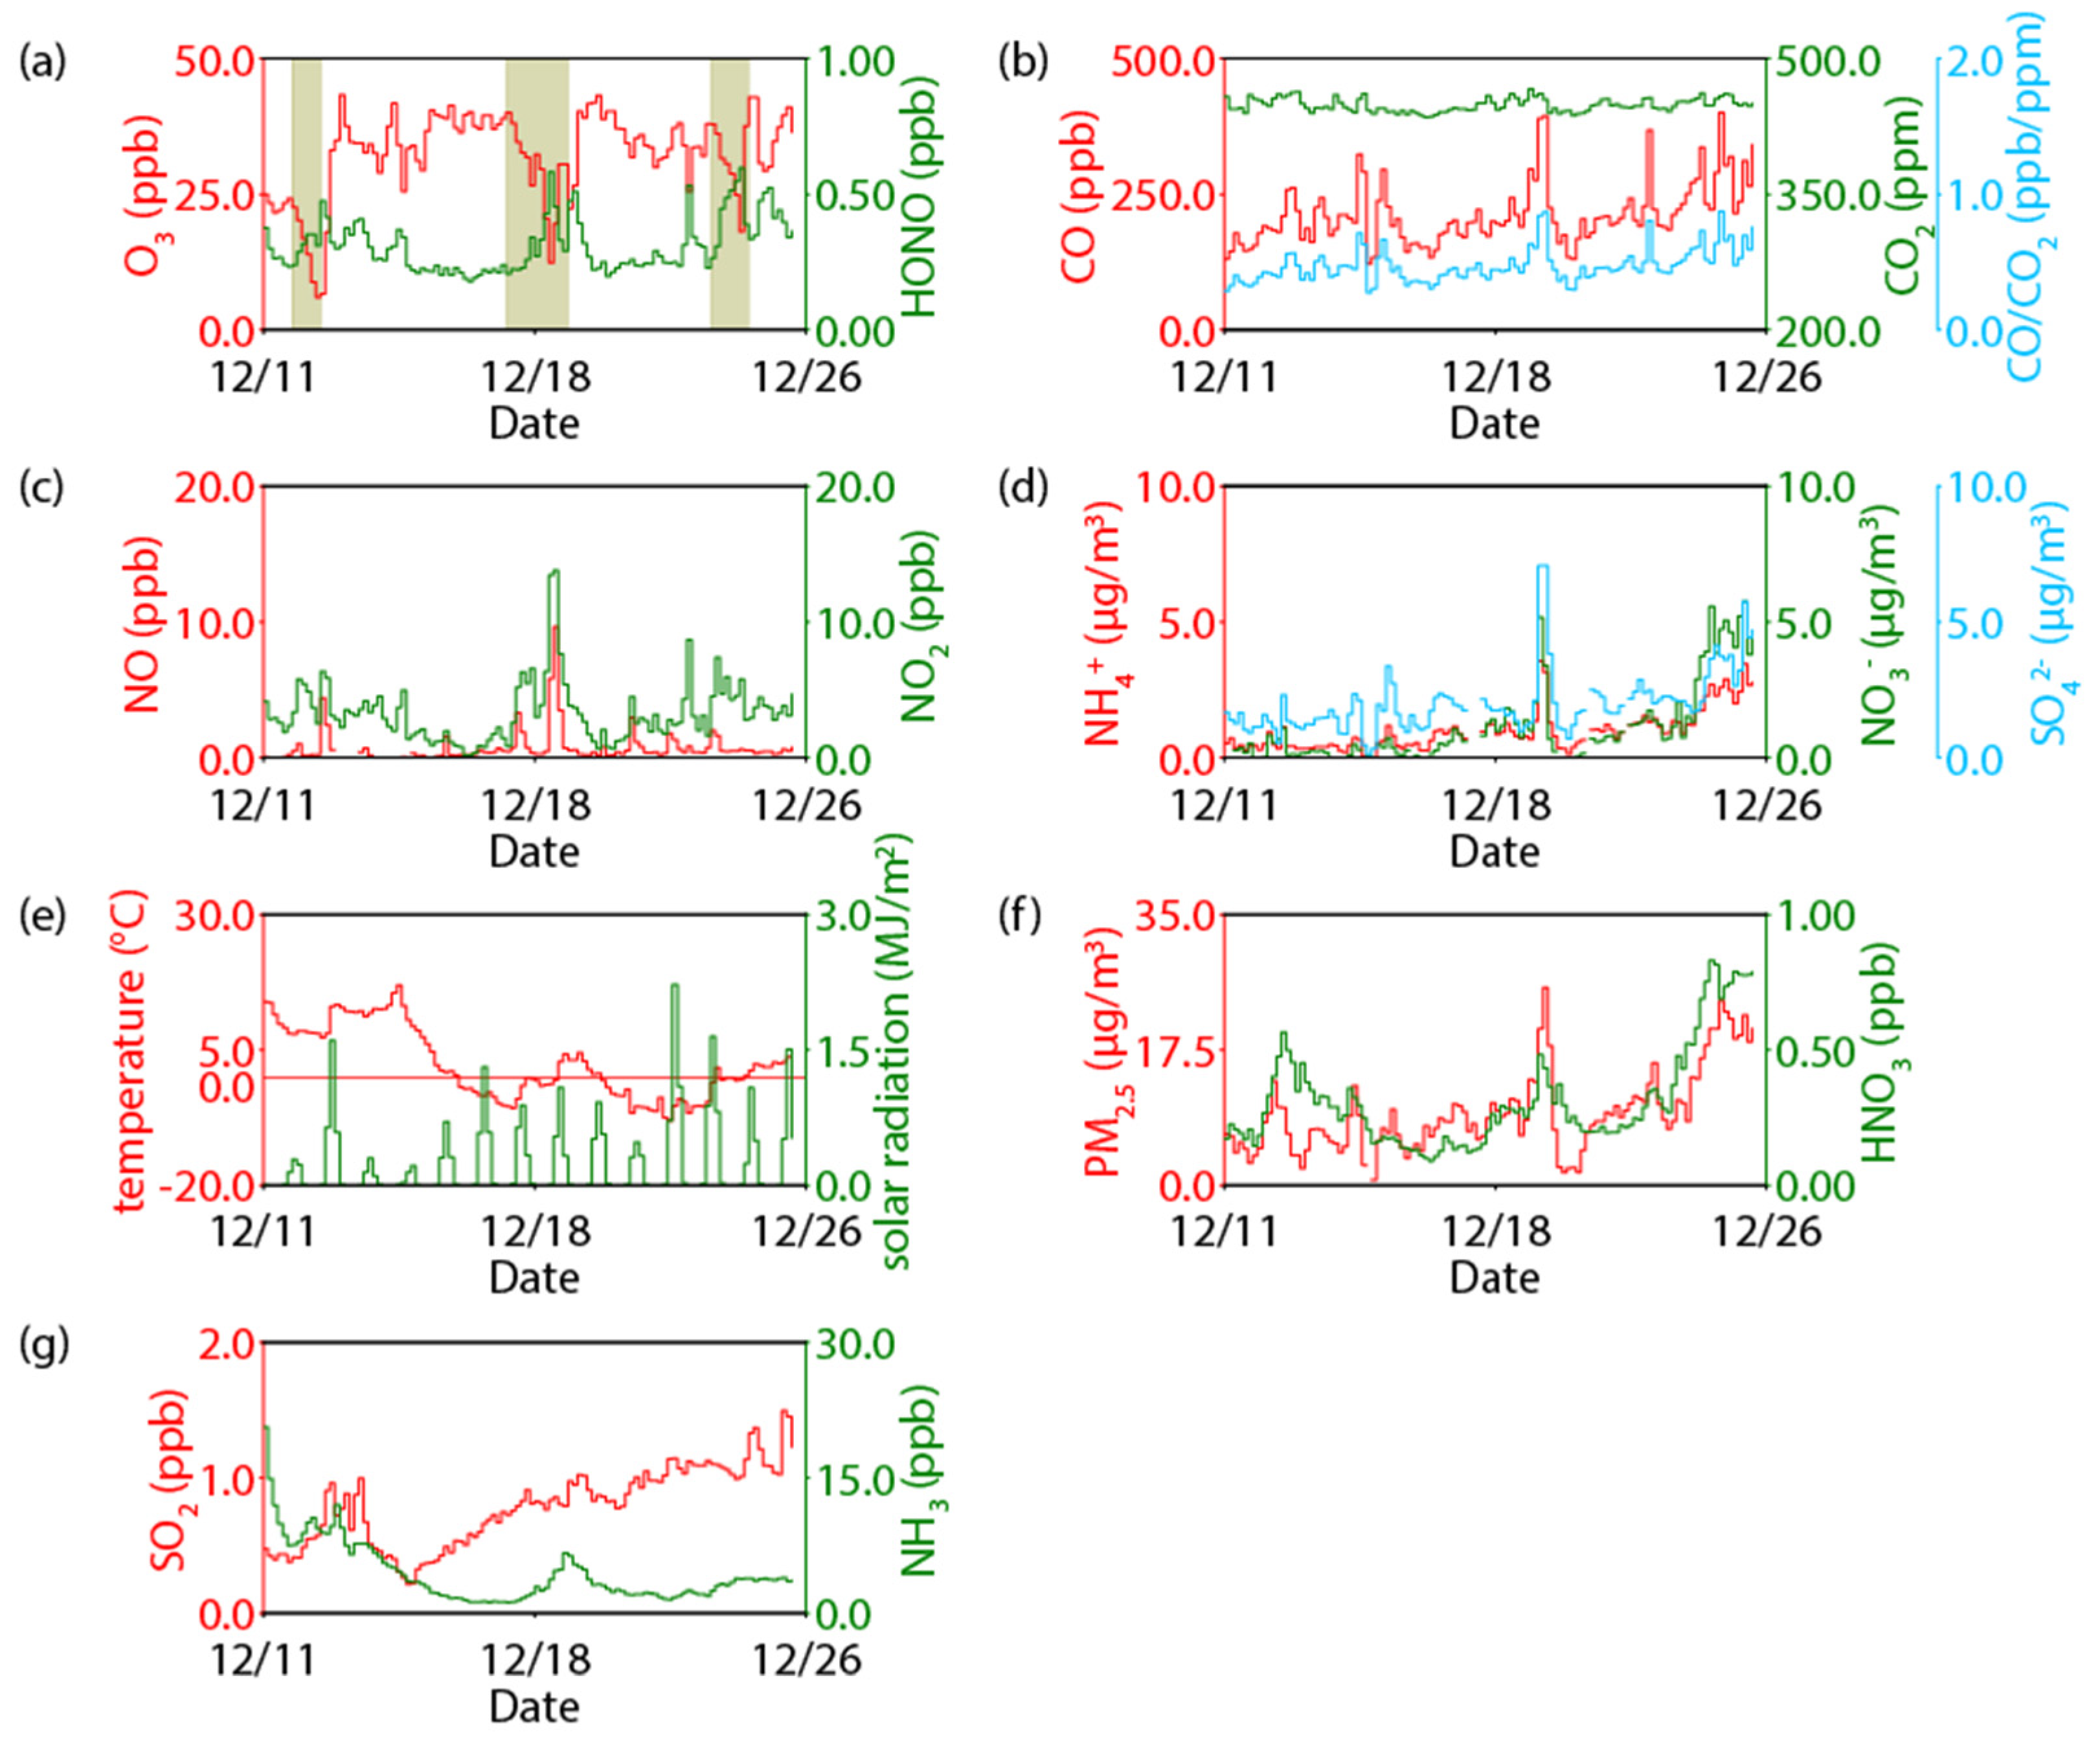
From December 11 to December 25, 2023, both PM2.5 and gaseous species such as HONO, NOx, and others were measured. The average ± standard deviation of the measured components throughout this period is summarized in Table 2. HONO was detected at an average of 0.31 ppb, peaking at 0.60 ppb (Figure 2a), which is comparable to previous measurements of HONO concentration in Seoul (0.36 ppb) recorded by Song et al. [16]. The mean concentration of O3 was 32.44 ppb, while NO and NO2 concentrations were 0.77 ppb and 3.28 ppb, respectively (Figure 2a,c). On the dates of December 13, 19, and 24, O3 levels dipped below 20 ppb before rebounding and consistently remaining above 25 ppb for the rest of the measured period. Regarding PM2.5, the average concentration during this interval was 9.38 µg/m3, with the maximum concentration reaching 25.56 µg/m3 at 3 AM on December 20 (Figure 1f). Given the winter mean PM2.5 concentration from 2015 to 2022 in South Korea has been above 20 µg/m3, the study period exhibited notably lower particulate levels, although there were occasional increases potentially attributable to external influxes, as noted by Jeong et al. [45]. The mean concentrations of CO and CO2 registered at 212 ppb and 449 ppm respectively, with the peak CO/CO2 ratio of 0.87 occurring at 3 AM on December 20 (Figure 2b), significantly, the CO/CO2 ratio stood at 0.87 at the recorded time, which was higher than the mean value of 0.47 for the entire study period. This heightened CO/CO2 ratio may signify decreased combustion efficiency or substantial long-range transport from China to the Korean Peninsula, according to previous research [46,47,48]. Figure 2d presents the average concentrations of ionic components (NH4+, NO3-, SO42-) throughout the study period as 0.99, 1.30, and 2.00 µg/m3 respectively. Notably, the concentrations peaked on December 20 and December 24 at 3.57 µg/m3 for NH4+, 5.75 µg/m3 for NO3-, and 7.09 µg/m3 for SO42-. The concurrent increase in particulate matter and concentrations of CO and CO2 on these dates indicates a regional influx of polluted air.
SO2 was measured at an average of 0.79 ppb throughout the study period and NH3 was measured at 4.33 ppb (Figure 2g). The concentration trend of NH3 levels paralleled temperature changes, which likely influenced ammonia release into the atmosphere [49,50,51]. HNO3 concentrations during the study period averaged 0.32 ppb, reaching a peak of 0.83 ppb during PM2.5 episodes. Previous studies recorded winter HNO3 levels in Seoul that varied from 0.16 ppb (non-hazy days) to 0.34 ppb (hazy days). Concurrently, Daejeon recorded winter concentrations of 0.72 ppb and summer concentrations of 0.1 ppb, with the annual averages in Chuncheon and Seoul ranging from 0.60 to 1.06 ppb. These results imply that the observed concentrations in this study are influenced by factors such as temperature, seasonal variations, and haze phenomena [52,53,54].

3.3. Diurnal Variation and Validation of a HONO Collection System for Ambient Air Measurement

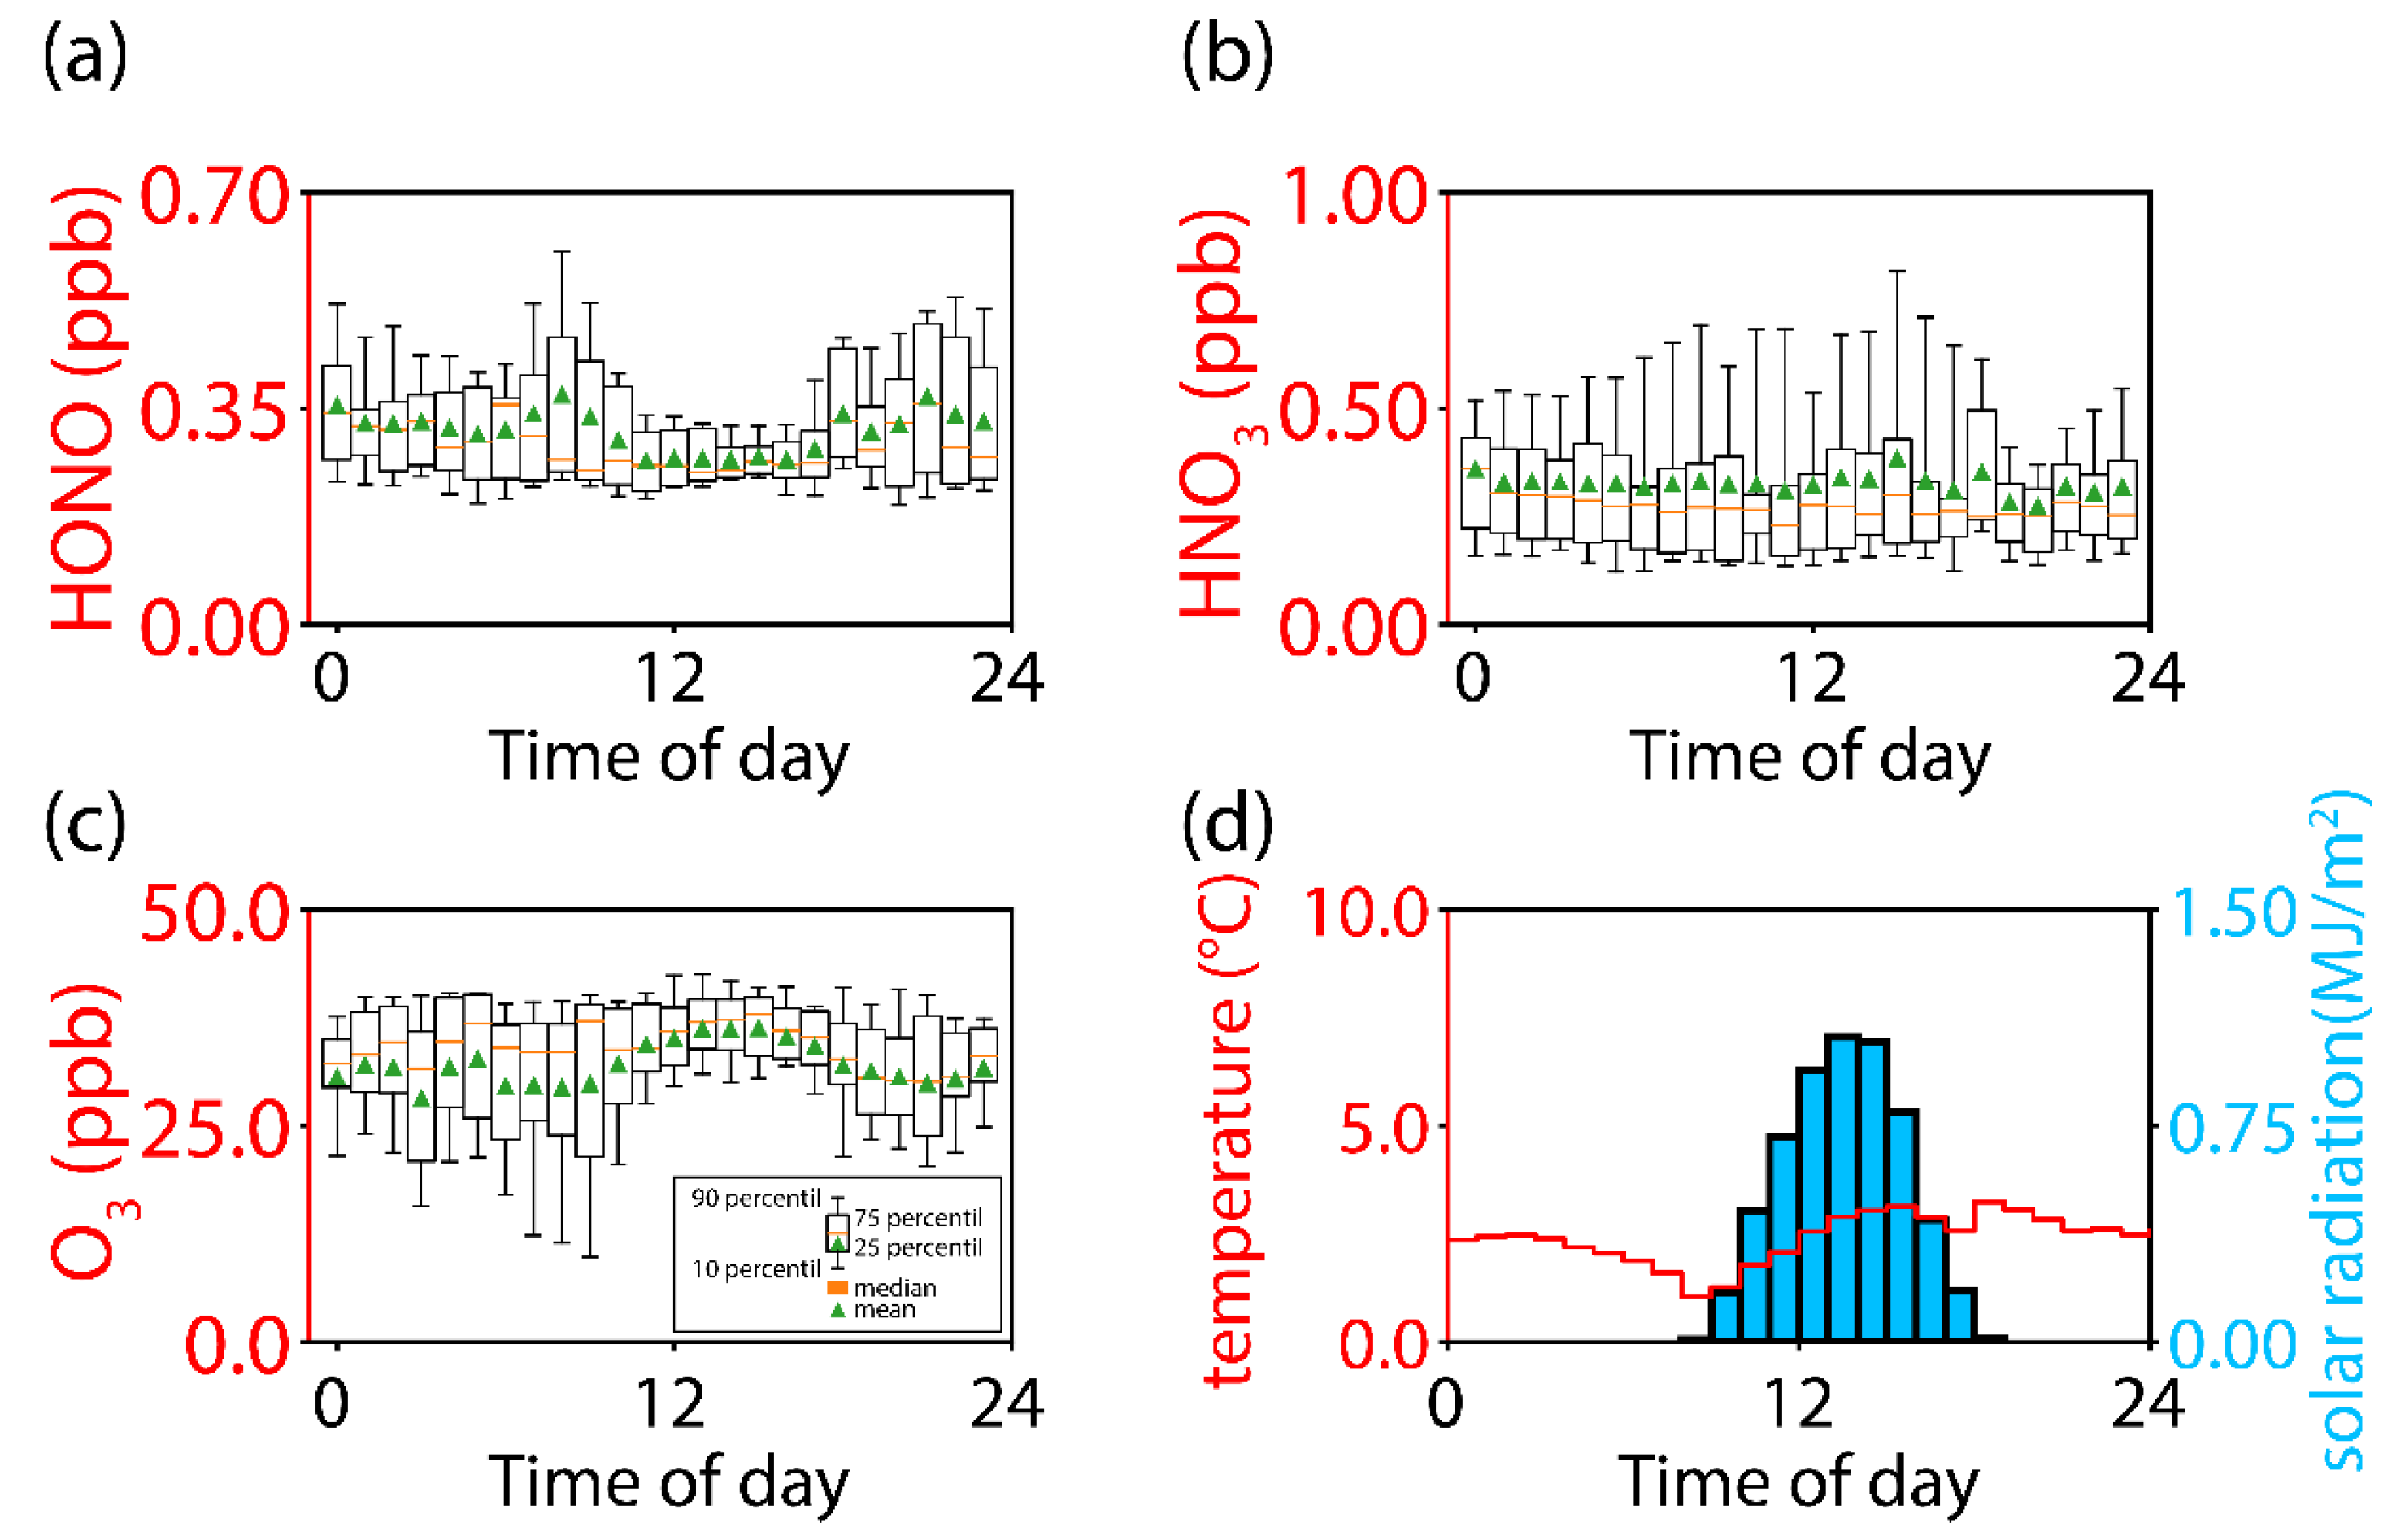
To determine the feasibility of using the HONO collection system in ambient air measurements, the typical diurnal behavior of HONO (i.e., nighttime increase and daytime decrease) was validated. Figure 3a–c illustrates the diurnal fluctuations in gas-phase concentrations of HONO, HNO3, and O3. The highest average HONO concentration was recorded at 08:00, measuring 0.372 ppb, closely followed by 21:00 with a concentration of 0.369 ppb. The lowest levels occurred from 11:00 to 16:00, at 0.27 ppb. In contrast, the peak concentration of O3 was recorded at 15:00, reaching 36.27 ppb. The corresponding diurnal peak of solar insolation (Figure 3d) was observed between 13:00 and 14:00. These trends corroborate earlier findings that HONO increases after sunset and decreases due to photolytic degradation [55,56]. HNO3 demonstrated its highest concentration of 0.38 ppb at 15:00, with the lowest at 20:00, measuring 0.27 ppb. The daytime increase in HNO3 is believed to result from the reaction of OH radicals with NO2, whereas the second-highest concentration (0.36 ppb at 00:00) is attributed to heterogeneous reactions involving water vapor and N2O5 during the night [56,57,58].

3.4. Inverse Relationship between Ozone and HONO

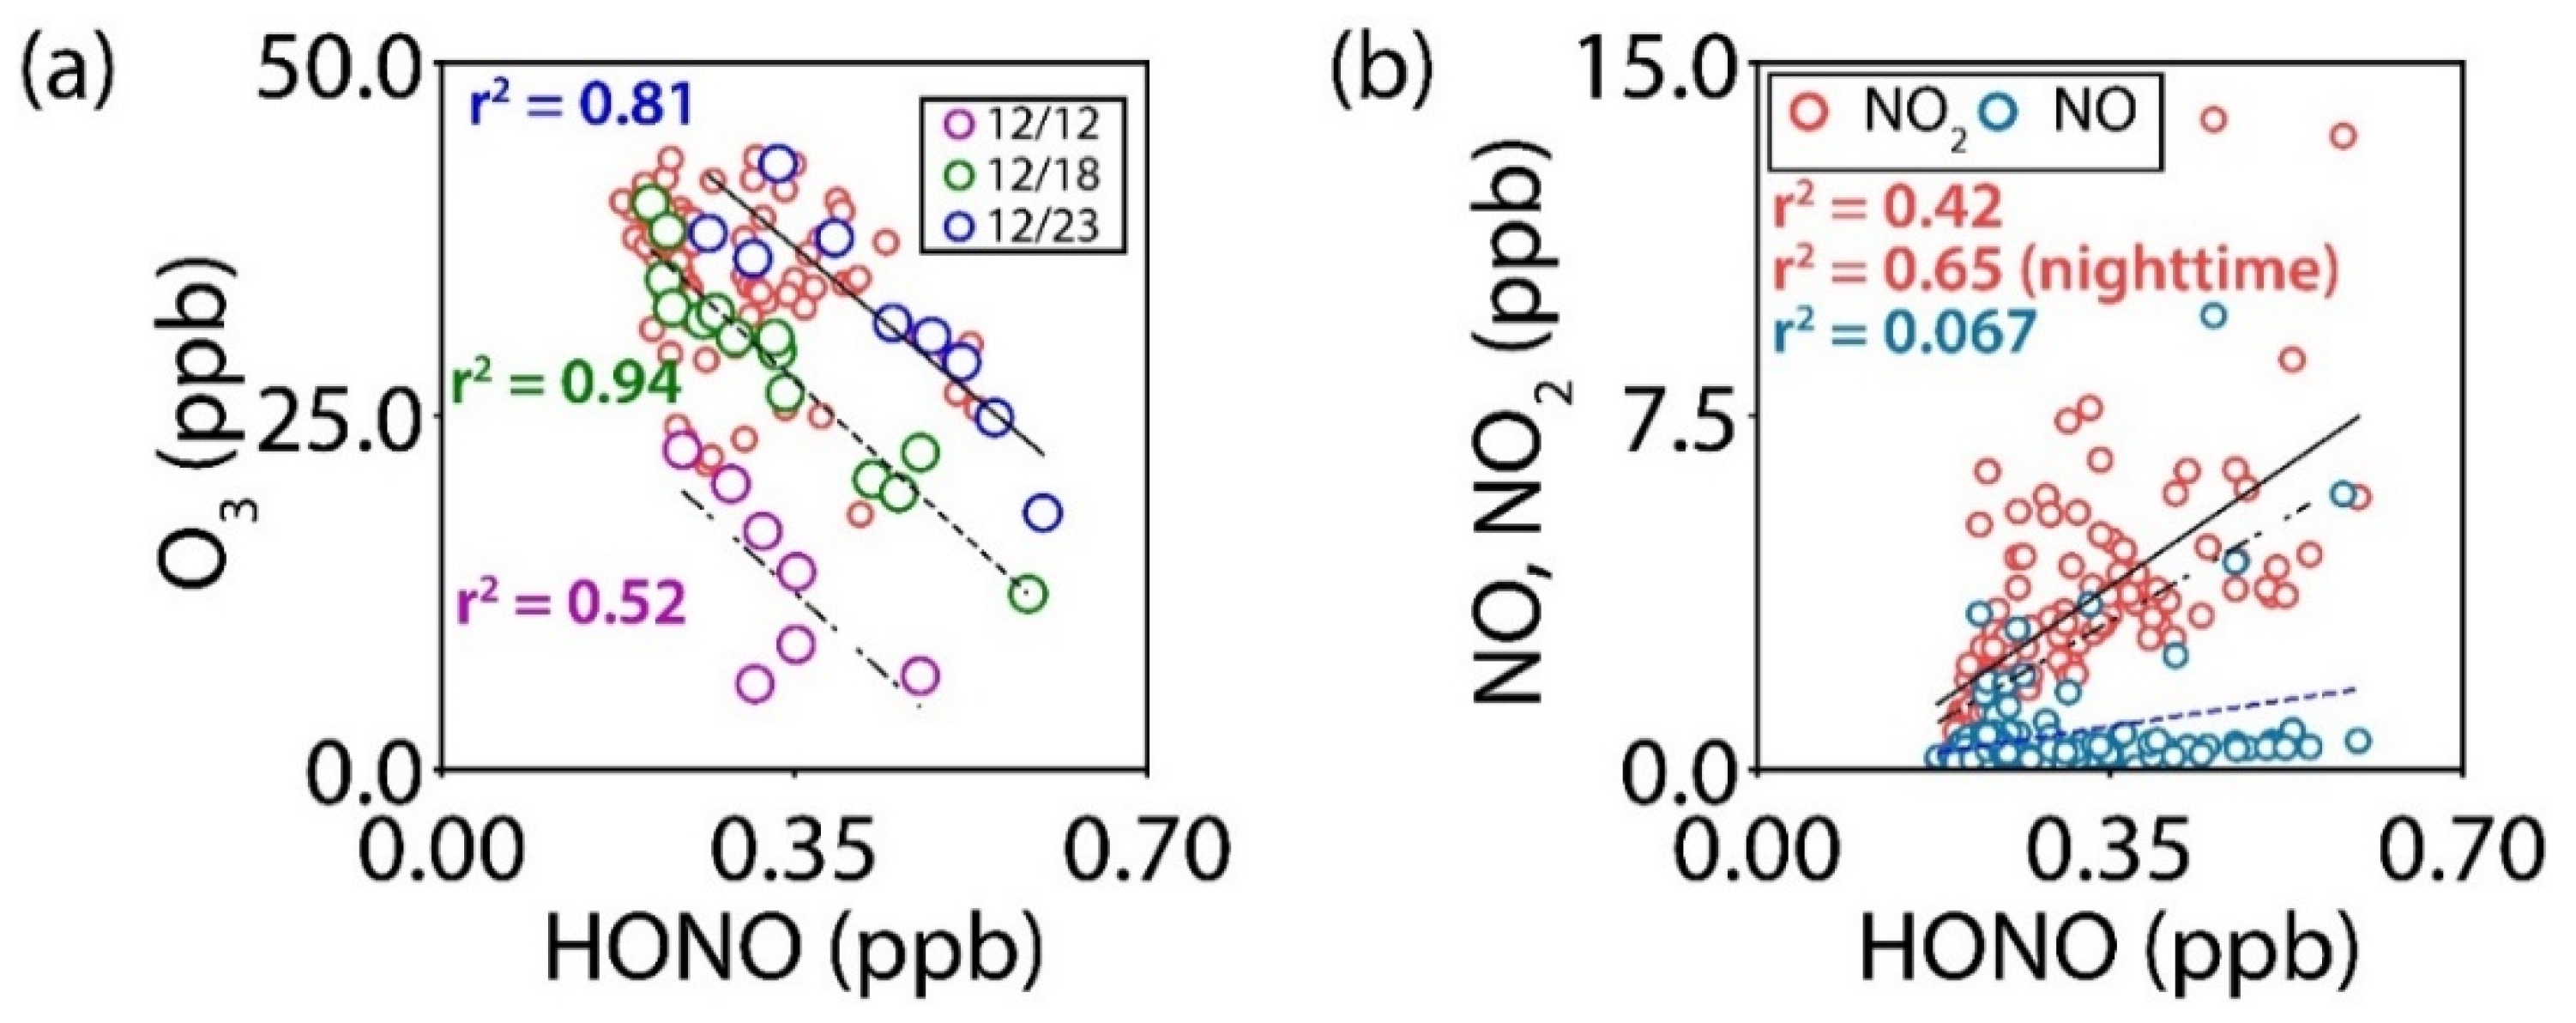
During the study period, it was observed that ozone concentrations fell below 20 ppb and an inverse relationship between HONO and O3 became evident. This phenomenon occurred three times, each lasting between 18 to 24 hours, as denoted by the shading in Figure 2a and presented in Figure 4a. The most notable period spanned from 03:00 on December 18 to 21:00 on December 19, with a correlation coefficient (r2) of 0.94, firmly establishing the inverse relationship between ozone and HONO. The other periods occurred from 12:00 on December 23 to 15:00 on December 24 (r2: 0.81) and from 12:00 on December 12 to 06:00 on December 13 (r2: 0.52). The reduction in ozone levels can be attributed to NO2 s titration effect, whereas the rise in HONO levels is linked to its formation from nitrate particles and NO2 [59,60,61,62,63]. Throughout the study period, HONO demonstrated a correlation with NO2 (r2: 0.42), while NO showed a lower correlation, even with excluded periods featuring NO concentrations exceeding 0.8 ppb (Figure 4b). The correlation between NO2 and HONO increased to 0.65 during nighttime (21:00 - 06:00), attributable to the heterogeneous conversion of NO2 on wet surfaces, which enhances nocturnal HONO production. Noticeable diurnal variations in HONO were also observed, with peaks occurring in the early morning and dips in the late afternoon. At night, the primary source of HONO was from emissions and RH-dependent NO2 conversions, whereas during the day, HONO primarily stemmed from NO-OH reactions, influencing OH production and atmospheric oxidation processes [64]. During the notable increase of HONO on December 23, the HONO/NOx ratio averaged 0.085, higher than in the other periods (0.068 and 0.060), suggesting that mechanisms beyond heterogeneous NOx reactions play a more significant role in HONO formation during this time [65,66]., the atmospheric chemical reactions of HONO, which are trackable through real-time measurement instruments (O3, NOx), have been corroborated by the HONO collection device employed in this study.

4. Discussion

This study successfully demonstrated the efficiency and applicability of the HONO collection system using an ultrasonic nozzle and spray chamber for ambient air measurements. The system attained an efficiency of 97.7 % and MDLs of 0.1 ppbv for HONO across two serial stages. Interference checks revealed negligible impacts from NO2 or OH radicals. From December 11 to December 25, 2023, the collected data showed that HONO concentrations exhibited typical diurnal variations, with peaks during the night and troughs around midday. This pattern corresponds with established photolysis dynamics and previous studies. Diurnal variations for O3 and HNO3 also occurred as expected, with O3 reaching its maximum during daylight and HNO3 escalating due to photochemical responses. Throughout the study, we observed specific instances of inverse correlations between HONO and O3 concentrations, particularly during episodes of ozone depletion. These correlations, with r2 values of 0.94, 0.81, and 0.52 across different timeframes, highlighted the interplay between ozone titration and HONO formation. Moreover, variations in the HONO/NOx ratio indicated the influence of heterogeneous reactions beyond simple NOx chemistry. Overall, the findings confirm that the HONO collection system is capable of reliably capturing atmospheric chemical reactions involving HONO, corroborating data from real-time measurement devices (O3, NOx). This validation promotes the systems utility in ambient air quality monitoring and research, offering valuable insights into the atmospheric mechanisms regulating HONO dynamics.

Acknowledgments

This study was supported by a grant (NRF-2020R1I1A3054851) from the National Research Foundation (NRF) and by a grant (NIER-2021-03-03-007) from the National Institute of Environment Research (NIER), funded by the Ministry of Environment (MOE) of the Republic of Korea.

References

  1. Ge, S.; Wang, G.; Zhang, S.; Li, D.; Xie, Y.; Wu, C.; Yuan, Q.; Chen, J.; Zhang, H. Abundant NH3 in China Enhances Atmospheric HONO Production by Promoting the Heterogeneous Reaction of SO2 with NO2. Environ. Sci. Technol. 2019, 53, 14339–14347. [Google Scholar] [CrossRef]
  2. Zhang, W.; Tong, S.; Ge, M.; An, J.; Shi, Z.; Hou, S.; Xia, K.; Qu, Y.; Zhang, H.; Chu, B.; et al. Variations and Sources of Nitrous Acid (HONO) during a Severe Pollution Episode in Beijing in Winter 2016. Sci. Total Environ. 2019, 648, 253–262. [Google Scholar] [CrossRef]
  3. Xing, C.; Liu, C.; Hu, Q.; Fu, Q.; Wang, S.; Lin, H.; Zhu, Y.; Wang, S.; Wang, W.; Javed, Z.; et al. Vertical Distributions of Wintertime Atmospheric Nitrogenous Compounds and the Corresponding OH Radicals Production in Leshan, Southwest China. J. Environ. Sci. 2021, 105, 44–55. [Google Scholar] [CrossRef] [PubMed]
  4. Hendrick, F.; Müller, J.-F.; Clémer, K.; Wang, P.; De Mazière, M.; Fayt, C.; Gielen, C.; Hermans, C.; Ma, J.Z.; Pinardi, G.; et al. Four Years of Ground-Based MAX-DOAS Observations of HONO and NO₂ in the Beijing Area. Atmos. Chem. Phys. 2014, 14, 765–781. [Google Scholar] [CrossRef]
  5. Kim, D.; Kim, J.; Lee, M.; Ahn, J.Y.; Lee, G. Assessment of Daytime HONO Emission Source from Asphalt Surface to Urban Air. Appl. Sci. 2021, 11. [Google Scholar] [CrossRef]
  6. Liu, Y.; Lu, K.; Ma, Y.; Yang, X.; Zhang, W.; Wu, Y.; Peng, J.; Shuai, S.; Hu, M.; Zhang, Y. Direct Emission of Nitrous Acid (HONO) from Gasoline Cars in China Determined by Vehicle Chassis Dynamometer Experiments. Atmos. Environ. 2017, 169, 89–96. [Google Scholar] [CrossRef]
  7. Su, H.; Cheng, Y.; Oswald, R.; Behrendt, T.; Trebs, I.; Meixner, F.X.; Andreae, M.O.; Cheng, P.; Zhang, Y.; Poschl, U. Soil Nitrite as a Source of Atmospheric HONO and OH Radicals. Science 2011, 333, 1616–1618. [Google Scholar] [CrossRef]
  8. Wu, D.; Horn, M.A.; Behrendt, T.; Müller, S.; Li, J.; Cole, J.A.; Xie, B.; Ju, X.; Li, G.; Ermel, M.; et al. Soil HONO Emissions at High Moisture Content Are Driven by Microbial Nitrate Reduction to Nitrite: Tackling the HONO Puzzle. ISME J. 2019, 13, 1688–1699. [Google Scholar] [CrossRef]
  9. Chai, J.; Hastings, M.G. Collection Method for Isotopic Analysis of Gaseous Nitrous Acid. Anal. Chem. 2018, 90, 830–838. [Google Scholar] [CrossRef]
  10. Heland, J.; Kleffmann, J.; Kurtenbach, R.; Wiesen, P. A New Instrument To Measure Gaseous Nitrous Acid (HONO) in the Atmosphere. Environ. Sci. Technol. 2001, 35, 3207–3212. [Google Scholar] [CrossRef]
  11. Kim, N.K.; Kim, Y.P.; Ghim, Y.S.; Song, M.J.; Kim, C.H.; Jang, K.S.; Lee, K.Y.; Shin, H.J.; Jung, J.S.; Wu, Z.; et al. Spatial Distribution of PM2.5 Chemical Components during Winter at Five Sites in Northeast Asia: High Temporal Resolution Measurement Study. Atmos. Environ. 2022, 290, 119359. [Google Scholar] [CrossRef]
  12. Kleffmann, J.; Lörzer, J.C.; Wiesen, P.; Kern, C.; Trick, S.; Volkamer, R.; Rodenas, M.; Wirtz, K. Intercomparison of the DOAS and LOPAP Techniques for the Detection of Nitrous Acid (HONO). Atmospheric Environment 2006, 40, 3640–3652. [Google Scholar] [CrossRef]
  13. Xue, C.; Ye, C.; Ma, Z.; Liu, P.; Zhang, Y.; Zhang, C.; Tang, K.; Zhang, W.; Zhao, X.; Wang, Y.; et al. Development of Stripping Coil-Ion Chromatograph Method and Intercomparison with CEAS and LOPAP to Measure Atmospheric HONO. Sci. Total Environ. 2019, 646, 187–195. [Google Scholar] [CrossRef] [PubMed]
  14. Cui, X.; Li, Y.; Jiang, C.; Cui, X.; Xie, J.; Yu, B. Line Positions and Effective Line Strengths of Trans-HONO near 1280 Cm−1. Spectrochim. Acta. A 2023, 302, 123044. [Google Scholar] [CrossRef]
  15. Xing, C.; Liu, C.; Li, Q.; Wang, S.; Tan, W.; Zou, T.; Wang, Z.; Lu, C. Observations of HONO and Its Precursors between Urban and Its Surrounding Agricultural Fields: The Vertical Transports, Sources and Contribution to OH. Sci. Total Environ. 2024, 915, 169159. [Google Scholar] [CrossRef]
  16. Song, C.H.; Park, M.E.; Lee, E.J.; Lee, J.H.; Lee, B.K.; Lee, D.S.; Kim, J.; Han, J.S.; Moon, K.J.; Kondo, Y. Possible Particulate Nitrite Formation and Its Atmospheric Implications Inferred from the Observations in Seoul, Korea. Atmos. Environ. 2009, 43, 2168–2173. [Google Scholar] [CrossRef]
  17. Gil, J.; Kim, J.; Lee, M.; Lee, G.; Ahn, J.; Lee, D.S.; Jung, J.; Cho, S.; Whitehill, A.; Szykman, J.; et al. Characteristics of HONO and Its Impact on O3 Formation in the Seoul Metropolitan Area during the Korea-US Air Quality Study. Atmos. Environ. 2021, 247, 118182. [Google Scholar] [CrossRef]
  18. Dalmoro, A.; Barba, A.A.; Lamberti, G.; d’Amore, M. Intensifying the Microencapsulation Process: Ultrasonic Atomization as an Innovative Approach. Eur. J. Pharm. Biopharm. 2012, 80, 471–477. [Google Scholar] [CrossRef]
  19. Bose, S.; Keller, S.S.; Alstrøm, T.S.; Boisen, A.; Almdal, K. Process Optimization of Ultrasonic Spray Coating of Polymer Films. Langmuir 2013, 29, 6911–6919. [Google Scholar] [CrossRef]
  20. Tatar Turan, F.; Cengiz, A.; Kahyaoglu, T. Evaluation of Ultrasonic Nozzle with Spray-Drying as a Novel Method for the Microencapsulation of Blueberry’s Bioactive Compounds. Innov. Food Sci. Emerg. 2015, 32, 136–145. [Google Scholar] [CrossRef]
  21. Tang, K.; Qin, M.; Fang, W.; Duan, J.; Meng, F.; Ye, K.; Zhang, H.; Xie, P.; He, Y.; Xu, W.; et al. Simultaneous Detection of Atmospheric HONO and NO2 Utilising an IBBCEAS System Based on an Iterative Algorithm. Atmos. Meas. Tech. 2020, 13, 6487–6499. [Google Scholar] [CrossRef]
  22. Wang, L.; Zhang, J. Detection of Nitrous Acid by Cavity Ring-Down Spectroscopy. Environ. Sci. Technol. 2000, 34, 4221–4227. [Google Scholar] [CrossRef]
  23. Liao, W.; Case, A.T.; Mastromarino, J.; Tan, D.; Dibb, J.E. Observations of HONO by Laser-Induced Fluorescence at the South Pole during ANTCI 2003. Geophys. Res. Lett. 2006, 33. [Google Scholar] [CrossRef]
  24. Pérez, I.M.; Wooldridge, P.J.; Cohen, R.C. Laboratory Evaluation of a Novel Thermal Dissociation Chemiluminescence Method for in Situ Detection of Nitrous Acid. Atmos. Environ. 2007, 41, 3993–4001. [Google Scholar] [CrossRef]
  25. Bourgeois, I.; Peischl, J.; Neuman, J.A.; Brown, S.S.; Allen, H.M.; Campuzano-Jost, P.; Coggon, M.M.; DiGangi, J.P.; Diskin, G.S.; Gilman, J.B.; et al. Comparison of Airborne Measurements of NO, NO₂, HONO, NOy, and CO during FIREX-AQ. Atmos. Meas. Tech. 2022, 15, 4901–4930. [Google Scholar] [CrossRef]
  26. Cheng, P.; Cheng, Y.; Lu, K.; Su, H.; Yang, Q.; Zou, Y.; Zhao, Y.; Dong, H.; Zeng, L.; Zhang, Y. An Online Monitoring System for Atmospheric Nitrous Acid (HONO) Based on Stripping Coil and Ion Chromatography. J. Environ. Sci. 2013, 25, 895–907. [Google Scholar] [CrossRef]
  27. Kleffmann, J.; Wiesen, P. Technical Note: Quantification of Interferences of Wet Chemical HONO LOPAP Measurements under Simulated Polar Conditions. Atmos. Chem. Phys. 2008, 8, 6813–6822. [Google Scholar] [CrossRef]
  28. Ren, Y.; Stieger, B.; Spindler, G.; Grosselin, B.; Mellouki, A.; Tuch, T.; Wiedensohler, A.; Herrmann, H. Role of the Dew Water on the Ground Surface in HONO Distribution: A Case Measurement in Melpitz. Atmos. Chem. Phys. 2020, 20, 13069–13089. [Google Scholar] [CrossRef]
  29. Bari, A.; Ferraro, V.; Wilson, L.R.; Luttinger, D.; Husain, L. Measurements of Gaseous HONO, HNO3, SO2, HCl, NH3, Particulate Sulfate and PM2.5 in New York, NY. Atmos. Environ. 2003, 37, 2825–2835. [Google Scholar] [CrossRef]
  30. Oh, S.-H.; Song, M.; Schauer, J.J.; Shon, Z.-H.; Bae, M.-S. Assessment of Long-Range Oriented Source and Oxidative Potential on the South-West Shoreline, Korea: Molecular Marker Receptor Models during Shipborne Measurements. Environ. Pollut. 2021, 281, 116979. [Google Scholar] [CrossRef]
  31. Oh, S.-H.; Park, K.; Park, M.; Song, M.; Jang, K.-S.; Schauer, J.J.; Bae, G.-N.; Bae, M.-S. Comparison of the Sources and Oxidative Potential of PM2.5 during Winter Time in Large Cities in China and South Korea. Sci. Total Environ. 2023, 859, 160369. [Google Scholar] [CrossRef] [PubMed]
  32. Oh, S.-H.; Choe, S.; Song, M.; Yu, G.-H.; Schauer, J.J.; Shin, S.-A.; Bae, M.-S. Effects of Long-Range Transport on Carboxylic Acids, Chlorinated VOCs, and Oxidative Potential in Air Pollution Events. Environ. Pollut. 2024, 347, 123666. [Google Scholar] [CrossRef]
  33. Song, M.; Choi, J.; Oh, S.-H.; Choe, S.; Yu, G.-H.; Cho, S.-S.; Park, J.; Bae, M.-S. Diurnal Dithiothreitol Assays for Biomass Burning Source in PM1.0 and PM2.5 during Summer and Winter. Atmos. Environ. 2023, 313, 120033. [Google Scholar] [CrossRef]
  34. Song, M.; Kim, M.; Oh, S.-H.; Yu, G.-H.; Choe, S.; Jeon, H.; Ko, D.-H.; Park, C.; Bae, M.-S. Characteristics of Atmospheric Pollutants in Paddy and Dry Field Regions: Analyzing the Oxidative Potential of Biomass Burning. Atmosphere 2024, 15. [Google Scholar] [CrossRef]
  35. Yu, G.-H.; Song, M.; Oh, S.-H.; Choe, S.; Jeon, H.; Ko, D.-H.; Bae, M.-S. Wintertime Diurnal Variation in Absorption Coefficient of Brown Carbon Associated with the Molecular Marker of Levoglucosan. Appl. Sci. 2024, 14. [Google Scholar] [CrossRef]
  36. Nodeh-Farahani, D.; Bentley, J.N.; Crilley, L.R.; Caputo, C.B.; VandenBoer, T.C. A Boron Dipyrromethene (BODIPY) Based Probe for Selective Passive Sampling of Atmospheric Nitrous Acid (HONO) Indoors. Analyst 2021, 146, 5756–5766. [Google Scholar] [CrossRef]
  37. Ziemba, L.D.; Dibb, J.E.; Griffin, R.J.; Anderson, C.H.; Whitlow, S.I.; Lefer, B.L.; Rappenglück, B.; Flynn, J. Heterogeneous Conversion of Nitric Acid to Nitrous Acid on the Surface of Primary Organic Aerosol in an Urban Atmosphere. Atmos. Environ. 2010, 44, 4081–4089. [Google Scholar] [CrossRef]
  38. Zhou, X.; Qiao, H.; Deng, G.; Civerolo, K. A Method for the Measurement of Atmospheric HONO Based on DNPH Derivatization and HPLC Analysis. Environ. Sci. Technol. 1999, 33, 3672–3679. [Google Scholar] [CrossRef]
  39. Wu, D.; Kampf, C.J.; Pöschl, U.; Oswald, R.; Cui, J.; Ermel, M.; Hu, C.; Trebs, I.; Sörgel, M. Novel Tracer Method To Measure Isotopic Labeled Gas-Phase Nitrous Acid (HO15NO) in Biogeochemical Studies. Environ. Sci. Technol. 2014, 48, 8021–8027. [Google Scholar] [CrossRef]
  40. Stutz, J.; Oh, H.-J.; Whitlow, S.I.; Anderson, C.; Dibb, J.E.; Flynn, J.H.; Rappenglück, B.; Lefer, B. Simultaneous DOAS and Mist-Chamber IC Measurements of HONO in Houston, TX. Atmos. Environ. 2010, 44, 4090–4098. [Google Scholar] [CrossRef]
  41. Wong, K.W.; Oh, H.-J.; Lefer, B.L.; Rappenglück, B.; Stutz, J. Vertical Profiles of Nitrous Acid in the Nocturnal Urban Atmosphere of Houston, TX. Atmos. Chem. Phys. 2011, 11, 3595–3609. [Google Scholar] [CrossRef]
  42. Li, D.; Xue, L.; Wen, L.; Wang, X.; Chen, T.; Mellouki, A.; Chen, J.; Wang, W. Characteristics and Sources of Nitrous Acid in an Urban Atmosphere of Northern China: Results from 1-Yr Continuous Observations. Atmos. Environ. 2018, 182, 296–306. [Google Scholar] [CrossRef]
  43. Lee, J.K.; Han, H.S.; Chaikasetsin, S.; Marron, D.P.; Waymouth, R.M.; Prinz, F.B.; Zare, R.N. Condensing Water Vapor to Droplets Generates Hydrogen Peroxide. Proc Natl Acad Sci USA 2020, 117, 30934–30941. [Google Scholar] [CrossRef] [PubMed]
  44. Lee, J.K.; Walker, K.L.; Han, H.S.; Kang, J.; Prinz, F.B.; Waymouth, R.M.; Nam, H.G.; Zare, R.N. Spontaneous Generation of Hydrogen Peroxide from Aqueous Microdroplets. Proc Natl Acad Sci USA 2019, 116, 19294–19298. [Google Scholar] [CrossRef] [PubMed]
  45. Jeong, J.I.; Park, R.J.; Song, C.-K.; Yeh, S.-W.; Woo, J.-H. Quantitative Analysis of Winter PM2.5 Reduction in South Korea, 2019/20 to 2021/22: Contributions of Meteorology and Emissions. Sci. Total Environ. 2024, 907, 168179. [Google Scholar] [CrossRef]
  46. Crawford, J.H.; Ahn, J.-Y.; Al-Saadi, J.; Chang, L.; Emmons, L.K.; Kim, J.; Lee, G.; Park, J.-H.; Park, R.J.; Woo, J.H.; et al. The Korea–United States Air Quality (KORUS-AQ) Field Study. Elem. Sci. Anth. 2021, 9, 00163. [Google Scholar] [CrossRef] [PubMed]
  47. Halliday, H.S.; DiGangi, J.P.; Choi, Y.; Diskin, G.S.; Pusede, S.E.; Rana, M.; Nowak, J.B.; Knote, C.; Ren, X.; He, H.; et al. Using Short-Term CO/CO2 Ratios to Assess Air Mass Differences Over the Korean Peninsula During KORUS-AQ. J. Geophys. Res. Atmos. 2019, 124, 10951–10972. [Google Scholar] [CrossRef]
  48. Tang, W.; Arellano, A.F.; DiGangi, J.P.; Choi, Y.; Diskin, G.S.; Agustí-Panareda, A.; Parrington, M.; Massart, S.; Gaubert, B.; Lee, Y.; et al. Evaluating High-Resolution Forecasts of Atmospheric CO and CO2 from a Global Prediction System during KORUS-AQ Field Campaign. Atmos. Chem. Phys. 2018, 18, 11007–11030. [Google Scholar] [CrossRef]
  49. Yao, X.; Zhang, L. Trends in Atmospheric Ammonia at Urban, Rural, and Remote Sites across North America. Atmos. Chem. Phys. 2016, 16, 11465–11475. [Google Scholar] [CrossRef]
  50. Nair, A.A.; Yu, F. Quantification of Atmospheric Ammonia Concentrations: A Review of Its Measurement and Modeling. Atmosphere 2020, 11, 1092. [Google Scholar] [CrossRef]
  51. Pedersen, J.; Nyord, T.; Feilberg, A.; Labouriau, R. Analysis of the Effect of Air Temperature on Ammonia Emission from Band Application of Slurry. Environmental Pollution 2021, 282, 117055. [Google Scholar] [CrossRef] [PubMed]
  52. Hong, Y.-M.; Lee, B.-K.; Park, K.-J.; Kang, M.-H.; Jung, Y.-R.; Lee, D.-S.; Kim, M.-G. Atmospheric Nitrogen and Sulfur Containing Compounds for Three Sites of South Korea. Atmos. Environ. 2002, 36, 3485–3494. [Google Scholar] [CrossRef]
  53. Kang, C.-M.; Lee, H.S.; Kang, B.-W.; Lee, S.-K.; Sunwoo, Y. Chemical Characteristics of Acidic Gas Pollutants and PM2.5 Species during Hazy Episodes in Seoul, South Korea. Atmos. Environ. 2004, 38, 4749–4760. [Google Scholar] [CrossRef]
  54. Kim, K.; Lee, C.; Choi, D.; Han, S.; Eom, J.; Han, J. A Study on the Formation Reactions and Conversion Mechanisms of HONO and HNO3 in the Atmosphere of Daejeon, Korea. Atmosphere 2024, 15, 267. [Google Scholar] [CrossRef]
  55. Hao, Q.; Jiang, N.; Zhang, R.; Yang, L.; Li, S. Characteristics, Sources, and Reactions of Nitrous Acid during Winter at an Urban Site in the Central Plains Economic Region in China. Atmos. Chem. Phys. 2020, 20, 7087–7102. [Google Scholar] [CrossRef]
  56. Stieger, B.; Spindler, G.; Fahlbusch, B.; Müller, K.; Grüner, A.; Poulain, L.; Thöni, L.; Seitler, E.; Wallasch, M.; Herrmann, H. Measurements of PM10 Ions and Trace Gases with the Online System MARGA at the Research Station Melpitz in Germany – A Five-Year Study. J. Atmos. Chem. 2018, 75, 33–70. [Google Scholar] [CrossRef]
  57. Ge, X.; He, Y.; Sun, Y.; Xu, J.; Wang, J.; Shen, Y.; Chen, M. Characteristics and Formation Mechanisms of Fine Particulate Nitrate in Typical Urban Areas in China. Atmosphere 2017, 8, 62. [Google Scholar] [CrossRef]
  58. Cheng, C.; Yang, S.; Yuan, B.; Pei, C.; Zhou, Z.; Mao, L.; Liu, S.; Chen, D.; Cheng, X.; Li, M.; et al. The Significant Contribution of Nitrate to a Severe Haze Event in the Winter of Guangzhou, China. Sci. Total Environ. 2024, 909, 168582. [Google Scholar] [CrossRef]
  59. Akimoto, H.; Tanimoto, H. Rethinking of the Adverse Effects of NOx-Control on the Reduction of Methane and Tropospheric Ozone – Challenges toward a Denitrified Society. Atmos. Environ. 2022, 277, 119033. [Google Scholar] [CrossRef]
  60. Andersen, S.T.; Carpenter, L.J.; Reed, C.; Lee, J.D.; Chance, R.; Sherwen, T.; Vaughan, A.R.; Stewart, J.; Edwards, P.M.; Bloss, W.J.; et al. Extensive Field Evidence for the Release of HONO from the Photolysis of Nitrate Aerosols. Sci. Adv. 2023, 9, eadd6266. [Google Scholar] [CrossRef]
  61. Chen, J.; Jiang, H.; Chen, X.; Wang, J.; Huang, D.; Lian, C.; Wang, W.; Ammann, M.; Bao, F.; Chen, C.; et al. A Novel Mechanism for NO2-to-HONO Conversion on Soot: Synergistic Effect of Elemental Carbon and Organic Carbon. Environ. Sci. Technol. Lett. 2023, 10, 878–884. [Google Scholar] [CrossRef]
  62. Lu, X.; Wang, Y.; Li, J.; Shen, L.; Fung, J.C.H. Evidence of Heterogeneous HONO Formation from Aerosols and the Regional Photochemical Impact of This HONO Source. Environ. Res. Lett. 2018, 13, 114002. [Google Scholar] [CrossRef]
  63. Wang, H.; Huang, C.; Tao, W.; Gao, Y.; Wang, S.; Jing, S.; Wang, W.; Yan, R.; Wang, Q.; An, J.; et al. Seasonality and Reduced Nitric Oxide Titration Dominated Ozone Increase during COVID-19 Lockdown in Eastern China. npj clim. atmos. sci. 2022, 5, 24. [Google Scholar] [CrossRef]
  64. Xuan, H.; Zhao, Y.; Ma, Q.; Chen, T.; Liu, J.; Wang, Y.; Liu, C.; Wang, Y.; Liu, Y.; Mu, Y.; et al. Formation Mechanisms and Atmospheric Implications of Summertime Nitrous Acid (HONO) during Clean, Ozone Pollution and Double High-Level PM2.5 and O3 Pollution Periods in Beijing. Sci. Total Environ. 2023, 857, 159538. [Google Scholar] [CrossRef] [PubMed]
  65. Lee, J.D.; Whalley, L.K.; Heard, D.E.; Stone, D.; Dunmore, R.E.; Hamilton, J.F.; Young, D.E.; Allan, J.D.; Laufs, S.; Kleffmann, J. Detailed Budget Analysis of HONO in Central London Reveals a Missing Daytime Source. Atmos. Chem. Phys. 2016, 16, 2747–2764. [Google Scholar] [CrossRef]
  66. Meusel, H.; Kuhn, U.; Reiffs, A.; Mallik, C.; Harder, H.; Martinez, M.; Schuladen, J.; Bohn, B.; Parchatka, U.; Crowley, J.N.; et al. Daytime Formation of Nitrous Acid at a Coastal Remote Site in Cyprus Indicating a Common Ground Source of Atmospheric HONO and NO. Atmos. Chem. Phys. 2016, 16, 14475–14493. [Google Scholar] [CrossRef]
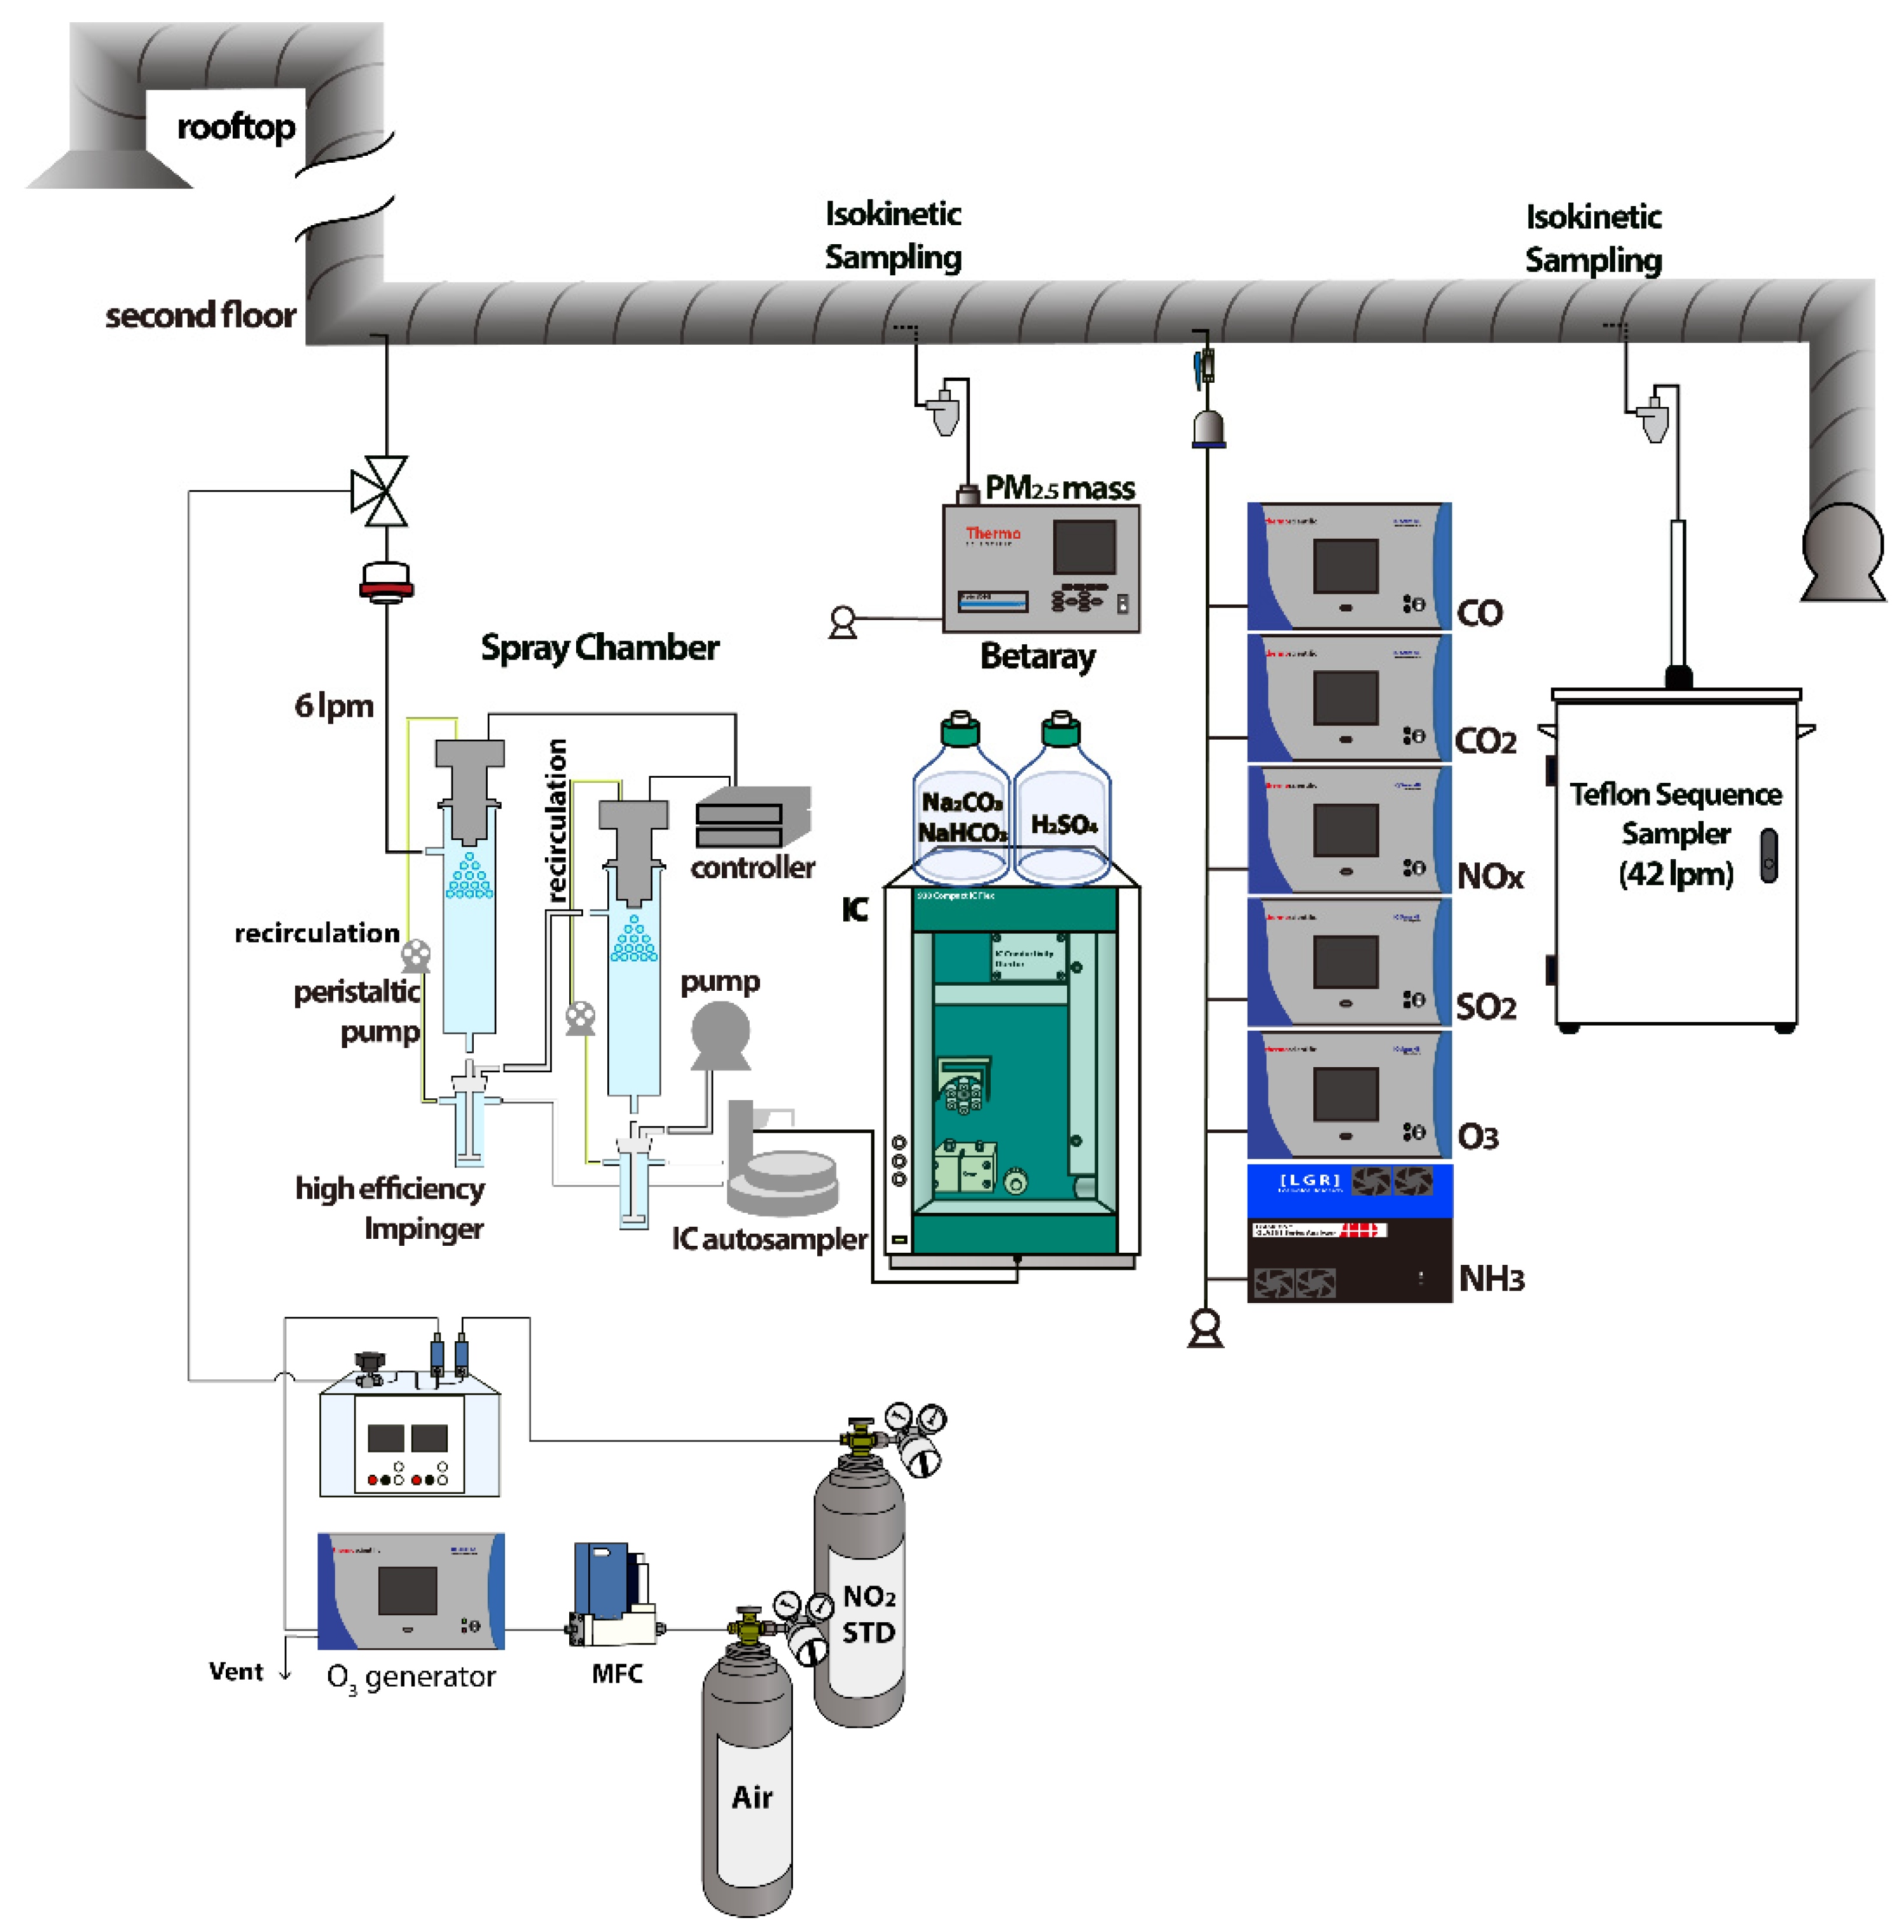
Figure 1. Schematic Diagram of a HONO Collection System Using an Ultrasonic Nozzle Coupled with a Spray Chamber and Ion Chromatography.
Preprints 117294 g001
Figure 2. Time Series Variation of (a) O3 and HONO, (b) CO, CO2, and CO/CO2, (c) NO and NO2, (d) NH4+, NO3-, and SO42-, (e) Temperature and Solar Radiation, (f) PM2.5 mass and HNO3, and (g) SO2 and NH3.
Preprints 117294 g002
Figure 3. Diurnal Patterns of (a) HONO, (b) HNO3, (c) O3, and (d) Temperature and Solar Radiation.
Preprints 117294 g003
Figure 4. Scatter Plots Between (a) O3 and HONO, and (b) NO, NO2, and HONO.
Preprints 117294 g004
Table 1. Summary of Analytical HONO Techniques Classified by Spectroscopic Methods and Wet Chemical Methods.
Category Technique Reference
Spectroscopic Analytical Methods TLAS1 [14]
MAX-DOAS2 [15]
IBBCEAS3 [21]
CRDS4 [22]
LIF5 [23]
TD-CL6 [24]
CIMS7 [25]
sampler detector
Wet Chemical Analytical Methods mist-chamber ion chromatograph [26]
stripping coil long path absorption photometer [10,12,27]
stripping coil ion chromatograph [26]
MARGA8 ion chromatograph [28]
annular denuder system ion chromatograph [29]
1 tunable laser absorption spectroscopy. 2 multi axis differential optical absorption spectroscopy. 3 incoherent broadband cavity-enhanced absorption spectroscopy. 4 cavity ring-down spectroscopy. 5 laser-induced fluorescence. 6 thermal dissociation and chemiluminescent. 7 chemical ionization mass spectrometry. 8 monitor for aerosols and gases in ambient air.
Table 2. Results of Mean Concentrations of PM2.5 and Gaseous Compounds.
Compounds Unit mean ± std
PM2.5 µg/m3 9.38±5.34
NO3- µg/m3 1.3±1.5
SO42- µg/m3 2±1.16
NH4+ µg/m3 0.99±0.76
HONO ppb 0.31±0.1
HNO3 ppb 0.32±0.19
NO ppb 0.77±1.29
NO2 ppb 3.28±2.22
O3 ppb 32.44±7.97
SO2 ppb 0.79±0.29
NH3 ppb 4.33±3.26
CO ppb 212.42±57.8
CO2 ppm 448.62±7.35
CO/CO2 ppb/ppm 0.47±0.12
Disclaimer/Publisher’s Note: The statements, opinions and data contained in all publications are solely those of the individual author(s) and contributor(s) and not of MDPI and/or the editor(s). MDPI and/or the editor(s) disclaim responsibility for any injury to people or property resulting from any ideas, methods, instructions or products referred to in the content.
Copyright: This open access article is published under a Creative Commons CC BY 4.0 license, which permit the free download, distribution, and reuse, provided that the author and preprint are cited in any reuse.
Alerts
Prerpints.org logo

Preprints.org is a free preprint server supported by MDPI in Basel, Switzerland.

Subscribe

© 2025 MDPI (Basel, Switzerland) unless otherwise stated