1. Introduction
Zinc is the lightest element in Group 12 of the periodic table. Despite its inclusion in the d-block, it has fully filled 3d orbitals and does not meet the IUPAC definition of a transition metal [
1]. These occupied 3d orbitals are energetically stable and remain unchanged during chemical processes. Therefore, unlike typical transition metals, zinc is only able to lose its two 4s electrons, resulting in a stable Zn
2+ ion.
Zinc is the 24th most abundant element in Earth's crust, with an average content of 65 mg kg
–1 [
2]. It is part of 320 different minerals, representing 5.3% of all minerals in the International Mineralogical Association's database [
3]. The most common of these is sphalerite (ZnS), which is normally found in bimetallic lead-zinc deposits [
4]. Elemental zinc is produced primarily through two distinct technologies, namely hydrometallurgy and pyrometallurgy. It is the fourth most utilized metal, following iron, aluminum, and copper [
2].
It is well established that zinc plays a pivotal role in biological processes and is an essential element for humans, animals, plants, and microorganisms. Zinc deficiency represents a significant public health concern [
5], with an estimated 4.4% of childhood deaths in developing countries potentially preventable through zinc nutrition [
6]. The recommended daily intake of zinc for adults is 15 mg [
7,
8]. In contrast to its counterparts in Group 12 (Cd and Hg), it is not regarded as a toxic element [
9]. Nevertheless, when consumed in substantial quantities (e.g., 50 mg day
–1 and above) over an extended period, zinc can cause harm. Toxic effects have been documented in persons exposed to pesticides and compounds used in the manufacture of paints, rubber and dyes. Other instances of intoxication have been attributed to the excessive use of Zn-containing dietary supplements or denture adhesive creams [
9,
10,
11].
A variety of spectroscopic techniques have been employed for the determination of zinc, including atomic absorption spectrometry (AAS), inductively coupled plasma optical emission spectrometry (ICP-OES), spectrofluorimetry, and spectrophotometry. They can be integrated with a number of pre-concentration techniques in order to enhance analytical performance and expand the scope of application.
Cloud point extraction (CPE) is a straightforward, cost-effective, and environmentally friendly pre-concentration technique that was developed in 1976 [
12] as an alternative to the classical liquid-liquid extraction (LLE). It is based on the partition of the analyte between two phases formed in a micellar system and is regarded as a "green analytical technique" due to the use of non-toxic surfactants in place of large amounts of volatile, flammable, and toxic organic solvents [
13,
14,
15,
16].
It is noteworthy that the discoverer of the CPE, Hiroto Watanabe, made his breakthrough shortly after conducting a spectrophotometric study of the complexation between Zn(II) and 1-(2-pyridylazo)-2-naphthol (PAN). In his initial publication [
17], Watanabe employed a non-ionic surfactant (Triton X-100) as a solubilizer. Subsequently, when the novel CPE technique gained attention due to its advantages, he returned to the Zn(II)–PAN system, proposing the first CPE–UV/Vis approach for the determination of Zn(II) [
18].
In the following years, a number of CPE methodologies have been proposed for Zn(II) determination. These methodologies employ AAS [
19,
20,
21,
22,
23,
24,
25,
26,
27,
28,
29], ICP-OES [
20,
30,
31], spectrofluorimetry [
32], and spectrophotometry [
33,
34,
35,
36,
37,
38]. However, most of them have inherent limitations, including complexity of implementation, insufficient selectivity, expensive equipment, narrow ranges of optimized parameters, and the necessity for the synthesis of reagents. Moreover, studies of the complexes formed, if conducted at all, have been limited mainly to molar ratio determination.
This paper addresses three main objectives: (i) to investigate the complexation between Zn(II) and 6-hexyl-4-(2-thiazolylazo)-resorcinol (HTAR) in a CPE system containing Triton X-114 (TX-114); (ii) to determine its suitability for the CPE-spectrophotometric determination of Zn(II); and (iii) to model the complexes formed using theoretical TD DFT calculations. A validating criterion for the conclusions drawn about the composition and structure of the extracted species would be a satisfactory match between the experimentally recorded and the theoretically generated spectra.
HTAR is a novel commercially available azo dye [
39,
40] that has recently been applied for the CPE-spectrophotometric determination of vanadium [
40], copper [
41], cobalt [
42], cadmium [
43], and mercury [
43]. Its complexes are separated easily by gravity, eliminating the need for a centrifuge. This approach, designated "centrifuge-less CPE" (CL-CPE) [
13,
14,
41,
42], is slightly slower than traditional CPE, but offers a simpler and more energy-efficient alternative.
2. Results and Discussion
2.1. Absorption Spectra and CPE Optimization
The complexation between Zn(II) and azo dyes, such as PAN [
18,
21,
26,
33,
36], 2-(5-bromo-2-pyridylazo)-5-diethylaminophenol (5-Br-PADAP) [
27], Sudan III [
37], and 4-(2-pyridylazo)-resorcinol (PAR) [
44,
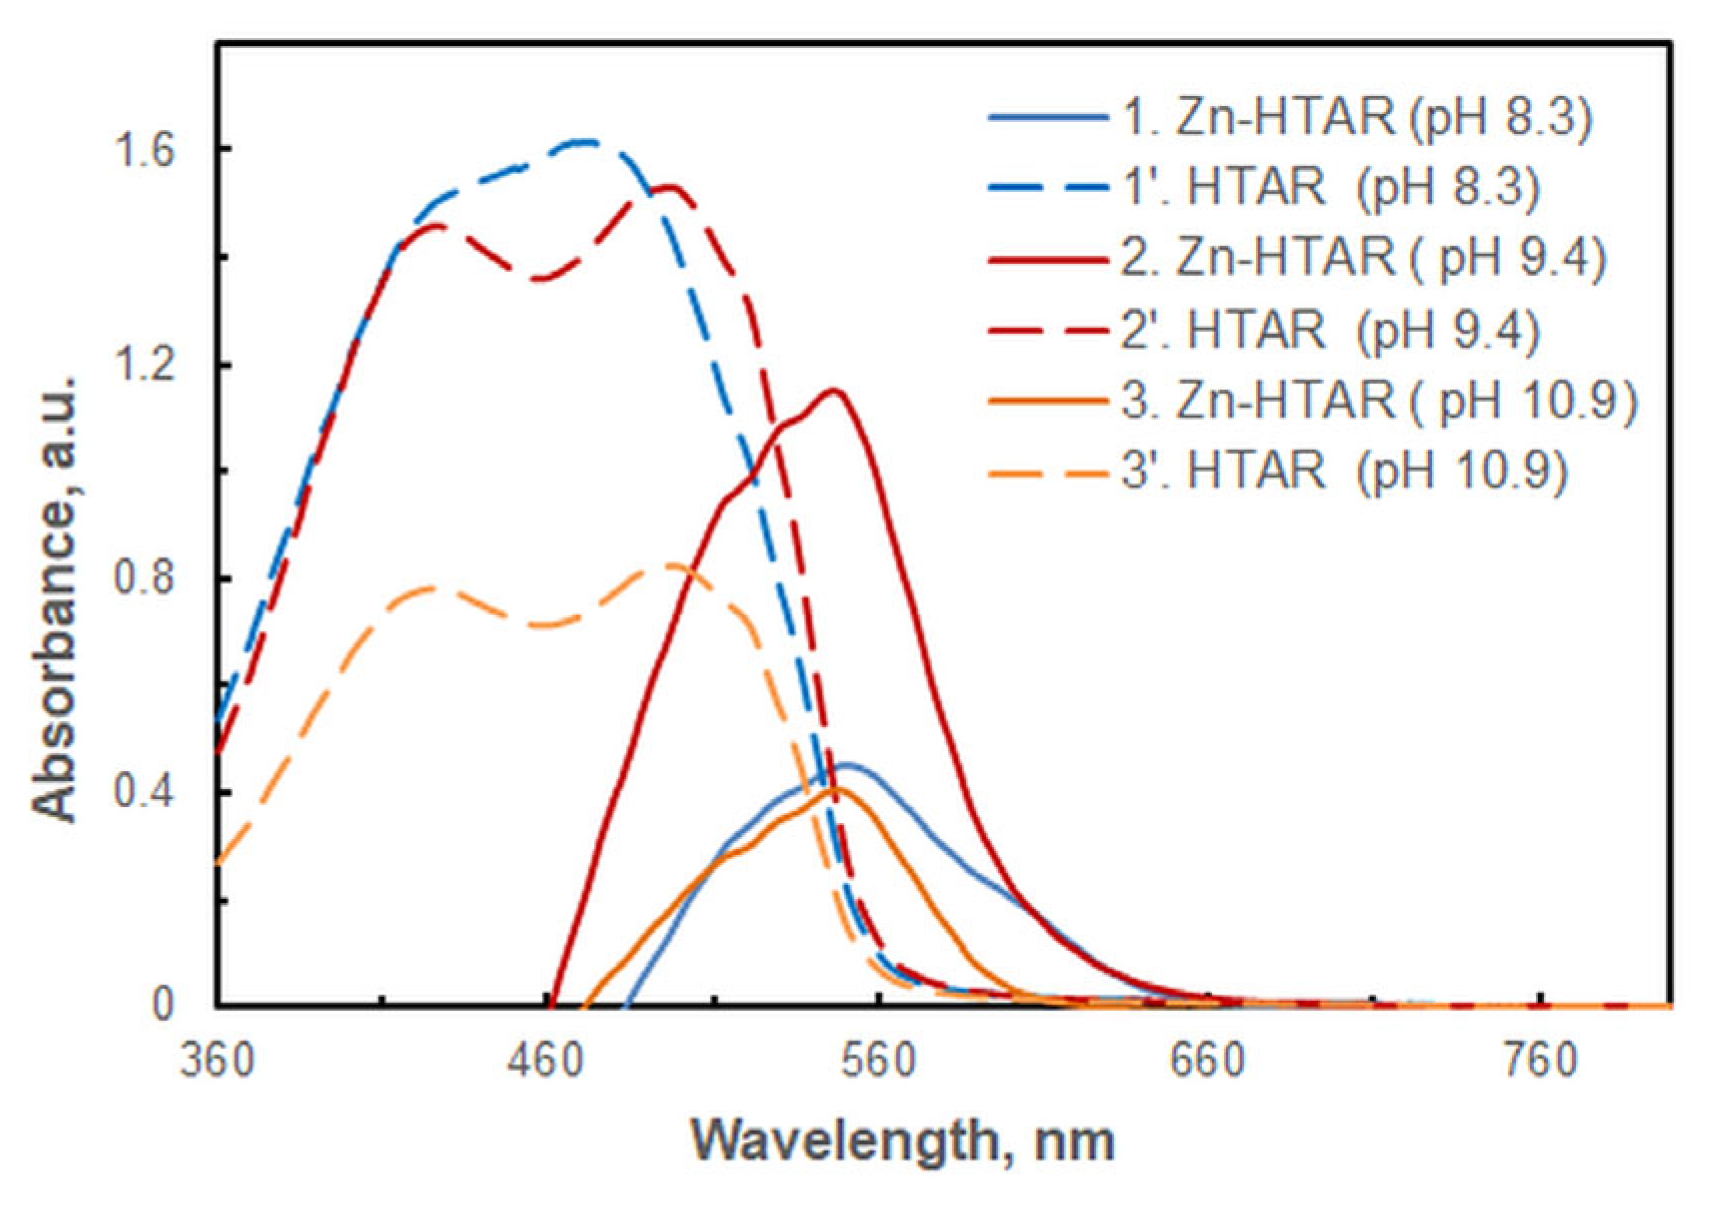
45], is known to occur in alkaline media. Similarly, the interaction of Zn(II) with HTAR also requires an alkaline environment. However, our observations indicate that complexes with different spectral properties are formed in response to small changes in experimental conditions (
Figure 1).
In order to identify the optimal conditions for CPE-spectrophotometric analysis (i.e., the conditions for obtaining the maximum analytical signal), a single-factor optimization approach was employed. The influence of the following variables was evaluated: concentration of HTAR, pH, amount of buffer, mass fraction of TX-114, incubation time, cooling time, mass of the final surfactant-rich phase (SRP) subjected to spectrophotometry, and wavelength of the spectrophotometric measurement. The optimal conditions identified are presented in
Table 1, and selected optimization steps are illustrated in
Figure 2,
Figure 3,
Figure 4,
Figure 5 and
Figure 6.
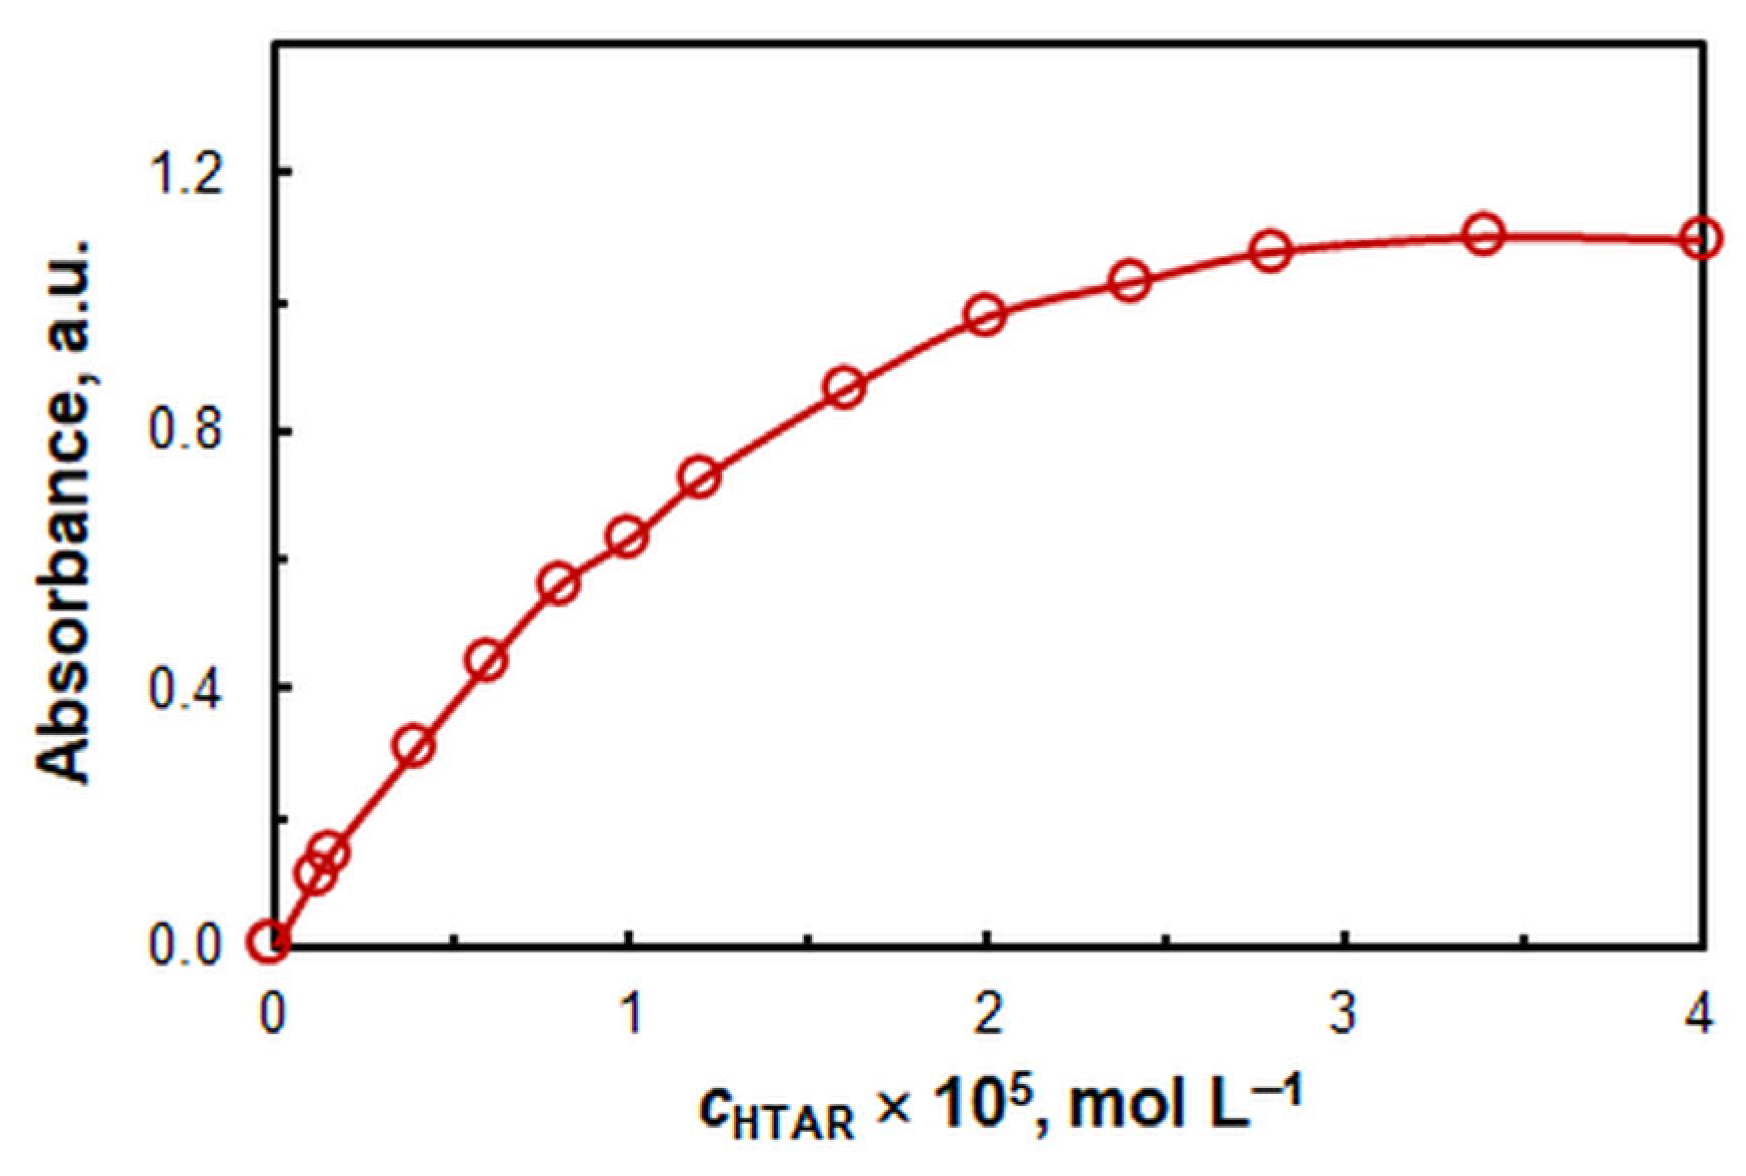
Figure 2 illustrates the impact of the HTAR concentration. The optimal value is 2.8 × 10
–5 mol L
–1. It is not recommended to work with higher HTAR concentrations, as this can result in significant blank absorbance values.
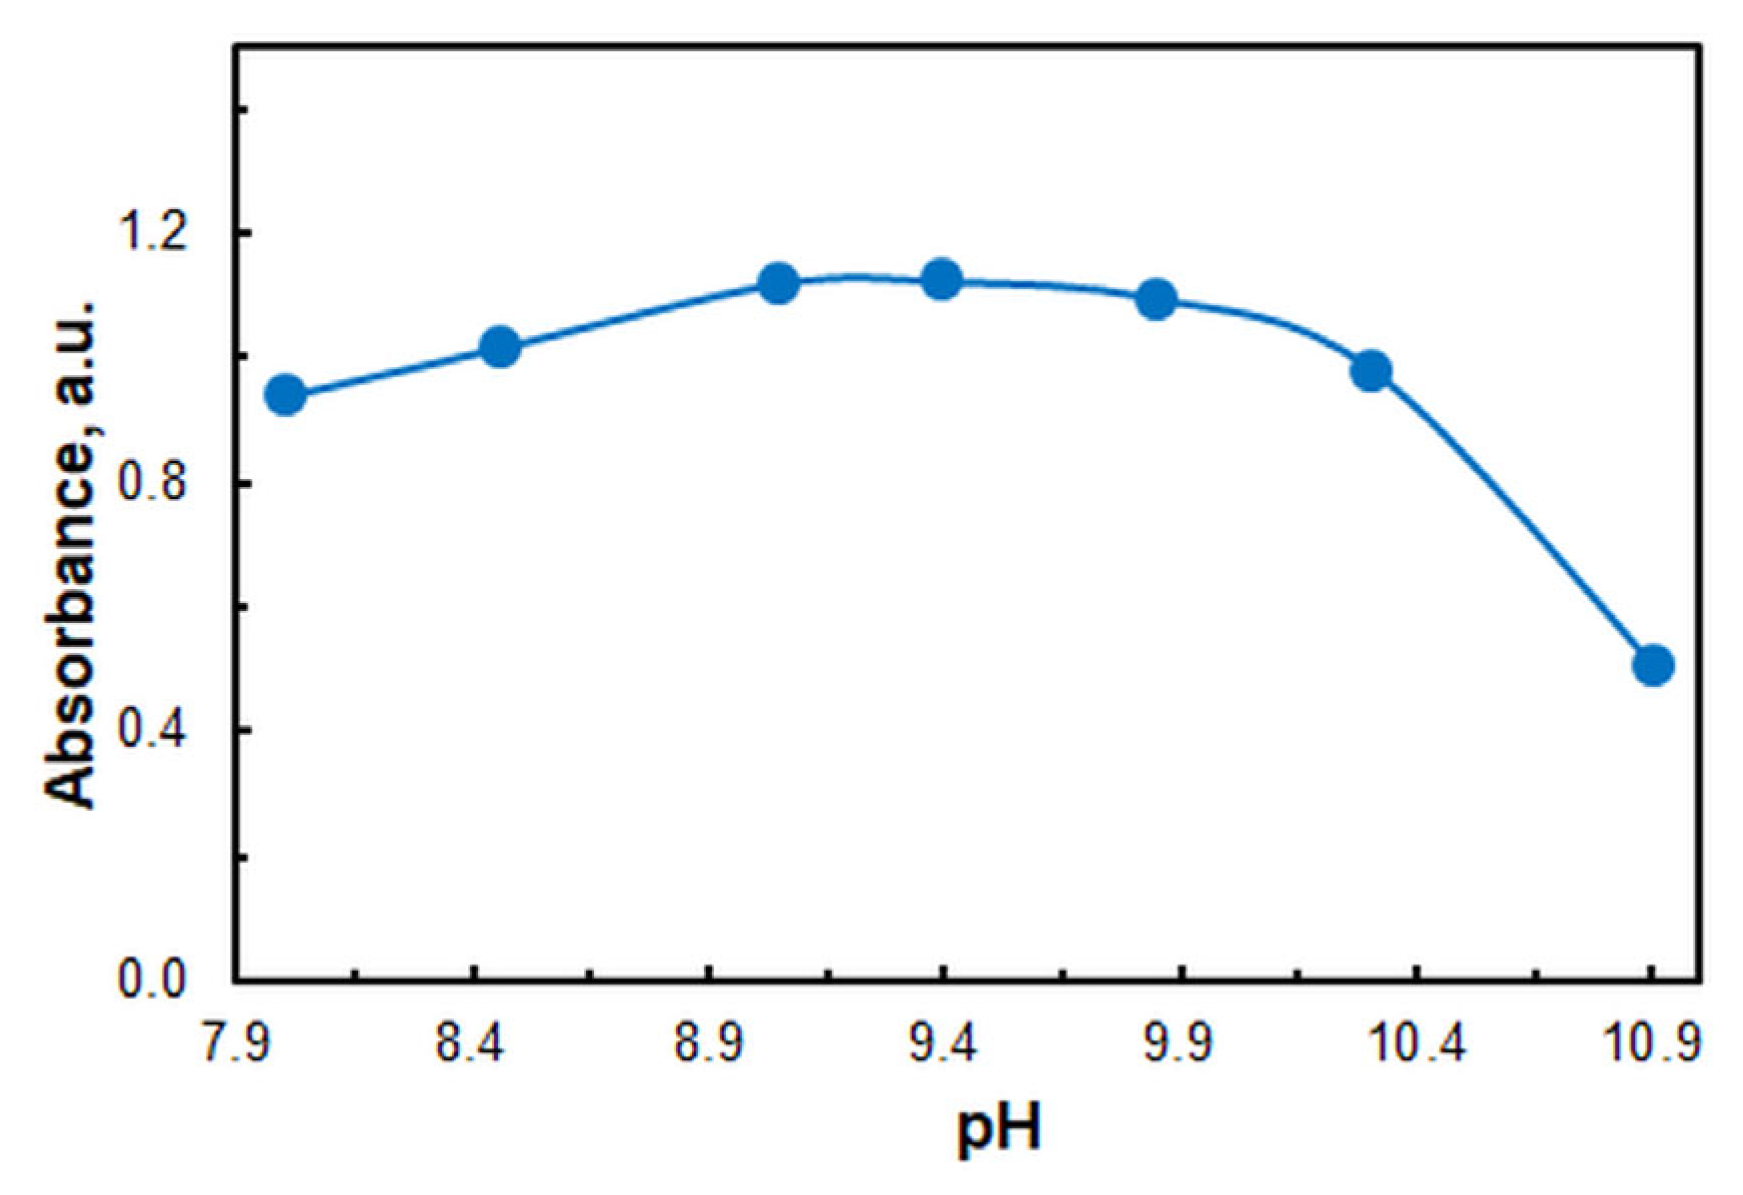
The CPE was conducted in the presence of an ammonium acetate buffer prepared from 2 mol L
–1 solutions of ammonia and acetic acid. As illustrated in
Figure 3, the absorbance is maximal within the pH range of 9.0 to 9.8. This range is sufficiently broad to ensure reliable results. Further studies were conducted at pH 9.4. At this pH value, the buffering capacity is at its maximum [
46].
In other HTAR-based CPE systems for the determination of metal ions, for example, Cu(II) [
41] and Co(II) [
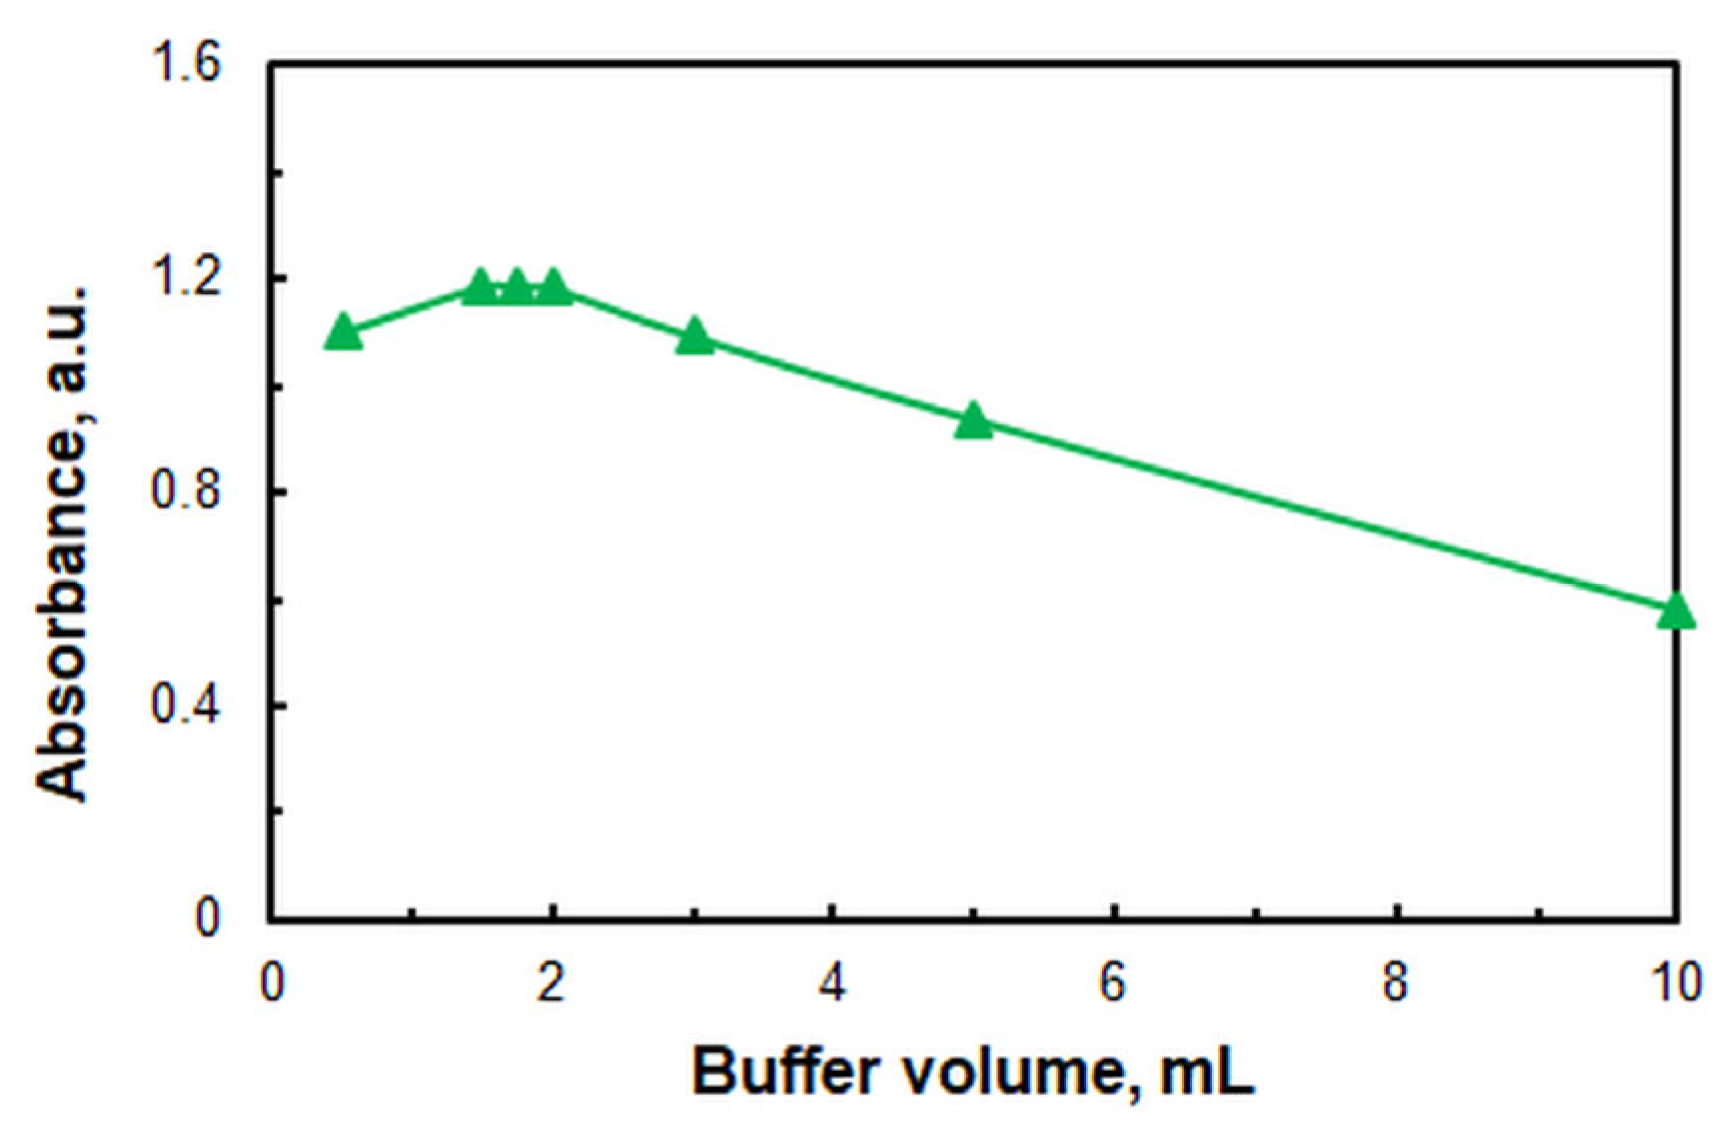
42], the addition of high amounts of the same ammonium acetate buffer was found to have no effect on the absorbance. However, in the CPE of Zn(II), a clear trend of decreasing absorbance was observed when large volumes of the buffer were used.
Figure 4 illustrates that the highest absorbance is observed when the buffer volume (
Vbuff) is in the range of 1.5 to 2.0 mL. Therefore, the optimum
Vbuff is 1.7–1.8 mL.
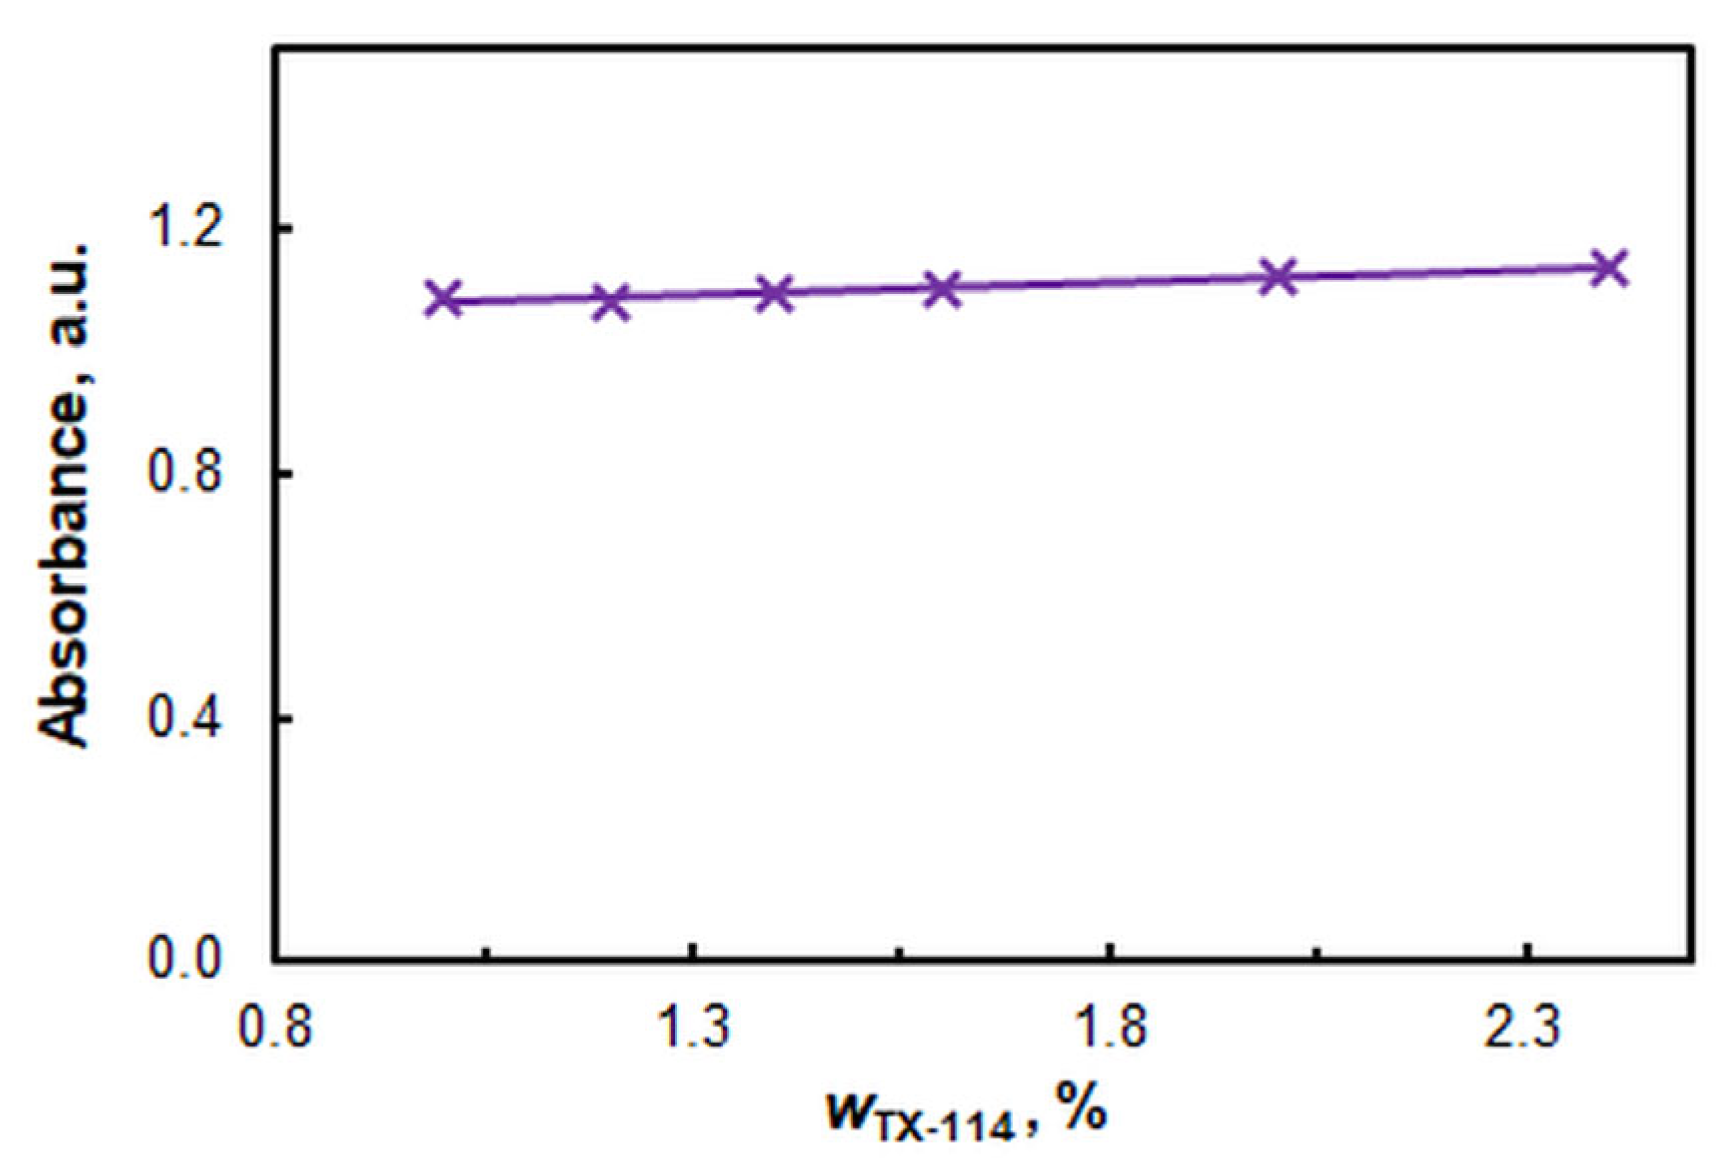
Figure 5 illustrates the impact of the mass fraction (
w) of TX-114. It can be observed that the absorption remains nearly constant throughout the interval under study. It is challenging to work at
w < 1%, as the surfactant-rich layer remains permanently turbid. The recommended
wTX-114 is 1.2%.
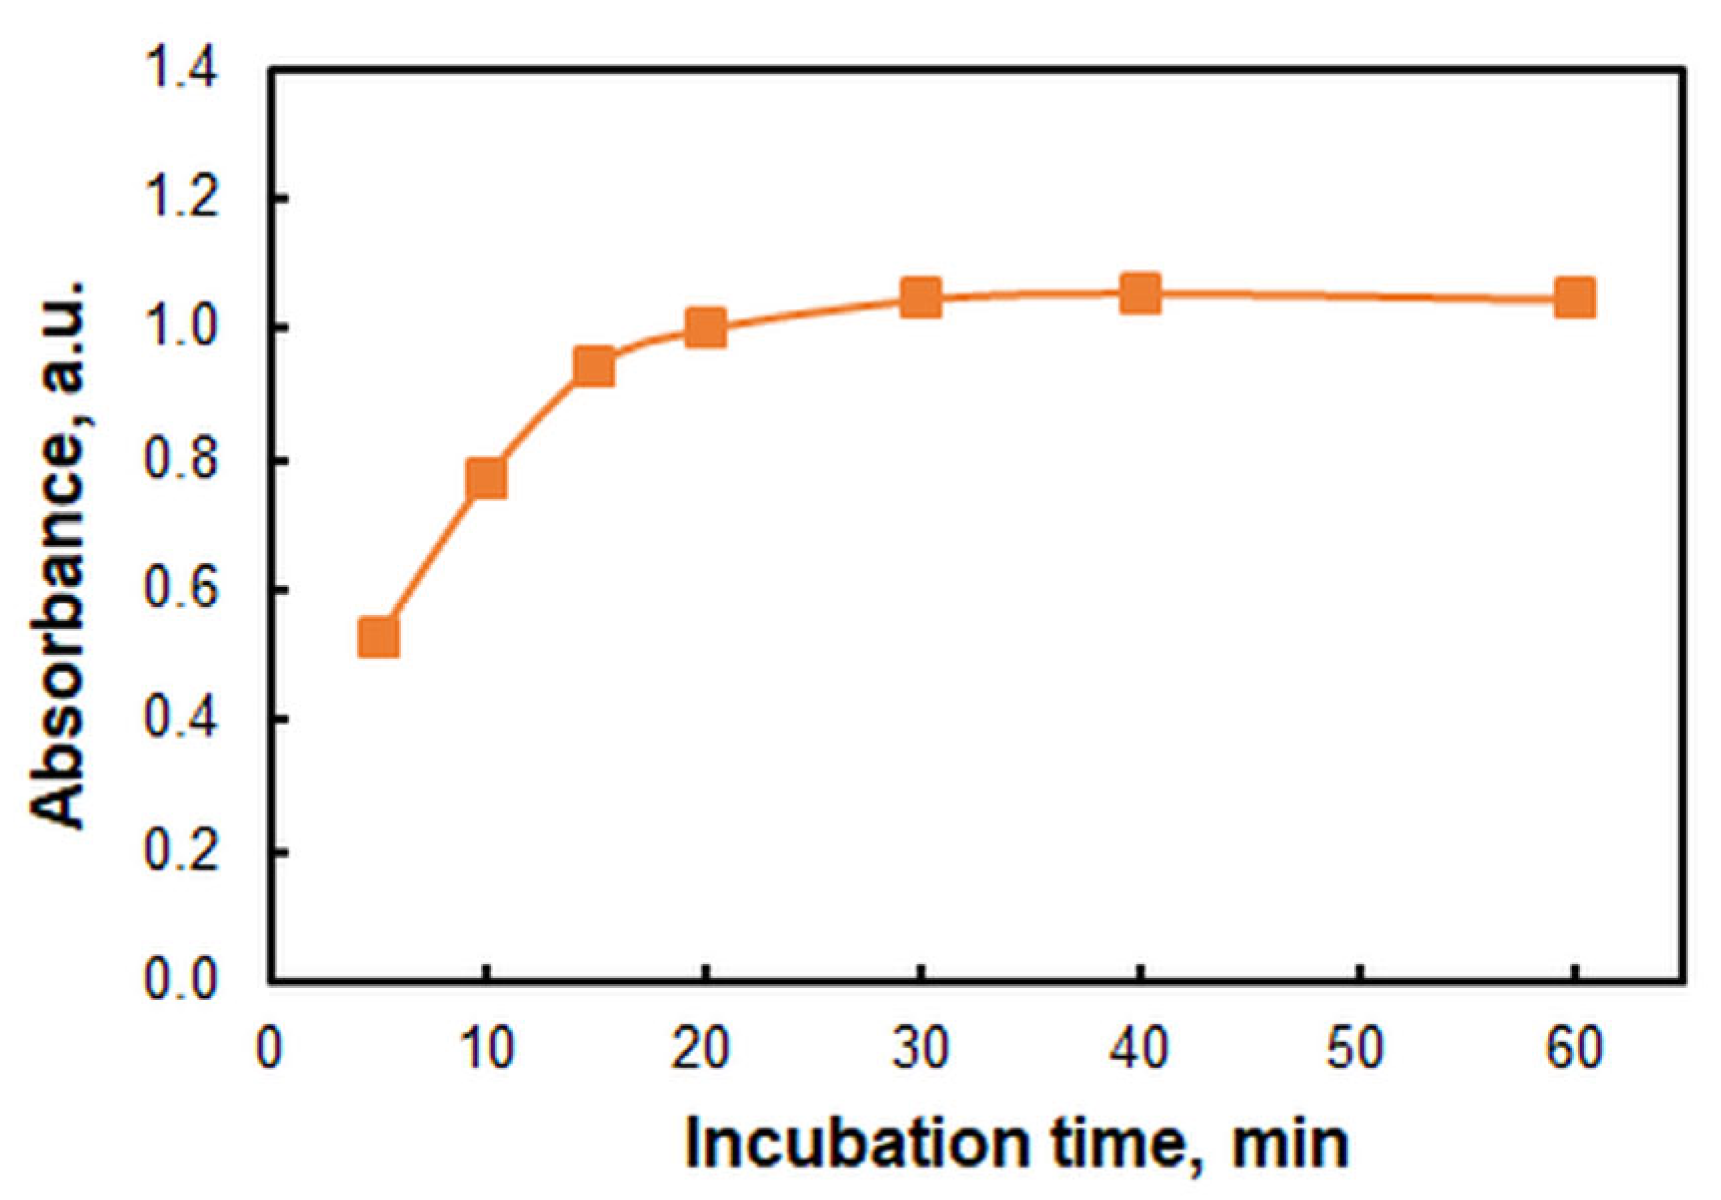
Figure 6 illustrates the impact of incubation time at a fixed water bath temperature of 50 °C. The time was measured from the moment the cloud point temperature was reached, which could be easily identified visually. It is evident from
Figure 6 that the incubation time (
t) is a non-critical parameter. Further studies were conducted at
t = 30 minutes.
The cooling for phase separation can be conducted at approximately –20 °C for a period of 30 to 60 minutes. It is not necessary to use a centrifuge. A shorter cooling time results in insufficiently viscous SRP, which interferes with phase separation by inverting the tube. If cooled for more than one hour, the upper aqueous phase may freeze.
Two approaches were evaluated for the processing of SRP:
1) Topping up to 5.00 g with water, gently heating and shaking to obtain a homogeneous solution [
40,
41,
42,
47].
2) Topping up to 3.00 g with a mixture of water and alcohol (ethanol or methanol).
The second approach is more rapid, more convenient, and provides higher sensitivity. A series of water-alcohol mixtures with varying alcohol contents was utilized to ascertain the optimal proportion. It was determined that the presence of 0.5 mL of ethanol was sufficient to produce a homogeneous liquid. Consequently, the subsequent experiments were conducted by diluting the SRP with 0.5 mL of ethanol and adding water to a total mass of 3.00 g.
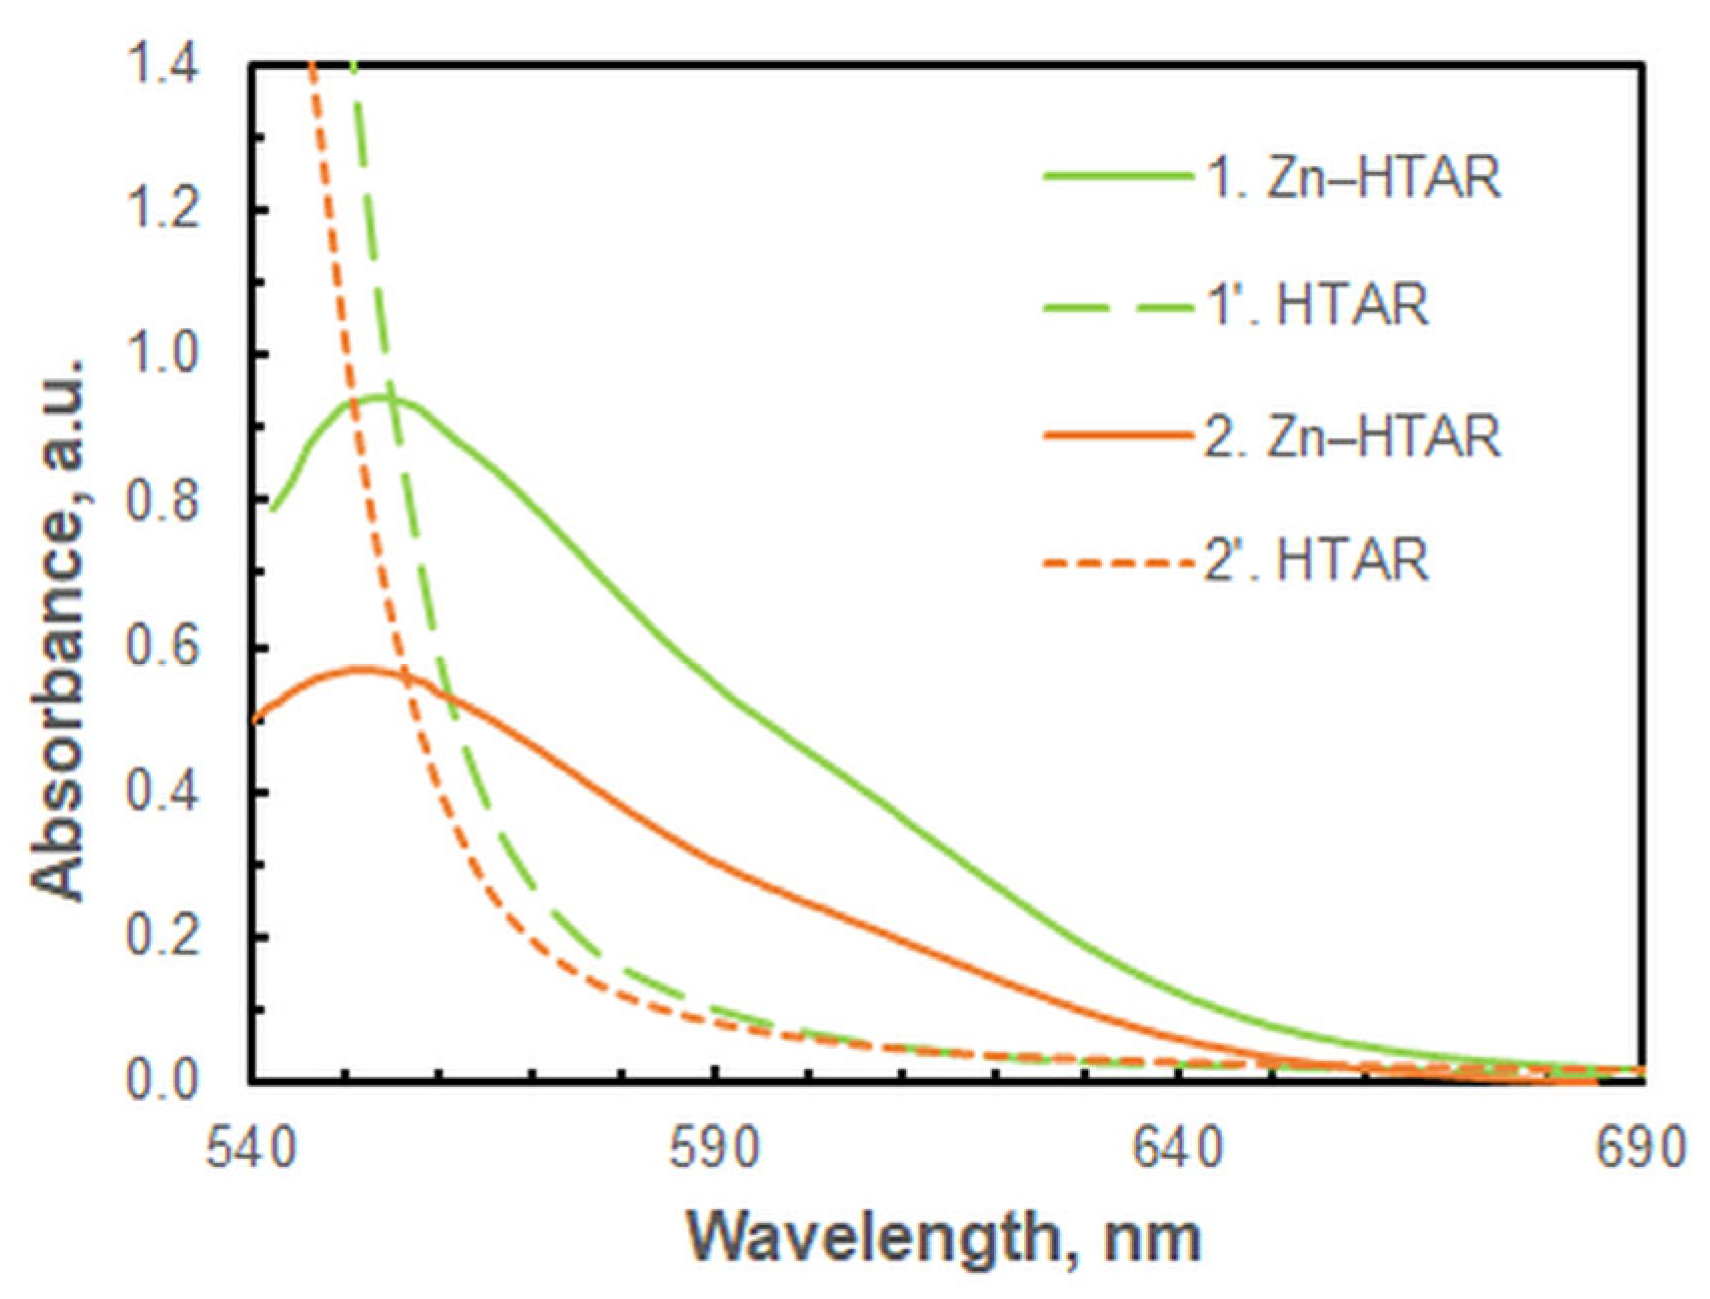
Figure 7 demonstrates that the location of the spectral bands is not affected by the added ethanol.
2.2. Stoichiometry and Suggested Structures
The saturation curve presented in
Figure 2 served as the basis for determining the stoichiometry of the extracted species. The results obtained by the straight-line method of Asmus [
48] (
Figure 8) and by the Bent & French method [
49] indicate that the molar ratio of Zn(II) to HTAR is 1:1. However, these methods are unusable for species of the type M
mR
n, where
m =
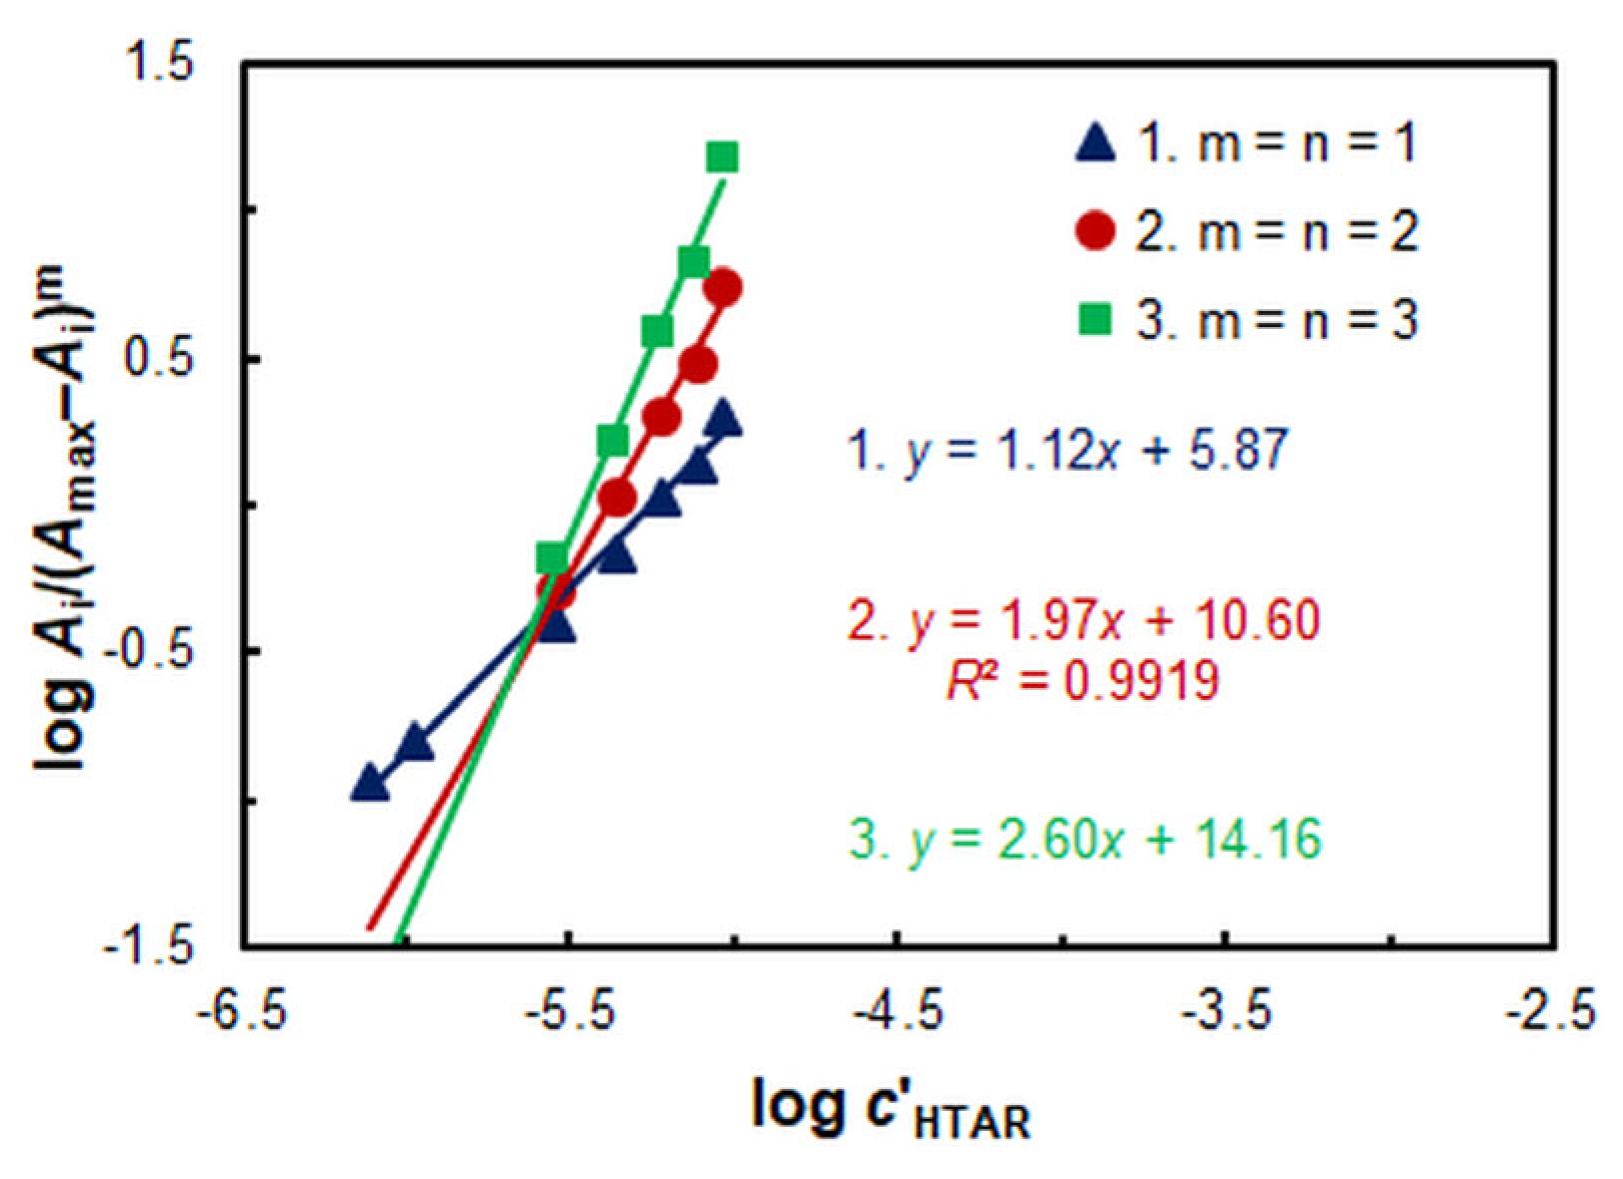
n > 1. Consequently, the mobile equilibrium method [
50] (
Figure 8), which is capable of handling such complexes, was employed as a subsequent step. The resulting slopes of the straight lines plotted in
Figure 9 are consistent with the conclusion that the complex stoichiometry is 2:2.
The chemical interactions that lead to the formation of hydrophobic extractable species are influenced by a number of factors. Among these are the ligand(s) design and the provision of an appropriate coordination number, as well as the possibilities of dimerization, which increases the hydrophobicity [
51]. Zinc's coordination numbers are usually between four and six, with three, seven, and eight being less common [
52]. The tetrahedral coordination geometry is the most prevalent [
53].
The HTAR, like other azoresorcinols [
16,
44,
54], is a tridentate ligand [
51]. This implies that at a 1:1 stoichiometry (Zn: HTAR) the coordination number of the complex should be 3.
The coordination sphere could be augmented with water molecules, but this would compromise the hydrophobicity. Another potential avenue for achieving a higher coordination number is the incorporation of ammonia molecules. This assumption is supported by the observation that the optical properties of the extract are influenced by the amount of the buffer added (see
Figure 4).
It is conceivable that the experimentally observed 2:2 structure resulted from the dimerization of two stable 1:1 species. Given that this is an equilibrium process, the coexistence of both 2:2 and 1:1 species can be anticipated.
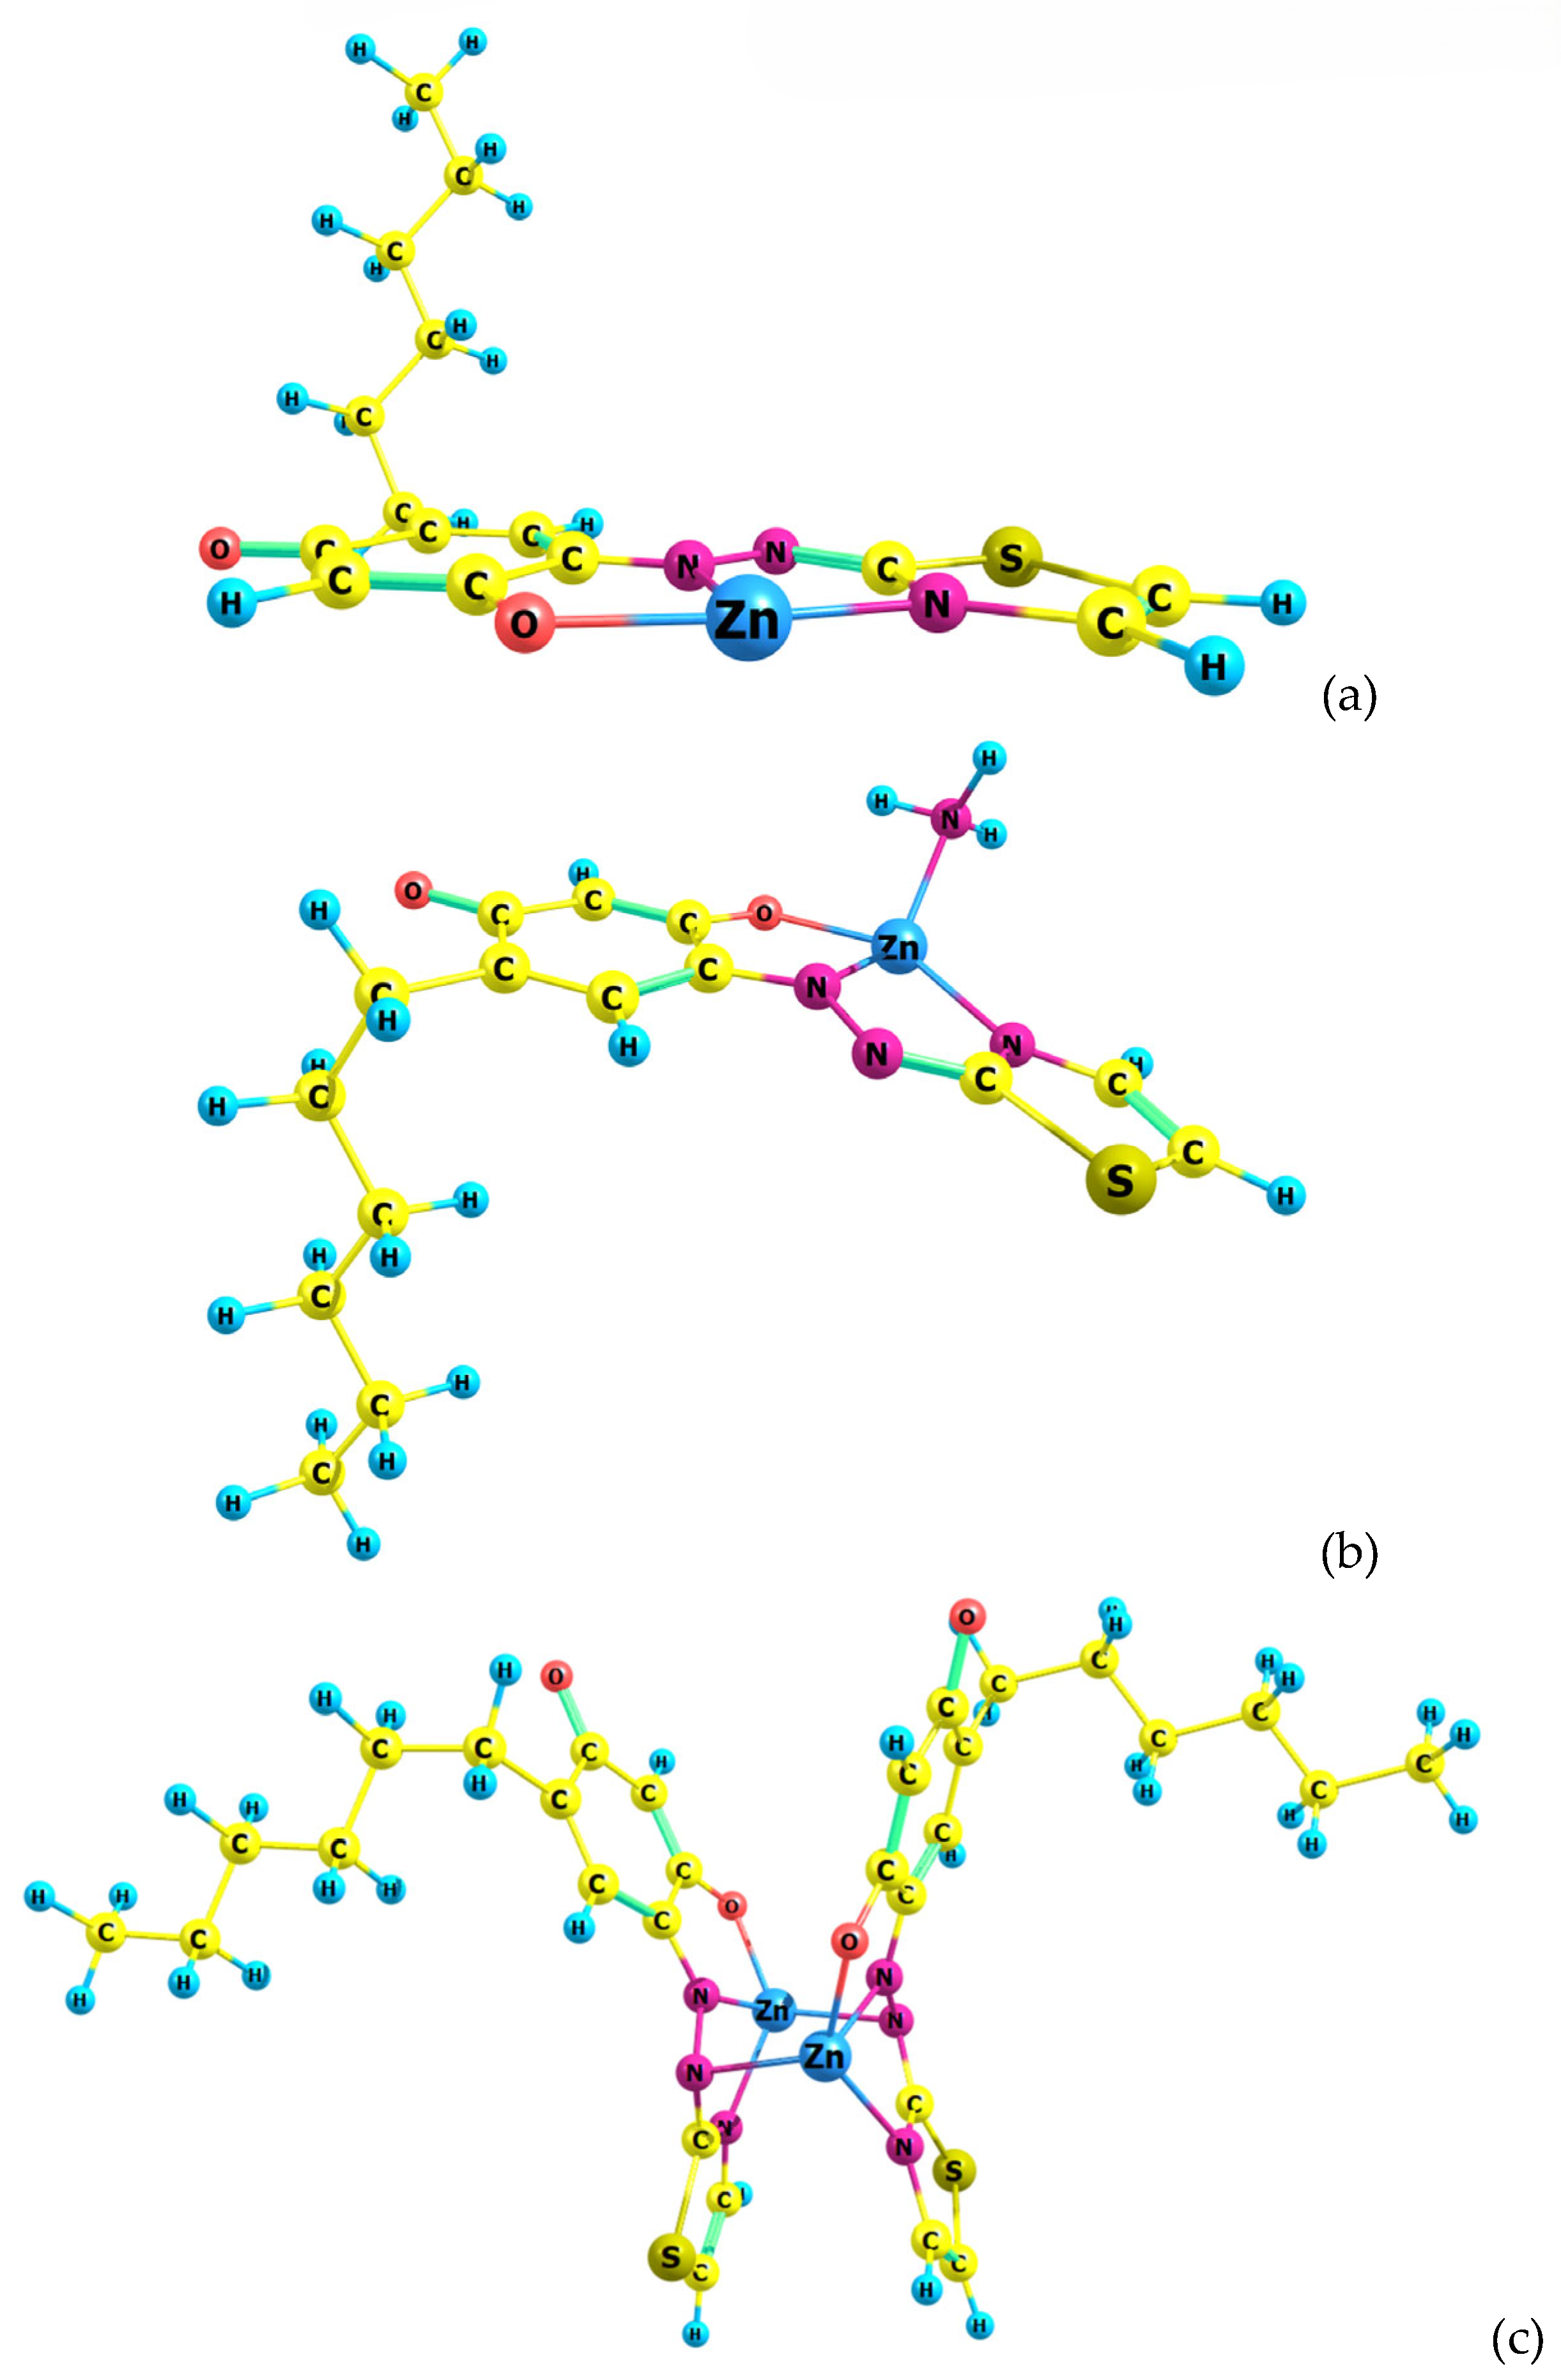
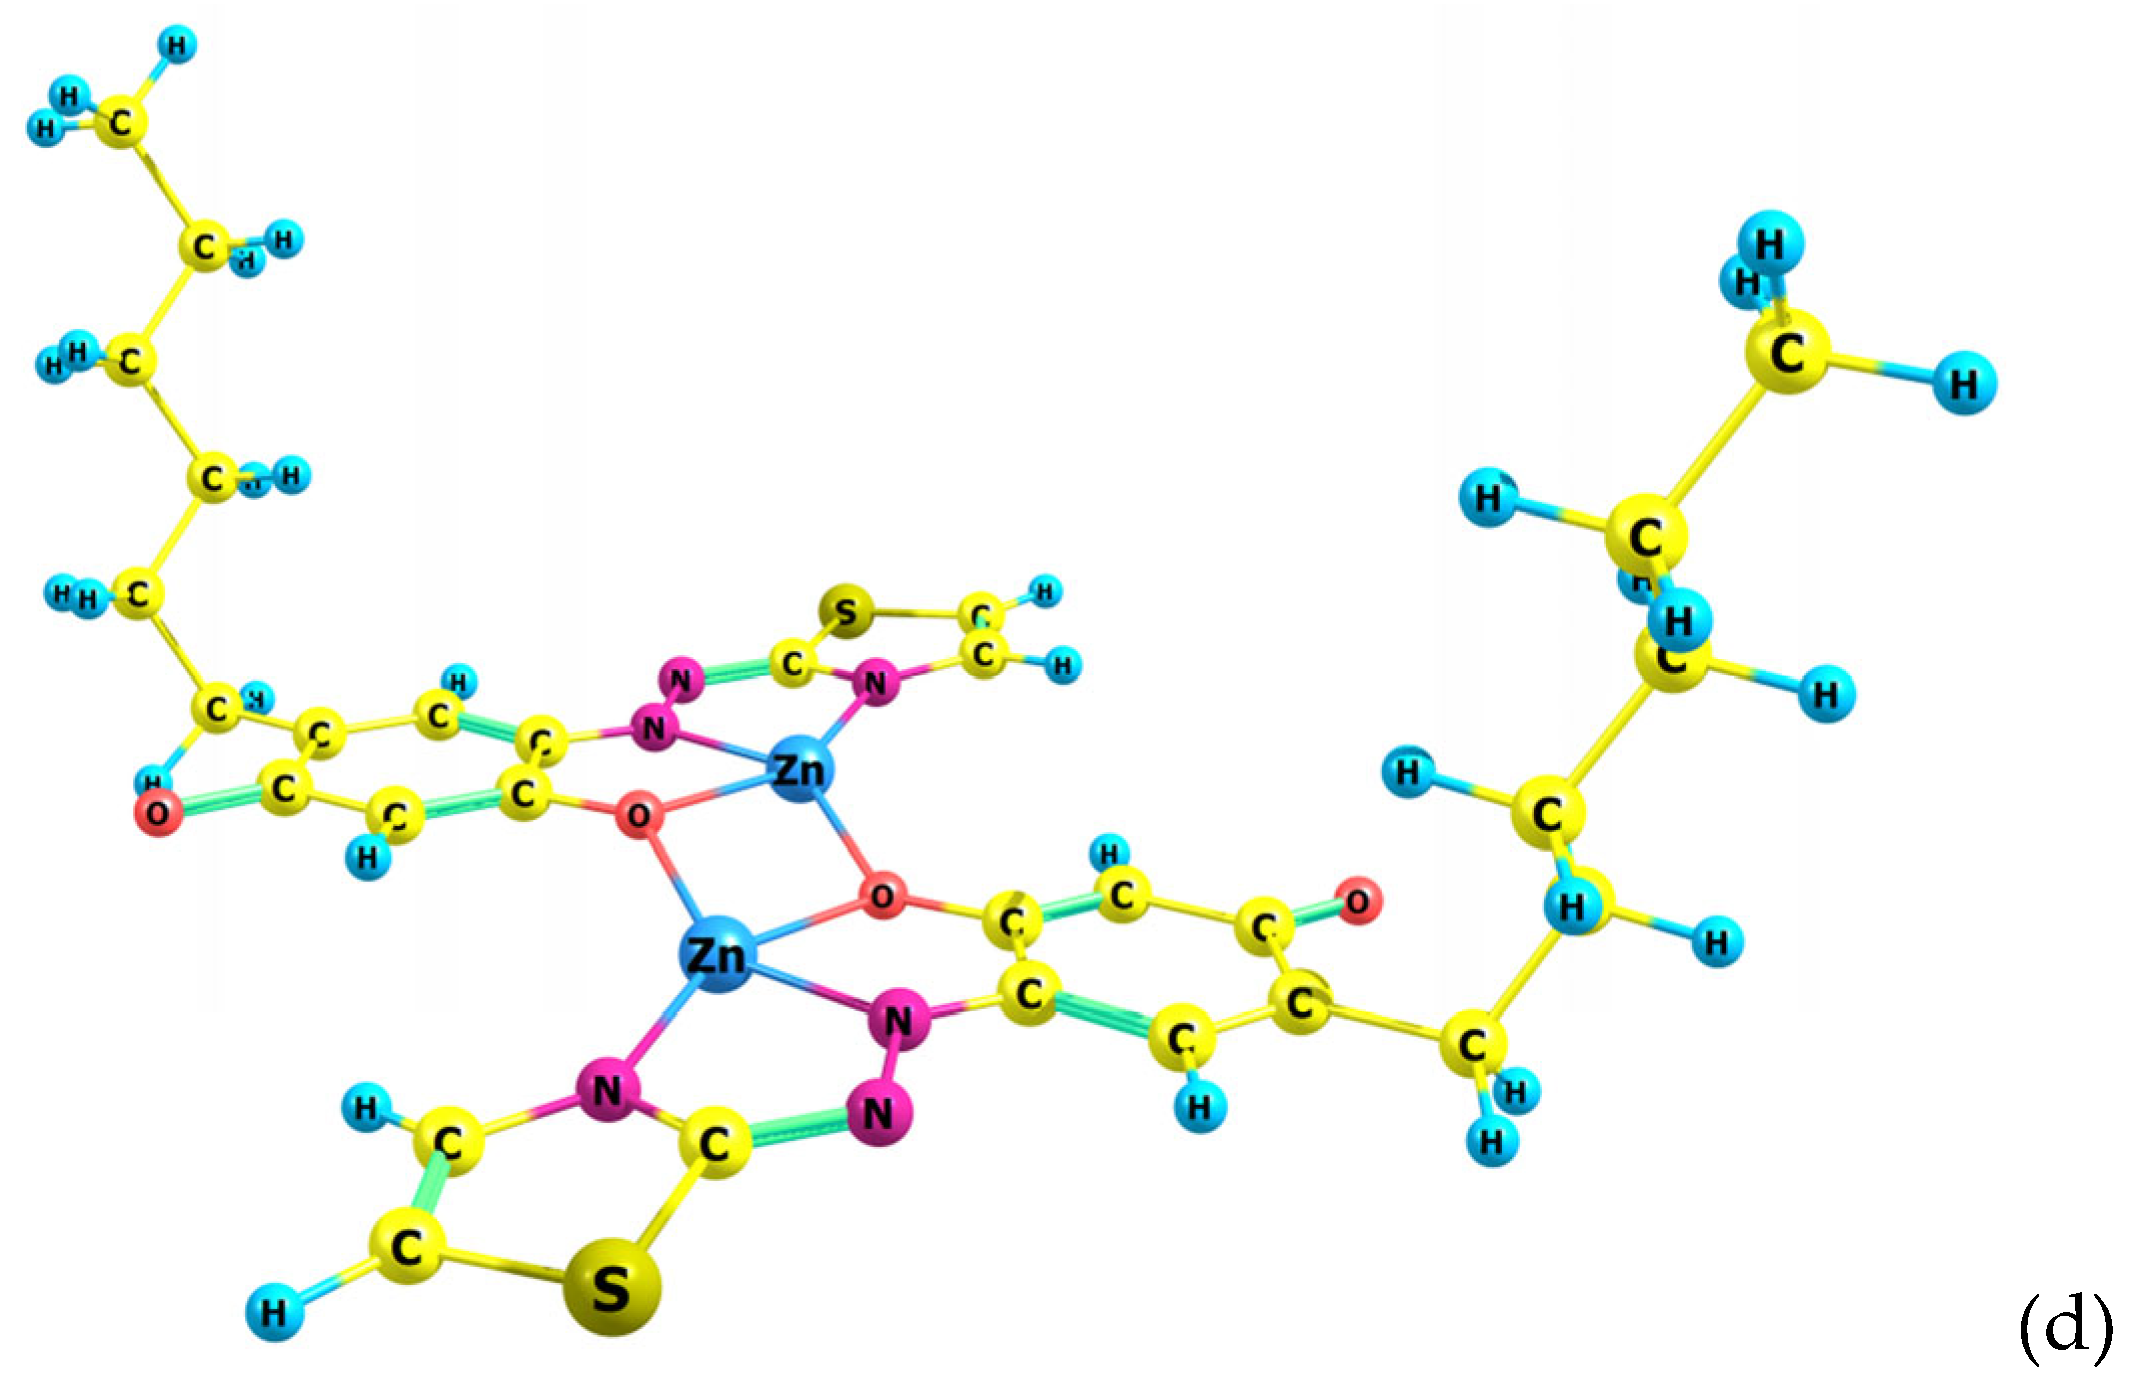
A preliminary step to verify the above assumptions was to model several potential structures with a stoichiometry of 1:1 and 2:2. Their ground state equilibrium geometries, optimized at the theoretical B3LYP/6-31G level, are presented in
Figure 10. Structures 3 and 4 were obtained by pairing Structure 1 in two different ways, with consideration given to previous experience [
51,
54].
In Structure 1, all atoms, with the exception of the hydrophobic hexyl tail of HTAR, are arranged in a plane, a configuration also observed in the free ligand [
40] and its vanadium(V) complex [
55]. The polygon exhibits T-shaped symmetry with valence angles of 82.9° (N
thiazole, Zn, N
azo), 86.5° (N
azo, Zn, O), and 169.5° (O, Zn, N
thiazole). In Structure 2, which contains an additional ammonia molecule, the planarity is slightly disrupted. The polygon is a highly distorted tetrahedron with valence angles of 154.0° (O, Zn, N
thiazole) and 137.5° (N
azo, Zn, N
ammonia). The planarity of the two ligands in the dimeric Structure 3 is most significantly disrupted. The two zinc atoms are also tetra-coordinated. In this structure, a six-membered ring involving the Zn atoms and the nitrogen atoms of the azo groups is observed. Structure 4 appears to be more stable than Structure 3. In it, the planarity of the ligands is largely preserved, and the oxygen atoms in the ortho position relative to the azo groups act as bridge atoms between the two coordination centers.
2.3. Comparison of Theoretical and Experimental Spectra
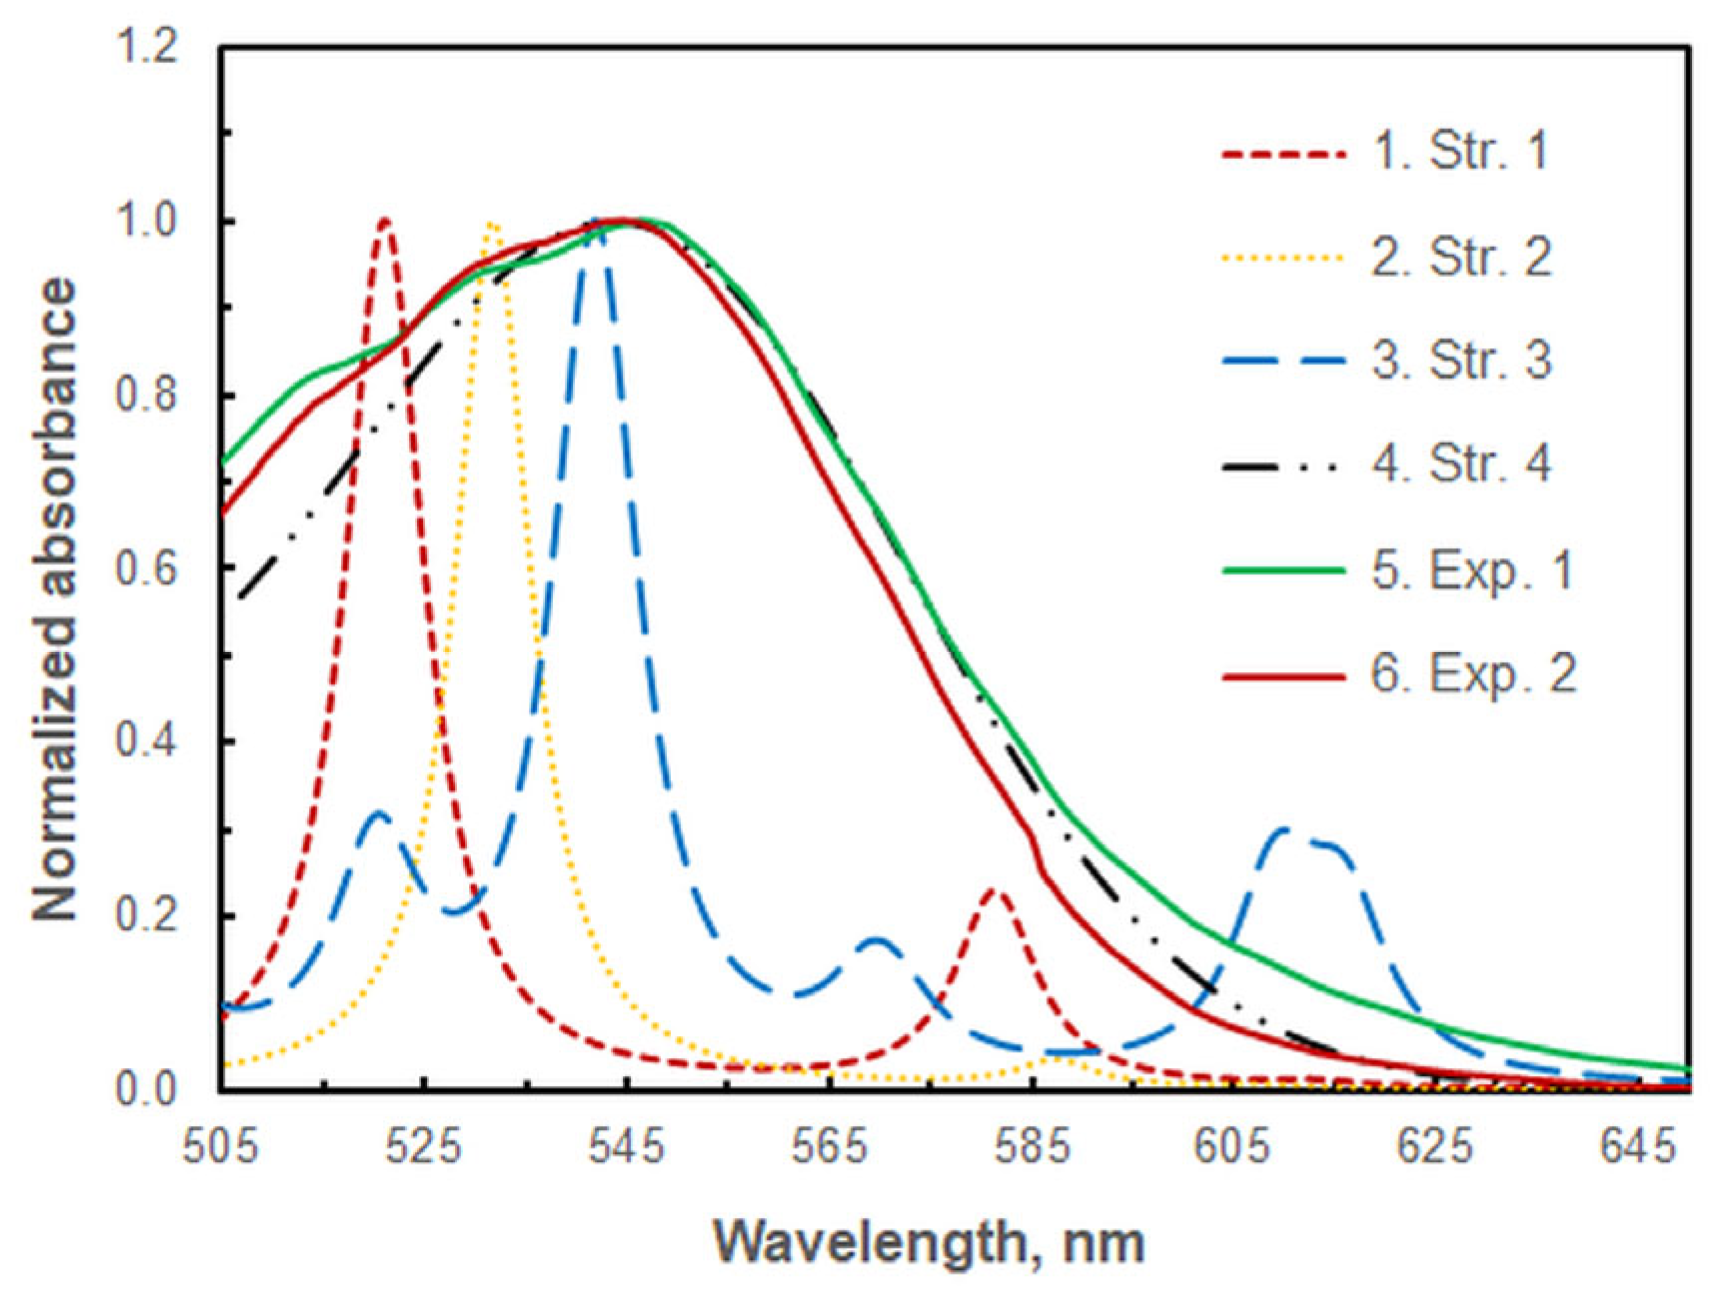
The structures depicted in
Figure 10 were used to compute vertical excitation energies with the time-dependent Hamiltonian, with the objective of simulating their theoretical absorption spectra.
Figure 11 compares these spectra with two experimental spectra (Exp. 1 and Exp. 2) obtained using different volumes of the buffer with the optimum pH of 9.4. It can be concluded that Exp. 1, obtained at the optimal buffer volume, is closer to the theoretical spectrum of Structure 4. However, both experimental spectra demonstrate the presence of the other three structures (Structures 1–3). For instance, the kink at approximately 585 nm in the Exp. 2 suggests that Structure 1 is formed even at high ammonia concentrations.
2.4. Energy Analysis of the Dimeric Structures
The shoulder observed at approximately 610 nm in the experimental spectra at the optimum HTAR concentration (
Figure 7), along with the spectra presented in
Figure 1 and
Figure 11, lead to the conclusion that Structure 3 exists in the extract, along with the dominant Structure 4. A comparison of the energies of the two binuclear complexes (Structure 3 and Structure 4) is therefore warranted. The calculated energy quantities at the selected theoretical level indicate that Structure 4 is approximately 175 kJ mol
–1 more stable than Structure 3. Additionally, the transformation from Structure 3 to Structure 4 is accompanied by a negative free energy change, ΔG = –179 kJ mol
–1, and a heat effect, ΔG = –172 kJ mol
–1.
2.5. Extraction Constant and Fraction Extracted
Given that under optimal CPE conditions, predominantly 2:2 species are extracted, the mobile equilibrium method (
Figure 8, line 2) can be employed to calculate the conditional extraction constant (
Kex). The determined logarithmic value of this constant is log
Kex = 15.9 ± 0.5.
The fraction extracted was determined via the formula %E = 100 × A1 / A3, where A1 and A3 are the corresponding absorbances for a single and a triple extraction (n = 5) at the optimum CPE conditions in equal final masses of the SRP (10.00 g). The obtained value, (98.3 ± 1.4)%, is indicative of the quantitative extraction of Zn(II).
2.6. Calibration Curve and Analytical Characteristics
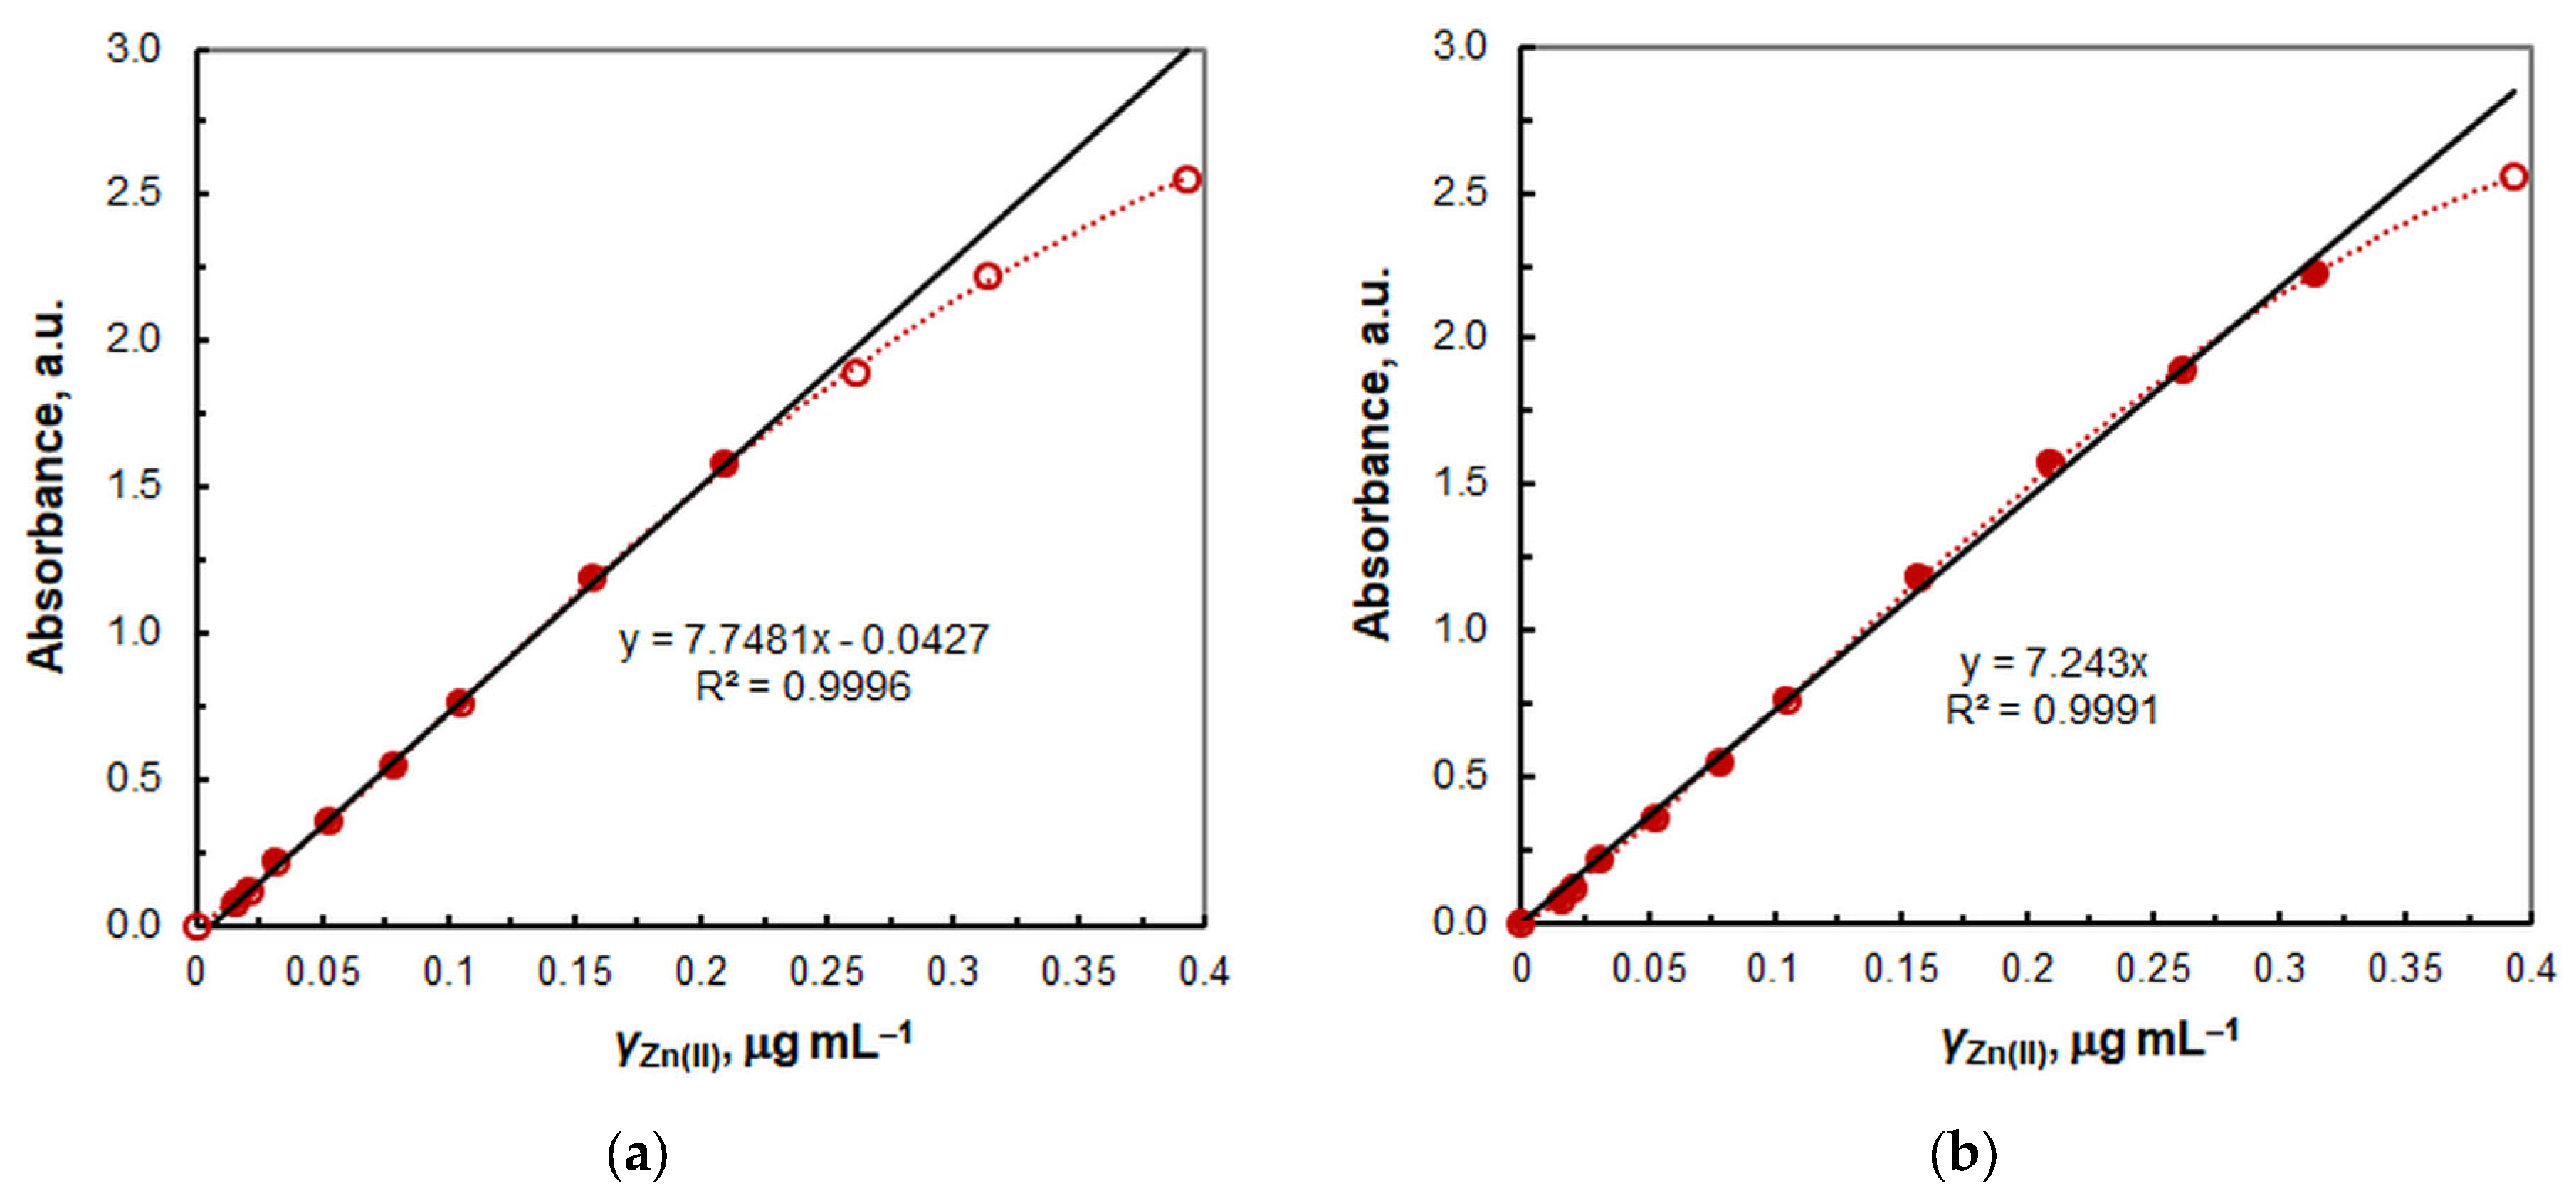
The relationship between absorbance and zinc concentration under optimal CPE conditions was linear within the range of 15.7 to 209 ng mL
–1 Zn(II) (
Figure 12a), with a remarkable squared correlation coefficient (
R2 = 0.9996). The linear regression equation was found to be
А = 7.748
γ–0.0427, where
γ represents the Zn(II) mass concentration in μg mL
–1. The standard deviations of the slope and intercept were 0.065 and 0.0068, respectively. The intercept is relatively small, but statistically distinguishable from zero. This can be attributed to the fact that at a low Zn(II) concentration, the presence of the minor 1:1 species is more noticeable.
If the intercept is set to zero (
Figure 12b), the relationship becomes linear up to 314 ng mL
–1 Zn(II) with an
R2 value of 0.9991. The resulting line is then described by the equation
A = 7.243
γ. The calculated molar absorptivity coefficient (
ε) is 4.47 × 10
5 L mol
–1 cm
–1, and the Sandell sensitivity is 0.138 ng cm
–2.
The density of the final SRP in the presence of 0.5 mL of ethanol, determined at room temperature with a pycnometer, was found to be close to unity (ρ = 0.99). Consequently, the preconcentration factor, calculated as the ratio of the highest sample volume (50 mL) to the lowest final volume (3.00 g = 3.03 mL), was determined to be 16.5.
A comparable value (PF = 16.4) was attained by dividing the slopes of the calibration lines obtained after CPE and without CPE (in the absence of TX-114 and without heating). The lack of a significant discrepancy between these values indicates that the chemistry of the complexation process is unlikely to be altered upon heating.
2.7. Impact of Foreign Ions
The influence of foreign ions is presented in
Table 2. The presence of large amounts of common ions, such as Na
+, K
+, Cl
–, SO
42–, NO
3–, and F
–, is tolerable, which does not place restrictions on how the samples are dissolved. Ions such as Mo(VI), W(VI) and Re(VII) also do not interfere in large amounts. The most significant interferences are caused by Cd(II), Co(II), Cu(II), Ni(II) and Pb(II), which form well-extractable complexes under the experimental conditions.
2.8. Analytical Application
The method was applied to determine the zinc content of Zinkorot® tablets, which are claimed to contain 25 mg of zinc per tablet. The result was statistically identical to this value: 24.7 ± 0.8 (mean ± SD, four replicate analyses). To evaluate the inter-day reproducibility, eight replicate analyses of the solution were performed on the next two days (four analyses per day). The pooled results for the three consecutive days demonstrated that the reproducibility was satisfactory, with a mean value of 24.8 and a relative standard deviation (RSD) of 3.7%.
The range of analyses was subsequently expanded by processing a dermal ointment (containing 10% ZnO) and two industrial samples, namely zinc concentrate and granulated zinc powder. The results are presented in
Table 3. The RSD was in the range of 2.5–3.1%.
2.9. Comparison with Existing Methods
Table 4 presents a summary of the data for the CPE-spectrophotometric methods for the determination of Zn(II). The novel CL-CPE method can be labelled as simple, convenient, inexpensive, sensitive, and ecologically friendly. The reagent is commercially available and does not require synthesis, in contrast to the procedures described in Refs. [
23,
24,
35,
56]. The incubation temperature (50 °C) is lower than that applied when using TX-100 (80–95 °C). The fraction extracted is significant, as the complex species are hydrophobic. Therefore, it is not necessary to add electrolytes to increase the fraction extracted. The method is not encumbered by absorption–desorption processes, as in Ref. [
34], or by the mathematical treatment of absorbances at different wavelengths, as in Ref. [
33].
One limitation of the proposed method is the lack of selectivity for certain side ions, which should be considered when selecting samples for analysis. Additionally, the absorbance of the blank at λmax is relatively high. However, this drawback can be easily overcome by measuring at a longer wavelength, if necessary.
3. Materials and Methods
3.1. Instrumentation and Chemicals
Spectronic Camspec M550 and Ultrospec 3300 pro scanning UV-Vis spectrophotometers (United Kingdom) equipped with 1 cm cuvettes were used for spectrophotometric measurements. The pH was determined using a WTW InoLab 7110 pH meter (Germany). An Ohaus Pioneer PA214C top-loading analytical balance (USA) was used for mass quantification. Samples were heated in a GFL 1023 water bath (Germany).
The chemicals were of the Merck brand. The stock Zn(II) solution (1 g L
–1) was prepared by dissolving high-purity zinc with an appropriate amount of HCl (1:1) [
28,
38,
57]. Further dilution was employed to prepare working solutions with a concentration of 2 × 10
–4 mol L
–1. The HTAR was dissolved in the presence of potassium hydroxide, resulting in an aqueous solution with a concentration of 2 × 10
–3 mol L
–1 [
39]. Laboratory-grade TX-114, diluted with water at a mass fraction of 10%, was utilized. The buffers were prepared by mixing the appropriate volumes of aqueous solutions of 2 mol L
–1 acetic acid and 2 mol L
–1 ammonia. The experiments were conducted using distilled water.
3.2. Samples and Sample Preparation
Zinkorot (Woerwag Pharma), a zinc supplement indicated for the treatment of zinc deficiency conditions, was procured from a local pharmacy. According to the product label, each tablet contains 25 mg of zinc. The tablets were prepared for analysis by the procedure outlined in [
42], which involved heating in a mixture of concentrated nitric acid (10 mL) and concentrated sulfuric acid (1 mL) on a sand bath.
A Zn-containing dermal ointment was prepared by mixing 10 g zinc(II) oxide with 90 g petrolatum. The mixture was then heated under agitation in a water bath at 85 °C. The resulting ointment was subjected to dissolution according to a known procedure, which entailed treatment with 0.5 mol L
–1 nitric acid to dissolve the oxide, followed by liquid-liquid extraction with diethyl ether to separate the organic component [
58].
The industrial samples (granulated dust and zinc concentrate) were provided by KCM SA, Plovdiv (Bulgaria), a metallurgical smelter engaged in the production of zinc and other metals. The samples were dissolved in concentrated nitric acid, and the resulting solutions were transferred to 1000-mL flasks, with water added until the mark.
3.3. CPE-Spectrophotometric Optimization
Solutions of TX-114, Zn(II), ammonium acetate buffer, and HTAR were transferred in a sequential manner into conical centrifuge tubes of known mass. The resulting mixtures were diluted to 50 mL with water and heated in a water bath at 50 °C for a fixed period of time. Subsequently, the tubes were cooled in a refrigerator to ensure completion of the precipitation process and to facilitate removal of the supernatant by inverting the tubes. Then, a mixture of alcohol and water was added to the remaining SRPs, resulting in a total mass (SRP + alcohol + H2O) of 3.00 g in each case. Finally, the mixtures were homogenized by gentle shaking.
An alternative dilution procedure for the SRPs was as described in [
40,
41,
42]. In this procedure, only water was added to a final mass of 5.00 g (SRP + H
2O). The samples were then homogenized by heating (for 1–2 minutes at 40–45 °C) and shaking for several minutes.
Irrespective of the manner in which the SRP was processed, a portion of the final clear solution was transferred to a cuvette and the absorbance was measured against a simultaneously prepared blank.
3.4. Recommended Procedure for the Determination of Zinc(II)
A 50-mL conical tube was weighed using а top-loading analytical balance, and 6 mL of a 10 % Triton X-114 solution was placed therein. Subsequently, an aliquot of the analyzed solution (15.7–209 ng mL–1 of Zn), 1.8 mL of a buffering solution with a pH of 9.4, and 0.7 mL of a 2 × 10⁻³ molar solution of HTAR were added. The tube was filled to a total volume of 50 mL with water, and the mixture was heated for 30 minutes in a water bath at 50 °C. After cooling in a refrigerator (at approximately −20 °C) for 40 minutes, at which point the precipitation process was complete and the SRP was virtually solid, the supernatant was removed by inverting the tube. Subsequently, 0.5 mL of ethanol and water were added to the SRP, resulting in a total mass of 3.00 g (the empty tube mass data were used for this operation). Following brief shaking to homogenize the solution, it was transferred to a cuvette. The absorbance was then measured at 553 nm against a similarly prepared blank.
3.5. Theoretical Section
The ground-state equilibrium geometries of the four suggested complexes were optimized at the B3LYP/6-31G level of theory in the gas phase, with no symmetry or structural restrictions. The spin multiplicity and charge were set to 1 and 0, respectively. Subsequent frequency calculations were performed to prove that the found geometries are located in minima on the hypercoordinate potential energy surface (PES). Additionally, the vertical excitation energies of the systems were calculated in order to simulate their UV spectra and facilitate a comparison with the experimental data. The calculations were conducted using the GAUSSIAN 03 software [
59]. The ChemCraft 1.8 program [
60] was employed for the visualization of the structures.
4. Conclusions
A novel CPE–chromogenic system for Zn(II) ions was investigated. The system is based on the hydrophobic azo dye HTAR and the non-ionic surfactant TX-114. The complex formation occurs in a weakly alkaline medium (ammonium acetate buffer), and the four complexes that were detected have a stoichiometry of 1:1 (Zn:HTAR), 1:1:1 (Zn:HTAR:NH3), and 2:2 (Zn:HTAR; two different species, which differ by the mutual arrangement of the ligands and the type of bridging atoms). In the optimal extraction conditions, the dominant species is a binuclear complex with oxygen bridging atoms. This complex serves as the basis for a simple, convenient, cost-effective, sensitive, and environmentally friendly CL-CPE method for the spectrophotometric determination of Zn(II).
Author Contributions
Conceptualization, K.G. and P.R.; methodology, K.G. and P.R.; software, V.D. and K.G.; validation, K.G., P.R. and A.S.; formal analysis, K.G., P.R, A.S. and F.G..; investigation, P.R., A.S. and F.G.; resources, K.G., P.R., V.D.; writing—original draft preparation, K.G.; writing—review and editing, K.G. and V.D; visualization, A.S., P.R. and K.G; supervision, K.G.; project administration, K.G. All authors have read and agreed to the published version of the manuscript.
Funding
This research was funded by the Medical University of Plovdiv, grant number DPDP-4/2024. The theoretical research was conducted using the infrastructure purchased under the National Roadmap for Research and Innovation, which was financially coordinated by the Ministry of Education and Science of the Republic of Bulgaria (grant number D01-325/01.12.2023).
Institutional Review Board Statement
Not applicable.
Informed Consent Statement
Not applicable.
Data Availability Statement
Not applicable.
Conflicts of Interest
The authors declare no conflicts of interest.
References
- IUPAC Gold Book. Transition element. Available online: https://goldbook.iupac.org/terms/view/T06456 (accessed on 3 September 2024).
- Abkhoshk, E.; Jorjani, E.; Al-Harahsheh, M.S.; Rashchi, F.; Naazeri, M. Review of the hydrometallurgical processing of non-sulfide zinc ores. Hydrometallurgy 2014, 149, 153–167. [Google Scholar] [CrossRef]
- IMA Database of Mineral Properties. Available online: https://rruff.info/ima/ (accessed on 3 September 2024).
- Chatterjee, K.K. Uses of Metals and Metallic Minerals; New Age International (P) Ltd.: New Delhi, India, 2007; pp. 276–285.
- Prasad, A.S. Impact of the Discovery of Human Zinc Deficiency on Health. J. Am. Coll. Nutr. 2009, 28, 257–265. [Google Scholar] [CrossRef]
- Gupta, S.; Brazier, A.K.M.; Lowe, N.M. Zinc deficiency in low- and middle-income countries: prevalence and approaches for mitigation. J. Hum. Nutr. Diet. 2020, 33, 624–643. [Google Scholar] [CrossRef]
- Zinc Toxicity. Available online: https://www.ncbi.nlm.nih.gov/books/NBK554548/ (accessed on 3 September 2024).
- Yousefi, S.; Makarem, S.; Alahmad, W.; Zare, F.D.; Tabani, H. Evaluation of complexing agents in the gel electro-membrane extraction: An efficient approach for the quantification of zinc (II) ions in water samples. Talanta 2022, 238, 123031. [Google Scholar] [CrossRef] [PubMed]
- Plum, L.M.; Rink, L.; Haase, H. The Essential Toxin: Impact of Zinc on Human Health. Int. J. Environ. Res. Public Health 2010, 7, 1342–1365. [Google Scholar] [CrossRef]
- Maywald, M.; Rink, L. Zinc in Human Health and Infectious Diseases. Biomolecules 2022, 12, 1748. [Google Scholar] [CrossRef]
- Stiles, L.I.; Ferrao, K.; Mehta, K.J. Role of zinc in health and disease. Clin. Exp. Med. 2024 24. [CrossRef]
- Miura, J.; Ishii, H.; Watanabe, H. Extraction and separation of nickel chelate of 1-(2-thiazolylazo)-2-naphthol in nonionic surfactant solution. Bunseki Kagaku 1976, 25, 808–809. [Google Scholar] [CrossRef]
- Snigur, D.; Azooz, E A.; Zhukovetska, O.; Guzenko, O., Mortada, W. Recent innovations in cloud point extraction towards a more efficient and environmentally friendly procedure. TrAC Trends in Anal. Chem. 2023, 164, 117113. [CrossRef]
- Halko, R.; Hagarová, I.; Andruch, V. Innovative Approaches in Cloud-Point Extraction. J. Chromatogr. A 2023, 464053. [Google Scholar] [CrossRef]
- Melnyk, A.; Namieśnik, J.; Wolska, L. Theory and recent applications of coacervate-based extraction techniques. TrAC Trends in Anal. Chem. 2015 71 282–292. [CrossRef]
- Pytlakowska, K.; Kozik, V.; Dabioch, M. Complex-forming organic ligands in cloud-point extraction of metal ions: a review. Talanta 2013, 110, 202–228. [Google Scholar] [CrossRef]
- Watanabe, H.; Sakai, Y. Spectrophotometric determination of zinc with 1-(2-pyridylazo)-2-naphthol and surfactant, Bunseki Kagaku 1974 23, 396–402. [CrossRef]
- Watanabe, H.; Tanaka, H. A non-ionic surfactant as a new solvent for liquid-liquid extraction of zinc (II) with 1-(2-pyridylazo)-2-naphthol. Talanta 1978, 25, 585–589. [Google Scholar] [CrossRef]
- Kulichenko, S.A.; Doroshchuk, V. A. Atomic-absorption determination of zinc in water with micellar-extraction preconcentration with phases of nonionic surfactants. J. Anal. Chem. 2003, 58, 524–527. [Google Scholar] [CrossRef]
- Giokas, D.L.; Eksperiandova, L.P.; Blank, A.B.; Karayannis, M.I. Comparison and evaluation of cloud point extraction and low-temperature directed crystallization as preconcentration tools for the determination of trace elements in environmental samples. Anal. Chim. Acta 2004, 505, 51–58. [Google Scholar] [CrossRef]
- Ferreira, H.S.; Santos, A.C.N.; Portugal, L.A.; Costa, A.C.S.; Miró, M.; Ferreira, S.L.C. Pre-concentration procedure for determination of copper and zinc in food samples by sequential multi-element flame atomic absorption spectrometry. Talanta 2008, 77, 73–76. [Google Scholar] [CrossRef]
- Shokrollahi, A.; Shamsipur, M.; Jalali, F.; Nomani, H. Cloud point extraction-preconcentration and flame atomic absorption spectrometric determination of low levels of zinc in water and blood serum samples. Cent. Eur. J. Chem. 2009, 7, 938–944. [Google Scholar] [CrossRef]
- Ghaedi, M.; Shokrollahi, A.; Niknam, K.; Niknam, E.; Derki, S.; Soylak, M. A cloud point extraction procedure for preconcentration/flame atomic absorption spectrometric determination of silver, zinc, and lead at subtrace levels in environmental samples. J. AOAC Int. 2009, 92, 907–913. [Google Scholar] [CrossRef]
- Ghaedi, M.; Shokrollahi, A.; Niknam, K.; Soylak, M. Cloud point extraction of copper, zinc, iron and nickel in biological and environmental samples by flame atomic absorption spectrometry. Sep. Sci. Technol. 2009, 44, 773–786. [Google Scholar] [CrossRef]
- Kandhro, G.A.; Kazi, T.G.; Baig, J.A.; Afridi, H.I.; Shah, A.Q.; Sheikh, H.R. , Kolachi, N.F.; Wadhwa, S.K. Zinc and iron determination in serum and urine samples of thyroid patients using cloud point extraction. J. AOAC Int. 2010, 93, 1589–1594. [Google Scholar]
- Kolachi, N.F.; Kazi, T.G.; Khan, S.; Wadhwa, S.K.; Baig, J.A.; Afridi, H.I.; Shah, A.Q.; Shah, F. Multivariate optimization of cloud point extraction procedure for zinc determination in aqueous extracts of medicinal plants by flame atomic absorption spectrometry. Food Chem. Toxicol. 2011, 49, 2548–2556. [Google Scholar] [CrossRef]
- Han, H.; Zhou, J.; Xu, Y.; Jia, C.; Xia, H.; Wang, Y. Determination of water-soluble and acid-soluble zinc in soils by flame atomic absorption spectrometry after cloud point extraction. Commun. Soil Sci. Plant Anal. 2012, 43, 2389–2399. [Google Scholar] [CrossRef]
- Gürkan, R.; Altunay, N. A reliable determination of zinc levels in beverages with and without alcohol by flame atomic absorption spectrometry after cloud point extraction, Anal. Methods 2013, 5, 1755–1763. [Google Scholar] [CrossRef]
- Altunay, N.; Elik, A.; Bulutlu, C.; Gürkan, R. Application of simple, fast and eco-friendly ultrasound-assisted-cloud point extraction for pre-concentration of zinc, nickel and cobalt from foods and vegetables prior to their flame atomic absorption spectrometric determinations, Int. J. Environ. Anal. Chem. 2018, 98, 655–675. [Google Scholar] [CrossRef]
- Silva, E.L.; Roldan, P.d.S.; Giné, M.F. Simultaneous preconcentration of copper, zinc, cadmium, and nickel in water samples by cloud point extraction using 4-(2-pyridylazo)-resorcinol and their determination by inductively coupled plasma optic emission spectrometry. J. Hazard. Mat. 2009, 171, 1133–1138. [Google Scholar] [CrossRef]
- Silva, F.L.F.; Matos, W.O.; Lopes, G.S. Determination of cadmium, cobalt, copper, lead, nickel and zinc contents in saline produced water from the petroleum industry by ICP OES after cloud point extraction. Anal. Methods 2015, 7, 9844–9849. [Google Scholar] [CrossRef]
- A. Bavili Tabrizi, Cloud point extraction and spectrofluorimetric determination of aluminium and zinc in foodstuffs and water samples, Food Chem. 2007 100, 1698–1703. [CrossRef]
- Afkhami, A.; Bahram, M. Cloud point extraction simultaneous spectrophotometric determination of Zn(II), Co(II) and Ni(II) in water and urine samples by 1-(2-pyridylazo)2-naphthol using partial least squares regression. Microchim. Acta 2006, 155, 403–408. [Google Scholar] [CrossRef]
- Pourreza, N.; Naghdi, T. Combined cloud point-solid phase extraction by dispersion of TiO2 nanoparticles in micellar media followed by semi-microvolume UV–vis spectrophotometric detection of zinc. Talanta 2014, 128, 164–169. [Google Scholar] [CrossRef]
- Jawad, S.K., Azooz, E.A. A new approach for separation, extraction and determination of zinc in different samples using cloud-point extraction coupled with spectrophotometry. Fire Journal of science and technology 2015 3, 261–273.
- Jaffer, N.D. Cloud-point technique for extraction and spectral estimation of zinc(II) in different samples. Biochem. Cell. Arch. 2019, 19, 4683–4690. [Google Scholar]
- Wannas, F.A.; Azooz, E.A.; Ridha, R.K.; Jawad, S.K. Separation and micro determination of zinc(II) and cadmium(II) in food samples using cloud point extraction method. Iraqi J. Sci. 2023, 64, 1049–1061. [Google Scholar] [CrossRef]
- Hameed, S.M.; Hussain, S.A.; Abdulzahra, M.A. Determination of zinc and magnesium in food samples via cloud point extraction using brilliant green as a reagent. Methods Objects Chem. Anal. 2024, 19, 111–117. [Google Scholar] [CrossRef]
- Racheva, P.V.; Milcheva, N.P.; Saravanska, A.D.; Gavazov, K.B. Extraction of gallium(III) with a new azo dye in the presence or absence of xylometazoline hydrochloride. Croat. Chem. Acta 2020, 93, 159–165. [Google Scholar] [CrossRef]
- Milcheva, N.P.; Genç, F.; Racheva, P.V.; Delchev, V.B.; Andruch, V.; Gavazov, K.B. An environmentally friendly cloud point extraction–spectrophotometric determination of trace vanadium using a novel reagent. J. Mol. Liq. 2021, 334, 116086. [Google Scholar] [CrossRef]
- Racheva, P.V.; Milcheva, N.P.; Genc, F.; Gavazov, K.B. (2021). A centrifuge-less cloud point extraction-spectrophotometric determination of copper(II) using 6-hexyl-4-(2-thiazolylazo)resorcinol. Spectrochim. Acta A Mol. Biomol. Spectrosc. 2021 262, 120106. [CrossRef]
- Gavazov, K.B.; Racheva, P.V.; Milcheva, N.P.; Divarova, V.V.; Kiradzhiyska, D. D.; Genç, F.; Saravanska, A.D. Use of a hydrophobic azo dye for the centrifuge-less cloud point extraction–spectrophotometric determination of cobalt. Molecules 2022, 27, 4725. [Google Scholar] [CrossRef] [PubMed]
- Gajdošová, A.; Šandrejová, J. Cloud point extraction technique for a sensitive and green determination of Hg and Cd: A new approach in detection step, In Proceedings of Novel Trends in Chemistry, Research and Education, Pavol Jozef Šafárik University in Košice, Slovak Republic, 22 November 2023, p. 25.
- Stojnova, K.; Yanev, P.; Lekova, V. Study on the equilibria of the complex formation of anionic chelate of Zn(II) with tridentate ligand and the cation of 3-(2-naphtyl)-2,5-diphenyl-2h-tetrazolium chloride. Acta Chim. Slov. 2023, 70, 295–302. [Google Scholar] [CrossRef]
- Shrivas, K.; Dewangan, K.; Ahmed, A. Surfactant-based dispersive liquid–liquid microextraction for the determination of zinc in environmental water samples using flame atomic absorption spectrometry. Anal. Methods 2016, 8, 5519–5525. [Google Scholar] [CrossRef]
- Konermann, L. Addressing a common misconception: ammonium acetate as neutral pH “buffer” for native electrospray mass spectrometry. J. Am. Soc. Mass Spectrom. 2017, 28, 1827–1835. [Google Scholar] [CrossRef] [PubMed]
- Stefanova-Bahchevanska, T.; Milcheva, N.; Zaruba, S.; Andruch, V.; Delchev, V.; Simitchiev, K.; Gavazov, K. A green cloud-point extraction-chromogenic system for vanadium determination. J. Mol. Liq. 2017, 248, 135–142. [Google Scholar] [CrossRef]
- Asmus, E. Eine neue Methode zur Ermittlung der Zusammensetzung schwacher Komplexe (A new method for the determination of composition of weak complexes), Fresenius' J. Anal. Chem. 1960, 178, 104–116. [Google Scholar] [CrossRef]
- Bent, H.E.; French, C.L. The structure of ferric thiocyanate and its dissociation in aqueous solution. J. Am. Chem. Soc. 1941, 63, 568–572. [Google Scholar] [CrossRef]
- Zhiming, Z.; Dongsten, M.; Cunxiao, Y. Mobile equilibrium method for determining composition and stability constant of coordination compounds of the form MmRn. J. Rare Earths 1997, 15, 216–219. [Google Scholar]
- Gavazov, K.B.; Racheva, P.V.; Saravanska, A.D.; Toncheva, G.K.; Delchev, V. B. Extractive spectrophotometric determination and theoretical investigations of two new vanadium(V) complexes. Molecules 2023, 28, 6723. [Google Scholar] [CrossRef]
- Archibald, S.J. 6.8 - Zinc. In Comprehensive Coordination Chemistry II McCleverty, J.A., Meyer, T.J., Eds. Pergamon: Oxford, United Kingdom, 2003; Volume 6, pp. 1147–1251.
- Patel, K.; Kumar, A.; Durani, S. Analysis of the structural consensus of the zinc coordination centers of metalloprotein structures. BBA - Proteins and Proteomics 2007 1774, 1247–1253. [CrossRef]
- Gavazov, K.B.; Delchev, V.B.; Mileva, K.T.; Stefanova, T. S.; Toncheva, G.K. . A 2:2:2 complex of vanadium(V) with 4-(2-thiazolylazo)orcinol and 2,3,5-triphenyl-2H-tetrazolium chloride. Acta Chim. Slov. 2016, 63, 392–398. [Google Scholar] [CrossRef] [PubMed]
- Kirova, G.K.; Velkova, Z.Y.; Delchev, V.B.; Gavazov, K.B. Vanadium-Containing Anionic Chelate for Spectrophotometric Determination of Hydroxyzine Hydrochloride in Pharmaceuticals. Molecules 2023, 28, 2484. [Google Scholar] [CrossRef] [PubMed]
- Al-shafie, Z.S.; Alshirifi, A.N. Synthesis and characterization of new azo-dye reagent and using to a spectrophotometric determination of zinc ions in some drug. AIP Conf. Proc. 2022, 2547, 040004. [Google Scholar] [CrossRef]
- Marczenko, Z.; Balcerzak, M. Separation, preconcentration and spectrophotometry in inorganic analysis, Elsevier: Amsterdam, Netherlands, 2000; pp. 466–473.
- Benamor, M.; Belhamel, K.; Draa, M.T. Use of xylenol orange and cetylpyridinium chloride in rapid spectrophotometric determination of zinc in pharmaceutical products. J. Pharm. Biomed. Anal. 2000, 23, 1033–1038. [Google Scholar] [CrossRef] [PubMed]
- Frisch, M.J.; Trucks, G.W.; Schlegel, H.B.; Scuseria, G.E.; Robb, M.A.; Cheeseman, J.R.; Montgomery, Jr. J.A.; Vreven, T.; Kudin, K.N.; Burant, J.C.; Millam, J.M.; Iyengar, S.S.; Tomasi, J.; Barone, V.; Mennucci, B.; Cossi, M; Scalmani, G.; Rega, N.; Petersson, G.A.; Nakatsuji, H.; Hada, M.; Ehara, M.; Toyota, K.; Fukuda, R.; Hasegawa, J.; Ishida, M.; Nakajima, T.; Honda, Y.; Kitao, O.; Nakai, H.; Klene, M.; Li, X.; Knox, J.E.; Hratchian, H.P.; Cross, J.B.; Bakken, V.; Adamo, C.; Jaramillo, J.; Gomperts, R.; Stratmann, R.E.; Yazyev, O.; Austin, A.J.; Cammi, R.; Pomelli, C.; Ochterski, J.W.; Ayala, P.Y.; Morokuma, K.; Voth, G.A.; Salvador, P.; Dannenberg, J.J.; Zakrzewski, V.G.; Dapprich, S.; Daniels, A.D.; Strain, M.C.; Farkas, O.; Malick, D.K.; Rabuck, A.D.; Raghavachari, K.; Foresman, J.B.; Ortiz, J.V.; Cui, Q.; Baboul, A.G.; Clifford, S.; Cioslowski, J.; Stefanov, B.B.; Liu, G.; Liashenko, A.; Piskorz, P.; Komaromi, I.; Martin, R.L.; Fox, D.J.; Keith, T.; Al-Laham, M.A.; Peng, C.Y.; Nanayakkara, A.; Challacombe, M.; Gill, P.M.W.; Johnson, B.; Chen, W.; Wong, M.W.; Gonzalez, C.; Pople, J.A., Gaussian 03, Revision D. 01 Inc., Wallingford, CT, 2004.
- ChemCraft. Available online: http://www.chemcraftprog.com (accessed on 1 September 2024).
Figure 1.
Absorption spectra of the complexes (1–3) and corresponding blanks (1'–3') at different pH values: 8.3 (1, 1'), 9.4 (2, 2’), and 10.9 (3, 3'). cZn(II) = cHTAR = 6 × 10⁻⁶ mol L–1, wTX-114 = 1.2 %, Vbuffer = 1,8 mL, t = 30 min at 50 °C, mSRP = 3 g.
Figure 1.
Absorption spectra of the complexes (1–3) and corresponding blanks (1'–3') at different pH values: 8.3 (1, 1'), 9.4 (2, 2’), and 10.9 (3, 3'). cZn(II) = cHTAR = 6 × 10⁻⁶ mol L–1, wTX-114 = 1.2 %, Vbuffer = 1,8 mL, t = 30 min at 50 °C, mSRP = 3 g.
Figure 2.
Effect of HTAR concentration. cZn(II) = 4 × 10⁻⁶ mol L–1, wTX-114 = 1.6%, pH 9.4, t = 30 min at 50 °C, mSRP = 5 g, λ = 553 nm.
Figure 2.
Effect of HTAR concentration. cZn(II) = 4 × 10⁻⁶ mol L–1, wTX-114 = 1.6%, pH 9.4, t = 30 min at 50 °C, mSRP = 5 g, λ = 553 nm.
Figure 3.
Effect of pH. cZn(II) = 2.4 × 10⁻⁶, cHTAR = 2.8 × 10⁻⁵ mol L–1, wTX-114 = 1.2%, Vbuffer = 3.0 mL, t = 30 min at 50 °C, mSRP = 3 g, λ = 553 nm.
Figure 3.
Effect of pH. cZn(II) = 2.4 × 10⁻⁶, cHTAR = 2.8 × 10⁻⁵ mol L–1, wTX-114 = 1.2%, Vbuffer = 3.0 mL, t = 30 min at 50 °C, mSRP = 3 g, λ = 553 nm.
Figure 4.
Effect of ammonium acetate buffer (pH 9.4) volume. cZn(II) = 2.4 × 10⁻⁶, cHTAR = 2.8 × 10⁻⁵ mol L–1, wTX-114 = 1.2%, t = 30 min at 50 °C, mSRP = 3 g, λ = 553 nm.
Figure 4.
Effect of ammonium acetate buffer (pH 9.4) volume. cZn(II) = 2.4 × 10⁻⁶, cHTAR = 2.8 × 10⁻⁵ mol L–1, wTX-114 = 1.2%, t = 30 min at 50 °C, mSRP = 3 g, λ = 553 nm.
Figure 5.
Effect of TX-114 mass fraction. cZn(II) = 2.4 × 10⁻⁶, cHTAR = 2.8 × 10⁻⁵ mol L–1, pH = 9.4, Vbuffer = 1.8 mL, wTX-114 = 1.2%, t = 30 min at 50 °C, mSRP = 3 g, λ = 553 nm.
Figure 5.
Effect of TX-114 mass fraction. cZn(II) = 2.4 × 10⁻⁶, cHTAR = 2.8 × 10⁻⁵ mol L–1, pH = 9.4, Vbuffer = 1.8 mL, wTX-114 = 1.2%, t = 30 min at 50 °C, mSRP = 3 g, λ = 553 nm.
Figure 6.
Effect of incubation time at 50 °C. cZn(II) = 2.4 × 10⁻⁶, cHTAR = 2.8 × 10⁻⁵ mol L–1, pH = 9.4, Vbuffer = 1.8 mL, wTX-114 = 1.2%, mSRP = 3 g, λ = 553 nm.
Figure 6.
Effect of incubation time at 50 °C. cZn(II) = 2.4 × 10⁻⁶, cHTAR = 2.8 × 10⁻⁵ mol L–1, pH = 9.4, Vbuffer = 1.8 mL, wTX-114 = 1.2%, mSRP = 3 g, λ = 553 nm.
Figure 7.
Absorption spectra of the complex species (1 and 2) and the blanks (1’ and 2’) in two different ways of SRP diluting; cZn(II) = 2 × 10⁻⁶ mol L–1, cHTAR = 2.8 × 10⁻⁵ mol L–1, wTX-114 = 1.2 %, pH = 9.1, Vbuffer = 1,8 mL, t = 30 min. (1, 1') m = 3.00 g, SRP diluted with ethanol (0.5 mL) and water. (2, 2’) m = 5.00 g; SRP diluted with water only.
Figure 8.
Determination of the HZH:Zn(II) molar ratio by the straight-line method of Asmus.
Figure 8.
Determination of the HZH:Zn(II) molar ratio by the straight-line method of Asmus.
Figure 9.
Determination of the HZH:Zn(II) molar ratio by the mobile equilibrium method.
Figure 9.
Determination of the HZH:Zn(II) molar ratio by the mobile equilibrium method.
Figure 10.
B3LYP/6-31G-optimized ground-state equilibrium geometries of the four possible structures: a) Structure 1; b) Structure 2; c) Structure 3; d) Structure 4.
Figure 10.
B3LYP/6-31G-optimized ground-state equilibrium geometries of the four possible structures: a) Structure 1; b) Structure 2; c) Structure 3; d) Structure 4.
Figure 11.
Comparison of the four theoretical spectra (Structures 1–4) at the B3LYP/6-31G level of theory and a scaling factor of 1.136 with two experimental spectra (Exp. 1 and 2) recorded at different buffer volumes: 1.8 mL (Exp. 1) and 10 mL (Exp. 2). cZn(II) = cHTAR = 6 × 10⁻⁶ mol L–1, wTX-114 = 1.2%, pH = 9.4, t = 30 min at 50 °C, mSRP = 3 g.
Figure 12.
Calibration graph for determination of Zn(II). The experimental conditions are given in
Table 1. In panel (a), the intercept is statistically different from zero, whereas in panel (b), it is set to zero.
Figure 12.
Calibration graph for determination of Zn(II). The experimental conditions are given in
Table 1. In panel (a), the intercept is statistically different from zero, whereas in panel (b), it is set to zero.
Table 1.
Optimization of the CPE system.
Table 1.
Optimization of the CPE system.
| Optimized parameter |
Investigated range |
Optimal value |
| Concentration of HTAR, mol L–1
|
(0.12–4) × 10–5
|
2.8 × 10⁻⁵
|
| pH |
8.0–10.9 |
9.4 |
| Volume of the buffer, mL |
0.5–10 |
1.8 |
| Mass fraction of TX-114, % |
0.6–2.4 |
1.2 |
| Incubation time at 50 °C, min |
5–60 |
30 |
| Cooling time at –20 °C, min |
20–70 |
40 |
| Wavelength, nm |
Visible range |
553 |
Table 2.
Impact of foreign ions on the determination of 3.9 μg Zn(II).
Table 2.
Impact of foreign ions on the determination of 3.9 μg Zn(II).
| Foreign ion (FI) |
Formula of the salt |
Mass of the FI, μg |
FI : Zn(II) mass ratio |
Mass of Zn found, μg |
E, % |
| Al(III) |
Al(NO3)3⋅9H2O |
39 |
10 |
4.1 |
106 |
| Ba(II) |
Ba(NO3)2
|
3900 |
1000 * |
4.0 |
101 |
| Ca(II) |
Ca(NO3)2
|
1950 |
500 |
4.1 |
106 |
| Cd(II) |
CdCl2
|
2.0 |
0.5 |
7.2 |
127 |
| Co(II) |
Co(SO4)2⋅7H2O |
2.0 |
0.5 |
5.9 |
151 |
| Cr(III) |
Cr2(SO4)3
|
3.9 |
1 |
3.9 |
99.2 |
| Cr(VI) |
K2CrO4
|
19.5 |
5 |
4.0 |
103 |
| Cu(II) |
CuSO4⋅5H2O |
2.0 |
0.5 |
4.8 |
123 |
| F–
|
NaF |
19500 |
5000 |
3.7 |
95.8 |
| Fe(III) |
Fe2(SO4)3
|
19.5 |
5 |
3.8 |
96.4 |
| HPO42– |
Na2HPO4⋅12H2О |
780 |
200 |
3.8 |
98.3 |
| Hg(II) |
Hg(NO3)2
|
78 |
20 |
3.9 |
100 |
| Mg(II) |
MgSO4⋅7H2O |
1950 |
500 |
3.9 |
100 |
| Mn(II) |
MnSO4⋅H2O |
7.8 |
2 |
3.9 |
99.0 |
| Mo(VI) |
(NH4)6Mo7O24⋅4H20 |
3900 |
1000* |
4.2 |
106 |
| Na(I) |
NaCl |
39000 |
10000 * |
4.0 |
102 |
| Ni(II) |
NiSO4⋅7H2O |
2.0 |
0.5 |
4.1 |
105 |
| NO3–
|
NH4NO3
|
39000 |
10000 * |
3.9 |
100 |
| Re(VII) |
NH4ReO4
|
3900 |
1000 * |
4.1 |
106 |
| Pb(II) |
Pb(NO3)2
|
3.9 |
1 |
4.8 |
123 |
| SO42–
|
K2SO4
|
39000 |
10000 * |
3.9 |
100 |
| V(V) |
NH4VO3
|
7.8 |
2 |
4.0 |
104 |
| W(VI) |
Na2WO4⋅2H2O |
3900 |
1000 * |
3.8 |
98.0 |
Table 3.
Determination of zinc in pharmaceutical and industrial samples.
Table 3.
Determination of zinc in pharmaceutical and industrial samples.
| # |
Sample |
Zn mass fraction (wZn), % |
Other ingredients |
wZn found b, c, % |
| 1 |
Dermal ointment |
8.03 |
90% petrolatum |
8.0 ± 0.2 |
| 2 |
Granulated zinc dust |
19.5 a
|
26.9% Fe, 7.9% CaO, 5.45% SiO2, 2.57% Pb, 2.18% Cl, 1.78% MgO, 1.02% S, 0.53% Al, 0.24 % Cu, 0.22% F, 0.07% Cd, 0.013% Sb, 0.009% As, 0.002% Co, 29 μg g–1 Tl, 22 μg g–1 Se, 14 μg g–1 Te, 10 μg g–1 Ge a
|
19.8 ± 0.6 |
| 3 |
Zinc concentrate |
49.7 a
|
31.75% S, 1.75% SiO2, 1.1% Pb, 0.32% Al2O3, 0.24% Cd, 0.17% Cu, 0.08% CaO, 0.071% Sb, 0.07% MgO, 0.016%As, 0.01% Cl, 0.005% F, 0.002% Co, 0.001% Ni, 11 μg g–1 Tl, 10 μg g–1 Ge, 5 μg g–1 Se, 5 μg g–1 Te, 3 μg g–1 Hg a
|
49.1 ± 1.4 |
Table 4.
Comparison with published CPE-spectrophotometric methods for Zn(II) determination.
Table 4.
Comparison with published CPE-spectrophotometric methods for Zn(II) determination.
| Reagent(s) |
Technique |
Surfactant |
Acidity |
λ, nm |
Linear range, ng mL–1 |
Sample |
Ref. |
| PAN |
CPE–UV/Vis |
PONPE-7.5 |
pH 10.0 |
555 |
2–60 |
Tap water |
[18] |
| PAN |
CPE–UV/Vis, PLSR |
TX-114 |
pH 9.2 |
550 |
2–150 |
Water and urine samples |
[33] |
| TiO2 NPs + dithizone |
CPE-SPE–UV/Vis |
TX-100 |
pH 7.0 |
530 |
0.5–90 |
Tap water, powder milk, and zinc sulfate tablet |
[34] |
| PANN |
CPE–UV/Vis |
TX-100 |
1 mol L–1 HCl |
414 |
100–3000 |
Vegetables, meet, and water samples |
[35] |
| Na2EDTA + BG |
CPE–UV/Vis |
TX-100 |
pH 10.0 |
630 |
100–10000 |
Food samples |
[38] |
| HTAR |
CL-CPE–UV/Vis |
TX-114 |
pH 9.4 |
554 |
15.7–209 |
Pharmaceutical and industrial samples |
This work |
|
Disclaimer/Publisher’s Note: The statements, opinions and data contained in all publications are solely those of the individual author(s) and contributor(s) and not of MDPI and/or the editor(s). MDPI and/or the editor(s) disclaim responsibility for any injury to people or property resulting from any ideas, methods, instructions or products referred to in the content. |
© 2024 by the authors. Licensee MDPI, Basel, Switzerland. This article is an open access article distributed under the terms and conditions of the Creative Commons Attribution (CC BY) license (http://creativecommons.org/licenses/by/4.0/).

