Preprint
Article

Qualitative and Quantitative Sex-Related Differences in the Perception of Single Molecules from Coffee Headspace

Altmetrics

Downloads

50

Views

26

Comments

0

A peer-reviewed article of this preprint also exists.

This version is not peer-reviewed

Submitted:

06 September 2024

Posted:

09 September 2024

You are already at the latest version

Alerts
Abstract
One of the still debated topics regarding the olfactory function concerns the presence or absence of sex-related differences of individuals. In this study, we checked for a relationship between the olfactory function of females and males and their ability to perceive single molecules, and how this can influence the intensity with which the complex odor formed by a set of single molecules is perceived. First, females and males were classified as normosmic or hyposmic based on the TDI olfactory score obtained using the Sniffin' Sticks test. Subsequently, the headspace of roasted coffee beans as a complex olfactory stimulus was broken down into single molecules by means of a chromatographic column; these were simultaneously conveyed to a mass spectrometer (for their subsequent classification) and to the human nose which acts as a chemical sensor by means of an olfactometer port. The results obtained with this gas chromatography-olfactometry approach show both qualitative and quantitative differences between females and males, with females performing better than males. In addition, the odor intensity reported by females when sniffing pen #10 containing coffee aroma is significantly higher than that reported by males. In conclusion, these data highlight that the human ability to perceive both single compounds and complex odors is strongly conditioned, not only by olfactory function of individuals, but also by their sex.
Keywords: 
Subject: Biology and Life Sciences  -   Food Science and Technology

1. Introduction

The information coming from the external environment that is captured and conveyed by the olfactory system towards the higher brain centers, plays an important role for all living organisms. The functions of the sense of smell can be grouped into three broad categories: alert for environmental dangers (smoke, gas, toxic and/or harmful substances, presence of predators), influence on social relationships (mother-child recognition, selection of a partner for mating), conditioning of eating behavior (it contributes to the location and choice of foods, both in qualitative and quantitative terms) [1,2,3,4,5,6,7,8,9,10,11,12]. In particular, individuals with smell disorders tend to isolate themselves socially, are subject to a greater number of household incidents and report preferring foods with high energy content, such as fats and sugars, adding flavor enhancers such as salt and spices, to the detriment of foods such as fruits and vegetables [13,14,15,16,17,18,19,20]. The choice of tastier, but also more caloric foods, seems to compensate for the reduced gratification during a meal, due to reduced olfactory stimulation. Besides, these individuals tend to reach sensory satiety late, resulting in increased meal duration and intake of highly caloric foods [21,22,23,24,25,26,27].
Food and drink odors are generally made up of a mixture of molecules and only some of them are sensorially relevant and are considered odor-active compounds [21,22,23,24,25,26,27,28,29,30,31,32,33]. Therefore, it is important to understand which and how many molecules are sensorially active within a complex mixture and how these can influence the intensity with which the smell of food and drinks is perceived. The coupled technique of gas chromatography-olfactometry (GC-O) allows to separate the single molecules that make up a mixture and, at the same time, to use the human nose as their sensory evaluator [34,35,36,37,38].
We have previously found that the ability to perceive the single molecules that make up a complex mixture, as they are eluted from the chromatographic column and conveyed to an evaluator via an olfactometric port, is directly related to the olfactory function of individuals. In fact, the higher the olfactory score obtained by each participant during the olfactory tests, the higher the number of molecules perceived [39,40,41]. As it is commonly accepted, on the basis of the scores obtained during olfactory tests, individuals can be classified as normosmic (normal olfactory function), hyposmic (reduced olfactory function) or functionally anosmic (general or specific inability to perceive odors) [3,19,42,43,44,45]. The reasons of this variability are multiple and can be of an environmental/behavioral nature (e.g., habitual smokers, sedentary lifestyle, polluted habitats), genetic (expression and functionality of OBPs, ORs, Kv1.3 channels, etc.) and physiological (age and sex) [40,42,46,47,48,49,50,51,52,53,54,55,56,57,58,59,60,61,62,63].
Based on these considerations, the main objective of this study was to evaluate the presence of any sex-related differences in the ability of individuals to perceive the single molecules that make up the complex odor of coffee, as they are eluted from the chromatographic column, both in qualitative (type of molecules smelled) and quantitative (number of molecules smelled) terms. In fact, one of the topics still under debate is related to the presence of differences in the olfactory function between females and males. Several studies have shown that females tend to perform better than males in their olfactory abilities, but none of them evaluated differences related to the ability to perceive single molecules [52,63,64,65]. This is of particular importance when considering that it has been suggested that odor-active compounds are those which contribute strongly to the aroma of the mixture [33,66]. The second objective was to confirm the relationship between olfactory function and the ability to perceive the single molecules as they are eluted from the chromatographic column. Finally, we assessed whether any differences in the number of odor-active compounds could also determine differences in the intensity with which females and males reported perceiving the odor of coffee contained in pen #10 of the identification test (one of the subtests of the Sniffin’ Sticks battery).

2. Materials and Methods

2.1. Subjects

The sixty-seven Caucasian volunteers who participated in this study (34 F, 33 M, age 29.19 ± 2.59 y; BMI 18.5-24.99 kg/m2) were recruited in the metropolitan area of Cagliari (Sardinia, Italy). Healthy, non-smoking subjects who reported having a good sense of smell, familiarity with the aroma of coffee and with a history of COVID-19 infection that ended at least 12 months before were included in the study. The exclusion criteria were: presence of chronic pathologies such as metabolic (diabetes, obesity, dysglycemia, dyslipidemia, metabolic syndrome, circulating levels of peptide), inflammatory/autoimmune (inflammatory bowel diseases, Sjögren’s syndrome, rheumatoid arthritis, psoriasis, myasthenia gravis) and neurodegenerative (Parkinson’s disease, Alzheimer’s disease, autism, mild cognitive impairment) [67,68,69,70,71,72,73,74,75,76,77,78,79,80,81,82,83,84,85,86,87,88,89].
Evaluation of the individual ability to perceive single molecules during the Gas Chromatography-Olfactometry experiments was carried out using the detection frequency method. This method has two advantages: it does not require qualified evaluators and the results obtained are representative of inter-individual variability [90,91,92,93,94].
On the day of the experiment, all participants had fasted for at least 90 minutes prior to testing and wore no perfume. Before starting the olfactory tests, each volunteer was read the experimental protocol previously approved by the local Ethics Committee and was asked to sign an informed consent (Prot. PG/2018/22 of January 2, 2018).

2.2. Olfactory Sensitivity Screening

The TDI olfactory score, given by the sum of the scores obtained with the tests of Threshold (T-test; score 0-16, obtained as the average of the last 4 reversals of 7), Discrimination (D-test; score 0-16, given by the number of correct discriminations) and Identification (I-test; score 0-16, given by the number of correct identifications), was used to evaluate the olfactory function of each individual. T-test, D-test and I-test represent the three sub-tests of the Sniffin’ Sticks test (Burghart Instruments, Wedel, Germany), based on odor-containing felt-tip pens, internationally recognized and widely used for olfactory screening [95] (for details visit: https://www.uniklinikum-dresden.de/de/das-klinikum/kliniken-polikliniken-institute/hno/forschung/interdisziplinaeres-zentrum-fuer-riechen-und-schmecken/neuigkeiten/downloads). The reference values reported by Hummel et al. [96] were used to classify each participant as normosmic, hyposmic or functionally anosmic, based on the TDI olfactory score obtained, and according to sex and age.
During the I-test, each participant also had to give her/his own assessment of the intensity with which the smell of coffee contained in pen #10 was perceived (from here on: coffee-odor pen), marking a sign on the “Visual Analogue Rating Units” scale (VARUs; ranging 0-20) [97].

2.3. Dynamic Headspace Sampling

The volatiles were collected by means of the dynamic headspace method [37,98]. The headspace method is considered the most appropriate to obtain, in terms of volatiles, an extract whose composition is closely linked to the quality of the scent assessed by the consumer [99]. Besides, it allows to obtain both extracts for Mass Spectrometry-Gas Chromatography (MS-GC) and a sensory evaluation by a human subject, by means of GC-O analysis [37].
About 100 g of roasted coffee beans were placed inside a 0.5 L airtight glass vessel with a flow-through mechanism [39]. The air impregnated with the volatiles was then conveyed towards a glass tube (5 mm Ø) inserted in the collection port at the top of the vessel and containing a Porapak Q filter (150/75mg, 50/80; Supelco). By flushing the system with purified air for three hours at a rate of 30 L/h (500 ml/min), volatiles were recovered at room temperature. Using 1.5 ml of 1-hexane, trapped volatiles were released from the Porapak Q tube, resulting in a solution containing the isolated volatile chemicals. Samples were then stored at -20 °C until used. To verify the effectiveness of the extract obtained and the reproducibility of the chromatogram, three GC runs were conducted 24h after sample preparation. The chemical profile obtained was identical to that obtained in the previous study [39] and comparable to that of other studies, providing evidence of its validity [100,101,102,103,104,105,106,107,108]. Before each experimental section, a GC analysis was also performed to verify that the sample was not altered.

2.4. Mass Spectrometry/Gas Chromatography–Olfactometry (MS/GC-O) Analysis

To perform the GC-O analyses, 1 µL of coffee extract volume was injected in the HP-INNOWax column (30 m × 0.25 mm × 0.50 µm; Agilent 19091N-233; Agilent technologies, Santa Clara, CA, USA) of the gas chromatograph (GC; Agilent 6890N). The injection volume, conveyed by a constant flow of 1.2 mL/min of He (carrier gas), was split 1:1 between the olfactometry detection port (Gerstel ODP3; Mülheim an der Ruhr, Germany) and the mass spectrometer (MS) detector (Agilent 5973; Santa Clara, CA, USA) coupled to the GC [41].
The injector temperature was set at 250 °C and the MS interface temperature was set at 260 °C. The oven temperature was maintained at 40 °C (0.2 min), 40 °C/min to 90 °C (0.50 min), 2 °C/min to 150 °C, 30 °C/min to 230 °C (12 min). The injector mode was splitless; 230 °C and 150 °C were, respectively, the temperatures for the ion source and the quadrupole mass filter. Chromatograms were recorded by monitoring the total ion current in a 40-550 mass range. The transfer line to the GC-ODP3 sniffing port was held at 220 °C [41].
The mass spectrum found in the MS Standard Library NIST2014 (US National Institute of Standards and Technology; Gaithersburg, MD, USA) was used to identify the volatiles obtained from the coffee roasted beans by means of the dynamic headspace method. As previously reported [39], we found 50 different volatiles and the information regarding “odor type” (i.e., roasted, bready, nutty, etc.) and “odor descriptors” (i.e., coffee, spicy, cheese, wood, etc.) were obtained from the Good Scents Company Information System (www.thegoodscentscompany.com), according to Gonzales-Kristeller and co-workers [109].
Every time the participant detected an odor, he/she had to record on a PC, using a digital recording and reporting system (GERSTEL ODP 3 for Windows 7), his/her own subjective evaluation of the odor-active compound perceived: intensity, duration, hedonic value and identification [37,38]. The participants recorded their evaluation by pressing one of the 4 keys present in the reporting system, which also provided information on the perceived intensity on a 1-4 scale: 1 = weak odor, 2 = distinct odor, 3 = intense odor, 4 = very intense smell. The aromagrams were superimposed on the chromatograms, by means of automatic recording of the retention and sniffing times of each odor-active compound. To avoid pre-conditioning, the samples were presented blindly.

2.5. Statistical Analysis

Fisher’s Exact Test was used to analyze differences in the perception of some odor-active compounds between females and males.
The Pearson’s correlation test was applied to examine the relationship between: a) the TDI olfactory score and the total number of odor-active compounds (hereafter, total-molecules) or the number of odor-active compounds smelling of coffee (hereafter, coffee-molecules) smelled by each subject, considering females and males both together and separately; b) TDI olfactory score and the intensity perceived by each subject for the pen of the identification test containing the coffee aroma (hereafter, coffee-odor pen), considering females and males both together and separately; c) the intensity perceived for the coffee-odor pen and the number of total- and coffee-molecules smelled by each subject, considering females and males both together and separately. Statistical analyses were performed using GraphPad Prism 6 (GraphPad Software, San Diego, CA, USA). A statistically significant correlation was defined with a p-value < 0.05.
One-way ANOVA was used to evaluate the effect of the TDI olfactory status of the subjects on their ability to smell single molecules during the GC-O tests and on the intensity perceived for the coffee-odor pen.
Two-way ANOVA was used to test for a significant interaction between TDI olfactory status × sex on the ability to detect individual molecules, both in the case of total- and coffee-molecules.
Fisher’s test of least significant difference (LSD) was used for post-hoc comparisons. Statistical analyses were performed using STATISTICA for WINDOWS (version 7.0; StatSoft Inc, Tulsa, OK, USA). P values < 0.05 were considered significant.

3. Results

Table 1 shows that 48 of the 50 compounds found in the headspace of roasted coffee bean were odor-active for at least two of the participants; in fact, the “ethylbenzene” (signed as n.5 in Table 1) was active for just one individual, while the “2-Butanone, 1-(acetyloxy)” (signed as n. 33 in Table 1) was not perceived by any participant. Furthermore, panelists perceived 23 of the 48 odor-active compounds as smelling of coffee, indicated with numbers 3,8, 11-12, 14-16, 20-21, 23-24, 26-28, 30, 34, 37, 39-42 and 49-50 in Table 1. However, only the odor-active compounds written in red in Table 1 are defined in the literature as coffee odorants. This means that participants correctly identified 18 of the 21 molecules smelling of coffee.
Table 2 shows the distribution of females and males in relation to their ability to perceive some odor-active compounds as they are eluted from the chromatographic column. In particular, a greater number of females than males were able to perceive the following volatiles: toluene (χ2 = 4.229, p = 0.039), pyridine (χ2 = 9.205, p = 0.003), furfural (χ2 = 5.230, p = 0.022), 2-furanmethanol acetate (χ2 = 5.380, p = 0.020), furan,2,2-methylenebis- (χ2 = 5.380, p = 0.020) and 2-furanmethanol (χ2 = 5.380, p = 0.020), belonging to coffee-molecules, and pyrazine 2-methyl-6-(2-propenyl) (χ2 = 6.052, p = 0.014) and 2-acetylpyrrole (χ2 = 5.490, p = 0.019), belonging to total-molecules. Instead, a greater number of males than females were able to perceive the following volatiles: D-limonene (χ2 = 4.16, p = 0.041), 2-propanone 1-hydroxy (χ2 = 4.695, p = 0.030) and pyrazine 3,5-diethyl-2-methyl- (χ2 = 5.380, p = 0.020), all belonging to total-molecules. No other differences in the perception of volatiles during GC-O experiments between females and males were found.
Figure 1A shows the mean values ± SE of the number of odor active-compounds for individuals with normosmia or hyposmia. One-way ANOVA revealed that normosmic individuals detected a higher number of total molecules (F (1,65) = 40.15; p < 0.0001) and coffee-molecules (F (1,65) = 32.54; p < 0.0001) than hyposmic ones. Figure 1B shows the same data according to sex. Post-hoc comparisons subsequent to two-way ANOVA (F (1,63) = 1.2162; p = 0.27) showed that normosmic individuals perceive a larger number of both total- and coffee-molecules, even when females (p < 0.0001; Fisher’s LSD test) and males (p ≤ 0.0077; Fisher’s LSD test) are considered separately. Also, among normosmic individuals, the results show that females perceive a larger number of both total- (p = 0.0087; Fisher’s LSD test) and coffee-molecules (p = 0.0116; Fisher’s LSD test) than males.
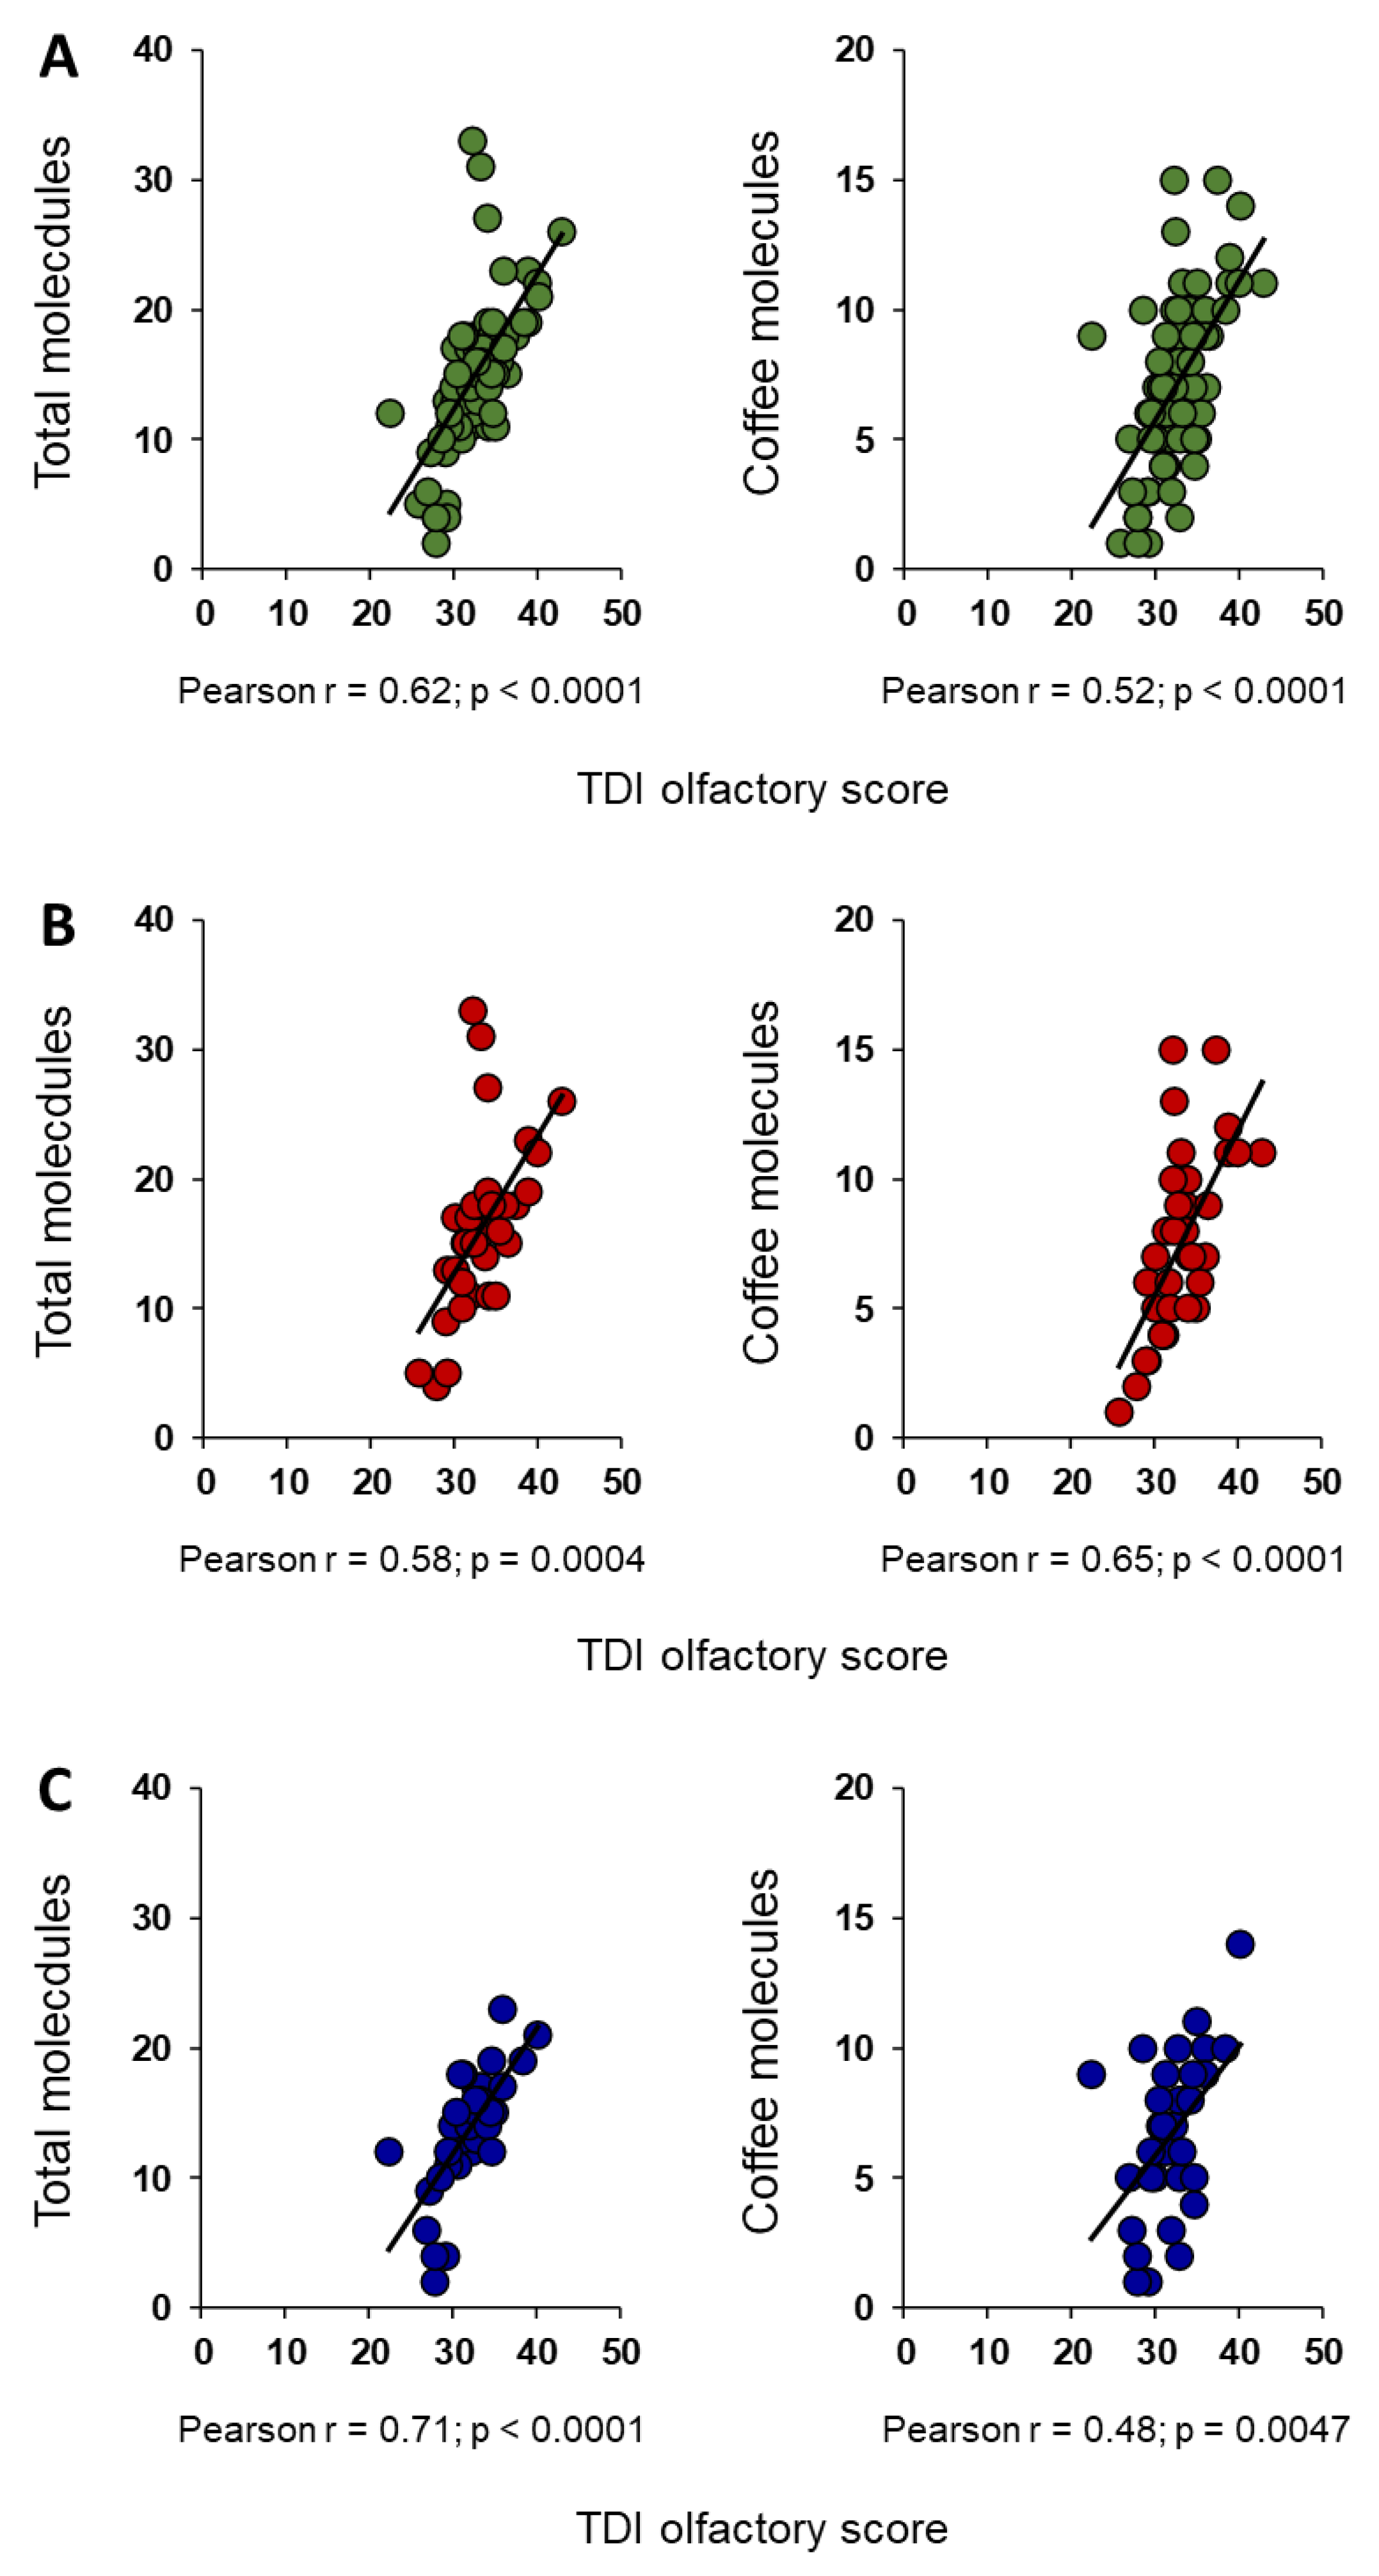
The results with Pearson’s correlation test, shown in Figure 2A, indicate that TDI olfactory score was positively correlated with both the number of total-molecules (Pearson’s r = 0.62, p < 0.0001) and that of coffee-molecules smelled by each subject (Pearson’s r = 0.52, p < 0.0001). Positive correlations between TDI olfactory score and number of both total and coffee odor-active compounds, were also found when females (Total: Pearson’s r = 0.58, p = 0.0004; Coffee: Pearson’s r = 0.65, p < 0.0001; Figure 2B) and males (Total: Pearson’s r = 0.71, p < 0.0001; Coffee: Pearson’s r = 0.48, p = 0.0047; Figure 2C) are considered separately.
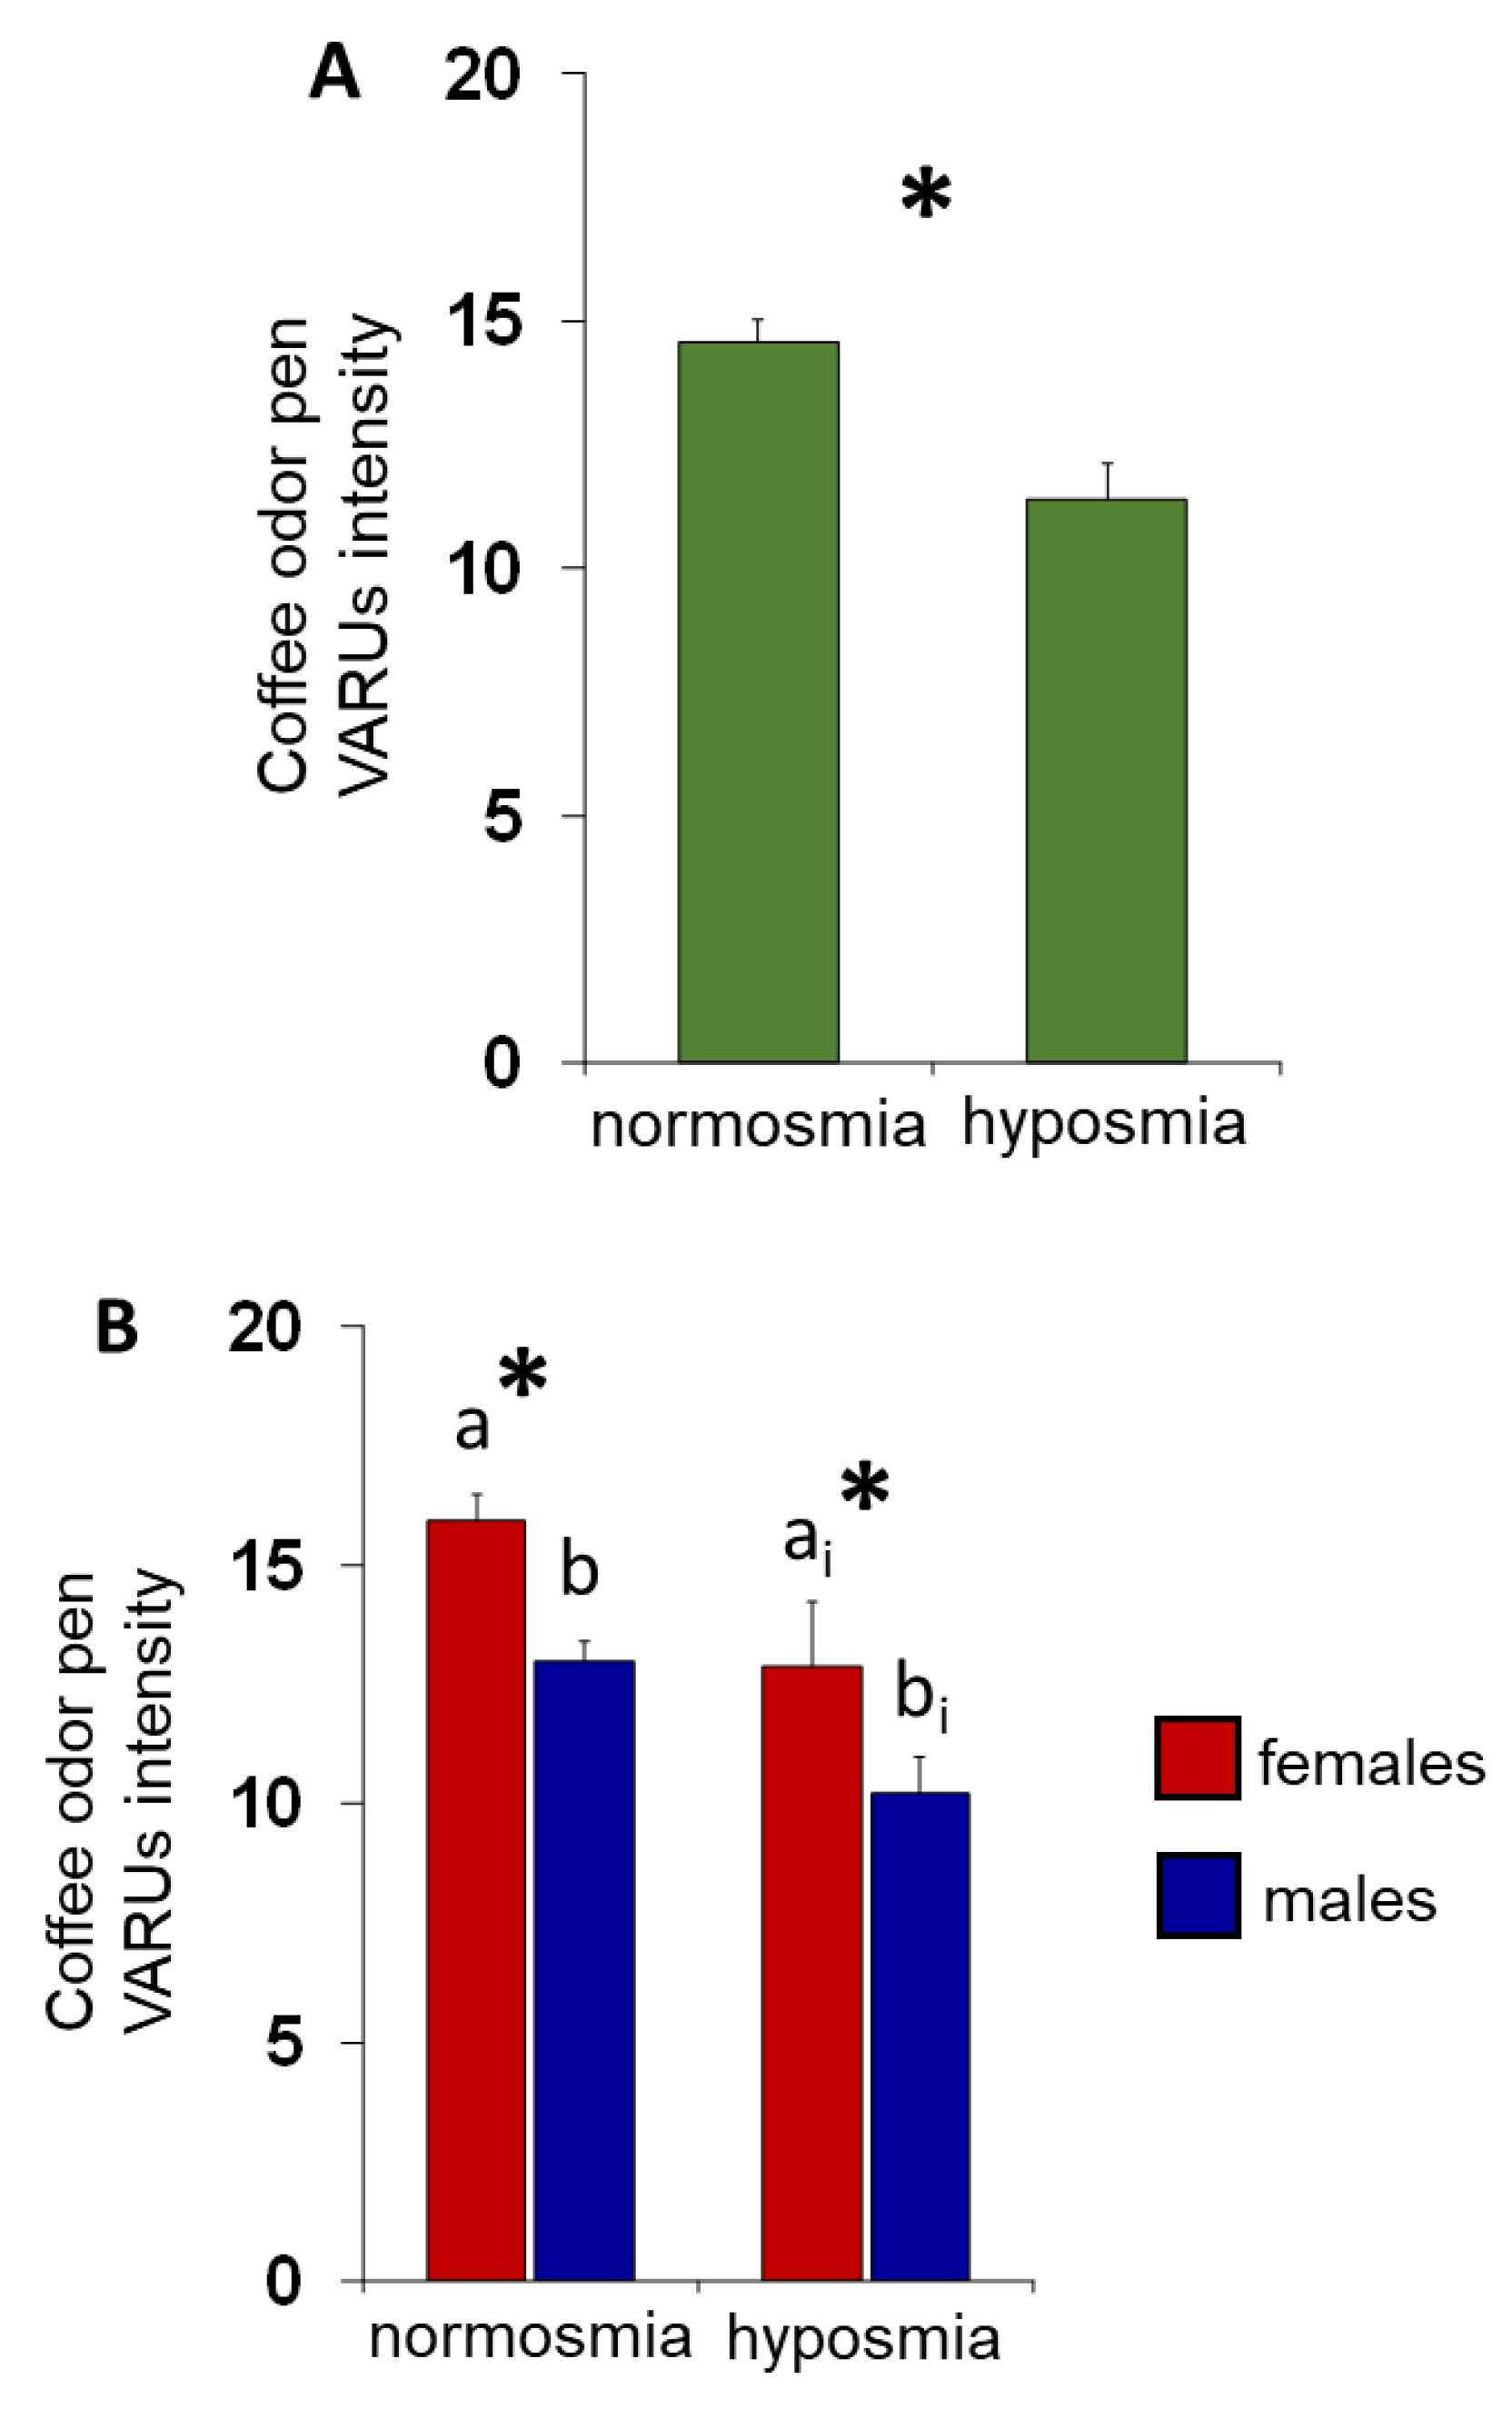
The mean values ± SE of the intensity perceived for coffee-odor pen by panelists classified by their TDI olfactory status are shown in Figure 3A. One-way ANOVA revealed that the intensity perceived by normosmic individuals was significantly higher than that of hyposmic individuals (F (1,65) = 10.40, p = 0.0019). Figure 3B shows the same data according to sex. Post-hoc analyses subsequent to two-way ANOVA (F (1,63) = 0.03; p = 0.87) highlighted that both normosmic females and males reported perceiving the coffee-odor pen with higher intensity than females (p = 0.0057; Fisher’s LSD test) and males (p = 0.0072; Fisher’s LSD test) with hyposmia. In addition, females perceived the coffee-odor pen more intensely than males, both among normosmic (p = 0.001; Fisher’s LSD test) and hyposmic (p = 0.0267; Fisher’s LSD test) individuals.
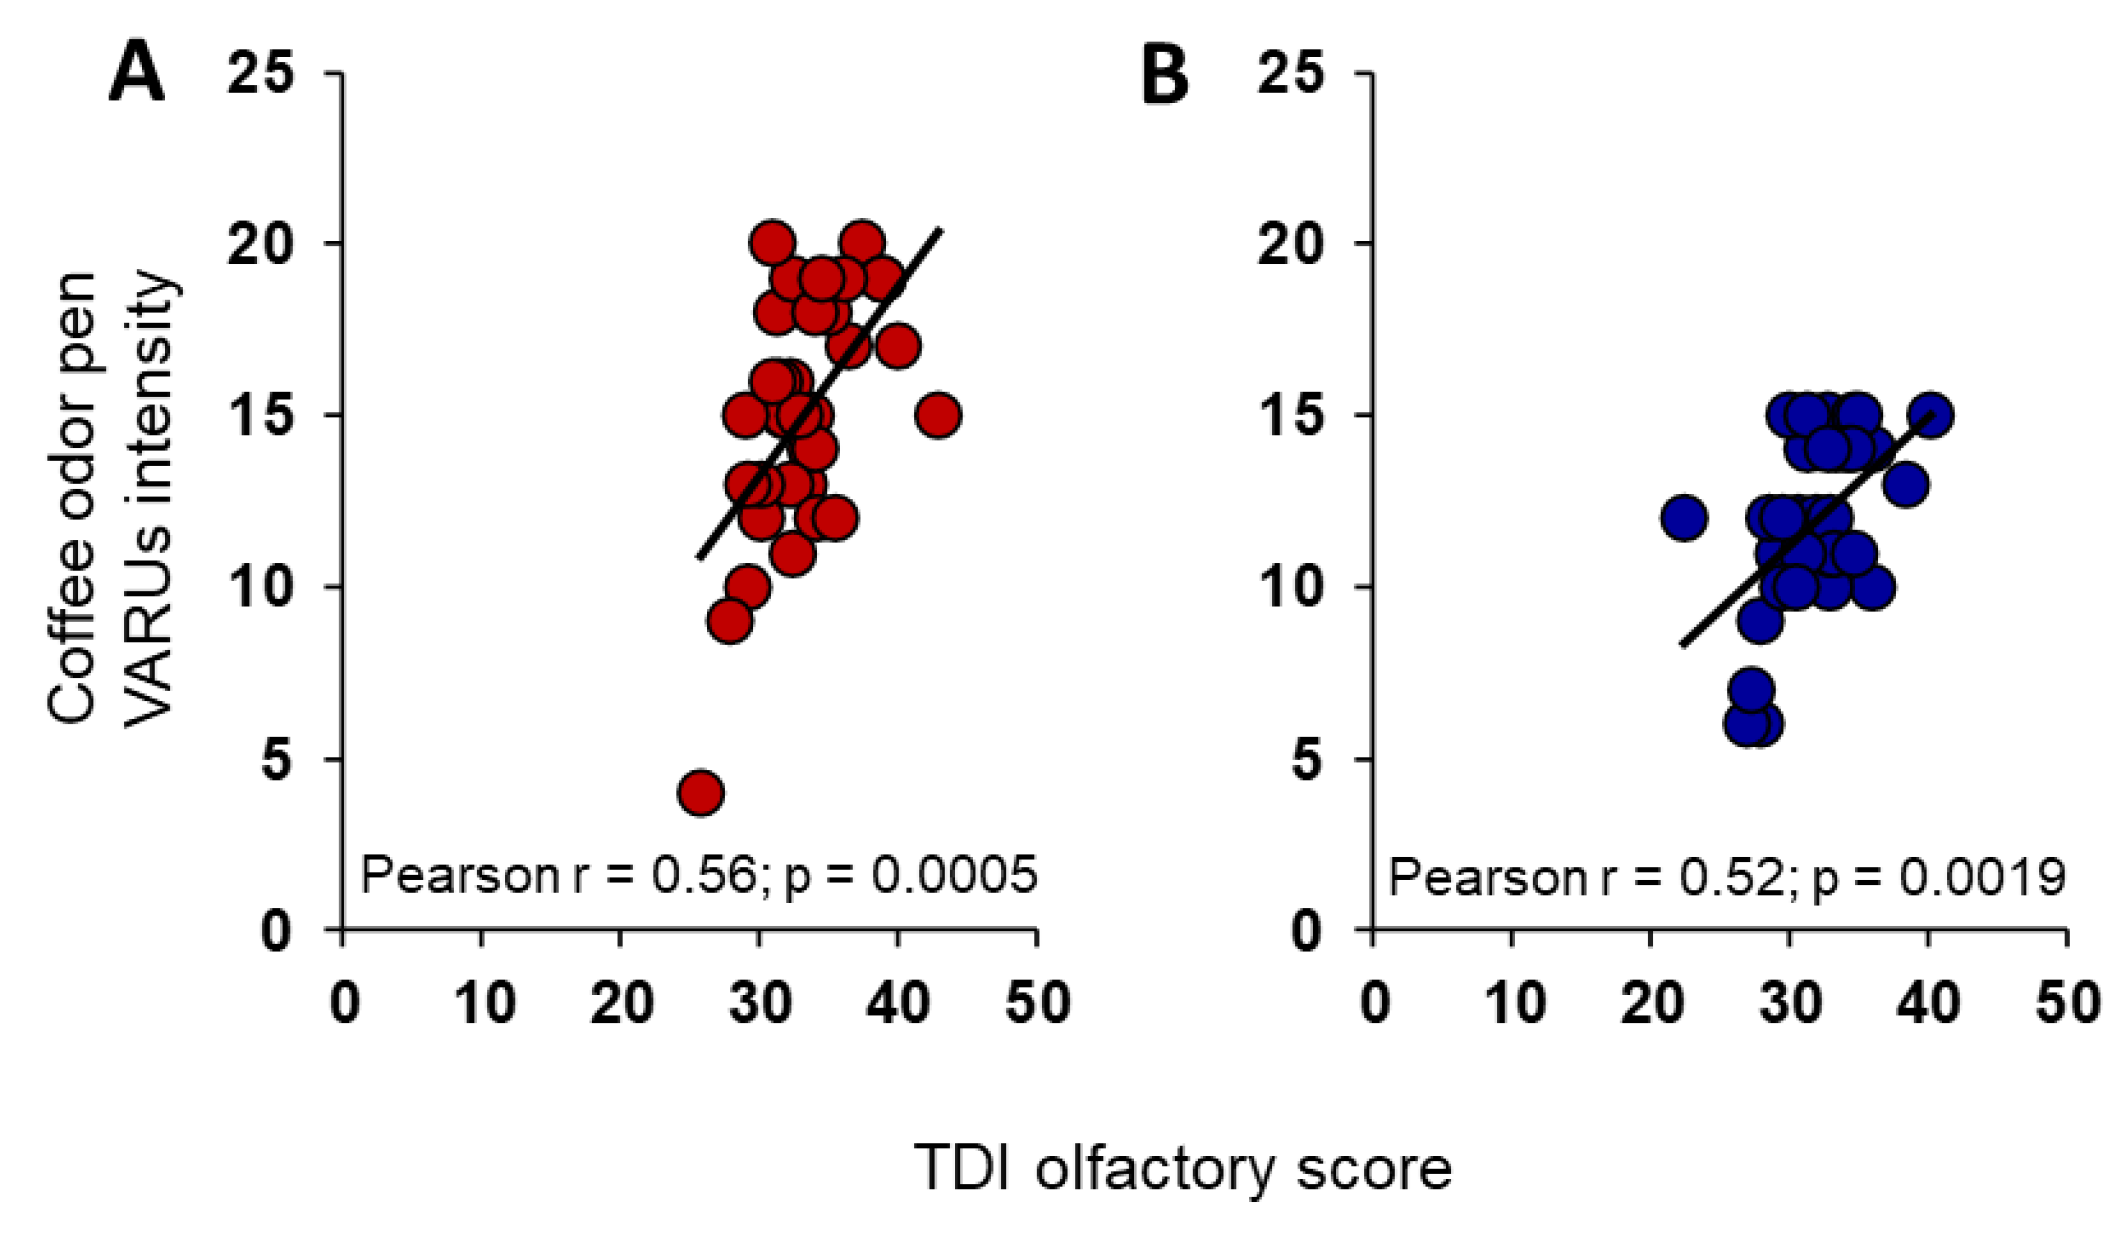
Pearson’s correlation analyses also revealed that the coffee-odor pen intensity reported by each individual was positively correlated with her/his TDI olfactory score, in both females (Pearson’s r = 0.56, p = 0.0005; Figure 4A) and males (Pearson’s r = 0.52, p = 0.0019; Figure 4B).
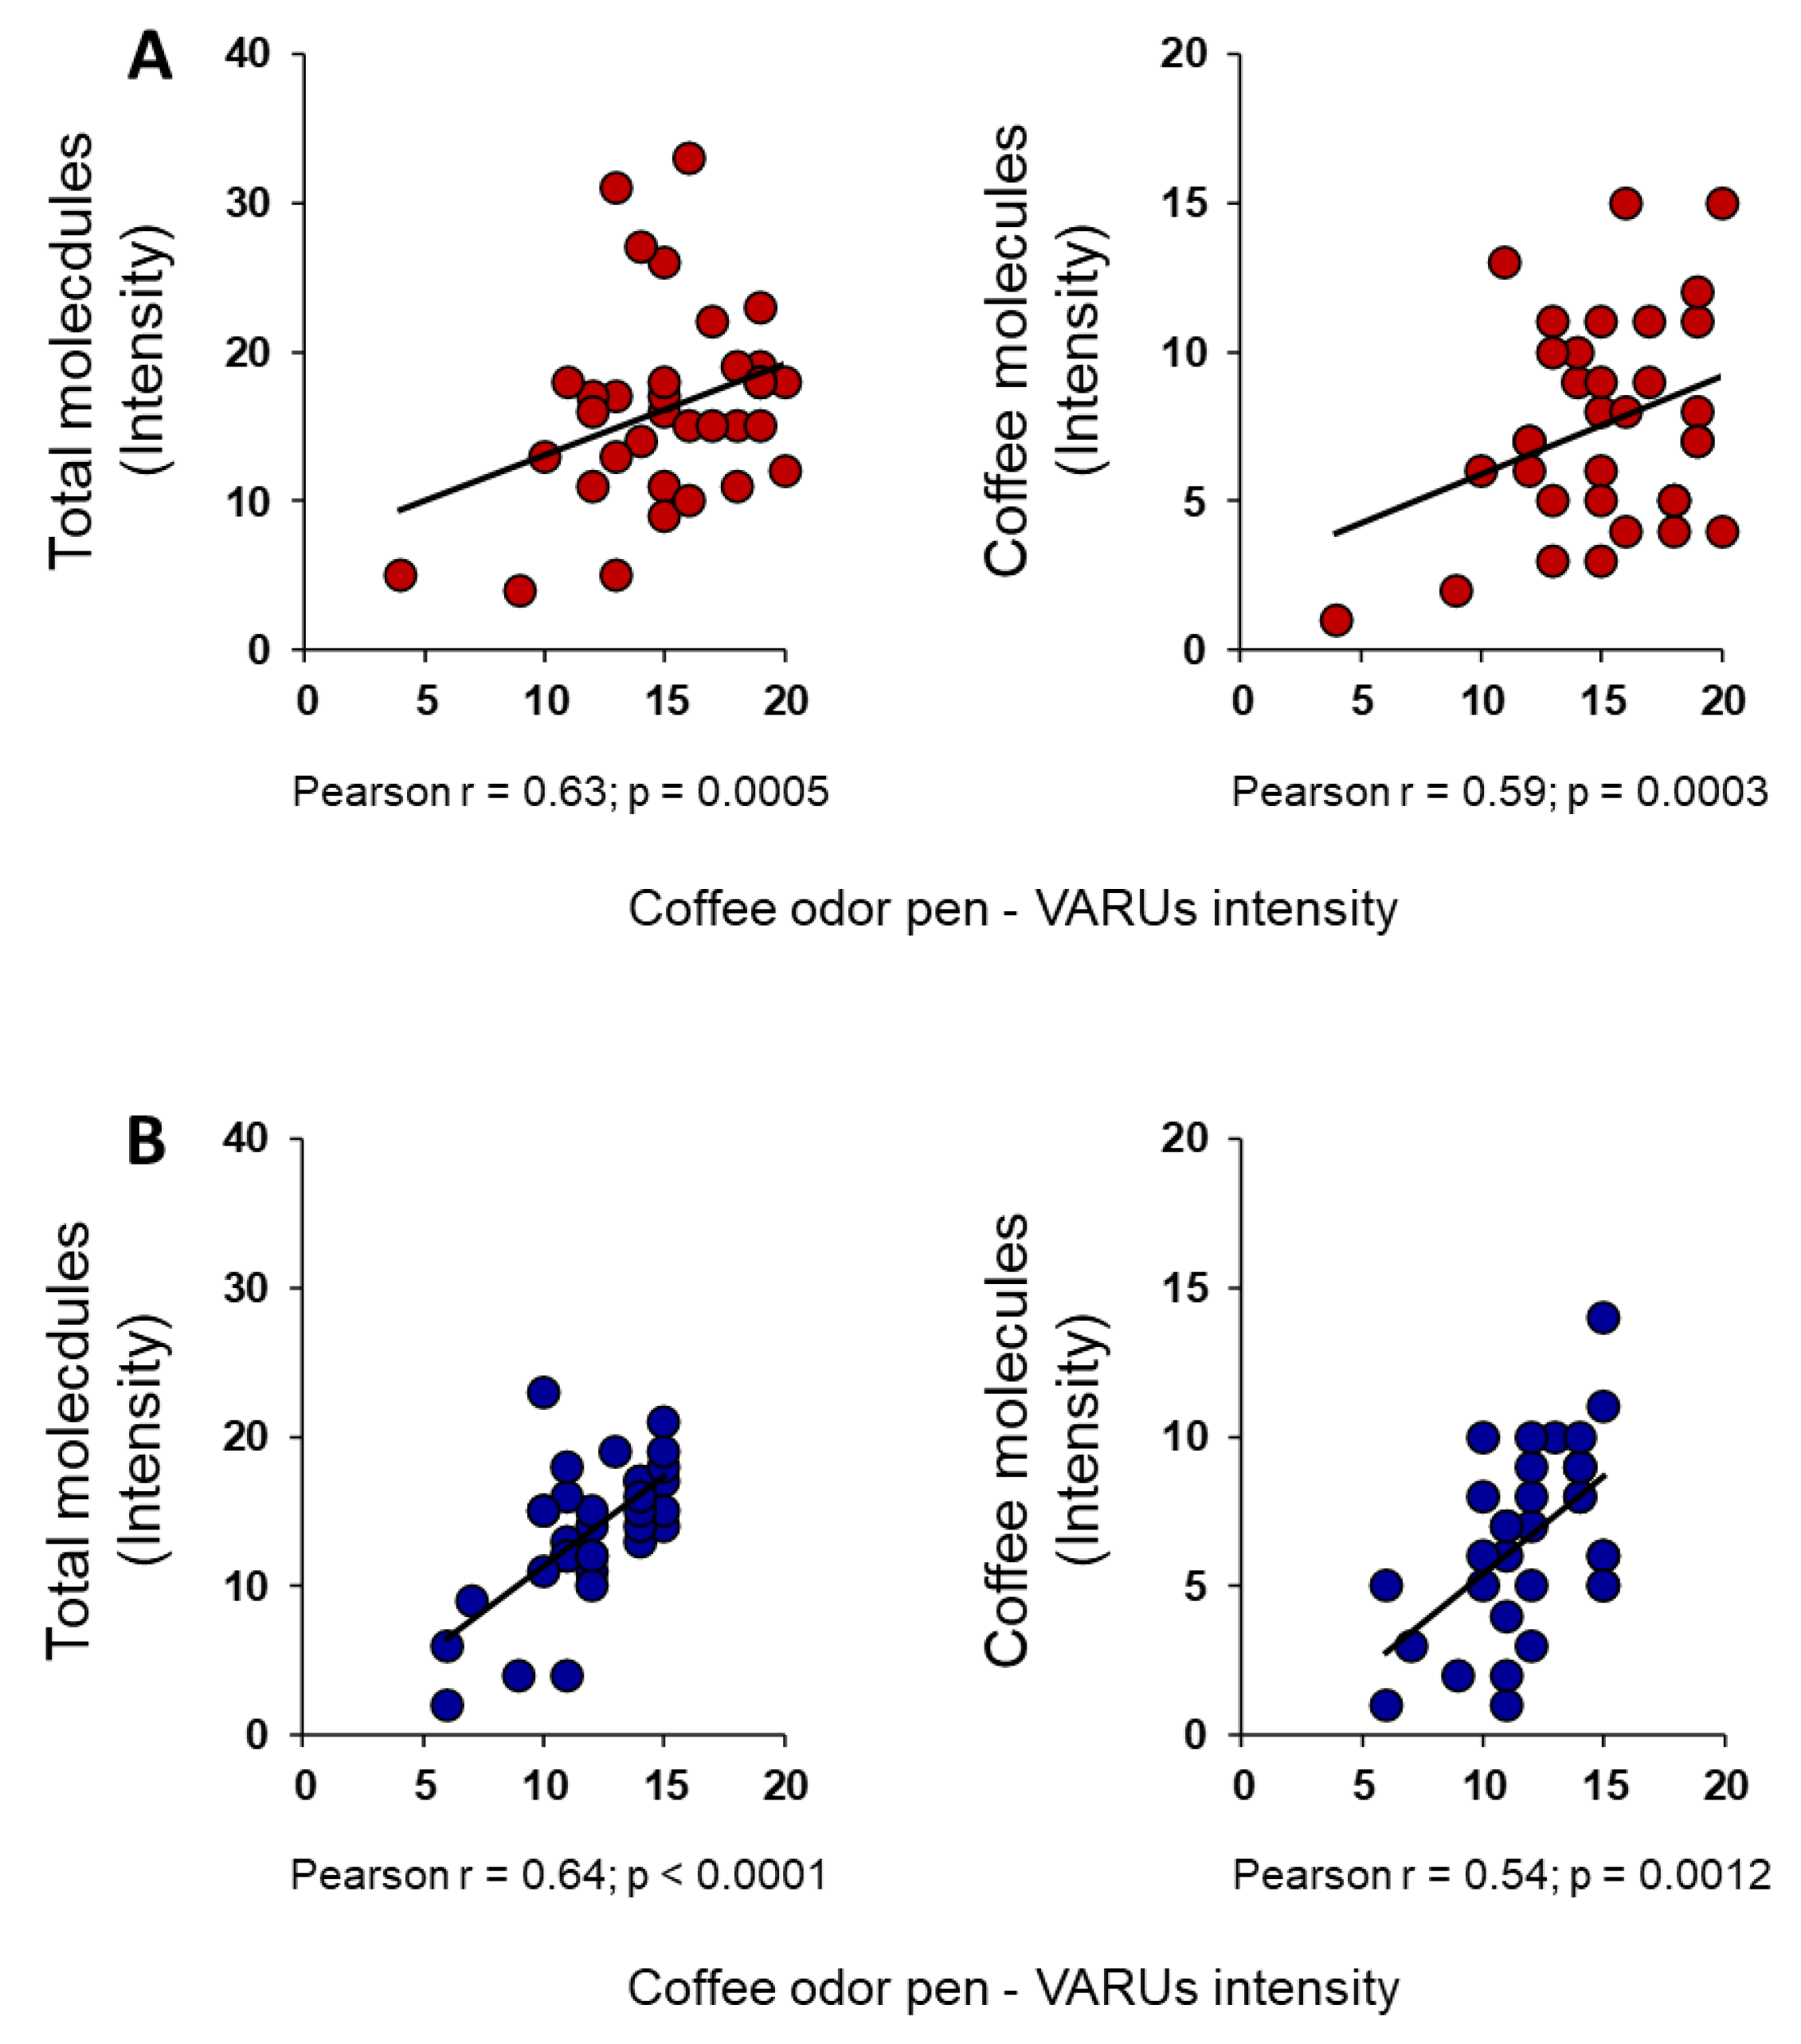
In addition, we found a significant positive correlation between coffee-odor pen intensity and number of total- and coffee-molecules perceived by each female (Total: Pearson’s r = 0.63, p = 0.0005; Coffee: Pearson’s r = 0.59, p = 0.0003; Figure 5A) and male (Total: Pearson’s r = 0.64, p < 0.0001; Coffee: Pearson’s r = 0.54, p = 0.0012; Figure 5B).

4. Discussion

The olfactory system provides information both on the composition of the external environment, signaling the presence of dangers, influencing inter-individual relationships and eating behavior, and on the composition of the internal environment, acting as a metabolic sensor [1,2,3,4,5,6,7,11,12,110,111]. Although the number of genes coding for functional olfactory receptors is approximately 350, it is known that the human nose, through a combinatorial code, is capable of perceiving and recognizing thousands of molecules [112,113,114,115,116,117,118,119]. Considering that the odor of foods and drinks is generally represented by a combination of several chemical molecules, that the sensorially active molecules are those that contribute most to determining the odor of the mixture, and that the odor-active compounds differ between individuals, this may explain why the intensity and pleasantness with which a complex odor is perceived can vary greatly between individuals and be extremely personal [33,35,39,41,90].
Based on these considerations, as a first objective of this study we evaluated the ability of individuals to perceive single molecules as they are separated and eluted from a chromatographic column and conveyed, via an olfactometric port, to the nose of participants. The results obtained with the GC-O experiments show that the number of molecules, both total or having the coffee-odor, smelled by normosmic participants is significantly higher than the number of molecules perceived by the hyposmic participants, both when females and males are considered together and separately. On the basis of the positive correlations found between the number of molecules perceived and the TDI olfactory score obtained by each female and male, these results confirm on the one hand the close relationship between the ability to perceive single molecules and the olfactory function of individuals, and on the other hand that this also applies to females and males separately [39,41]. In fact, considering that one of the topics still debated is whether the olfactory function of females differs from that of males, the main objective of this study was to evaluate the presence of differences both qualitative (type of molecules perceived) and quantitative (number of molecules perceived), in the ability of females and males to perceive the single molecules that make up a complex mixture. The results show that females perceive a larger number of both total- and coffee-molecules than males, in agreement with previous studies on sex-related differences in olfactory function which report that females perform better than males [52,63,120]. The reasons for this difference may be linked to cognitive, social and/or genetic factors. Previous studies have shown that females perform better than males in episodic olfactory memory, appear to be more interested in olfactory stimuli and are more familiar with odors [54,120,121,122]; in accordance, the frequency detection method used in this study to evaluate the ability to perceive single molecules, validated when using inexperienced evaluators and especially when the mixture is unknown, requires good concentration and ability to recall information from olfactory memory [92,93,123,124]. As regards genetic factors, recent studies have shown that the expression and functionality of Kv1.3 channels, abundantly expressed in the olfactory epithelium and olfactory bulb, can play an important role in influencing the olfactory function of individuals [52,125,126,127]. In particular, one major T allele may protect females from olfactory dysfunction, while males need two T alleles for an olfactory performance comparable to that of females [52].
Another interesting aspect highlighted by our results is that females differ from males not only in the number of molecules perceived, but also in the type. In fact, we found that for 6 of the 18 coffee-molecules, among participants who correctly identified them, the number of females was significantly higher than that of males. Even among the total-molecules, i.e., those belonging to the mixture but not classified as coffee odorants, we found sex-related differences among the participants who smelled them. In detail, two molecules were perceived by a larger number of females, while three others were perceived by a larger number of males. Finally, our results showed that females reported perceiving the coffee-odor pen with a significantly higher intensity than males, although for both sexes the correlation analyses showed that the intensity perceived by each participant was significantly correlated with her/his TDI olfactory score. This result can be partly explained by the fact that females not only perceive a larger number of both total- and coffee-molecules, but among the participants who smelled some of the coffee molecules, the larger number is represented by females. Taken together, these findings support previous studies that highlight a better olfactory performance of females as compared to males, but also the idea that each individual has her/his own sensory idea of a complex odor, despite everyone defining it as the same thing.
In this study, the olfactory function of individuals was assigned by means of the TDI olfactory score obtained from each participant. Since the TDI score is given by the sum of the score obtained with the olfactory threshold test (T-test), discrimination (D-test) and identification (I-test) of odors, the state of hyposmia can be determined by the reduced ability to perceive and/or discriminate and/or identify odors. We have previously found that in healthy subjects the main determinant of the TDI score is T-score, followed by D-score and finally by I-score [59]. This aspect takes a particular importance if we consider that in GC-O experiments the ability to perceive and discriminate odors is fundamental. First, the lower the olfactory threshold, the larger the number of molecules that can be perceived; in fact, even molecules that are subthreshold for individuals with reduced olfactory perception, could instead be suprathreshold for those who show a better olfactory threshold. Second, a reduced ability to discriminate odors could cause similar odors to be perceived as the same, thus reducing the number of odor-active compounds. In agreement, a previous study had highlighted that the ability to perceive single molecules was associated with the threshold olfactory score obtained by participants [41]. Furthermore, the differences found between sexes are also in agreement with recent findings on the differences between the TDI olfactory score of females and males, due to differences between the olfactory threshold and discrimination scores [52].

5. Conclusions

By considering that the olfactory function plays an important role in food choices, the ability to perceive odors, both simple and complex, as well as the type of molecules that are perceived, is of particular importance for the state of health of individuals. In fact, the number, type and intensity with which the molecules are perceived can influence the quality and quantity of a meal. If this is unbalanced towards foods with a high energy content, consequently, we observe an increase in body weight and the appearance of unhealthy conditions such as dysglycemia and/or dyslipidemia, just to name a few. A good olfactory function, on the other hand, favors both less abundant meals and meals rich in healthier foods such as fruit and vegetables.
The considerations emerging from the results of this study provide the basis for evaluating, in future studies on a larger sample: a) further differences, especially qualitative, between females and males in their ability to perceive single molecules as they are eluted from a chromatographic column; b) the relationships between number and/or type of molecules perceived and olfactory threshold and discrimination in females and males separately; c) the role of polymorphisms of some genes involved in the olfactory function of individuals.

Author Contributions

Conceptualization, G.S. and R.C.; methodology, G.S.; statistical analysis, G.S.; investigation, G.S. and P.S.; data curation, G.S.; writing—original draft preparation, G.S.; writing—review and editing, G.S., P.S. and R.C.; supervision, G.S.; project administration, G.S.; funding acquisition, G.S and P.S.

Funding

This work was supported by a grant from the University of Cagliari (Fondo Integrativo per la Ricerca, FIR 2021-2022).

Institutional Review Board Statement

The study was conducted according to the guidelines of the Declaration of Helsinki and approved by the Ethical Committee of the University Hospital of Cagliari (Prot. NP/2020/3883 del 30.09.2020).

Informed Consent Statement

“Informed consent was obtained from all subjects involved in the study.”

Data Availability Statement

The data presented in this study are available on request from the corresponding author. The data are not publicly available due to restrictions (e.g., privacy or ethical).

Acknowledgments

The authors thank the volunteers, without whose contribution this study would not have been possible.

Conflicts of Interest

The authors declare no conflict of interest. The funders had no role in the design of the study; in the collection, analyses, or interpretation of data; in the writing of the manuscript, or in the decision to publish the results.

References

  1. Aschenbrenner, K.; Hummel, C.; Teszmer, K.; Krone, F.; Ishimaru, T.; Seo, H.S.; Hummel, T. The influence of olfactory loss on dietary behaviors. The Laryngoscope 2008, 118, 135–144. [Google Scholar] [CrossRef] [PubMed]
  2. Connor, E.E.; Zhou, Y.; Liu, G.E. The essence of appetite: does olfactory receptor variation play a role? Journal of animal science 2018, 96, 1551–1558. [Google Scholar] [CrossRef] [PubMed]
  3. Croy, I.; Nordin, S.; Hummel, T. Olfactory Disorders and Quality of Life—An Updated Review. Chemical Senses 2014, 39, 185–194. [Google Scholar] [CrossRef] [PubMed]
  4. Hummel, T.; Nordin, S. Olfactory disorders and their consequences for quality of life. Acta oto-laryngologica 2005, 125, 116–121. [Google Scholar] [CrossRef] [PubMed]
  5. Landolt, P.J.; Heath, R.R.; Chambers, D.L. Oriented flight responses of female Mediterranean fruit flies to calling males, odor of calling males, and a synthetic pheromone blend. Entomologia Experimentalis et Applicata 1992, 65, 259–266. [Google Scholar] [CrossRef]
  6. Lebreton, S.; Borrero-Echeverry, F.; Gonzalez, F.; Solum, M.; Wallin, E.A.; Hedenström, E.; Hansson, B.S.; Gustavsson, A.-L.; Bengtsson, M.; Birgersson, G.; et al. A Drosophila female pheromone elicits species-specific long-range attraction via an olfactory channel with dual specificity for sex and food. BMC Biology 2017, 15, 88. [Google Scholar] [CrossRef]
  7. Li, H.; Wang, P.; Zhang, L.; Xu, X.; Cao, Z.; Zhang, L. Expressions of Olfactory Proteins in Locust Olfactory Organs and a Palp Odorant Receptor Involved in Plant Aldehydes Detection. Frontiers in physiology 2018, 9, 663. [Google Scholar] [CrossRef]
  8. Solari, P.; Corda, V.; Sollai, G.; Kreissl, S.; Galizia, C.G.; Crnjar, R. Morphological characterization of the antennal lobes in the Mediterranean fruit fly Ceratitis capitata. Journal of comparative physiology. A, Neuroethology, sensory, neural, and behavioral physiology 2016, 202, 131–146. [Google Scholar] [CrossRef]
  9. Sollai, G.; Solari, P.; Crnjar, R. Olfactory sensitivity to major, intermediate and trace components of sex pheromone in Ceratitis capitata is related to mating and circadian rhythm. Journal of insect physiology 2018, 110, 23–33. [Google Scholar] [CrossRef]
  10. Sollai, G.; Solari, P.; Crnjar, R. Differences in the Olfactory Sensitivity of Ceratitis capitata to Headspace of Some Host Plants in Relation to Sex, Mating Condition and Population. Diversity 2020, 12, 207. [Google Scholar] [CrossRef]
  11. Stevenson, R.J. An initial evaluation of the functions of human olfaction. Chem Senses 2010, 35, 3–20. [Google Scholar] [CrossRef] [PubMed]
  12. Su, C.Y.; Menuz, K.; Carlson, J.R. Olfactory perception: receptors, cells, and circuits. Cell 2009, 139, 45–59. [Google Scholar] [CrossRef] [PubMed]
  13. Duffy, V.B.; Backstrand, J.R.; Ferris, A.M. Olfactory dysfunction and related nutritional risk in free-living, elderly women. Journal of the American Dietetic Association 1995, 95, 879–884, quiz 885-876. [Google Scholar] [CrossRef]
  14. Erskine, S.E.; Philpott, C.M. An unmet need: Patients with smell and taste disorders. Clinical otolaryngology : official journal of ENT-UK ; official journal of Netherlands Society for Oto-Rhino-Laryngology & Cervico-Facial Surgery 2020, 45, 197–203. [Google Scholar]
  15. Ferris, A.M.; Duffy, V.B. Effect of olfactory deficits on nutritional status. Does age predict persons at risk? Annals of the New York Academy of Sciences 1989, 561, 113–123. [Google Scholar] [CrossRef] [PubMed]
  16. Gaillet-Torrent, M.; Sulmont-Rossé, C.; Issanchou, S.; Chabanet, C.; Chambaron, S. Impact of a non-attentively perceived odour on subsequent food choices. Appetite 2014, 76, 17–22. [Google Scholar] [CrossRef]
  17. Manesse, C.; Ferdenzi, C.; Sabri, M.; Bessy, M.; Rouby, C.; Faure, F.; Bellil, D.; Jomain, S.; Landis, B.N.; Hugentobler, M.; et al. Dysosmia-Associated Changes in Eating Behavior. Chemosensory Perception 2017, 10, 104–113. [Google Scholar] [CrossRef]
  18. Postma, E.; Graaf, C.; Boesveldt, S. Food preferences and intake in a population of Dutch individuals with self-reported smell loss: An online survey. Food Quality and Preference 2019, 79, 103771. [Google Scholar] [CrossRef]
  19. Seo, H.S.; Guarneros, M.; Hudson, R.; Distel, H.; Min, B.C.; Kang, J.K.; Croy, I.; Vodicka, J.; Hummel, T. Attitudes toward Olfaction: A Cross-regional Study. Chem Senses 2011, 36, 177–187. [Google Scholar] [CrossRef]
  20. Stroebele, N.; De Castro, J.M. Effect of ambience on food intake and food choice. Nutrition 2004, 20, 821–838. [Google Scholar] [CrossRef]
  21. Albrecht, J.; Schreder, T.; Kleemann, A.M.; Schöpf, V.; Kopietz, R.; Anzinger, A.; Demmel, M.; Linn, J.; Kettenmann, B.; Wiesmann, M. Olfactory detection thresholds and pleasantness of a food-related and a non-food odour in hunger and satiety. Rhinology 2009, 47, 160–165. [Google Scholar] [PubMed]
  22. Bolhuis, D.P.; Lakemond, C.M.; de Wijk, R.A.; Luning, P.A.; de Graaf, C. Effect of salt intensity in soup on ad libitum intake and on subsequent food choice. Appetite 2012, 58, 48–55. [Google Scholar] [CrossRef] [PubMed]
  23. Egecioglu, E.; Skibicka, K.P.; Hansson, C.; Alvarez-Crespo, M.; Friberg, P.A.; Jerlhag, E.; Engel, J.A.; Dickson, S.L. Hedonic and incentive signals for body weight control. Reviews in endocrine & metabolic disorders 2011, 12, 141–151. [Google Scholar]
  24. Power, M.L.; Schulkin, J. Anticipatory physiological regulation in feeding biology: cephalic phase responses. Appetite 2008, 50, 194–206. [Google Scholar] [CrossRef] [PubMed]
  25. Ramaekers, M.G.; Boesveldt, S.; Lakemond, C.M.; van Boekel, M.A.; Luning, P.A. Odors: appetizing or satiating? Development of appetite during odor exposure over time. International journal of obesity (2005) 2014, 38, 650–656. [Google Scholar] [CrossRef]
  26. Stafford, L.D. Olfactory Specific Satiety depends on degree of association between odour and food. Appetite 2016, 98, 63–66. [Google Scholar] [CrossRef]
  27. Yin, W.; Hewson, L.; Linforth, R.; Taylor, M.; Fisk, I.D. Effects of aroma and taste, independently or in combination, on appetite sensation and subsequent food intake. Appetite 2017, 114, 265–274. [Google Scholar] [CrossRef]
  28. Ferreira, V. Revisiting psychophysical work on the quantitative and qualitative odour properties of simple odour mixtures: a flavour chemistry view. Part 2: qualitative aspects. A review. Flavour and Fragrance Journal 2012, 27, 201–215. [Google Scholar] [CrossRef]
  29. Ferreira, V. Revisiting psychophysical work on the quantitative and qualitative odour properties of simple odour mixtures: a flavour chemistry view. Part 1: intensity and detectability. A review. Flavour and Fragrance Journal 2012, 27, 124–140. [Google Scholar] [CrossRef]
  30. Frank, M.E.; Fletcher, D.B.; Hettinger, T.P. Recognition of the Component Odors in Mixtures. Chemical senses 2017, 42, 537–546. [Google Scholar] [CrossRef]
  31. Iannario, M.; Manisera, M.; Piccolo, D.; Zuccolotto, P. Sensory analysis in the food industry as a tool for marketing decisions. Advances in Data Analysis and Classification 2012, 6, 303–321. [Google Scholar] [CrossRef]
  32. Ruijschop, R.M.; Boelrijk, A.E.; de Ru, J.A.; de Graaf, C.; Westerterp-Plantenga, M.S. Effects of retro-nasal aroma release on satiation. The British journal of nutrition 2008, 99, 1140–1148. [Google Scholar] [CrossRef] [PubMed]
  33. Schilling, B.; Kaiser, R.; Natsch, A.; Gautschi, M. Investigation of odors in the fragrance industry. Chemoecology 2010, 20, 135–147. [Google Scholar] [CrossRef]
  34. Delahunty, C.M.; Eyres, G.; Dufour, J.P. Gas chromatography-olfactometry. Journal of separation science 2006, 29, 2107–2125. [Google Scholar] [CrossRef] [PubMed]
  35. Jordán, M.J.; Tandon, K.; Shaw, P.E.; Goodner, K.L. Aromatic profile of aqueous banana essence and banana fruit by gas chromatography-mass spectrometry (GC-MS) and gas chromatography-olfactometry (GC-O). Journal of agricultural and food chemistry 2001, 49, 4813–4817. [Google Scholar] [CrossRef]
  36. Mayol, A.R.; Acree, T.E. Advances in Gas Chromatography-Olfactometry. In Gas Chromatography-Olfactometry; ACS Symposium Series; American Chemical Society: 2001; Volume 782, pp. 1-10.
  37. Nuzzi, M.; Lo Scalzo, R.; Testoni, A.; Rizzolo, A. Evaluation of Fruit Aroma Quality: Comparison Between Gas Chromatography–Olfactometry (GC–O) and Odour Activity Value (OAV) Aroma Patterns of Strawberries. Food Analytical Methods 2008, 1, 270–282. [Google Scholar] [CrossRef]
  38. van Ruth, S.M. Methods for gas chromatography-olfactometry: a review. Biomolecular engineering 2001, 17, 121–128. [Google Scholar] [CrossRef]
  39. Crnjar, R.; Solari, P.; Sollai, G. The Human Nose as a Chemical Sensor in the Perception of Coffee Aroma: Individual Variability. Chemosensors 2023, 11, 248. [Google Scholar] [CrossRef]
  40. Melis, M.; Tomassini Barbarossa, I.; Hummel, T.; Crnjar, R.; Sollai, G. Effect of the rs2890498 polymorphism of the OBPIIa gene on the human ability to smell single molecules. Behavioural brain research 2021, 402, 113127. [Google Scholar] [CrossRef]
  41. Sollai, G.; Tomassini Barbarossa, I.; Usai, P.; Hummel, T.; Crnjar, R. Association between human olfactory performance and ability to detect single compounds in complex chemical mixtures. Physiology & behavior 2020, 217, 112820. [Google Scholar]
  42. Cain, W.S.; Gent, J.F. Olfactory sensitivity: reliability, generality, and association with aging. Journal of experimental psychology. Human perception and performance 1991, 17, 382–391. [Google Scholar] [CrossRef] [PubMed]
  43. Feldmesser, E.; Bercovich, D.; Avidan, N.; Halbertal, S.; Haim, L.; Gross-Isseroff, R.; Goshen, S.; Lancet, D. Mutations in olfactory signal transduction genes are not a major cause of human congenital general anosmia. Chem Senses 2007, 32, 21–30. [Google Scholar] [CrossRef] [PubMed]
  44. Hasin-Brumshtein, Y.; Lancet, D.; Olender, T. Human olfaction: from genomic variation to phenotypic diversity. Trends in genetics : TIG 2009, 25, 178–184. [Google Scholar] [CrossRef] [PubMed]
  45. Jafek, B.W.; Gordon, A.S.; Moran, D.T.; Eller, P.M. Congenital anosmia. Ear, nose, & throat journal 1990, 69, 331–337. [Google Scholar]
  46. Attems, J.; Walker, L.; Jellinger, K.A. Olfaction and Aging: A Mini-Review. Gerontology 2015, 61, 485–490. [Google Scholar] [CrossRef]
  47. Cain, W.S.; Stevens, J.C. Uniformity of olfactory loss in aging. Annals of the New York Academy of Sciences 1989, 561, 29–38. [Google Scholar] [CrossRef]
  48. Calderón-Garcidueñas, L.; Franco-Lira, M.; Henríquez-Roldán, C.; Osnaya, N.; González-Maciel, A.; Reynoso-Robles, R.; Villarreal-Calderon, R.; Herritt, L.; Brooks, D.; Keefe, S.; et al. Urban air pollution: influences on olfactory function and pathology in exposed children and young adults. Experimental and toxicologic pathology : official journal of the Gesellschaft fur Toxikologische Pathologie 2010, 62, 91–102. [Google Scholar] [CrossRef]
  49. Doty, R.L.; Shaman, P.; Applebaum, S.L.; Giberson, R.; Siksorski, L.; Rosenberg, L. Smell identification ability: changes with age. Science (New York, N.Y.) 1984, 226, 1441–1443. [Google Scholar] [CrossRef]
  50. Keller, A.; Zhuang, H.; Chi, Q.; Vosshall, L.B.; Matsunami, H. Genetic variation in a human odorant receptor alters odour perception. Nature 2007, 449, 468–472. [Google Scholar] [CrossRef]
  51. Melis, M.; Mastinu, M.; Sollai, G. Effect of the rs2821557 Polymorphism of the Human Kv1.3 Gene on Olfactory Function and BMI in Different Age Groups. Nutrients 2024, 16, 821. [Google Scholar] [CrossRef]
  52. Melis, M.; Tomassini Barbarossa, I.; Crnjar, R.; Sollai, G. Olfactory Sensitivity Is Associated with Body Mass Index and Polymorphism in the Voltage-Gated Potassium Channels Kv1.3. Nutrients 2022, 14, 4986. [Google Scholar] [CrossRef] [PubMed]
  53. Min, H.J.; Kim, S.M.; Han, D.H.; Kim, K.S. The sniffing bead system, an olfactory dysfunction screening tool for geriatric subjects: a cross-sectional study. BMC geriatrics 2021, 21, 54. [Google Scholar] [CrossRef] [PubMed]
  54. Öberg, C.; Larsson, M.; Bäckman, L. Differential sex effects in olfactory functioning: The role of verbal processing. Journal of the International Neuropsychological Society 2002, 8, 691–698. [Google Scholar] [CrossRef]
  55. Schubert, C.R.; Fischer, M.E.; Pinto, A.A.; Klein, B.E.K.; Klein, R.; Tweed, T.S.; Cruickshanks, K.J. Sensory Impairments and Risk of Mortality in Older Adults. The journals of gerontology. Series A, Biological sciences and medical sciences 2017, 72, 710–715. [Google Scholar] [CrossRef]
  56. Silva Teixeira, C.S.; Cerqueira, N.M.; Silva Ferreira, A.C. Unravelling the Olfactory Sense: From the Gene to Odor Perception. Chem Senses 2016, 41, 105–121. [Google Scholar] [CrossRef] [PubMed]
  57. Sollai, G.; Crnjar, R. Age-Related Olfactory Decline Is Associated With Levels of Exercise and Non-exercise Physical Activities. Frontiers in aging neuroscience 2021, 13, 695115. [Google Scholar] [CrossRef]
  58. Sollai, G.; Crnjar, R. Association among Olfactory Function, Lifestyle and BMI in Female and Male Elderly Subjects: A Cross-Sectional Study. Nutrients 2023, 15. [Google Scholar] [CrossRef]
  59. Sollai, G.; Melis, M.; Magri, S.; Usai, P.; Hummel, T.; Tomassini Barbarossa, I.; Crnjar, R. Association between the rs2590498 polymorphism of Odorant Binding Protein (OBPIIa) gene and olfactory performance in healthy subjects. Behavioural brain research 2019, 372, 112030. [Google Scholar] [CrossRef] [PubMed]
  60. Sollai, G.; Melis, M.; Tomassini Barbarossa, I.; Crnjar, R. A polymorphism in the human gene encoding OBPIIa affects the perceived intensity of smelled odors. Behavioural brain research 2022, 427, 113860. [Google Scholar] [CrossRef]
  61. Sorokowska, A.; Sorokowski, P.; Frackowiak, T. Determinants of human olfactory performance: a cross-cultural study. The Science of the total environment 2015, 506-507, 196–200. [Google Scholar] [CrossRef]
  62. Sorokowska, A.; Sorokowski, P.; Hummel, T. Cross-Cultural Administration of an Odor Discrimination Test. Chemosens Percept 2014, 7, 85–90. [Google Scholar] [CrossRef] [PubMed]
  63. Sorokowski, P.; Karwowski, M.; Misiak, M.; Marczak, M.K.; Dziekan, M.; Hummel, T.; Sorokowska, A. Sex Differences in Human Olfaction: A Meta-Analysis. Front Psychol 2019, 10, 242. [Google Scholar] [CrossRef]
  64. Doty, R.L.; Cameron, E.L. Sex differences and reproductive hormone influences on human odor perception. Physiology & behavior 2009, 97, 213–228. [Google Scholar]
  65. Olofsson, J.K.; Nordin, S. Gender Differences in Chemosensory Perception and Event-related Potentials. Chemical Senses 2004, 29, 629–637. [Google Scholar] [CrossRef]
  66. Bugaud, C.; Alter, P. Volatile and non-volatile compounds as odour and aroma predictors in dessert banana (Musa spp.). Postharvest Biology and Technology 2016, 112, 14–23. [Google Scholar] [CrossRef]
  67. Aydın, E.; Tekeli, H.; Karabacak, E.; Altunay İ, K.; Aydın, Ç.; Çerman, A.A.; Altundağ, A.; Salihoğlu, M.; Çayönü, M. Olfactory functions in patients with psoriasis vulgaris: correlations with the severity of the disease. Archives of dermatological research 2016, 308, 409–414. [Google Scholar] [CrossRef] [PubMed]
  68. Besser, G.; Erlacher, B.; Aydinkoc-Tuzcu, K.; Liu, D.T.; Pablik, E.; Niebauer, V.; Koenighofer, M.; Renner, B.; Mueller, C.A. Body-Mass-Index Associated Differences in Ortho- and Retronasal Olfactory Function and the Individual Significance of Olfaction in Health and Disease. Journal of clinical medicine 2020, 9. [Google Scholar] [CrossRef] [PubMed]
  69. Croy, I.; Symmank, A.; Schellong, J.; Hummel, C.; Gerber, J.; Joraschky, P.; Hummel, T. Olfaction as a marker for depression in humans. Journal of affective disorders 2014, 160, 80–86. [Google Scholar] [CrossRef]
  70. Graves, A.B.; Bowen, J.D.; Rajaram, L.; McCormick, W.C.; McCurry, S.M.; Schellenberg, G.D.; Larson, E.B. Impaired olfaction as a marker for cognitive decline: interaction with apolipoprotein E epsilon4 status. Neurology 1999, 53, 1480–1487. [Google Scholar] [CrossRef]
  71. Palouzier-Paulignan, B.; Lacroix, M.C.; Aimé, P.; Baly, C.; Caillol, M.; Congar, P.; Julliard, A.K.; Tucker, K.; Fadool, D.A. Olfaction under metabolic influences. Chem Senses 2012, 37, 769–797. [Google Scholar] [CrossRef]
  72. Pastor, A.; Fernández-Aranda, F.; Fitó, M.; Jiménez-Murcia, S.; Botella, C.; Fernández-Real, J.M.; Frühbeck, G.; Tinahones, F.J.; Fagundo, A.B.; Rodriguez, J.; et al. A Lower Olfactory Capacity Is Related to Higher Circulating Concentrations of Endocannabinoid 2-Arachidonoylglycerol and Higher Body Mass Index in Women. PloS one 2016, 11, e0148734. [Google Scholar] [CrossRef] [PubMed]
  73. Patel, Z.M.; DelGaudio, J.M.; Wise, S.K. Higher Body Mass Index Is Associated with Subjective Olfactory Dysfunction. Behavioural neurology 2015, 2015, 675635. [Google Scholar] [CrossRef] [PubMed]
  74. Perricone, C.; Shoenfeld, N.; Agmon-Levin, N.; de Carolis, C.; Perricone, R.; Shoenfeld, Y. Smell and autoimmunity: a comprehensive review. Clinical reviews in allergy & immunology 2013, 45, 87–96. [Google Scholar]
  75. Pinto, J.M.; Wroblewski, K.E.; Kern, D.W.; Schumm, L.P.; McClintock, M.K. Olfactory dysfunction predicts 5-year mortality in older adults. PloS one 2014, 9, e107541. [Google Scholar] [CrossRef] [PubMed]
  76. Poessel, M.; Freiherr, J.; Wiencke, K.; Villringer, A.; Horstmann, A. Insulin Resistance Is Associated with Reduced Food Odor Sensitivity across a Wide Range of Body Weights. Nutrients 2020, 12, 2201. [Google Scholar] [CrossRef]
  77. Ross, G.W.; Petrovitch, H.; Abbott, R.D.; Tanner, C.M.; Popper, J.; Masaki, K.; Launer, L.; White, L.R. Association of olfactory dysfunction with risk for future Parkinson’s disease. Annals of neurology 2008, 63, 167–173. [Google Scholar] [CrossRef]
  78. Sollai, G.; Melis, M.; Mastinu, M.; Paduano, D.; Chicco, F.; Magri, S.; Usai, P.; Hummel, T.; Barbarossa, I.T.; Crnjar, R. Olfactory Function in Patients with Inflammatory Bowel Disease (IBD) Is Associated with Their Body Mass Index and Polymorphism in the Odor Binding-Protein (OBPIIa) Gene. Nutrients 2021, 13. [Google Scholar] [CrossRef]
  79. Steinbach, S.; Proft, F.; Schulze-Koops, H.; Hundt, W.; Heinrich, P.; Schulz, S.; Gruenke, M. Gustatory and olfactory function in rheumatoid arthritis. Scandinavian journal of rheumatology 2011, 40, 169–177. [Google Scholar] [CrossRef]
  80. Steinbach, S.; Reindl, W.; Dempfle, A.; Schuster, A.; Wolf, P.; Hundt, W.; Huber, W. Smell and taste in inflammatory bowel disease. PloS one 2013, 8, e73454. [Google Scholar] [CrossRef]
  81. Steinbach, S.; Reindl, W.; Kessel, C.; Ott, R.; Zahnert, T.; Hundt, W.; Heinrich, P.; Saur, D.; Huber, W. Olfactory and gustatory function in irritable bowel syndrome. Eur Arch Otorhinolaryngol 2010, 267, 1081–1087. [Google Scholar] [CrossRef]
  82. Sun, C.; Tang, K.; Wu, J.; Xu, H.; Zhang, W.; Cao, T.; Zhou, Y.; Yu, T.; Li, A. Leptin modulates olfactory discrimination and neural activity in the olfactory bulb. Acta physiologica (Oxford, England) 2019, 227, e13319. [Google Scholar] [CrossRef] [PubMed]
  83. Tekeli, H.; Senol, M.G.; Altundag, A.; Yalcınkaya, E.; Kendirli, M.T.; Yaşar, H.; Salihoglu, M.; Saglam, O.; Cayonu, M.; Cesmeci, E.; et al. Olfactory and gustatory dysfunction in Myasthenia gravis: A study in Turkish patients. Journal of the neurological sciences 2015, 356, 188–192. [Google Scholar] [CrossRef] [PubMed]
  84. Tschöp, M.; Weyer, C.; Tataranni, P.A.; Devanarayan, V.; Ravussin, E.; Heiman, M.L. Circulating ghrelin levels are decreased in human obesity. Diabetes 2001, 50, 707–709. [Google Scholar] [CrossRef] [PubMed]
  85. Velluzzi, F.; Deledda, A.; Lombardo, M.; Fosci, M.; Crnjar, R.; Grossi, E.; Sollai, G. Application of Artificial Neural Networks (ANN) to Elucidate the Connections among Smell, Obesity with Related Metabolic Alterations, and Eating Habit in Patients with Weight Excess. Metabolites 2023, 13, 206. [Google Scholar] [CrossRef] [PubMed]
  86. Velluzzi, F.; Deledda, A.; Onida, M.; Loviselli, A.; Crnjar, R.; Sollai, G. Relationship between Olfactory Function and BMI in Normal Weight Healthy Subjects and Patients with Overweight or Obesity. Nutrients 2022, 14, 1262. [Google Scholar] [CrossRef] [PubMed]
  87. Walliczek-Dworschak, U.; Wendler, J.; Khan, T.; Aringer, M.; Hähner, A.; Hummel, T. Chemosensory function is decreased in rheumatoid arthritis. Eur Arch Otorhinolaryngol 2020, 277, 1675–1680. [Google Scholar] [CrossRef]
  88. Wilson, R.S.; Arnold, S.E.; Schneider, J.A.; Boyle, P.A.; Buchman, A.S.; Bennett, D.A. Olfactory impairment in presymptomatic Alzheimer’s disease. Annals of the New York Academy of Sciences 2009, 1170, 730–735. [Google Scholar] [CrossRef]
  89. Wilson, R.S.; Schneider, J.A.; Arnold, S.E.; Tang, Y.; Boyle, P.A.; Bennett, D.A. Olfactory Identification and Incidence of Mild Cognitive Impairment in Older Age. Archives of General Psychiatry 2007, 64, 802–808. [Google Scholar] [CrossRef]
  90. Brattoli, M.; Cisternino, E.; Dambruoso, P.R.; de Gennaro, G.; Giungato, P.; Mazzone, A.; Palmisani, J.; Tutino, M. Gas chromatography analysis with olfactometric detection (GC-O) as a useful methodology for chemical characterization of odorous compounds. Sensors (Basel, Switzerland) 2013, 13, 16759–16800. [Google Scholar] [CrossRef]
  91. d’Acampora Zellner, B.; Dugo, P.; Dugo, G.; Mondello, L. Gas chromatography-olfactometry in food flavour analysis. J Chromatogr A 2008, 1186, 123–143. [Google Scholar] [CrossRef]
  92. Dussort, P.; Depretre, N.; Bou-Maroun, E.; Fant, C.; GUICHARD, E.; Brunerie, P.; Le Fur, Y., Y.; Le Quéré, J.-L. An original approach for gas chromatography-olfactometry detection frequency analysis: Application to gin. Food Research International 2012, 49, 253–262. [Google Scholar] [CrossRef]
  93. Plutowska, B.; Wardencki, W. Application of gas chromatography–olfactometry (GC–O) in analysis and quality assessment of alcoholic beverages – A review. Food Chemistry 2008, 107, 449–463. [Google Scholar] [CrossRef]
  94. Pollien, P.; Ott, A.; Montigon, F.; Baumgartner, M.; Muñoz-Box, R.; Chaintreau, A. Hyphenated Headspace-Gas Chromatography-Sniffing Technique:  Screening of Impact Odorants and Quantitative Aromagram Comparisons. Journal of agricultural and food chemistry 1997, 45, 2630–2637. [Google Scholar] [CrossRef]
  95. Hummel, T.; Sekinger, B.; Wolf, S.R.; Pauli, E.; Kobal, G. ‘Sniffin’ sticks’: olfactory performance assessed by the combined testing of odor identification, odor discrimination and olfactory threshold. Chem Senses 1997, 22, 39–52. [Google Scholar] [CrossRef]
  96. Hummel, T.; Kobal, G.; Gudziol, H.; Mackay-Sim, A. Normative data for the “Sniffin’ Sticks” including tests of odor identification, odor discrimination, and olfactory thresholds: an upgrade based on a group of more than 3,000 subjects. Eur Arch Otorhinolaryngol 2007, 264, 237–243. [Google Scholar] [CrossRef]
  97. Fischer, M.; Zopf, Y.; Elm, C.; Pechmann, G.; Hahn, E.G.; Schwab, D.; Kornhuber, J.; Thuerauf, N.J. Subjective and objective olfactory abnormalities in Crohn’s disease. Chem Senses 2014, 39, 529–538. [Google Scholar] [CrossRef]
  98. Rizzolo, A.; Polesello, A.; Polesello, S. Use of headspace capillary GC to study the development of volatile compounds in fresh fruit. Journal of High Resolution Chromatography 1992, 15, 472–477. [Google Scholar] [CrossRef]
  99. van Den Dool, H.; Dec. Kratz, P. A generalization of the retention index system including linear temperature programmed gas—liquid partition chromatography. Journal of Chromatography A 1963, 11, 463–471. [Google Scholar] [CrossRef] [PubMed]
  100. Akiyama, M.; Murakami, K.; Ohtani, N.; Iwatsuki, K.; Sotoyama, K.; Wada, A.; Tokuno, K.; Iwabuchi, H.; Tanaka, K. Analysis of volatile compounds released during the grinding of roasted coffee beans using solid-phase microextraction. Journal of agricultural and food chemistry 2003, 51, 1961–1969. [Google Scholar] [CrossRef]
  101. Caporaso, N.; Whitworth, M.B.; Cui, C.; Fisk, I.D. Variability of single bean coffee volatile compounds of Arabica and robusta roasted coffees analysed by SPME-GC-MS. Food research international (Ottawa, Ont.) 2018, 108, 628–640. [Google Scholar] [CrossRef]
  102. Gloess, A.N.; Yeretzian, C.; Knochenmuss, R.; Groessl, M. On-line analysis of coffee roasting with ion mobility spectrometry–mass spectrometry (IMS–MS). International Journal of Mass Spectrometry 2018, 424, 49–57. [Google Scholar] [CrossRef]
  103. Lee, S.; Kim, M.; Lee, K.-G. Effect of reversed coffee grinding and roasting process on physicochemical properties including volatile compound profiles. Innovative Food Science & Emerging Technologies 2017, 44. [Google Scholar]
  104. López-Galilea, I.; Fournier, N.; Cid, C.; Guichard, E. Changes in headspace volatile concentrations of coffee brews caused by the roasting process and the brewing procedure. Journal of agricultural and food chemistry 2006, 54, 8560–8566. [Google Scholar] [CrossRef]
  105. Majcher, M.A.; Klensporf-Pawlik, D.; Dziadas, M.; Jeleń, H.H. Identification of aroma active compounds of cereal coffee brew and its roasted ingredients. Journal of agricultural and food chemistry 2013, 61, 2648–2654. [Google Scholar] [CrossRef]
  106. Sunarharum, W.; Williams, D.; Smyth, H. Complexity of coffee flavor: A compositional and sensory perspective. Food Research International 2014, 62, 315–325. [Google Scholar] [CrossRef]
  107. Yang, N.; Liu, C.; Liu, X.; Degn, T.K.; Munchow, M.; Fisk, I. Determination of volatile marker compounds of common coffee roast defects. Food Chemistry 2016, 211, 206–214. [Google Scholar] [CrossRef] [PubMed]
  108. Zapata, J.; Londoño, V.; Naranjo, M.; Osorio, J.; Lopez, C.; Quintero, M. Characterization of aroma compounds present in an industrial recovery concentrate of coffee flavour. CyTA - Journal of Food 2018, 16, 367–372. [Google Scholar] [CrossRef]
  109. Gonzalez-Kristeller, D.C.; do Nascimento, J.B.; Galante, P.A.; Malnic, B. Identification of agonists for a group of human odorant receptors. Frontiers in pharmacology 2015, 6, 35. [Google Scholar] [CrossRef]
  110. Julliard, A.K.; Al Koborssy, D.; Fadool, D.A.; Palouzier-Paulignan, B. Nutrient Sensing: Another Chemosensitivity of the Olfactory System. Frontiers in physiology 2017, 8, 468. [Google Scholar] [CrossRef]
  111. Sollai, G.; Biolchini, M.; Crnjar, R. Taste receptor plasticity in relation to feeding history in two congeneric species of Papilionidae (Lepidoptera). Journal of insect physiology 2018, 107, 41–56. [Google Scholar] [CrossRef]
  112. Gaillard, I.; Rouquier, S.; Giorgi, D. Olfactory receptors. Cellular and molecular life sciences : CMLS 2004, 61, 456–469. [Google Scholar] [CrossRef] [PubMed]
  113. Gaillard, I.; Rouquier, S.; Pin, J.P.; Mollard, P.; Richard, S.; Barnabé, C.; Demaille, J.; Giorgi, D. A single olfactory receptor specifically binds a set of odorant molecules. The European journal of neuroscience 2002, 15, 409–418. [Google Scholar] [CrossRef] [PubMed]
  114. Gerkin, R.C.; Castro, J.B. The number of olfactory stimuli that humans can discriminate is still unknown. eLife 2015, 4, e08127. [Google Scholar] [CrossRef] [PubMed]
  115. Malnic, B.; Godfrey, P.A.; Buck, L.B. The human olfactory receptor gene family. Proceedings of the National Academy of Sciences of the United States of America 2004, 101, 2584. [Google Scholar] [CrossRef]
  116. Malnic, B.; Hirono, J.; Sato, T.; Buck, L.B. Combinatorial receptor codes for odors. Cell 1999, 96, 713–723. [Google Scholar] [CrossRef]
  117. Mombaerts, P. Odorant receptor gene choice in olfactory sensory neurons: the one receptor-one neuron hypothesis revisited. Current opinion in neurobiology 2004, 14, 31–36. [Google Scholar] [CrossRef]
  118. Mombaerts, P.; Wang, F.; Dulac, C.; Chao, S.K.; Nemes, A.; Mendelsohn, M.; Edmondson, J.; Axel, R. Visualizing an olfactory sensory map. Cell 1996, 87, 675–686. [Google Scholar] [CrossRef]
  119. Shepherd, G.M. Outline of a theory of olfactory processing and its relevance to humans. Chem Senses 2005, 30 Suppl 1, i3–5. [Google Scholar] [CrossRef]
  120. Larsson, M.; Finkel, D.; Pedersen, N.L. Odor identification: influences of age, gender, cognition, and personality. The journals of gerontology. Series B, Psychological sciences and social sciences 2000, 55, P304–310. [Google Scholar] [CrossRef]
  121. Cornell Kärnekull, S.; Jönsson, F.U.; Willander, J.; Sikström, S.; Larsson, M. Long-Term Memory for Odors: Influences of Familiarity and Identification Across 64 Days. Chemical Senses 2015, 40, 259–267. [Google Scholar] [CrossRef]
  122. Schaal, B.; Marlier, L.; Soussignan, R. Olfactory function in the human fetus: evidence from selective neonatal responsiveness to the odor of amniotic fluid. Behavioral neuroscience 1998, 112, 1438–1449. [Google Scholar] [CrossRef]
  123. Le Fur, Y.; Mercurio, V.; Moio, L.; Blanquet, J.; Meunier, J.M. A new approach to examine the relationships between sensory and gas chromatography-olfactometry data using Generalized Procrustes analysis applied to six French Chardonnay wines. Journal of agricultural and food chemistry 2003, 51, 443–452. [Google Scholar] [CrossRef] [PubMed]
  124. van Ruth, S.M.; O’Connor, C.H. Evaluation of three gas chromatography-olfactometry methods: comparison of odour intensity-concentration relationships of eight volatile compounds with sensory headspace data. Food Chemistry 2001, 74, 341–347. [Google Scholar] [CrossRef]
  125. Fadool, D.A.; Tucker, K.; Perkins, R.; Fasciani, G.; Thompson, R.N.; Parsons, A.D.; Overton, J.M.; Koni, P.A.; Flavell, R.A.; Kaczmarek, L.K. Kv1.3 channel gene-targeted deletion produces “Super-Smeller Mice” with altered glomeruli, interacting scaffolding proteins, and biophysics. Neuron 2004, 41, 389–404. [Google Scholar] [CrossRef] [PubMed]
  126. Guthoff, M.; Tschritter, O.; Berg, D.; Liepelt, I.; Schulte, C.; Machicao, F.; Haering, H.U.; Fritsche, A. Effect of genetic variation in Kv1.3 on olfactory function. Diabetes/metabolism research and reviews 2009, 25, 523–527. [Google Scholar] [CrossRef]
  127. Tucker, K.; Cavallin, M.A.; Jean-Baptiste, P.; Biju, K.C.; Overton, J.M.; Pedarzani, P.; Fadool, D.A. The Olfactory Bulb: A Metabolic Sensor of Brain Insulin and Glucose Concentrations via a Voltage-Gated Potassium Channel. Results and problems in cell differentiation 2010, 52, 147–157. [Google Scholar]
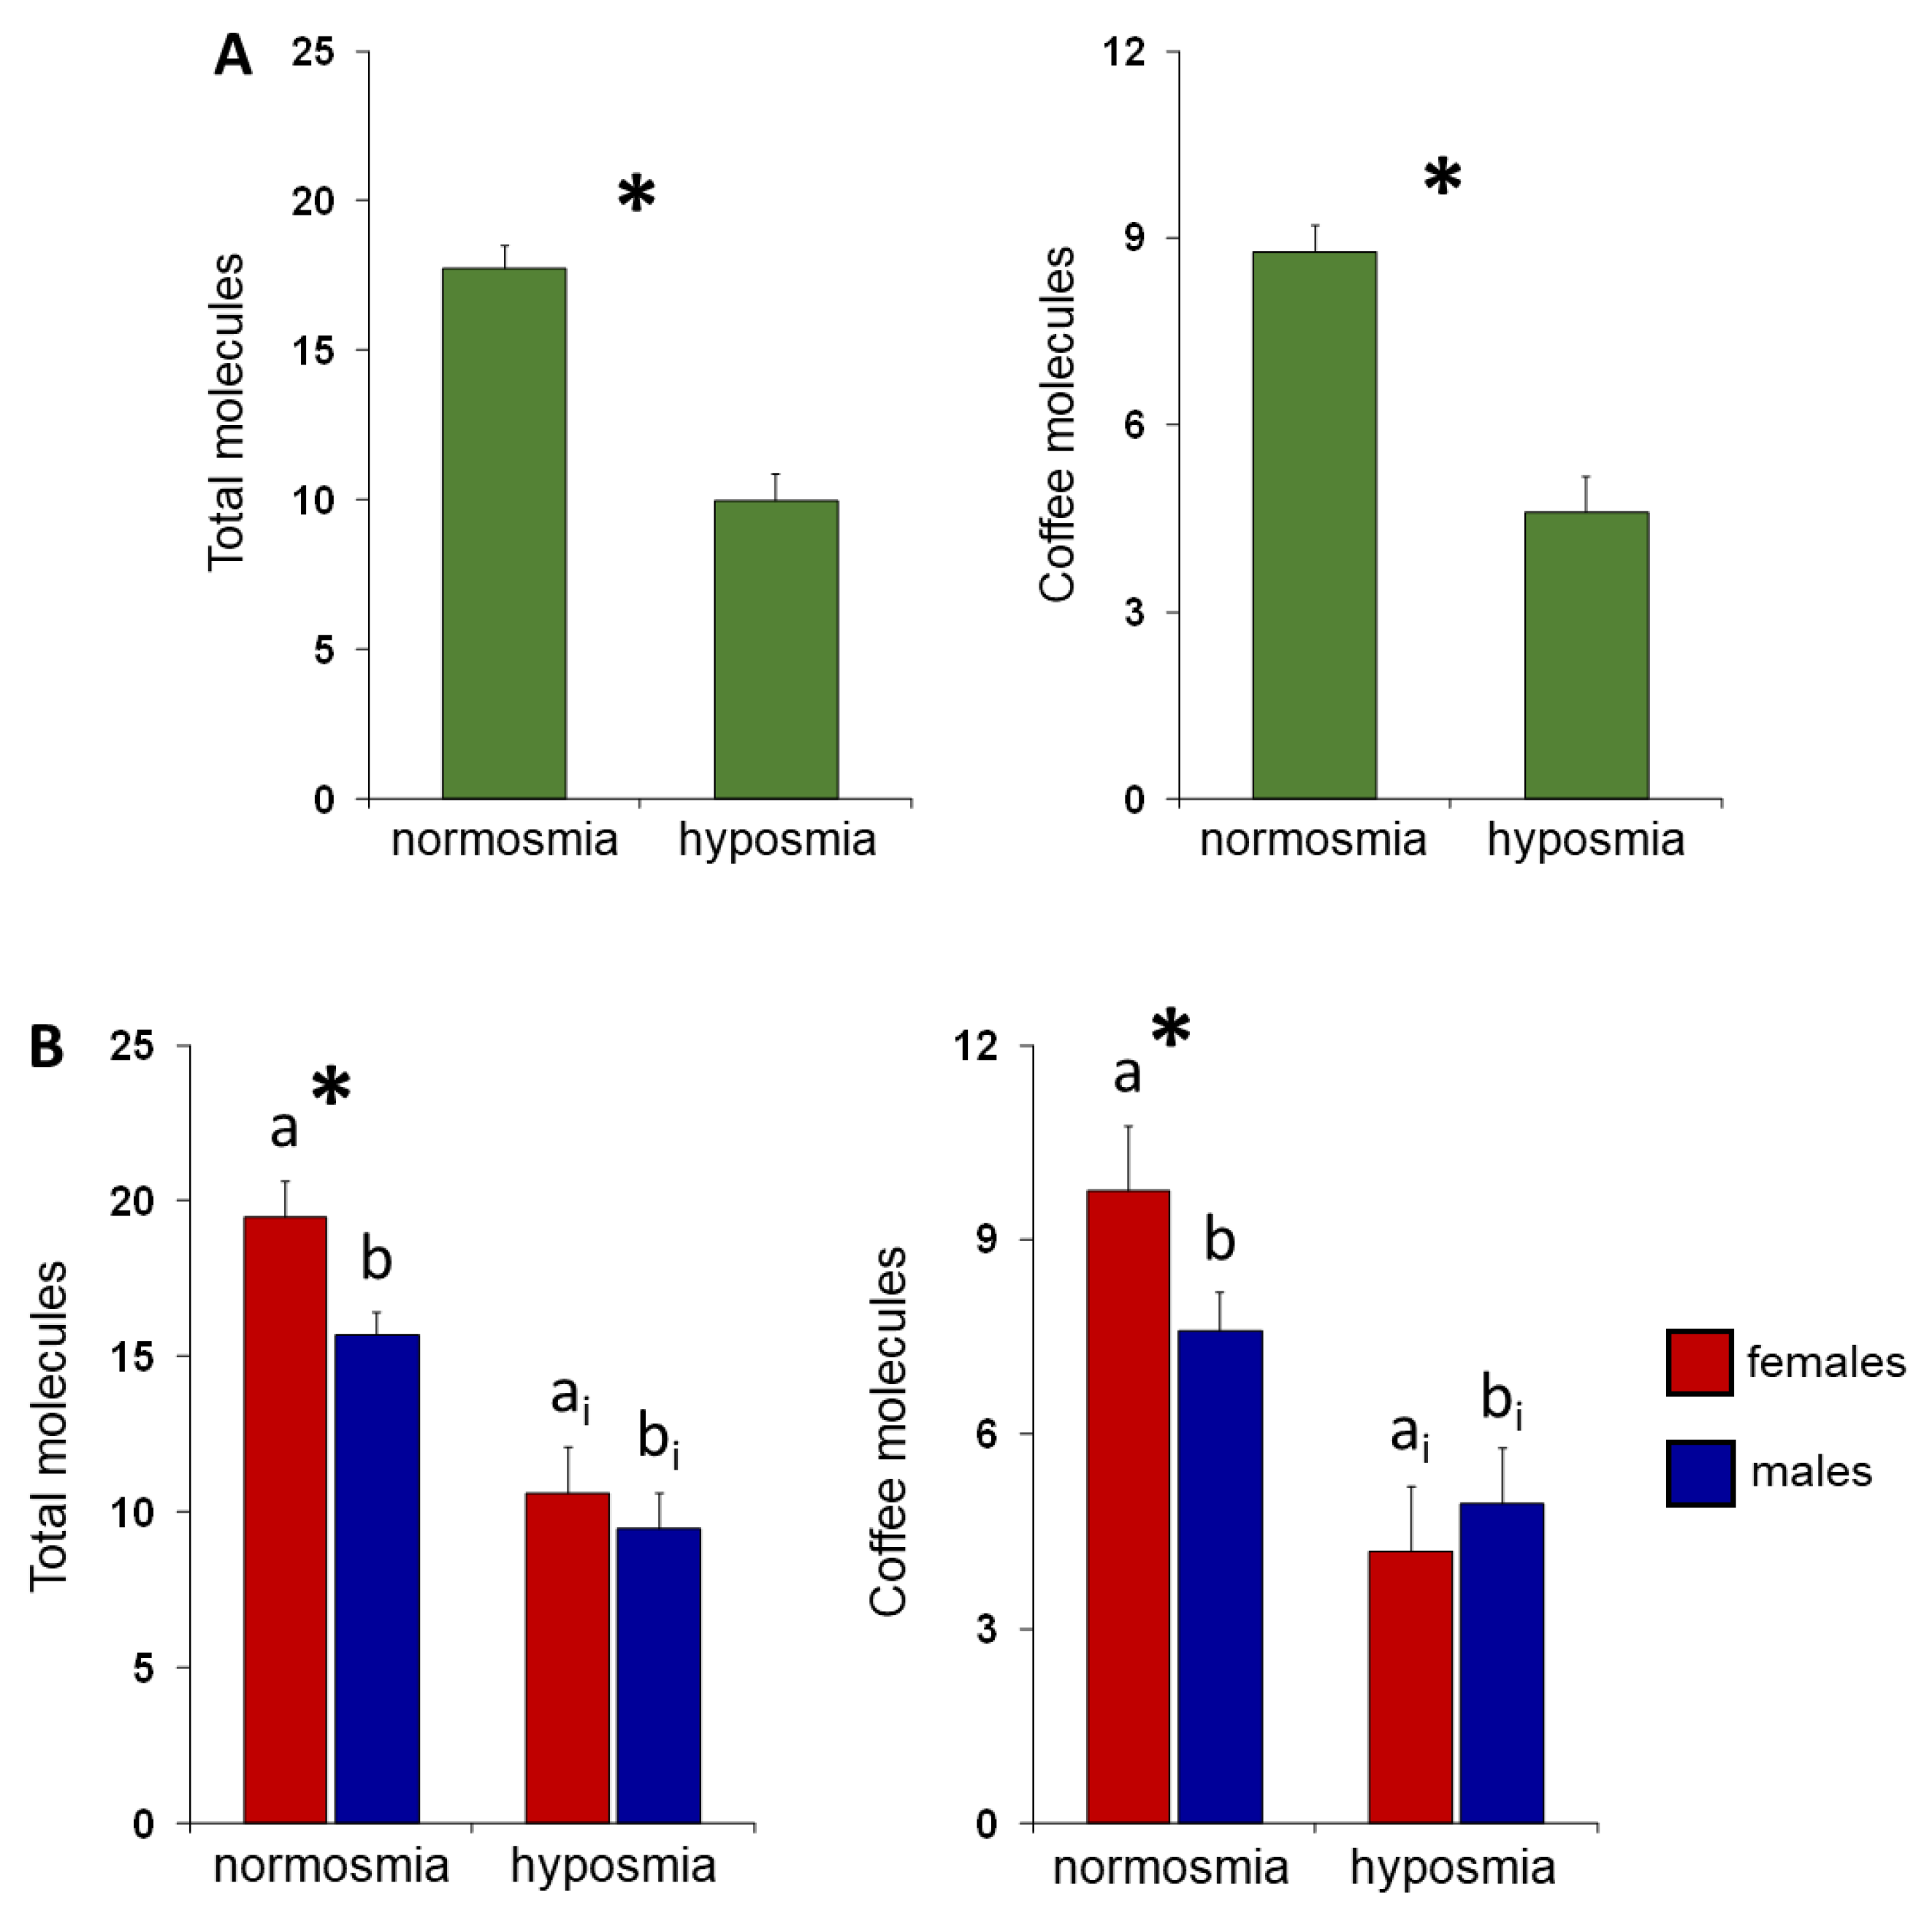
Figure 1. Effect of the TDI olfactory status on the ability to perceive single molecules. (A) Mean values ± SE of the number of total- and coffee-molecules smelled during the GC-O experiments by subjects, according to their TDI olfactory status. * Indicates significant differences between individuals with normosmia or hyposmia (p < 0.0001; Fisher’s LSD test subsequent to one-way ANOVA). (B) Mean values ± SE of the number of total and coffee molecules smelled during the GC-O experiments by females and males, according to their TDI olfactory status. Different letters indicate significant differences between individuals with normosmia or hyposmia (females: a-ai; males: b-bi; p < 0.01; Fisher’s LSD test subsequent to one-way ANOVA). * Indicates significant differences between females and males within the same TDI olfactory status (p ≤ 0.012; Fisher’s LSD test subsequent to one-way ANOVA).
Preprints 117512 g001
Figure 2. Relationship between TDI olfactory score and ability to perceive single molecules. Correlation analyses between TDI olfactory score and the number of total- and coffee-molecules smelled by subjects of both sexes together (A), only females (B) or only males (C).
Preprints 117512 g002
Figure 3. Relationship between Effect of the TDI olfactory status on the intensity perceived for coffee-odor pen. (A) Mean values ± SE of the intensity perceived for coffee-odor pen by subjects according to their TDI olfactory status. * Indicates significant differences between individuals with normosmia or hyposmia (p = 0.0002; Fisher’s LSD test subsequent to one-way ANOVA). (B) Mean values ± SE of the intensity perceived for coffee-odor pen by each female and male separately, according to their TDI olfactory status. Different letters indicate significant differences between individuals with normosmia or hyposmia (females: a-ai; males: b-bi; p < 0.01; Fisher’s LSD test subsequent to one-way ANOVA). * indicates significant differences between females and males within the same TDI olfactory status (p ≤ 0.027; Fisher’s LSD test subsequent to one-way ANOVA).
Preprints 117512 g003
Figure 4. Relationship between TDI olfactory status and intensity perceived for coffee-odor pen. Correlation analyses between the intensity perceived for coffee-odor pen by each female (A) and male (B).
Preprints 117512 g004
Figure 5. Relationship between the intensity perceived for coffee-odor pen and number of single molecules. Correlation analyses between the number of total- and coffee-molecules smelled and the intensity perceived for coffee-odor pen by each female (A) and male (B).
Preprints 117512 g005
Table 1. GC-O analysis of volatile compounds found in the headspace of roasted coffee beans: odor-active compounds and odor descriptions by subjects.
N. Odor-active compound Odor description df
(F-M)
1
2
3
4
5
6
7
8
9
10
11
12
13
14
15
16
17
18
19
20

21

22
23

24

25
26
27
28
29
30
31
32
33
34
35
36
37
38
39
40

41

42
43
44
45
46
47
48
49
50
Octane, 3,5-dimethyl-
Oxalic acid, isobutyl nonyl
ester
Toluene
β-Pinene
Ethylbenzene
p-Xylene
Oxalic acid, isobutyl pentyl
ester
Pyridine*
D-Limonene*
Furan,2-pentyl-*
Pyrazine, methyl-*
Acetoin
2-Propanone, 1-hydroxy-
Pyrazine, 2,5-dimethyl-*
Pyrazine, ethyl-*
Pyrazine, 2,3-dimethyl-*
DL-2,3-Butanediol*
Vinyl butyrate
Hex-4-yn-3-one, 2,2-dimethyl-
Pyrazine, 2-ethyl-6-methyl-*

Pyrazine, 2-ethyl-3-methyl-*

Pyrazine, 2-(n-propyl)-*
Pyrazine, 2,6-diethyl-*

Pyrazine, 3-ethyl-2,5-dimethyl-
*

2-Propanone, 1-(acetyloxy)-
Pyrazine, 2-ethyl-3,5-dimethyl-
*
Furfural*
Pyrazine, tetramethyl-
Pyrazine, 3,5-diethyl-2-methyl-
*
Pyrazine, 2-ethenyl-5-methyl-
Furan, 2-acetyl-*
2,3-Pentanedione*
2-Butanone, 1-(acetyloxy)-
2-Furanmethanol, acetate*
Pyrazine, 2-methyl-6-(2
-propenyl)-
2-Cyclopenten-1-one, 2,3-
dimethyl-
Acetic acid, diethyl-*
Pentanoic acid, 4-oxo-, methyl
ester
2-Furancarboxaldehyde, 5-
methyl-*
2-Furanmethanol, propanoate*

Furan, 2,2’-methylenebis-*

2-Furanmethanol*
Butanoic acid, 3-methyl-*
Furan, 2-(2-furanylmethyl)-5-
methyl-*
Pyrazine, 2-acetyl-6-methyl
4(H)-Pyridine, N-acetyl-*
Octaethylene glycol
monododecyl ether
2-Hexadecanol
N-Furfurylpyrrole*
2-Acetylpyrrole*
Woody, burnt, unknown
Burnt, unknown
Coffee, smoked, solvent, roasted, fruit
Sweet, floral, vanilla, herbs, incense,
sulfur, pungent
Petrol
Vanilla, medicinal, floral, gas, pungent
Floral, fruity, vanilla, sweet
Coffee, smoked, roasted, cheese
Sweet, sour, citrus
Smoked, plastic, herbs
Coffee, nutty, roasted, smoke, caramellic
Coffee, sweet, roasted, parfum, woody,
caramellic
Sweet, pungent, fish, solvent, wet, feet,
medicinal
Coffee, citrus, medicinal, sweet, cocoa,
shoes
Coffee, nutty, egg, pungent, shoes
Coffee, burnt, caramellic, fruity
Sweet, caramellic, rose, wet
Floral, parfum, bitter, solvent, pungent,
plastic
Sweet, solvent, pungent
Coffee, sweet, smoked, medicinal, solvent,
parfum, roasted, balsamic, fruit
Coffee, cocoa, solvent, bitter, nutty,
roasted, burnt, medicinal, solvent, herbs
Green, musty, woody, earthy, wet, herbs,
floral, fruit
Coffee, roasted, earthy, musty, burnt,
mushrooms,
vegetable
Coffee, nutty, roasted, floral, bitter,
woody, solvent, wet
Pungent, parfum, wet
Coffee, musty, roasted, wet, herbs, musty
Coffee, sweet, solvent, floral, pungent
Coffee, roasted, burnt, vanilla, bitter,
solvent
Floral, musty, wet, solvent, fresh
Coffee, nutty, bitter, plastic, earthy, musty
Parfum
Floral, earthy, sweat, musk, cheese,
pungent, woody
----------
Roasted, fruit, herb, woody, coffee,
vegetable, fish
Pungent, sour, bitter, herbs, spicy
Sweet, floral, lavender
Roasted, solvent, rotten, musty, wet earth,
coffee
Sweet, nutty
Coffee, sweet, parfum, solvent
Coffee, pungent, floral, musty, herb,
sweet, burnt, vegetable
Coffee, nutty, popcorn, roasted, fish, sour,
plastic, smoke
Coffee, smoke, popcorn, nutty, roasted,
sweet
Cheese, smoke, stinky feet, acidic, fruity,
putrid
Nutty, plastic, unknown
Putrid, musty, cheese, medicinal
Shoes, wet, sweat, plastic, cheese
Sweat, acidic
Cheese, musty, putrid, plastic, shoes,
burnt
Solvent, cheese, musty, coffee, caramellic,
smoked
Coffee, roasted, almond, sweet, burnt,
parfum, fresh, popcorn
0-3
2-1
14-6
6-6
0-1
4-5
5-3
14-3
1-6
3-3
3-5
10-10
7-15
7-10
4-2
4-3
2-4
5-4
2-3
19-25

24-22

18-16
23-21

18-16

6-3
17-19
15-6
13-13
11-20
15-11
2-0
26-24
0-0
22-12
8-1
3-1
20-13
5-2
5-4
14-9

22-12

22-12
14-19
1-2
4-6
9-7
2-2
24-23
16-20
25-15
Odor-active compounds: list of compounds eluted by the chromatographic column during GC-O experiments and smelled by at least two subjects who participated in the study. Odor description: specific description that each subject gave of the odor smelled during the GC-O experiment. df = detection frequency; number of females and males who smelled the compound. Volatile compounds described in literature as molecules smelling of coffee are listed in red print. Asterisk indicates molecules commonly found in the headspace of roasted coffee beans [100,101,102,103,104,105,106,107,108].
Table 2. GC-O analysis: sex-related differences for some odor-active compounds.
Molecule Perception
ability
F
n (%)
M
n (%)
p-Value
Toluene Yes 14 6 0.039
No 20 27
Pyridine Yes
No
14
20
3
30
0.003
D-limonene Yes
No
1
33
6
27
0.041
2-Propanone, 1-hydroxy- Yes
No
7
27
15
18
0.030
Furfural Yes
No
15
19
6
27
0.022
Pyrazine, 3,5-diethyl-2-methyl- Yes
No
11
23
20
13
0.020
2-Furanmethanol, acetate Yes
No
22
12
12
21
0.020
Pyrazine, 2-methyl-6-(2-propenyl)- Yes
No
8
26
1
32
0.014
Furan,2,2-methylenebis- Yes
No
22
12
12
21
0.020
2-Furanmethanol Yes
No
22
12
12
21
0.020
2-Acetylpyrrole Yes
No
25
9
15
18
0.019
Different distribution between Females (F) and Males (M) in their ability to perceive some molecules from the headspace of roasted coffee beans. p-Value derived from Fisher’s Exact Test. Females (n = 34), Males (n = 33). Volatile compounds described in literature as molecules smelling of coffee are listed in red print.
Disclaimer/Publisher’s Note: The statements, opinions and data contained in all publications are solely those of the individual author(s) and contributor(s) and not of MDPI and/or the editor(s). MDPI and/or the editor(s) disclaim responsibility for any injury to people or property resulting from any ideas, methods, instructions or products referred to in the content.
Copyright: This open access article is published under a Creative Commons CC BY 4.0 license, which permit the free download, distribution, and reuse, provided that the author and preprint are cited in any reuse.
Prerpints.org logo

Preprints.org is a free preprint server supported by MDPI in Basel, Switzerland.

Subscribe

© 2024 MDPI (Basel, Switzerland) unless otherwise stated