Submitted:
06 September 2024
Posted:
09 September 2024
You are already at the latest version
Abstract
Keywords:
1. Introduction
2. Materials and Methods
2.1. Lidar Description
2.2. Cloud Retrievals
2.3. Meteorological Retrievals
2.4. Cloud Classifications
3. Results
3.1. Occurrence and Statistical Characteristics of Cirrus Clouds
3.2. Cirrus Clustering
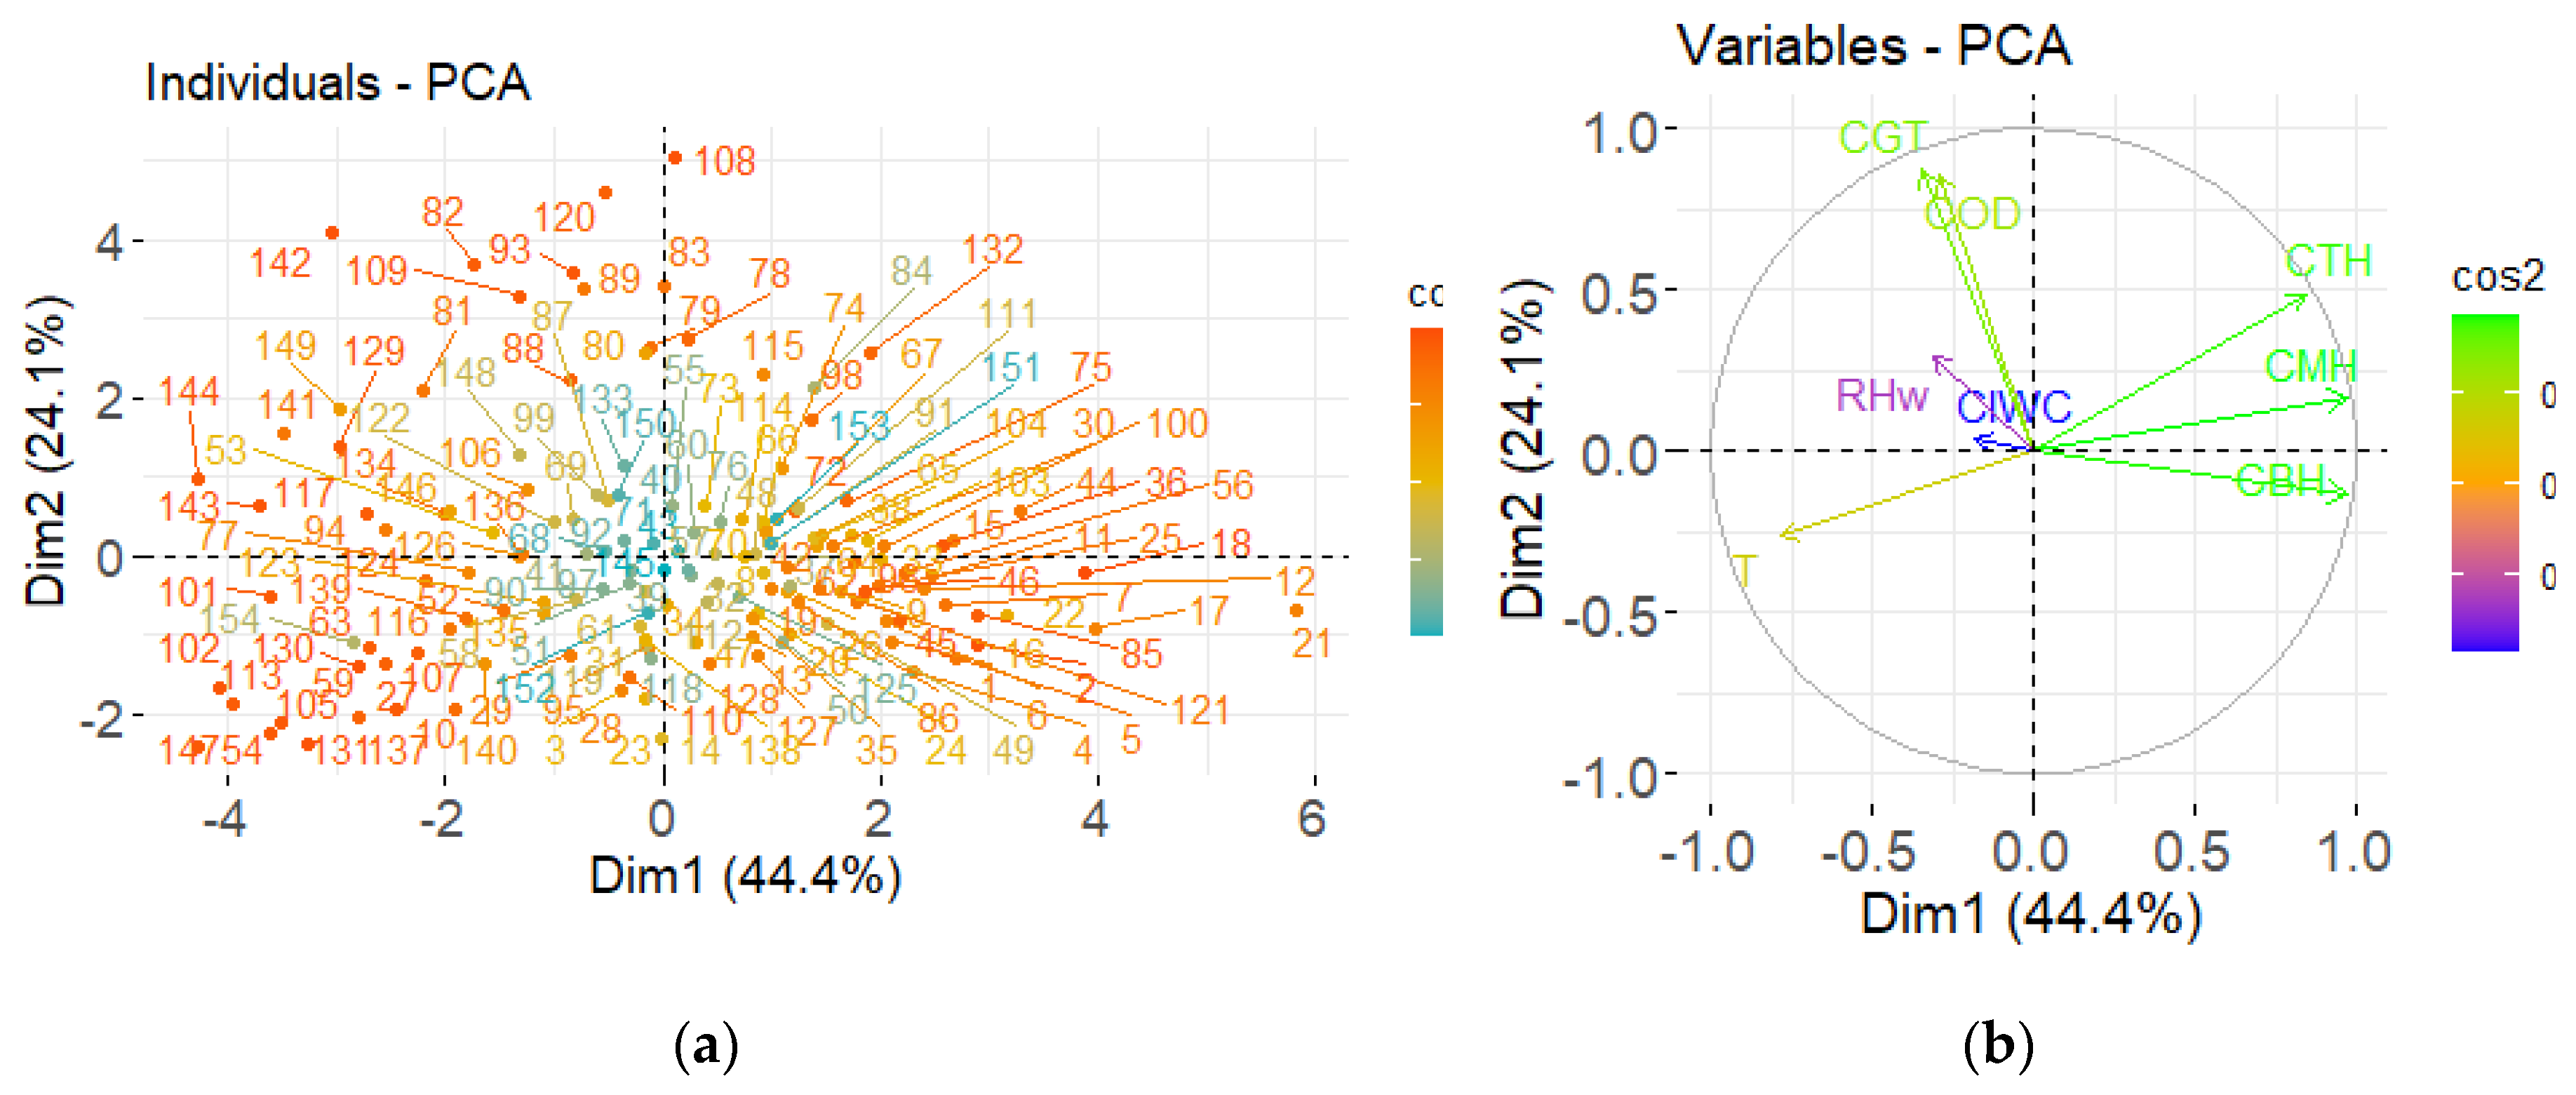
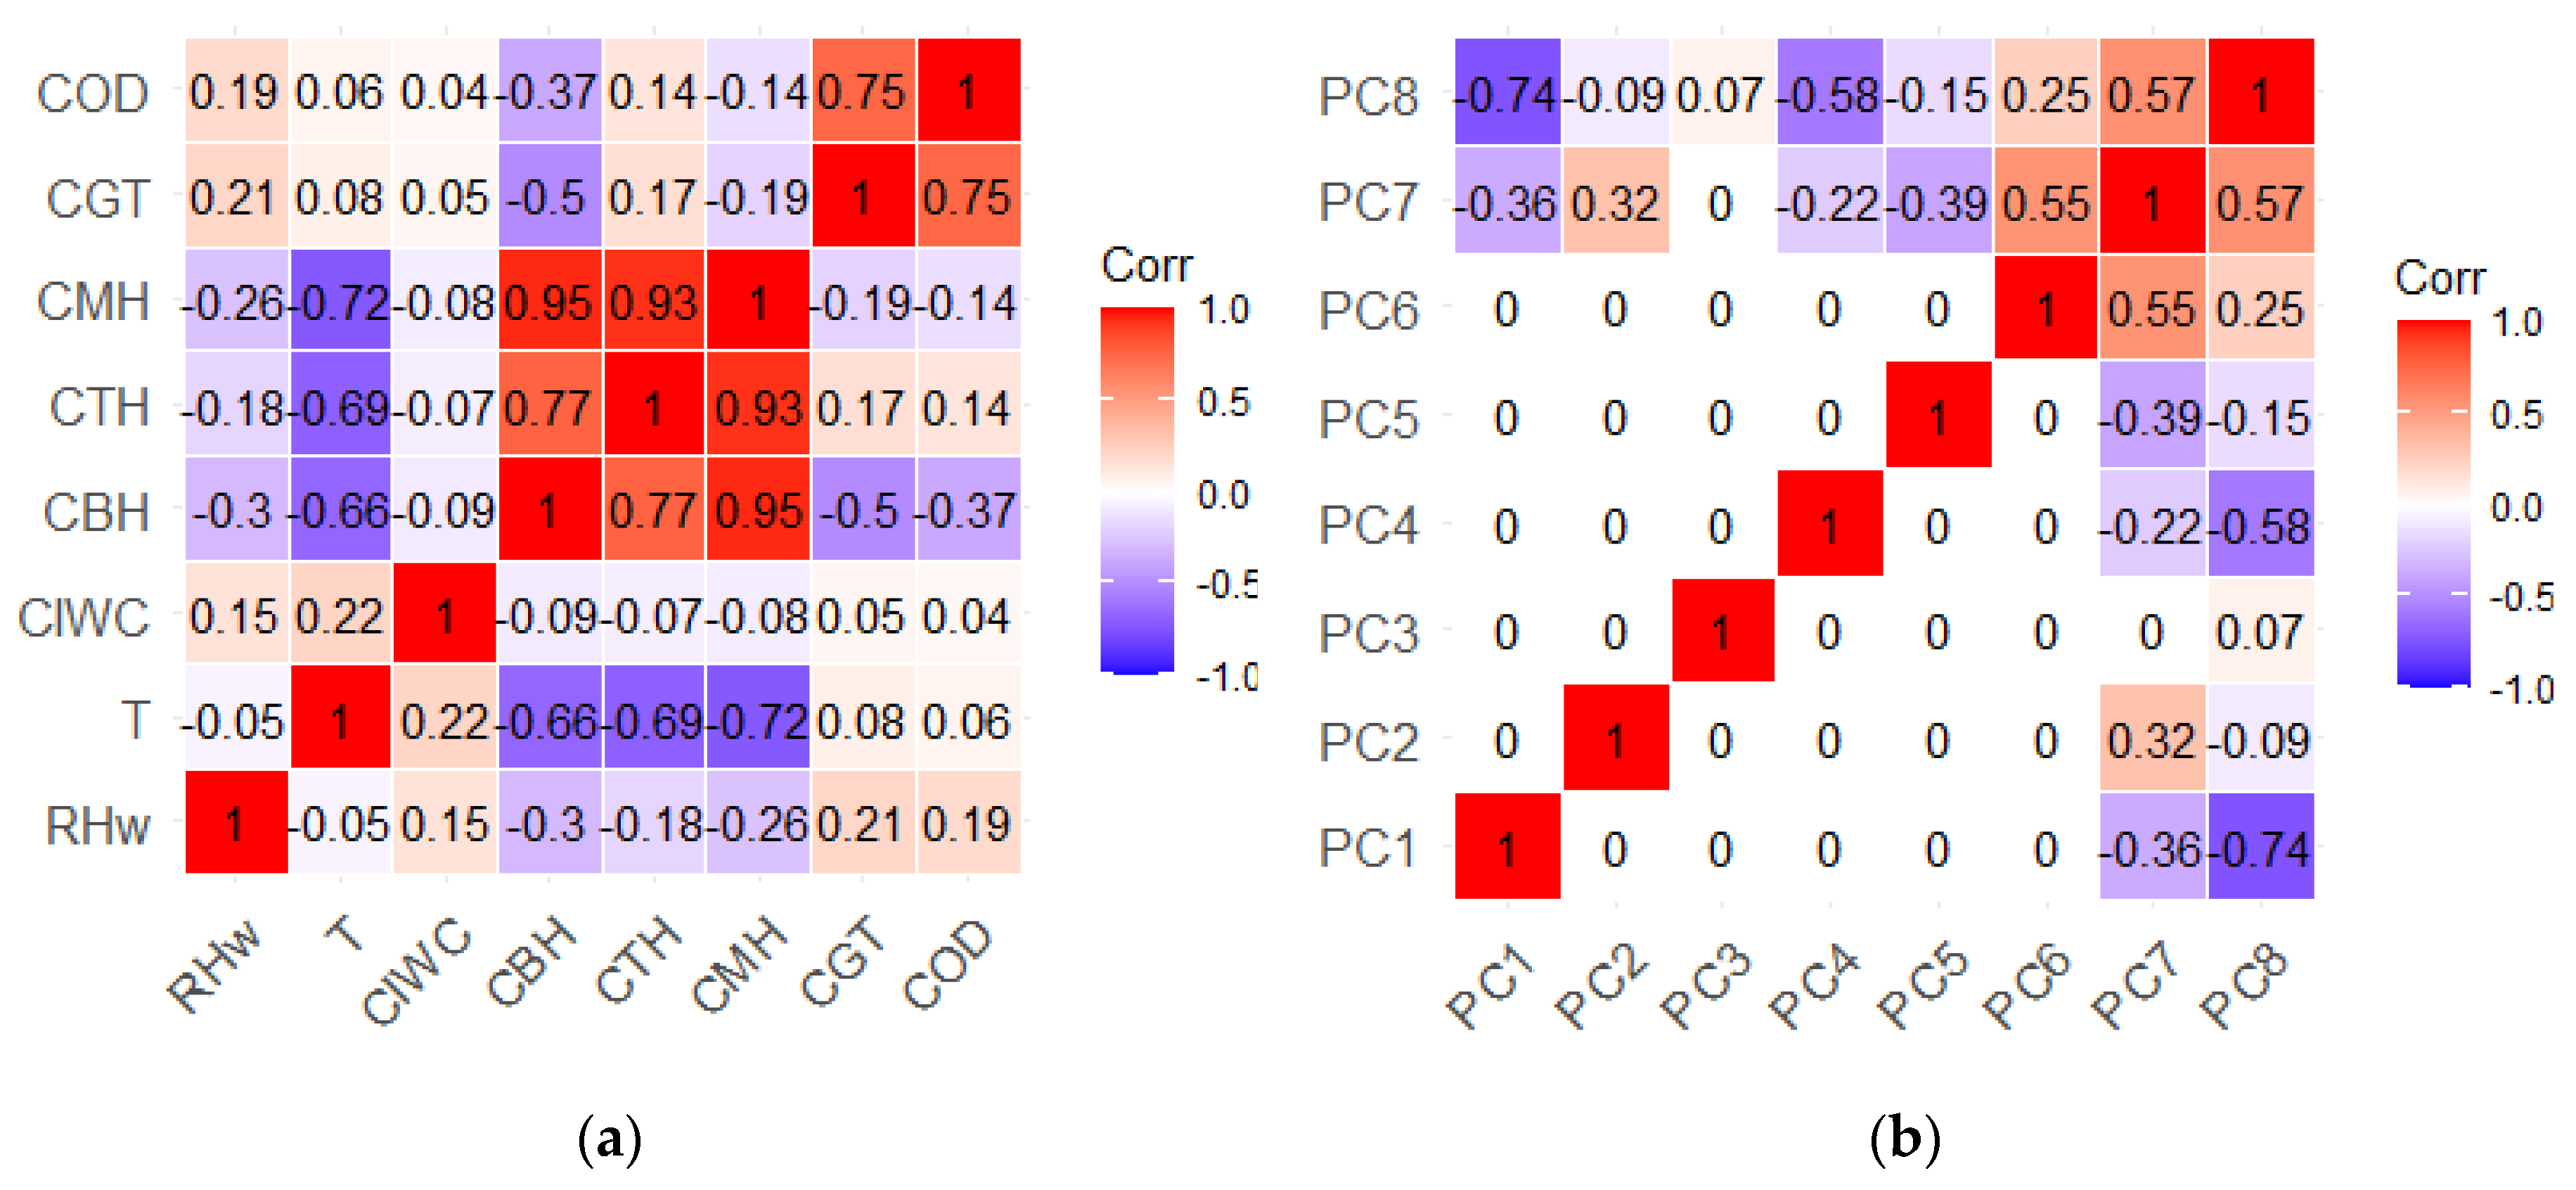
3.3. Principal Component Analysis - PCA
3.4. Clustering on PCs – Cirrus Classes
3.5. Optical Properties – Cirrus Groups
3.6. Seasonal Variations of the Cirrus Classes and Groups
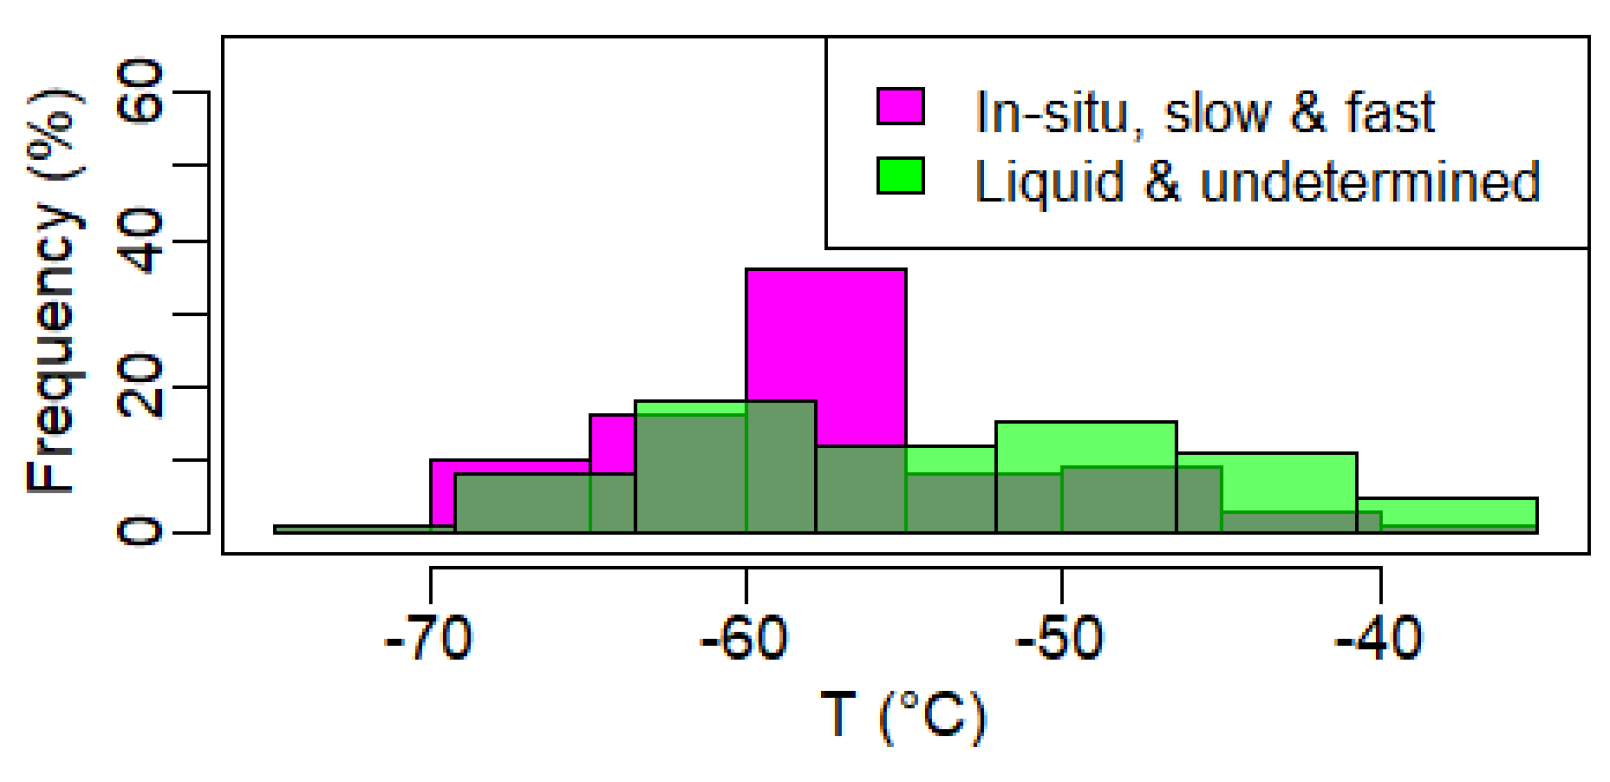
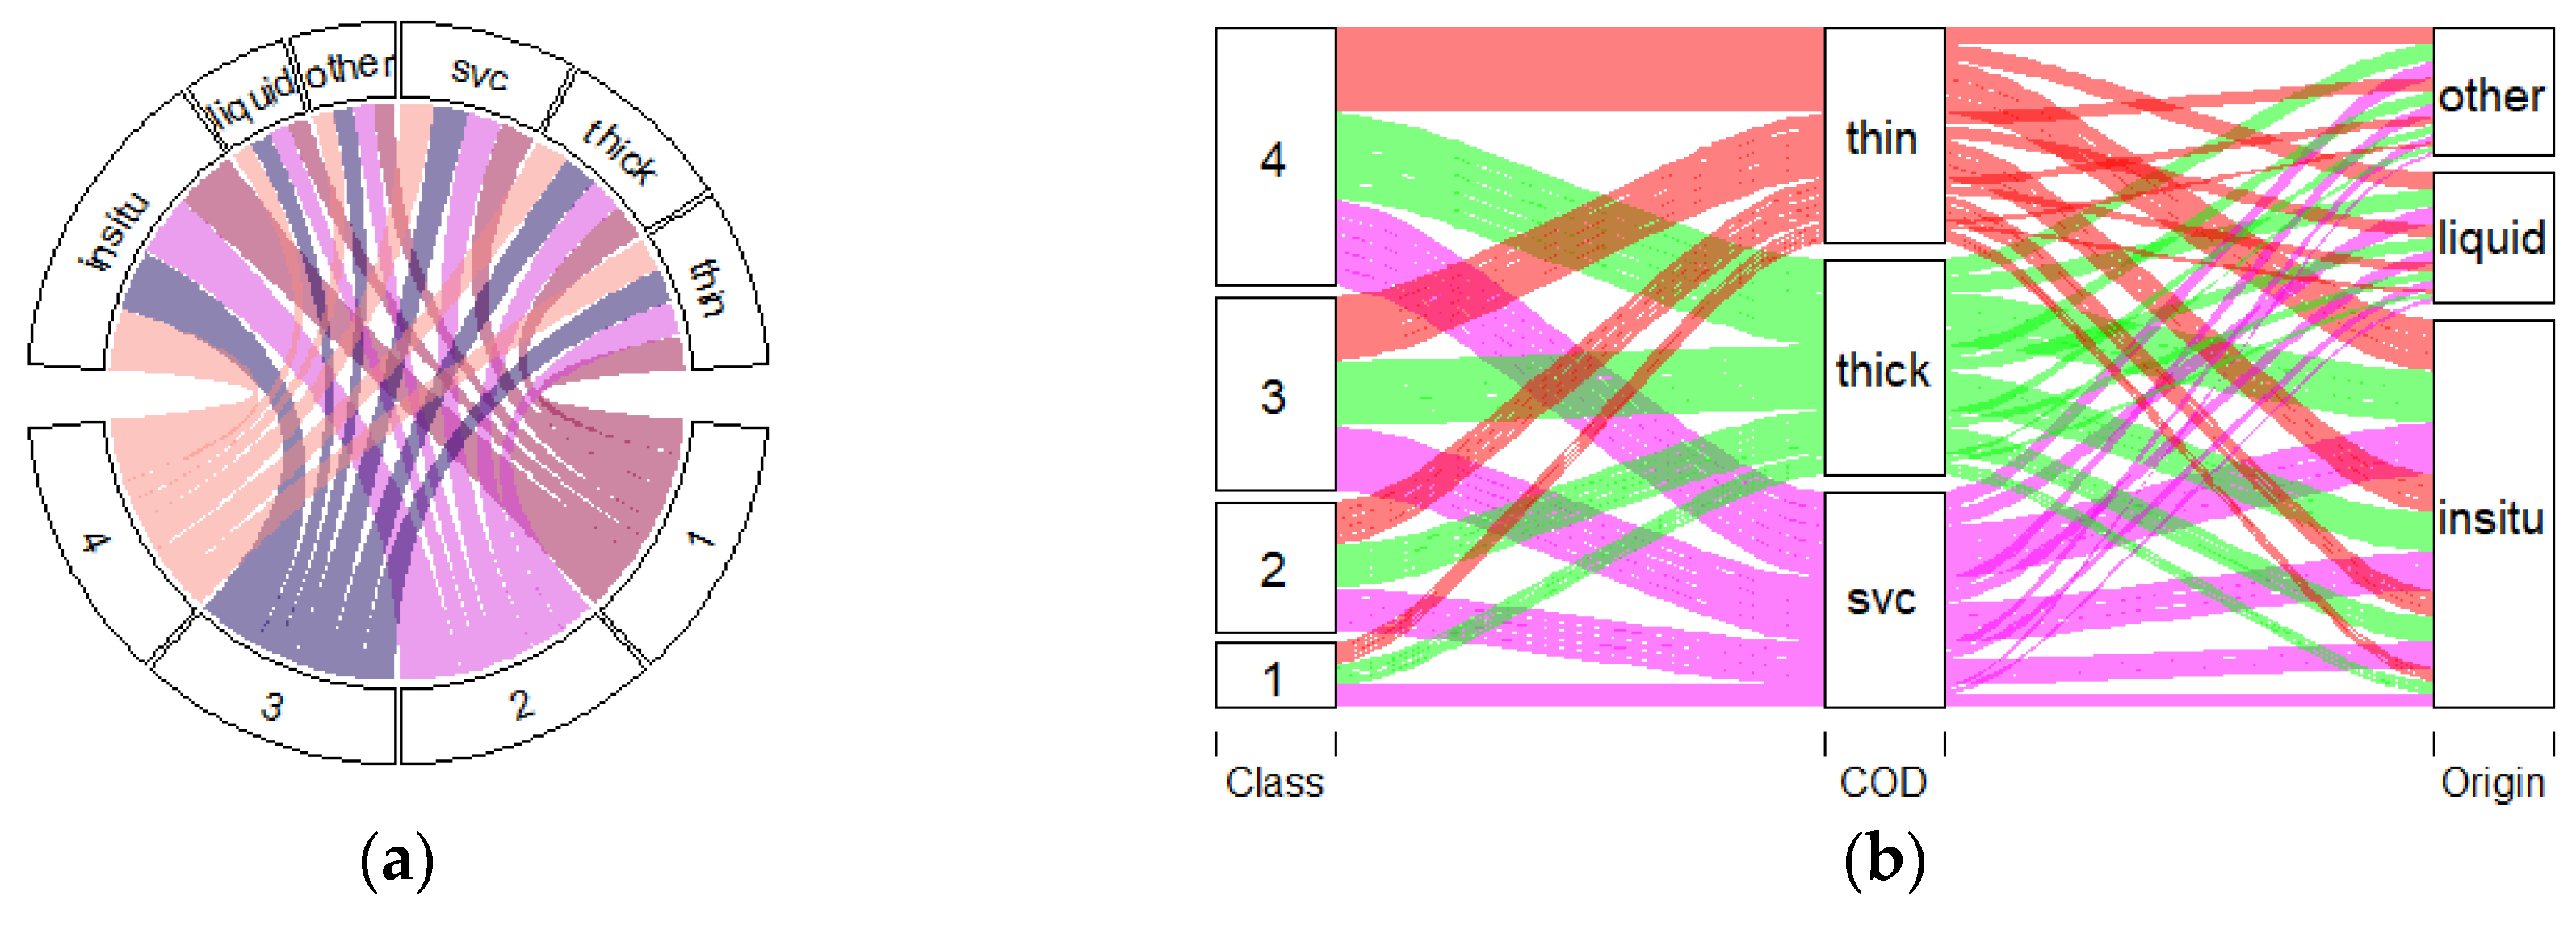
3.7. Categorization Based on the Cirrus Mechanism of Formation
4. Conclusions
Acknowledgments
References
- Sassen, K.; Wang, Z.; Liu, D. Global distribution of cirrus clouds from CloudSat/Cloud-Aerosol Lidar and Infrared Pathfinder Satellite Observations (CALIPSO) measurements. J. Geophys. Res. Atmos. 2008, 113, D00A12. [Google Scholar] [CrossRef]
- Li, Q.; Jiang, J.H.; Wu, D.L.; Read, W.G.; Livesey, N.J.; Waters, J.W.; Zhang, Y.; Wang, B.; Filipiak, M.J.; Davis, C.P.; et al. Convective outflow of South Asian pollution: A global CTM simulation compared with EOS MLS observations. Geophys. Res. Lett. 2005, 32. [Google Scholar] [CrossRef]
- Fu, R.; Hu, Y.; Wright, J.S.; Jiang, J.H.; Dickinson, R.E.; Chen, M.; Filipiak, M.; Read, W.G.; Waters, J.W.; Wu, D.L. Short circuit of water vapor and polluted air to the global stratosphere by convective transport over the Tibetan Plateau. Proc. Natl. Acad. Sci. 2006, 103, 5664–5669. [Google Scholar] [CrossRef]
- Jin, M. MODIS observed seasonal and interannual variations of atmospheric conditions associated with hydrological cycle over Tibetan Plateau. Geophys. Res. Lett. 2006, 33. [Google Scholar] [CrossRef]
- Chen, B.; Liu, X. Seasonal migration of cirrus clouds over the Asian Monsoon regions and the Tibetan Plateau measured from MODIS/Terra. Geophys. Res. Lett. 2005, 32. [Google Scholar] [CrossRef]
- Spichtinger, P.; Gierens, K.; Leiterer, U.; Dier, H. Ice supersaturation in the tropopause region over Lindenberg, Germany. Meteorol. Z. 2003, 12, 143–156. [Google Scholar] [CrossRef]
- Berry, E.; Mace, G.G. Cirrus Cloud Properties and the Large-Scale Meteorological Environment: Relationships Derived from A-Train and NCEP–NCAR Reanalysis Data. J. Appl. Meteorol. Clim. 2013, 52, 1253–1276. [Google Scholar] [CrossRef]
- Muhlbauer, A.; Ackerman, T.P.; Comstock, J.M.; Diskin, G.S.; Evans, S.M.; Lawson, R.P.; Marchand, R.T. Impact of large-scale dynamics on the microphysical properties of midlatitude cirrus. J. Geophys. Res. Atmos. 2014, 119, 3976–3996. [Google Scholar] [CrossRef]
- Wolf, K.; Bellouin, N.; Boucher, O. Long-term upper-troposphere climatology of potential contrail occurrence over the Paris area derived from radiosonde observations. Atmospheric Meas. Tech. 2023, 23, 287–309. [Google Scholar] [CrossRef]
- Voigt, C.; Schumann, U.; Minikin, A.; Abdelmonem, A.; Afchine, A.; Borrmann, S.; Boettcher, M.; Buchholz, B.; Bugliaro, L.; Costa, A.; et al. ML-CIRRUS: The Airborne Experiment on Natural Cirrus and Contrail Cirrus with the High-Altitude Long-Range Research Aircraft HALO. Bull. Am. Meteorol. Soc. 2017, 98, 271–288. [Google Scholar] [CrossRef]
- Krämer, M.; Rolf, C.; Spelten, N.; Afchine, A.; Fahey, D.; Jensen, E.; Khaykin, S.; Kuhn, T.; Lawson, P.; Lykov, A.; et al. A microphysics guide to cirrus – Part 2: Climatologies of clouds and humidity from observations. Atmospheric Meas. Tech. 2020, 20, 12569–12608. [Google Scholar] [CrossRef]
- Kim, Y.; Kim, S.-W.; Kim, M.-H.; Yoon, S.-C. Geometric and optical properties of cirrus clouds inferred from three-year ground-based lidar and CALIOP measurements over Seoul, Korea. Atmospheric Res. 2014, 139, 27–35. [Google Scholar] [CrossRef]
- Sassen, K.; Campbell, J.R. A Midlatitude Cirrus Cloud Climatology from the Facility for Atmospheric Remote Sensing. Part I: Macrophysical and Synoptic Properties. J. Atmospheric Sci. 2001, 58, 481–496. [Google Scholar] [CrossRef]
- Sassen, K. and Comstock, J. M.: A midlatitude cirrus cloud climatology from the facility for atmospheric remote sensing. Part III: Radiative properties, J. Atmos. Sci., 2001.b 58, 2113–2127.
- Desbois, M.; Seze, G.; Szejwach, G. Automatic Classification of Clouds on METEOSAT Imagery: Application to High-Level Clouds. J. Appl. Meteorol. 1982, 21, 401–412. [Google Scholar] [CrossRef]
- Krämer, M.; Rolf, C.; Luebke, A.; Afchine, A.; Spelten, N.; Costa, A.; Meyer, J.; Zöger, M.; Smith, J.; Herman, R.L.; et al. A microphysics guide to cirrus clouds – Part 1: Cirrus types. Atmospheric Meas. Tech. 2016, 16, 3463–3483. [Google Scholar] [CrossRef]
- Luebke, A.E.; Afchine, A.; Costa, A.; Grooß, J.-U.; Meyer, J.; Rolf, C.; Spelten, N.; Avallone, L.M.; Baumgardner, D.; Krämer, M. The origin of midlatitude ice clouds and the resulting influence on their microphysical properties. Atmospheric Meas. Tech. 2016, 16, 5793–5809. [Google Scholar] [CrossRef]
- Wernli, H.; Boettcher, M.; Joos, H.; Miltenberger, A.K.; Spichtinger, P. A trajectory-based classification of ERA-Interim ice clouds in the region of the North Atlantic storm track. Geophys. Res. Lett. 2016, 43, 6657–6664. [Google Scholar] [CrossRef]
- Gasparini, B.; Meyer, A.; Neubauer, D.; Münch, S.; Lohmann, U. Cirrus Cloud Properties as Seen by the CALIPSO Satellite and ECHAM-HAM Global Climate Model. J. Clim. 2018, 31, 1983–2003. [Google Scholar] [CrossRef]
- Urbanek, B.; Groß, S.; Schäfler, A.; Wirth, M. Determining stages of cirrus evolution: a cloud classification scheme. Atmospheric Meas. Tech. 2017, 10, 1653–1664. [Google Scholar] [CrossRef]
- Klett, J.D. Stable analytical inversion solution for processing lidar returns. Appl. Opt. 1981, 20, 211–220. [Google Scholar] [CrossRef]
- Fernald, F.G. Analysis of atmospheric lidar observations: some comments. Appl. Opt. 1984, 23, 652–653. [Google Scholar] [CrossRef] [PubMed]
- Ansmann, A.; Wandinger, U.; Riebesell, M.; Weitkamp, C.; Michaelis, W. Independent measurement of extinction and backscatter profiles in cirrus clouds by using a combined Raman elastic-backscatter lidar. Appl. Opt. 1992, 31, 7113–7131. [Google Scholar] [CrossRef] [PubMed]
- Ansmann, A., J. Bosenberg, G. Brogniez, S. Elouragini, P.H. Flamant, K. Klapheck, H. Linn, L. Menenger, W. Michaelis, M. Riebesell, C. Senif, P.H. Thro, U. Wanclinger, and C. Weitkamp, Lidar network observations of cirrus morphological and scattering properties during the International Cirrus Experiment 1989: J. App. Meteor., 1993, 3oe, 1608-1622.
- Gobbi, G.P.; Barnaba, F.; Ammannato, L. The vertical distribution of aerosols, Saharan dust and cirrus clouds in Rome (Italy) in the year 2001. Atmospheric Meas. Tech. 2004, 4, 351–359. [Google Scholar] [CrossRef]
- Granados-Muñoz, M.J.; Navas-Guzmán, F.; Bravo-Aranda, J.A.; Guerrero-Rascado, J.L.; Lyamani, H.; Valenzuela, A.; Titos, G.; Fernández-Gálvez, J.; Alados-Arboledas, L. Hygroscopic growth of atmospheric aerosol particles based on active remote sensing and radiosounding measurements: selected cases in southeastern Spain. Atmospheric Meas. Tech. 2015, 8, 705–718. [Google Scholar] [CrossRef]
- Comerón, A.; Muñoz-Porcar, C.; Rodríguez-Gómez, A.; Sicard, M.; Dios, F.; Gil-Díaz, C.; Oliveira, D.C.F.d.S.; Rocadenbosch, F. An explicit formulation for the retrieval of the overlap function in an elastic and Raman aerosol lidar. Atmospheric Meas. Tech. 2023, 16, 3015–3025. [Google Scholar] [CrossRef]
- Granados-Muñoz, M.J.; Sicard, M.; Papagiannopoulos, N.; Barragán, R.; Bravo-Aranda, J.A.; Nicolae, D. Two-dimensional mineral dust radiative effect calculations from CALIPSO observations over Europe. Atmospheric Meas. Tech. 2019, 19, 13157–13173. [Google Scholar] [CrossRef]
- Mandija, F.; Guerrero-Rascado, J.L.; Lyamani, H.; Granados-Muñoz, M.J.; Alados-Arboledas, L. Synergic estimation of columnar integrated aerosol properties and their vertical resolved profiles in respect to the scenarios of dust intrusions over Granada. Atmospheric Environ. 2016, 145, 439–454. [Google Scholar] [CrossRef]
- Mandija, F.; Markowicz, K.; Zawadzka, O. Characterization of aerosol events using synergistically column integrated optical aerosol properties and polarimetric measurements. J. Atmospheric Solar-Terrestrial Phys. 2016, 150-151, 9–20. [Google Scholar] [CrossRef]
- Giannakaki, E.; Balis, D.S.; Amiridis, V.; Kazadzis, S. Optical and geometrical characteristics of cirrus clouds over a Southern European lidar station. Atmospheric Meas. Tech. 2007, 7, 5519–5530. [Google Scholar] [CrossRef]
- Dionisi, D.; Keckhut, P.; Liberti, G.L.; Cardillo, F.; Congeduti, F. Midlatitude cirrus classification at Rome Tor Vergata through a multichannel Raman–Mie–Rayleigh lidar. Atmospheric Meas. Tech. 2013, 13, 11853–11868. [Google Scholar] [CrossRef]
- Kienast-Sjögren, E.; Rolf, C.; Seifert, P.; Krieger, U.K.; Luo, B.P.; Krämer, M.; Peter, T. Climatological and radiative properties of midlatitude cirrus clouds derived by automatic evaluation of lidar measurements. Atmospheric Meas. Tech. 2016, 16, 7605–7621. [Google Scholar] [CrossRef]
- Garcia, I.B.; Spang, R.; Ungermann, J.; Griessbach, S.; Krämer, M.; Höpfner, M.; Riese, M. Observation of cirrus clouds with GLORIA during the WISE campaign: detection methods and cirrus characterization. Atmospheric Meas. Tech. 2021, 14, 3153–3168. [Google Scholar] [CrossRef]
- Voigt, C.; Schumann, U.; Jessberger, P.; Jurkat, T.; Petzold, A.; Gayet, J.-F.; Krämer, M.; Thornberry, T.; Fahey, D.W. Extinction and optical depth of contrails. Geophys. Res. Lett. 2011, 38. [Google Scholar] [CrossRef]
- Gil-Díaz, C.; Sicard, M.; Comerón, A.; Oliveira, D.C.F.d.S.; Muñoz-Porcar, C.; Rodríguez-Gómez, A.; Lewis, J.R.; Welton, E.J.; Lolli, S. Geometrical and optical properties of cirrus clouds in Barcelona, Spain: analysis with the two-way transmittance method of 4 years of lidar measurements. Atmospheric Meas. Tech. 2024, 17, 1197–1216. [Google Scholar] [CrossRef]
- Goldfarb, L. , Keckhut, P. , Chanin, M.-L., and Hauchecorne, A.: Cirrus climatological results from lidar measurements at OHP (44_ N, 6_ E), Geophys. Res. Lett., 2001, 28, 1687–1690. [Google Scholar]
- Campbell, J.R.; Vaughan, M.A.; Oo, M.; Holz, R.E.; Lewis, J.R.; Welton, E.J. Distinguishing cirrus cloud presence in autonomous lidar measurements. Atmospheric Meas. Tech. 2015, 8, 435–449. [Google Scholar] [CrossRef]
- Eguchi, N.; Yokota, T.; Inoue, G. Characteristics of cirrus clouds from ICESat/GLAS observations. Geophys. Res. Lett. 2007, 34. [Google Scholar] [CrossRef]
- Dupont, J.; Haeffelin, M.; Morille, Y.; Noël, V.; Keckhut, P.; Winker, D.; Comstock, J.; Chervet, P.; Roblin, A. Macrophysical and optical properties of midlatitude cirrus clouds from four ground-based lidars and collocated CALIOP observations. J. Geophys. Res. Atmos. 2010, 115. [Google Scholar] [CrossRef]
- Hoareau, C. , Keckhut, P. , Noel, V., Chepfer, H., and Baray, J.-L.: A decadal cirrus clouds climatology from ground-based and spaceborne lidars above south of France (43.9◦ N–5.7◦ E), Atmos. Chem. Phys. Discuss., 2013, 13, 6379–6417. [Google Scholar] [CrossRef]
- Keckhut, P.; Hauchecorne, A.; Bekki, S.; Colette, A.; David, C.; Jumelet, J. Indications of thin cirrus clouds in the stratosphere at mid-latitudes. Atmospheric Meas. Tech. 2005, 5, 3407–3414. [Google Scholar] [CrossRef]
- Keckhut, P. , Borchi, F. , Bekki, S., Hauchecorne, A., and SiLaouina, M.: Cirrus classification at mid-latitude from systematic lidar observations, J. Appl. Meteorol. Clim., 2006, 45, 249–258. [Google Scholar]
- Keckhut, P. Perrin, J-M. Thuillier, G. Hoareau, C. Porteneuve, J. and Montouxc, N. Subgrid-scale cirrus observed by lidar at mid-latitude: variability effects of the cloud optical depth. Journal of Applied Remote Sensing, 2013, 073530-1 Vol. 7.
- Montoux, N.; Keckhut, P.; Hauchecorne, A.; Jumelet, J.; Brogniez, H.; David, C. Isentropic modeling of a cirrus cloud event observed in the midlatitude upper troposphere and lower stratosphere. J. Geophys. Res. Atmos. 2010, 115. [Google Scholar] [CrossRef]
- Lamquin, N.; Stubenrauch, C.J.; Gierens, K.; Burkhardt, U.; Smit, H. A global climatology of upper-tropospheric ice supersaturation occurrence inferred from the Atmospheric Infrared Sounder calibrated by MOZAIC. Atmospheric Meas. Tech. 2012, 12, 381–405. [Google Scholar] [CrossRef]
- Voudouri, K.A.; Giannakaki, E.; Komppula, M.; Balis, D. Variability in cirrus cloud properties using a PollyXT Raman lidar over high and tropical latitudes. Atmospheric Meas. Tech. 2020, 20, 4427–4444. [Google Scholar] [CrossRef]
- Gouveia, D.A.; Barja, B.; Barbosa, H.M.J.; Seifert, P.; Baars, H.; Pauliquevis, T.; Artaxo, P. Optical and geometrical properties of cirrus clouds in Amazonia derived from 1 year of ground-based lidar measurements. Atmospheric Meas. Tech. 2017, 17, 3619–3636. [Google Scholar] [CrossRef]
- He, Q.S.; Li, C.C.; Ma, J.Z.; Wang, H.Q.; Shi, G.M.; Liang, Z.R.; Luan, Q.; Geng, F.H.; Zhou, X.W. The Properties and Formation of Cirrus Clouds over the Tibetan Plateau Based on Summertime Lidar Measurements. J. Atmospheric Sci. 2013, 70, 901–915. [Google Scholar] [CrossRef]
- Lakkis, S.G.; Lavorato, M.; Canziani, P.; Lacomi, H. Lidar observations of cirrus clouds in Buenos Aires. J. Atmospheric Solar-Terrestrial Phys. 2015, 130-131, 89–95. [Google Scholar] [CrossRef]
- Nohra, R. , Parol, F. , and Dubuisson, P.: Comparison of Cirrus Cloud Characteristics as Estimated by A Micropulse Ground-Based Lidar and A Spaceborne Lidar CALIOP Datasets Over Lille, France (50.60 N, 3.14 E), EPJ Web Conf., 2016, 119, 16005. [Google Scholar]
- Seifert, P.; Ansmann, A.; Müller, D.; Wandinger, U.; Althausen, D.; Heymsfield, A.J.; Massie, S.T.; Schmitt, C. Cirrus optical properties observed with lidar, radiosonde, and satellite over the tropical Indian Ocean during the aerosol-polluted northeast and clean maritime southwest monsoon. J. Geophys. Res. Atmos. 2007, 112. [Google Scholar] [CrossRef]
- Yorks, J.E.; Hlavka, D.L.; Hart, W.D.; McGill, M.J. Statistics of Cloud Optical Properties from Airborne Lidar Measurements. J. Atmospheric Ocean. Technol. 2011, 28, 869–883. [Google Scholar] [CrossRef]
- Sherlock, V. , Garnier, A. , Hauchecorne, A., and Keckhut, P.: Implementation and validation of a Raman lidar measurement of middle and upper tropospheric water vapour, Appl. Opt., 1999, 38, 5838–5850. [Google Scholar]
- Khaykin S., S. Godin-Beekmann, A. Hauchecorne, J. Pelon, F. Ravetta, P. Keckhut, Stratospheric smoke layer with unprecedentedly high backscatter observed by lidars above southern france, Geophysical Research Letters, American Geophysical Union, 2018, 45 (3), pp.1639-1646. ⟨10.1002/2017GL076763⟩.
- Bucholtz, A. Rayleigh-scattering calculations for the terrestrial atmosphere. Appl. Opt. 1995, 34, 2765–2773. [Google Scholar] [CrossRef]
- Hoareau, C. , Keckhut, P. , Baray, J.-L., Sarkissian, A., and Durry, G.: Methodology for water monitoring in the upper troposphere with Raman lidar at Observatory of Haute-Provence, J. Atmos. Ocean. Technol., 2009, 26, 2149–2160. [Google Scholar]
- Lanzante J., R. : Resistant, robust and non-parametric techniques for the analysis of climate data: Theory and examples, including applications to historical radiosonde station data, Int. J. Climatol., 1996, 16, 1197–1226. [Google Scholar] [CrossRef]
- Nellore, M.K.; Kannan, V.; Vellaisamy, A.L.R. A Statistical Method for Determining Optical and Geometrical Characteristics of Cirrus Clouds. Climate 2019, 7, 72. [Google Scholar] [CrossRef]
- Li, Q.; Groß, S. Changes in cirrus cloud properties and occurrence over Europe during the COVID-19-caused air traffic reduction. Atmospheric Meas. Tech. 2021, 21, 14573–14590. [Google Scholar] [CrossRef]
- Córdoba-Jabonero, C.; Lopes, F.J.; Landulfo, E.; Cuevas, E.; Ochoa, H.; Gil-Ojeda, M. Diversity on subtropical and polar cirrus clouds properties as derived from both ground-based lidars and CALIPSO/CALIOP measurements. Atmospheric Res. 2017, 183, 151–165. [Google Scholar] [CrossRef]
- Gryspeerdt, E.; Quaas, J.; Goren, T.; Klocke, D.; Brueck, M. An automated cirrus classification. Atmospheric Meas. Tech. 2018, 18, 6157–6169. [Google Scholar] [CrossRef]
- Dekoutsidis, G.; Groß, S.; Wirth, M.; Krämer, M.; Rolf, C. Characteristics of supersaturation in midlatitude cirrus clouds and their adjacent cloud-free air. Atmospheric Meas. Tech. 2023, 23, 3103–3117. [Google Scholar] [CrossRef]
- Cadet, B., V. Giraud, M. Haeffelin, P. Keckhut, A. Rechou, and S. Baldy, improved re-trievals of the optical properties of cirrus clouds by a combination of lidar methods, Appl. Opt., 2005, 44 (9), 1726-1734.
- Platt, C.M.R.; Dilley, A.C. Determination of the cirrus particle single-scattering phase function from lidar and solar radiometric data. Appl. Opt. 1984, 23, 380–386. [Google Scholar] [CrossRef]
- Chen, W.-N.; Chiang, C.-W.; Nee, J.-B. Lidar ratio and depolarization ratio for cirrus clouds. Appl. Opt. 2002, 41, 6470–6476. [Google Scholar] [CrossRef] [PubMed]
- Hersbach, H. , Bell, B., Berrisford, P., Biavati, G., Horányi, A., Muñoz Sabater, J., Nicolas, J., Peubey, C., Radu, R., Rozum, I., Schepers, D., Simmons, A., Soci, C., Dee, D., Thépaut, J-N. ERA5 hourly data on pressure levels from 1940 to present. 2023. [Google Scholar] [CrossRef]
- Wilks, D.S. Statistical Methods in the Atmospheric Sciences. Volume 100 (International Geophysics), 3rd Ed. ed; Academic Press: Cambridge, MA, USA, 2011. [Google Scholar]
- Shcherbakov, V.; Gayet, J.-F.; Jourdan, O.; Minikin, A.; Ström, J.; Petzold, A. Assessment of Cirrus Cloud Optical and Microphysical Data Reliability by Applying Statistical Procedures. J. Atmospheric Ocean. Technol. 2005, 22, 409–420. [Google Scholar] [CrossRef]
- Jeggle, K. , Neubauer, D., and Lohmann, U.: Identification of cirrus formation regimes using cluster analysis of back trajectories and satellite data, EGU General Assembly 2023, Vienna, Austria, 24–28 Apr 2023, EGU23-5002. [CrossRef]
- Gordon, N.D.; Norris, J.R. Cluster analysis of midlatitude oceanic cloud regimes: mean properties and temperature sensitivity. Atmospheric Meas. Tech. 2010, 10, 6435–6459. [Google Scholar] [CrossRef]
- Kurihana, T.; Moyer, E.J.; Foster, I.T. AICCA: AI-Driven Cloud Classification Atlas. Remote. Sens. 2022, 14, 5690. [Google Scholar] [CrossRef]
- Sassen, K.; Cho, B.S. Subvisual-Thin Cirrus Lidar Dataset for Satellite Verification and Climatological Research. J. Appl. Meteorol. Clim. 1992, 31, 1275–1285. [Google Scholar] [CrossRef]
- Mandija, F.; Sicard, M.; Comerón, A.; Alados-Arboledas, L.; Guerrero-Rascado, J.L.; Barragan, R.; Bravo-Aranda, J.A.; Granados-Muñoz, M.J.; Lyamani, H.; Porcar, C.M.; et al. Origin and pathways of the mineral dust transport to two Spanish EARLINET sites: Effect on the observed columnar and range-resolved dust optical properties. Atmospheric Res. 2016, 187, 69–83. [Google Scholar] [CrossRef]
- Mandija, F.; Chavez-Perez, V.; Nieto, R.; Sicard, M.; Danylevsky, V.; Añel, J.; Gimeno, L. The climatology of dust events over the European continent using data of the BSC-DREAM8b model. Atmospheric Res. 2018, 209, 144–162. [Google Scholar] [CrossRef]
- Reichardt, J. : Optical and Geometrical Properties of Northern Mid-latitude Cirrus Clouds Observed with a UV Raman lidar, Phys. Chem. Earth (B), 1999, 24, 255–260. [Google Scholar] [CrossRef]
- Sunilkumar, S.V.; Parameswaran, K. Temperature dependence of tropical cirrus properties and radiative effects. J. Geophys. Res. Atmos. 2005, 110. [Google Scholar] [CrossRef]
- Gordon, N.D.; Norris, J.R. Cluster analysis of midlatitude oceanic cloud regimes: mean properties and temperature sensitivity. Atmospheric Meas. Tech. 2010, 10, 6435–6459. [Google Scholar] [CrossRef]
- Li, Y.; Mahnke, C.; Rohs, S.; Bundke, U.; Spelten, N.; Dekoutsidis, G.; Groß, S.; Voigt, C.; Schumann, U.; Petzold, A.; et al. Upper-tropospheric slightly ice-subsaturated regions: frequency of occurrence and statistical evidence for the appearance of contrail cirrus. Atmospheric Meas. Tech. 2023, 23, 2251–2271. [Google Scholar] [CrossRef]
- Schumann, U.; Poll, I.; Teoh, R.; Koelle, R.; Spinielli, E.; Molloy, J.; Koudis, G.S.; Baumann, R.; Bugliaro, L.; Stettler, M.; et al. Air traffic and contrail changes over Europe during COVID-19: a model study. Atmospheric Meas. Tech. 2021, 21, 7429–7450. [Google Scholar] [CrossRef]
- Schmidt, E. : Die Entstehung von Eisnebel aus den Auspuffgasen von Flugmotoren, in: Deutschen Akademie der Luftfahrtforschung, R. Oldenbourg, 1941, 5, 44, 1–15. [Google Scholar]
- Appleman, H. The Formation of Exhaust Condensation Trails by Jet Aircraft. Bull. Am. Meteorol. Soc. 1953, 34, 14–20. [Google Scholar] [CrossRef]
- Kaiser, H.F. The varimax criterion for analytic rotation in factor analysis. Psychometrika 1958, 23, 187–200. [Google Scholar] [CrossRef]
- Berry, E.; Mace, G.G. Cirrus Cloud Properties and the Large-Scale Meteorological Environment: Relationships Derived from A-Train and NCEP–NCAR Reanalysis Data. J. Appl. Meteorol. Clim. 2013, 52, 1253–1276. [Google Scholar] [CrossRef]
- Horn, J.L. A rationale and test for the number of factors in factor analysis. Psychometrika 1965, 30, 179–185. [Google Scholar] [CrossRef]
- Yeung, Ka Yee, and W. L. Ruzzo. An empirical study on principal component analysis for clustering gene expression data. Technical report, Department of Computer Science and Engineering, University of Washington, 2000.
- Ge, J.; Zheng, C.; Xie, H.; Xin, Y.; Huang, J.; Fu, Q. Midlatitude Cirrus Clouds at the SACOL Site: Macrophysical Properties and Large-Scale Atmospheric States. J. Geophys. Res. Atmos. 2018, 123, 2256–2271. [Google Scholar] [CrossRef]
- Pandit, A.K.; Gadhavi, H.S.; Ratnam, M.V.; Raghunath, K.; Rao, S.V.B.; Jayaraman, A. Long-term trend analysis and climatology of tropical cirrus clouds using 16 years of lidar data set over Southern India. Atmospheric Meas. Tech. 2015, 15, 13833–13848. [Google Scholar] [CrossRef]
- Sandhya, M.; Sridharan, S.; Devi, M.I.; Niranjan, K.; Jayaraman, A. A case study of formation and maintenance of a lower stratospheric cirrus cloud over the tropics. Ann. Geophys. 2015, 33, 599–608. [Google Scholar] [CrossRef]
- Wang, Z. and Sassen, K. : Cirrus cloud microphysical property retrieval using lidar and radar measurements: II, Midlatitude cirrus microphysical and radiative properties, J. Atmos. Sci., 2002, 59, 2291–2302. [Google Scholar]



| Previous results | Criteria | Ref. | ||||||
|---|---|---|---|---|---|---|---|---|
| CMH (km) | CGT (km) | COD | T (oC) | Occurr. (%) | CMH (km) |
T (oC) |
LR (sr) |
|
| Mid-latitude regions | ||||||||
| 10.3 ± 0.9 | 2.7 ± 0.9 | 0.31 ± 0.24 | -51± 5.5 | 53 (3-57-40) | 8 | -38 | 25 | [31] |
| 7.8 ÷ 11.2 | 1.2 ÷ 4.3 | 0.37 ± 0.18 | -58 ÷ -36 | 30 (10-49-41) | – | – | 31 | [32] |
| – | – | 0.14 ± 0.13 | – | 30 (36-50-14) | – | -38 | – | [33] |
| 10.3 ± 1.2 | 1.8 ± 1.1 | 0.36 ± 0.45 | -51 ± 8.0 | 26 (14-48-38) | 7 | -37 | – | [36] |
| 10.0 ± 1.3 | 1.4 ± 1.3 | – | – | 39 (20-23-57) | – | -25 | 18 | [37] |
| 9.0 ÷ 10.0 | 2.1 ÷ 2.4 | 1.18 ÷ 1.23 | -50 ÷ -45 | – | – | -37 | 25 | [38] |
| 9.2 ± 1.9 | 1.6 | 0.36 | – | – | 5 | -40 | – | [39] |
| 9.7 ± 1.6 | 1.6 ± 1.5 | – | -50 ± 9.5 | – | 7 | -25 | 25 | [51] |
| 10.1 ± 1.7 | 1.6 ± 1.1 | 0.07 ÷ 0.50 | -52 ÷ -38 | 37 (38-32-30) | – | -25 | – | [41] |
| 8.6 ÷ 11.5 | 0.9 ÷ 3.2 | 0.13 ÷ 0.80 | -58 ÷ -41 | 47 (23-50-27) | – | – | 18 | [43] |
| Other regions | ||||||||
| 9.8 ± 1.7 | 1.5 ± 0.7 | 0.45 ± 0.30 | -39± 5.0 | 11 (0-80-20) | 6 | -27 | 27 | [47] |
| 10.0 ± 0.8 | 1.6 ± 0.7 | 0.30 ± 0.30 | -40± 6.0 | 64 (2-61-37) | 6 | -27 | 27 | [47] |
| 12.8 ± 1.5 | 1.8 ± 1.0 | 0.28 ± 0.29 | -58± 11 | 43 (8-52-40) | 9 | – | 30 | [52] |
| 13.6 ± 2.1 | 1.4 ± 1.1 | 0.25 ± 0.46 | – | 74 (42-38-20) | – | -37 | 23 | [48] |
| 14.7 ± 1.8 | 1.7 | 0.33 ± 0.29 | -65± 12 | 15 (16-34-50) | 9 | -40 | 28 | [49] |
| – | – | 0.37± 0.25 | – | – | 8 | -20 | 27 | [53] |
| 10.1 | 3.0 ± 0.9 | 0.26 ± 0.11 | -65± 4.0 | (0-68-32) | 8 | – | 32 | [50] |
| CBH (km) |
CMH (km) |
CTH (km) |
CGT (km) |
COD | T (oC) |
|
|---|---|---|---|---|---|---|
| 1st mode | 10.5 | 11.3 | 12.2 | 1.26 | 0.12 | -58.3 |
| 1st density | 0.24 | 0.30 | 0.33 | 0.49 | 1.98 | 0.06 |
| 2nd mode | 15.2 | 15.4 | 15.6 | 2.94 | 0.91 | -49.2 |
| 2nd density | 0.005 | 0.006 | 0.007 | 0.10 | 0. 25 | 0.03 |
| Class | CBH (km) |
CMH (km) |
CTH (km) |
CGT (km) |
COD | T (oC) |
Type | Position | Occurr. (%) |
|---|---|---|---|---|---|---|---|---|---|
| K-means method (original data) | |||||||||
| 1 | 11.2 | 11.7 | 12.3 | 1.18 | 0.23 | -64.0 | Thin | Tropopause | 22.1 |
| 2 | 10.4 | 11.3 | 12.2 | 1.80 | 0.49 | -57.2 | Thick | Tropopause | 43.5 |
| 3 | 9.3 | 10.0 | 10.8 | 1.58 | 0.37 | -48.4 | Moderate | Upper troposphere | 23.4 |
| 4 | 7.8 | 8.6 | 9.3 | 1.52 | 0.37 | -41.3 | Moderate | Mid-troposphere | 11.0 |
| PAM method (original data) | |||||||||
| 1 | 10.7 | 11.4 | 12.1 | 1.40 | 0.19 | -61.3 | Moderate | Tropopause | 36.6 |
| 2 | 10.2 | 11.1 | 11.9 | 1.70 | 0.12 | -55.6 | Thick | Tropopause | 30.7 |
| 3 | 9.0 | 9.8 | 10.5 | 1.50 | 0.24 | -47.9 | Moderate | Upper troposphere | 22.9 |
| 4 | 8.5 | 8.8 | 9.0 | 0.50 | 0.07 | -41.3 | Thin | Mid-troposphere | 9.8 |
| Eigenvalue | Variance (%) | Cumulative variance (%) | |
|---|---|---|---|
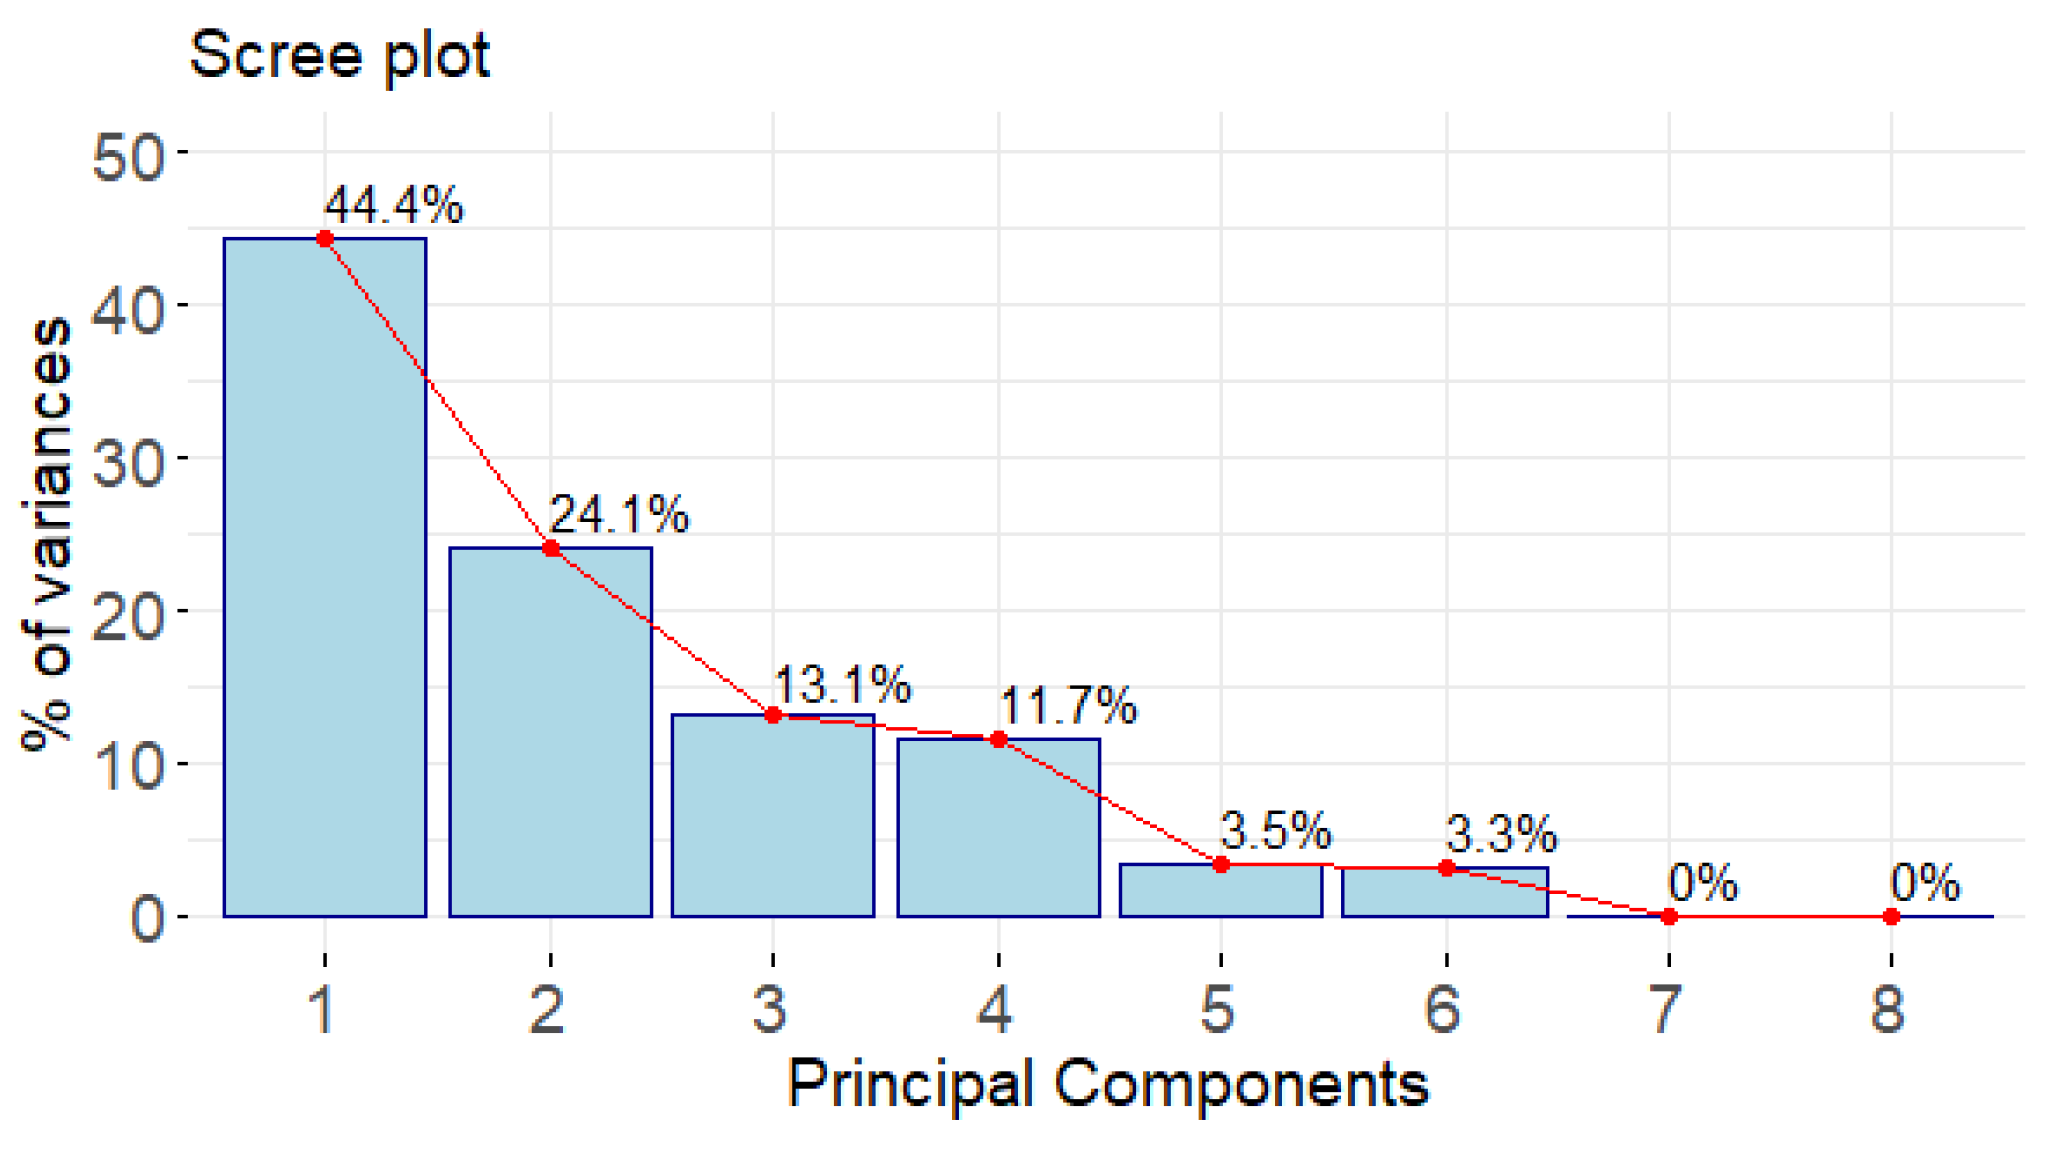
| PC 1 | 3.6 | 44.4 | 44.4 |
| PC 2 | 1.9 | 24.1 | 68.5 |
| PC 3 | 1.0 | 13.1 | 81.6 |
| PC 4 | 0.9 | 11.7 | 93.3 |
| PC 5 | 0.3 | 3.5 | 96.7 |
| PC 6 | 0.3 | 3.3 | 100 |
| PC 7 | 3.E-31 | 4.E-30 | 100 |
| PC 8 | 8.E-32 | 1.E-30 | 100 |
| PC1 | PC2 | PC3 | PC4 | PC5 | PC6 | PC7 | PC8 | |
|---|---|---|---|---|---|---|---|---|
| Cloud base height (CBH) | 0.52 | -0.10 | 0.10 | -0.05 | -0.30 | 0.07 | 0.46 | -0.64 |
| Cloud mean height (CMH) | 0.51 | 0.12 | 0.07 | -0.10 | -0.16 | 0.20 | -0.80 | -0.06 |
| Cloud top height (CTH) | 0.45 | 0.35 | 0.02 | -0.14 | 0.02 | 0.33 | 0.39 | 0.63 |
| Cloud geometrical depth (CGT) | -0.18 | 0.63 | -0.13 | -0.12 | 0.48 | 0.34 | 0.004 | -0.44 |
| Cloud optical depth (COD) | -0.16 | 0.61 | -0.12 | -0.14 | -0.60 | -0.45 | 2E-16 | 4E-17 |
| Mid-cloud temperature (I) | -0.42 | -0.19 | -0.07 | -0.39 | -0.47 | 0.64 | 8E-16 | 7E-16 |
| Relative humidity (RH) | -0.17 | 0.21 | 0.54 | 0.71 | -0.22 | 0.28 | 3E-16 | -1E-16 |
| Cloud ice water content (CIWC) | -0.10 | 0.02 | 0.81 | -0.53 | 0.14 | -0.18 | -6E-17 | 2E-16 |
| Standard deviation | 1.89 | 1.39 | 1.02 | 0.97 | 0.53 | 0.51 | 6.E-16 | 3.E-16 |
| Proportion of variance | 0.44 | 0.24 | 0.13 | 0.12 | 0.03 | 0.03 | 0.E+00 | 0.00 |
| Cumulative Proportion | 0.44 | 0.68 | 0.82 | 0.93 | 0.97 | 1.00 | 1.00 | 1.00 |
| Class | CBH (km) |
CMH (km) |
CTH (km) |
CGT (km) |
COD | T (oC) |
Type | Position | Occur. (%) |
|---|---|---|---|---|---|---|---|---|---|
| K-means method (original data) | |||||||||
| 1 | 11.7 | 12.2 | 12.7 | 1.06 | 0.20 | -61.3 | Thin | Tropopause | 31.8 |
| 2 | 9.0 | 10.7 | 12.5 | 3.49 | 1.39 | -55.7 | Thick | Upper troposphere | 11.7 |
| 3 | 10.0 | 10.7 | 11.4 | 1.43 | 0.24 | -54.7 | Moderate | Upper troposphere | 37.0 |
| 4 | 8.1 | 8.8 | 9.6 | 1.57 | 0.40 | -44.2 | Moderate | Mid-troposphere | 19.5 |
| PAM method (original data) | |||||||||
| 1 | 11.52 | 12.04 | 12.55 | 1.03 | 0.19 | -60.9 | Thin | Tropopause | 37.0 |
| 2 | 9.11 | 10.84 | 12.58 | 3.47 | 1.41 | -56.9 | Thick | Upper troposphere | 11.7 |
| 3 | 9.75 | 10.53 | 11.31 | 1.56 | 0.27 | -53.4 | Moderate | Upper troposphere | 33.8 |
| 4 | 8.0 | 8.7 | 9.5 | 1.52 | 0.39 | -43.7 | Moderate | Mid-troposphere | 17.5 |
| Characteristic | Ref. | Thin MT | Thick UT | Thin UP | Thin TP |
|---|---|---|---|---|---|
| This study | 19.5 | 11.7 | 31.8 | 37.0 | |
| Occurrence (%) | [32] | 17 | 21 | 30 | 30 |
| [41] | 28 | 30 | 42 | – | |
| [43] | 36 | 27 | 35 | – | |
| CMH (km) | This study | 8.8 ± 0.9 | 10.7 ± 0.9 | 12.2 ± 0.7 | 10.7 ± 0.6 |
| [32] | 7.8 ± 0.9 | 8.8 ± 0.9 | 11.2 ± 0.7 | 10.2 ± 0.9 | |
| [41] | 8.1 ± 1.0 | 10.4 ± 1.0 | 11.2 ± 1.1 | – | |
| [43] | 8.6 ± 0.9 | 9.8 ± 0.7 | 11.5 ± 0.9 | – | |
| CGT (km) | This study | 1.6 ± 0.7 | 3.5 ± 0.8 | 1.1 ± 0.5 | 1.4 ± 0.5 |
| [32] | 1.2 ± 0.7 | 4.3 ± 0.8 | 1.3 ± 0.5 | 2.8 ± 0.6 | |
| [41] | 1.3 ± 0.8 | 2.9 ± 1 | 1.0 ± 0.4 | – | |
| [43] | 0.9 ± 0.8 | 3.2 ± 0.9 | 0.9 ± 0.6 | – | |
| COD | This study | 0.2 ± 0.8 | 1.0 ± 0.8 | 0.1 ± 0.2 | 0.2 ± 1.0 |
| [32] | 0.04 ± 0.06 | 0.47 ± 0.36 | 0.09 ± 0.09 | 0.16 ± 0.20 | |
| [41] | 0.1 ± 0.2 | 0.5 ± 0.4 | 0.07 ± 0.06 | – | |
| [43] | 0.2 ± 0.2 | 0.8 ± 0.4 | 0.1 ± 0.1 | – | |
| T (oC) | This study | -44.2 ± 4.0 | -55.7 ± 5.1 | -61.3 ± 4.2 | -54.7 ± 5.0 |
| [32] | -36 ± 7 | -42 ± 7 | -58 ± 4 | -53 ± 4 | |
| [41] | -38 ± 9 | -52 ± 6 | -56 ± 7 | – | |
| [43] | -41 ± 6 | -50 ± 6 | -58 ± 6 | – |
| SVC | Thin | Thick | Visible | Opaque | Reference |
|---|---|---|---|---|---|
| Comparable results | |||||
| 5 | 57 | 38 | 95 | 38 | This study |
| 3 | 57 | 40 | 97 | 40 | [31] |
| 10 | 49 | 41 | 90 | 41 | [32] |
| 10 | 65 | 25 | 90 | 25 | [90] |
| 14 | 48 | 38 | 86 | 38 | [36] |
| 32 | 51 | 17 | 82 | 17 | [33] |
| Less similar results | |||||
| 42 | 38 | 20 | 77 | 20 | [48] |
| 43 | 46 | 11 | 68 | 11 | [33] |
| 35 | 52 | 13 | 62 | 13 | [33] |
| – | – | – | 67 | – | [51] |
| – | – | – | 50 | – | [13] |
| CBH | CMH | CTH | CGT | COD | CIWC | ω | T | RH | |
|---|---|---|---|---|---|---|---|---|---|
| SVC | 11.4 | 11.7 | 11.9 | 0.5 | 0.02 | 7.4E-07 | 0.024 | -58.8 | 68.6 |
| Thin | 10.3 | 11.0 | 11.6 | 1.2 | 0.15 | 2.8E-06 | 0.015 | -54.9 | 78.3 |
| Opaque | 9.3 | 10.5 | 11.6 | 2.3 | 0.81 | 2.7E-06 | 0.004 | -54.3 | 90.3 |
| season | CBH (km) |
CMH (km) |
CTH (km) |
CGT (km) |
COD | T (oC) |
Frequency (%) |
|---|---|---|---|---|---|---|---|
| MAM | 10.2 | 11.3 | 12.3 | 2.06 | 0.70 | -57.8 | 27.9 |
| JJA | 9.9 | 10.7 | 11.4 | 1.50 | 0.25 | -54.5 | 26.0 |
| SON | 8.8 | 9.5 | 10.3 | 1.50 | 0.34 | -47.3 | 24.7 |
| DJF | 11.2 | 11.8 | 12.4 | 1.15 | 0.23 | -60.3 | 21.4 |
| Class1 | Class2 | Class3 | Class4 | SVC | Thin | Opaque | |
| MAM | 12.3 | 11.7 | 2.6 | 1.3 | 2.6 | 9.7 | 15.6 |
| JJA | – | – | 26.0 | – | 0.6 | 17.5 | 7.8 |
| SON | – | – | 8.4 | 16.2 | 0.6 | 14.9 | 9.1 |
| DJF | 19.5 | – | – | 1.9 | 1.3 | 14.3 | 5.8 |
| CIWC | CBH | CMH | CTH | CGT | COD | RH | T | Ocurr. | ||
|---|---|---|---|---|---|---|---|---|---|---|
| Slow in situ | 6.5E-07 | 11.1 | 11.4 | 11.8 | 0.70 | 0.05 | -57.9 | 79.4 | 9.1 | |
| Fast in situ |
3.4E-07 | 10.2 | 11.0 | 11.8 | 1.62 | 0.42 | -56.5 | 80.5 | 72.1 | |
| In situ both |
3.8E-07 | 10.3 | 11.0 | 11.8 | 1.52 | 0.36 | -56.7 | 80.3 | 81.2 | |
| Liquid origin | 8.4E-06 | 7.8 | 9.2 | 10.6 | 2.78 | 1.14 | -44.3 | 108.9 | 5.2 | |
| Other cases | 1.4E-05 | 9.5 | 10.2 | 10.9 | 1.48 | 0.22 | -48.4 | 84.8 | 13.6 |
| Morphology (4 classes) |
Optical properties (3 groups) |
Formation mechanisms (3 categories) |
| Mid-tropospheric | Subvisible | Slow in situ |
| Thick upper-tropospheric | Thin | Fast in situ |
| Thin upper-tropospheric | Opaque | Liquid |
| Tropopause cirrus |
Disclaimer/Publisher’s Note: The statements, opinions and data contained in all publications are solely those of the individual author(s) and contributor(s) and not of MDPI and/or the editor(s). MDPI and/or the editor(s) disclaim responsibility for any injury to people or property resulting from any ideas, methods, instructions or products referred to in the content. |
© 2024 by the authors. Licensee MDPI, Basel, Switzerland. This article is an open access article distributed under the terms and conditions of the Creative Commons Attribution (CC BY) license (https://creativecommons.org/licenses/by/4.0/).


