1. Introduction
Modern technology is advancing rapidly, necessitating the constant need for strong, dependable, and efficient energy sources supporting various applications. Lithium-ion (Li-ion) batteries have gained prominence and fundamentally transformed the utilization and storage of energy [
1]
. It has sparked an unparalleled revolution in battery technology, affecting everything from portable electronic gadgets to electric cars and renewable energy storage systems [
2,
3]
Fine particles of one material are distributed throughout another in a heterogeneous combination known as dispersion (Schramm & Wiley Inter Science (Online Service) 2005). The graphite particles in the anode paste are difficult to uniformly disperse in a solution that contains binders, water, and conductive additive without any external shear forces. Rather, they continue to be spread throughout the dispersed phase in the cylindrical vessel. For equipment design, process scale-up, energy conservation, and product quality control, it is imperative to comprehend the fluid behavior, including rheological characteristics within the dispersing device. We can achieve this by simulating the mixing process and analyzing parameters such as the rotor rotational speed and dispersion time [
4]. The dispersion vessel consists of the rotating tool and the vessel. The rotating tool consists of a rotor shaft and a cylinder, while the vessel represents the outer part of the equipment. Two distinct scales are employed to ascertain the degree of mixing. In macromixing, the bulk fluid flow is frequently characterized by the mean concentration or residence time distribution. Turbulent comes after micro-mixing and describes dispersing at the molecular level, thereby immediately influencing the direction of a chemical process. Several research papers examined the role of dispersion using CFD and experimental fluid dynamics [
5]. The experimental findings were used to develop many empirical equations related to the dispersion time with the operating circumstances and geometries [
5,
6]. Several studies focused on utilizing the CFD approach to describe fluid flow’s hydrodynamics and verify the projected findings with experimental data [
5,
7].
Experimental studies are an effective means of elucidating the behavior of fluids in mixing vessels. However, they are costly and time-consuming, necessitating the use of sophisticated instrumentation and techniques to obtain quantitative measurements and visualize the flow. Due to the inherently unstable nature of turbulent flow, is a significant challenge to overcome. Furthermore, experimental approaches can only cover some critical mixing process parameters or provide the requisite degree of spatial resolution within the rotational tools. For these reasons, theoretical tools, particularly CFD, have swiftly evolved into a valuable tool for delving into the complexities of complex dispersion [
4]. CFD simulations of turbulent flows generate a plethora of data, including viscosity contours, velocity vectors, turbulent kinetic energy, and energy dissipation rates, among other information. A thorough examination of the massive amounts of data generated by CFD simulations can show flow behavior, circulation patterns, vortex structures, turbulence intensity, dissipation rates, Reynolds stresses, etc. The average Navier-Stokes equations’ transport turbulence models form the basis of most CFD simulations, and these models have undergone extensive exploration [
8,
9]. The k-Ɛ turbulence model is widely used in engineering practice and is the foundation for most commercial CFD software.
CFD simulations of non-Newtonian fluids are highly significant. The rheological characteristics of a fluid in a rotating system can vary over time according to the applied shear forces. The fluid impacts the energy dissipation rates, affecting both their magnitude and location [
10]. CFD simulations are performed using the ANSYS Fluent software (student version 2024R1) with the k-Ɛ turbulence model. The purpose is to simulate the mixing process in a dispersion tool as a batch process under various operating conditions, including rotor rotational speed and dispersion time. Several CFD models have been built in the past to help us learn more about how the quality of the solid suspension affects the mixing of the liquid phase in a solid liquid stirred reactor [
5,
11]. For the first time, a more comprehensive research study has extended the two-phase CFD model to forecast the mixing conditions in the high shear mixing t. A comparison was conducted to ascertain the influence of operational variables, including impeller rotational speed, gas flow rate, and feed location, on the mixing time [
12]. A study was conducted on the flow pattern and the distribution of the energy dissipation rate in a batch rotor-stator mixer. The typical k–ε turbulence model and sliding mesh were utilized in this investigation [
13]. The correlation between the power and flow properties of batch rotor-stator mixers has been investigated using CFD models. This work significantly improves our comprehension of the correlation between power, flow, and dispersion geometry in rotor-stator mixers [
14]. However, the researchers did not consider the impact of the rotor-stator shape, rotational speed, and dispersion time on rheological parameters in their investigation. The interaction between dispersion time, particle size, and rotating speed in multiphase systems to achieve uniform dispersion remains poorly understood.
The present work aims to develop the multiphase inhomogeneous Eulerian model that is combined with the finite-rate/eddy-dissipation (FR/ED) model to investigate the complex connections between two-phase macroscale dispersion, turbulent mixing, and chemical interactions in the manufacturing of battery paste (anode) in a batch process. The multiphase model utilized the classic k–ε turbulence model to solve the turbulence kinetic energy and dissipation, which were then used to calculate the turbulent mixing rate. The impact of rotational speed and dispersion time on the flow patterns and slurry viscosity distribution was simulated using the verified multiphase Eulerian model. This finding highlighted the significance of dispersion in non-Newtonian fluids.
2. Materials and Methods
2.1. Experimental
2.1.1. Materials and Device
The materials utilized in the formulation of anode slurry are documented in
Table 1.
Table 1. represents the materials used to make the anode pastes, together with information on the producer, registered office, and Chemical Abstracts Service (CAS) number.
The specification of the mixing equipment and the characterization equipment’s are listed in
Table 2.
Table 2. A list of the equipment that were used, along with their names, and manufacturers.
2.1.2. Recipe
Table 3 represents the slurry recipe for 40% solids anode pastes in 500 g batches. Material weight proportions and weights are mentioned. The Fraunhofer Institute for Production Engineering and Automation, Functional Materials Department, formulated the recipe. These trials were done at ambient environment.
Table 3. The formula for making 500 g of anode paste with 40% solids concentration.
The anode pastes’ dispersion medium, distilled water, accounts for 60.0% of their weight. The active ingredient graphite has a 37.2% weight in pastes, and the maximum solid concentration is 93.0%. At 3.0%, Na-CMC is the second-highest solids content. Conductive carbon black is added at 2.0% solids weight. The second binder ingredient, SBR, and the lead additive comprise 2.0% and 0.8% of the paste’s solids composition. SBR was employed as an emulsion with 40% polymer and 60% water. Therefore, the pastes’ solids composition determined a dry weight of 2.0% SBR. Adding less distilled water kept the solvent concentration at 60.0% of the anode paste’s weight.
2.1.3. Preparation of Anode Paste
Two different techniques, disk dissolvers and rotor-stator-based mixing equipment, were employed to disperse the anode pastes. Both variations of dispersion were executed in a batch setting. Dissolving disks with different diameters can opt for dispensing in varying quantities. Initially, the materials mentioned in
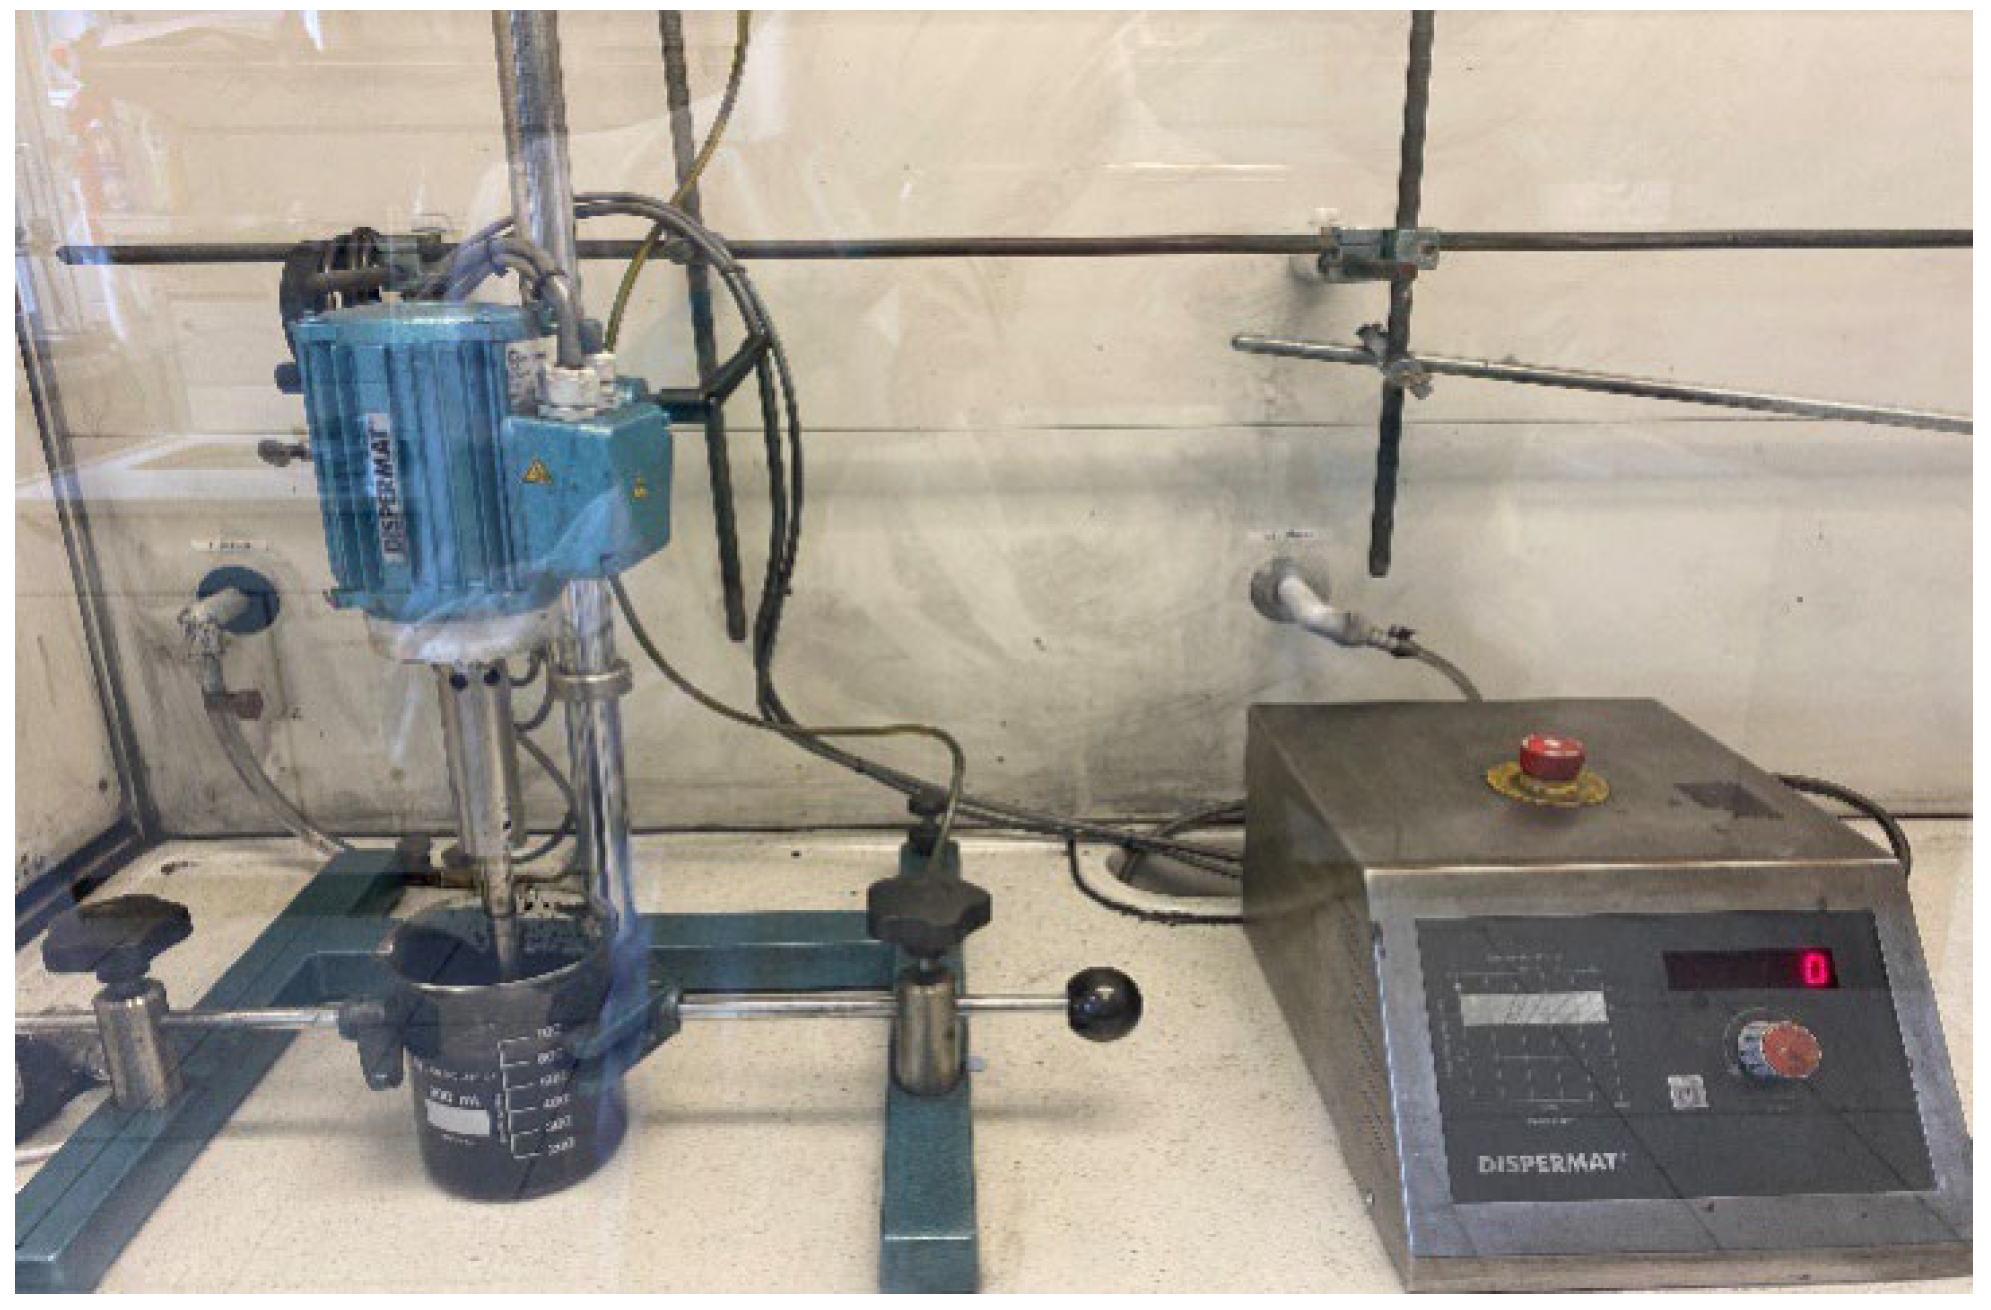
Table 1 were measured using a weighing balance. Subsequently, distilled water was also added to a beaker. The beaker was affixed beneath the dissolver, and the dissolver disk with a diameter of 50 mm was immersed into the beaker as shown in
Figure 1.
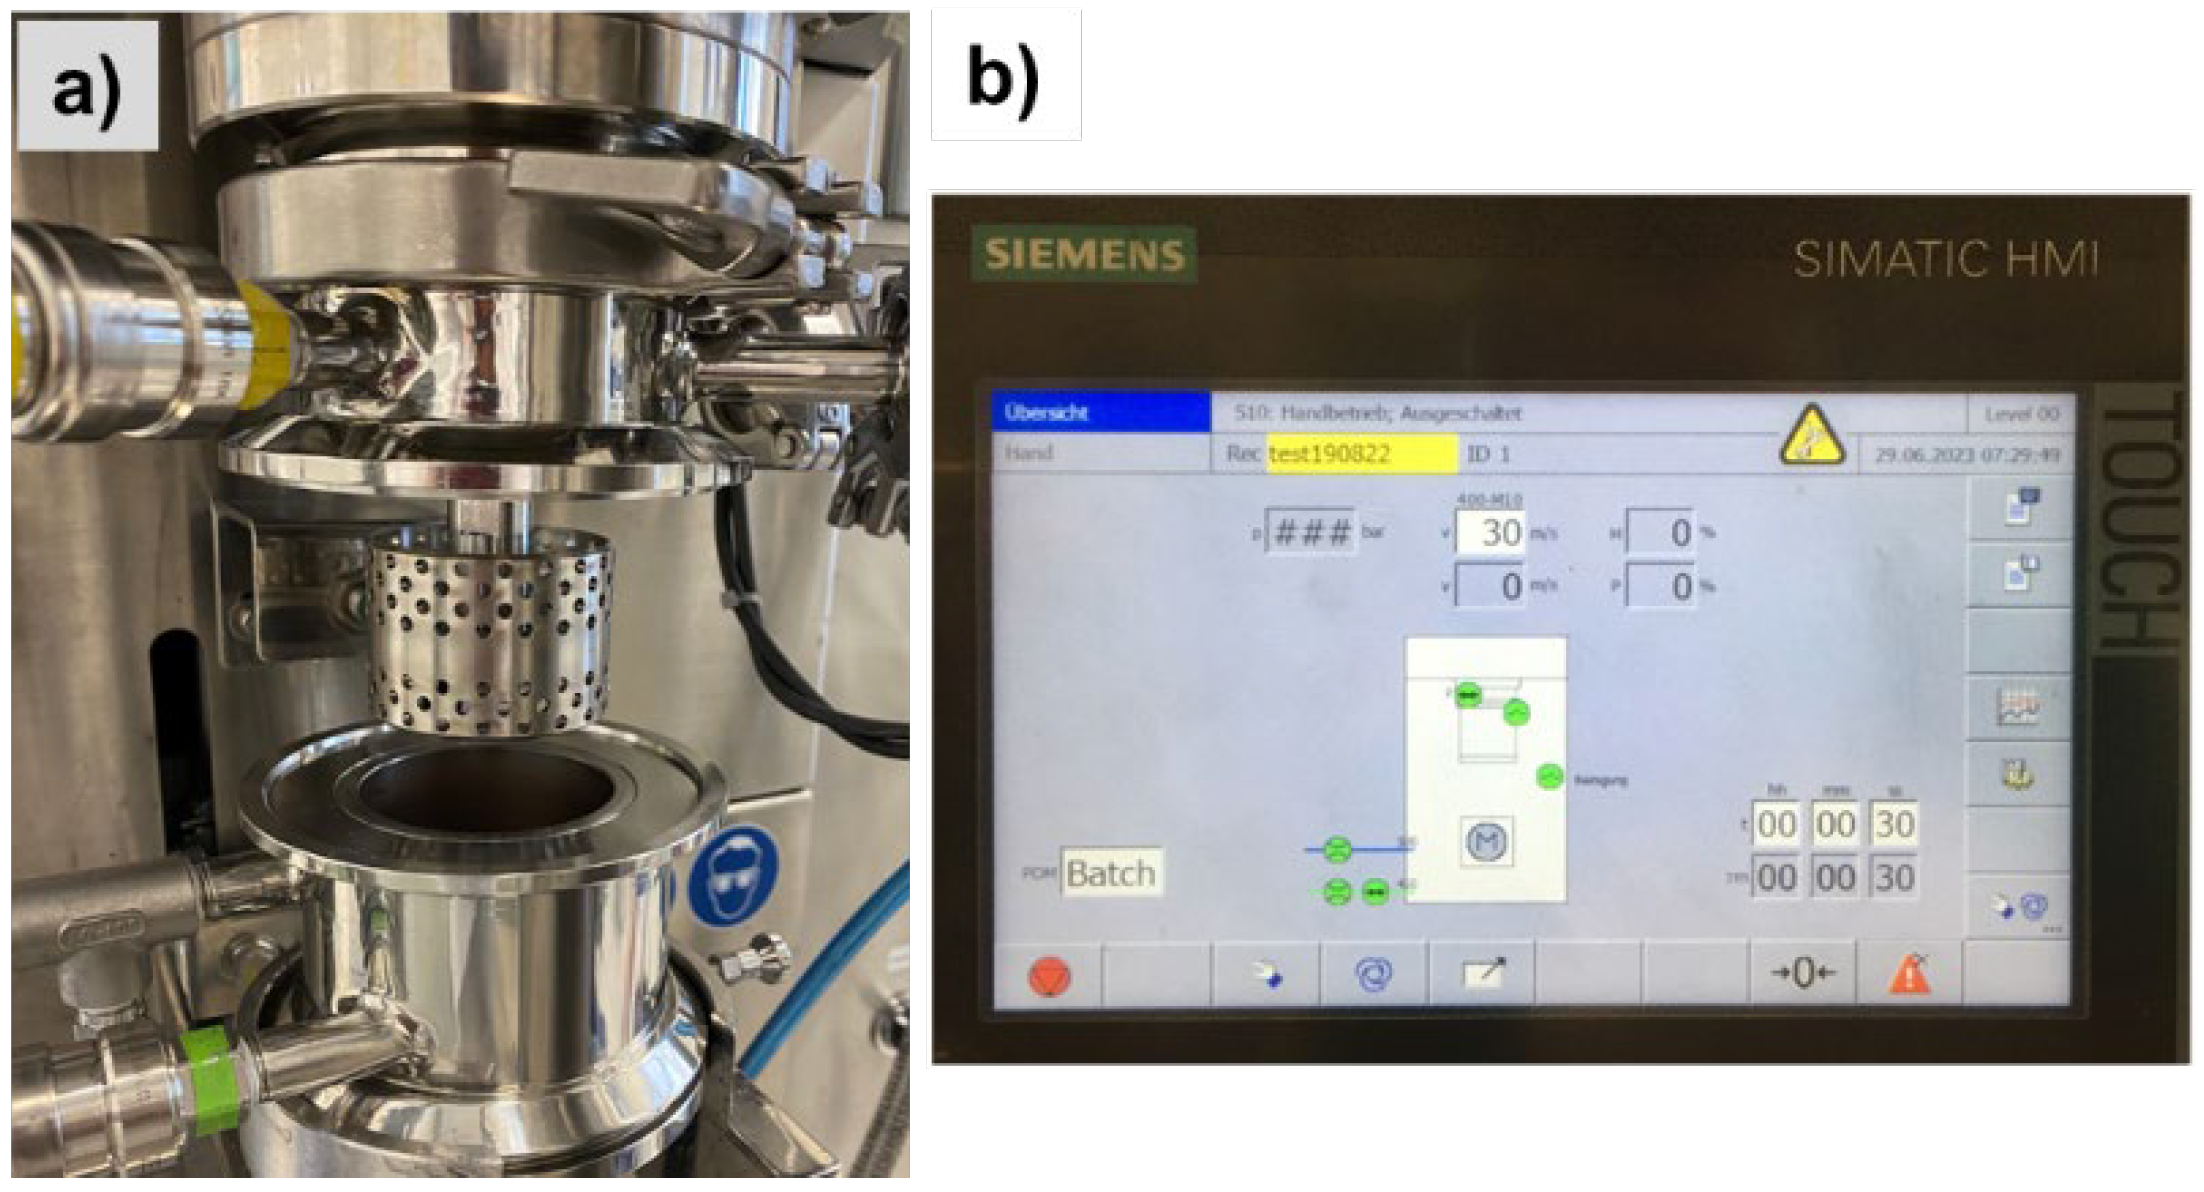
The dissolver is raised with rotational speed from 0 to 2500 rpm. Na-CMC was incrementally introduced as the rotational speed was augmented. The process was continued for 25 minutes. After 25 minutes, the rotational speed was decreased to 1000 revolutions per minute (rpm), and the binder material, SBR, was introduced. Subsequently, the mixture was evenly distributed by rotating it at a speed of 1000 revolutions per minute for an additional duration of 10 minutes. The carbon black and graphite were introduced gradually and in increments into the Na-CMC solution at a speed of 1000 rpm. After achieving complete graphite and carbon black dispersion, the rotational speed was raised to 4500 rpm, and the paste was dispersed for 10 minutes. The pre-distributed paste was subsequently placed in 80 g portions into the container of the Filmix (
Figure 2 (a)). The completed pastes were transferred into jars with large openings for further testing. A touch control display is used for parameter setup and motor on/off (
Figure 2 (b)). The different dispersion parameters were adjusted by choosing the mixing time and mixer speed. Dispersion time changes rheology by affecting how particles break up and where they are spread out. Rotational speed changes fluid flow and viscosity, which leads to higher shear forces that change rheology.
2.1.4. Viscosity
The rheological characteristics of the anode pastes were measured using the Anton Paar MCR 302 rheometer. The measurements were conducted using a PP20 plate-plate system with the rheometer Anton Paar MCR 302, which had a plate diameter of 20 mm. The measuring gap, or the distance between the two plates, was 1 mm, and the measurements were taken at 25 °C. Each measurement was conducted using a sample volume of about 1 ml. The sample’s dynamic viscosity was tested within 0 to 1000 s-1 in 300 s. Each measurement contains 100 measurement points, and each point was held for 3 s. The Anton Paar rheoWizard software was utilized to control the implementation. The measurement data was assessed using the Anton Paar rheoWizard Software. Due to specific variations in each measurement, the samples were tested five times. The average value was subsequently computed.
2.1.5. Density
Before recording data, the device was cleaned. Accurate was the setting chosen for measuring performance. Furthermore, it was decided to verify the filling level and the density stability. Care was taken to ensure the U-tube was filled and there were no bubbles in the measurement cell before injecting the anode paste into the density meter. The measurement was initiated once the sample was injected. The sample were tested five times, and the average value was considered for the simulation.
2.2. CFD
2.2.1. Geometry and Mesh
The Filmix FM-56 geometry was created using SolidWorks 2021, while the meshes were generated using ANSYS Design Modeller. Three domains were primarily established by combining and organizing dimensions. The initial step involves constructing the vessel (outer part of the machine) with a diameter of 56 mm and a height of 53 mm. The second component is a rotational tool (inner part of the machine) with holes. It has an inner diameter of 48 mm, an outer diameter of 52 mm, and a height of 38 mm. There are seven rows of holes, each with a diameter of 3 mm, and every row has twenty holes. The extended region was utilized to affix the rotational tool and comprises a rotor shaft with a diameter of 18 mm, which is linked to a circular plate measuring 48 mm in diameter and 2 mm in thickness. The circular plate is equipped with eight holes, each with a diameter of 6 mm, to enhance the dispersion of the particles. The third domain was required to facilitate the rotation of the inner cylinder and establish a connection with the power machine. A fluid zone was established at the inner border of the vessel to prevent the formation of voids, and domain one was excluded from the geometry. A block-structured meshing technique was employed to generate meshes consisting exclusively of triangular cells. When utilizing the student edition of ANSYS, the meshing process exceeds a certain number of elements. Therefore, the growth rate has been increased from 1.2 to 2 in the sizing process. According to the statistics, the number of nodes is 102,612, and the number of elements is 444,681.
2.2.2. Software
SolidWorks
The primary function is to simplify the generation of precise and complex 3D geometry. To facilitate the accurate and effective geometry development, the software optimizes the entire design process through the facilitation of assembly modeling, simulations, comprehensive documentation, and realistic visualization.
Design Modeler CFD
The Design Modeler application is dedicated to the generation of meshes. The software permits the application of Computer Aided Design (CAD) or SolidWorks geometries and the generation of such geometries. The Design Modeler utilizes a block-structured meshing technique, which enables triangular meshes even in intricate geometries.
Fluent
The Fluent solver utilizes the center node finite volume method (FVM) discretization methodology and provides segregated and linked solution techniques. In multiphase approach, Eulerian model will be best suited among the mixture and volume of fluid (VOF) model. Furthermore, there is one accessible particle tracking model. The selection of the discretization method might also significantly impact the outcomes of other multiphase models. Fluent offers various discretization techniques specially designed to address the volume fraction equation and alleviate this issue. Additionally, several techniques can be employed to discretize the remaining transport equations spatially. Various drag models and transfer mechanisms, including lift forces and turbulent dispersion, simulate interphase transfer [
15].
2.2.3. Multiphase Flows
The term “multiphase flow” describes a process in which more than one phase—a solid, liquid, or gas is present simultaneously. The four most common types of multiphase flows involve gas and liquid, gas and solid, liquid, and solid, and all the three phases altogether. It is usual practice to further characterize flows based on how they seem visually, whether as segregated, mixed, or scattered flow. Classifying a multiphase flow inside a particular flow regime is as essential as determining the flow’s laminar or turbulent nature in single-phase flow analysis; both concepts refer to different types of flows [
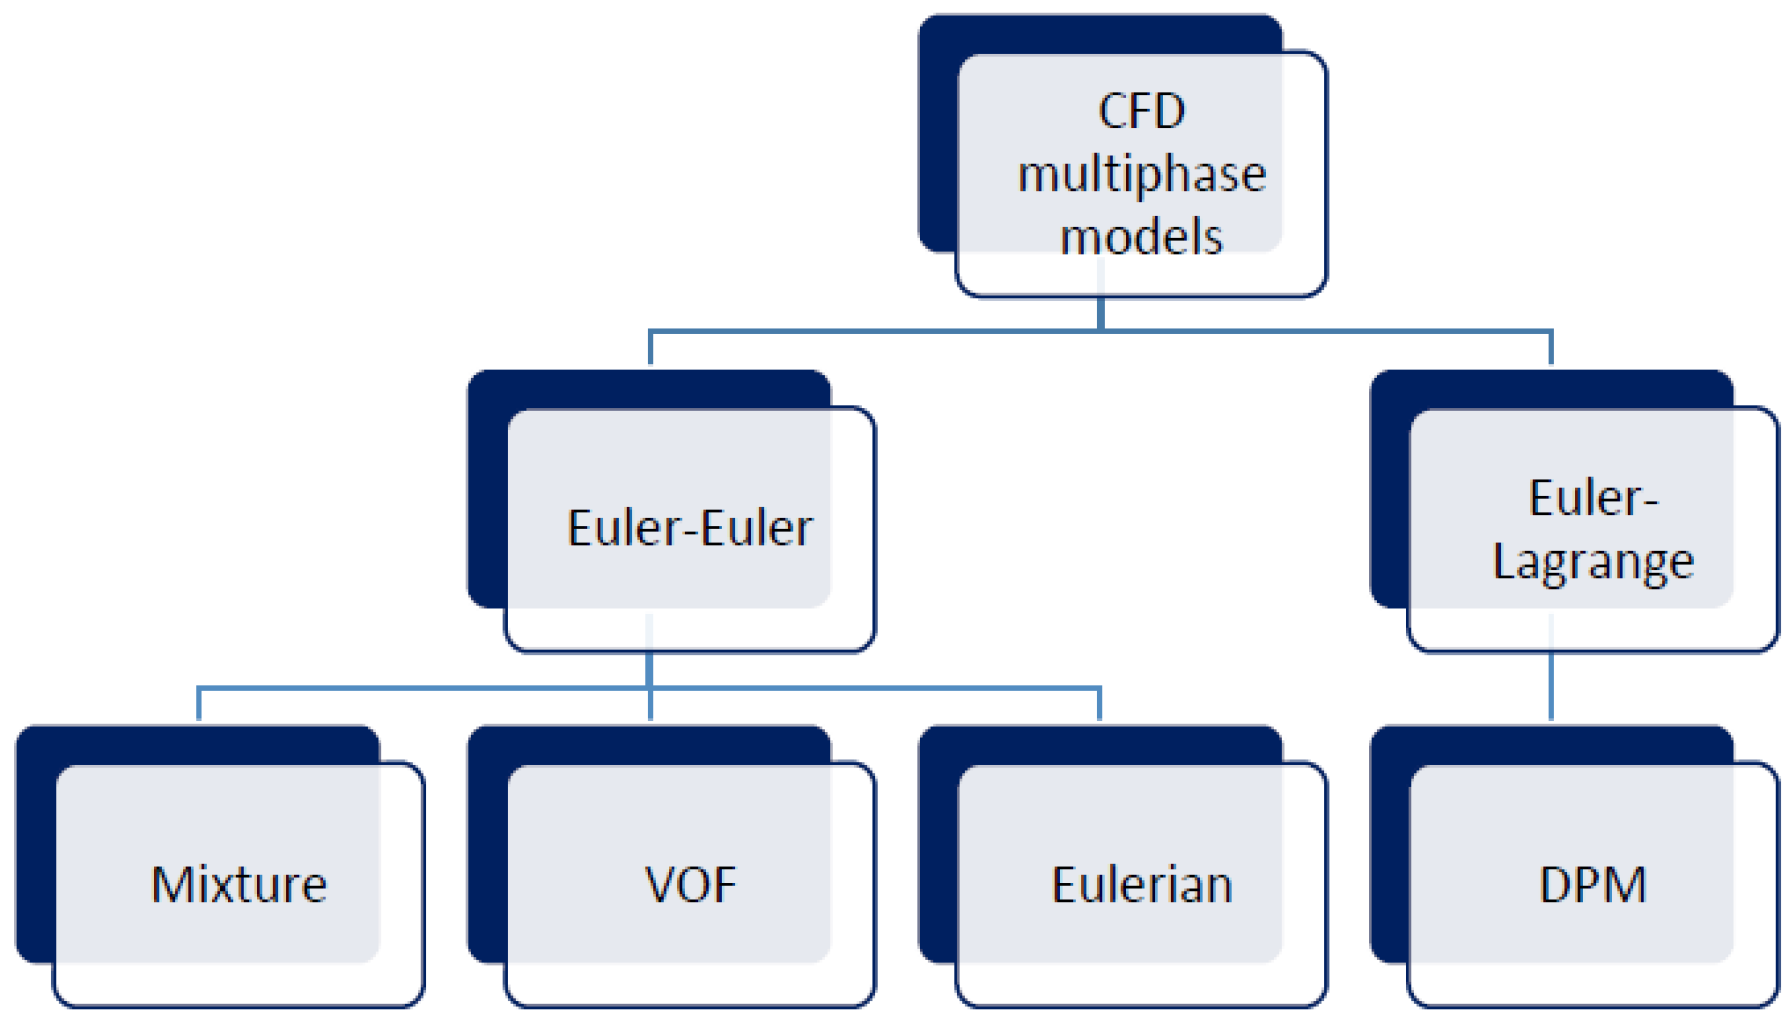
16]. This study utilized anode paste as a liquid component and air as a gas. Euler-Euler and Euler-Lagrange are the two main methods for modeling multiphase flows as shown in
Figure 3 [
17].
It is covered in depth since this study uses the inhomogeneous Eulerian-Eulerian models. The ANSYS Fluent User’s Guide, 2023 R1, describes the remaining models [
16]. The kinetic theory of granular flow was employed to compute the parameters of the liquid phase, specifically the pressure and viscosity, to address the closure problem. The Schiller-Naumann drag force model were selected to determine the momentum transfer between the liquid and gas phases.
2.2.4. Eulerian-Eulerian Approach
The Eulerian-Eulerian approach assumes that the flow phases are treated as interpenetrating continua. A phase volume fraction arises since another phase cannot occupy a fluid volume. It indicates that the volume fractions depend on time and space variables, and their total sum equals one [19]. The model solves equations for momentum, mass conversion, and stress tensor for each phase as mentioned in multiphase flows section 2.2.3. All steps in the domain experience shared pressure. The number of phases is constrained solely by space requirements, processing time, and convergence behavior. This technique may also be used to analyze the dispersed flows, where the overall motion of particles is more important than tracking individual particles. The distributed phase equations are averaged in each computing cell to produce mean fields. Hence, this method is preferably appropriate for dense flows.
2.2.5. Preliminary Model Selection Approach
To thoroughly analyze the selection process of the model, it is necessary to first specify the parameters that need to be chosen and the corresponding options that have been selected. It is widely recognized that the simulation setup can be constructed in several ways. The most essential possibilities are shown here to simplify the model selection process.
- I.
RANS models:
Reynolds Averaged Navier-Stokes (RANS) models provide the most cost-effective method for simulating complex turbulent flows. Typical examples of such models include the k-ε and k-ω models. Both types are compatible with the mixing behavior. These models simplify the problem by solving two extra transport equations and using eddy-viscosity to calculate Reynolds stresses [19]. Also, k-ω models better predict flows and separation in boundary layers with an unfavorable pressure difference. One problem with the standard ω equation is that it is susceptible to changes in the freestream values of k and ω outside the shear layer. These changes can have a significant effect on the solution. Therefore, utilizing the k-ω model in the present work is not advisable. Furthermore, the literature review reveals that in most cases, the Eulerian Granular model for slurry flow modeling and k-ε model for turbulence modeling have been recommended [20,21,22]. The standard model is chosen out of the three k-ε model alternatives. Although significant variations between these three models are not anticipated, the Standard model best fits the data given the complicated geometry. A mixture model is chosen to model turbulent characteristics.
- II.
Properties and phase interaction
Properties
The technique for selecting the phase characteristics requires essential parameters, such as density and viscosity, for each phase within a computational domain. A constant viscosity value was employed in this study on the granular viscosity model. This choice was made because constant values in granular viscosity models presume that the characteristics of granular materials remain unchanged, simplifying the simulations. This simplification optimizes computations, improving computational efficiency and stability. Nevertheless, it might reduce precision in many situations where differences in detailed features affect the interactions between fluids and solids, thereby decreasing the model’s ability to adapt the complicated multiphase flow settings. Furthermore, the solid pressure, radial distribution, and packing limit models were all maintained with default settings.
Phase Interaction
When dealing with flake-shaped particles, the Schiller-Naumann drag model is an excellent choice for simulations of multiphase phase interactions. It is helpful in circumstances where particle shape substantially affects flow behavior, allowing simulations to resemble real-world conditions better and improving the overall prediction capabilities of the multiphase system. The other two types, Syamlal and Gidaspow, would not be suitable for our case. These models best utilize the relevant frictional viscosity models. The consideration of turbulent dispersion is essential as it substantially influences the particle distribution profile [19]. The Simonin model is suitable for turbulent multiphase models, specifically for dispersed turbulent modeling for each phase. The ia-symmetric model is typically chosen as the interfacial area to achieve the most accurate outcomes. This model has superior accuracy compared to the ia-particle model. The precision of the solution is crucial in the scattered area at the front of the inner cylinder surface.
2.2.6. Cell Zone and Boundary Conditions
Cell zones are distinct regions delineated within the computational domain and possess unique properties or materials. Three primary cell zones exist: the inner rotating cylinder, the rotor-stator, and the fluid body. Boundary conditions determine the interaction between a multiphase flow and its surroundings. It entails specifying mass flow rates, pressures, or velocities at boundaries to simulate the mixing conditions. In multiphase simulations, the primary aim of cell zone and boundary conditions is to precisely depict the physical reality, guarantee convergence and stability, and authenticate the model compared to empirical observations. It is imperative to meet these conditions to obtain dependable and significant results when simulating complex multiphase flows. By the geometry of the equipment, the interior rotating cylinder is regarded as solid motion and is allocated translational velocity (m/s), while the rotor-stator is assigned rotational speed (rad/s). Furthermore, the fluid body wall was treated with the same velocity (m/s) as the interior cylinder.
2.2.7. Solver Setting and Convergence Criteria
The governing equations were discretized using a finite volume approach in a double-precision mode and solved using the CFD solver [19]. To prevent the occurrence of spurious diffusion, the simulated outcomes were obtained by utilizing the linear first-order Quadratic Upstream Interpolation for Convective Kinematics (QUICK) scheme and pressure PRESsure Staggered Option (PRESTO). The absolute velocity formulation was chosen for application use, and the default Least ‘Squares Cell Based’ method was used to calculate the gradient. The phase-coupled Semi-Implicit Method for Pressure Linked Equations (SIMPLE) method was employed to resolve the interplay between the continuity and momentum equations via pressure. Regarding numerical convergence, a requirement of 10-4 was established for each time step. The residuals for momentum, continuity, turbulence, and volume fraction equations were tracked and ideally should decrease to a value below 1e-5.
2.2.8. Rheological Model
The rheological behavior of the anode paste is non-Newtonian. When the shear rate exceeded a certain threshold, the fluid viscosity decreases. The term for this occurrence is shear-thinning. When necessary, the cross model was employed to represent the non-Newtonian rheology, as it had been demonstrated to depict the shearing characteristics of the slurry accurately [
5].

The variables μ0, λ, and n are the zero-shear viscosity, natural time, and power-law index. The cross model is frequently employed to characterize the viscosity’s low-shear-rate behavior. The experimental data were utilized in this study to fit the model parameters represented in Equation (4) using the nonlinear least squares method.
3. Results and Discussion
3.1. Viscosity Measurements of Pre-Mix and after Filmix Slurry Using Rheometer
The viscosity of the premix and after Filmix anode paste were evaluated using a rheometer. Shear rate sweeps were conducted over a range of 0 to 100 s
-1 to investigate the viscosity behavior of the anode paste.
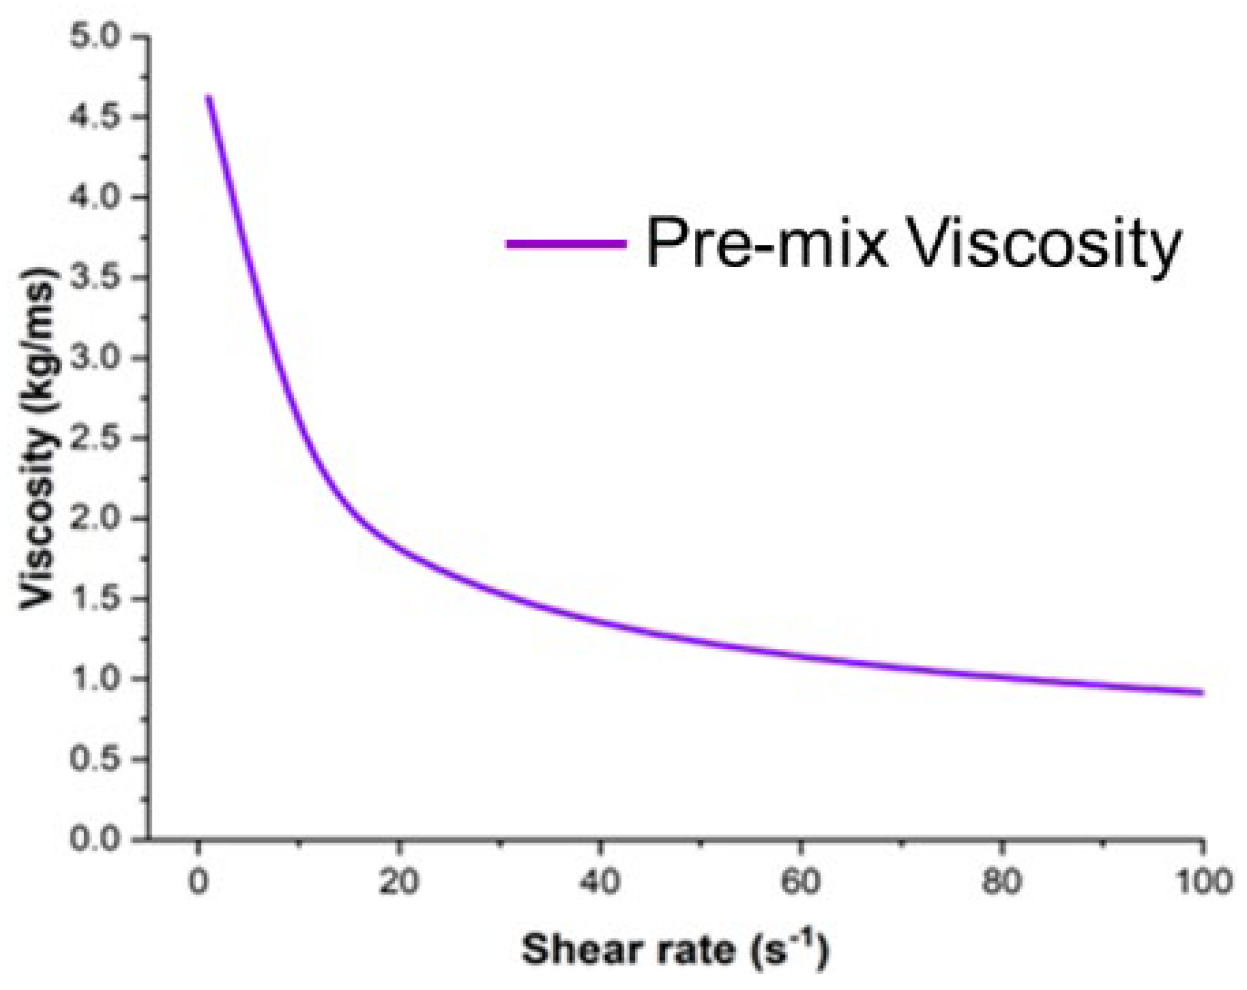
Figure 4 depicts the viscosity plotted against the shear rate for the pre-mix anode paste.
It can be observed that the shear rate exerts a significant influence on the viscosity of the anode paste. The viscosity-shear rate graph exhibits shear-thinning behavior, whereby the viscosity decreases from 4.624 kg/m-s to 0.916 kg/m-s as the shear rate increases from 1 s-1 to 100 s-1. The paste is subjected to higher shear rates during rotation, which results in a reduction in its resistance to flow.
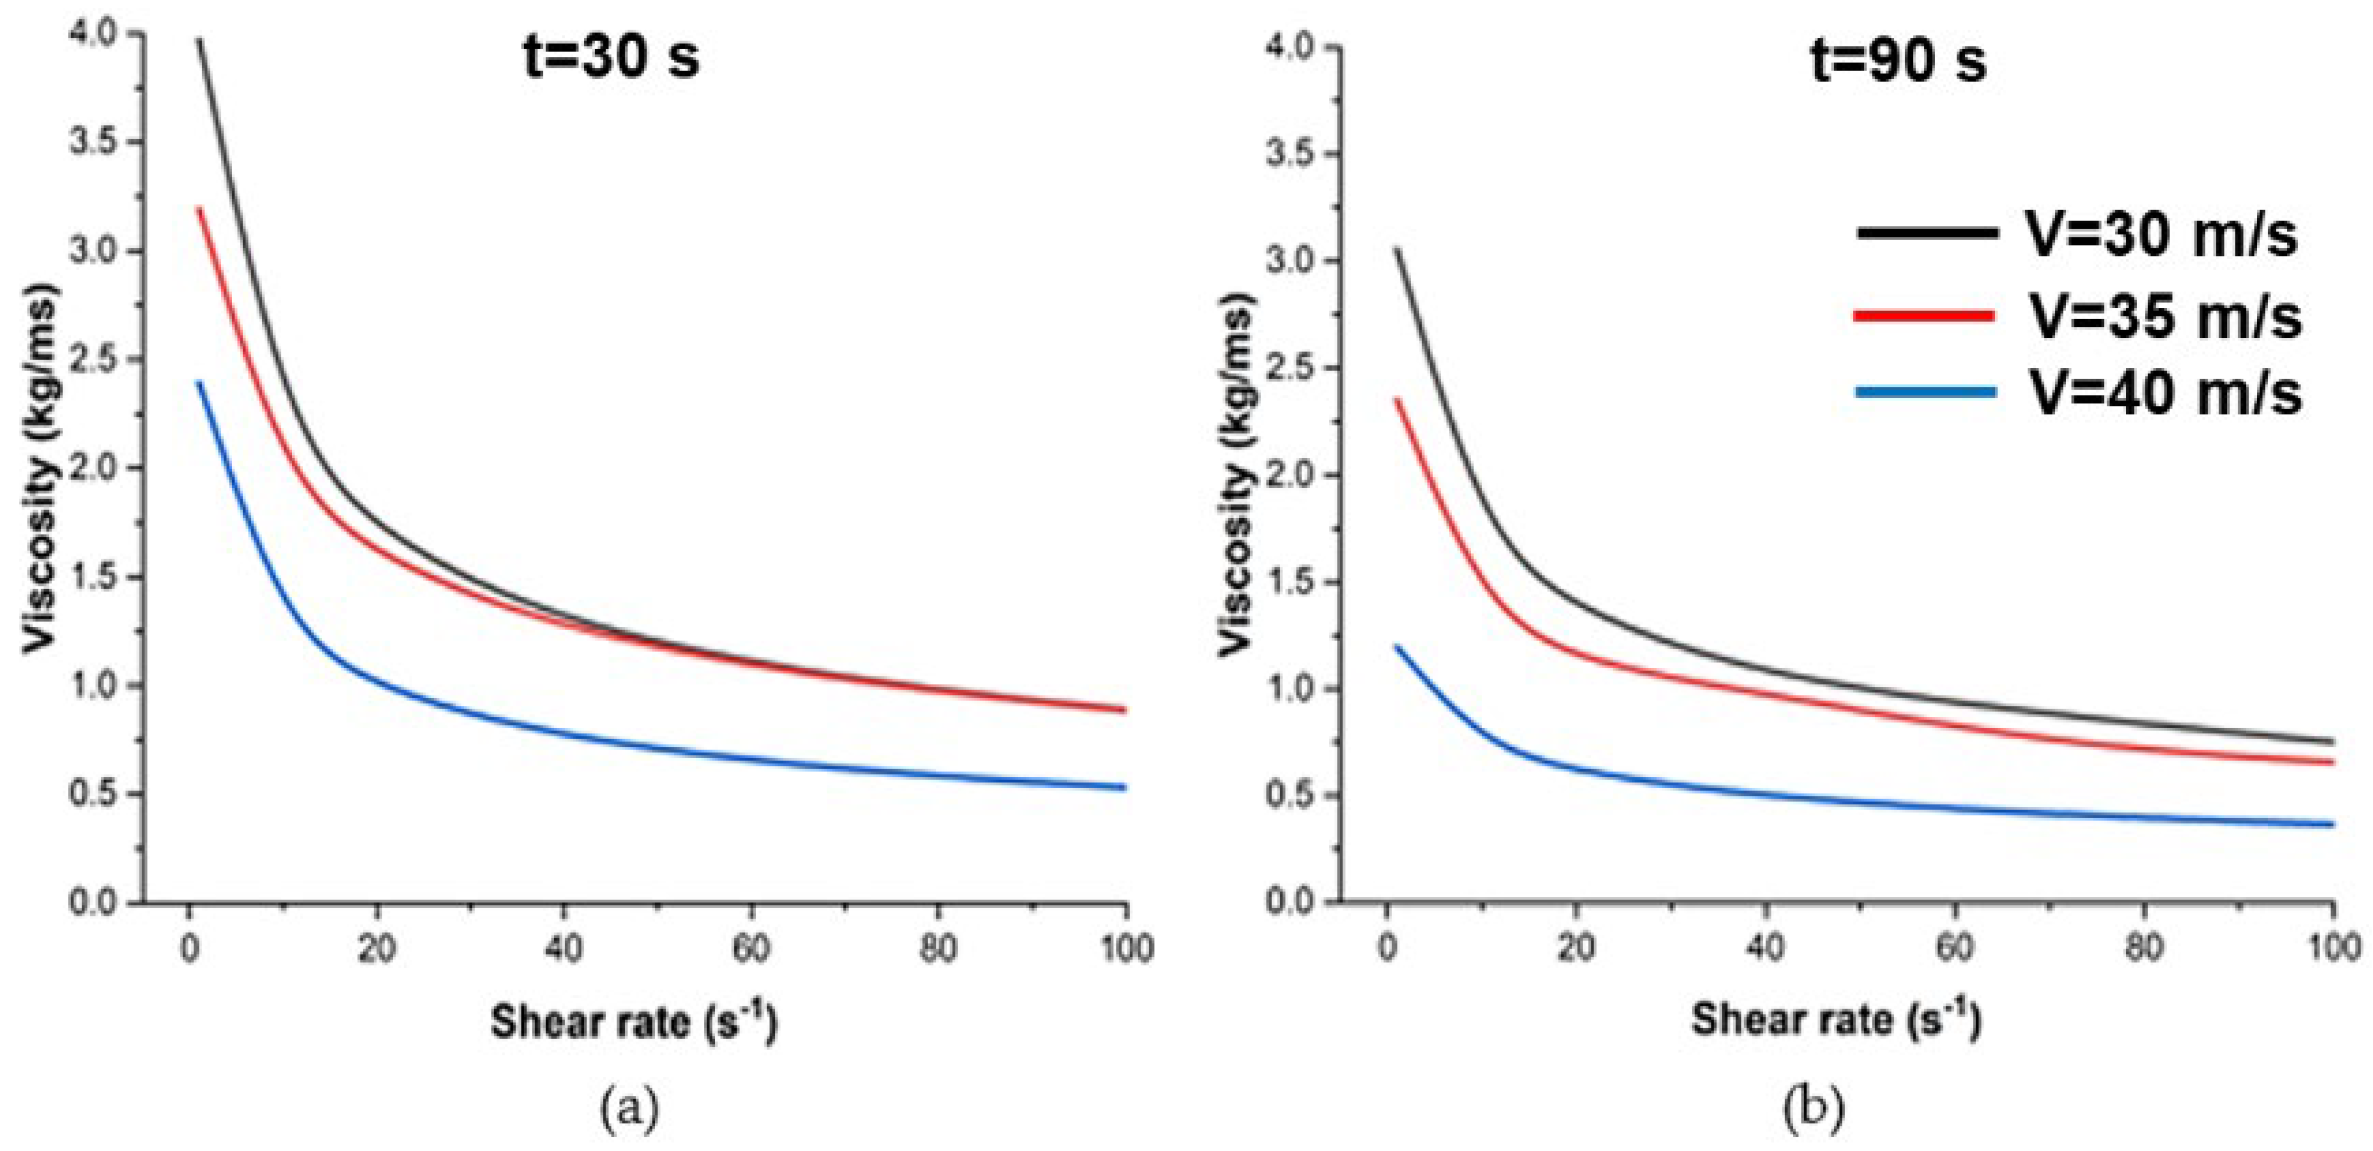
Figure 5 illustrates the results obtained at a constant dispersion time of 30 s and 90 s, with varying rotor velocities of 30 m/s, 35 m/s, and 40 m/s.
Figure 5 (a) shows that the viscosity reduces from 3.969 kg/m-s to 0.889 kg/m-s at 30 m/s, 3.192 kg/m-s to 0.885 kg/m-s at 35 m/s, and 2.392 kg/m-s to 0.532 kg/m-s at 40 m/s as the shear rate increase from 1 s
-1 to 100 s
-1 for the dispersion time of 30 s. On the other hand, the viscosity decreases respectively from 3.055 kg/m s to 0.752 kg/m s at 30 m/s, 2.352 kg/m s to 0.655 kg/m s at 35 m/s and 1.195 kg/m s to 0.366 kg/m s at 40 m/s as the shear rate increases from 1 s
-1 to 100 s
-1 for the dispersion time of 90 s in
Figure 5 (b).
The increase in the mixing velocities from 30 m/s to 40 m/s results in the increase of shear force. The internal structure of the particle undergoes a process of alignment or breakdown, which reduces the particle’s resistance to flow. The primary mechanism behind this behavior is the alignment of particles or molecules in the direction of particle flow, which reduces intermolecular forces and thus decreases viscosity. In dispersions, increased shear can break up agglomerates, leading to a more homogeneous mixture with lower viscosity. Increasing the dispersion time from 30 seconds to 90 seconds improves the mixing at consistent shear rates and velocities, resulting in a more even distribution of particles. This process decreases the viscosity in the reactive/intense area, resulting in an overall decrease in viscosity.
3.2. Process Simulation for Velocity Vectors, Flow Patterns and Viscosity Distribution of Anode Pastes at Different Rotational Speeds and Mixing Time
Non-Newtonian fluids exhibit viscosity that changes with shear rate. In these fluids, the concept of effective viscosity helps to simplify the analysis by providing a single value that can be used to describe the fluid’s resistance to flow under specific conditions. The effective viscosity at a given shear rate can be interpreted as the fluid’s apparent viscosity at that rate [24]. Effective viscosity is obtained through computational simulations that solve the governing equations of fluid dynamics, incorporating factors like shear rate, volume fraction, particle size, particle-particle interaction, and fluid compositions [25]. The viscosity of the pre-mix anode paste obtained from the rheometer at a fixed shear rate is employed as the initial input viscosity in the simulation for each measurement.
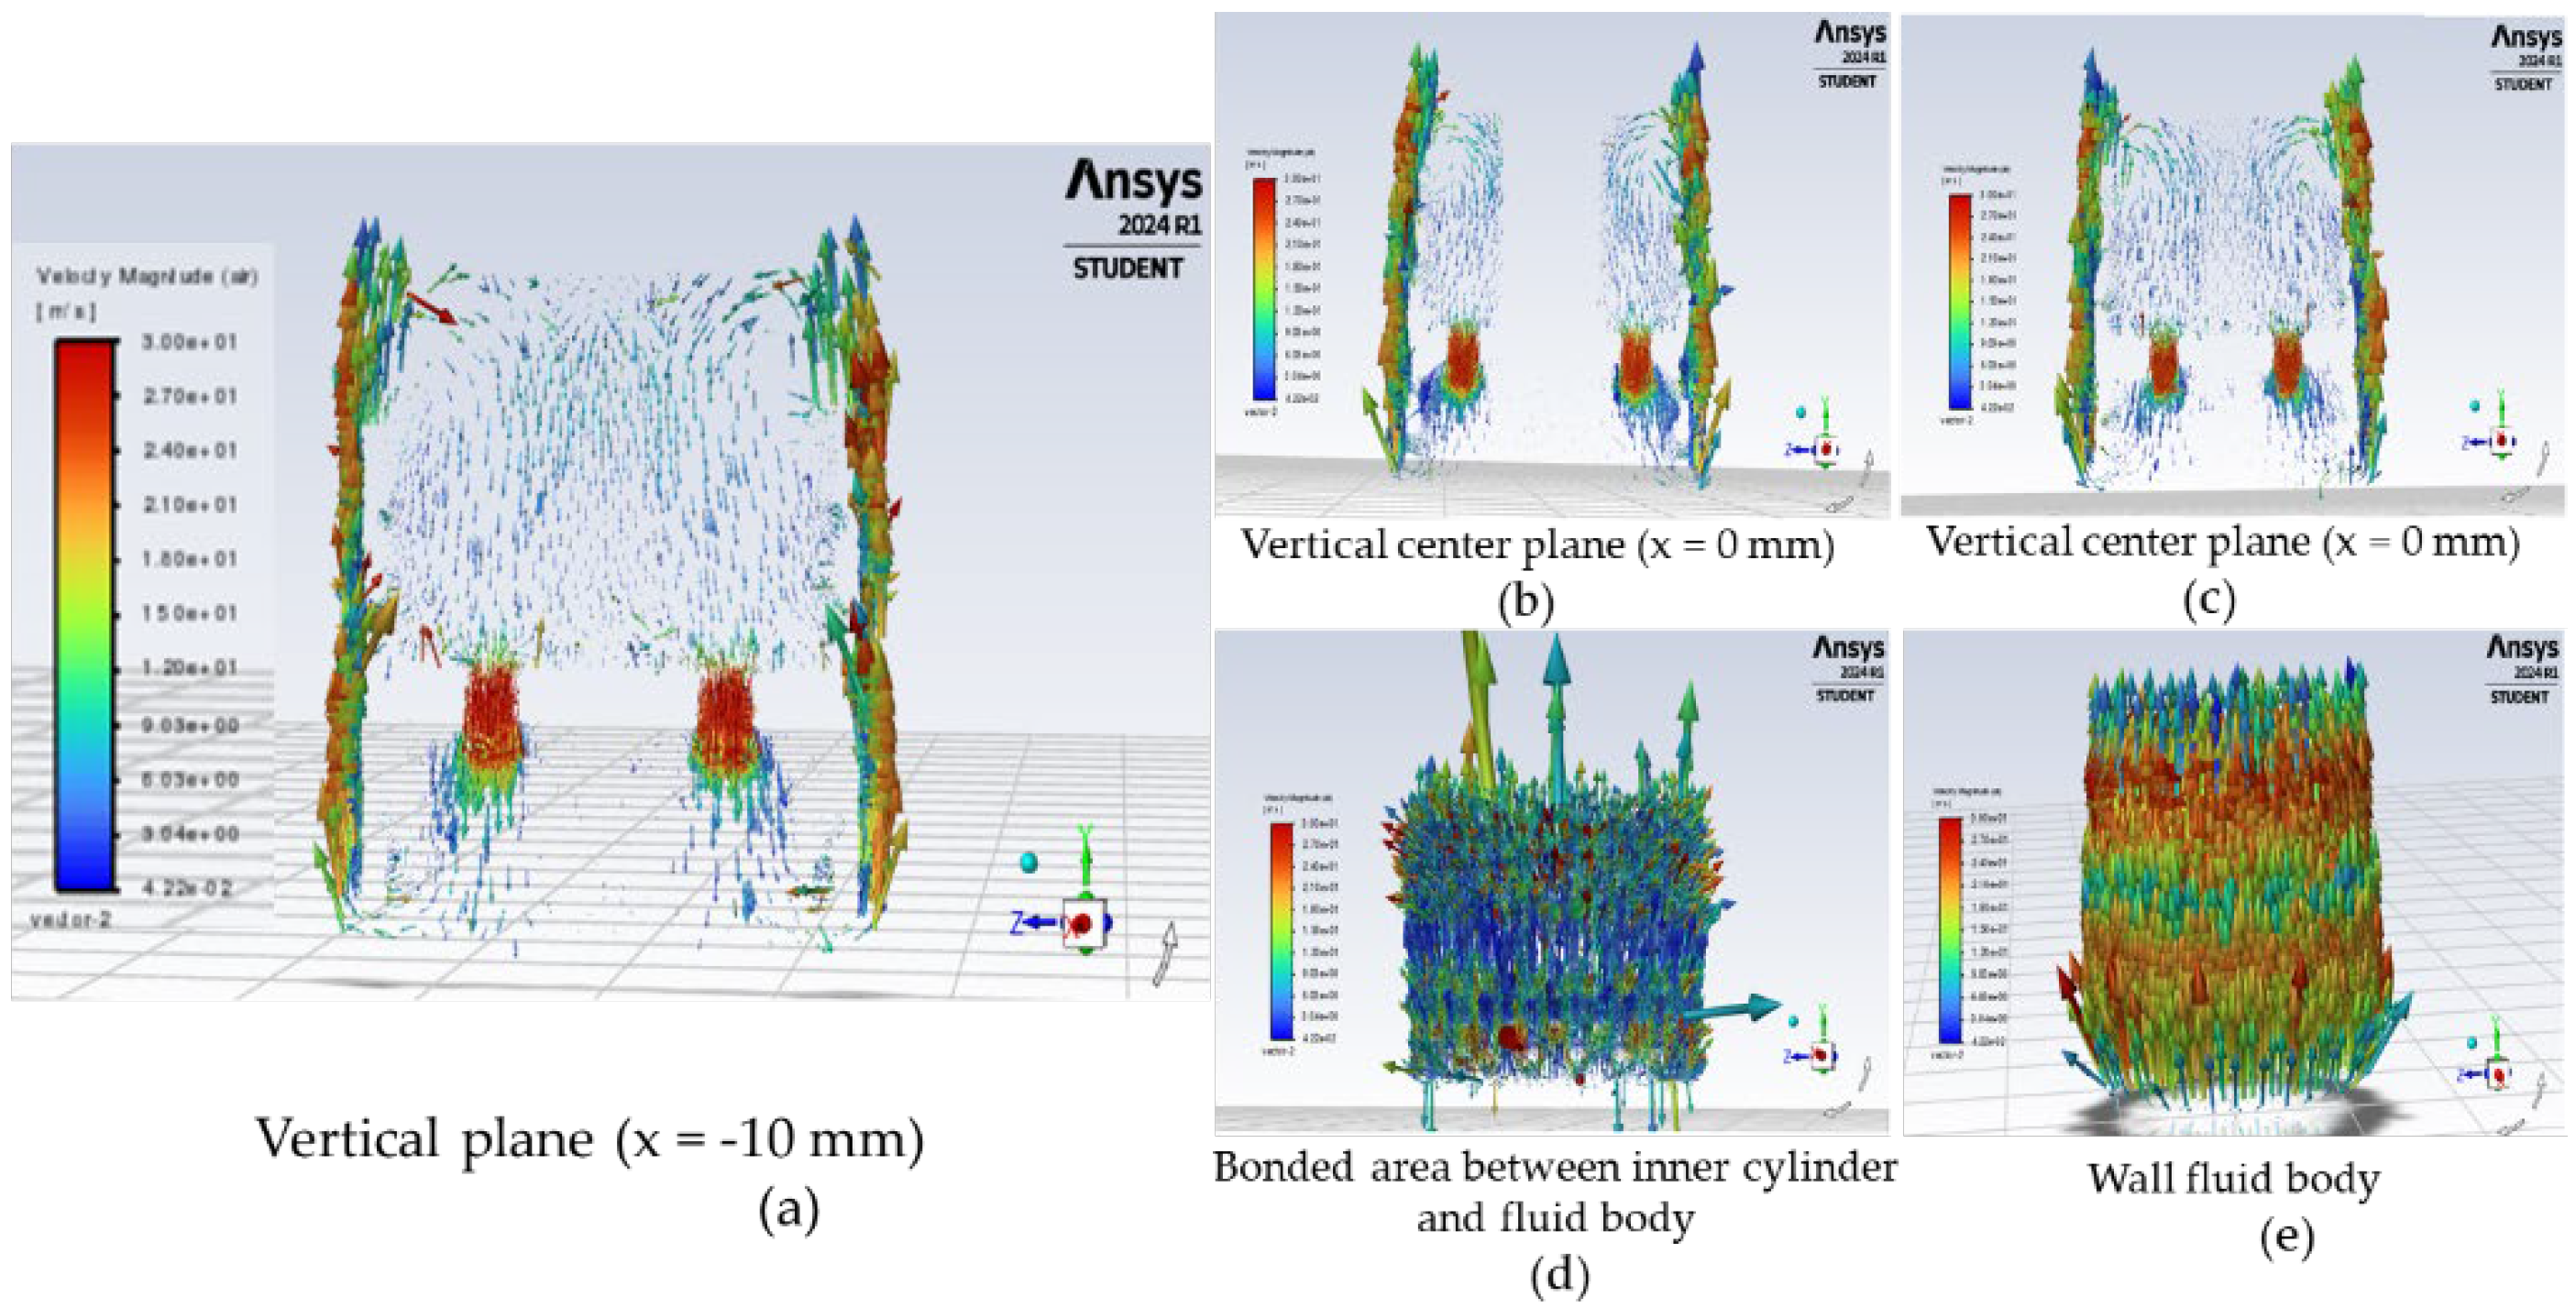
The intricate flow pattern is a consequence of the presence of a high-speed rotor connected with an inner cylinder, which induces recirculation loops. The jets are formed when the momentum flux changes direction from tangential to radial as the fluid hits the inner surface of the moving cylinder and the wall of the fluid body as shown in
Figure 6 [
13]. At the front of each hole, there is a fast-moving stream of fluid that goes from the inside of the hole to the wall of the fluid body [
13,
14,26]. Behind this, the fluid flows back into the hole towards the area where the rotor moves. The vectors in the vicinity of the fluid body wall are longer, indicating higher velocities. Conversely, the shorter vectors in the region between the rotor and the inner surface of the moving cylinder suggest a decrease in speed due to flow obstruction. The formation of vortices is evident in the regions of interaction, which indicates the presence of intense mixing.
The velocity configuration depends on the spatial connection between the rotor and the moving cylinder. The jet is continuously formed at the front of the vessel, dependent of the hole position, whereas the circulation takes place at the bottom end [
13]
. The velocity contour plot in
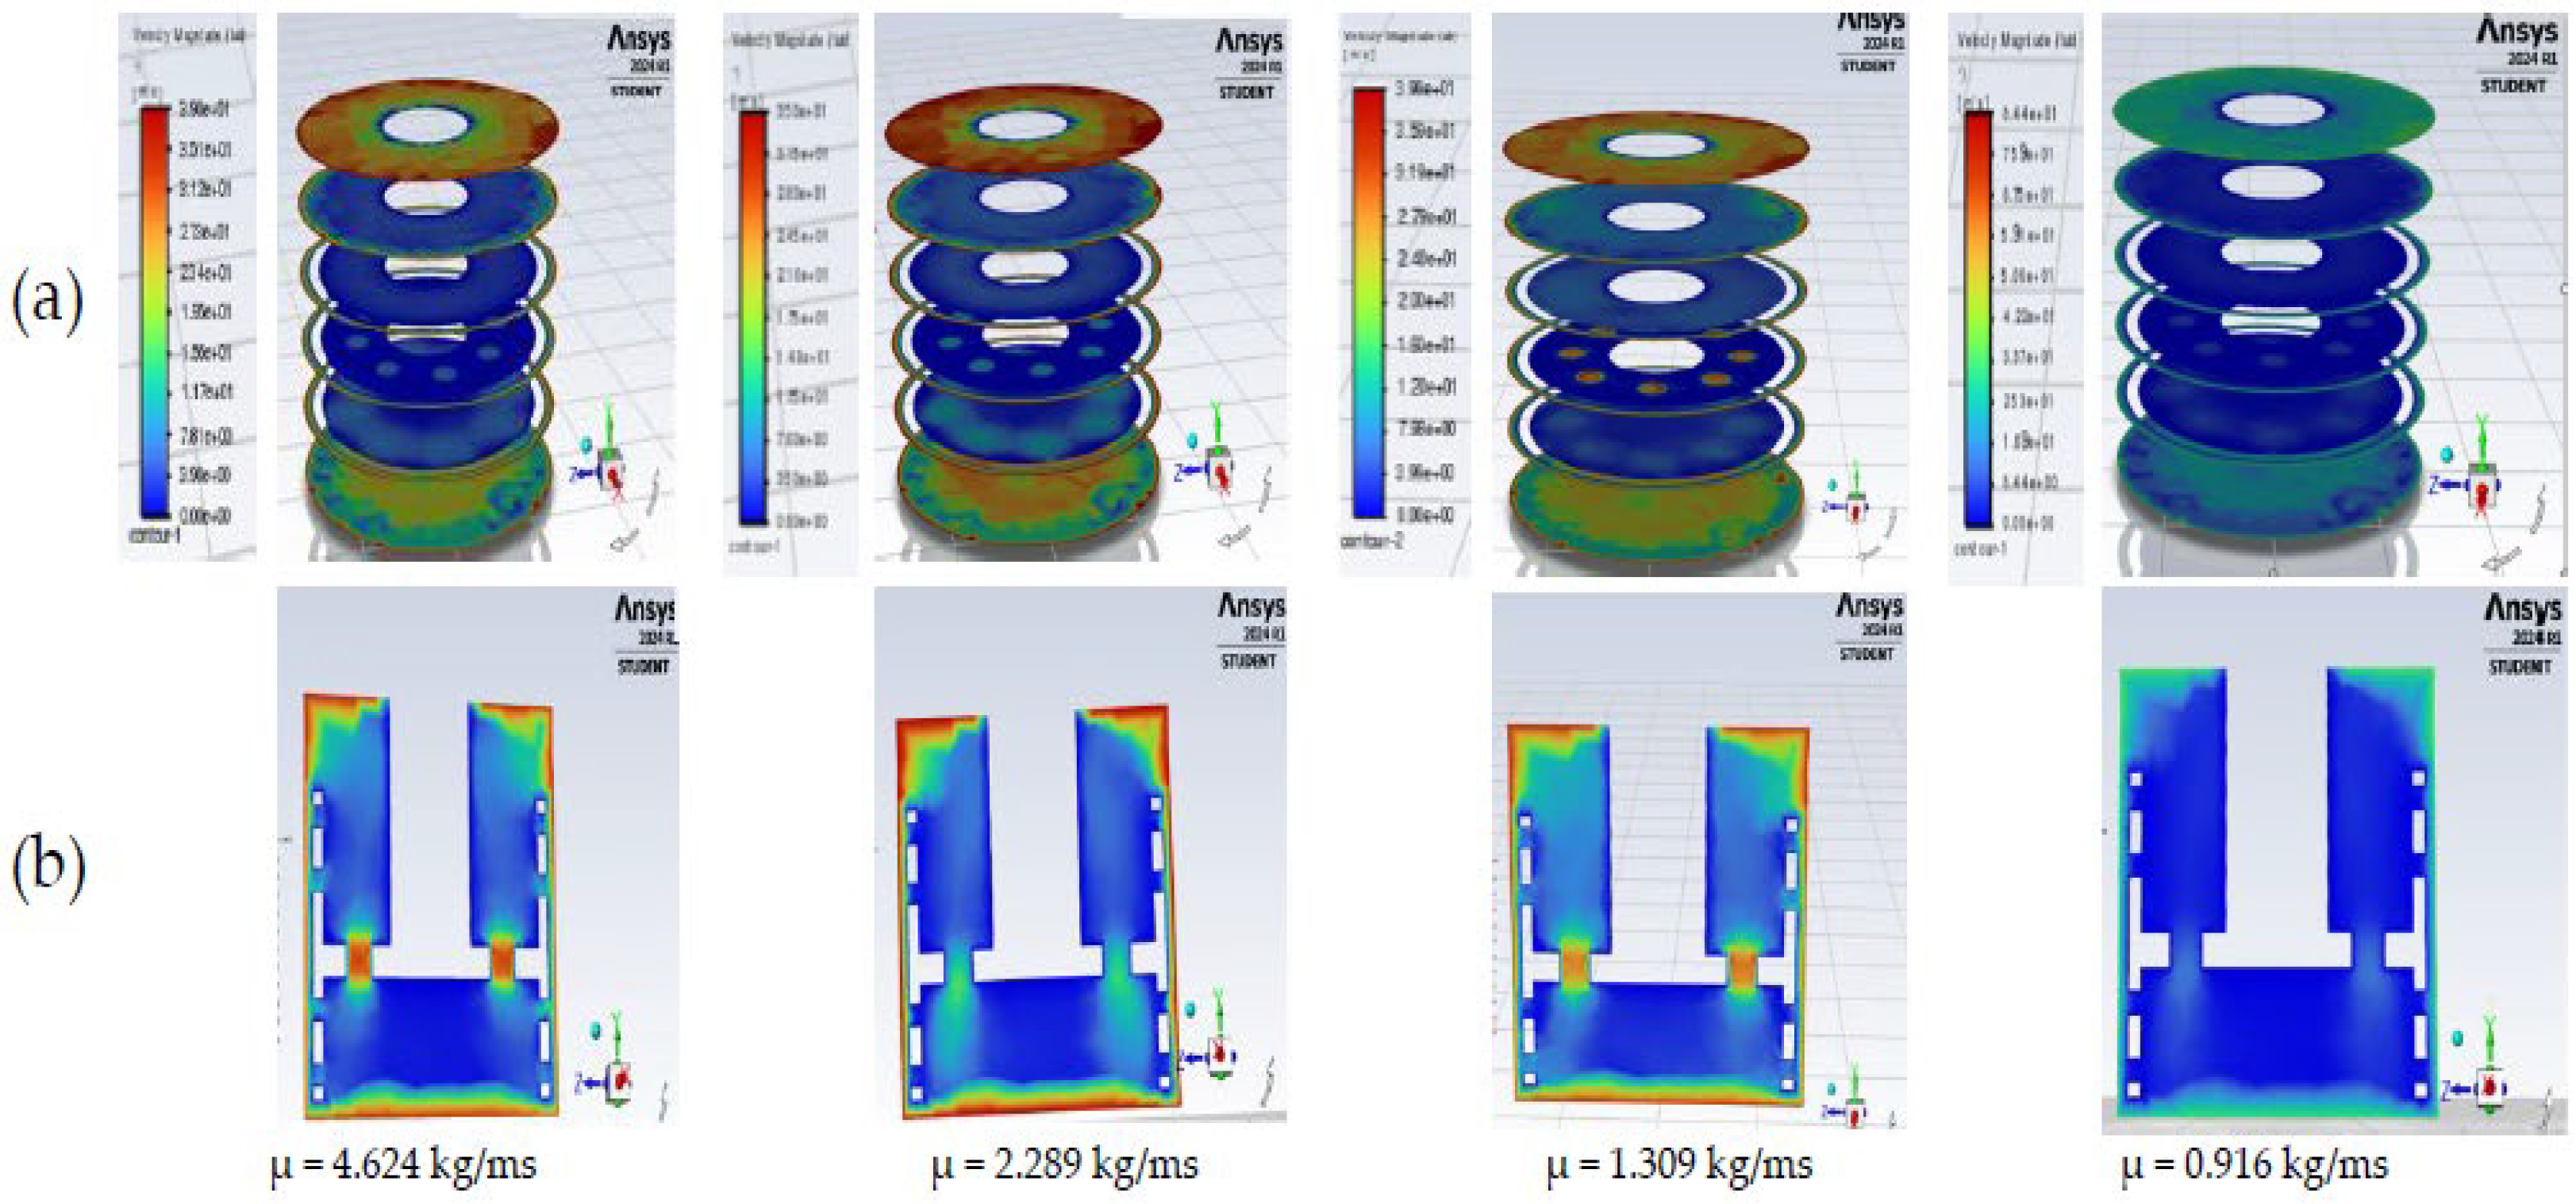
Figure 7 reveals a high-velocity core in the top edge and bottom center, with velocities reaching up to 84.4 m/s. This high-velocity region gradually diminishes as the fluid moves towards the rotor circular plate. The contours also highlight zones of lower velocity at the distance between the rotor and the moving cylinder walls, suggesting potential areas where mixing efficiency is lower. The velocity fluctuation is caused by variations in input viscosity, while all other parameters remain constant. At an input viscosity of 4.624 kg/m-s, the velocity varies from 0 to 39 m/s. However, when the input viscosity reduces to 0.916 kg/m-s, the velocity ranges rise to 0-84.4 m/s, as shown in
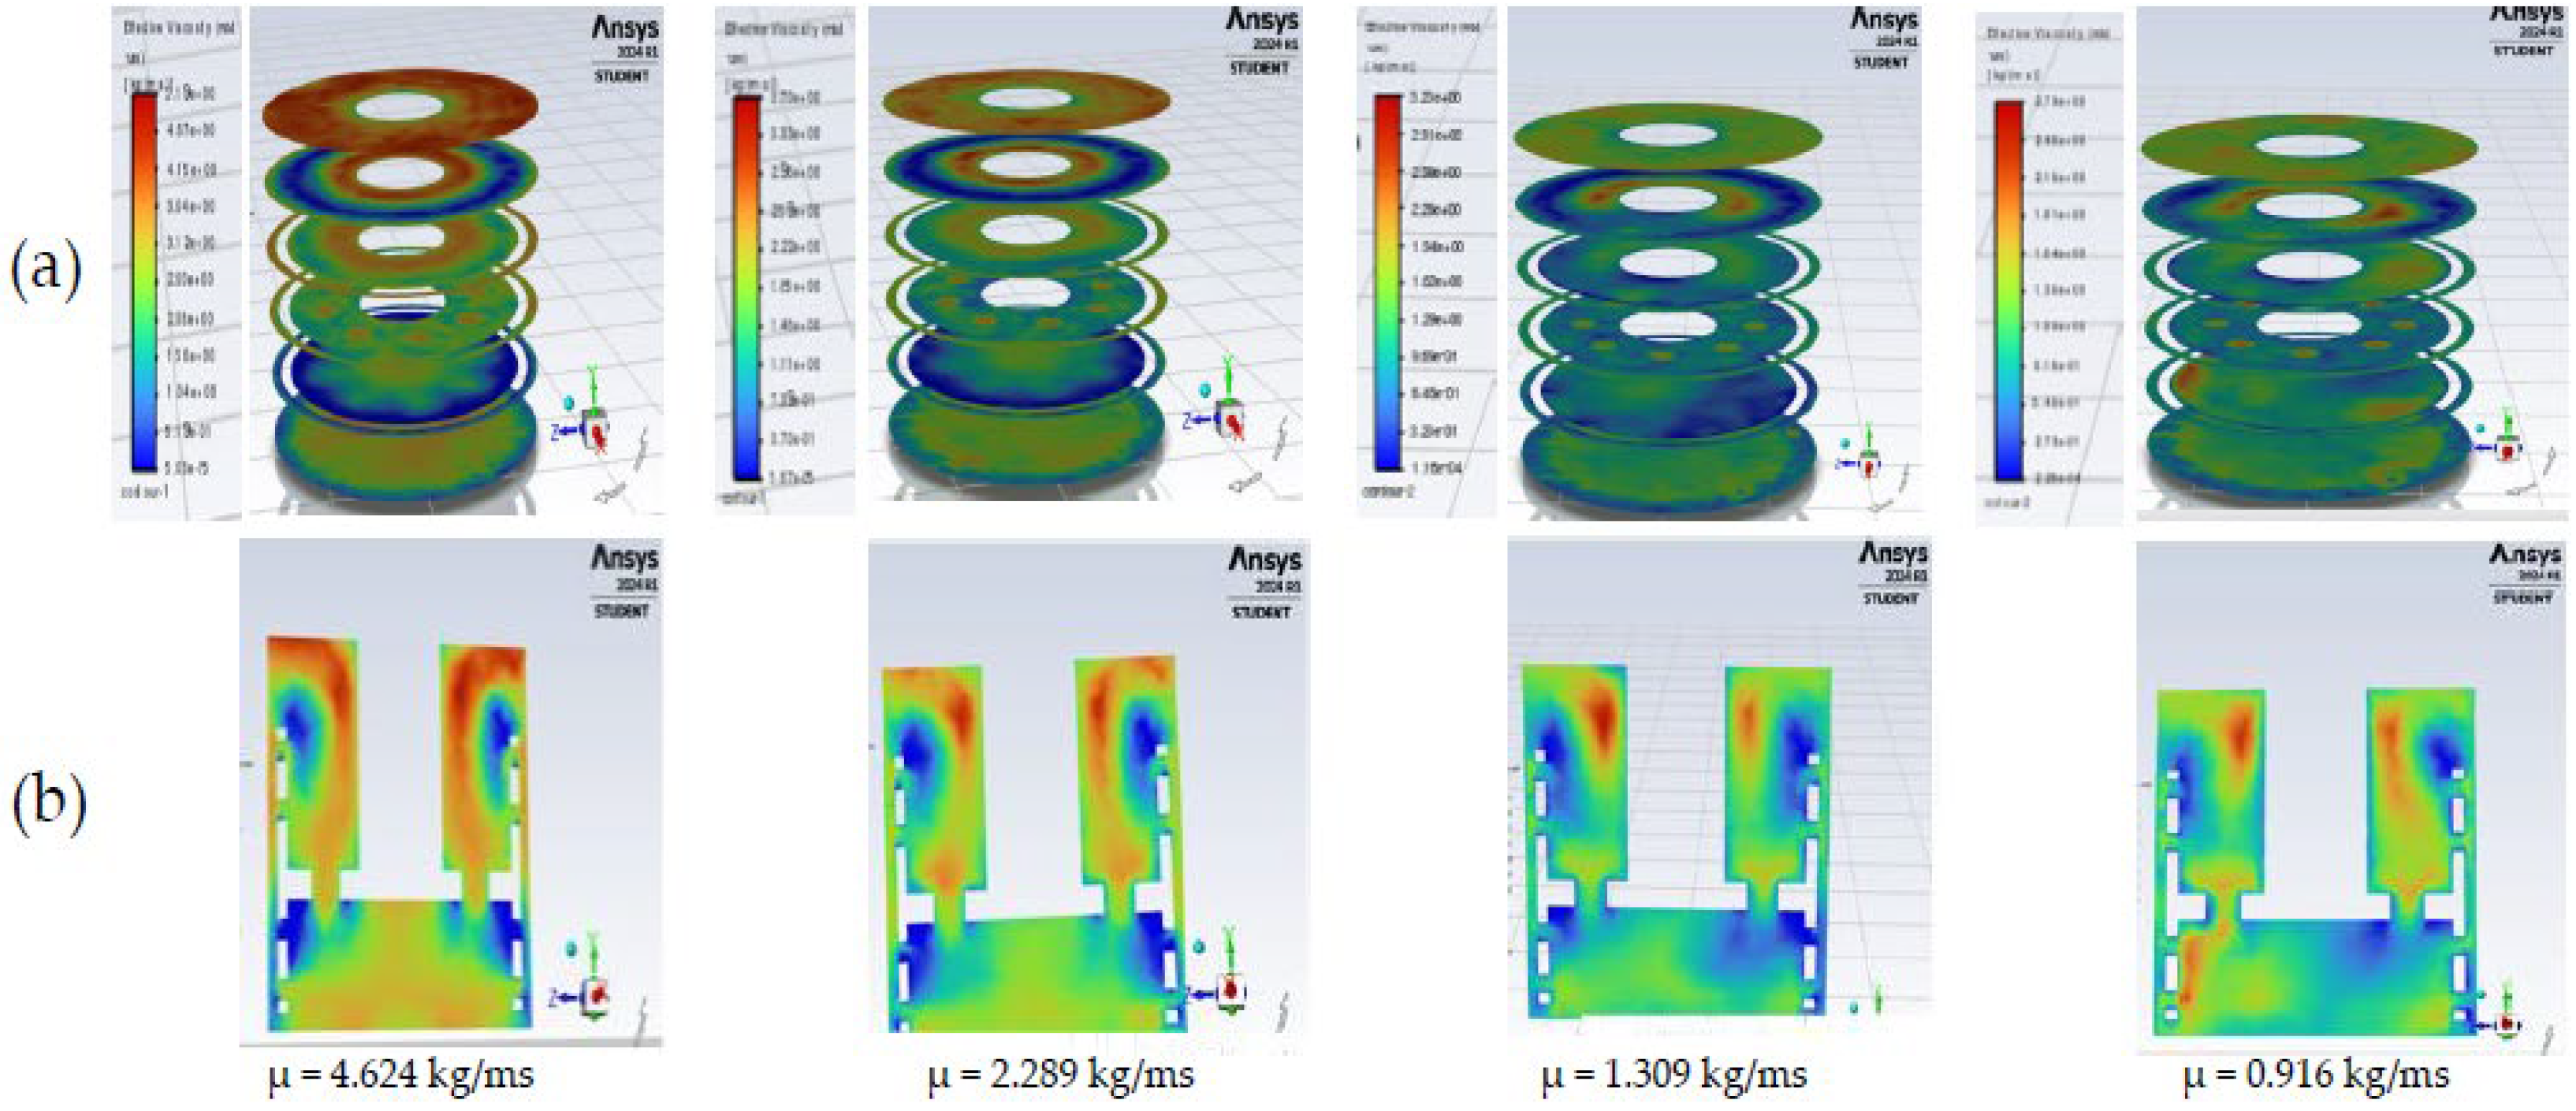
Figure 7. The viscosity contour plot demonstrates notable fluctuations in viscosity throughout the mixer as shown in
Figure 8. In the proximity to the rotor and moving cylinder, the viscosity of the fluid intensifies because of elevated shear stress. In contrast, areas with increased viscosity are detected at the top edge and bottom circulation areas, where shear rates are lower. This can be due to the high-velocity region in the top edge of the cylinder. Furthermore, it has been noticed that the region between the rotors and the inner cylinder exhibits decreased viscosity from 4.624 kg/m-s to 0.916 kg/m-s because of the high shear rate in that position. The viscosity pattern remains consistent at the same radial distance, with slight deviations occurring at input viscosities of 1.05 kg/m-s and 0.916 kg/m-s, as well as when the entire range of viscosity increases.
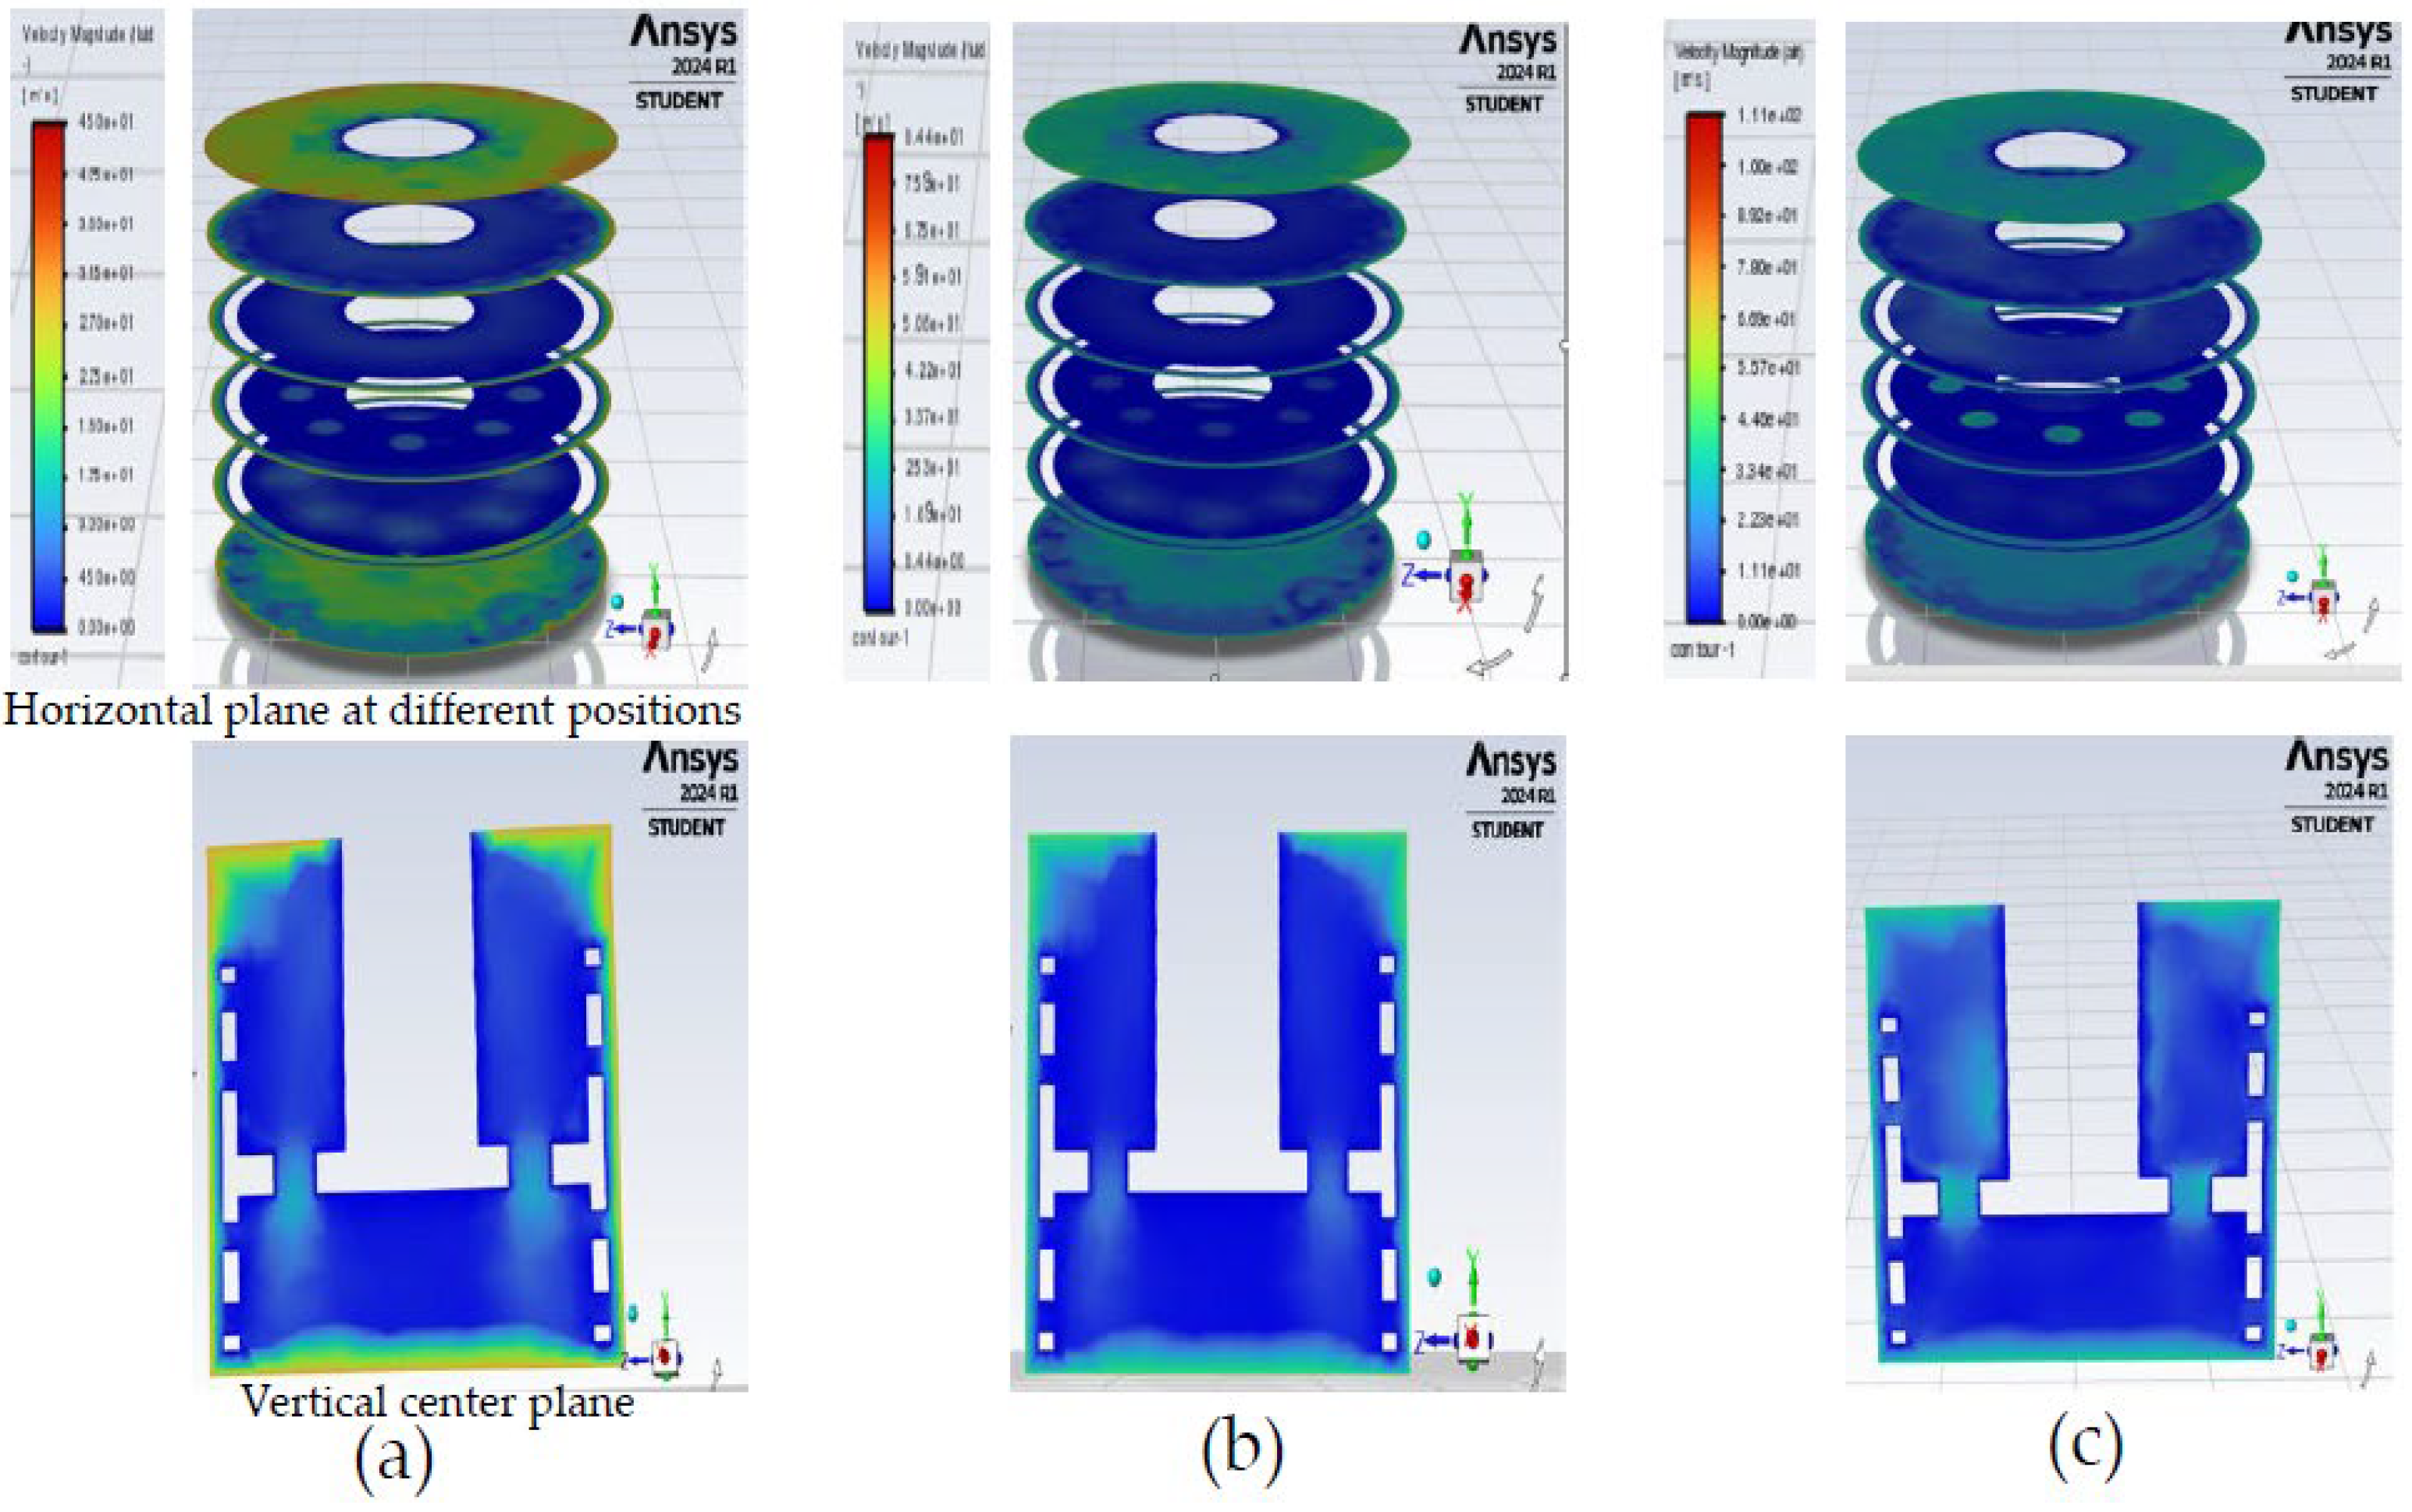
Figure 9 illustrates that the velocity varies between 0 and 45 m/s when the shear rate is 100 s
-1 and the dispersion time is 30 s. Similarly, the velocity ranges from 0 to 84.4 m/s at a shear rate of 35 m/s and from 0 to 111 m/s with a shear rate of 40 m/s. However, in
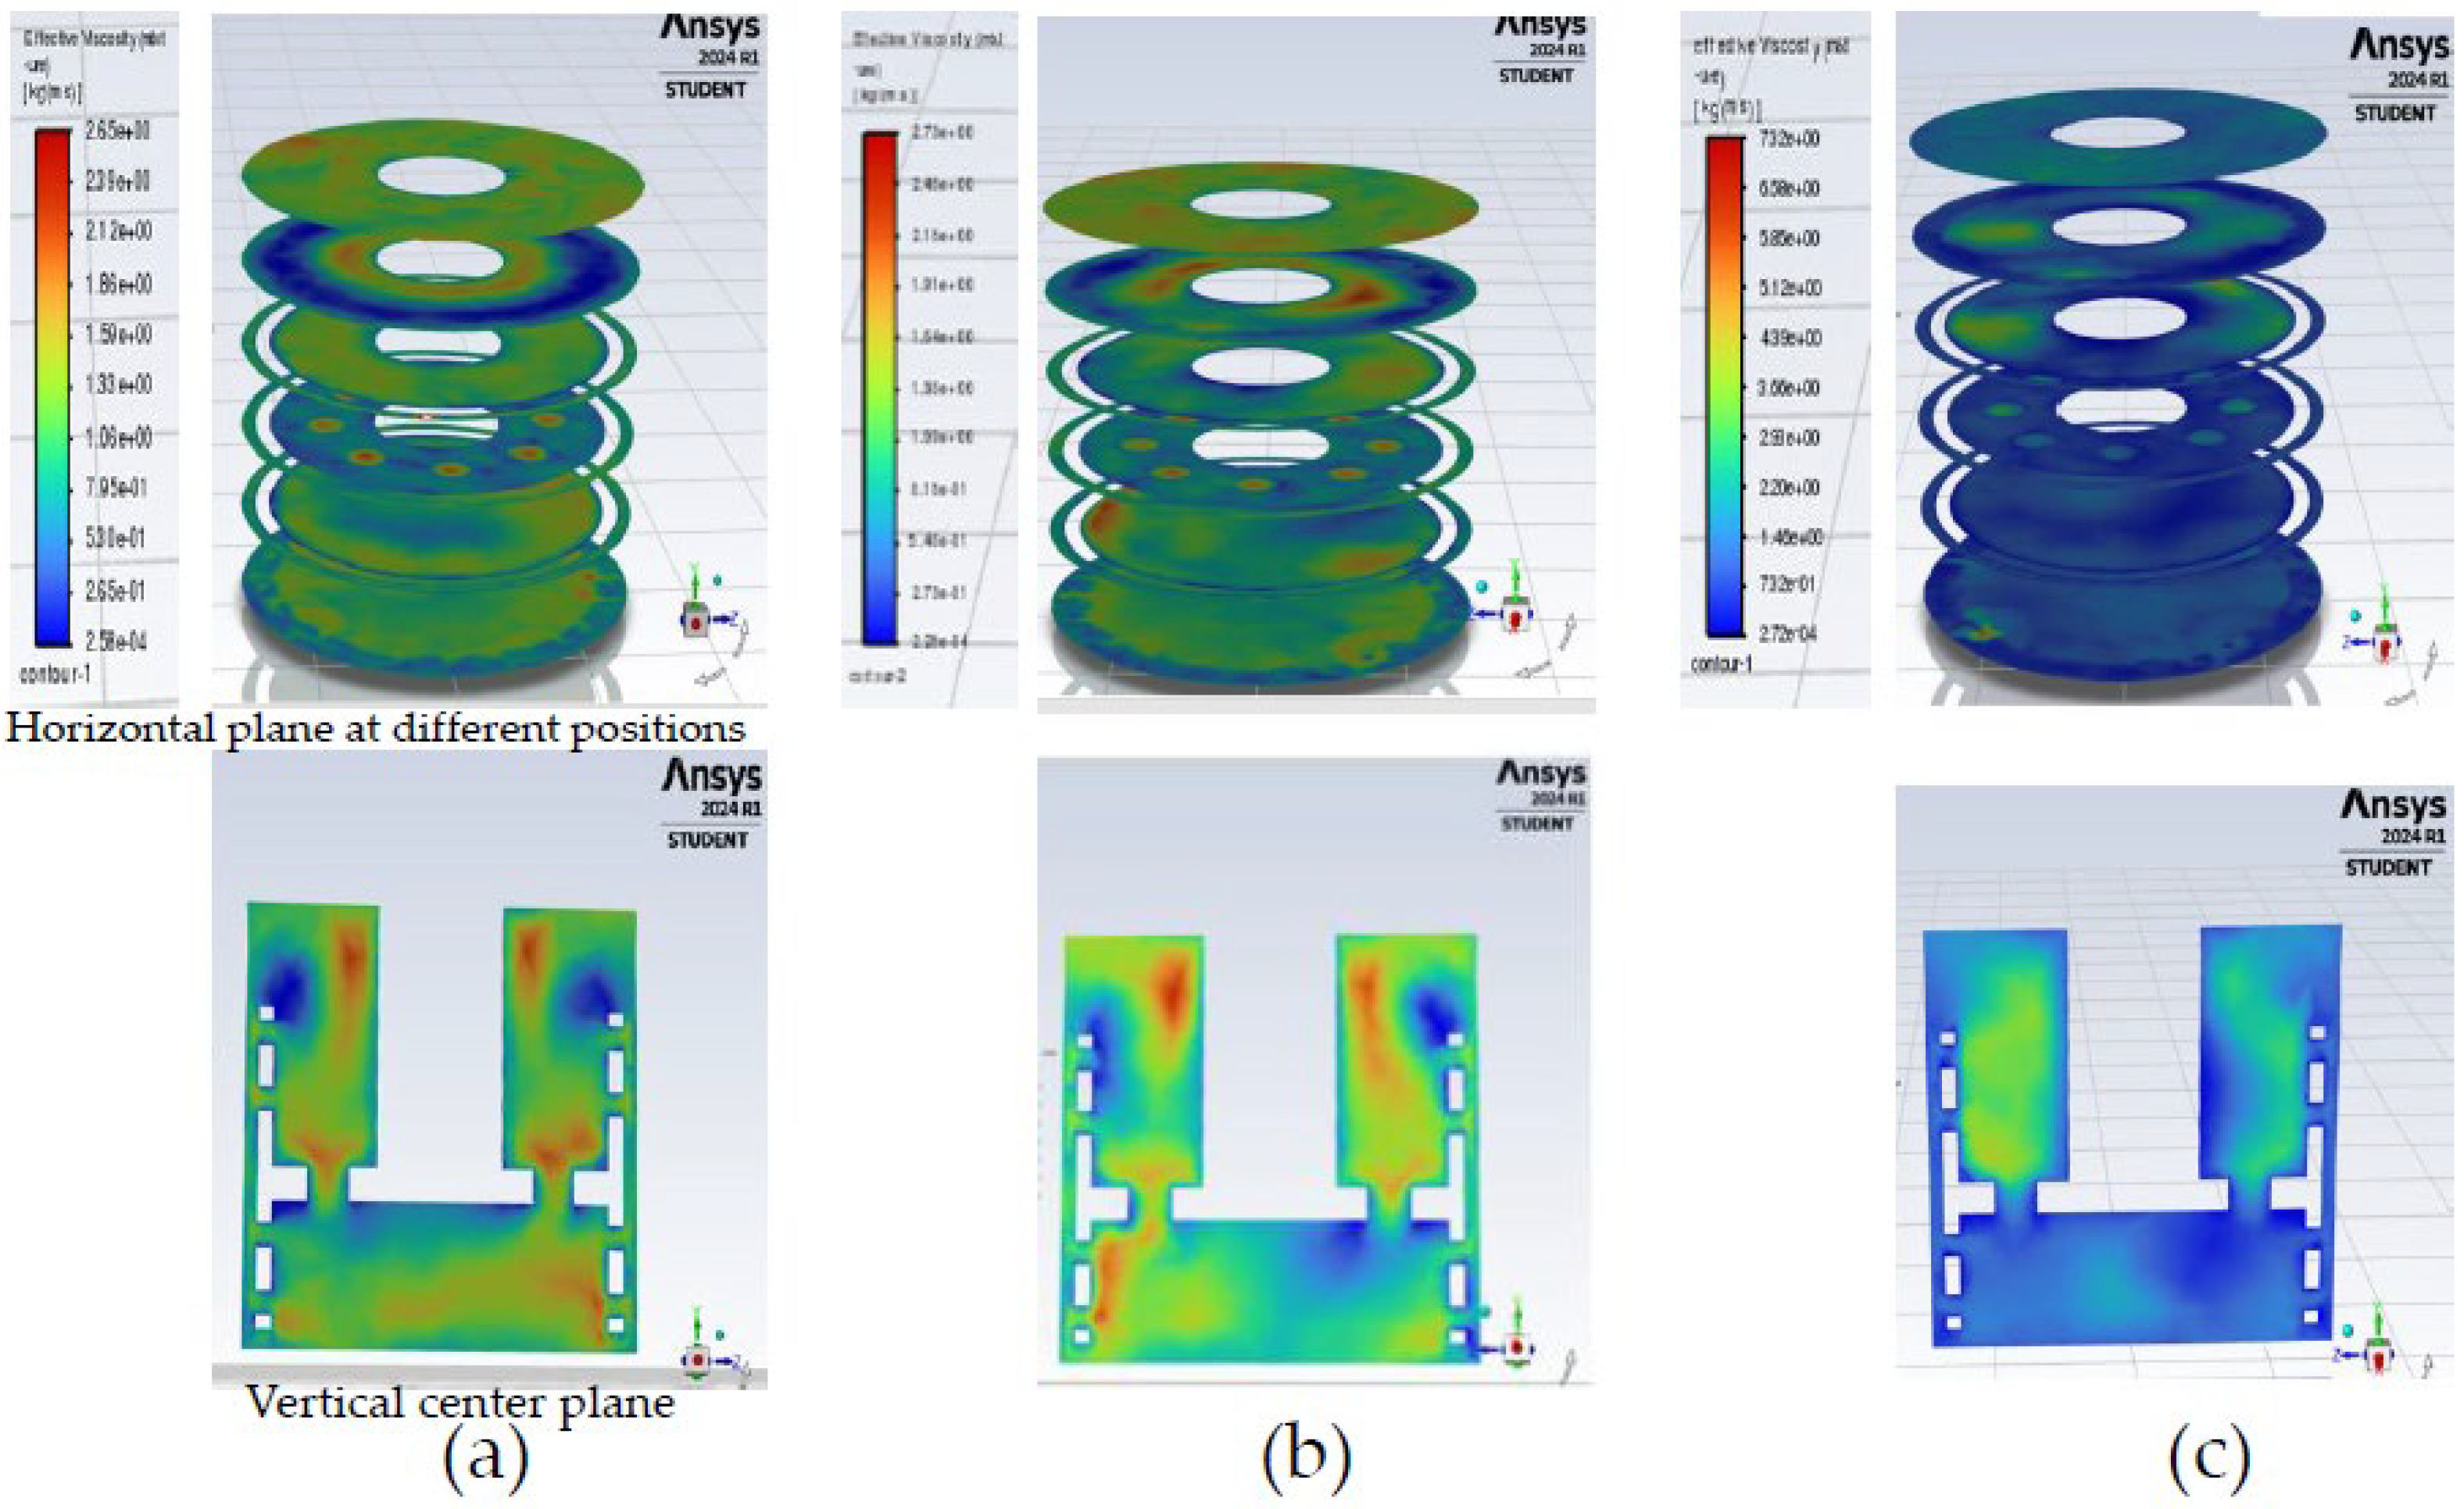
Figure 10, the viscosity varies from 0-2.65 kg/m-s at a velocity of 30 m/s, 0-2.73 kg/m-s at 35 m/s, and 0-7.32 kg/m-s at 40 m/s, with a shear rate of 100 s-1 and a dispersion duration of 30 s.
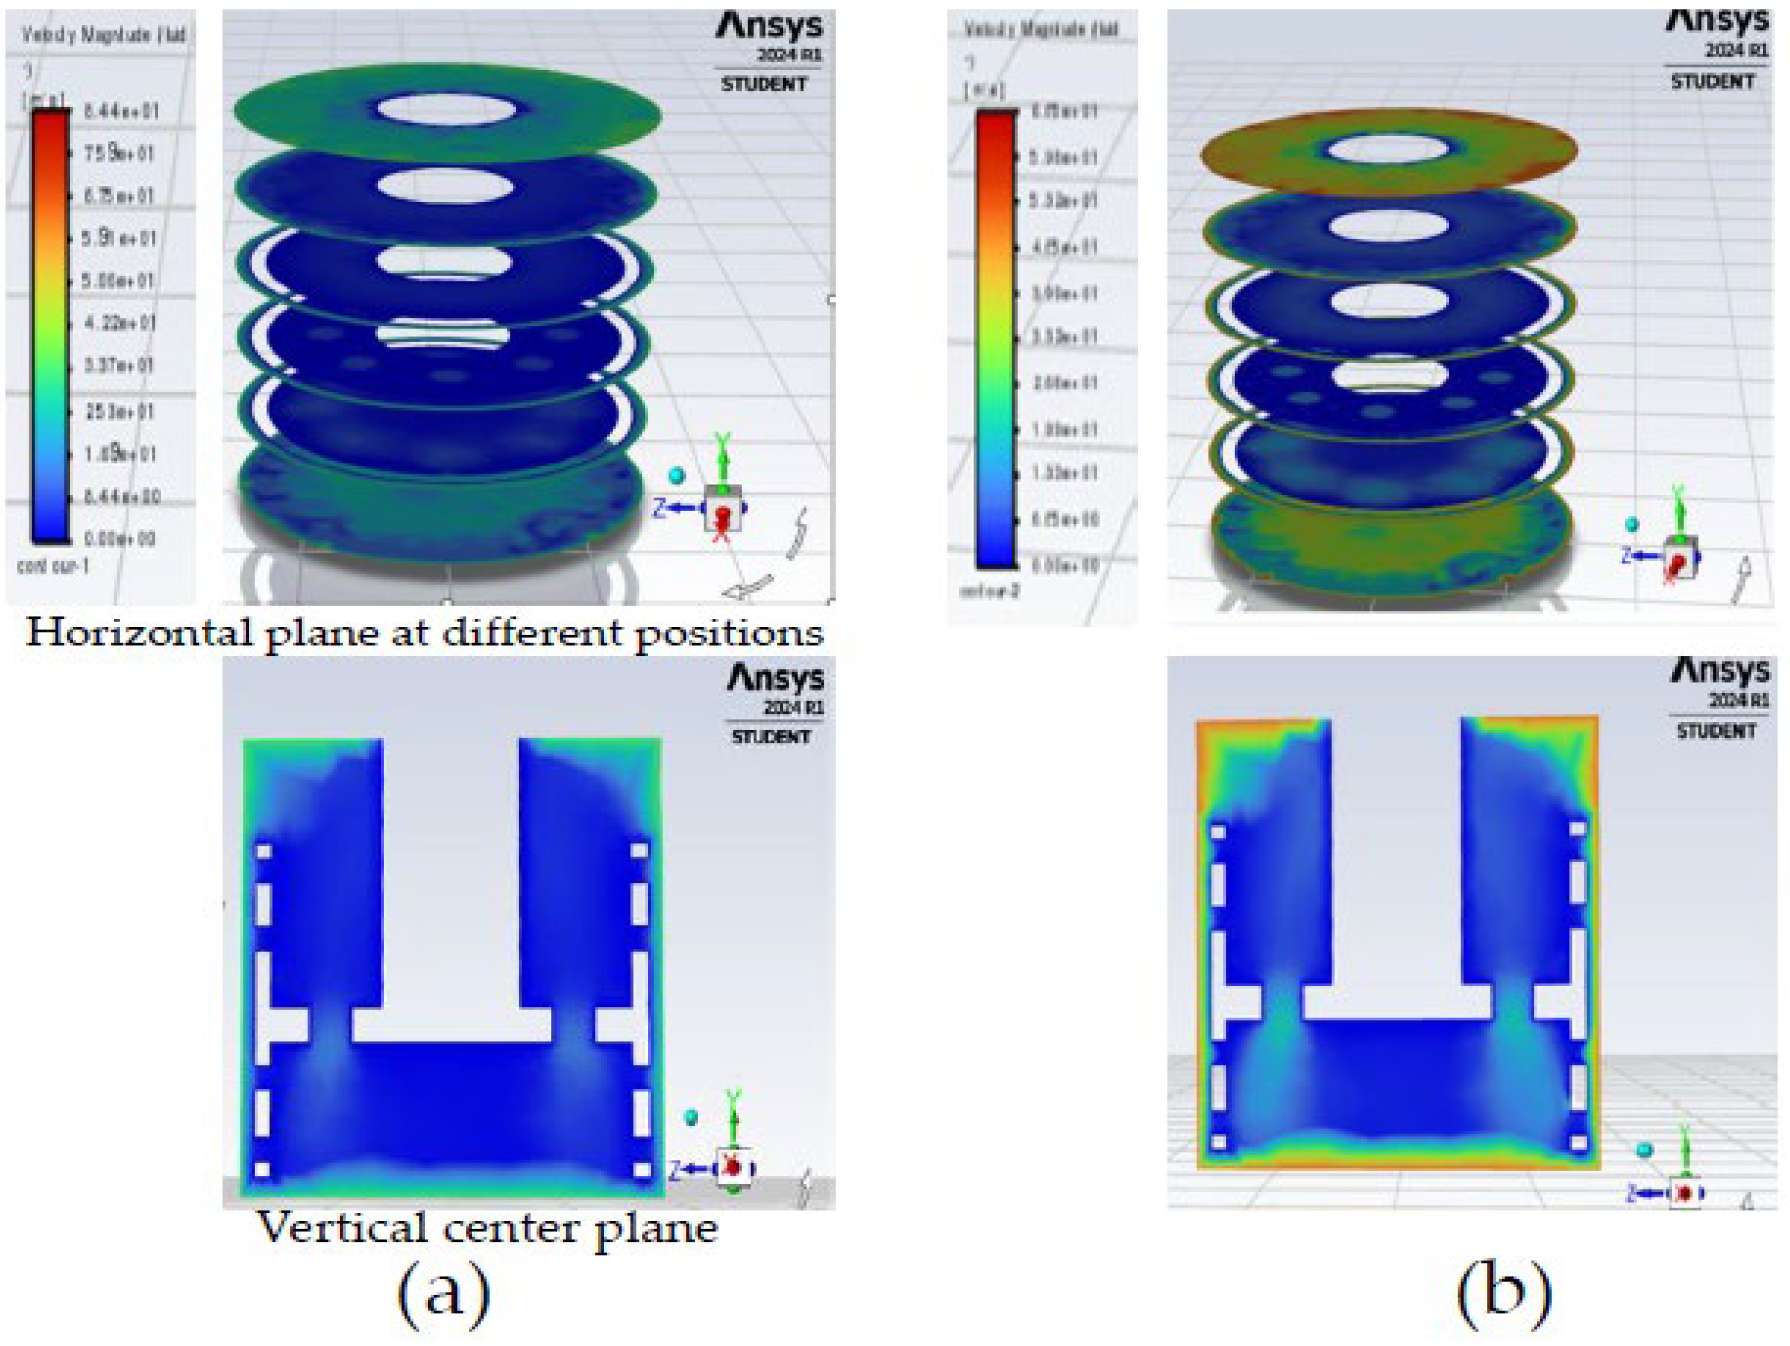
According to
Figure 11, the velocity at 30 s varies from 0 to 84.4 m/s, while at 90 s it ranges from 0 to 67.7 m/s. These measurements were taken at a shear rate of 100 s
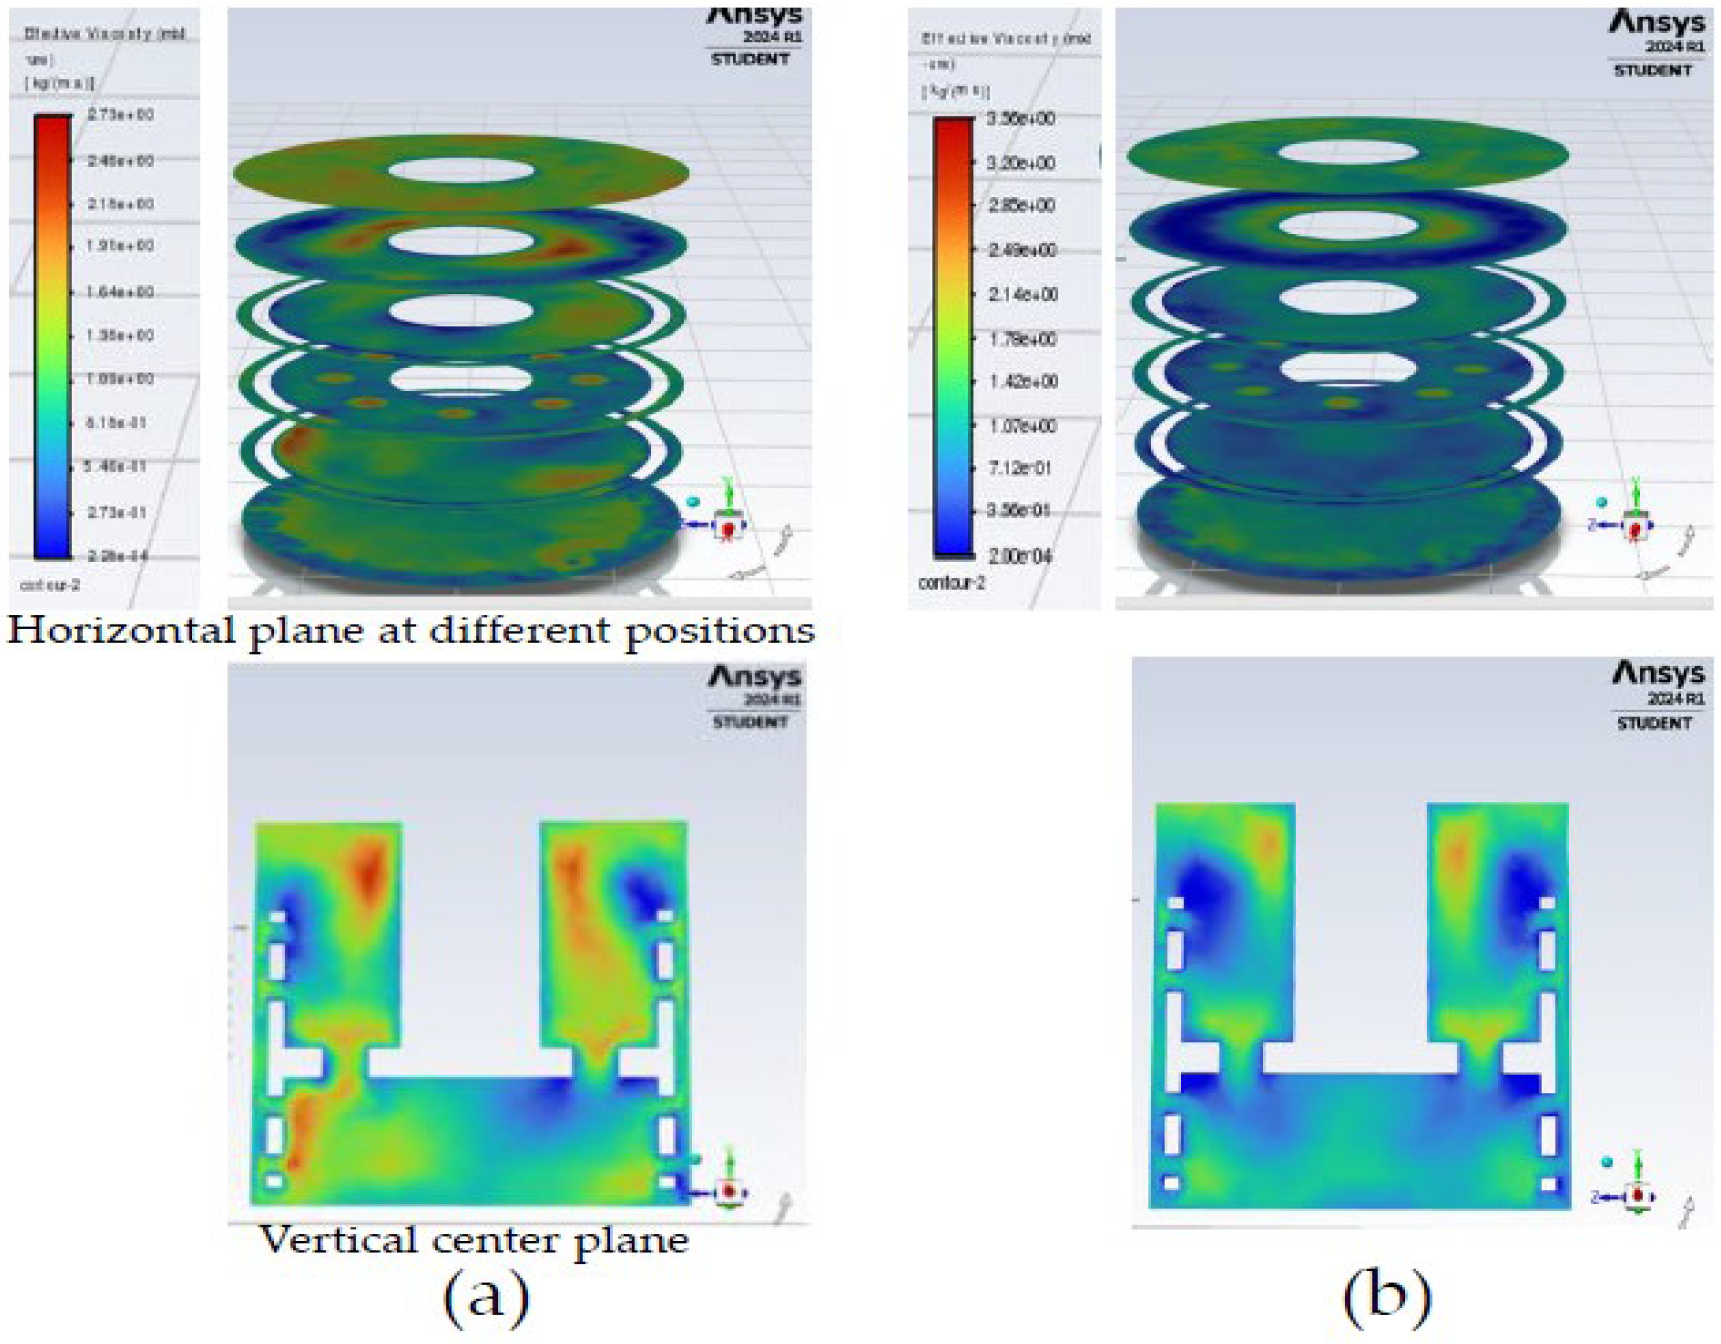
-1 and a rotor speed of 35 m/s. However, in
Figure 12, the viscosity varies between 0-2.73 kg/m-s at 30 s and 0-3.56 kg/m-s at 90 s, with a shear rate of 100 s
-1 and a rotor speed of 35 m/s. As the velocity range reduces, the consistency of the velocity rises as the dispersion time grows from 30 seconds to 90 seconds. The distribution pattern of viscosity is more uniform with a dispersion duration of 90 seconds.
4. Summary and Outlook
The anode paste with 40% solid weight were formulated with disk dissolvers and rotor-stator based mixing equipment in batch scale production. The anode pastes were formulated with different rotational speed and mixing time and physio-chemical properties such as density and viscosity were measured and analyzed. The viscosity-shear rate graph exhibits non-Newtonian shear-thinning behavior. The increase in the mixing velocities from 30 m/s to 40 m/s results in the increase of shear force. The internal structure of the particle undergoes a process of alignment or breakdown, which reduces the particle’s resistance to flow. Increasing the dispersion time from 30 seconds to 90 seconds improves the mixing at consistent shear rates and velocities, resulting in a more even distribution of particles. This process decreases the viscosity in the reactive/intense area, resulting in an overall decrease in viscosity. The multiphase Eulerian-Eulerian CFD model were developed using ANSYS Fluent to simulate the dispersion process of anode paste. These models depicted the fluid jets, and the momentum flux changes during the dispersion process. The velocity contour plot reveals a high-velocity core in the top edge and bottom center showing high mixing efficiency. This high-velocity region gradually diminishes as the fluid moves towards the rotor circular plate. These contours also highlight zones of lower velocity at the distance between the rotor and the moving cylinder walls, suggesting potential areas where mixing efficiency is lower. The viscosity contour plot demonstrates notable fluctuations in viscosity throughout the mixer. In the proximity to the rotor and moving cylinder, the viscosity of the fluid intensifies because of elevated shear stress. In contrast, areas with increased viscosity are detected at the top edge and bottom circulation areas, where shear rates are lower. Due to the intricate nature of the simulated case, further enhancements and investigations are required. Performing a sensitivity approach study on the dispersion time within the range of 30 s to 90 s is a potential method for determining the optimal value of the dispersion duration. In addition, there is an opportunity to improve the calculation of the shear rate, and it is suggested that tetrahedral or poly-hexacore meshing be used in future research to ensure precise CFD simulation.
Author Contributions
Conceptualization, Formal analysis, writing—original draft preparation, writing—review and editing, Md. Shaheen Alam, Mohammed Shariq, Dominik Nemec; Methodology, software, validation, Md. Shaheen Alam, Mohammed Shariq; Supervision, Project administration, Dominik Nemec; Funding, Acquisition, Mohammed Shariq; Dominik Nemec. All authors have read and agreed to the published version of the manuscript.
Funding
This research was funded by from the Indo-German Science & Technology Centre Industrial Fellowship Post-Doctoral Industrial Fellowship 2023 (grant no. IGSTC/IF 2023/PDIF/MS-296/25/2023-24).
Data Availability Statement
The data presented in this study are included in the article, further inquiries can be directed to the corresponding author.
Conflicts of Interest
The authors declare no conflict of interest.
References
- T. Kim, W. Song, D. Y. Son, L. K. Ono, and Y. Qi, “Lithium-ion batteries: outlook on present, future, and hybridized technologies,” Journal of Materials Chemistry A, vol. 7, no. 7. Royal Society of Chemistry, pp. 2942–2964, 2019. [CrossRef]
- B. Diouf and R. Pode, “Potential of lithium-ion batteries in renewable energy,” Renewable Energy, vol. 76. Elsevier Ltd., pp. 375–380, Apr. 01, 2015. [CrossRef]
- B. Kennedy, D. Patterson, and S. Camilleri, “Use of lithium-ion batteries in electric vehicles,” 2000. [Online]. Available: www.elsevier.comrlocaterjpowsour . [CrossRef]
- A. H. Alexopoulos, D. Maggioris, and C. Kiparissides, “CFD analysis of turbulence non-homogeneity in mixing vessels A two-compartment model,” 2002. [Online]. Available: www.elsevier.com/locate/ces . [CrossRef]
- L. Xie, Q. A. Wang, X. J. Luo, and Z. H. Luo, “CFD Simulation of the Particle Dispersion Behavior and Mass Transfer-Reaction Kinetics in non-Newton Fluid with High Viscosity,” International Journal of Chemical Reactor Engineering, vol. 17, no. 7, 2019. [CrossRef]
- A. W. Nienow, “On Impeller Circulation and Mixing Effectiveness in the Turbulent Flow Regime.,” Chem Eng Sci, vol. 52, pp. 2557–2565, 1997. [CrossRef]
- Z. Trad, J.P. Fontaine, C. Larroche, and C. Vial, “Experimental and Numerical Investigation of Hydrodynamics and Mixing in a Dual- Impeller Mechanically-Stirred Digester.,” Chemical engineering journal, vol. 329, pp. 142–155, 2017. [CrossRef]
- R. Wolfgang, “TURBULENCE MODELS AND THEIR APPLICATION IN HYDRAULICS- A state of art reviews,” 2017.
- N. C. Markatos, “The mathematical modelling of turbulent flows,” 1986. [CrossRef]
- C. Xuereb and J. Bertrand, “3-D hydrodynamics in a tank stirred by a double-propeller system and Klled with a liquid having evolving rheological properties,” Chem Eng Sci, vol. 51, no. 10, pp. 1725–1734, 1996.
- G. R. Kasat, A.R. Khopkar, V.V. Ranade, and A.B. Pandita, “‘CFD Simulation of Liquid-Phase Mixing in Solid–Liquid Stirred Reactor.,’” Chem Eng Sci, vol. 63, pp. 3877–3885, 2008.
- Q. Zhang, Y. Yong, Z.S. Mao, C. Yang, and C. Zhao, “‘Experimental Determination and Numerical Simulation of Mixing Time in a Gas– Liquid Stirred Tank.,’” Chemical Engineering Science, vol. 64, pp. 2926–2933, 2009. [CrossRef]
- A. T. Utomo, M. Baker, and A. W. Pacek, “Flow pattern, periodicity and energy dissipation in a batch rotor-stator mixer,” Chemical Engineering Research and Design, vol. 86, no. 12, pp. 1397–1409, Dec. 2008. [CrossRef]
- T. P. John, J. S. Panesar, A. Kowalski, T. L. Rodgers, and C. P. Fonte, “Linking power and flow in rotor-stator mixers,” Chem Eng Sci, vol. 207, pp. 504–515, Nov. 2019. [CrossRef]
- E. Stenmark, “On Multiphase Flow Models in ANSYS CFD Software.”.
- John R. Thome, Engineering Data Book III. Decatur, Alabama, USA: Wolverine Tube, Inc, 2004.
- T. Bikmukhametov, O. J. Nydal, and C. Lawrence, “CFD Simulations of Multiphase Flows with Particles,” 2016.
- Olli Visuri, Gijsbert A. Wierink, and Ville Alopaeus, “Investigation of drag models in CFD modeling and comparison to experiments of liquid–solid fluidized systems,” Int J Miner Process, vol. 104–105, pp. 58–70, Mar. 2012. [CrossRef]
- “Ansys Fluent User’s Guide,” 2023. [Online]. Available: http://www.ansys.com.
- S. K. Lahiri and K. C. Ghanta, “Identifikacija režima proticanja suspenzija u cevovodima - novi pristup modelovanju pomoću veštačkih neuronskih mreža i diferencijalnog prirasta,” Chemical Industry and Chemical Engineering Quarterly, vol. 16, no. 4, pp. 329–343, 2010. [CrossRef]
- T. Nabil, I. El-Sawaf, and K. El-Nahhas, “COMPUTATIONAL FLUID DYNAMICS SIMULATION OF THE SOLID-LIQUID SLURRY FLOW IN A PIPELINE,” 2013.
- T. N. Ofei and A. Y. Ismail, “Eulerian-Eulerian Simulation of Particle-Liquid Slurry Flow in Horizontal Pipe,” Journal of Petroleum Engineering, vol. 2016, pp. 1–10, Sep. 2016. [CrossRef]
- B. E. Launder and D. B. Spalding, “The numerical computation of turbulent flows,” Comput Methods Appl Mech Eng, vol. 3, no. 2, pp. 269–289, 1974. [CrossRef]
- T. Fukui, M. Kawaguchi, and K. Morinishi, “A two-way coupling scheme to model the effects of particle rotation on the rheological properties of a semidilute suspension,” Comput Fluids, vol. 173, pp. 6–16, Sep. 2018. [CrossRef]
- N. Masuyama and T. Fukui, “Numerical simulation of the effects of non-Newtonian property of the solvent on particle suspension rheology,” Advances in Mechanical Engineering, vol. 15, no. 9, Sep. 2023. [CrossRef]
- H. H. Mortensen, D. Arlov, F. Innings, and A. Håkansson, “A validation of commonly used CFD methods applied to rotor stator mixers using PIV measurements of fluid velocity and turbulence,” Chem Eng Sci, vol. 177, pp. 340–353, Feb. 2018. [CrossRef]
Figure 1.
Screwed-on dissolver attached with the disk having D = 50 mm (Dispermat LC 30, VMA-Getzmann, Reichshof, Germany).
Figure 1.
Screwed-on dissolver attached with the disk having D = 50 mm (Dispermat LC 30, VMA-Getzmann, Reichshof, Germany).
Figure 2.
Filmix FM-56 (Thin-Film Mixer, Bühler Holding AG, Switzerland) in batch operation with container open (a) and touch control display (b).
Figure 2.
Filmix FM-56 (Thin-Film Mixer, Bühler Holding AG, Switzerland) in batch operation with container open (a) and touch control display (b).
Figure 3.
ANSYS Fluent multiphase modelling techniques.
Figure 3.
ANSYS Fluent multiphase modelling techniques.
Figure 4.
depicts the viscosity of the pre-mix anode paste as a function of shear rate.
Figure 4.
depicts the viscosity of the pre-mix anode paste as a function of shear rate.
Figure 5.
The viscosity of the anode pastes after Filmix at a constant dispersion time of either (a) 30 s and (b) 90 s was evaluated with varying rotor velocities of 30, 35, and 40 m/s.
Figure 5.
The viscosity of the anode pastes after Filmix at a constant dispersion time of either (a) 30 s and (b) 90 s was evaluated with varying rotor velocities of 30, 35, and 40 m/s.
Figure 6.
Prediction of the velocity vector in different positions.
Figure 6.
Prediction of the velocity vector in different positions.
Figure 7.
The velocity contours represent (a) the horizontal plane at different positions and (b) the vertical center plane for a constant velocity of 35 m/s and dispersion time of 30 s, employing different pre-mixed anode paste viscosities as input to the simulation.
Figure 7.
The velocity contours represent (a) the horizontal plane at different positions and (b) the vertical center plane for a constant velocity of 35 m/s and dispersion time of 30 s, employing different pre-mixed anode paste viscosities as input to the simulation.
Figure 8.
The viscosity contours represent (a) the horizontal planes at different positions, and (b) the vertical center plane for a constant velocity of 35 m/s and dispersion time of 30 s, employing different pre-mixed anode paste viscosities as input in the simulation.
Figure 8.
The viscosity contours represent (a) the horizontal planes at different positions, and (b) the vertical center plane for a constant velocity of 35 m/s and dispersion time of 30 s, employing different pre-mixed anode paste viscosities as input in the simulation.
Figure 9.
The velocity contours were measured at a fixed dispersion time of 30 seconds and a pre-mixed input viscosity of 0.916 kg/m-s against the shear rate of 100 s-1, while varying the rotor velocities: (a) 30 m/s, (b) 35 m/s, and (c) 40 m/s.
Figure 9.
The velocity contours were measured at a fixed dispersion time of 30 seconds and a pre-mixed input viscosity of 0.916 kg/m-s against the shear rate of 100 s-1, while varying the rotor velocities: (a) 30 m/s, (b) 35 m/s, and (c) 40 m/s.
Figure 10.
The velocity contours were measured at a fixed dispersion time of 30 seconds and a pre-mixed input viscosity of 0.916 kg/m-s against the shear rate of 100 s-1, while varying the rotor velocities: (a) 30 m/s, (b) 35 m/s, and (c) 40 m/s.
Figure 10.
The velocity contours were measured at a fixed dispersion time of 30 seconds and a pre-mixed input viscosity of 0.916 kg/m-s against the shear rate of 100 s-1, while varying the rotor velocities: (a) 30 m/s, (b) 35 m/s, and (c) 40 m/s.
Figure 11.
The velocity contours were measured at a fixed rotor velocity of 35 m/s and a pre-mixed input viscosity of 0.916 kg/m-s against the shear rate of 100 s-1, while varying the dispersion times: (a) 30 s and (b) 90 s.
Figure 11.
The velocity contours were measured at a fixed rotor velocity of 35 m/s and a pre-mixed input viscosity of 0.916 kg/m-s against the shear rate of 100 s-1, while varying the dispersion times: (a) 30 s and (b) 90 s.
Figure 12.
The viscosity contours were measured at a fixed rotor velocity of 35 m/s and a pre-mixed input viscosity of 0.916 kg/m-s against the shear rate of 100 s-1, while varying the dispersion times: (a) 30 s and (b) 90 s.
Figure 12.
The viscosity contours were measured at a fixed rotor velocity of 35 m/s and a pre-mixed input viscosity of 0.916 kg/m-s against the shear rate of 100 s-1, while varying the dispersion times: (a) 30 s and (b) 90 s.
Table 1.
A list of the materials used to make the anode pastes, together with information on the producer, registered office, and CAS number.
Table 1.
A list of the materials used to make the anode pastes, together with information on the producer, registered office, and CAS number.
| Chemicals |
CAS number |
Producer |
Registered office |
| TIMEREX SLP50 Graphite |
7782-42-5 |
Imerys Graphite & Carbon Switzerland Ltd. |
Bodio, Switzerland |
| Conductive (Carbon Black) C65 |
333-86-4 |
Imerys Graphite & Carbon Belgium SA |
Willebroek, Belgium |
| BM-451B Styrene-butadiene (SBR) |
9003-55-8 |
ZEON Corporation |
Tokyo, Japan |
| Sodium Carboxymethyl cellulose (Na-CMC) |
9004-32-4 |
SIGMA-AL-DRICH, Co. |
St. Louis, USA |
Table 2.
A list of the equipment that were used, along with their names, manufacturers, and locations.
Table 2.
A list of the equipment that were used, along with their names, manufacturers, and locations.
| Device type |
Device name |
Producer |
Location |
| Dissolver |
Dispermat LC 30 |
VMA-Getzmann |
Reichshof, Deutschland |
| Rotor-stator mixer |
Filmix FM-56 |
Bühler Holding AG |
Uzwil, Switzerland |
| Rheometer |
HAAKE™MARS™II Rheometer |
Thermo Scientific™ |
Waltham, USA |
| Density meter |
DMA 1001 |
Anton Paar GmbH |
Graz, Austria |
| Analytical balance |
XB_620C |
Precisa Gravimetrics AG |
Dietikon, Switzerland |
Table 3.
The formula for making 500 g of anode paste with 40% solids concentration.
Table 3.
The formula for making 500 g of anode paste with 40% solids concentration.
| Material |
Weight Share % |
|
Initial weight / g |
| % amount in solid |
% amount in paste |
| Active Graphite |
93.0 |
37.2 |
186.0 |
| Lead additive carbon black |
2.0 |
0.8 |
4.0 |
| Na-CMC |
3.0 |
1.2 |
6.0 |
| SBR |
2.0 |
0.8 |
4.0 |
| Distilled water |
- |
60 |
300 |
| Sum |
100 |
100 |
500 |
|
Disclaimer/Publisher’s Note: The statements, opinions and data contained in all publications are solely those of the individual author(s) and contributor(s) and not of MDPI and/or the editor(s). MDPI and/or the editor(s) disclaim responsibility for any injury to people or property resulting from any ideas, methods, instructions or products referred to in the content. |
© 2024 by the authors. Licensee MDPI, Basel, Switzerland. This article is an open access article distributed under the terms and conditions of the Creative Commons Attribution (CC BY) license (http://creativecommons.org/licenses/by/4.0/).


