Preprint
Article

Impact of Model Knowledge on Acoustic Emission Source Localization Accuracy

Altmetrics

Downloads

46

Views

33

Comments

0

A peer-reviewed article of this preprint also exists.

Submitted:

09 September 2024

Posted:

09 September 2024

You are already at the latest version

Alerts
Abstract
Reliable and precise damage localization in mechanical structures is of high importance in the context of structural health monitoring (SHM). The acoustic emission (AE) method has already shown its excellent suitability for damage localization. However, low signal-to-noise ratios (SNRs) are often prevalent in SHM, thus an increase in localization accuracy and robustness is still in demand. The present study faces this task through the integration of various model knowledge for AE source localization. The basis of the presented algorithm is the consideration of the dispersive behavior of elastic waves in thin-walled structures. The continuous wavelet transform (CWT) is used to obtain time-frequency representations of the signals, where frequency-dependent values for time-of-arrival (TOA) are extracted. Furthermore, the algorithm incorporates the knowledge that all sensors receive signals with the same time and location of origin, as well as the slightly different sensitivity of the theoretically equal sensors. The final localization results are achieved by a two-parameter grid search optimization. The algorithm is experimentally tested on a large aluminum plate with four piezoelectric wafer active sensors (PWASs) arranged in an array of 100 mm × 100 mm. The mean localization error of pencil lead breaks at ten different positions within the sensor array is used as an accuracy measure. It is shown that as more of the described model knowledge is incorporated into the localization, the accuracy increases. With the final algorithm, the mean localization error is more than halved compared to AE localization based on classical TOA estimation. Although the experiment described is conducted under laboratory conditions, the remarkable increase in accuracy suggests that AE source localization may be successful even at low SNR as typical for operational conditions.
Keywords: 
Subject: Engineering  -   Mechanical Engineering

1. Introduction

Highly optimized lightweight structures play an important role in enabling efficient and sustainable operation in various industries, e.g., in aviation. Often lightweighting of mechanical structures is accompanied by an increased risk of catastrophic failure, caused by material uncertainties or misuse. For aircraft, costly inspection programs are used to ensure safe operation. An approach to reduce inspection costs is structural health monitoring (SHM). SHM is the continuous and on-board monitoring of the condition of a mechanical structure by an integrated system of sensors [1]. In recent years much research was done in the development of SHM methods using different physical principles for damage identification [2]. Among these, the acoustic emission (AE) method is of great interest, as AE is not just able to detect damages, but also demonstrated its excellent suitability to locate damages in mechanical structures [3,4]. Triangulation is one of the most popular AE source localization techniques [5]. It is based on the time difference of arrival (TDOA) of the sensors (minimum three sensors for 2D localization) applied to the mechanical structure. Consequently, the most crucial part of accurate AE source localization is the precise extraction of time of arrival (TOA) of each sensor signal. Other commonly used AE source localization algorithms are modal acoustic emission (MAE), beamforming, or data-driven algorithms utilizing machine learning methods [6]. MAE uses the different TOAs and group velocities of the S0 and A0 wave modes, with the advantage that fewer sensors are required for localization [5]. Beamforming is a robust AE source localization method that is, e.g., advantageous for large structures. However, in terms of accuracy, beamforming cannot compete with methods based on precise TOA extractions [7]. Other popular approaches are data-driven localization methods using different machine learning model classes. Such data-driven approaches are suitable for highly anisotropic materials or complex structures. Drawbacks of the data-driven approaches are the requirements of representative training data and the difficult transferability from a trained model to test objects of different materials and geometry. Moreover, to obtain precise localization results one highly relevant input parameter for the data-driven methods is often still some kind of TOA information [6]. Therefore, accurate TOA estimation is still the most critical part for AE source localization algorithms, which have already demonstrated their ability to produce highly accurate localization results. The difficulty of precise TOA extraction strongly increases as the signal-to-noise ratio (SNR) decreases which is typically the case for SHM applications.   
SHM is intended for operational conditions, i.e., environmental noise is likely to be present and signal attenuation may be dominant due to larger distances from the AE source to the sensors. In addition, certain types of damage, e.g. corrosion, inherently result in low-amplitude AE signals [8]. Such circumstances lead to low SNRs, making accurate TOA estimation more difficult and thus AE source localization less reliable and accurate.
This contribution presents an algorithm that incorporates model knowledge for robust and accurate TOA extraction and AE source localization. Dispersion of elastic waves in homogeneous thin-walled structures of isotropic material is considered to increase the robustness by extracting multiple frequency-dependent values for TOA. The constraint that all sensors receive a signal caused by an AE event of the same time and place of origin is implemented. Finally, the slight differences in sensor sensitivity between the theoretically equal sensors used are considered. A remarkable increase in localization accuracy as more of the described model knowledge is incorporated into the algorithm is demonstrated in an experimental investigation.

2. Model-Based AE Source Localization Algorithm

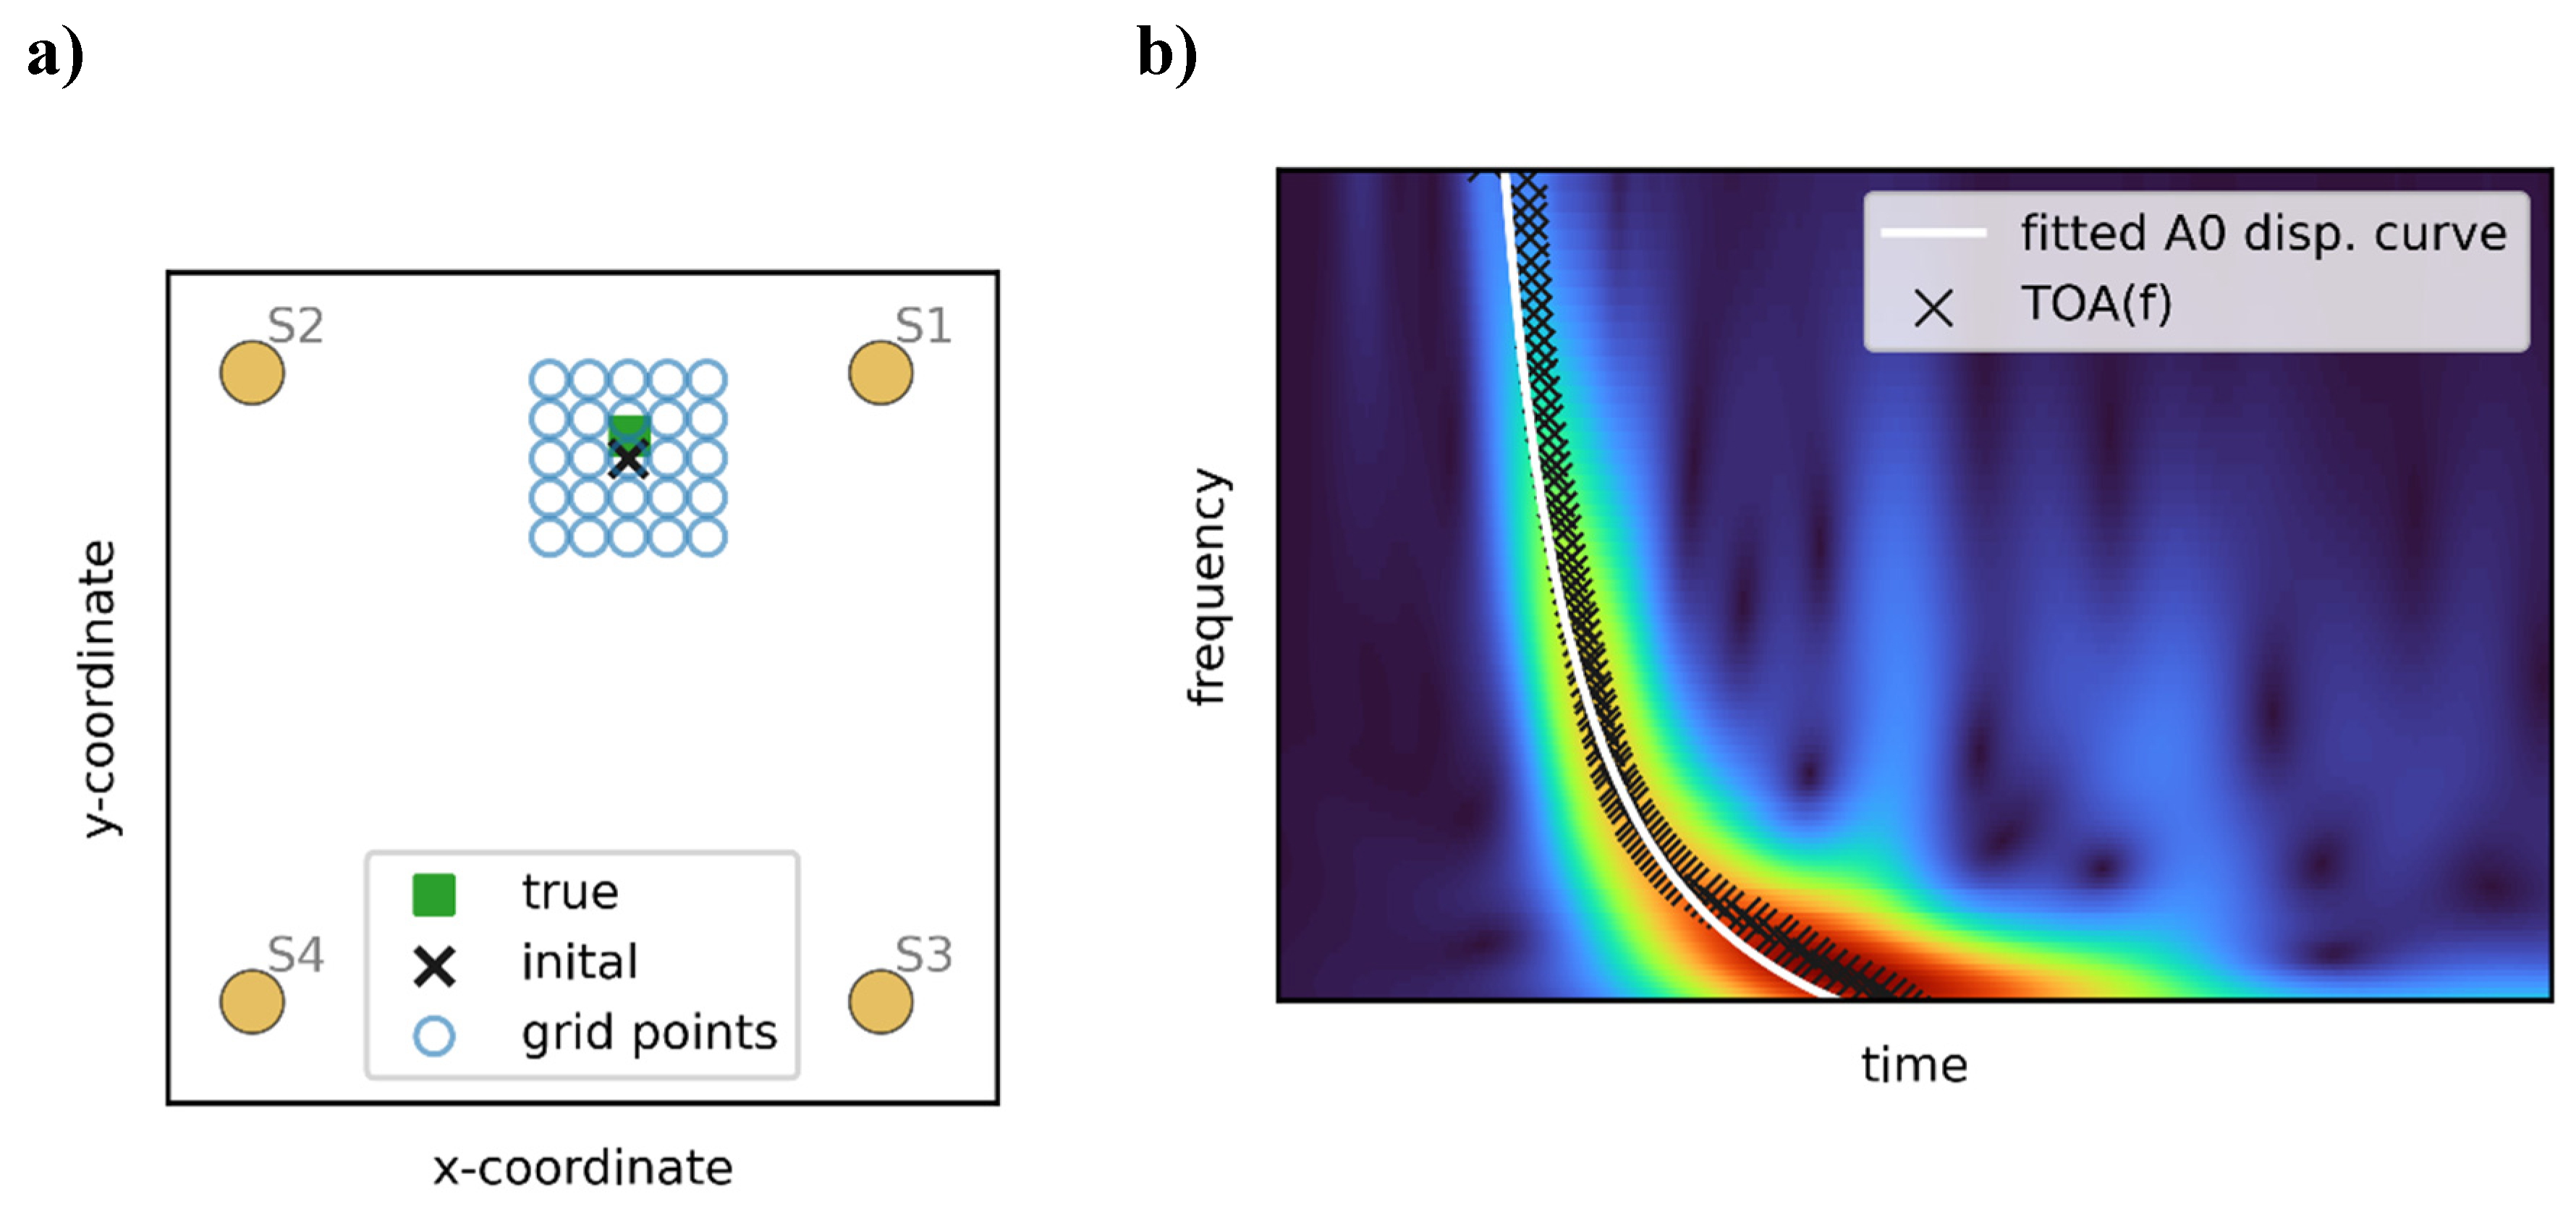
In its present form, the proposed algorithm is intended to be used for homogeneous thin-walled structures of isotropic material. Figure 1 shows a flowchart of the model-based AE source localization algorithm. The input for the algorithm is a single AE event measured by n c h 3 synchronized AE sensors. The algorithm requires an initial rough localization result as a starting point, which is first determined using an arbitrary localization method. A quadratic search grid of potential localization results is defined with the initial localization result in its center, see Figure 2a. These grid points define the first parameter space of the two-parameter grid search optimization. For each grid point, the following tasks are performed successively. With the known sensor positions the source-to-sensor distances are calculated for each grid point by
l i , j = x c h , j x i 2 + y c h , j y i 2
With being x c h , j , y c h , j  the coordinates of sensor j = 1 n c h  and x i , y i  the coordinates of the grid point i = 1 n p t s .  Next, the A0 dispersion curve, i.e., the group velocity of the A0 wave mode c g , A 0 f d  with frequency f  and the half plate thickness d  can be determined [1]. This dispersion curve is then transformed in the time-frequency domain by
t i , j * ( f ) = l i , j c g , A 0 ( f d )   .
Parallel to that, continuous wavelet transform (CWT) is used to transform the AE signals in the time-frequency domain [9]. In the present study, the complex Mexican hat wavelet is used. Spectrograms are drawn and the maximum values over frequency are extracted. These maximums reflect the dispersive behavior of elastic waves in thin-walled structures and are interpreted and used as a frequency-dependent TOA ( T O A ( f ) ) [10]. Figure 2b shows an exemplary spectrogram of a pencil lead break (PLB), the black crosses mark the described maximum values, i.e., T O A ( f ) . For a defined reference channel c h r e f the transformed dispersion curve according to Equation (2) is fitted by a least-squares algorithm to the values of T O A ( f ) . The material parameters and the geometry of the structure are assumed to be known and the source-to-sensor distance for the current grid point is given by Equation (1). Hence, the only remaining fit parameter is a time offset t i , r e f . The position in time of the fitted transformed dispersion curve of the reference channel results to
t i , r e f f = t i , r e f * f + t i , r e f
and is illustrated in Figure 2b. The transformed dispersion curves of the remaining channels are not fitted to the corresponding T O A ( f ) , but are placed at the constrained position in time according to
t i , j f = t i , j * f + t i , j .
This reflects the fact that all channels measure signals from the same time and location of origin. The relative time offset between channel j and the reference channel resulting from the known sensor positions is given by
t i , j = t i , r e f + l i , j l i , r e f c g , A 0 ( f d ) .
To find a common best fit of all channels to the corresponding spectrograms the transformed dispersion curves are shifted together in time. This common time shift defines the second parameter space for the two-parameter grid search optimization. The objective function for the optimization is a frequency-dependent weighted sum of the wavelet coefficients of all channels closest to the respective transformed dispersion curves. The frequency-dependent weighting considers the different sensitivities V j ( f ) of the used sensors by
w j ( f ) = V r e f ( f ) V j ( f )
where f = f 1 f m is the considered frequency range resulting from the CWT. The localization result, i.e., the grid point i ^ which fits best to the measurement data is obtained by
i ^ = arg max i , τ j = 1 n c h k = 1 m W j t i , j + τ , f k w j f k τ [ τ 0 ,   τ n ]
where W j t , f are the wavelet coefficients of channel j and τ the defined discrete time shift parameter.

3. Experimental Investigation

The proposed localization algorithm was tested by PLBs on a large aluminum plate structure.
It was evaluated how the successive consideration of more model knowledge affects the localization accuracy.

3.1. Setup and Procedure

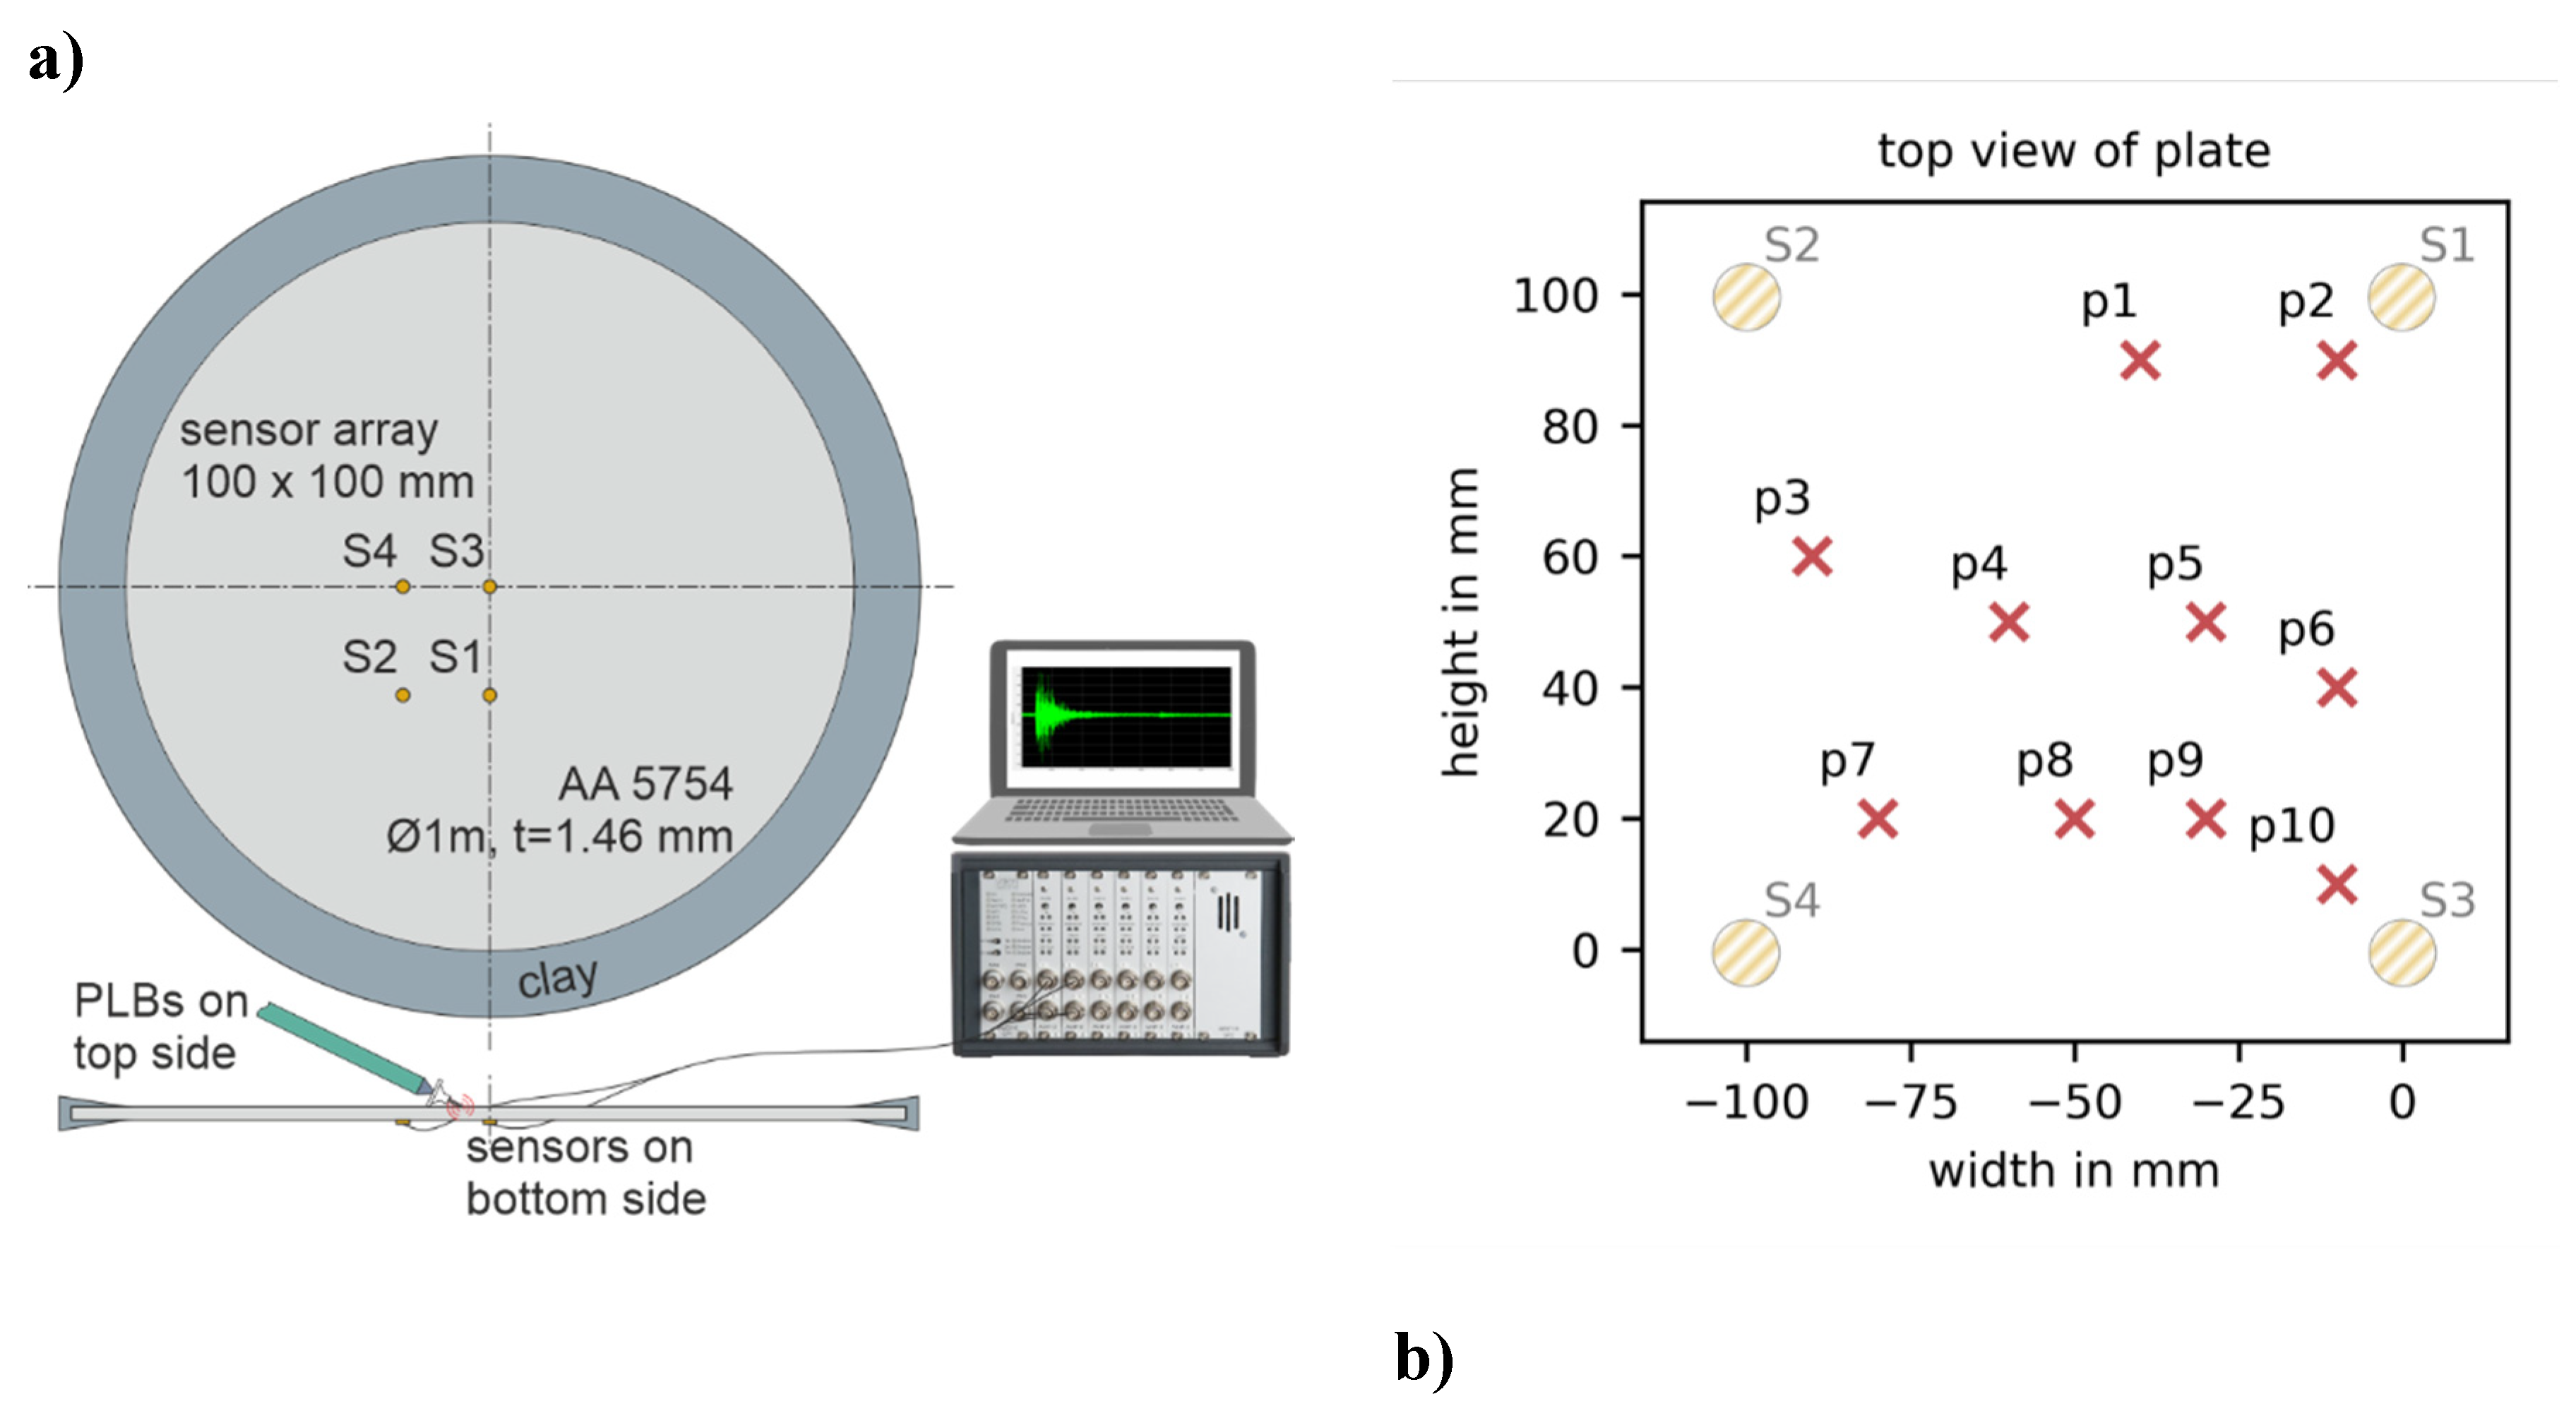
Figure 3a shows the experimental setup used for the investigation. The investigation was conducted on a circular plate of AA5754 aluminum alloy (E=69 GPa, ν=0.33, ρ=2670 kg/m3) of dimension Ø1000 mm × 1.46 mm. The edge of the plate was covered with wedge-shaped clay to suppress boundary reflections. Four PIC151 Ø10 mm × 0.5 mm piezoelectric wafer active sensors (PWASs) were adhesively bonded (Loctite EA 9466) on the bottom side of the plate in a quadratic array of 100 mm side length, with one PWAS in the center. The PWAS were connected to a Vallen AMSY-6 AE data acquisition system. PLBs were conducted on ten positions within the sensor array, see Figure 3b and Table 1. Data acquisition was done in hit-based mode with sampling frequency f s = 10 MHz. The signals were recorded with 1000 pre-trigger samples, i.e., 100 µs.

3.2. Results

Data processing and analysis was done by using Python 3.9. The lambwaves package [11] was used to compute the dispersion curves, and the ssqueezepy package [12] was used for the CWT. The initial rough localization results as start points for the proposed model-based localization algorithm were obtained by triangulation using the Akaike information criterion (AIC) TOA estimator. The required wave speed used for the triangulation was experimentally determined to be 5320 m/s. The Euclidean distances between the actual PLB positions and the triangulation results were calculated. The mean error of all ten positions was 2.94 mm.
In the following, the effects of using different model knowledge for localization, i.e. results during three different phases of the model-based algorithm, are presented. All gathered localization results, the actual PLB positions, and the mean localization errors are listed in Table 1 at the end of Section 3.2.
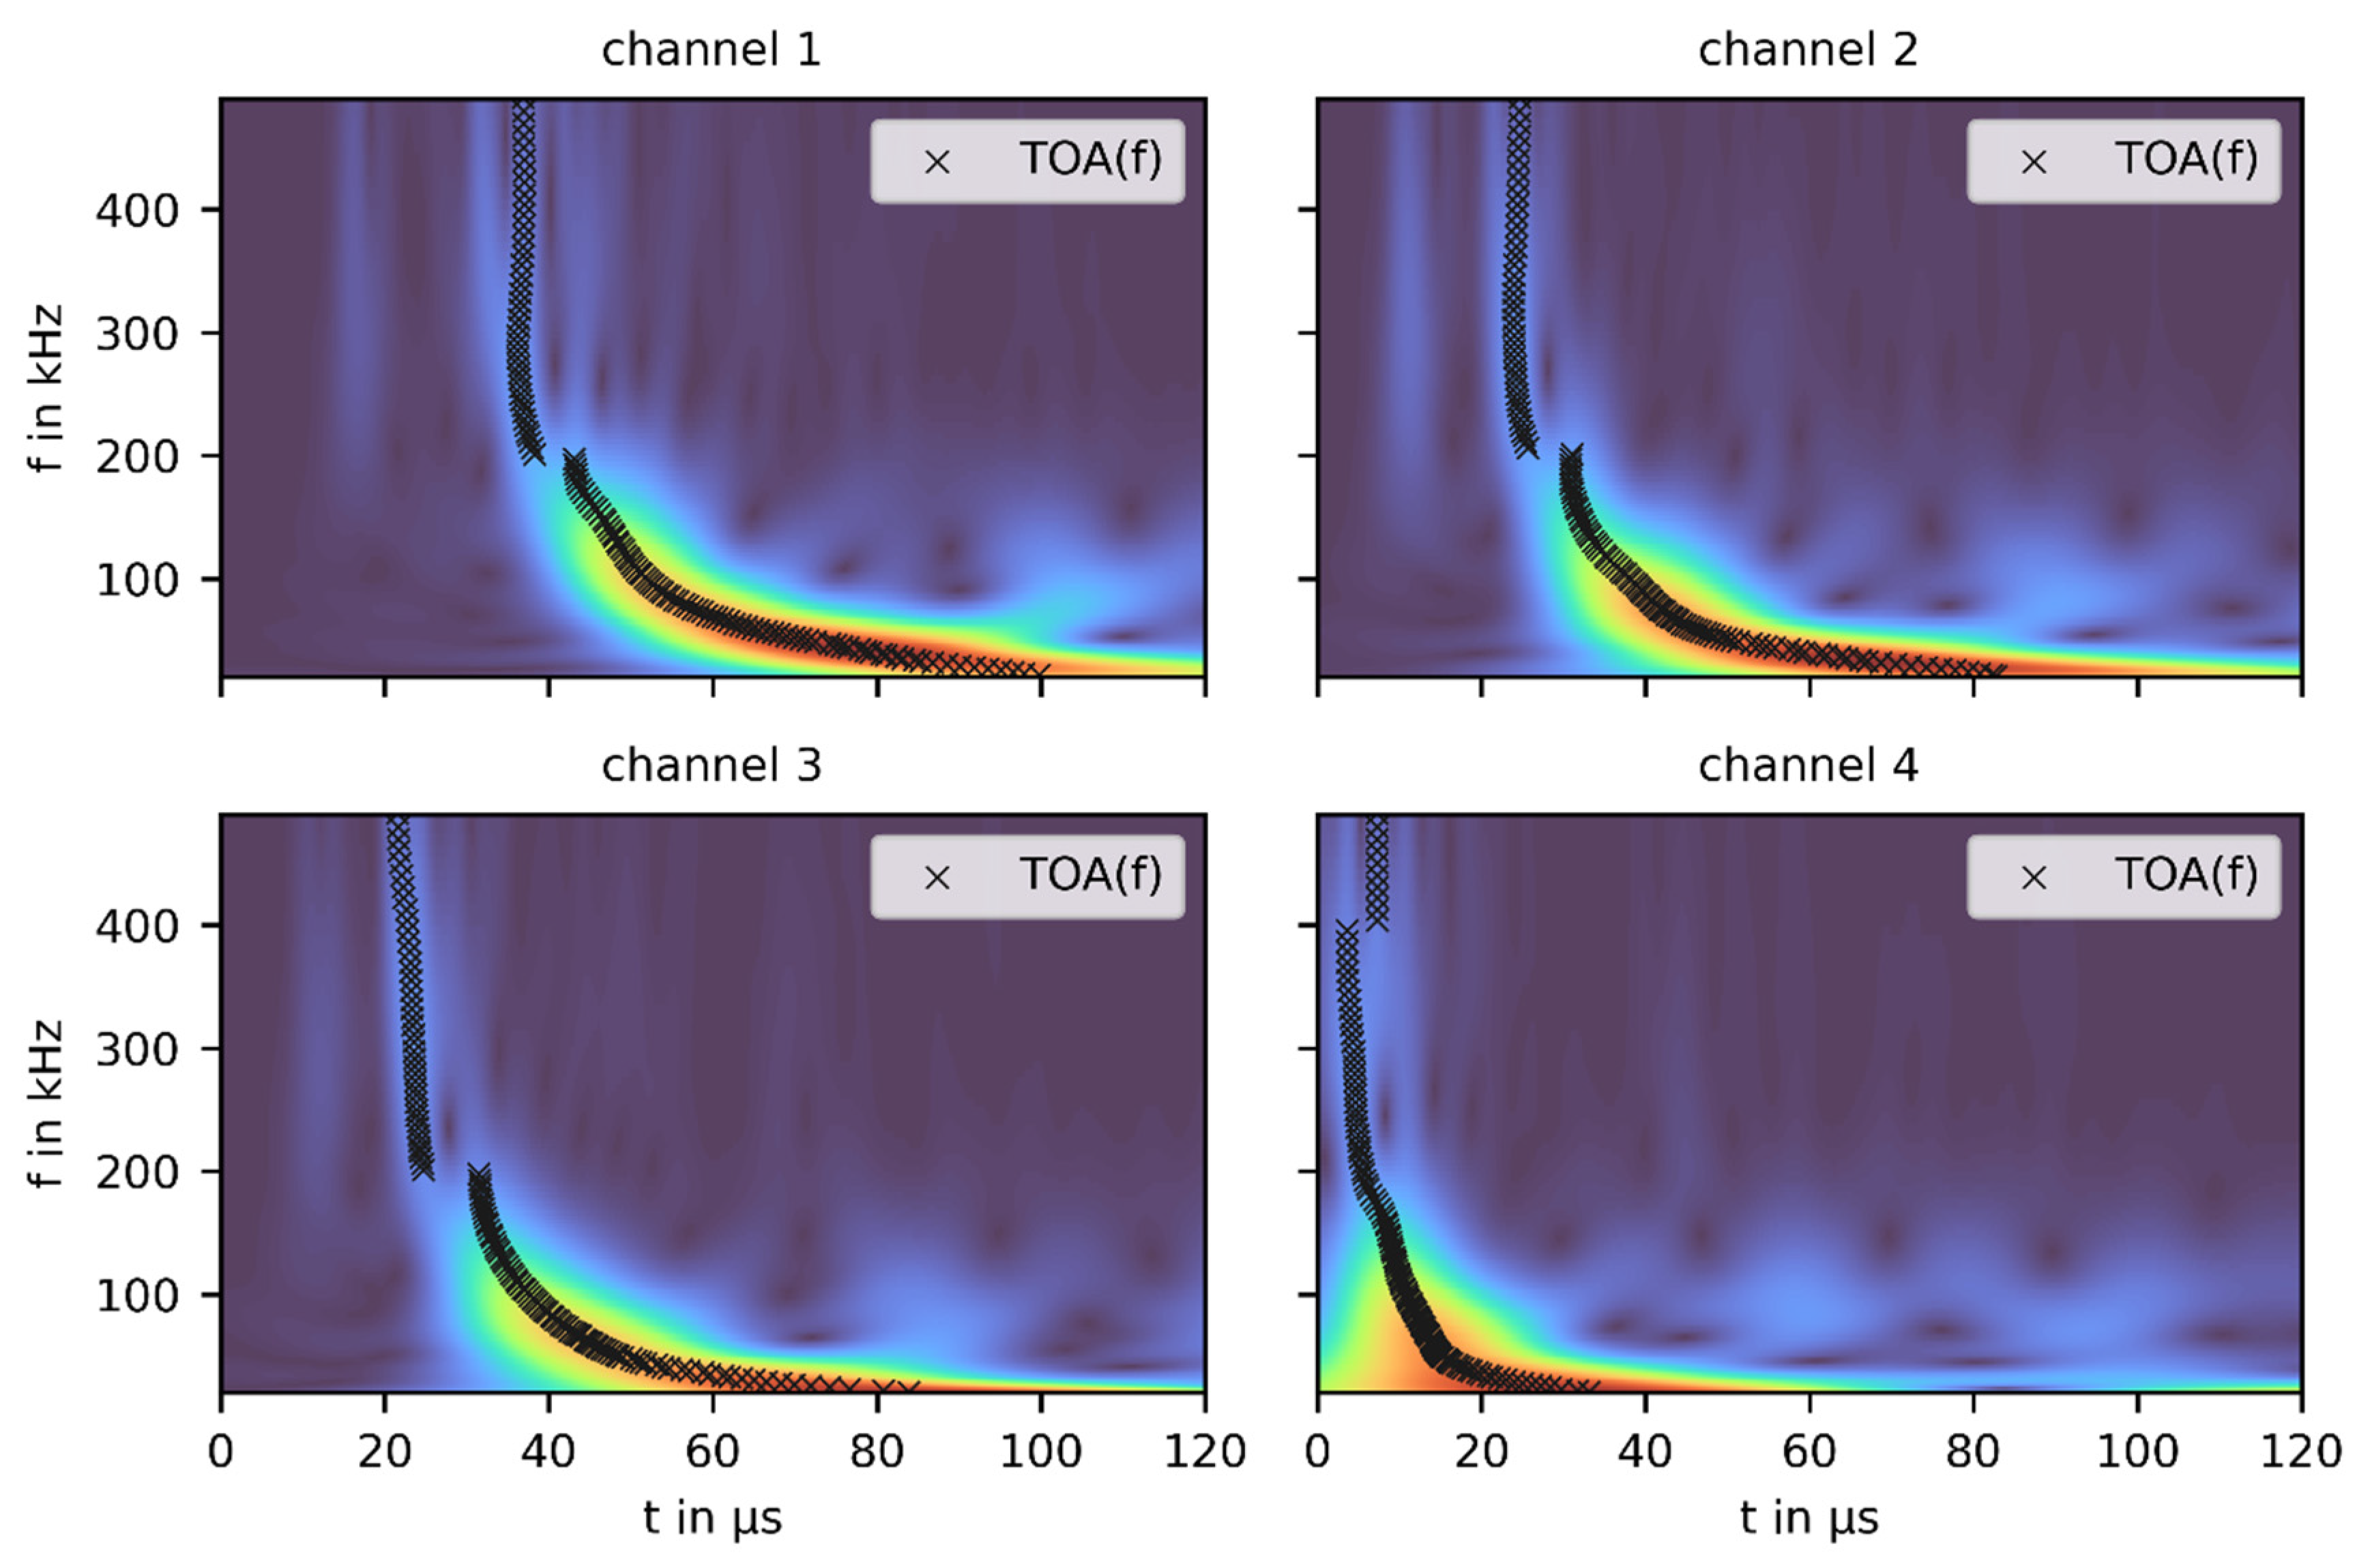
First, only the dispersive behavior of the A0 mode was considered. CWT was conducted on the four AE signals per PLB and T O A f were extracted from the spectrograms. During the entire study, a frequency range between 20 kHz and 500 kHz was evaluated, consisting of 130 frequencies according to the CWT performed, i.e., T O A f consisted of 130 entries as well. Figure 4 exemplarily shows the spectrograms and T O A f resulting from the PLB at position p7. For each of the 130 TOAs a triangulation was conducted with the corresponding group velocity c g , A 0 f d with d = 1.46 / 2 = 0.73 mm. The median values of these 130 x/y localization results was used as the localization result, see Table 1 for the results of the ten PLB positions. The mean error over all ten PLB positions was 1.54 mm. It should be noted that this localization approach was used here only to present the impact of T O A f on localization accuracy. In the described model-based algorithm, the extraction of the T O A ( f ) is a necessary step, but was not used to obtain localization results.
Second, the presented model-based localization algorithm was nearly fully implemented and tested. The only thing which was not yet considered were the slightly different sensor sensitivities of the four PWAS, therefore Equation (6) became
w j = 1                                       j .
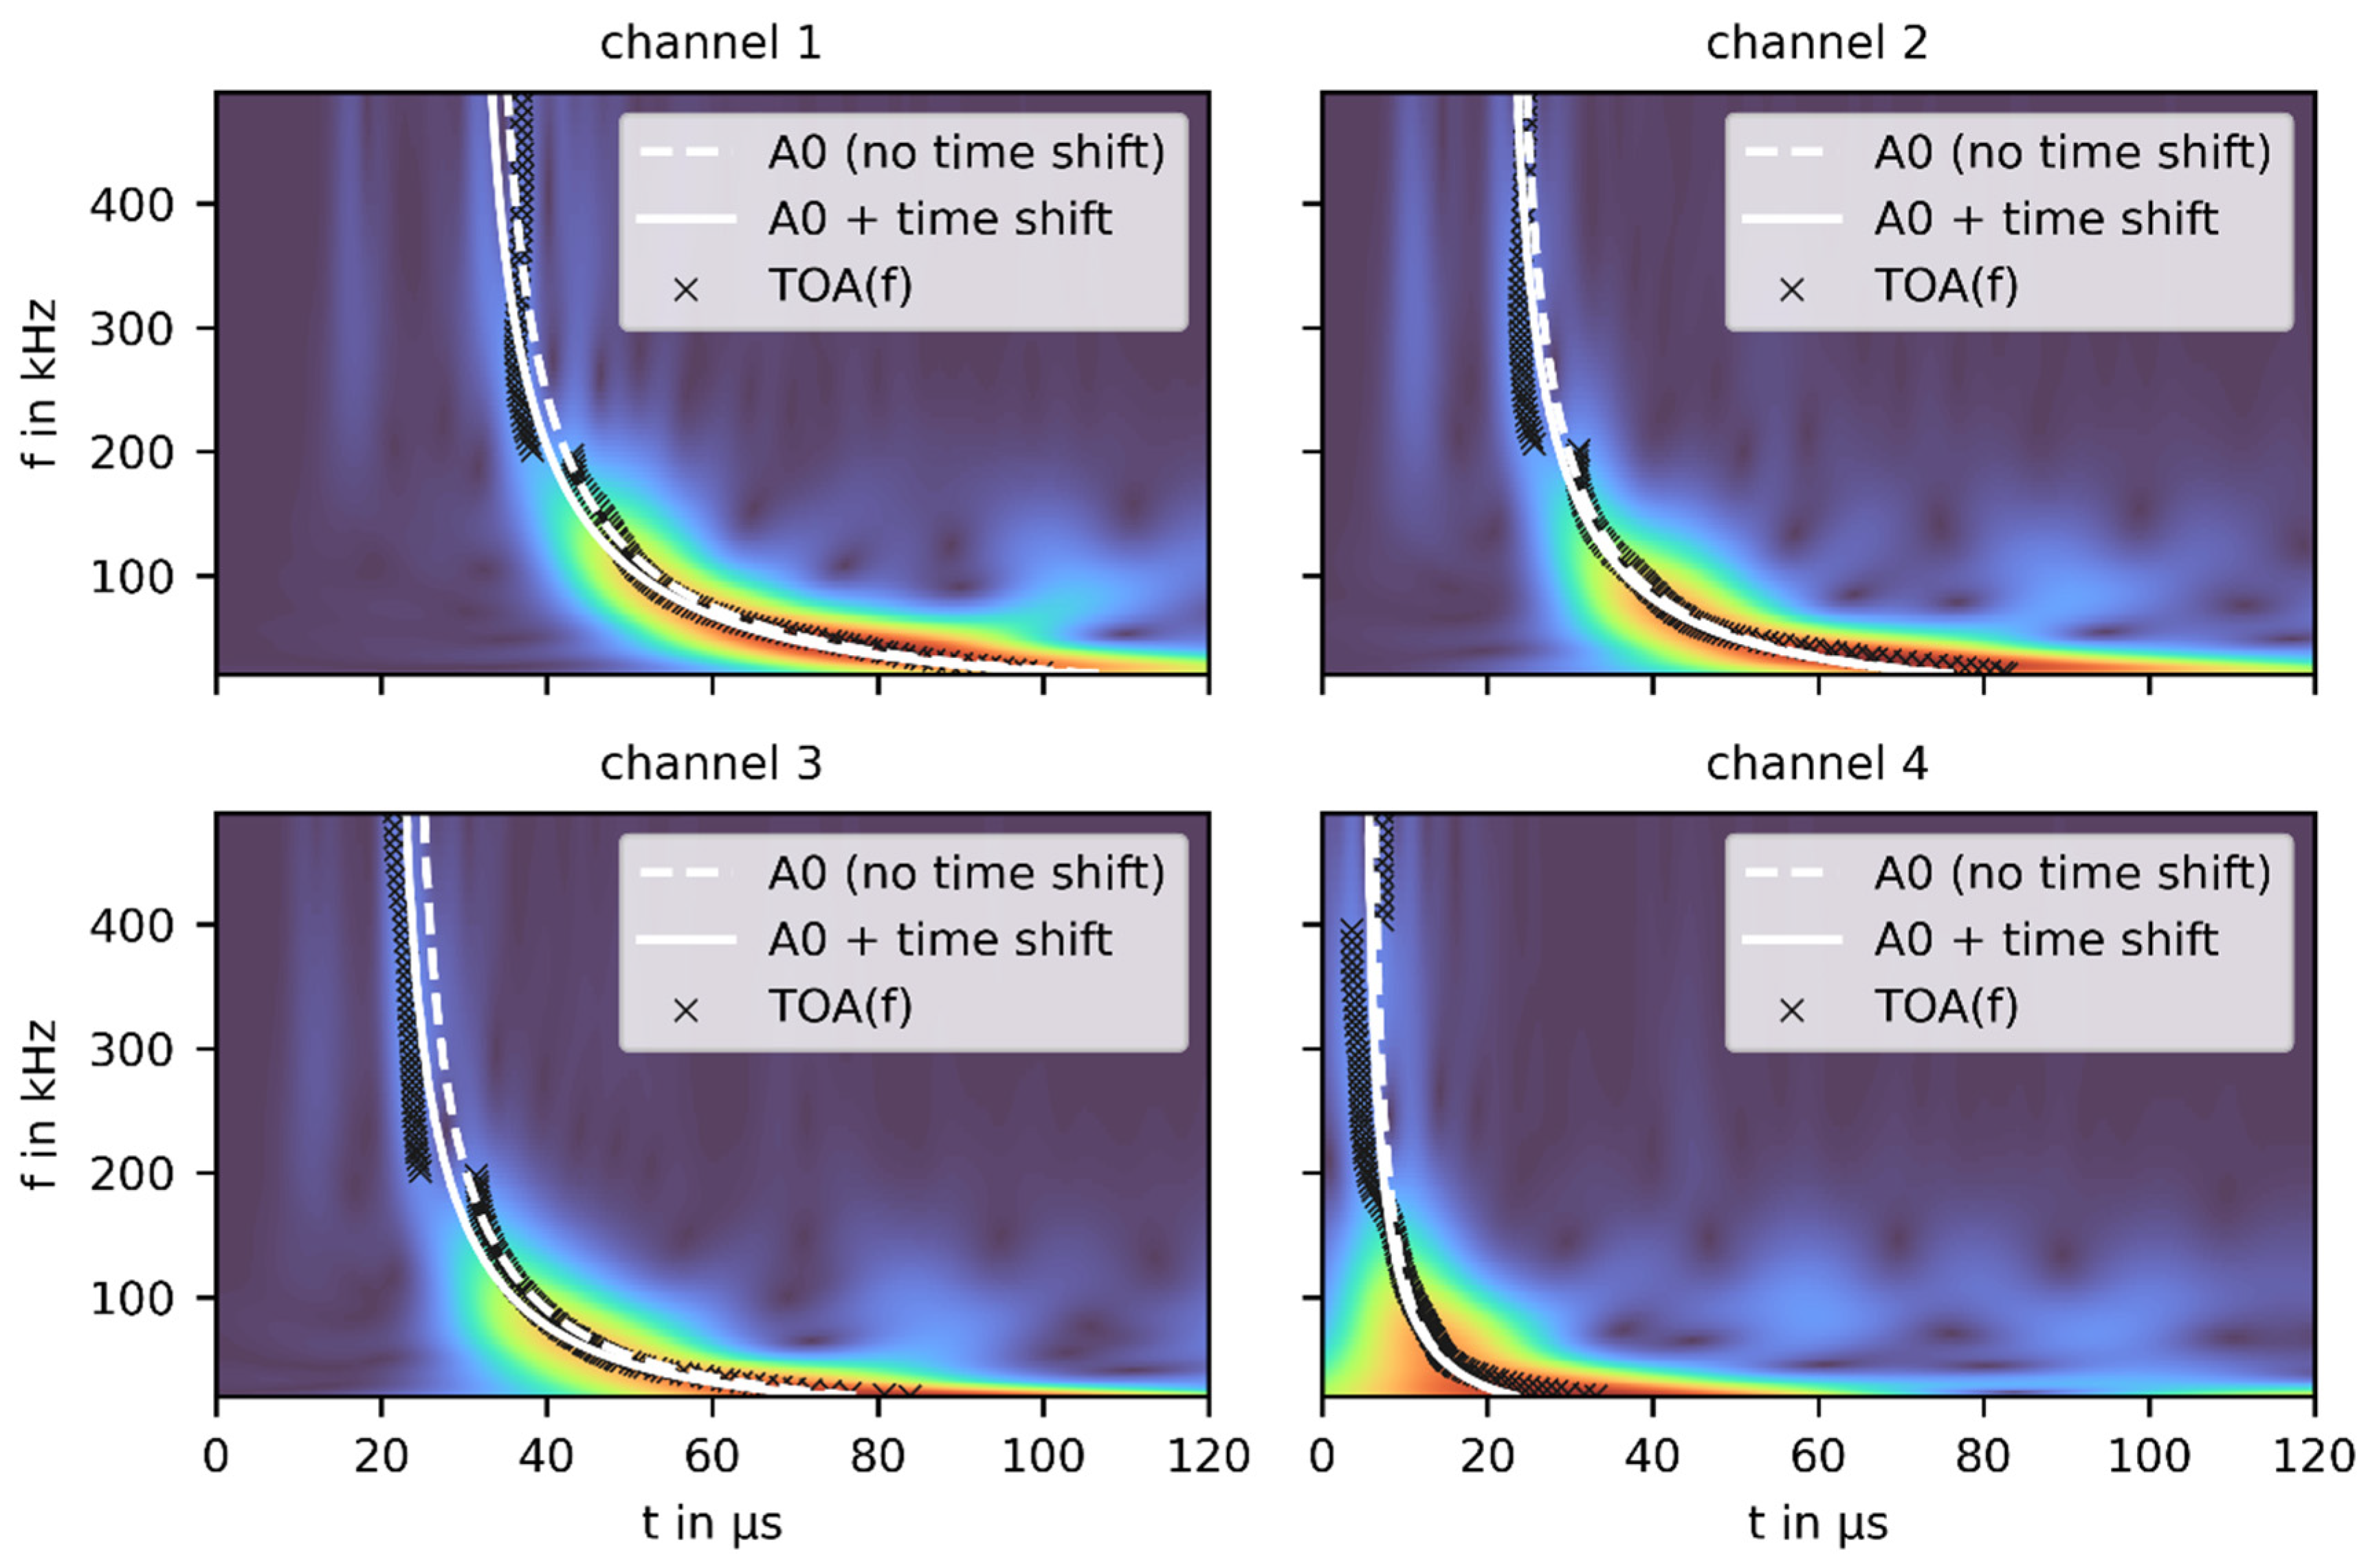
The following algorithm parameter values were used for the evaluation. The first optimization parameter, the test grid, was set to 25 × 25 grid points with side lengths of 10 mm × 10 mm. This grid was chosen because the maximum error determined by triangulation was 5 mm (PLB position p6), i.e., with a grid size twice as large as this maximum error, the true positions of all PLBs were in the solution space of the algorithm. The second optimization parameter, the time shift, was set to start from -40 to +20 time increments, resulting in absolute time shifts between -4 µs and +2 µs. This range proved to be reasonable during the evaluation. Figure 5 shows spectrograms of the measured AE signals resulting from a PLB at position p7. T O A ( f ) is again marked by black crosses. The dashed white lines show the transformed A0 dispersion curves that fit best to the spectrograms when the time shift parameter was not considered in the optimization, and the solid white lines show the best fit of the transformed A0 dispersion curve to the spectrograms when the described time-shifting was considered in the optimization, i.e., the described two-parameter grid search optimization. The localization results after the two-parameter grid search optimization with w j =   1 are given in Table 1, the mean localization error was 1.31 mm.
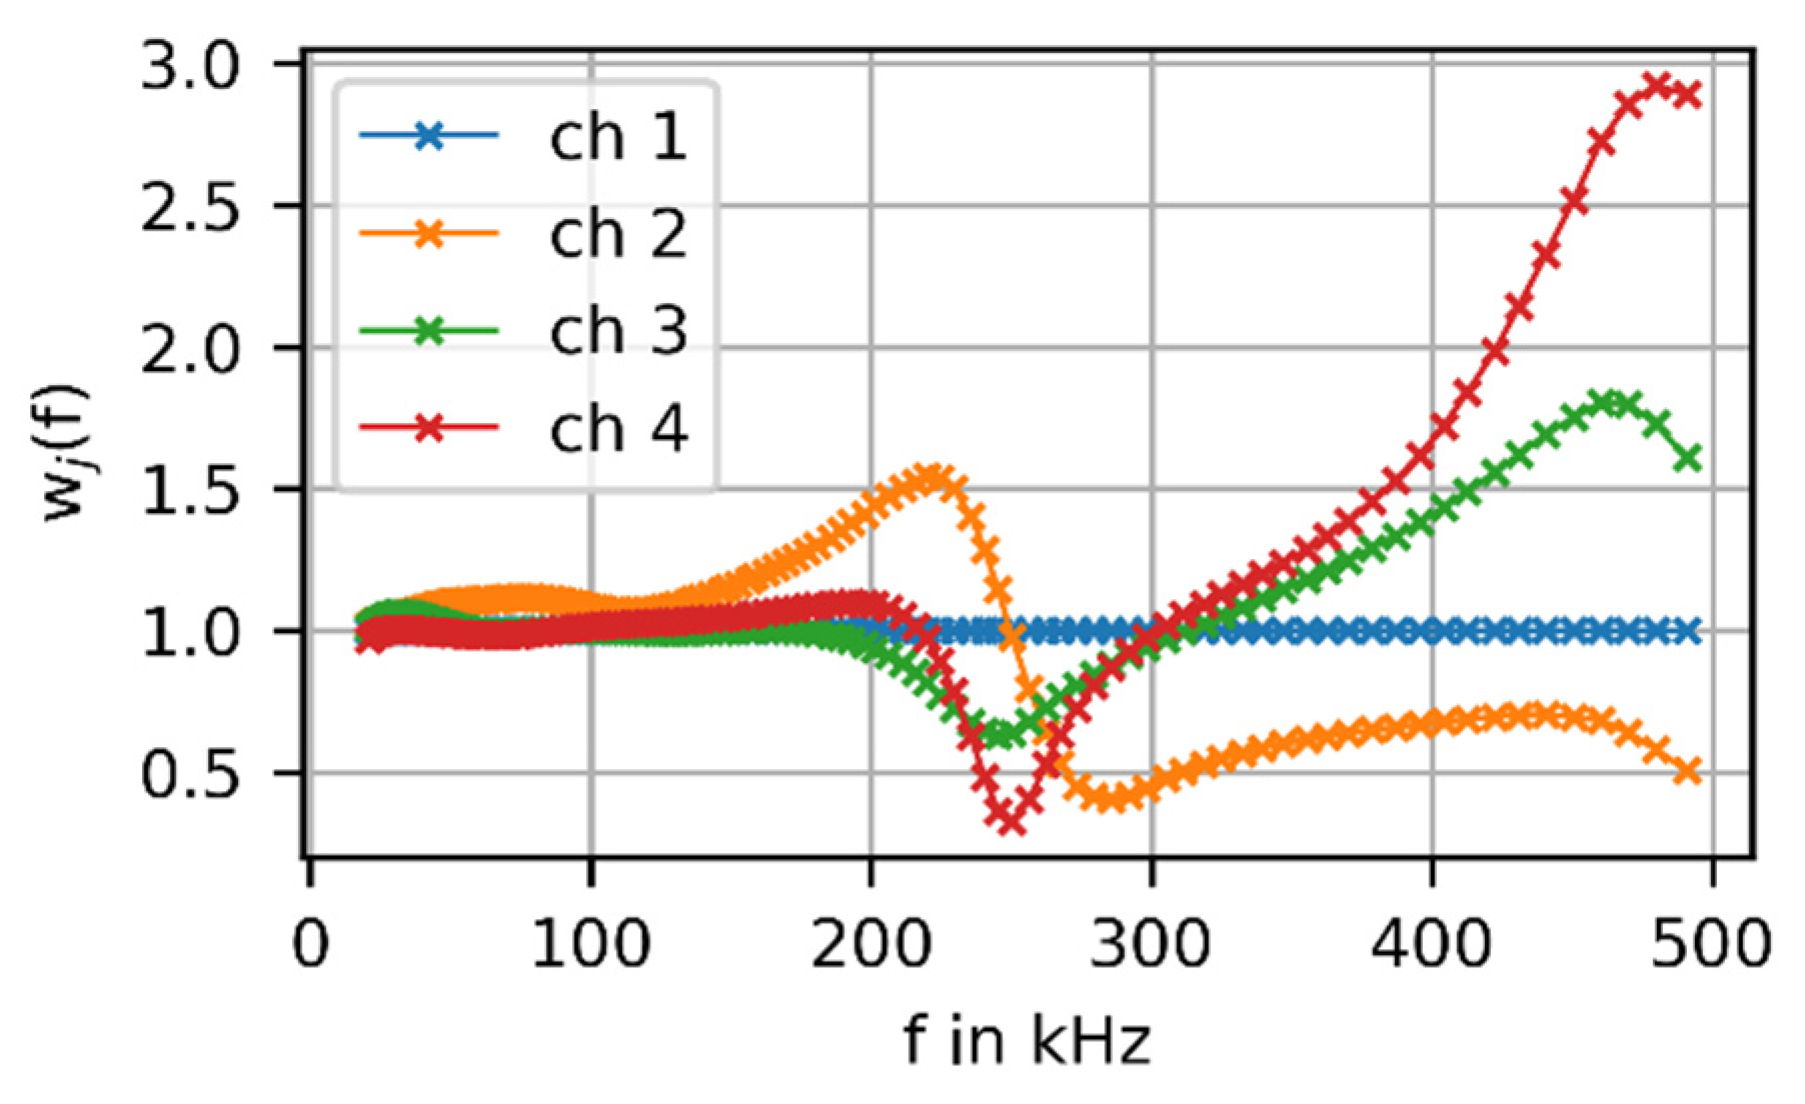
Third, the full model-based localization algorithm, according to Section 2 was implemented and tested. The same parameters as above were used. Additionally, the frequency-dependent weighting according to Equation (6) with channel 1 as the reference channel was considered. The sensitivities V j ( f ) of the four sensors were determined from 100 PLBs in the center of the sensor array (25 PLBs per 4 perpendicular orientations). For each measured sensor signal CWT was performed and the transformed dispersion curves were fitted to the maximum values in the spectrogram. The absolute values of the closest wavelet coefficients were extracted to obtain sensitivity curves. The 100 curves per sensor were averaged to obtain a single sensitivity curve per sensor. The frequency-dependent weighting was calculated according to Equation (6). The corresponding curves are shown in Figure 6. In the low-frequency range, the differences in sensor sensitivity are rather small, but above 180 kHz there were significant differences. The localization results using the full model-based localization algorithm are given in Table 1. The impact of the differences in sensor sensitivity resulted in an increase in localization accuracy with a final mean localization error of 1.23 mm.

3.3. Discussion

The mean error of the ten PLBs using triangulation was 2.94 mm, which was used as a reference accuracy in this investigation. A remarkable reduction in the mean error, i.e., an increase in localization accuracy was already achieved when localization with frequency-dependent TOA (130 single TOAs) was used, the mean error was nearly halved to 1.54 mm. The constraint that all AE channels measure the same AE event of same place and time of origin again resulted in a considerable increase in accuracy with a mean error of 1.31 mm. With the full model-based algorithm, i.e., when also the differences in sensor sensitivities are considered, a further increase in accuracy was achieved with a mean error of 1.23 mm. In summary, the model-based AE source localization algorithm achieved an improvement in localization accuracy of 1.71 mm, or about 58 %, over triangulation for the laboratory experiment performed. However, it has to be mentioned that uncertainties in the sensor positioning and also in the actual PLB locations, which could add up to a few tenths of a millimeter, have to be considered. Such uncertainties may affect the localization results and possibly reduce the accuracy improvement of the model-based algorithm compared to triangulation. In addition, there may be various applications where triangulation will be accurate enough and the higher computational cost of the model-based algorithm may not be worthwhile. However, especially for the case of low SNR AE signals, the presented model-based algorithm is expected to be well suited to provide reliable and accurate localization results, which is also suggested by recent results from the author's research group.

4. Conclusions

The present work discusses a novel model-based AE source localization algorithm to be used for SHM. SHM is intended for operational conditions, thus the measured AE signals are expected to show low SNRs, which typically affects the localization accuracy of classical AE source localization algorithms. In this contribution, a model-based AE source localization algorithm is presented and its impact on the localization accuracy is shown by a laboratory experiment on a large aluminum plate. A fundamental part of the algorithm is the consideration of the dispersive behavior of elastic waves in thin-walled structures. Multiple frequency-dependent TOAs of the A0 wave mode are extracted using CWT. Furthermore, the constraint that all used AE sensors measure signals of an AE event of the same time and location of origin is incorporated and the different sensitivities of the AE sensors are taken into account. The impact on the localization accuracy when successively more model knowledge is considered in the localization is discussed and a final localization accuracy improvement of 58% over classical triangulation is achieved. By incorporating the different model knowledge described, the algorithm is also considered to be well suited to provide accurate and reliable localization results for AE signals with low SNR.
Future work will test the proposed model-based algorithm for AE source localization of events with low SNR signals caused by atmospheric corrosion. Furthermore, the isolation and incorporation of the S0 wave mode and boundary reflections in the AE signals could be considered to increase the localization accuracy or to reduce the number of required sensors.

Acknowledgements

The researchers acknowledge the financial support by the Austrian Federal Ministry for Climate Action, Environment, Energy, Mobility, Innovation and Technology, and the Austrian Research Promotion Agency FFG (grant number FO999903054).

References

  1. Giurgiutiu, V., “Structural Health Monitoring with Piezoelectric Wafer Active Sensors,” Academic Press, Amsterdam, 2014.
  2. Kralovec, C., and Schagerl, M., “Review of Structural Health Monitoring Methods Regarding a Multi-Sensor Approach for Damage Assessment of Metal and Composite Structures,” Sensors, Vol. 20, No. 3, 2020, p. 826. [CrossRef]
  3. Giurgiutiu, V., “Structural Health Monitoring of Aerospace Composites,” Academic Press, Oxford, 2016.
  4. Ono, K., “Review on Structural Health Evaluation with Acoustic Emission,” Applied Sciences, Vol. 8, No. 6, 2018, p. 958. [CrossRef]
  5. Kundu, T., “Acoustic Source Localization,” Ultrasonics, Vol. 54, No. 1, 2014, pp. 25–38. [CrossRef]
  6. Hassan, F., Mahmood, A. K. B., Yahya, N., Saboor, A., Abbas, M. Z., Khan, Z., and Rimsan, M., “State-of-the-Art Review on the Acoustic Emission Source Localization Techniques,” IEEE Access, Vol. 9, 2021, pp. 101246–101266. [CrossRef]
  7. McLaskey, G. C., Glaser, S. D., and Grosse, C. U., “Beamforming Array Techniques for Acoustic Emission Monitoring of Large Concrete Structures,” Journal of Sound and Vibration, Vol. 329, No. 12, 2010, pp. 2384–2394. [CrossRef]
  8. Erlinger, T., Kralovec, C., and Schagerl, M., “Monitoring of Atmospheric Corrosion of Aircraft Aluminum Alloy AA2024 by Acoustic Emission Measurements,” Applied Sciences, Vol. 13, No. 1, 2023, p. 370. [CrossRef]
  9. Suzuki, H., Kinjo, T., Hayashi, Y., and Takemoto, M., “Wavelet Transform of Acoustic Emission Signals,” Journal of acoustic emission, Vol. 14, 1996, pp. 69–84.
  10. Jiao, J., He, C., Wu, B., Fei, R., and Wang, X., “Application of Wavelet Transform on Modal Acoustic Emission Source Location in Thin Plates with One Sensor,” International Journal of Pressure Vessels and Piping, Vol. 81, No. 5, 2004, pp. 427–431. [CrossRef]
  11. Rotea, F., “Lambwaves,” GitHub, 2020. Retrieved 18 March 2024. https://github.com/franciscorotea/Lamb-Wave-Dispersion.
  12. Muradeli, J., “Ssqueezepy,” GitHub, 2020. Retrieved 5 March 2024. https://github.com/OverLordGoldDragon/ssqueezepy.
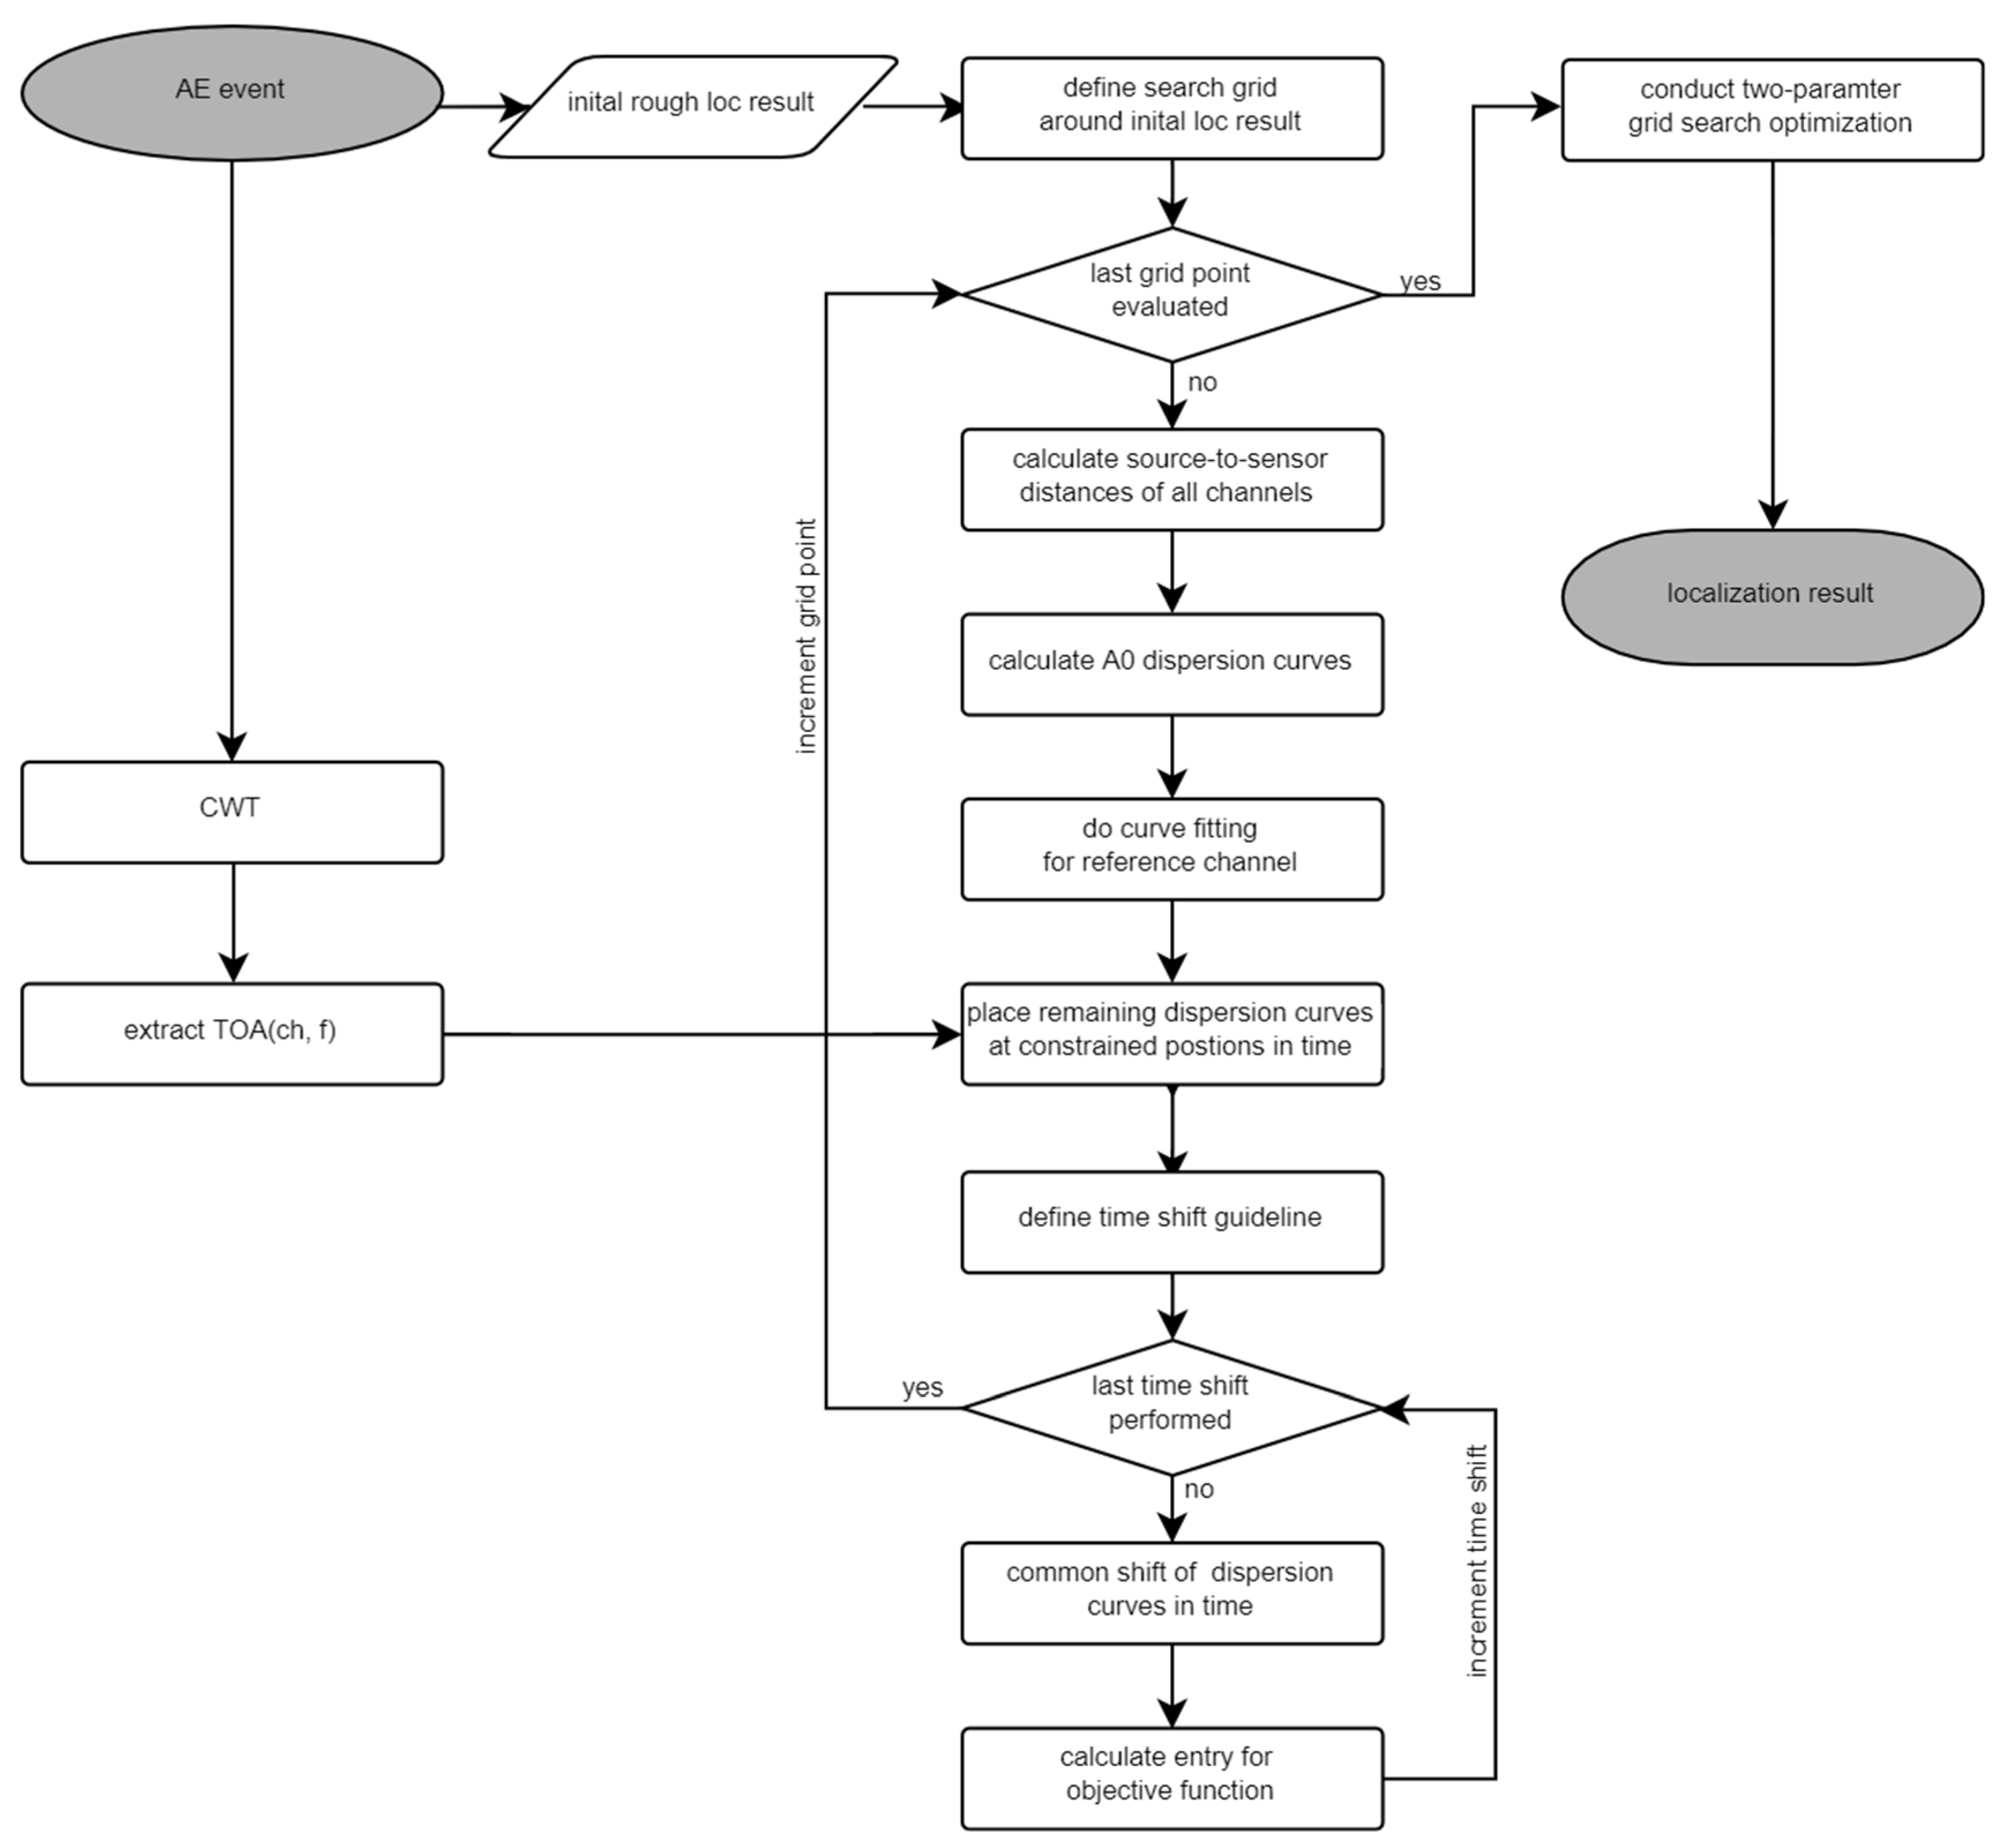
Figure 1. Flow chart of the proposed model-based AE source localization algorithm.
Preprints 117680 g001
Figure 2. a) Exemplary search grid (5x5 grid points) with start and true source location and four AE sensors S1-S4. b) Exemplary spectrogram of a pencil lead break with extracted frequency-dependent TOA and the corresponding fitted transformed dispersion curve.
Preprints 117680 g002
Figure 3. a) Experimental setup for the investigation. The four PWASs were applied on the bottom side of the plate and the PLBs were conducted on the top side of the plate. b) PLB positions p1-p10 on the top side of the plate.
Preprints 117680 g003
Figure 4. Spectrograms of the measured AE signals from a PLB at position p7. 130 black crosses per channel mark frequency dependent TOAs between 20 kHz and 500 kHz.
Preprints 117680 g004
Figure 5. Spectrograms with T O A f of the measured AE signals from a PLB at position p7. The dashed white lines show the transformed A0 dispersion curves without considering the time shift procedure. The solid white lines show the transformed A0 dispersion curves representing the localization result after the two-parameter grid search optimization.
Preprints 117680 g005
Figure 6. Curves of frequency-dependent weighting coefficients w j ( f ) with c h r e f = c h 1 .
Preprints 117680 g006
Table 1. True locations of the ten PLBs and the localization results of triangulation and the different described steps of the model-based localization algorithm with the corresponding improvement of accuracy.
PLB (x / y) localization results in mm
label (x / y) in mm triangulation (AIC) TOA(f) constrained sensor sensitivities
p1 (-40 / 90) (-40.2 / 86.4) (-39.6 / 92.4) (-39.4 / 91.4) (-40,2 / 91,4)
p2 (-10 / 90) (-9.8 / 88.2) (-9.3 / 91.2) (-9.8 / 91.1) (-10,6 / 91,1)
p3 (-90 / 60) (-88.2 / 59.6) (-91.7 / 60.0) (-92.0 / 60.0) (-92,4 / 59,6)
p4 (-60 / 50) (-62.2 / 53.8) (-60.4 / 50.4) (-59.3 / 49.6) (-60,5 / 49,6)
p5 (-30 / 50) (-29.2 / 52.2) (-29.2 / 50.4) (-28.8 / 49.7) (-29,6 / 49,3)
p6 (-10 / 40) (-15.0 / 39.4) (-6.7 / 40.0) (-10.0 / 39.8) (-10,0 / 39,8)
p7 (-80 / 20) (-80.4 / 21.8) (-79.6 / 19.0) (-79.2 / 19.3) (-80,0 / 18,9)
p8 (-50 / 20) (-50.6 / 22.4) (-49.8 / 18.4) (-49.4 / 18.2) (-49,4 / 18,2)
p9 (-30 / 20) (-28.2 / 23.6) (-29.6 / 19.4) -(29.0 / 18.6) (-29,5 / 19,0)
p10 (-10 / 10) (-10.4 / 12.0) (-9.1 / 8.5) (-8.7 / 9.1) -(9,6 / 8,7)
mean abs. error 2.94 mm 1.54 mm 1.31 mm 1.23 mm
improv. vs. triangulation - 48 % 55 % 58 %
Disclaimer/Publisher’s Note: The statements, opinions and data contained in all publications are solely those of the individual author(s) and contributor(s) and not of MDPI and/or the editor(s). MDPI and/or the editor(s) disclaim responsibility for any injury to people or property resulting from any ideas, methods, instructions or products referred to in the content.
Copyright: This open access article is published under a Creative Commons CC BY 4.0 license, which permit the free download, distribution, and reuse, provided that the author and preprint are cited in any reuse.
Prerpints.org logo

Preprints.org is a free preprint server supported by MDPI in Basel, Switzerland.

Subscribe

© 2024 MDPI (Basel, Switzerland) unless otherwise stated