Preprint
Article

A Combined Experimental and Computational Study on the Effect of the Reactor Configuration and Operational Procedures on Formation, Growth and Dissociation of Carbon Dioxide Hydrate

Altmetrics

Downloads

82

Views

38

Comments

0

A peer-reviewed article of this preprint also exists.

Submitted:

09 September 2024

Posted:

10 September 2024

You are already at the latest version

Alerts
Abstract
Clathrate hydrate-based technologies have been considered as promising and sustainable alternatives for the effective management of the climate change risks related to emissions of carbon dioxide, produced by human activities. This work presents a combined experimental and computational investigation of the effects of the operational procedures and characteristics of the experimental configuration, on the phase diagrams of CO2-H2O systems and CO2 hydrates formation, growth and dissociation conditions. The operational modes involved (i) the incremental (step-wise) temperature cycling and (ii) the continuous temperature cycling processes, in the framework of an isochoric pressure search method. Also, two different high pressure PVT configurations were used, of which one encompassed a stirred tank reactor and the other incorporated an autoclave of constant volume with magnetic agitation. The experimental results implied a dependence of the subcooling, (P, T) conditions for hydrate formation and dissociation and thermal stability of the hydrate phase on the applied temperature cycling mode, and the technical features of the utilized PVT configuration. The experimental findings were complemented by a thermodynamic simulation model and other calculation approaches, with the aim to resolve the phase diagrams including the CO2 dissolution over the entire range of the applied (P, T) conditions.
Keywords: 
Subject: Chemistry and Materials Science  -   Physical Chemistry

1. Introduction

Clathrate hydrates (also called gas hydrates) are nonstoichiometric crystalline ice-like substances, consisting of a hydrogen-bonded lattice formed by water molecules (host) and entrapped gas molecules (guest gas), which are not bonded with the lattice. One of the advantages of gas hydrates is the drastic reduction of the volume of the enclathrated gas compared with that in the gaseous phase. Under standard temperature and pressure, the volume of gas stored in 1 m3 of CO2 hydrate is about 120-160 m3 [1]. The large uptake of CO2 in clathrate hydrates renders them a promising option for either storing, transportation or even disposing and sequestration.
CO2 hydrates have been investigated with regard to their formation conditions and potential applications in all large-scale fields of the Carbon Capture and Storage (CCS) system, including (i) the flow assurance and safe CO2 pipeline transportations [2,3,4,5], (ii) CO2 storage and separations [6,7,8], including Post-Combustion Capture [9,10], and Pre-Combustion Capture [11,12,13] applications, and (iii) CO2 sequestration [14,15,16], in deep sea sediments and other subsurface storage sites to mitigate the global warming, as well as in natural gas hydrate reservoirs to facilitate CH4 extraction and recovery, while at the same time to prevent the release of a greenhouse gas to the atmosphere [17,18,19]. Another application of gas hydrate technologies related to CO2 capture and separation pertains to CO2-rich natural gas upgrade [20], and biogas upgrade via CO2-CH4 separation that leads to biomethane production [21,22].
Gas hydrate crystals are formed when a hydrate former and water are mixed and the temperature and pressure conditions of the system reach the (H-Lw-G) equilibrium curve where the gas, liquid and hydrate phase co-exist. Conversely, gas hydrates decompose when the (P, T) conditions diverge from the hydrate-water rich liquid-gas (H-Lw-G) phase equilibrium [23]. Hydrate dissociation is an endothermic process in which the hydrogen bonds between water molecules of the hydrate lattice and the van der Waals interaction between the guest and water molecules of the lattice break to release water and gas. Several experimental methodologies have been used to study the phase behavior and equilibrium of the CO2-H2O system including the formation and dissociation conditions of CO2 hydrates [23,24,25,26,27]. These conditions are determined either by visual observation using high-pressure optical cells or by monitoring the total pressure of the system as a function of temperature that allows for constructing the (P-T) phase diagrams.
Three static methods have been applied to study the gas-liquid-hydrate phase equilibrium and gas hydrate formation kinetics, in particular the Isothermal Pressure-Search, the Isobaric Temperature-Search, and the Isochoric Pressure-Search methods. The Isothermal Pressure-Search method [27,28,29] allows to determine the (P-T) phase diagram (phase envelope) of the system, and is based on conducting a cooling/heating cycle at constant volume. In this method the cell volume is kept constant and the temperature undergoes a cyclic alteration procedure consisted of a cooling step, an isothermal step, and a slow incremental heating step whereas the pressure is monitored constantly. Hydrate formation is initiated under sufficient subcooling, ΔTsub, which is defined as the difference between the experimental temperature where gas hydrate nucleation takes place, Texp, and the equilibrium temperature, Teq, which corresponds to the theoretical (H-Lw-G) equilibrium conditions (Teq, Peq), i.e. ΔTsub, = TeqTexp, where Texp < Teq [30,31,32,33,34]. Hydrate crystals growth is detected from a sharp pressure drop at a constant temperature. After completion of hydrates formation, the hydrate crystals decompose through step-wise heating. At each isothermal step of the heating process, enough time is provided to the system to establish (H-Lw-G) equilibrium and thus, to derive a (Peq, Teq) curve that passes through consecutive equilibrium points. In the corresponding (P-T) phase diagram, the point where the heating curve joints the cooling curve and the slope of the heating curve changes abruptly, is considered as the point of complete hydrate dissociation [28]. The dissociation point is often confirmed by visual observation.
An interesting issue related to the experimental techniques that have been applied to study the (P, T) formation conditions and kinetics of growth and dissociation of CO2 hydrates, pertains to the effects of the design and technical characteristics of the gas hydrate autoclave and experimental configuration [35,36,37]. The design, geometrical and technical features of the utilized experimental setup as well as the operational modes can affect the characteristics of mass and heat transfer. It has been reported that application of batch stirring can improve the mass transfer and heat transfer performances of the methane hydrate formation process [36]. Usage of a stirrer can enhance the mass transfer driving force, which – unless excessive agitation is applied - can promote gas hydrate nucleation and growth, thereby increasing hydrate growth rate. Englezos et al. [38] developed a kinetic model of hydrate formation by assuming that the hydrate formation process is similar to the crystallization process composed of two successive steps with different mass transfer resistances. In the first step, the dissolved guest molecules diffuse from the bulk of the liquid into the liquid water-hydrate interface through the laminar diffusion layer around a particle. The second step consists of adsorption of the guest molecules at the liquid water-hydrate interface, followed by their incorporation and stabilization of the structured framework of the water /guest gas cages. When the agitation is conducted at a high stirring rate, the mass transfer resistance and heat-transfer resistance around the crystal seed, become negligible [38]. Experimental formation data obtained in a semi-batch stirred tank reactor have implied that at a stirring rate of 400 rpm, the mass transfer resistance around the crystal seeds is eliminated, and is no longer affected by a further increase in the rpm [38]. A stirring rate of 400 rpm was chosen as the most suitable one to avoid extensive rippling on the gas-liquid interface. This stirring rate was also able for continuous removal of the hydrate seeds from the gas-liquid interface to the bulk liquid.
On the other hand, during growth of gas hydrate crystals, an amount of latent heat of formation is released, which has to be effectively transferred to the cooling bath in order to control the temperature. The heat transfer rate between the hydrate former-liquid system and the cooling medium is affected by the design and technical features of the employed PVT set-up, the stirring mode (mechanical agitation or magnetic stirring), the design of the autoclave, the geometry and dimensions of the stirrer, the stirring rate, the contact between the autoclave and the coolant (i.e. direct contact by immersion of the autoclave into a cooling bath or cooling of the cell via circulation of the coolant through a coil), the coolant circulation rate, and the applied cooling/heating rate determine the heat transfer rate. The mass and heat transfer can affect the phase transitions (and thus, the obtained phase envelopes) in the hydrate former-liquid system, gas dissolution rate, supersaturation of the aqueous solution, and the hydrate nucleation process, which in turn determines the induction period for nucleation. Insufficient heat transfer rates can reduce subcooling, which is a driving force for hydrate formation [36].
In what concerns the gas hydrate dissociation process, this essentially involves multiphase heat and mass transfer coupled with intrinsic decomposition kinetics and gas and water flow behavior [28]. The hydrate dissociation rate depends on the intrinsic dissociation rate, heat transfer rate, and mass transfer rate [39]. A number of theoretical models has been developed to predict the intrinsic decomposition rate of gas hydrates [40,41,42,43]. On the basis of comparisons with experimental data on gas hydrate dissociation, Hong et al.[44] and Davis et al.[45] developed theoretical models for heat transfer-limited hydrate dissociation showing that heat transfer plays the dominant role in dissociation, rather than intrinsic kinetics.
Therefore, elucidation of the effects of the technical characteristics of the hydrate formation autoclave and PVT configuration, on the phase behavior of CO2-H2O systems and (P, T) conditions for CO2 hydrate growth, can enable (i) CO2 hydrates growth at a higher temperature (i.e. shorter metastability region / lower subcooling) and (ii) less experimental time due to the shortening of the induction period. Suitable process modes and conditions can enhance the hydrate nucleation kinetics and facilitate the two aforementioned effects. As a result, less energy- and time-consuming processes can be developed without any usage of kinetic promoters. Also, the potential to form CO2 hydrate slurries with thermal stability up to 4-5oC in a reproducible manner, by applying processes that are based on efficient operational modes and suitable PVT configurations, is of practical importance.
The data derived from gas hydrate formation experiments can be compared with suitable Equation of States that calculate the incipient (P, T) conditions for CO2 hydrate formation (i.e. the conditions at which the first hydrate crystals emerge in the aqueous phase), which coincide with the (P, T) conditions of complete thermal hydrate dissociation. On the other hand, it is interesting to investigate the potential of simple calculation approaches to predict the solubility of CO2 hydrate even under hydrate formation conditions, by elaborating experimental equilibrium data, and evaluate their prediction accuracy with accurate yet complex thermodynamic models or gas hydrate-related calculation models incorporated in commercial simulation software [46,47,48,49,50]. By calculating the CO2 solubility and CO2 fugacity in the gas phase at each equilibrium temperature (using an accurate EoS), the CO2 mole fractions and partitioning of CO2 among the gas, hydrate, and aqueous phase can be approximated.
The objective of this work was to investigate the effect of (i) the applied experimental procedures, and (ii) the characteristics of two different PVT configurations on the (P, T) conditions of formation and dissociation of CO2 hydrates, and on the respective phase envelopes. The experimental procedures involved (i) the continuous temperature cycling mode, and (ii) the incremental (step-wise) temperature cycling mode, in the framework of the Isochoric Pressure Search method. Both experimental modes proceeded through consecutive stages of initial equilibration, cooling, isothermal cooling, and heating of the studied CO2-H2O systems. In addition, two different high pressure PVT configurations were used, of which one encompassed a stirred tank reactor and the other incorporated an autoclave of constant volume with magnetic agitation. A qualitative interpretation of the observations has been provided with the aim to gain an insight into the effect of the design and technical features of the two experimental setups on the consecutive steps of hydrates nucleation, crystal growth and thermal decomposition, as well as the form and stability of the hydrate phase. The experimental findings were complemented by two calculation approaches, one of which was a thermodynamic simulation model and the other was a developed semi-empirical calculation method, with the aim to resolve the obtained phase envelopes including CO2 dissolution and solubility evolution, over the entire range of the applied (P, T) conditions.

2. Materials and Methods

2.1. Chemicals

CO2 gas with a minimum listed purity of 99.998% (SOL) was used in this work. Deionized water was used after being subjected to a thorough degassing procedure.

2.2. Experimental Setups

The phase behavior and gas hydrate formation conditions of the CO2-H2O system have been studied using two different experimental setups. The first high pressure PVT apparatus consists of two basic parts, namely a reactor cell (autoclave) inside an air bath-thermostated cabinet, and a gas preparation manifold. A detailed description of the PVT apparatus has been provided in the work of Kastanidis et al. [51]. The second PVT configuration includes a high pressure stirred tank reactor immersed in a thermostated bath. The reactor shares the same gas preparation manifold with the first PVT apparatus, the description of which is given below.

2.3. Gas Preparation Manifold

The gas preparation manifold is the system in which CO2 or any other hydrate former can be stored and delivered to the PVT cell under high pressures. It includes (i) a reservoir vessel having a volume of 24 L and maximum operating pressure of 12 bar, four toggle valves, and one pressure transducer (WICA D-10) for pressures up to 20 bar (with a measurement precision of ±0.02 bar), and (ii) a pneumatic gas booster (JULY GB25) bearing a pilot air valve (Swagelok), which is used to receive gas from the reservoir vessel, and deliver it to the PVT cell at several target pressures. The gas booster has a pressure multiplying ratio of 20 in relation to the pressure of the pilot air. Evacuation of the reservoir vessel down to a pressure of 10-8 bar can be attained by means of a turbomolecular pump (Leybold, Turbovac 361 C), assisted by a rotary pump (Leybold, D16B), that is connected to one of the toggle valves. The three additional toggle valves are used for supplying single pure gases into the reservoir vessel, and are connected to gas cylinders equipped with pressure regulators.

2.4. Description of the First PVT Apparatus

2.4.1. High Pressure PVT cell

The high-pressure PVT cell, which has an internal volume of approximately 325 ml, is constructed from a special alloy (Alloy 20). The PVT cell consists of a cup and a container that can be easily separated from each other. The cup is firmly mounted in an air-bath cabinet. Two feed-through connectors, each one bearing a K-type thermocouple with a measurement precision of ±0.1oC, are mounted on top of the cup. The thermocouples monitor the temperature of the gas and liquid phases inside the container. On top of the cup there are also two additional feed-through connectors which allow small quantities to be removed from the gas and liquid phase inside the cell via the respective gas and liquid sampling valves and loops. Also, the top of the cup bears an optical window where an external camera (Supereyes™) is mounted. The camera video-monitors the gas/liquid interface during the experiments, allowing to optically invigilate the entire gas hydrate formation and dissociation processes. The bottom of the PVT cell is in contact with a magnetic agitator with controllable rotation speed, which causes the rotation of a magnetic bar to facilitate the mixing of the components of the liquid phase.

2.4.2. Thermostated Air Cabinet

The PVT cell is housed in an insulated cabinet with air circulation. The temperature in the cabinet is precisely controlled by a PID temperature controller (Jumo dTRON 316) and can be kept constant with an accuracy of ±0.1oC. The insulated cabinet interior also accommodates a high-pressure transducer (WICA D-10) for pressures in the range 0-200 bar with a measuring accuracy of ±0.2 bar, and a pressure transducer for the low-pressure range 0-10 bar (WICA D-10) with a measuring accuracy of ±0.01 bar. In addition, the cabinet contains the sampling loops for the gas and liquid phase with precisely defined volumes, and a pressure relief cell for the liquid sampling. All high pressure (24 MPa) diaphragm valves (Swagelok) are accessible from the front panel of the cabinet. An overview picture of all the equipment located inside the insulated cabinet can be found in the work of Kastanidis et al. [51].
The temperature of the air-bathed cabinet interior as well as of the gas and liquid phases inside the reactor cell are displayed by three digital indicators/controllers (Jumo) located on the front panel. The panel also contains digital readouts of the three pressure transducers attached to the reactor cell, the pressure relief cell for the liquid phase, and the primary vessel in the gas preparation manifold. A thermal bath with a water/ethylene-glycol mixture as coolant, and controlled by an automatic temperature controller (type ECO Silver RE 630S, Lauda), was used to thermostatize the PVT cell with a maximum deviation of ±0.02oC over the temperature range of our measurements. The coolant from the bath circulates through a thermally insulated cooling coil which passes though the cabinet interior and is firmly mounted around the PVT cell. Both the coil and the cell are firmly enclosed by an insulating jacket. The coil can be easily removed from the PVT cell whenever its container needs to be removed for cleaning.

2.4.3. Monitoring and Data Acquisition

The readings of the two thermocouples for the gas and liquid phases inside the reactor cell, as well as those of the pressure transducers mounted on the reactor and relief cells are monitored, saved and acquired in a data acquisition unit using a virtual instrument application (VI) developed in Labview environment. The communication is performed via an RS232 interface.

2.5. Description of the PVT Configuration Incorporating a Stirred Reactor

2.5.1. Stirred Reactor

A high-pressure stirred tank reactor has been used for the experimental investigation of CO2 hydrates formation and (H-Lw-G) equilibrium (Figure 1). The configuration includes a Parr 4561 bench top high-pressure stirred reactor made of T316 stainless steel, equipped with a magnetic drive for internal stirring with controllable speed of the stirrer motor (A1120HC drive model), a Parr stirring control unit (model 4565M), a refrigeration unit, a single piston sampling cylinder, and a high-pressure automated water pump. The stirred reactor encompasses a bomb cylinder (cell) with inner free volume of 100 ml and I.D. 2.1 inches, a gas inlet valve, a liquid sampling valve, a gas release valve, a mounted J-type thermocouple (with precision of ±0.3°C over the range 0°C - +200°C) a part of which reaches to the cell interior, a pressure gauge and a burst disc. In all experimental runs, the incoming gas was introduced through the gas inlet valve which is connected to a tube that reaches below the surface of the liquid and near the bottom of the cell.
The pressure of the gas phase inside the cell is monitored by using an electronic pressure transducer (type PXM4202-6KGI, Omega Engineering Inc.) with measurement precision of 0.1 bar, operation range of 0-6000 psig, and analog signal output 4-20 mA, which is mounted on the outlet of the gas release valve. The same automated thermal bath which is connected to the first large PVT apparatus, is also used for thermostating the stirred reactor of the second PVT setup. In this case the small reactor cell is immersed in the bath in direct contact with the coolant.

2.5.2. Data Monitoring and Acquisition System

The temperature of the refrigeration bath and the reactor cell interior are monitored by using a digital thermometer (type P655 instrument, Dostmann electronic) encompassing an A/D converter, that receives the analog signals from the two J-type thermocouples, one mounted inside the reactor cell (as mentioned in Section 2.5.1), and one partially immersed into the coolant in the refrigeration bath. The signals from the P655 thermometer’s digital output are transmitted to a RS232 interface in a PC. The analog readings from the pressure transducer are transmitted to a BNC-2110 A/D card with 15 BNC connectors for analog and digital I/O signal connections that transmits the digitalized signals to the PC through a PCI card. A VI application in the employed NI Labview (32-bit) software was used for data logging, storage, and acquisition.

2.6. Water Supply Configuration

A high-pressure continuous flow, pulse free pump (VP-6K Ambient pump model, Vindum Engineering Inc.) has been used to deliver water into the reactor cell of both PVT setups, with a precisely controllable flow rate and pressure, and accurately monitor the gas phase pressure over the entire course of the experiments via internal pressure transmitters with accuracy +/- 0.1% of full scale. The water amounts were introduced to the reactor cell through the high-pressure single piston sampling cylinder mentioned in Section 2.5.1 (type ProLight Ti-690 64 MB, Proserv), with inlet and outlet valves, which is connected to the water pump. The cylinder has total internal volume of 629 ml and maximum pressure limit of 690 barg. The side of the cylinder that is fixed to the liquid sampling valve of the reactor cell is filled with deionized that has been degassed for 5 hours under vacuum using a rotary pump and intense magnetic stirring. The pump has a maximum pressure rating of 6500 psi, minimum flow rate of 0.00002 ml/min, pressure resolution 0.1 psi, and flow rate and volume accuracy +/- 0.1% of set point. The pump allows for logging and acquisition of water flow rate and pressure data and thus, it can be used complementary to the readings from the pressure transducers mounted on the two PVT setups, which are monitored using the employed NI Labview data recording software.

2.7. Experimental Procedure

The Isochoric Pressure-Search method has been applied in both PVT configurations to determine the (P, T) conditions for the formation and dissociation of gas hydrates. This method allows the construction of the phase diagram of the studied CO2-H2O system including the point (P, T) of the complete thermal dissociation of gas hydrates. At first, the gas primary vessel and PVT apparatus were thoroughly evacuated using a turbomolecular pump (Leybold, Turbovac 361 C) assisted by a rotary pump (Leybold, D16B). CO2 gas was then loaded into the gas primary vessel up to a pressure of 5 bar. The reactor cell was cleaned with methanol and then repeatedly with deionized water, followed by drying using compressed air. The cell was then tightly sealed and thoroughly evacuated along with the gas feed line to remove the atmospheric gases while pressure and temperature data were recorded. After the evacuation step, the temperature of the thermal bath was set to 23-25oC and the empty reactor cell of the small PVT setup was immersed in the bath, whereas in the large PVT apparatus the temperature of the reactor cell was regulated by the coolant circulating through the cooling coil in firm contact with the cell. Subsequently, pure CO2 was fed into the reactor cell and pressurized to a selected target pressure, at bath temperature, by using the gas booster described in Section 2.3. The (P, T) data were recorded every 30 s, and after remaining stable for 3 hours, their average values were considered as the feed (P, T) conditions.
Subsequently, a certain volume of deionized and degassed water is loaded into the autoclave through the single piston cylinder which is connected to the high-pressure water pump. Upon completion of water addition to the cell, the contained liquid is stirred either by using a magnetic agitator in the large PVT configuration or via the magnetic drive bearing a four-blades impeller when the small PVT setup is used. After charging the required amount of water to the autoclave and setting the stirring rate, the pressure began to decrease (at constant temperature), as a result of gas dissolution in water, until absorption equilibrium was reached, as indicated by stabilization of the pressure. This way of supplying the gas and water components makes it possible to calculate the exact amount of gas inside the cell by determining the compressibility factor, Z, at the steady feed conditions (P, T) of the hydrate former (whose volume is known), using the Peng-Robinson (P-R) or other Equation of State. In addition, this method allows to correctly determine the H2O:CO2 mole ratio in the cell based on the supplied amounts of CO2 and water.
Accordingly, each CO2-H2O binary system was slowly cooled down to 13.7-13.8oC, and kept under isothermal conditions to establish absorption equilibrium. Then, the system was further cooled to ~0oC or -1oC to study CO2 dissolution and form gas hydrates by applying either an incremental (step-wise, SW) mode (~1oC temperature drop per reduction step) or a continuous cooling (CC) mode. The system was kept at the lower temperature limit for 24 or 48 hours to study hydration and (H-Lw-G) equilibrium. Subsequently, a step-wise or continuous heating stage was conducted to thermally decompose the formed hydrate phase and close the phase envelope. The duration of the individual isothermal steps in the SW cycling mode was not predetermined but varied depending on the time required for the system to reach absorption (at the cooling stage) or desorption equilibrium (on heating) or gas-liquid-hydrate equilibrium.
The applied H2O:CO2 mole ratios (denoted hereafter as MR) ranged between 20.48-21.91. The loading conditions of the two components, experimental parameters, and employed PVT configuration for all experimental runs, are listed in Table 1.

3. Results

3.1. Experimental Pressure vs. Temperature Phase Diagrams

3.1.1. Experimental Runs Performed in Continuous Temperature Cycling Mode

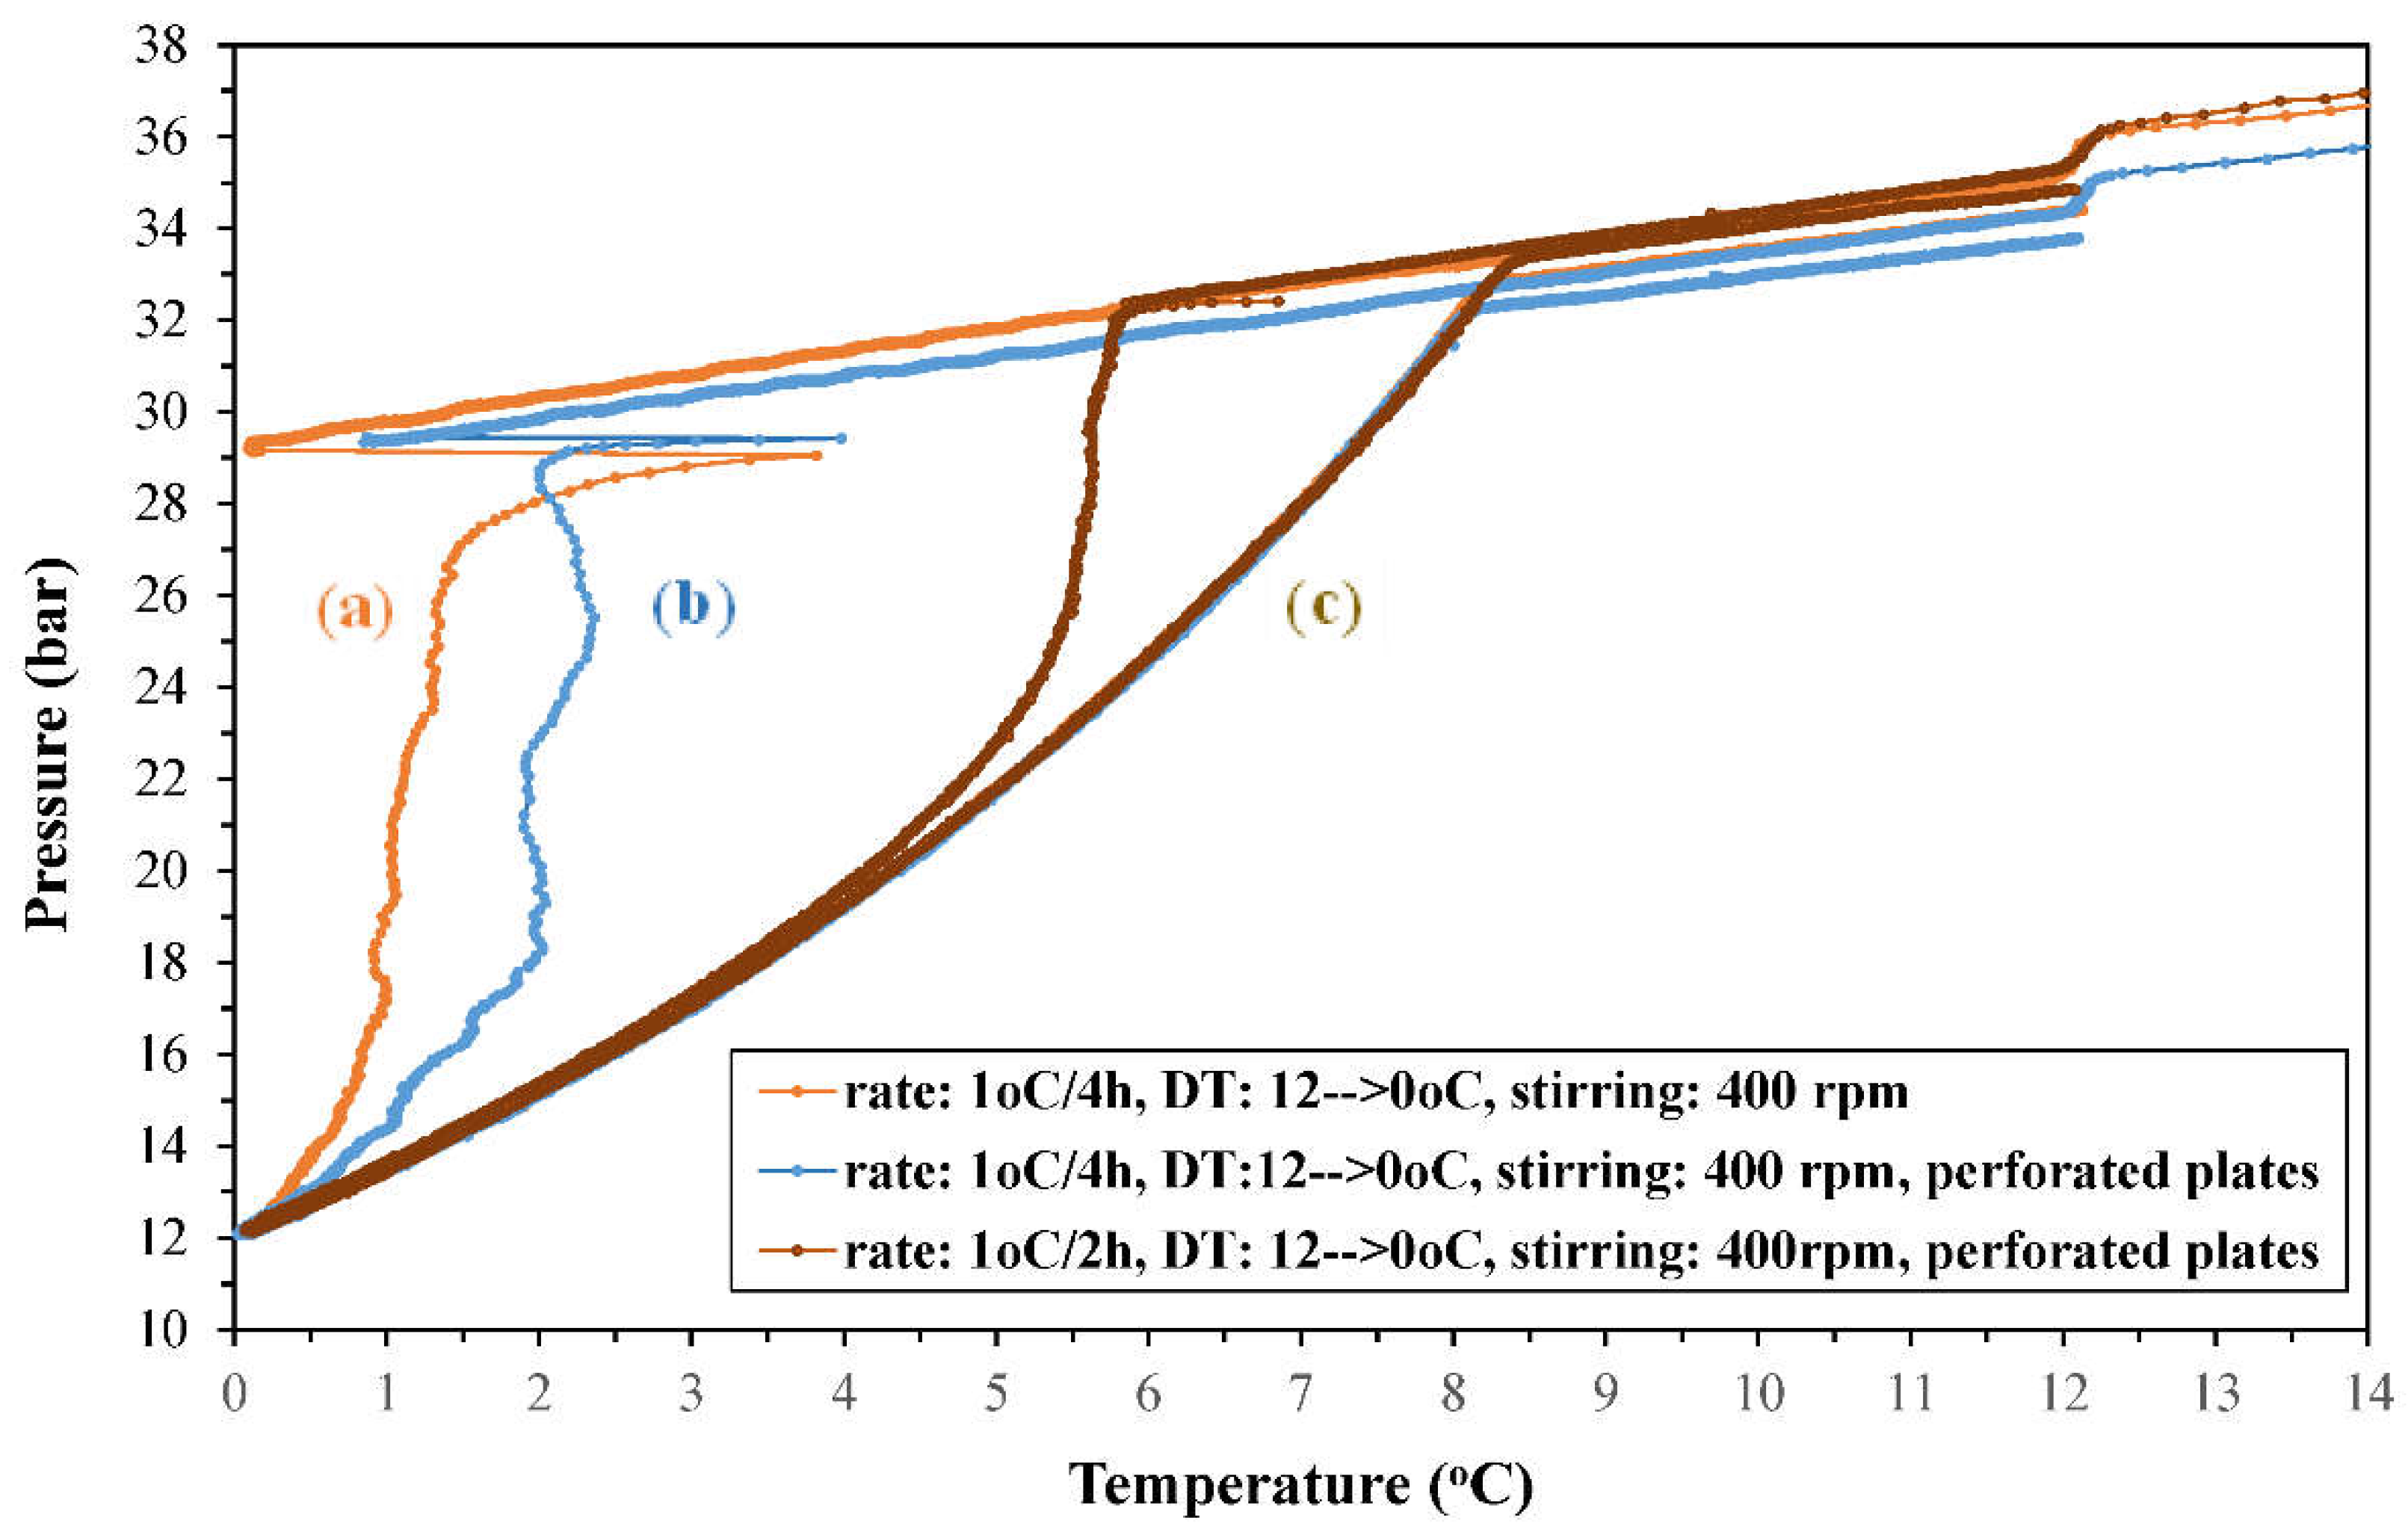
The (P, T) phase diagrams derived from the experiments conducted in the continuous temperature cycling mode are presented in Figure 2. The steep and drastic pressure drop steps during the cooling stage, which imply the extensive formation of CO2 hydrates, were affected by the cooling rate and the presence of perforated plates on the rotation axis of the magnetic drive, in what concerns (i) the onset temperature of each abrupt pressure reduction step, and (ii) the pressure reduction profile that led to the final (Peq, Teq) conditions of the (H-Lw-G) equilibrium. The pressure reduction reached to the same equilibrium pressure (12.07, 12.13, and 12.58 bara) at the lowest applied temperature limit of 0.02, 0.07, and 0.24oC, (i.e. the same (Peq, Teq) equilibrium point, as is also shown in Figure S1). The equilibrium pressures were close to the Peq values at similar temperatures which have been referred in the literature (Peq = 12.7 bara at 0.35oC [52]; Peq = 13.8 bara at 0.7oC [23]).
It is worthy to mention that the faster applied cooling rate (1oC/2h) significantly reduced the subcooling and induction period of the CO2 hydrate nucleation stage, thereby accelerating the initiation of the subsequent stage of hydrate crystals growth. The latter stage is related to the extensive absorption and transfer of CO2 from the gas phase to the hydrate crystals, which accounts for the observed drastic pressure reduction.
In addition, a similar (P-T) phase diagram was obtained from a repetition experiment, when upon completion of the experiment with MR20.21, the same CO2-H2O system was initially equilibrated at room temperature for 48 hours and was then subjected to the same continuous temperature cycling process, with the same cooling-heating rate of 1oC/2h. The (P-T) phase diagrams of the two experiments are compared in Figure S2. The small difference in the initial pressure between these two runs is due to CO2 absorption during the initial equilibration step in the repetition experiment. As it can be observed, the usage of perforated plates facilitated the formation and growth of hydrate crystals since the surface area of these plates provided an additional large number of nucleation sites and thus, it served as kinetic promoter by reducing the induction time of the nucleation phase which leads to hydrates crystal growth.
Regarding the heating curves, in all experiments the pressure increased as soon as the heating stage commenced and kept increasing smoothly up to the point where the heating curves joint the respective cooling curves. The evolution of pressure with raising temperature was common for the three runs. The observed pressure evolution might be indicative of a heat-sensitive hydrate phase, that consists of isolated hydrate crystals dispersed within the bulk aqueous liquid, the external layers of which are gradually decomposed with increasing temperature. This dissociation releases CO2 molecules into the aqueous liquid in a continuous but not abrupt manner, which are subsequently desorbed into the gas phase. Furthermore, the temperature at which the heating curves (i.e. hydrate thermal dissociation) and cooling curves joint, ranged between 8.15-8.45oC.

3.1.2. Experimental Runs Performed in Incremental Temperature Cycling Mode

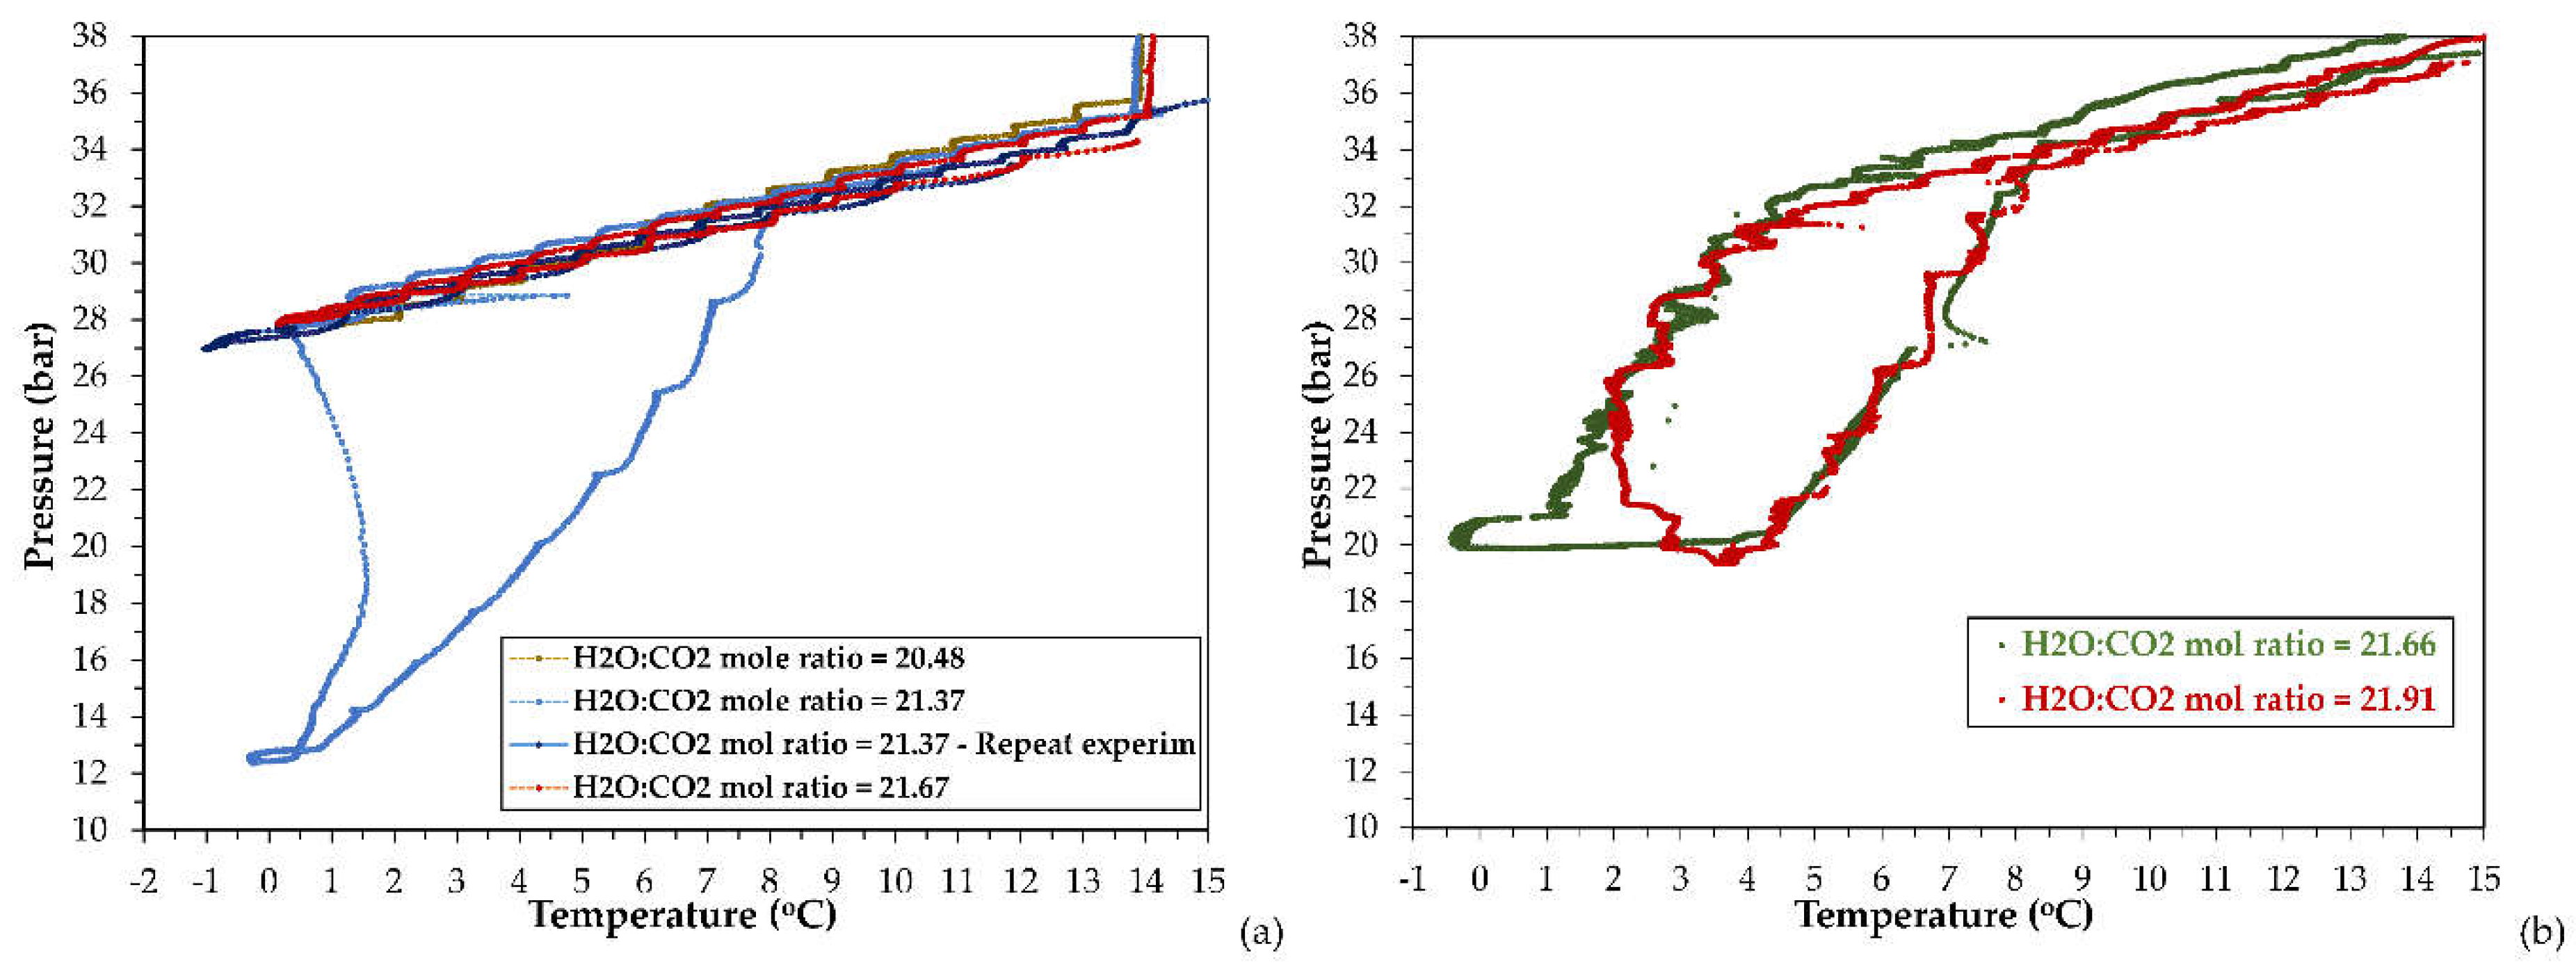
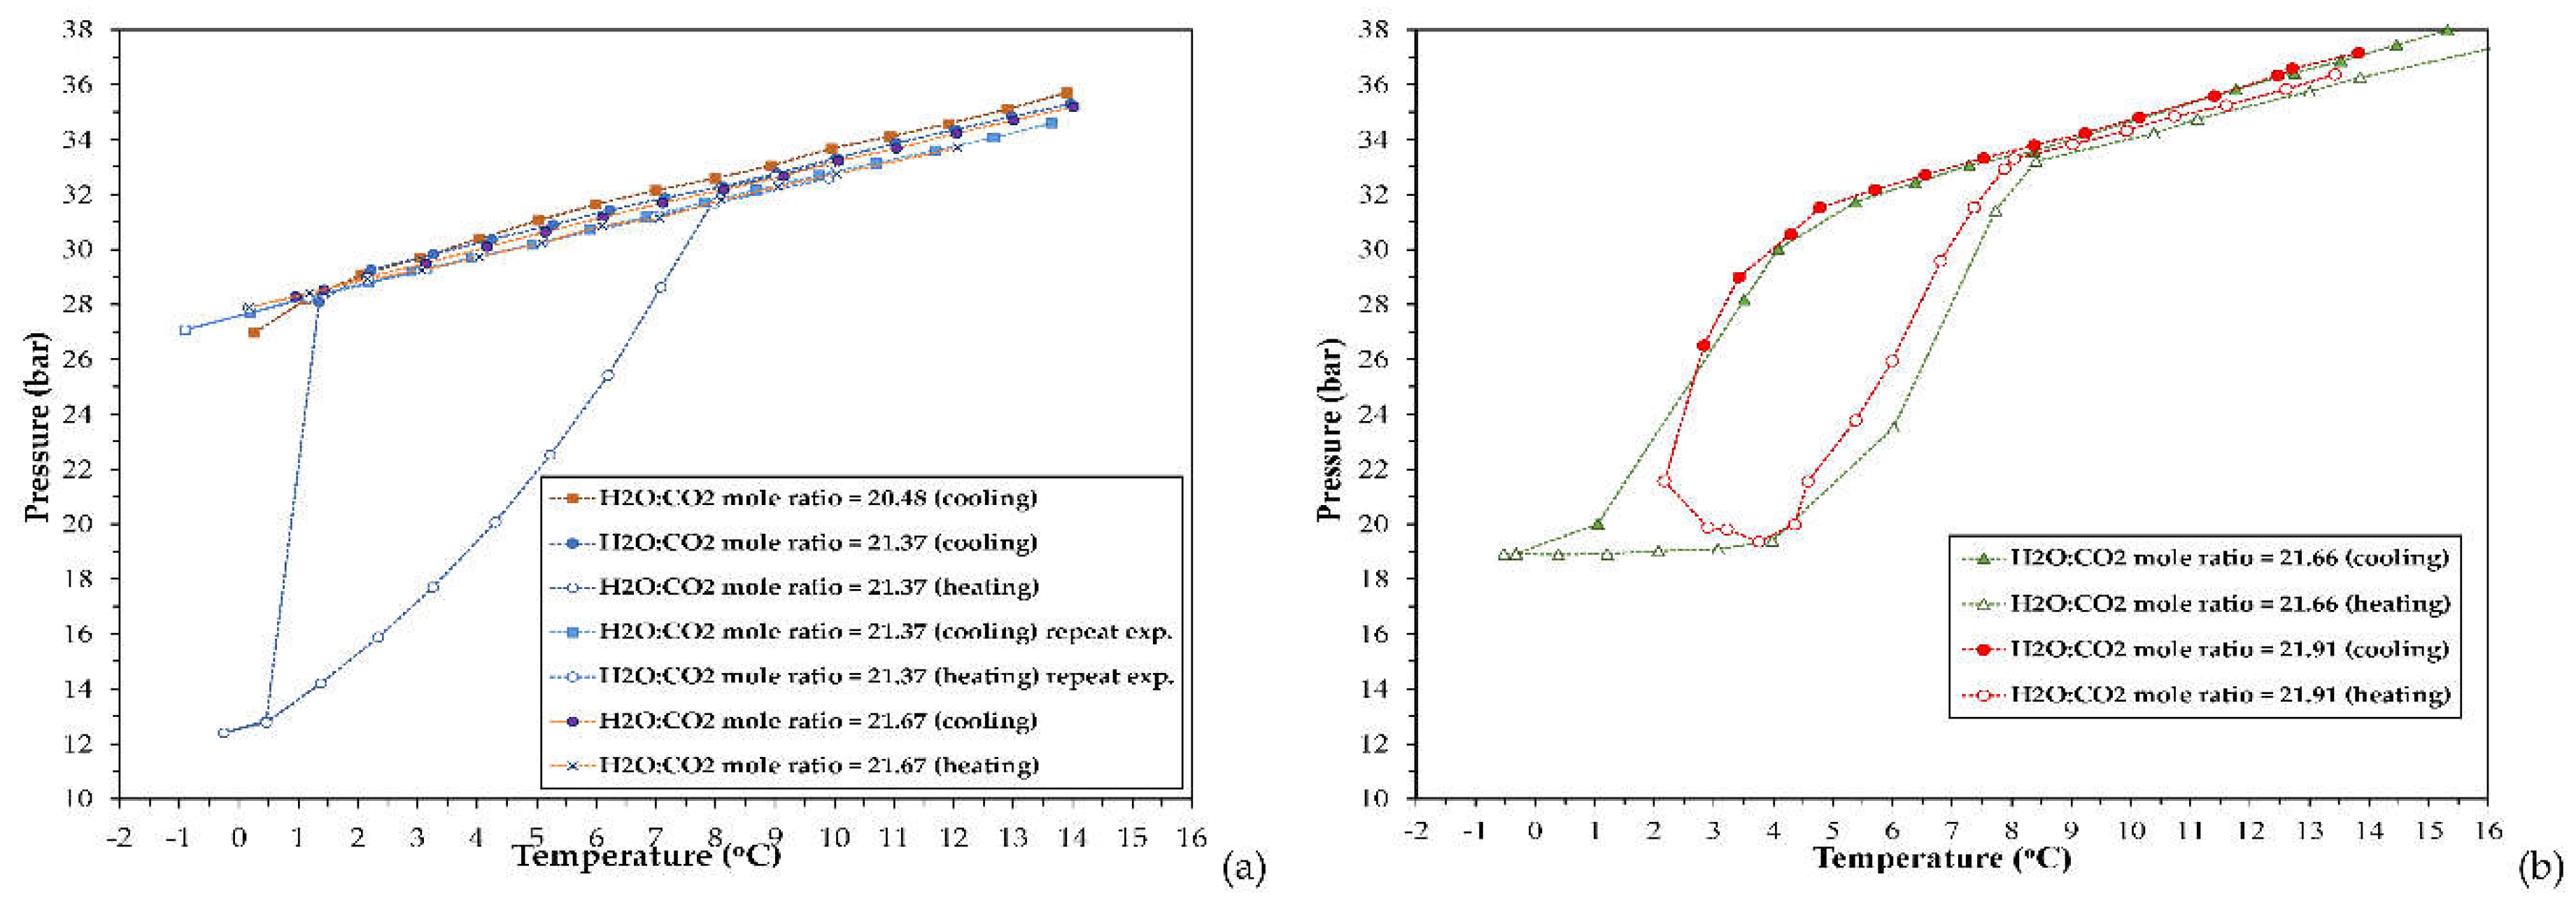
The pressure and temperature data acquired during the cooling, isothermal and heating stage, from the runs performed with the studied CO2-H2O systems via the SW-mode, have been used to identify the (P, T) conditions to reach (H-Lw-G) equilibrium, and construct the phase envelope of the respective systems. The (P, T) phase diagrams are presented in Figure 3, whereas Figure 4 depicts the experimental (P, T) results at equilibrium conditions (either (Lw-G) or (H-Lw-G) equilibrium). The respective phase envelopes are formed from the equilibrium data acquired at the cooling and heating stage. The SW-mode experiments were conducted using feed H2O:CO2 mole ratios within the range of 20.48-21.91.
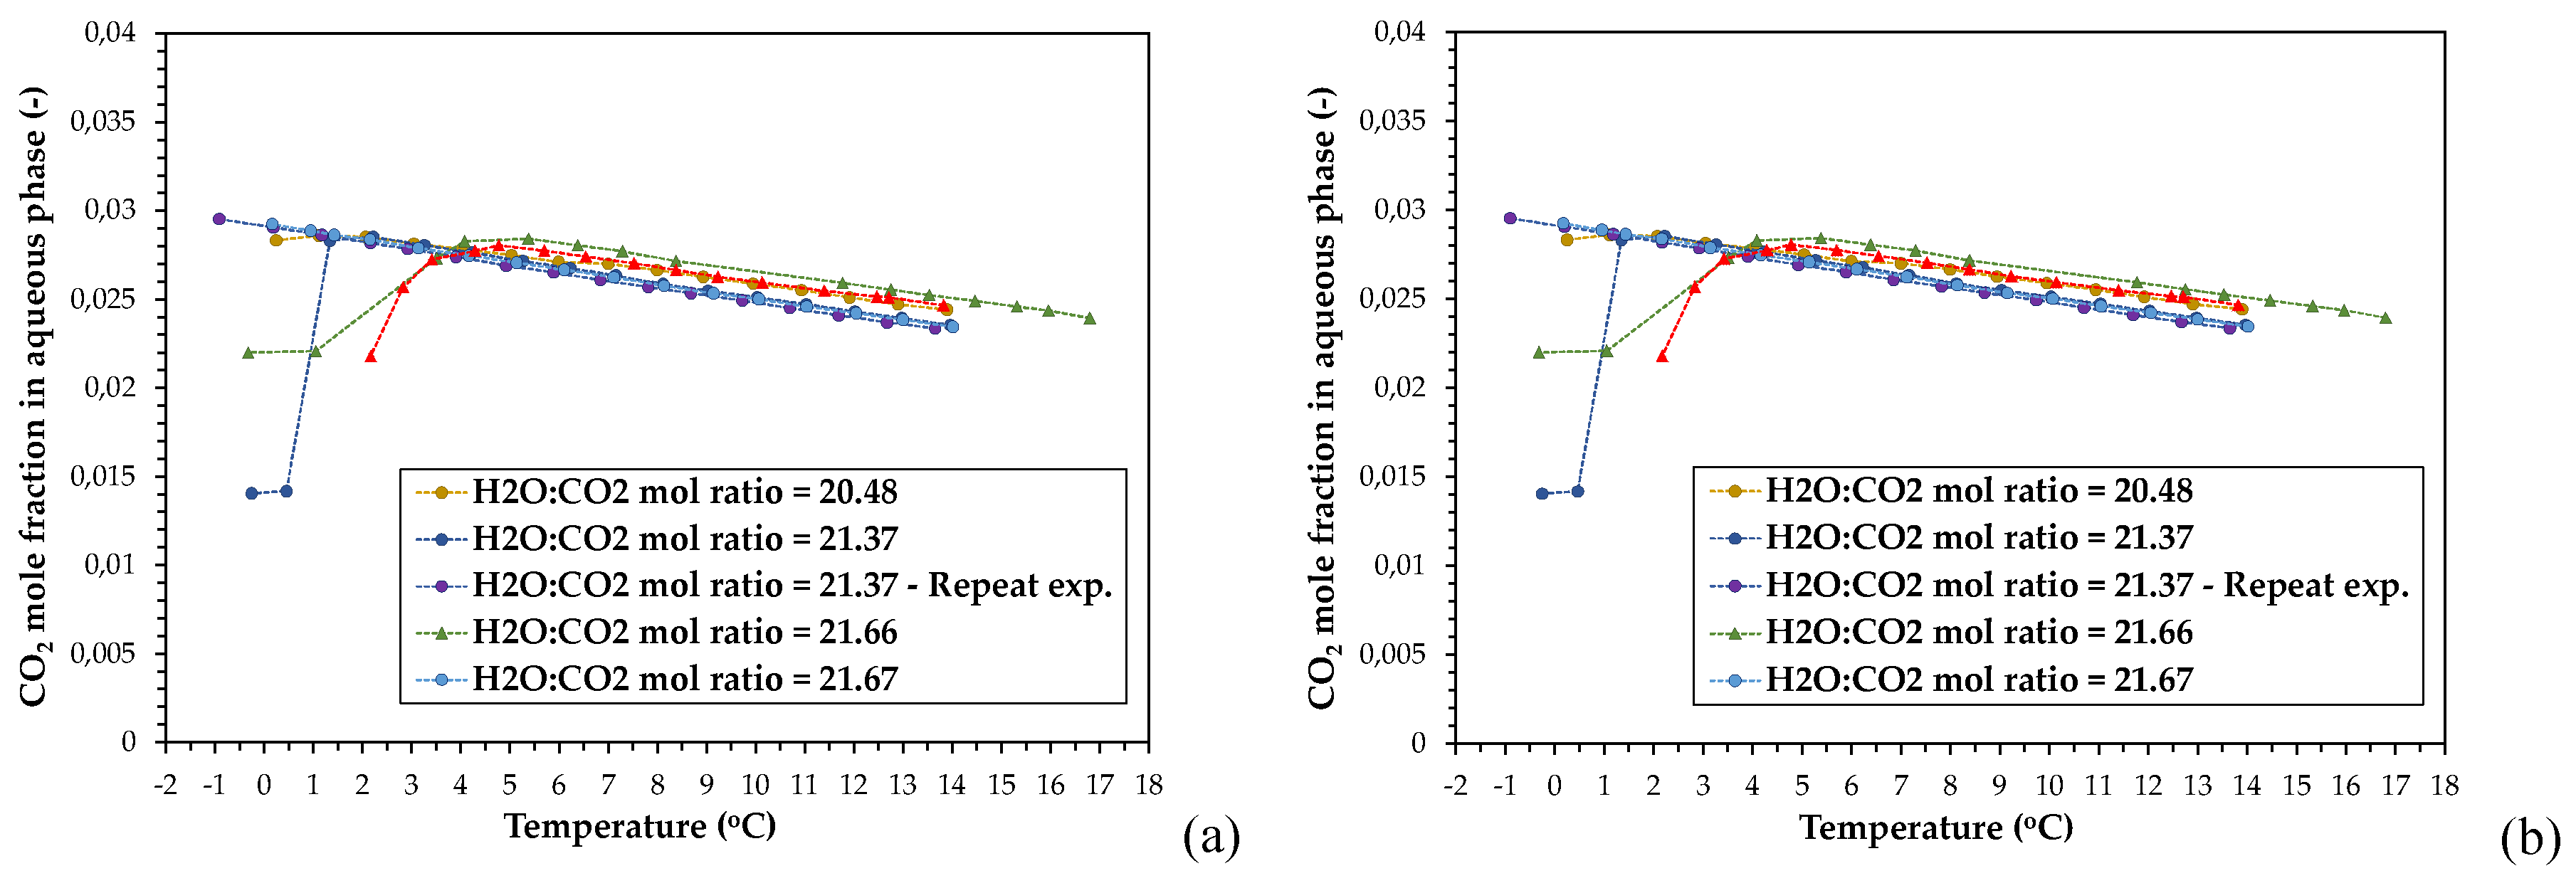
Regarding the stirred tank reactor, with the exception of one experiment performed with MR21.37, in the other three runs no hydrate formation has taken place at all during the entire cooling period, as observed in Figure 3a and Figure 4a. In these three runs, the CO2-H2O system at the cooling stage did not undergo any transition from a two-phase (Lw-G) to a three-phase (H-Lw-G) system, even though (P, T) conditions were applied at which this phase transition should have taken place. In opposite, regarding the runs performed in the large PVT apparatus, application of similar H2O:CO2 feed mole ratios allowed for CO2 hydrate formation, as observed in Figure 4b. Formation and growth of gas hydrates was deduced by the steep and drastic pressure reduction at the cooling stage. CO2 hydrate crystals exhibit substantially higher capacity for CO2 absorption compared to liquid water.
The situation where only the gas and aqueous phase coexist under hydrate formation conditions, corresponds to a metastable equilibrium between the gas phase and a super-saturated aqueous liquid, which contains a large population of dispersed hydrate nuclei. This metastability is associated with a supercooled liquid where the hydrate nuclei aggregation/clustering process that normally leads to a necessary critical size for crystal growth, involves a relatively long induction period, because of prohibited clustering of hydrate nuclei. As a consequence, the subsequent step of hydrate crystal growth cannot commence during the successive cooling steps. Hence, at the cooling stage, the supersaturation of the aqueous phase was inadequate to rapture the metastability and force the gas-liquid system to undergo the phase transition that would lead to growth of stable hydrate crystals.
For the runs with a H2O:CO2 mole ratio of 21.66 and 21.91, the pressure drop became rapid and prominent below ~3oC. As observed in the phase envelopes of the experiments with MR21.37, MR21.66 and MR21.91 (Figure 3a,b), the temperature difference between the point of complete hydrate decomposition and the onset of hydrate crystal growth (i.e. the degree of subcooling) is either moderate, as in the two latter runs (ΔΤsub = 2.74oC and 4.18oC respectively), or high, as in the experiment with MR21.37Τsub = 6.74oC). The onset temperature of hydrate crystals growth (i.e. rapture of metastability) has been taken as the temperature of the sudden heat release (temperature jump).
Further evidence for gas hydrate formation is provided by the first derivative of pressure with respect to temperature (dP/dT) vs. temperature curves at the SW cooling stage, as shown in Figure S3. In the case of the experiments with MR21.37 and MR21.91, an intense maximum is observed at 0.46 and 2.17oC respectively, which starts to emerge at 1.34 and 4.29oC. Another important finding is the different profiles of the heating curves obtained from the two PVT configurations. This dissimilarity could arise from the different internal design and liquid agitation mode of the crystallization autoclaves, which affect the mass and heat transfer rates (lower temperature reduction rate in the large PVT autoclave compared to the cell of the stirred reactor, for the same cooling rate), as will be discussed later.
It is mentioned that the SW-mode proceeds though consecutive equilibrium steps of gas dissolution, hydrate formation, hydrate dissociation and gas desorption, which result in prolonged processes. On one hand, application of intense agitation will increase the gas dissolution rate and thus, the concentration of gas hydrate nuclei within the bulk liquid and/or on the gas/liquid interface during the cooling stage. However, it is possible that excessive agitation and shear, especially for quite long periods, destabilize and decompose the clusters of gas hydrate nuclei, thereby hindering their aggregation that would initiate the growth of hydrate crystals. As a consequence, the subcooling degree and the nucleation induction time will increase and the gas/liquid system may even be unable to undergo the phase transformation needed to establish (H-Lw-G) equilibrium. The hindrance of the hydrate nuclei clustering is possibly the reason for the lack of a CO2 hydrate phase for the experiments with MR20.48, MR21.37 (repetition experiment), and MR21.67. For the run with MR21.37, the conditions at which (H-Lw-G) equilibrium was established were identified at (i) T = 0.46oC and P = 12.83 bara, (ii) T = -0.25oC and P = 12.4 bara.

3.2. Correlation of the Pressure Evolution During the Cooling Stage with Crystallization Effects

In is known that formation of CO2 hydrates is a two-phase process that includes (i) formation of fine nuclei consisted of CO2 molecules enclathrated within ice-like crystalline lattices (crystal seeds), which grow in size via clustering, and (ii) growth of bulky hydrate crystals [53]. The duration of the nucleation phase is defined as the induction period. During this period the aqueous phase is supersaturated with CO2. The nucleation phase is ended by the formation of stable hydrate nuclei clusters of critical size. As soon as the growing nuclei exceed the critical size, they begin to grow spontaneously as bulky hydrate crystals, and in this way the crystal growth phase commences. The greater the subcooling / supersaturation, the greater the driving force for hydrate nucleation and the rate of hydrate crystal growth.
The effect of the subcooling degree on the extent and rate of CO2 hydrate growth and associated pressure drop, can be assessed by the phase envelopes of the runs with MR21.37, MR21.66, and MR21.91. In the first run, the evolution of pressure during the cooling stage was quite different from the case of the two latter runs. Since the three experiments were performed using the same stirring rate (400 rpm) and at nearly the same initial pressure (31.04-31.40 bar, see Table 1), the sharper pressure reduction that occurred in the first run can be associated with the greater subcooling and induction time. This ensues larger driving force for spontaneous growth of hydrate crystals and also higher crystal growth rate and thus, higher pressure reduction rate. Similar findings regarding the effect of subcooling on the hydrate growth rate have been reported in the literature, although cases with large variability in induction times within a single experimental setup have been also reported [54,55].
On the other hand, the larger induction time and subcooling can be attributed to the intense shear or turbulence imposed in the aqueous liquid by the rotation of the impeller, that could mechanically extort CO2 molecules for the hydrate nuclei dispersed in the liquid phase, especially when prolonged cooling stages are applied. This would prevent the formation of stable hydrate nuclei clusters of critical size, until the driving force for this clustering at a sufficiently low temperature, eventually overcomes the mass transfer limitation. It is noted that for all runs performed in the stirred tank reactor by applying the SW mode, the experiment with MR21.37 was the only case where a CO2 hydrate phase was formed. This is indicative of the hindering effect of the excessive shear / turbulence, and prolonged process time, in the capability of CO2-H2O systems to undergo the phase transition that will lead to the formation of a gas hydrate phase, despite the higher heat flux.
In the two latter runs that were performed in the large PVT setup, the pressure reduction became sharp below ~3oC (for MR21.91) or ~4oC (for MR21.66). It is likely that the moderate mass transfer imposed by magnetic stirring did not hinder aggregation of hydrate nuclei dispersed in the aqueous liquid - this aggregation is an essential process for hydrate crystal growth - since no excessive shear and turbulence conditions were applied in the liquid to destabilize clustering of hydrate nuclei. This would result in the observed lowering of the subcooling degree compared to the high ΔTsub that was observed when the stirred tank reactor was used (experiment with MR21.37).
Besides the abrupt pressure reduction in the experiments with MR21.66 and MR21.91, a rapid switching in the appearance of the aqueous phase was observed, from a lucid solution to an opaque one. The surface of the stirred liquid became essentially opaque to optical observation by the mounted camera (rather suddenly) once the autoclave was cooled below nearly 3oC, indicating the formation of a non-transparent hydrate layer. Several optical microscopy studies have revealed that during the hydrate crystals growth phase, a CO2 hydrate film can be formed and expand laterally along the gas/liquid interface [56,57]. The lateral growth rate of this hydrate film also depends on the system’s subcooling ΔTsub.
Prior to the sharp pressure reduction that occurred at the cooling stage for the runs with MR21.37, MR21.66, and MR21.91, an instantaneous increase (jump) of the liquid’s temperature was observed, which coincided to the onset of the drastic pressure drop. Natarajan et al.[58] have reported a slight but detectable rise of the aqueous solution temperature at the turbidity point because of the heat released by the sudden formation of stable hydrate nuclei. The sudden increase in temperature can be attributed to a rapid initiation of the growth phase of large amounts of stable hydrate crystals, which is an exothermic process. It is noticed that the temperature jump was more pronounced when it took place at a lower temperature and thus, greater subcooling, possibly due to the larger population of hydrate nuclei clusters of critical size in the aqueous phase. This would cause an abrupt release of larger amounts of hydration heat during the initiation of the phase of hydrate crystals growth.
Apart from the effect of the utilized PVT setup on the subcooling degree and the onset of the temperature jump, the temperature profile of the steep pressure drop phase, can also be explained on the basis of the mass and heat transfer characteristics of each experimental apparatus. Although the excessive agitation in the stirred tank reactor and the direct contact of the reactor with the coolant result in enhanced heat transfer rates, that maintain constant temperature, the release of substantial amounts of hydration heat can impose a temporary increase of both temperature and pressure inside the reactor, thereby introducing a negative effect, as can be observed in Figure 3a.

3.3. Thermal Dissociation of the Hydrate Phase

The thermal dissociation stage of the hydrate phase was studied with regard to the evolution of the gas pressure with increasing temperature. In the experiments where the system established (H-Lw-G) equilibrium (i.e. those with MR21.37, MR21.66 and MR21.91), the pressure exhibited two different behaviors. In the run with MR21.37, the pressure did not change up to 0.8oC, whereas in the other two experiments it remained either constant or even further decreased as the system was heated from the lower temperature limit up to ~4oC, thereby demonstrating the thermal stability of the CO2 hydrate phase up to this threshold. However, it is likely that the stability of the pressure over this temperature range is due to the growth of a thick dense hydrate layer on the gas/liquid interface rather than to a slow heat transfer and dissociation rate of large CO2 hydrate crystals dispersed in the bulk liquid. This hydrate layer acted as a practically impermeable cap separating the gaseous from the aqueous phase, thus preventing the desorption of released CO2 molecules from decomposed hydrate crystals below the solid layer/liquid interface towards the gas phase. Once the temperature exceeded 4oC, the gradual decomposition and pore opening of the hydrate barrier layer, enabled the release of considerable amounts of CO2 into the gas phase and this decomposition-desorption process continued up to 8oC.
The prominent first derivative dP/dT peak at 4.58oC for the experiment with MR21.91 (7.09 bar/oC), which implies the considerable release of CO2 amounts into the gas phase (which started between 3.76-4.36oC), is indicative of the dense hydrate cap assumption. At the temperature of ~8oC the phase envelopes closed, similar to the experiment with MR21.37. For all three experiments the “hydrate decomposition point” at which the thermal decomposition curve joins the cooling curve, was reproducible to within 0.37oC (8.08oC for the MR21.37, 8.41oC for the MR21.66, and 8.04oC for the MR21.91).

3.4. Phase Transformations and Equilibrium at CO2 Hydrate Formation Conditions

As mentioned previously, during the crystal growth phase, a rapid decline in pressure occurs owing to the extensive CO2 absorption by the hydrate phase. The spontaneous growth of hydrate crystals leads to the formation of a thin hydrate film that propagates along the gas/liquid interface. Eventually the hydrate film covers the entire interface and then, it grows in thickness into the aqueous phase-side. It has been reported that the size of the hydrate crystals decreases and the lateral film growth rate increases with greater supercooling [54,55]. An explanation for the effect of supercooling on the lateral growth rate of the hydrate films along gas / water interfaces has been provided in literature by a film growth model involving convective transfer of the heat of hydrate formation, from the edge of the film to the surrounding phases [59].
There are two sources of CO2 molecules that contribute to the lateral growth and thickness of a gas hydrate film; these are the gas phase and the bulk aqueous phase. Mori et al.[60] and Sugaya et al.[61] considered the hydrate film to be a thin water-permeable hydrophilic crystalline plate with numerous microperforations which are much larger than the molecular dimensions of the hydrate formers and water. In each microperforation liquid water diffuses continuously by capillary forces toward the gas phase-side surface of the hydrate layer, resulting in successive formation of hydrate crystals on this surface and therefore, in thickening of the hydrate film [62]. At the same time, the opposite surface of the hydrate film is being eroded as a result of dissociation of the hydrate crystals exposed to the bulk aqueous phase. Dissociation is enhanced with increasing rate of diffusive or convective removal of the gas molecules from the aqueous phase-side of the hydrate layer, which is inherently dependent on the flow of water relative to the film. The film thickness is inversely proportional to the mass transfer coefficient on the aqueous phase-side of the film [63].
In contrast, at low subcooling and low supersaturation levels, the population of hydrate nuclei is lower, and the lateral growth rate of the hydrate layer is controlled by the growth rate of a single crystal. As a result, the hydrate film surface becomes rougher and the lateral growth proceeds at lower rate [64,65]. The lower lateral growth rate of the hydrate layer provides the crystals in the film front with sufficient time to grow to 3D dimensions, which leads to the formation of a thicker and coarser hydrate film. The wider inter-crystalline gaps (film capillaries), in conjunction to the coarser internal texture (that provides larger hydrophilic surface area) favor the transfer of water and CO2 molecules from the gas phase, which come into contact on the pore mouths. Eventually, if the temperature becomes quite low, the width of pores may substantially decrease, and then the hydrate film will become practically impermeable to gas permeation. In this case, the hydrate film will separate the two fluid phases from each other and as a result, the pressure decrease will cease and the system will reach a steady state, which however is not identical to the actual (H-Lw-G) equilibrium.
Indeed, if the phase diagrams of the experiments with MR21.37, MR20.09 (stirred tank reactor, Figure 3a and Figure 4) and MR21.66, MR21.91 (large PVT setup, Figure 3b) are compared, it can be deduced that the larger mass transfer and shear, established in the mechanically agitated tank reactor, prevented the formation of a mechanically and thermally stable hydrate layer. Since a dense hydrate layer could hardly appear on the gas/liquid interface under such conditions, the bulk liquid was accessible to CO2 dissolution from the gas phase, until (H-Lw-G) equilibrium was eventually established and the pressure drop ceased, as observed in Figure 4a. This was also the reason for the larger reduction of the normalized pressure, as seen in Figure S3a. The structural instability of the CO2 hydrate layer could account for the fact that it started decomposing gradually almost as soon as the temperature of the system was raised (MR21.37).
On the other hand, in the case of the large autoclave, the moderate magnetic stirring resulted in slower mass transfer between the hydrate crystals and the surrounding fluid liquid. Thus, destabilization of the hydrate nuclei clusters was prevented, and enough time was provided to the individual clusters to continue enclathrating CO2 molecules and grow in dimensions up to a critical size. Such operational conditions tended to induce a rather moderate subcooling with shortening of induction period, and produce a thicker hydrate layer with low porosity on the gas/liquid interface, which acted like an impermeable cap, separating the gas phase from the bulk liquid phase [63,64,65]
As a result, the system reached a steady state that can be far from the theoretical (H-Lw-G) equilibrium. This case is different from what was observed in the run with MR21.37, at which once the rapid consumption of CO2 was completed and the pressure reached a constant limiting value, the system reached the (P, T) conditions for (H-Lw-G) equilibrium.

3.5. Comparison between Experimental and Computational Results on the Phase Behavior of The studied CO2-H2O Systems

3.5.1. Computational Results on the Incipient Conditions for CO2 Hydrate Formation

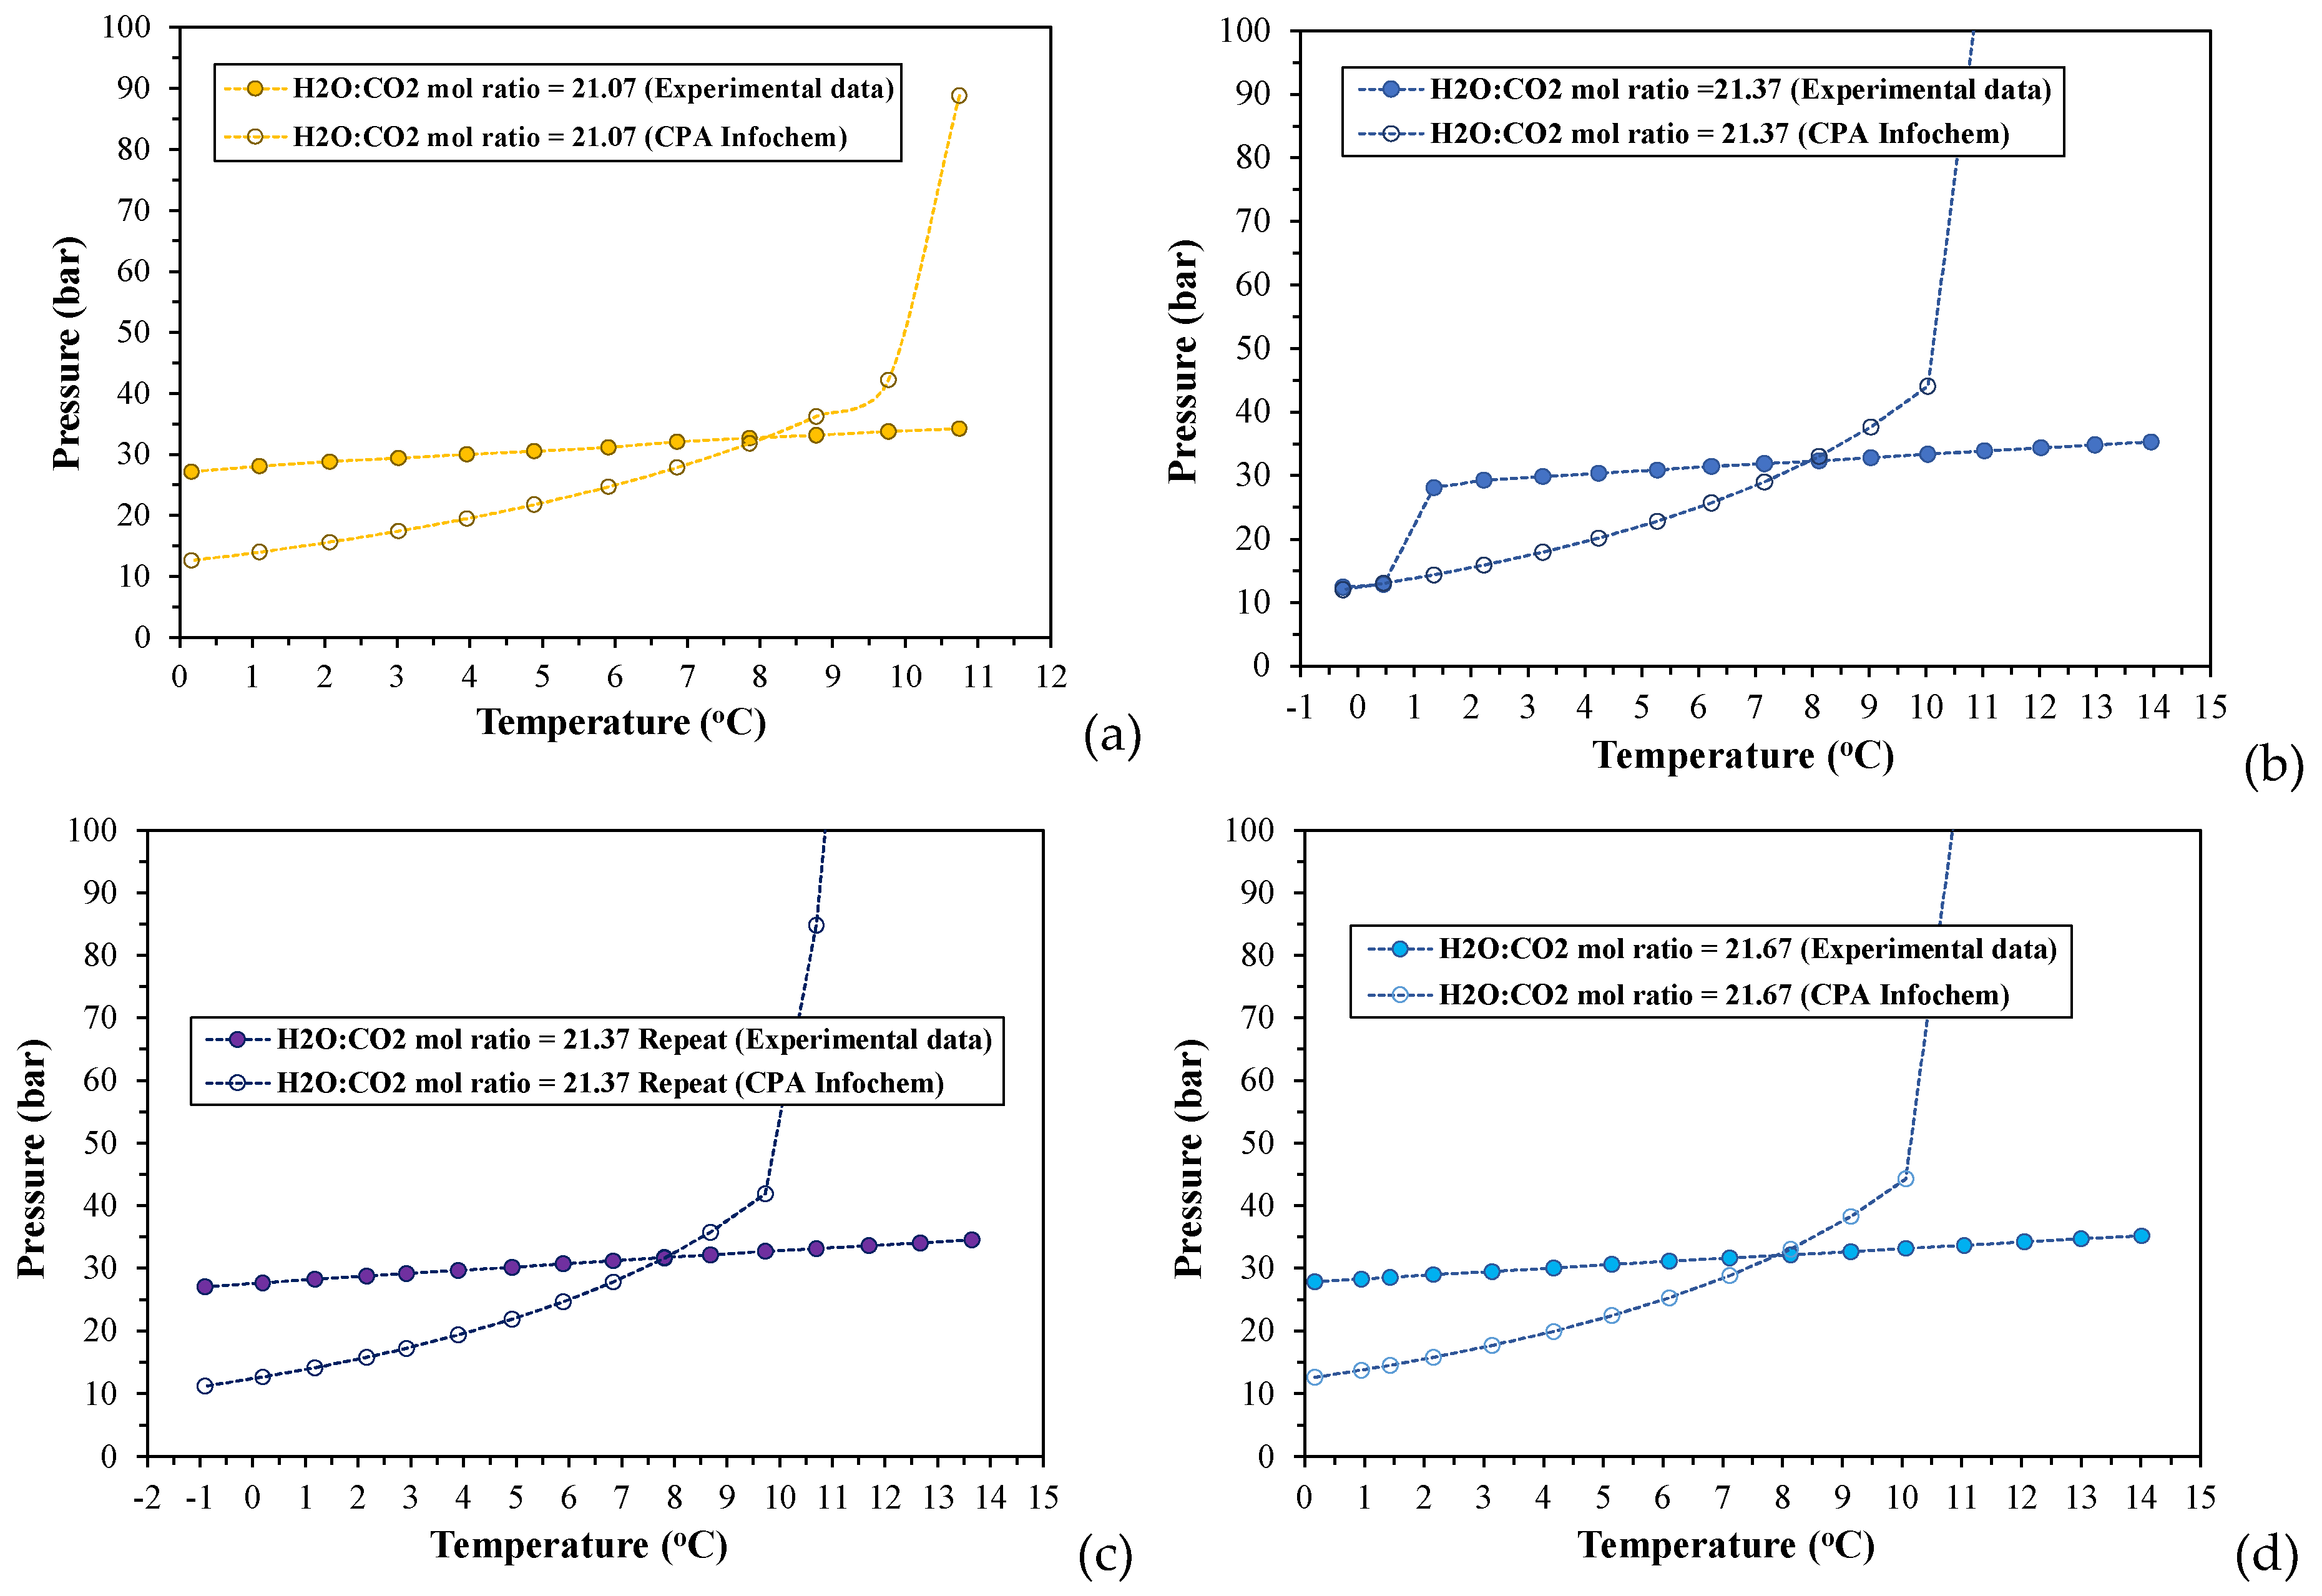
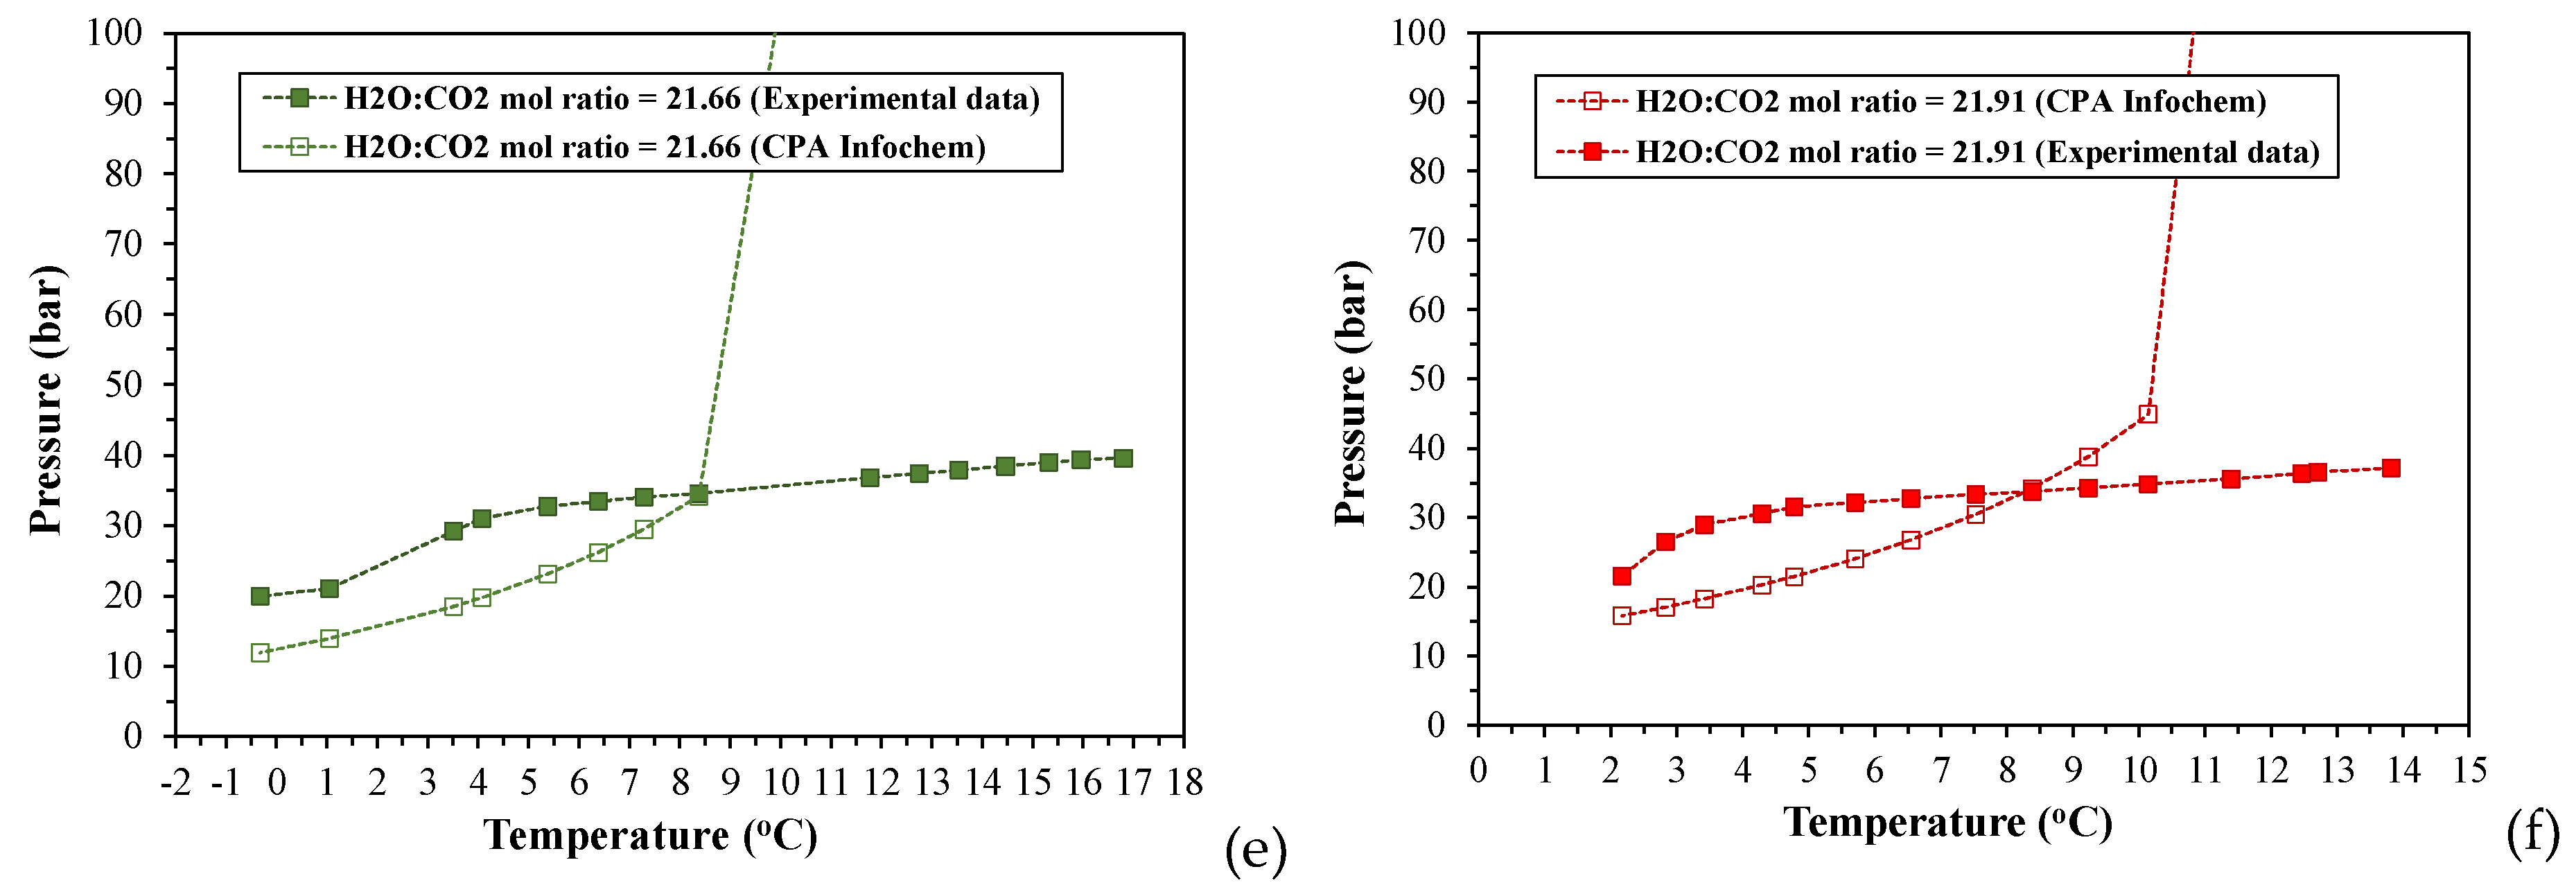
In addition to the experimental investigation of the phase behavior and hydrate formation conditions, a commercial thermodynamic software (Multiflash v.6.1) has been used to computationally determine the incipient pressure for CO2 hydrate formation, Pinc, and CO2 solubility in the aqueous phase, at each equilibrium temperature, Teq, for all experiments. The simulation model used for these calculations was the CPA Infochem Equation of State, which is available in the simulation software. Figure 5 depicts a collocation of the experimental (Peq, Teq) equilibrium curves for the cooling stage with the (Pinc, Teq) curves that have been calculated by applying the CPA Infochem model and for the same equilibrium temperatures.
According to the simulation results presented in Figure 5, there is a temperature threshold at which the experimental equilibrium (Peq, Teq) curve for each run intersects the respective calculated (Pinc, Teq) curve, below which the experimental pressures exceed the predicted incipient pressure at any equilibrium temperature, Teq. This intersection point is detected at a different temperature depending on the applied H2O:CO2 mole ratio. For all experiments the intersection point ranges between ~7.9-8.38oC and thus, it coincides to the “hydrate decomposition point” of the respective phase envelopes. The computational results in the case of the run with MR21.37 showed also two more intersection points at the experimental conditions where (H-Lw-G) was established (see Section 3.1.2).
At the experimental pressures above the calculated incipient ones (at same temperatures), the studied CO2-H2O systems are two-phase gas hydrate-water rich liquid (H-Lw) systems, and thus, the gas phase should have been completely depleted and CO2 would only be distributed between the hydrate phase and the aqueous liquid. The conditions for (H-Lw-G) equilibrium in CO2-H2O systems with H2O:CO2 mole ratios of 20:1, 30:1, and 40:1 have been determined by applying the CPA Infochem model, and the calculation results are shown in Figure S4. The temperature range in which (H-Lw-G) equilibrium can be attained, varies from 271.81-283.31 K for the MR20:1 and MR30:1, and from 271.81-280.37 K for the MR40:1. Figure S5-S7 in Supplementary Materials presents density and volume values of the aqueous phase, as well as change of volume (%) of the aqueous phase, at the (Peq, Teq) equilibrium conditions of the experiments, that have been calculated using the CPA Infochem model.

3.5.2. CO2 Solubility Calculations

CO2 solubility in the aqueous phase at the applied (Peq, Teq) equilibrium conditions, has been calculated using three approaches: (i) calculation of the Henry coefficient for all equilibrium temperatures by a fitting equation, which was derived from an extended data base of experimental measurements of CO2 solubility in water, combined with the calculation of CO2 fugacity at absorption equilibrium using the Peng-Robinson EoS, (ii) the CPA Infochem model of the Multiflash v.6.1 software, and (iii) the simple subtraction of the CO2 amount in the gas phase - at each phase equilibrium point (Peq, Teq) - from the initial CO2 amount supplied in the autoclave at the feed conditions, using the Peng-Robinson EoS. The CO2 solubility values calculated by the three aforementioned approaches were compared regarding their mutual deviations and with respect to their temperature dependence over the entire cooling stage (including superaturation conditions), and at the (H-Lw-G) equilibrium stage. The evolution of CO2 solubility in the aqueous phase with decreasing temperature in the presence of hydrates was resolved, and the results of the three calculation approaches will be discussed.

3.5.2.1. Henry Coefficients at the Equilibrium Temperatures

Carroll et al.[66] performed a thorough review of the research literature on CO2 dissolution in water and found approximately 80 experimental studies that reported dissolution equilibrium data for pressures lower than 10 bar. The authors developed a model based on the Henry's law and the experimental solubility data derived from the literature, to calculate the Henry's coefficient values, and allowed for the data to be compared and correlated. The developed model related the calculated Henry's coefficients (expressed in terms of mole fraction) as a function of absolute temperature, as follows:
l n H 21 = 6.8346 + 1.2817 × 10 4 / T 3.7668 × 10 6 / T 2 + 2.997 × 10 8 / T 3 ,
where H12 is the Henry coefficient of the system H2O (solvent, component 1) - CO2 (solute, component 2), in MPa/(mole fraction) and T is the absolute temperature. This correlation was found to be valid for the temperature range between 0 and 160oC. The Henry coefficients at any experimental temperature can be calculated by applying the fitting equation.
The maximum total pressure where the experimental data from the literature were taken into account to produce the above fitting equation, was limited to about 10 bar because this model ignores the deviation from the ideal behavior of the liquid phase, which at pressures greater than 10 bar starts to become significant. At higher pressures, the solubility of CO2 increases to the point where the activity coefficients can no longer be ignored. Also, at pressures above 10 bar, the Poynting correction (the effect of pressure on the reference volatility) becomes significant. The error resulting from neglecting the Poynting factor at a pressure of 10 bar was estimated to be about 1%. For a gas/liquid solvent system and a given temperature, the Henry coefficient expresses the solubility of the gas and is defined by the following relationship:
H 21 = lim x i 0 y i f i x i = lim x i 0 y i φ ^ i P x i
where xi: mole fraction of gas component i in the liquid phase, yi: mole fraction of gaseous component i in the gas phase, fi: fugacity of component i in the gas phase, φi: the fugacity coefficient of component i in the gas phase, and P: total pressure. The product yi·P is the partial pressure (pi) of component i (in this case CO2) in the gas phase, xi = xCO2,aq, and yi·fi = φi·pi. It is mentioned that in order for the calculated Henry constants to be valid, the mole fraction of the dissolved gas must be quite small (normally xCO2,aq → 0 and φ → 1).
Subsequently, the CO2 solubility curves which are calculated by applying the fitting equation (1) coupled with the Peng-Robinson EoS for CO2, and the Henry coefficient equation, that is H21 = φCO2·pCO2 / xCO2,aq, can be compared with simulation results for CO2 solubility in water at various (P, T) conditions. In particular, the equilibrium (P, T) conditions of the experimental runs will be the selected parameters for comparison purposes.
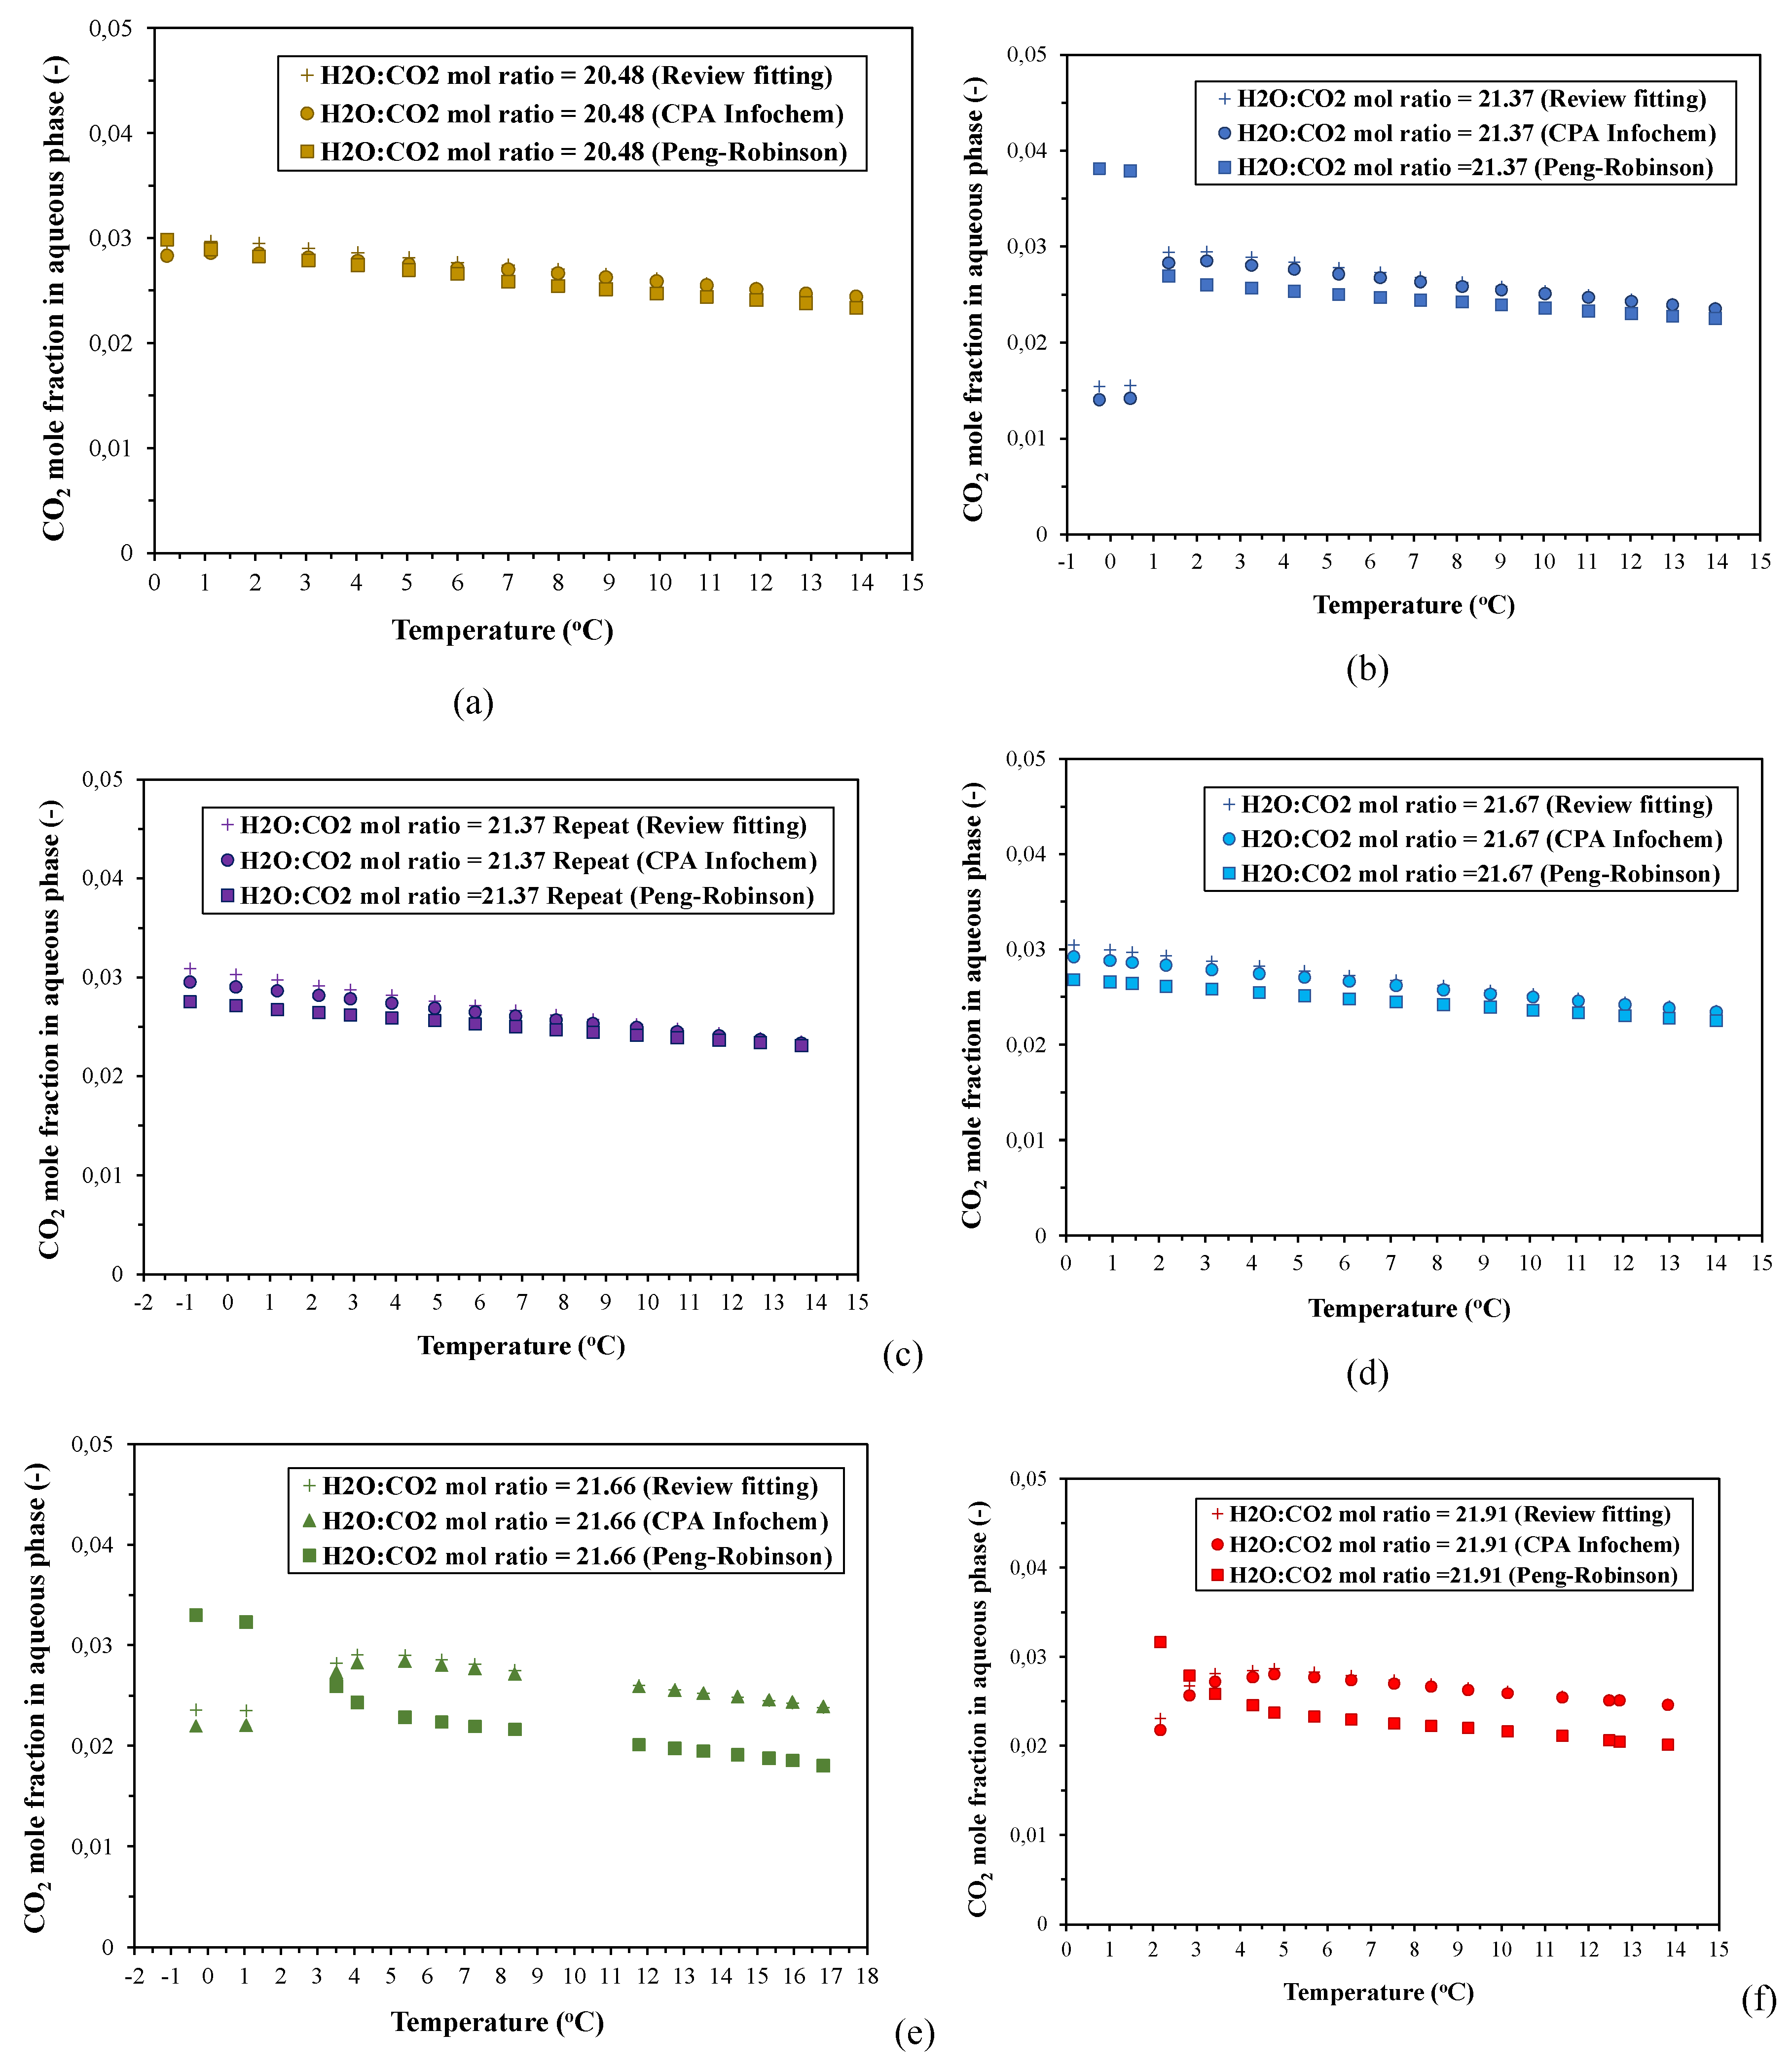
Figure 6a depicts the effect of temperature on CO2 solubility. The CO2 mole fractions in the liquid have been calculated using the fitting equation (1) to determine the Henry constant for each temperature and the Peng-Robinson EoS to calculate the fugacity at the respective experimental equilibrium pressures. Since the fitting equation (1) has been produced by collecting a large number of CO2 solubility data published in literature, the two calculation models (CPA Infochem and P-R EoS) can be indirectly validated with regard to their agreement with the experimental results for CO2 absorption in water reported in literature.

3.5.2.2. Calculation of CO2 Dissolution in Water Using the Simulation Model and Comparison with the Calculation Results Derived from the Fitting Equation-Based Approach

Figure 6b presents the CO2 solubility, calculated by applying the CPA Infochem model, as a function of temperature, for all applied MRs. The simulation model calculates the amount (in moles) and the mole fraction of CO2 in any phase in equilibrium. Figure S8 presents the deviations in the calculated values of CO2 solubility in water as a function of temperature, between the CPA Infochem EoS and the H21 vs. T fitting equation (1). The deviations are given as mean absolute percentage deviation (MAPD). A reasonable agreement between the fitting equation (1) and the thermodynamic model, especially at the higher equilibrium temperatures, can be deduced. A small deviation of the calculated results between the two approaches emerges at the lower temperature regime. Therefore, the simple calculation approach that is based on the fitting equation (1) can be useful for simple and rough predictions of the CO2 solubility in CO2-H2O systems (and mass balances as well), even under gas hydrate formation conditions. Usage of a more complex EoS will add complexity to this approach without significantly enhancing the accuracy.
Furthermore, in the experiment with MR21.37, the CO2 amount (moles) that remained in the gas phase at 0.46oC, calculated by using the CPA Infochem EoS, reached to 16.1% of its initial amount at the feed. At the lowest temperature of -0.25oC, the respective CO2 amount was slightly reduced to 15.65%. It is reminded that these two equilibrium temperatures correspond to (H-Lw-G) equilibrium conditions, as mentioned in the Section 3.1.2. In the experiment with MR21.66, the remaining CO2 amount in the gas phase at -0.32oC, reached to 27.41% of its initial amount at the feed, even though the initial gas pressures in these two runs were almost equal (31.4 and 31.04 bara respectively, see Table 1). The difference in the remaining CO2 amount in the gas phase between these two experiments can be attributed to the assumption of the growth of an impermeable hydrate layer on the gas/liquid interface and the subsequent establishment of a steady-state condition in the experiment with MR21.66, which prevented the CO2-H2O system from reaching the actual (H-Lw-G) phase equilibrium.

3.5.2.3. Calculation of CO2 Dissolution in Water Using the Peng-Robinson EoS

The CO2 solubility values that have been calculated using the approaches described above (i.e. H21 vs. T fitting equation, CPA Infochem model, and P-R EoS), as a function of temperature, are presented in Figure 7. The presented calculation results refer to both PVT configurations. In almost all cases, the CO2 solubilities calculated by using the P-R EoS clearly diverge from the results obtained from the other two calculation approaches especially under the conditions at which formation of hydrates occurred.
Furthermore, the results reveal a decline in CO2 solubility in the presence of the hydrate phase, as the temperature decreased. This reduction was more pronounced in the experiment with MR21.37 that exhibited the greater supercooling degree (minimum xCO2,aq ~ 0.015) and the most sharp and pronounced pressure drop. The decline of the CO2 mole fraction in the aqueous phase is a result of enclathration of large amounts of gas at the expense of the gas dissolved in the super-saturated aqueous liquid. Decrease of CO2 solubility with decreasing temperature over the hydrate formation region, has been reported previously by other research groups [24,67].

4. Conclusions

In this work the phase behavior, and gas hydrates formation and dissociation conditions of CO2-H2O systems have been experimentally investigated with respect to (i) the applied temperature cycling procedures and (iii) characteristics of the experimental PVT configuration. The operational procedures involved (i) the incremental temperature cycling mode and (ii) the continuous temperature cycling process, in the framework of the Isochoric Pressure Search method. The (P, T) conditions required to reach the (H-Lw-G) equilibrium depend on the temperature cycling mode applied as well as the design and technical characteristics of the reactor cell. The incremental temperature cycling mode imposes longer induction times and higher subcooling when the experiments are performed using the agitated tank reactor, compared to the magnetically stirred autoclave.
Qualitative considerations on the subcooling, induction time, and thermal stability of the developed hydrate phases allowed to gain an insight on the effect of the technical parameters of the two PVT setups (i.e. agitation method, internal design, mass and heat transfer coefficients, shear, perforated plates), on the growth rate thickness, and porosity of the hydrate layer on the gas/liquid interface. A thin permeable hydrate layer will allow for the system to reach actual (H-Lw-G) equilibrium whereas a thick dense layer with low porosity may act as an impermeable barrier separating the two fluid phases from each other. As a result, the system may eventually reach a steady state where the gas phase is isolated from the aqueous/hydrate phase, which is different from the actual (H-Lw-G) equilibrium.
In what concerns the continuous temperature cycling mode, the faster applied cooling rate significantly promoted the CO2 hydrates growth. Also, the usage of perforated plates reduced the induction time of the nucleation phase and facilitated the formation and growth of hydrate crystals by providing an additional large number of nucleation sites on their surface. Moreover, the obtained heating curves joint the cooling curves at temperatures that ranged between 8.15-8.45oC, similar to the cases of all runs performed by applying the SW operational mode which exhibited CO2 hydrae formation, regardless of the employed PVT configuration. On the other hand, the profile of the heating curves in the CC operational mode was also similar to the heating curve of the run with M21.37 that was performed in the same autoclave, i.e. the stirred tank reactor, indicating that usage of this type of hydrate formation set-up can only result in formation of a thin hydrate layer which is not thermally and mechanically stable, in opposite to the dense hydrate layer that is grown when the magnetically agitated PVT autoclave with moderate mass transfer is used.
The simulation results corroborated the experimental findings in what concerns the hydrate decomposition point, the metastability of the studied systems, and their ability to undergo the phase transformation that leads to CO2 hydrates formation. CO2 solubility at the equilibrium (P, T) conditions has been resolved using two calculation approaches: (i) calculation of the Henry coefficient for the experimental temperatures by combining a fitting equation, which was derived from an extended data base of experimental measurements of CO2 solubility in water, with the Peng-Robinson EoS-based calculation of the CO2 fugacity at the equilibrium (P, T) conditions, and (ii) the CPA Infochem model of a commercial simulation software. The results revealed a continuous decline in CO2 solubility with decreasing temperature in the presence of CO2 hydrates while the opposite trend was found in the two-phase (Lw-G) regime. Thus, the contribution of each one of the CO2 sources (i.e. the aqueous phase and the gas phase) on CO2 hydrates formation was assessed.

Supplementary Materials

The following supporting information can be downloaded at the website of this paper posted on Preprints.org, Figure S1: (a) Normalized Pressure vs. Temperature plots for the CO2-H2O binary system including the cooling and heating cycles, for the H2O:CO2 mole ratios 20.48-21.91, (b) First derivative of pressure with respect to temperature vs. Temperature curves, for the H2O:CO2 mole ratios of 20.48-21.9. Dotted lines have been drawn to guide the eye.; Figure S2: Evolution of (P, T) conditions for the experiments with H2O:CO2 mole ratios of (i) 20.09, (ii) 20.28, and (iii) 20.21 in the CM mode, (a) Pressure vs. Time, (b) Temperature vs. Time.; Figure S3: (P, T) phase diagrams for the CO2-H2O binary system in the continuous temperature cycling mode, for the H2O:CO2 mole ratios (a) 20.09, (b) 20.09 (repetition with an initial equilibration step at room temperature for 48 hours).; Figure S4: H-Lw-G and H-Lw-Lg equilibrium curves for the CO2-H2O system, for H2O:CO2 mole ratios of 20:1, 30:1, and 40:1, calculated by using the CPA Infochem model.; Figure S5: (a), (b) Density values of the aqueous phase calculated using the CPA Infochem model, and density data of pure water at the respective (P, T) conditions of the experimental runs, (c) Experimental density of pure water at 1 bar and 30 bar as a function of temperature. In all diagrams (a)-(c) the density values of water have been derived from the NIST Thermophysical Properties of Fluid Systems, https://webbook.nist.gov/chemistry/fluid/.; Figure S6: (a) Normalized density (%), and (b) normalized volume (%) of the aqueous phase, calculated by using the CPA Infochem model, as a function of the equilibrium temperature (reference temperature = 13.7-13.8oC).; Figure S7: Change of volume (%) of the aqueous phase, calculated by using the CPA Infochem model, as a function of the equilibrium temperature.; Figure S8: Mean absolute percentage deviations (MAPD) between the CPA Infochem model and fitting equation results.

Author Contributions

For research articles with several authors, a short paragraph specifying their individual contributions must be provided. Conceptualization, N.P.; methodology, N.P. and A.L; software, C.T. and A.L.; validation, N.P.; formal analysis, C.T. and A.L.; investigation, C.T. and S.S.; resources, N.P.; data curation, C.T. and S.S.; writing—original draft preparation, A.L.; writing—review and editing, N.P., R.G. and E.S.; visualization, I.Y. and S.B.; supervision, N.P.; project administration, E.S. and S.B.; funding acquisition, E.S. and S.B. All authors have read and agreed to the published version of the manuscript.

Funding

The authors acknowledge co-financing by the European Research Executive Agency (REA) under grant agreement No 101079246 (“TWINN2SET” project).

Data Availability Statement

The original contributions presented in the study are included in the article, further inquiries can be directed to the corresponding authors.

Acknowledgments

The authors would like to acknowledge Senior Researcher Dr. Athanasios Stubos, Head of the Environmental Research Laboratory, Director of the INRASTES Institute and Vice President of NCSR “Demokritos”, Athens-Greece, for kindly providing the large PVT apparatus that was used in this work. The authors would also like to acknowledge Professor Bahman Tohidi, of Heriot-Watt University, for his kind reviewing and commenting on their submitted research manuscript.

Conflicts of Interest

The authors declare no conflict of interest.

References

  1. Li, X.S.; Xu, C.G.; Zhang, Y. Ruan, X. K.; Li, G.; Wang, Y. Investigation into gas production from natural gas hydrate: A review. Appl. Energy 2016, 172, 286-322. [CrossRef]
  2. Chapoy, A.; Burgass, R.; Tohidi, B.; Alsiyabi, I. Hydrate and phase behavior modeling in CO2-rich pipelines. J. Chem. Eng. Data 2015, 60, 447-453. [CrossRef]
  3. Liu, W.; Hu, J.; Sun, F.; Sun, Z.; Li, X. A numerical study on the non-isothermal flow characteristics and hydrate risk of CO2 in buried transmission pipelines under the gas-phase transportation mode. Greenhouse Gas Sci. Technol. 2020, 10, 249-264. [CrossRef]
  4. Liu, B.; Liu, X.; Lu, C.; Godbole, A.; Michal, G.; Tieu, A.K. Multi-phase decompression modeling of CO2 pipelines. Greenhouse Gas Sci. Technol. 2017, 7, 665-679. [CrossRef]
  5. Wang, Z.; Zhao. Y.; Zhang, J.; Pan, S.; Yu, J.; Sun, B. Flow assurance during deepwater gas well testing: hydrate blockage prediction and prevention. J. Pet. Sci. Eng. 2018, 163, 211-216. [CrossRef]
  6. Xu, C.-G.; Li, X.-S. Research progress of hydrate-based CO2 separation and capture from gas mixtures. RSC Adv. 2014, 4, 18301-18316. [CrossRef]
  7. Li, A.; Wang, J.; Bao, B. High-efficiency CO2 capture and separation based on hydrate technology: A review. Greenhouse Gas Sci Technol. 2019, 9, 175-193. [CrossRef]
  8. Lee, Y.; Kim, H.; Lee, W.; Kang, D.W.; Lee, J.W.; Ahn, Y.-H. Thermodynamic and kinetic properties of CO2 hydrates and their applications in CO2 capture and separation. J. Environ. Chem. Eng. 2023, 11, 110933. [CrossRef]
  9. Cheng, Z.; Li, S.; Liu, Y.; Zhang, Y.; Ling, Z.; Yang, M.; Jiang, L.; Song, Y. Post-combustion CO2 capture and separation in flue gas based on hydrate technology: A review. Renew. Sust. Energ. Rev. 2022, 154, 111806. [CrossRef]
  10. Luling, L.; Shuanshi, F.; Qiuxiong, C.; Guang, Y.; Jinzhou, Z.; Na, W.; Yonggang, W. Experimental and modeling phase equilibria of gas hydrate systems for post-combustion CO2 capture. J. Taiwan Inst. Chem. Eng. 2019, 96, 35-44. [CrossRef]
  11. Babu, P.; Linga, P.; Kumar, R.; Englezos, P. A review of the hydrate based gas separation (HBGS) process for carbon dioxide pre-combustion capture. Energy 2015, 85, 261-279. [CrossRef]
  12. Gholinezhad, J.; Chapoy, A.; Tohidi, B. Separation and capture of carbon dioxide from CO2/H2 syngas mixture using semi-clathrate hydrates. Chem. Eng. Res. Des. 2011, 89, 1747-1751. [CrossRef]
  13. Hassan, M.H.A.; Sher, F.; Fareed, B.; Ali, U.; Zafar, A.; Bilal, M.; Iqbal, H.M.N. Sustainable hydrates for enhanced carbon dioxide capture from an integrated gasification combined cycle in a fixed bed reactor. Ind. Eng. Chem. Res. 2021, 60, 11346-11356. [CrossRef]
  14. Zheng, J.; Chong, Z.R.; M. Qureshi, M.F.; Linga, P. Carbon dioxide sequestration via gas hydrates: A potential pathway toward decarbonization. Energy Fuels 2020, 34, 10529-10546. [CrossRef]
  15. Tohidi, B.; Yang, J. Salehabadi, M.; Anderson, R.; Chapoy, A. CO2 hydrates could provide secondary safety factor in subsurface sequestration of CO2. Environ. Sci. Technol. 2010, 44, 1509-1514. [CrossRef]
  16. Teng, Y.; Zhang, D. Long-term viability of carbon sequestration in deep-sea sediments. Sci. Adv. 2018, 4, 1-8. [CrossRef]
  17. Liu, Y.; Wang, P.; Yang, M.; Zhao, Y.; Zhao, J.; Song, Y. CO2 sequestration in depleted methane hydrate sandy reservoirs. J. Nat. Gas Sci. Eng. 2018, 49, 428-434. [CrossRef]
  18. Koh, D.-Y.; Kang, H.; Lee, J.-W.; Park, Y.; Kim, S.-J.; Lee, J.; Lee, J.Y.; Lee, H. Energy-efficient natural gas hydrate production using gas exchange. Appl. Energy 2016, 162, 114-130. [CrossRef]
  19. Wilson, I.; Saini, S.; Sreenivasan, H.; Sahu, C.; Krishna, S.; Gupta, P. Review and perspectives of energy-efficient methane production from natural gas hydrate reservoirs using carbon dioxide exchange technology. Energy Fuels 2023, 37, 9841-9872. [CrossRef]
  20. Lim, J.; Choi, W.; Mok, J.; Seo, Y. Kinetic CO2 selectivity in clathrate-based CO2 capture for upgrading CO2-rich natural gas and biogas. Chem. Eng. J. 2019, 369, 686-693. [CrossRef]
  21. Beatrice Castellani, B.; Morini, E.; Bonamente, E.; Rossi, F. Experimental investigation and energy considerations on hydrate-based biogas upgrading with CO2 valorization. Biomass Bioenergy 2017, 105, 364-372. [CrossRef]
  22. Moghaddam, E.A.; Larsolle, A.; Tidåker, P.; Nordberg, A. Gas hydrates as a means for biogas and biomethane distribution. Front. Energy Res. 2021, 9, 568879. [CrossRef]
  23. Adisasmito, S.; Frank III, R.J.; Sloan Jr. E.D. Hydrates of carbon dioxide and methane mixtures. J. Chem. Eng, Data 1991, 36, 68-71. [CrossRef]
  24. Servio, P.; Englezos, P. Effect of temperature and pressure on the solubility of carbon dioxide in water in the presence of gas hydrate. Fluid Phase Equilib. 2001, 190, 127-134. [CrossRef]
  25. Martinez C.; Sandoval, J.F.; Ortiz, N.; Ovalle, S.; Beltran, J.G. Mechanisms, growth rates, and morphologies of gas hydrates of carbon dioxide, methane, and their mixtures. Methane 2022, 1, 2-23. [CrossRef]
  26. Ferrari, P.F.; Guembaroski, A.Z.; Neto, M.A.M.; Morales, R.E.M.; Sum, A.K. Experimental measurements and modelling of carbon dioxide hydrate phase equilibrium with and without ethanol. Fluid Phase Equilib. 2016, 413, 176-183. [CrossRef]
  27. Tariq, M.; Soromenho, M.R.C.; Rebelo, L.P.N.; Esperança, J.M.S.S. Insights into CO2 hydrates formation and dissociation at isochoric conditions using a rocking cell apparatus. Chem. Eng. Sci. 2022, 249, 117319. [CrossRef]
  28. Sloan, E.D.; Koh, C.A. Clathrate hydrates of natural gases. 3rd ed.; CRC Press, Taylor & Francis Group: Boca Raton, FL, 2008, pp. 113-188 and 189-256.
  29. Zou, X.; Zi, M.; Yang, C.; Liu, K.; Zhao, C.; Chen, D. High-throughput sapphire reaction system: A new experimental apparatus to evaluate hydrate kinetic inhibitors with high efficiency. J. Nat. Gas Sci. Eng. 2022, 104, 104687. [CrossRef]
  30. Freer, E.M.; Selim, M.S.; Sloan Jr., E.D. Methane hydrate film growth kinetics. Fluid Phase Equilib. 2001, 185, 65-75. [CrossRef]
  31. Saito, K.; Kishimoto, M.; Tanaka, R.; Ohmura, R. Crystal growth of clathrate hydrate at the interface between hydrocarbon gas mixture and liquid water. Cryst. Growth Des. 2010, 11, 295-301. [CrossRef]
  32. Servio, P.; Englezos, P. Morphology of methane and carbon dioxide hydrates formed from water droplets. AIChE J. 2003, 49, 269-276. [CrossRef]
  33. Ohmura, R.; Shigetomi, T.; Mori, Y.H. Formation, growth and dissociation of clathrate hydrate crystals in liquid water in contact with a hydrophobic hydrate-forming liquid. J. Cryst. Growth 1999, 196, 164-173. [CrossRef]
  34. Ueno, H.; Akiba, H.; Akatsu, S.; Ohmura, R. Crystal growth of clathrate hydrates formed with methane + carbon dioxide mixed gas at the gas/liquid interface and in liquid water. New J. Chem. 2015, 39, 8254-8262. [CrossRef]
  35. Pivezhani, F.; Roosta, H.; Dashti, A.; Mazloumi, S.H. Investigation of CO2 hydrate formation conditions for determining the optimum CO2 storage rate and energy: Modeling and experimental study. Energy 2016, 113, 215-226. [CrossRef]
  36. Hao, W.; Wang, J.; Fan, S.; Hao, W. Study on methane hydration process in a semi-continuous stirred tank reactor. Energy Convers. Manag. 2007, 48, 954-960. [CrossRef]
  37. Filarsky, F.; Hagelstein, M.; Schultz, H.J. Influence of different stirring setups on mass transport, gas hydrate formation, and scale transfer concepts for technical gas hydrate applications. Applied Research 2022, 2, 1-16. [CrossRef]
  38. Englezos, P.; Kalogerakis, N.; Dholobhai, P.D.; Bishnoi, P.R. Kinetics of formation of methane and ethane gas hydrates. Chem. Eng. Sci. 1987, 42, 2647-2658. [CrossRef]
  39. Kim, H.C.; Bishnoi, P.R.; Heidemann, R.A.; Rizvi, S.S.H. Kinetics of methane hydrate decomposition. Chem. Eng. Sci. 1987, 42, 1645-1653. [CrossRef]
  40. Windmeier, C.; Oellrich, L. Theoretical study of gas hydrate decomposition kinetics-model development. J. Phys. Chem. A 2013, 117, 10151-10161. [CrossRef]
  41. Windmeier, C.; Oellrich, L. Theoretical study of gas hydrate decomposition kinetics-model predictions, J. Phys. Chem. A 2013, 117, 12184-12195. [CrossRef]
  42. Clarke, M.; Bishnoi, P.R. Determination of the intrinsic rate of ethane gas hydrate decomposition. Chem. Eng. Sci. 2000, 55, 4869-4883. [CrossRef]
  43. Sean, W.Y.; Sato, T.; Yamasaki, A.; Kiyono, F. CFD and experimental study on methane hydrate dissociation Part I. Dissociation under water flow. AIChE J. 2007, 53, 262-274. [CrossRef]
  44. Hong, H.; Pooladi-Darvish, M.; Bishnoi, P.R. Analytical modelling of gas production from hydrates in porous media. J. Can. Pet. Technol. 2003, 42, 45–56. [CrossRef]
  45. Davies, S.R.; Selim, M.S.; Sloan, E.D.; Bollavaram, P.; Peters, D.J. Hydrate plug dissociation. AIChE J. 2006, 52, 4016-4027. [CrossRef]
  46. Chen, G.-J.; Guo, T.-M. Thermodynamic modeling of hydrate formation based on new concepts. Fluid Phase Equilib. 1996, 122, 43-65. [CrossRef]
  47. You, C.; Chen, Z.; Li, X.; Zhao, Q.; Feng, Y.; Wang, C. Benedict–Webb–Rubin–Starling Equation of State + hydrate thermodynamic theories: An enhanced prediction method for CO2 solubility and CO2 hydrate phase equilibrium in pure water/NaCl aqueous solution system. Energies 2024, 17, 2356. [CrossRef]
  48. Kontogeorgis, G.M.; Voutsas, E.C.; Yakoumis, I.V.; Tassios, D.P. An equation of state for associating fluids. Ind. Eng. Chem. Res. 1996, 35, 4310-4318. [CrossRef]
  49. Ballard, A.; Sloan, E. The next generation of hydrate prediction: an overview. J. Supramol. Chem. 2002, 2 385-392. [CrossRef]
  50. Klauda,J.B.; Sandler, S.I. Phase behavior of clathrate hydrates: a model for single and multiple gas component hydrates. Chem. Eng. Sci. 2003, 58, 27-41. [CrossRef]
  51. Kastanidis, P.; Romanos, G.E.; Michalis, V.K.; Economou, I.G.; Stubos, A.K.; Tsimpanogiannis, I.N. Development of a novel experimental apparatus for hydrate equilibrium measurements. Fluid Phase Equilib. 2016, 424, 152-161. [CrossRef]
  52. Maekawa, T. Equilibrium conditions for clathrate hydrates formed from carbon dioxide or ethane in the presence of aqueous solutions of 1,4-dioxane and 1,3-dioxolane. Fluid Phase Equilib. 2014, 384, 95-99. [CrossRef]
  53. Sun, Q.; Kang, Y.T. Review on CO2 hydrate formation/dissociation and its cold energy application. Renewable and Sustainable Energy Reviews 2016, 62, 478-494. [CrossRef]
  54. Mali, G.A.; Chapoy, A.; Tohidi, B. Investigation into the effect of subcooling on the kinetics of hydrate formation. J. Chem. Thermodynamics 2018, 117, 91-96. [CrossRef]
  55. Canale, V.; Fontana, A.; Siani, G.; Di Profio, P. Hydrate induction time with temperature steps: A novel method for the determination of kinetic parameters. Energy Fuels 2019, 33, 6113-6118. [CrossRef]
  56. Uchida, T.; Ebinuma, T.; Kawabata, J.; Narita, H. Microscopic observations of formation processes of clathrate-hydrate films at an interface between water and carbon dioxide. J. Cryst. Growth, 1999, 204, 348-356. [CrossRef]
  57. Uchida, T.; Ikeda, I.Y.; Takeya, S.; Ebinuma, T.; Nagao, J.; Narita, H. CO2 hydrate film formation at the boundary between CO2 and water: effects of temperature, pressure and additives on the formation rate. J. Cryst. Growth 2002, 237–239, 383-387. [CrossRef]
  58. Natarajan, V.; Bishnoi, P.R.; Kalogerakis, N. Induction phenomena in gas hydrate nucleation. Chem. Eng. Sci. 1994, 49, 2075-2087. [CrossRef]
  59. Mori, Y.H. Estimating the thickness of hydrate films from their lateral growth rates: application of a simplified heat transfer model. J. Cryst. Growth 2001, 223, 206-212. [CrossRef]
  60. Mori, Y.H.; Mochizuki, T. Mass transport across clathrate hydrate films – a capillary permeation model. Chem. Eng. Sci. 1997, 52, 3613-3616. [CrossRef]
  61. Sugaya, M., Mori, Y.H. Behavior of clathrate hydrate formation at the boundary of liquid water and a fluorocarbon in liquid or vapor state. Chem. Eng. Sci. 1996, 51, 3505-3517. [CrossRef]
  62. Li, X.; Wang, C.; Li, Q.; Fan, Q.; Chen, G.; Sun, C. Study on the growth kinetics and morphology of methane hydrate film in a porous glass microfluidic device. Energies 2021, 14, 6814. [CrossRef]
  63. Mori, Y.H.; Mochizuki, T. Modeling of simultaneous heat and mass transfer to/from and across a hydrate film. Ann. New York Acad. Sci. 2000, 912, 633-641. [CrossRef]
  64. Li, S.-L.; Sun, C.-Y.; Feng, X.-J.; Li, F.-G.; Chen, L.-T.; Chen, G.-J. Initial thickness measurements and insights into crystal growth of methane hydrate film. AIChE J. 2013, 59, 2145-2154. [CrossRef]
  65. Li, S.-L.; Sun, C.-Y.; Liu, B.; Li, Z.-Y.; Chen, G.-J.; Sum, A. K. New observations and insights into the morphology and growth kinetics of hydrate films. Sci. Rep. 2014, 4, 4129. [CrossRef]
  66. Carroll, J.J.; Slupsky, J.D.; Mather, A.E. The solubility of carbon dioxide in water at low pressure. J. Phys. Chem. Ref. Data 1991, 20, 1201-1209. [CrossRef]
  67. Saito, K.; Sum, A.K.; Ohmura, R. Correlation of hydrate-film growth rate at the guest/liquid-water interface to mass transfer resistance. Ind. Eng. Chem. Res. 2010, 49, 7102-7103. [CrossRef]
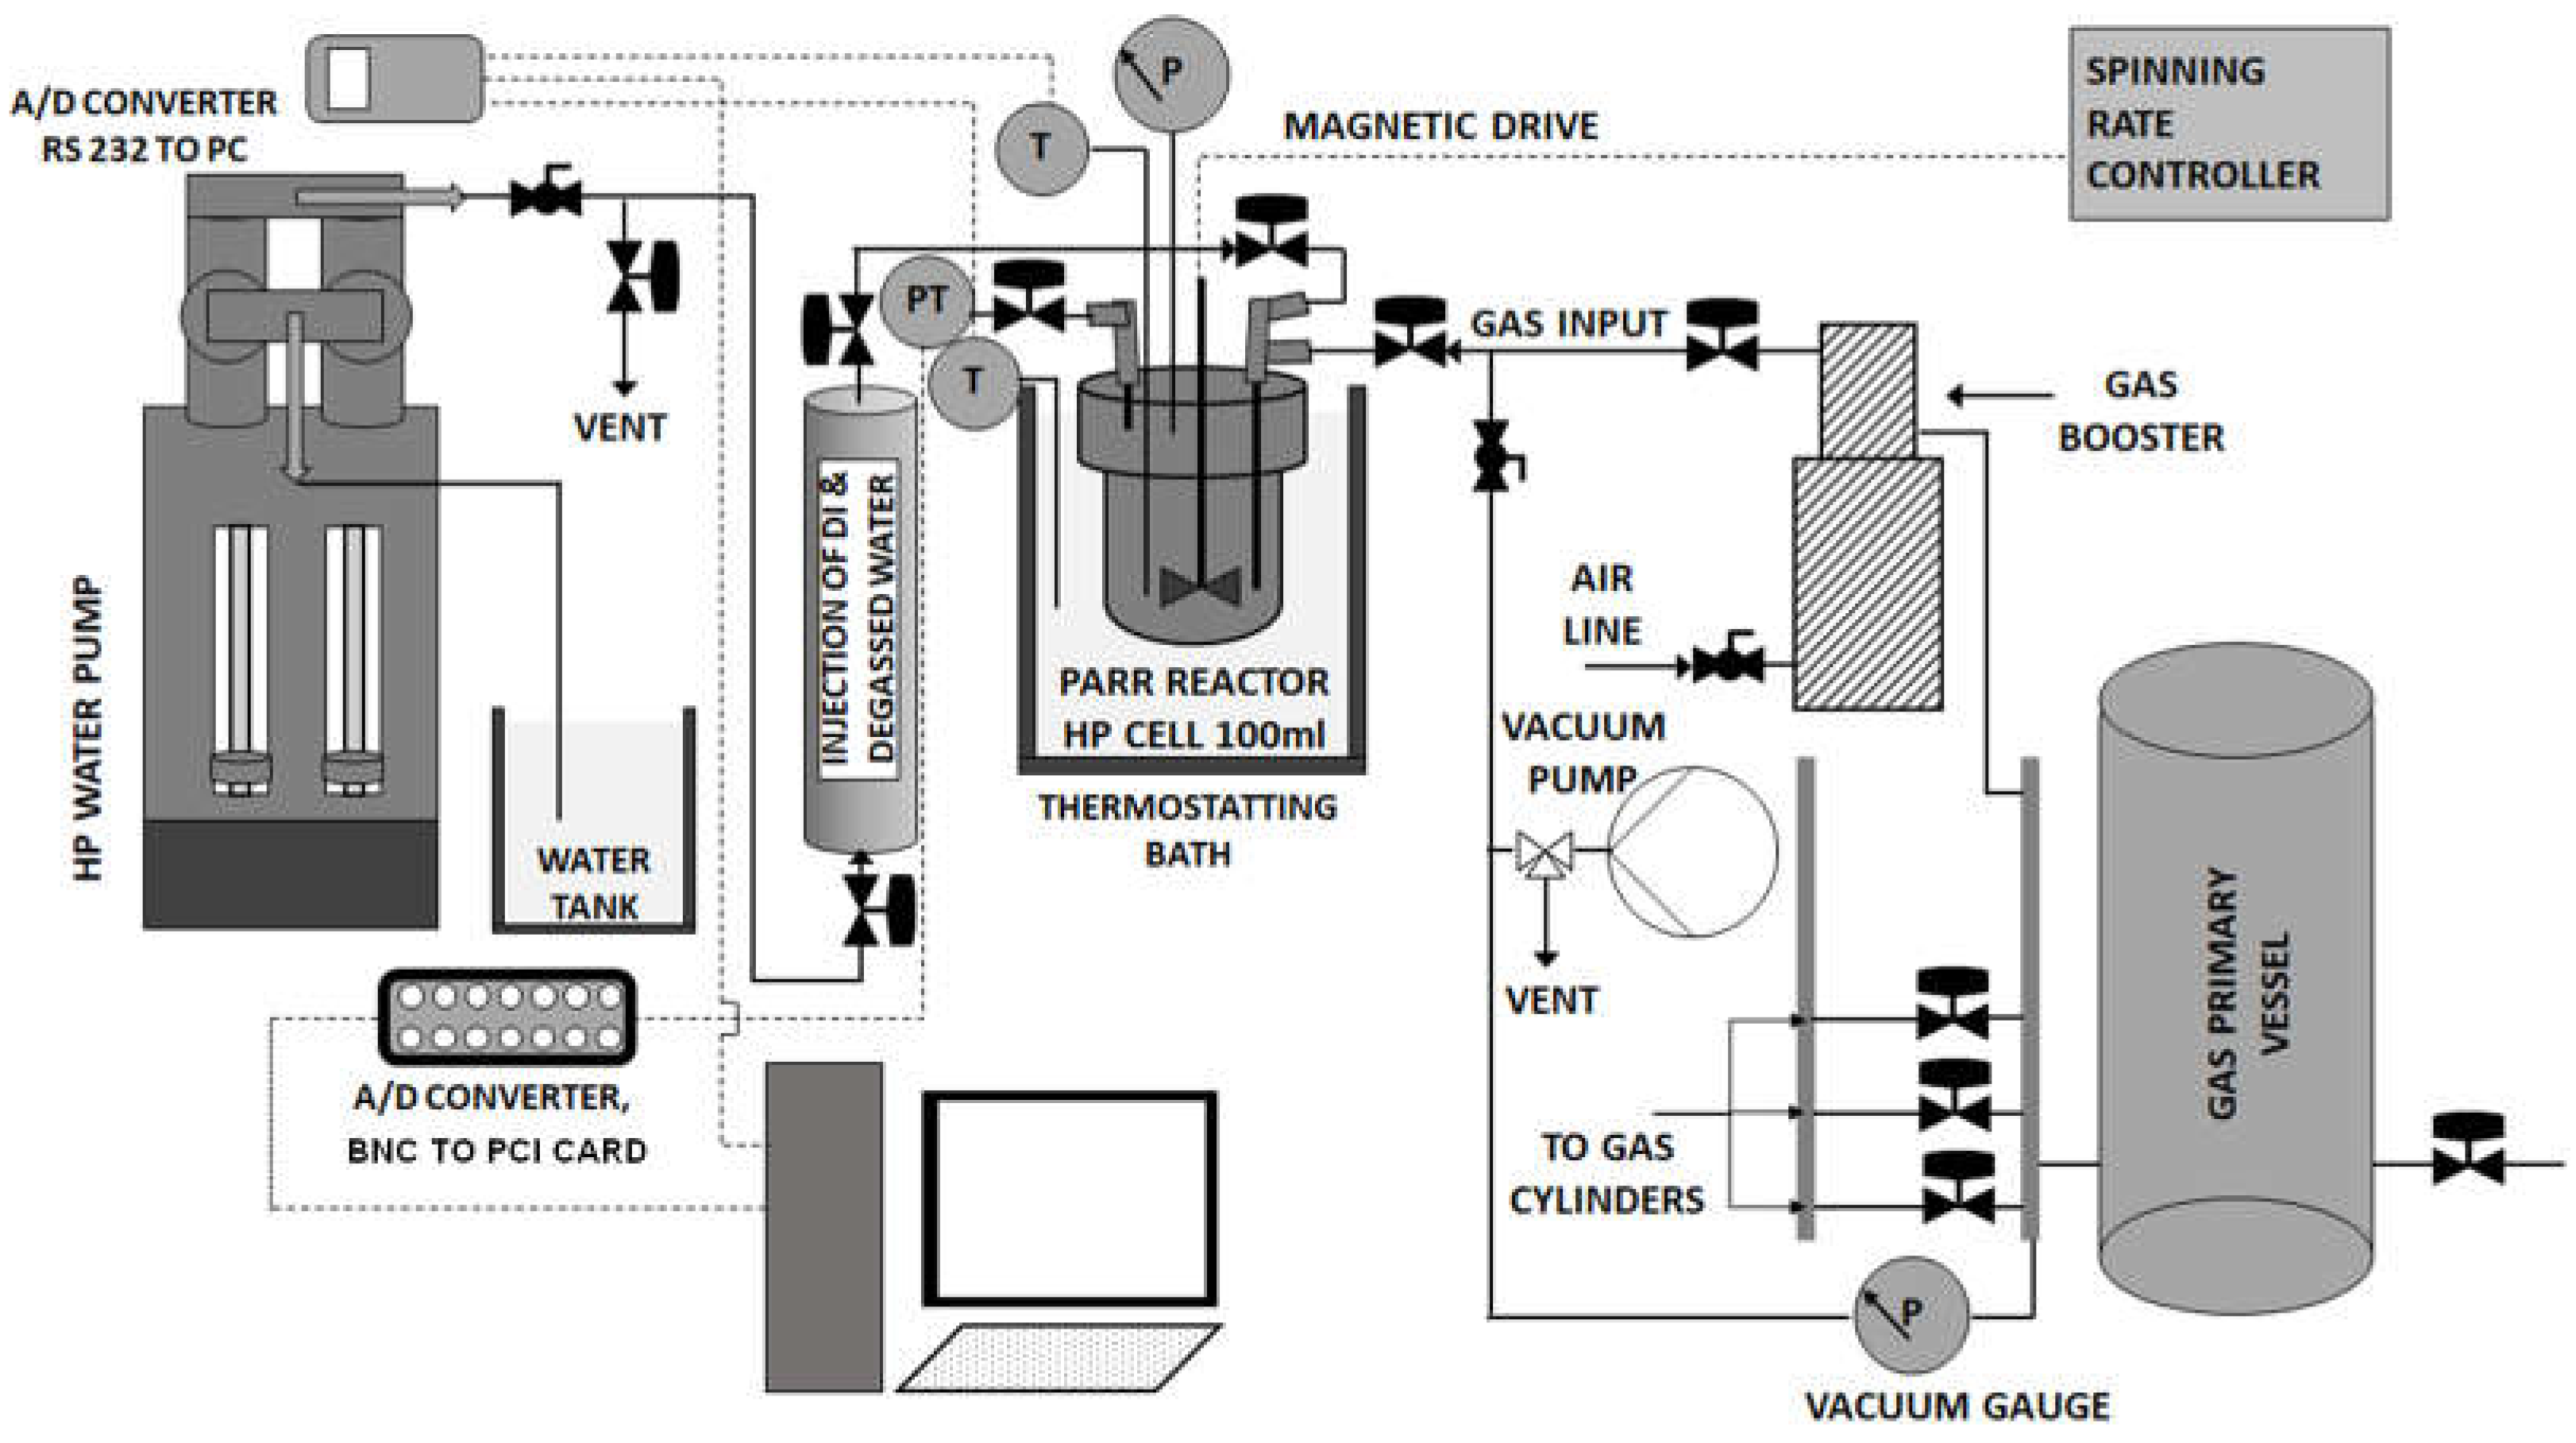
Figure 1. Schematic diagram of the PVT configuration incorporating a stirred tank reactor.
Preprints 117675 g001
Figure 2. (P, T) phase diagrams for the CO2-H2O binary system in the continuous temperature cycling mode, for the H2O:CO2 mole ratios (a) 20.09, (b) 20.28, and (c) 20.21.
Preprints 117675 g002
Figure 3. (P, T) phase diagrams for the CO2-H2O binary system including the cooling and heating stages, for the H2O:CO2 mole ratios (a) 20.48-21.67, (b) 21.66, 21.91. .
Preprints 117675 g003
Figure 4. Equilibrium (P, T) phase diagrams for the CO2-H2O system including the cooling and heating cycles, for the H2O:CO2 mole ratios (a) 20.48-21.67, tank reactor, (b) 21.66-21.91, large reactor.
Preprints 117675 g004
Figure 5. Juxtaposition of Experimental pressure vs. Temperature curves and calculated Incipient pressure vs. Temperature curves for the experiments with (a)-(d) H2O:CO2 mole ratios of 20.48, 21.37, 21.37 (repeated run), and 21.67; (e)-(f) H2O:CO2 mole ratios of 21.66, and 21.91. The experimental results (a)-(d) have been performed in the small reactor. The experimental result (e) and (f) have been performed in the large reactor configuration.
Preprints 117675 g005aPreprints 117675 g005b
Figure 6. CO2 solubility (in terms of CO2 mole fraction in the aqueous phase) vs. temperature for all applied H2O:CO2 mole ratios. The CO2 solubility has been calculated by applying (a) the fitting equation (1) coupled with the P-R EoS, (b) the CPA Infochem thermodynamic model.
Preprints 117675 g006
Figure 7. CO2 solubility vs. equilibrium temperature results calculated by applying the fitting equation (1), the CPA Infochem model, and the P-R EoS approaches, for the H2O:CO2 mole ratios of (a) 20.48, (b) 21.37, (c) 21.37 (repeat experiment), (d) 21.67, (e) 21.66, and (f) 21.91.
Preprints 117675 g007
Table 1. Feed conditions, water amounts, MRs, temperature cycling modes, temperature and duration of the first and second isothermal steps, stirring rates, and employed PVT configuration.
Experiment
No.
Feed
pressure
(bara)
Water
amount
(ml)
H2O:CO2
mole ratio
(MR)
(-)
Stirring
rate
(rpm)
Temperature/ duration of 1st isothermal step
(oC) / (hours)
Temperature/ duration of 2nd isothermal step
(oC) / (hours)
Temperature
alteration
mode/heating stage(1)
Inner total volume of the PVT cell
(ml)
1 32.09 60 20.48 400 13.90 / 12 0.25 / 24 SW / - 100
2 31.40 60 21.37 400 13.96 / 12 -0.25 / 24 SW / + 100
3 31.40(2) 60 21.37(2) 400 13.65 / 12 -0.90 / 24 SW / + 100
4 31.04 195 21.66 400 16.80 / 12 -0.32 / 24 SW / + 325
5 31.39 60 21.67 900 14.01 / 12 0.17 / 24 SW / + 100
6 31.36 195 21.91 400 13.82 / 12 2.17 / 24 SW / + 325
7 33.14 60 20.09 400 12 / 2 0.1 / 24 CM / + 100
8 32.99(3) 60 20.21(3) 400 12 / 2 0.1 / 24 CM / + 100
9 32.75 60 20.28 400 12 / 2 0.1 / 48 CM / + 100
10 32.99(4) 60 20.21(4) 400 12 / 2 0.1 / 24 CM / + 100
(1) SW: step-wise cooling-heating mode; CM: continuous cooling-heating mode; (+): heating stage included, (-): without heating stage. (2) Experiment No. 3 was a repetition of the experiment No. 2, which commenced once the system’s temperature at the heating stage reached to 13.65oC, without removal of the CO2 and H2O components from the cell. (3) In the experiments No. 8 and 9, perforated plates and spacers were fixed along the rotation axis of the magnetic drive. (4) Experiment No. 10 was a repetition of the experiment No. 8, which commenced once the system’s temperature at the heating stage reached room temperature, without removal of the CO2 and H2O components from the cell. An equilibration step of the system at room temperature for 48 hours was performed prior to the commencement of the cooling stage.
Disclaimer/Publisher’s Note: The statements, opinions and data contained in all publications are solely those of the individual author(s) and contributor(s) and not of MDPI and/or the editor(s). MDPI and/or the editor(s) disclaim responsibility for any injury to people or property resulting from any ideas, methods, instructions or products referred to in the content.
Copyright: This open access article is published under a Creative Commons CC BY 4.0 license, which permit the free download, distribution, and reuse, provided that the author and preprint are cited in any reuse.
Prerpints.org logo

Preprints.org is a free preprint server supported by MDPI in Basel, Switzerland.

Subscribe

© 2024 MDPI (Basel, Switzerland) unless otherwise stated