Submitted:
09 September 2024
Posted:
10 September 2024
You are already at the latest version
Abstract
Keywords:
1. Introduction
2. Materials and Methods
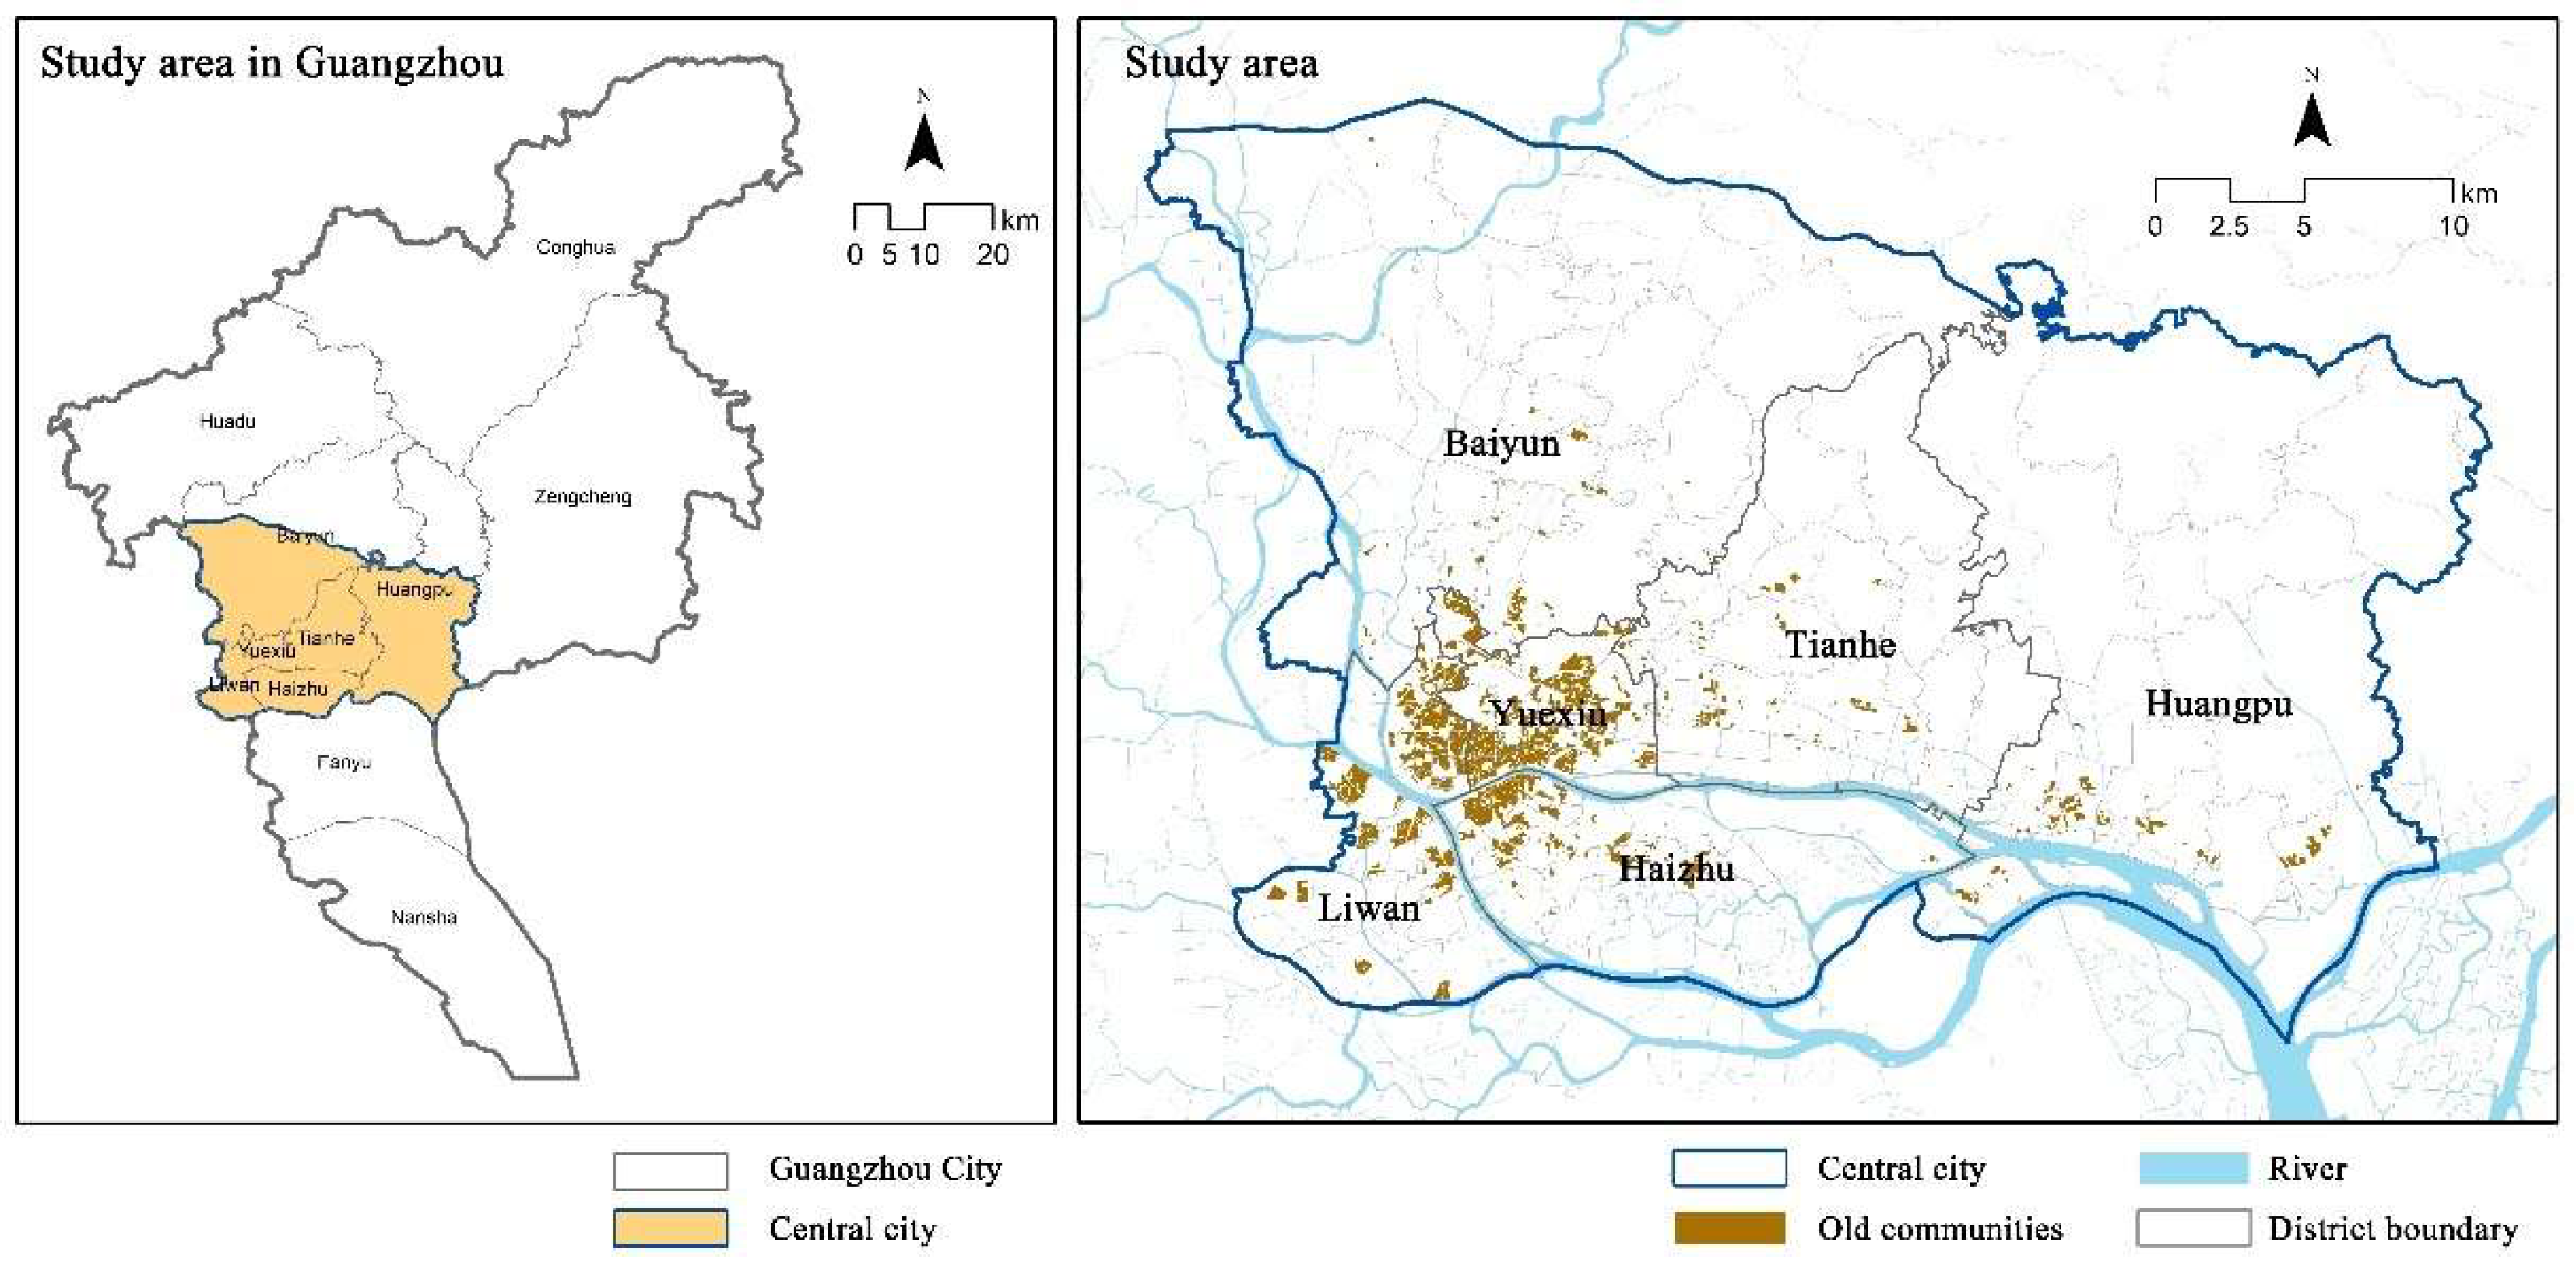
2.1. Study Area
2.2. Analytical Framework
2.2.1. Object Definition: Spatial Assets in Old Communities
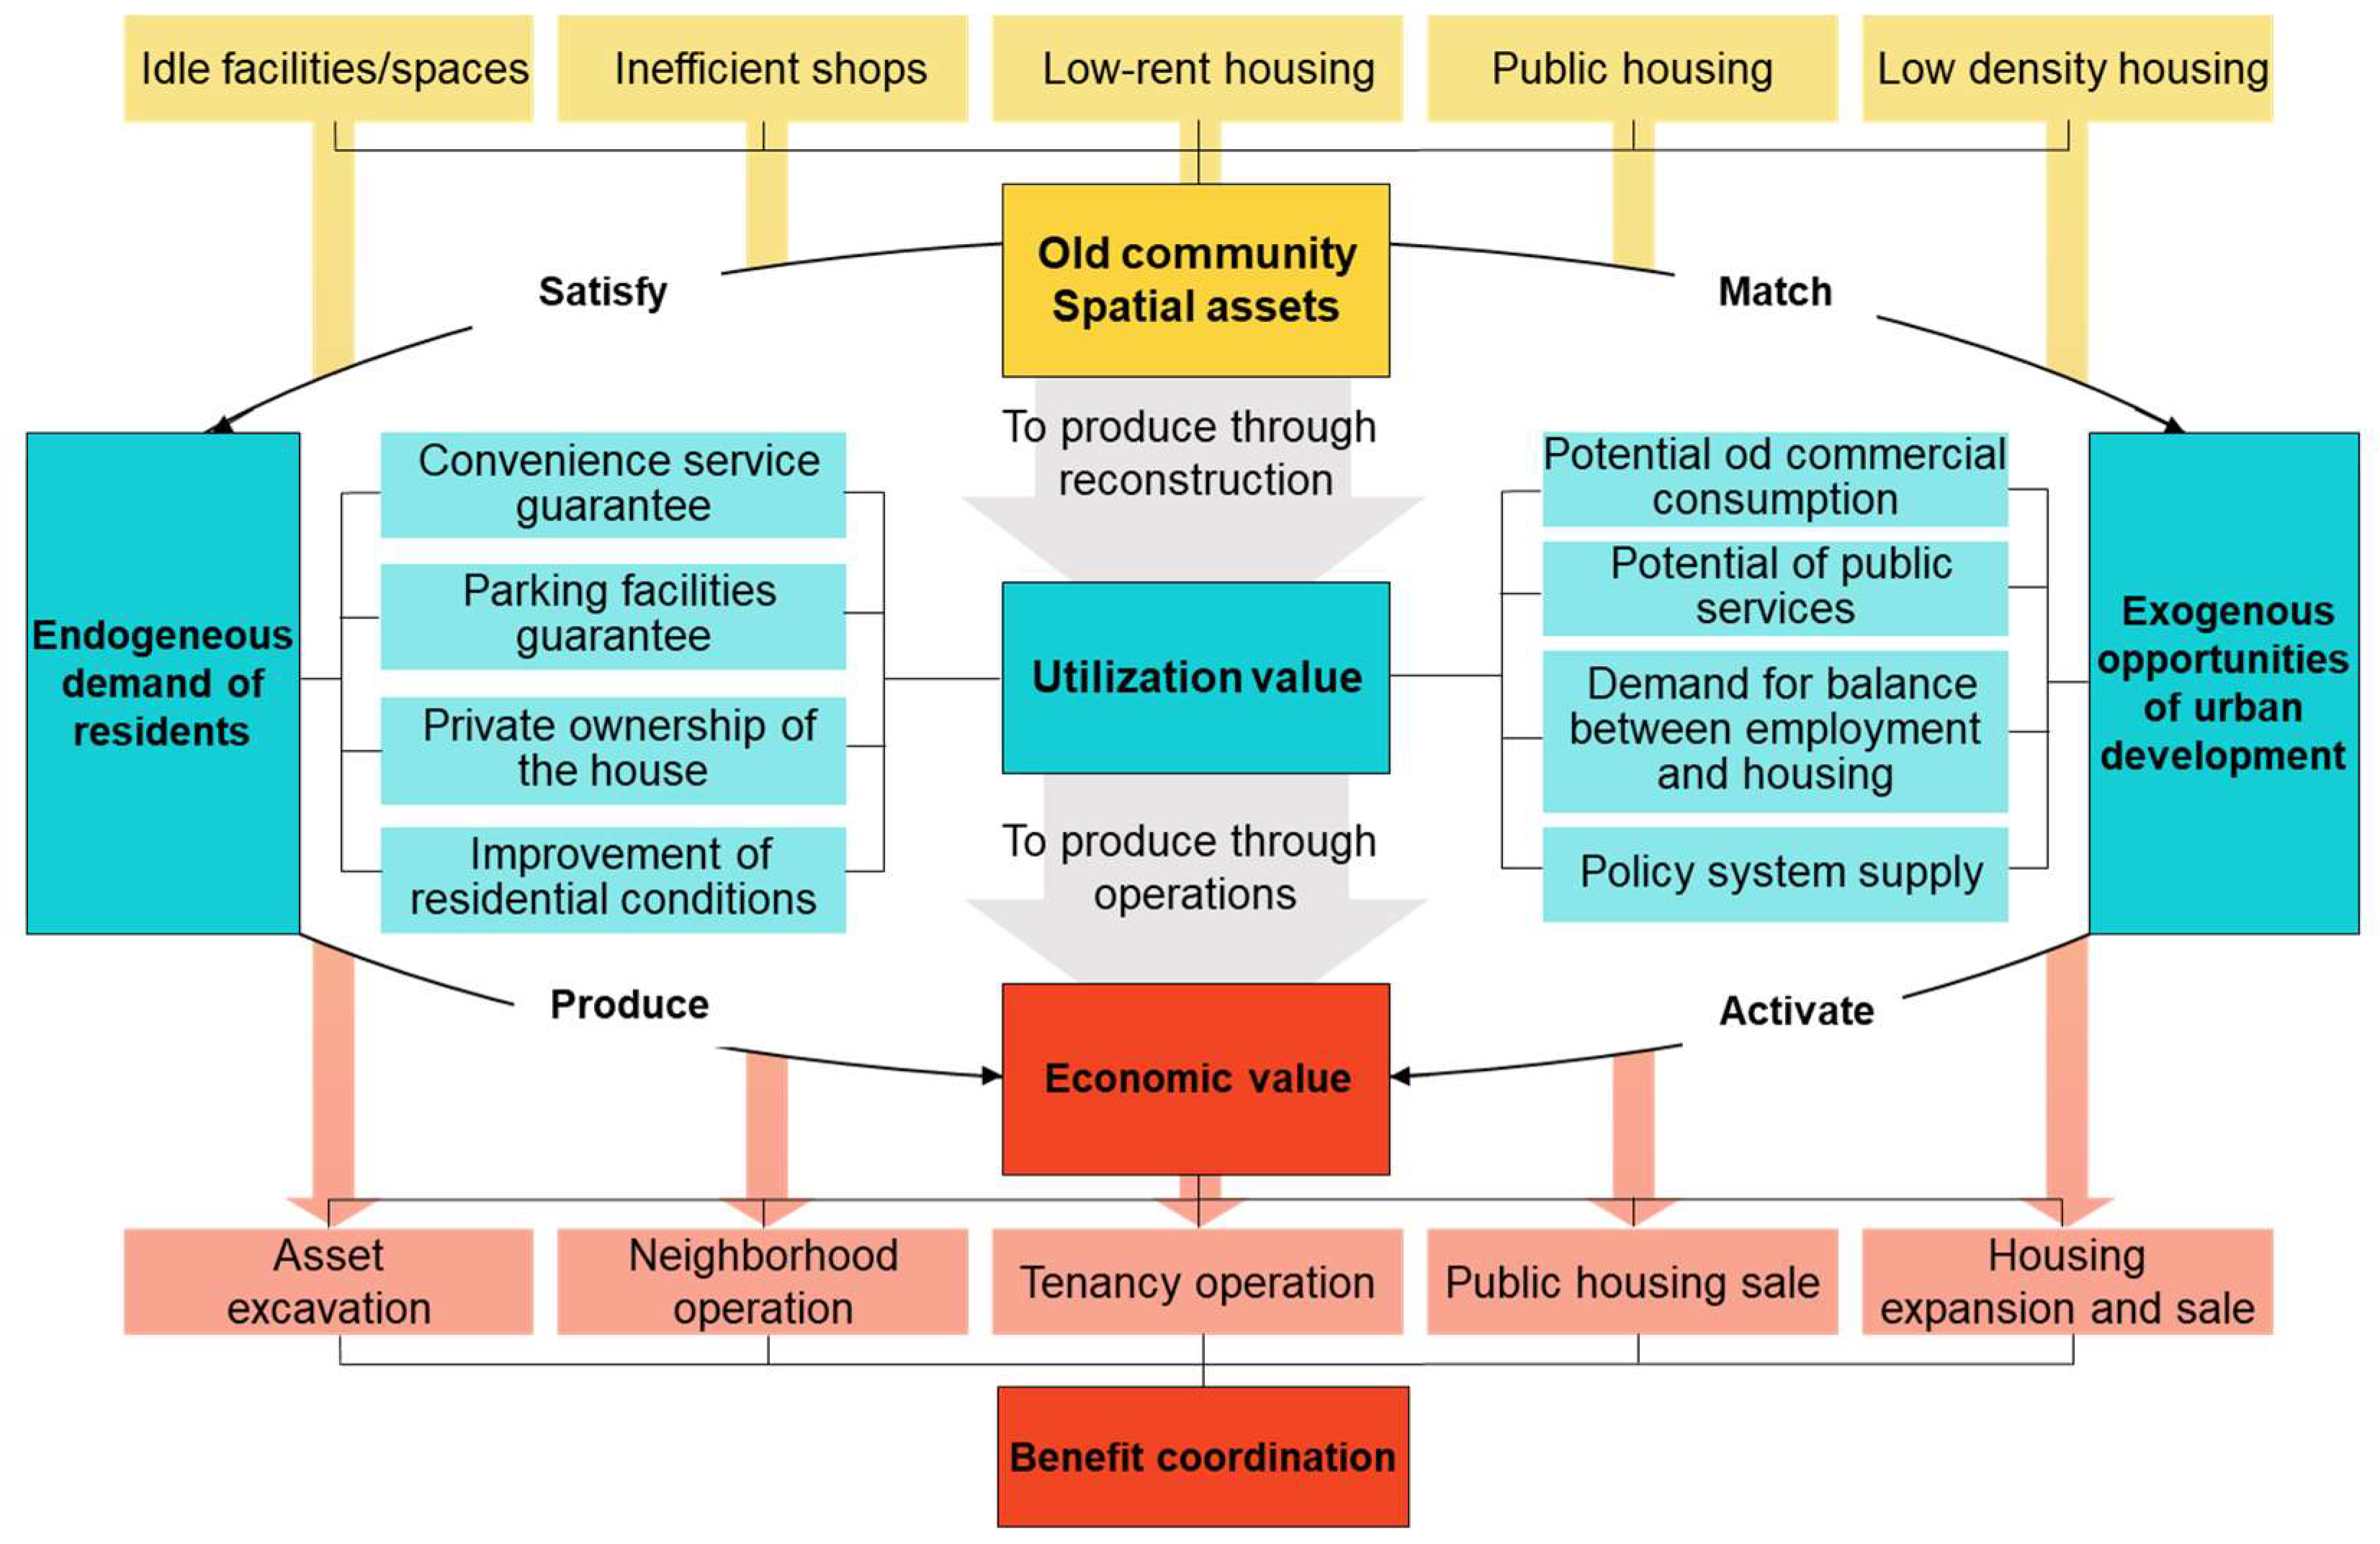
2.2.2. Dynamic logic: Leveraging "Endogenous Demand" and "Exogenous Opportunities" to Activate Spatial Asset Value
2.2.3. Strategic Pathways: Five Approaches to Value Extraction and Coordinated Utilization of Spatial Assets in Old Communities
2.3. Data Acquisition and Processing
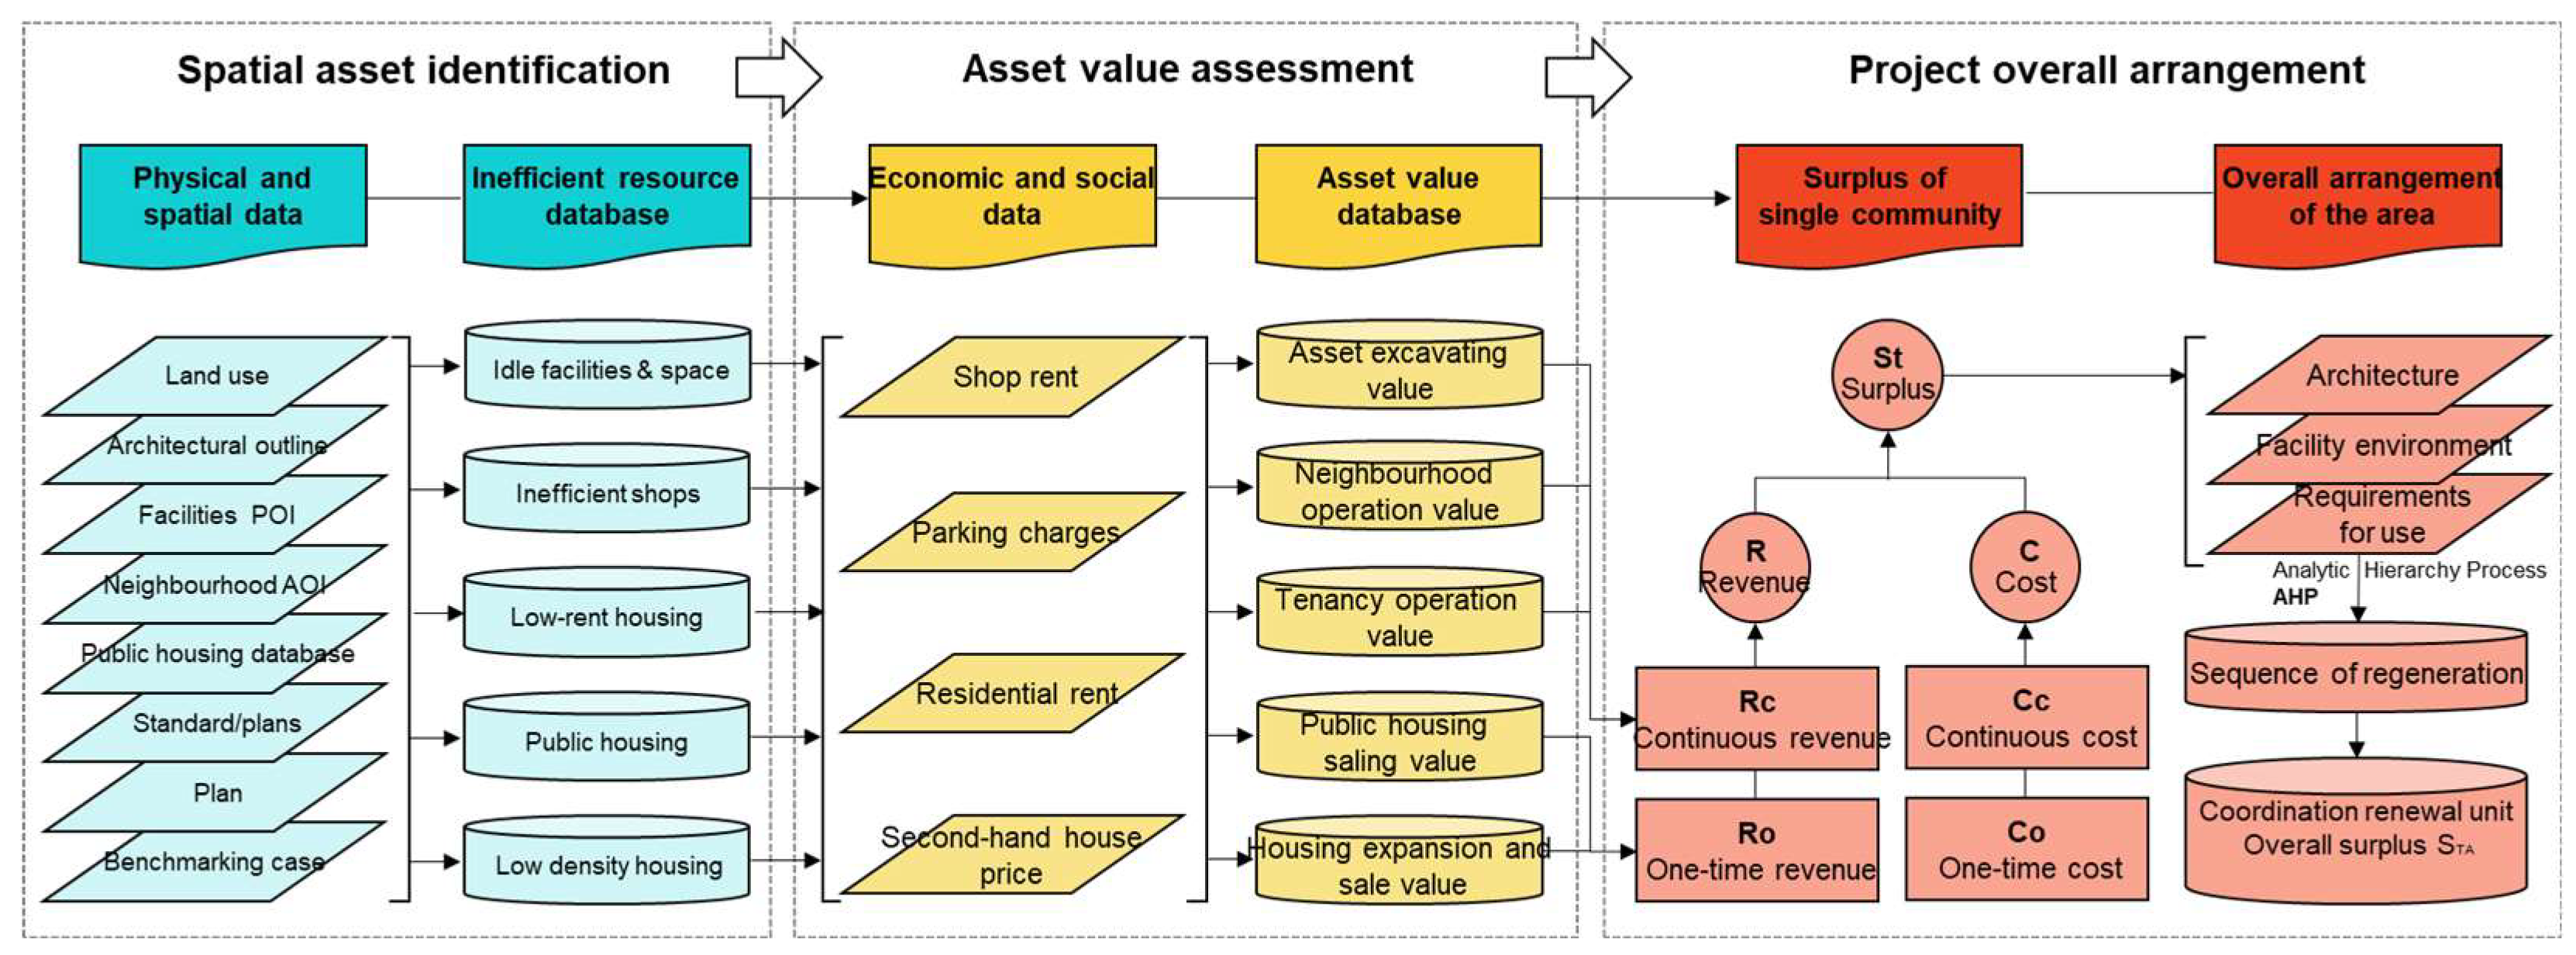
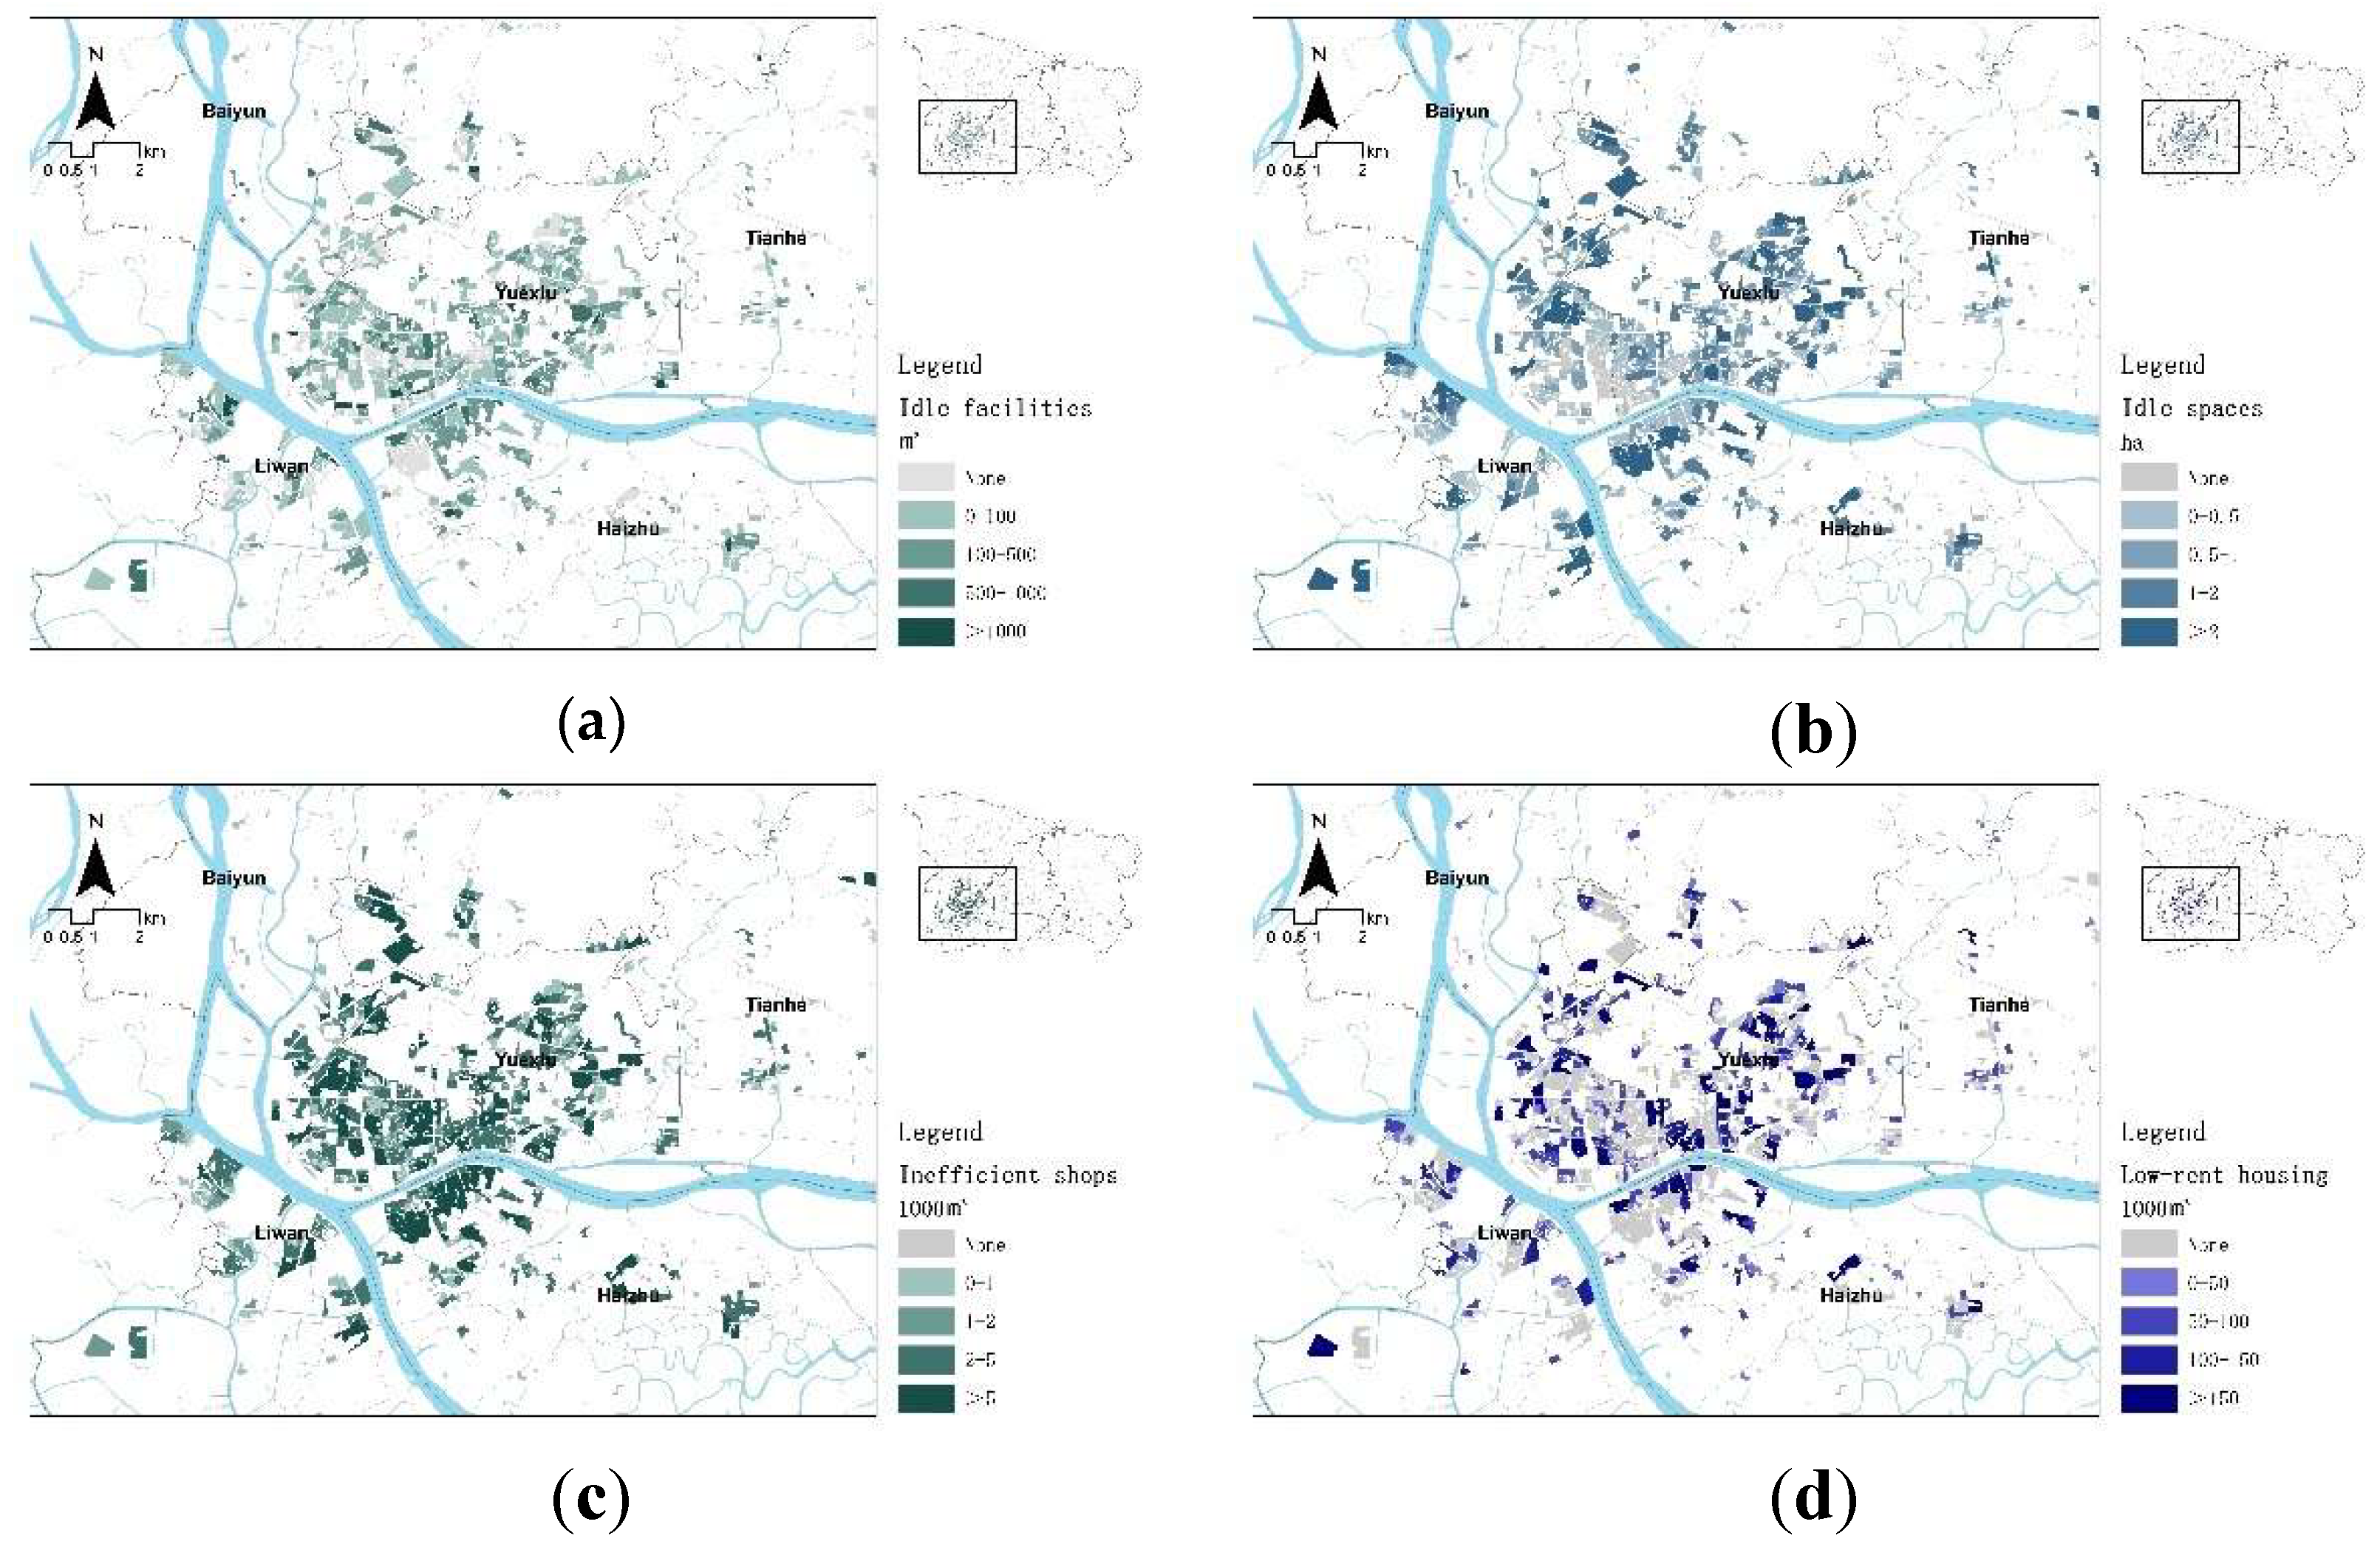
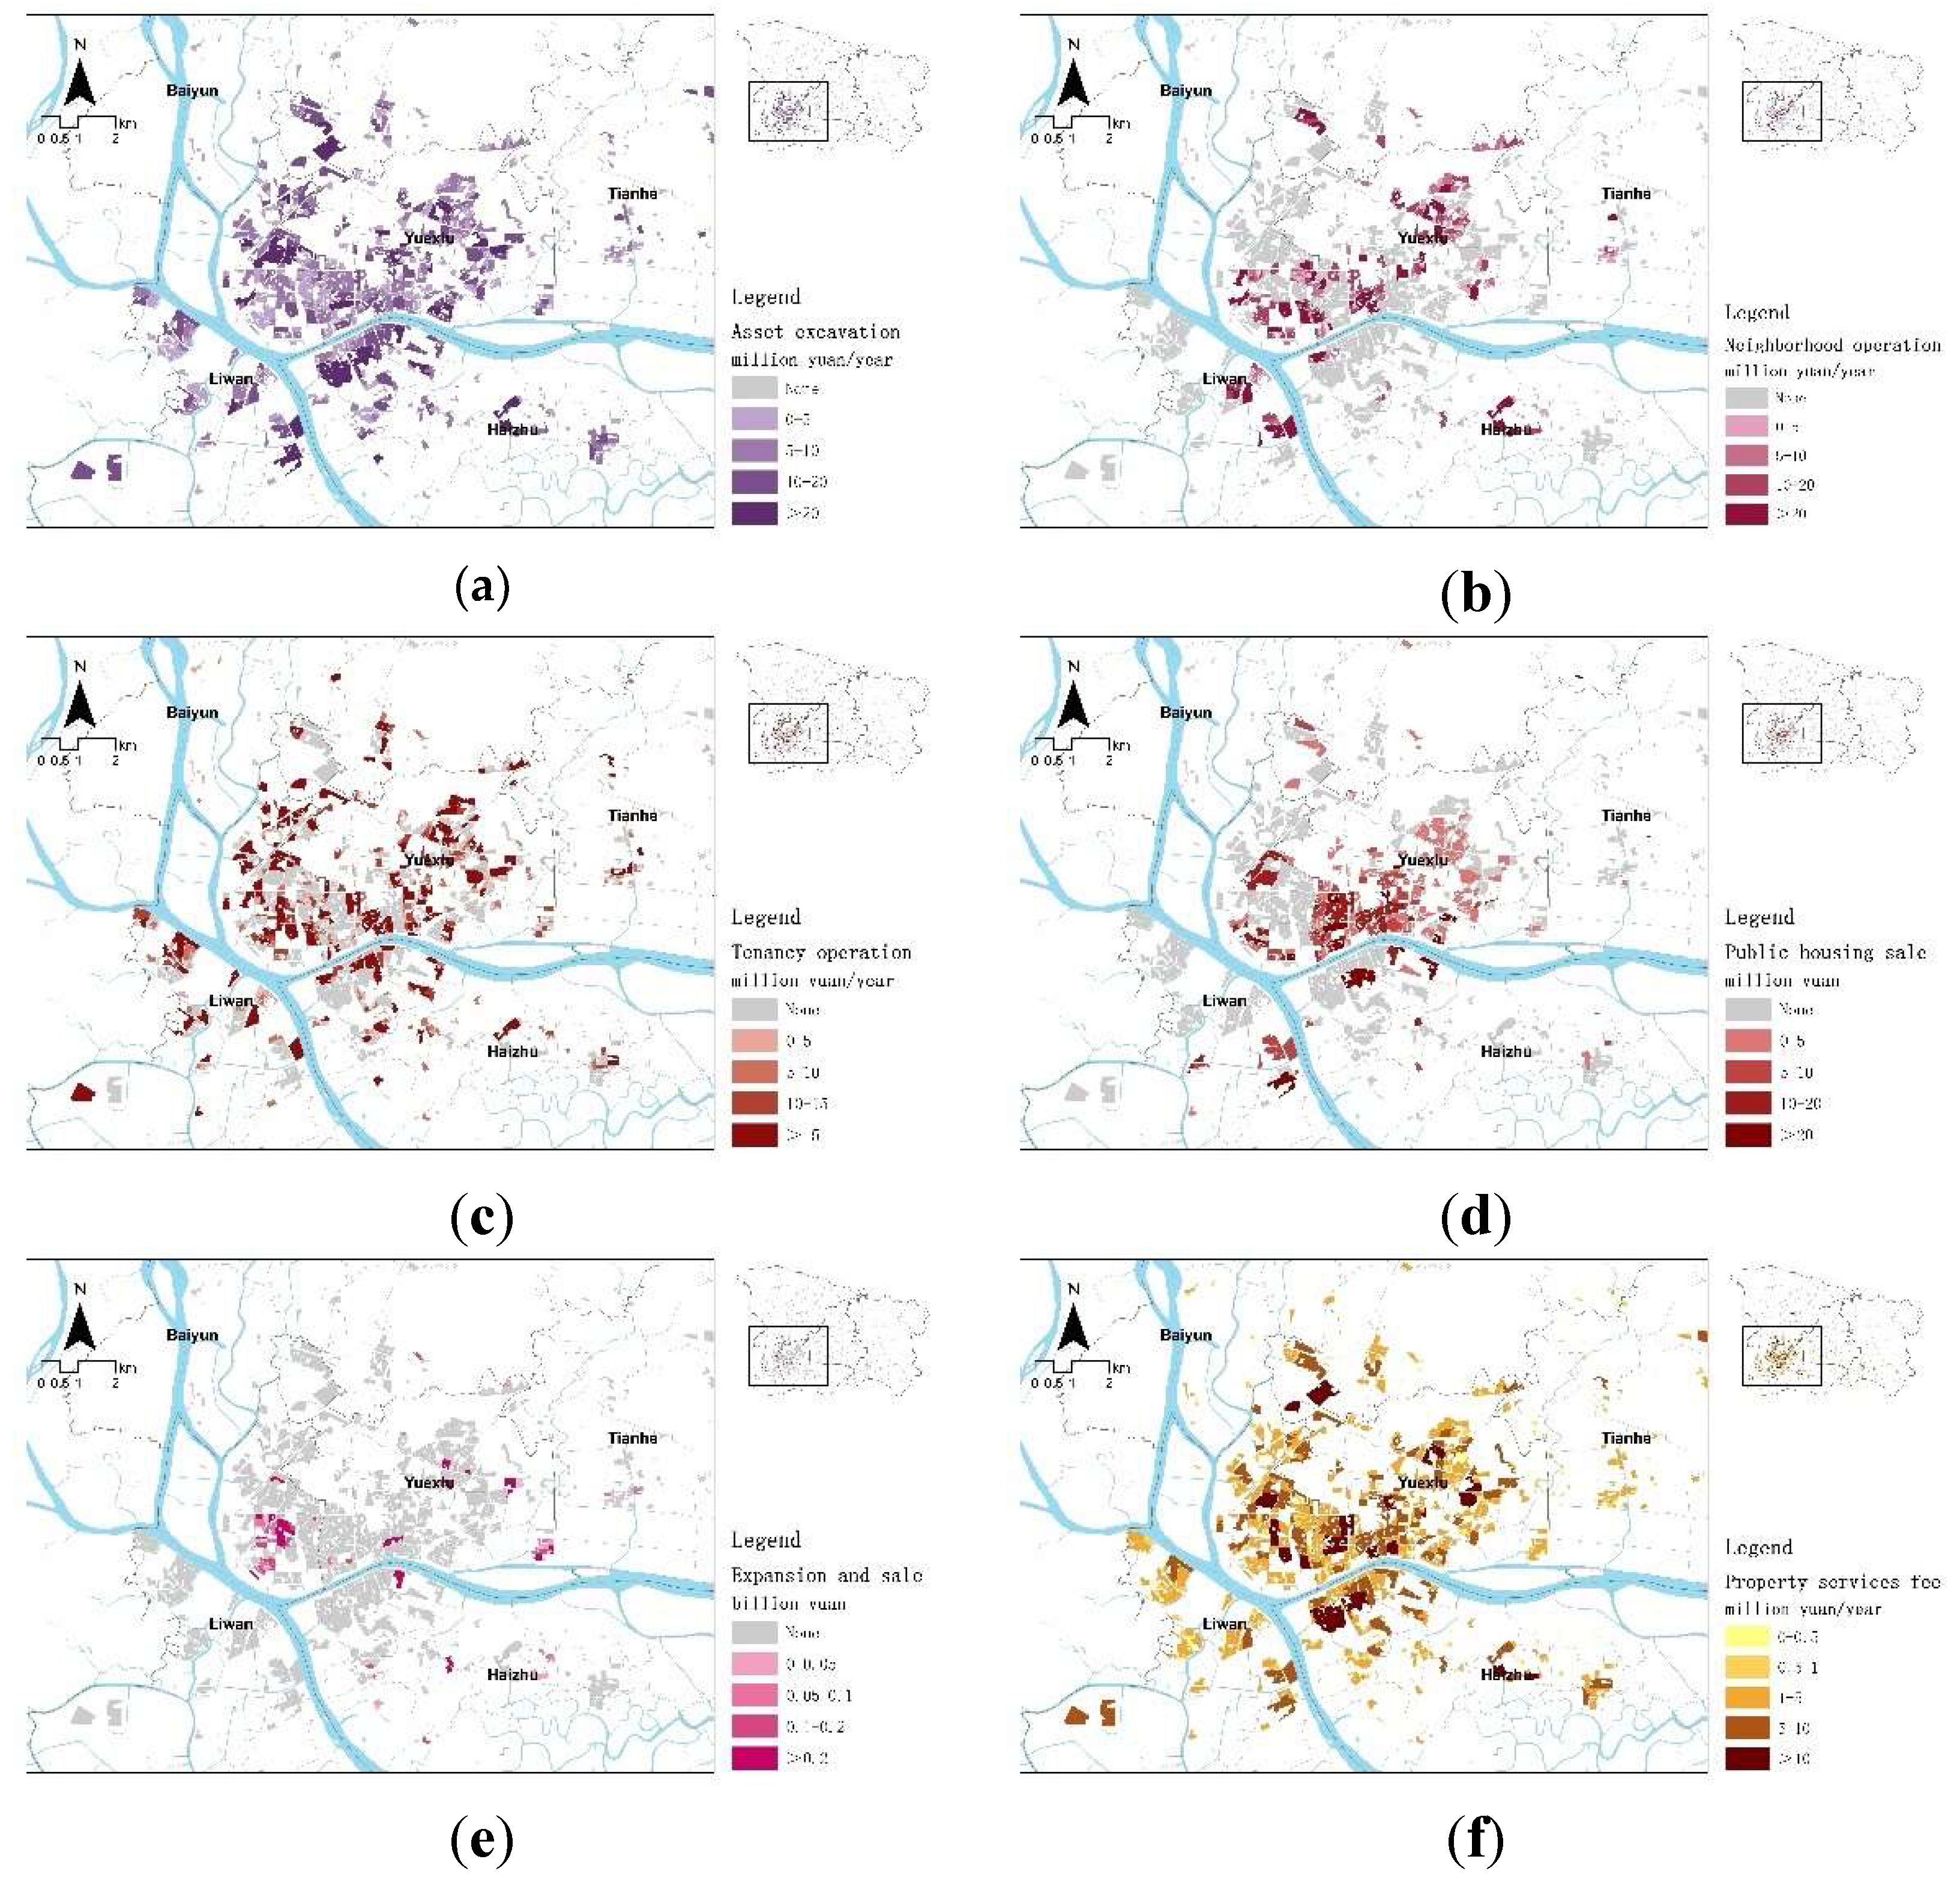
2.3.1. Spatial Assets Identification and Economic Value Assessment
- (1)
- Asset excavation of idle facilities and space
- (2)
- Neighborhood operation of operational facilities
- (3)
- Tenancy operation of low-rent housing
- (4)
- Public housing sale
- (5)
- Expansion and sale of low-density housing
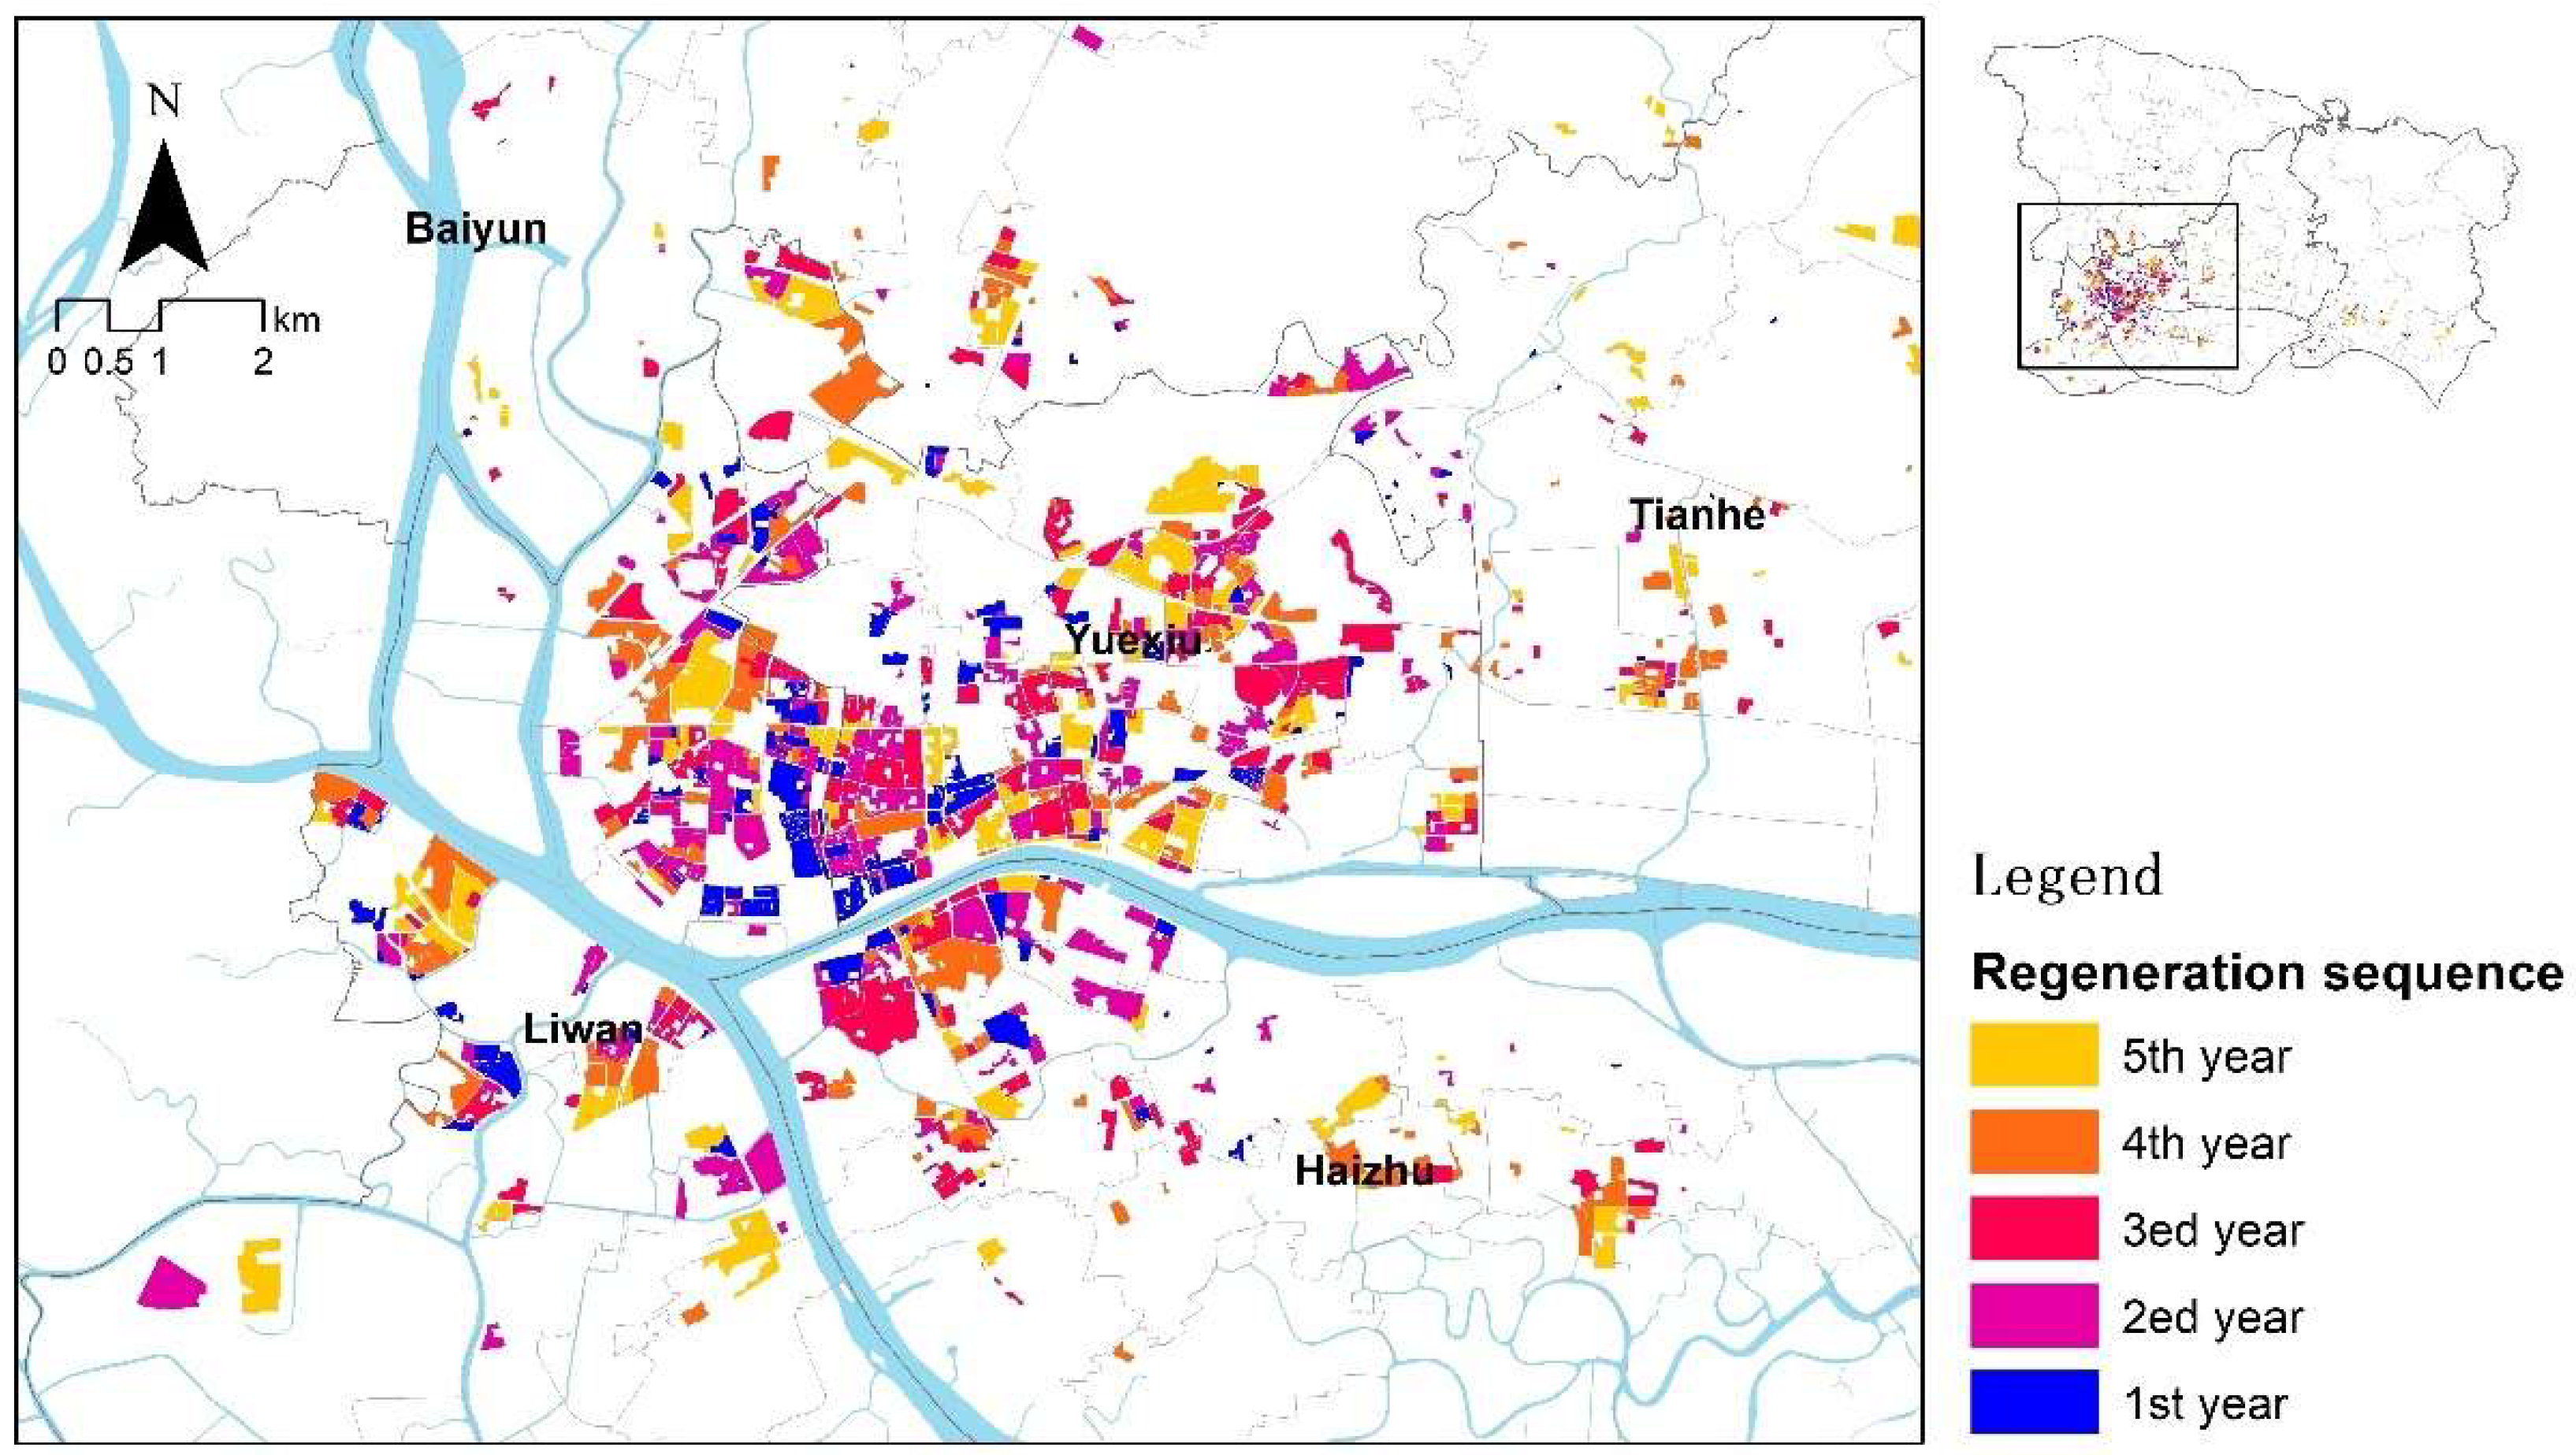
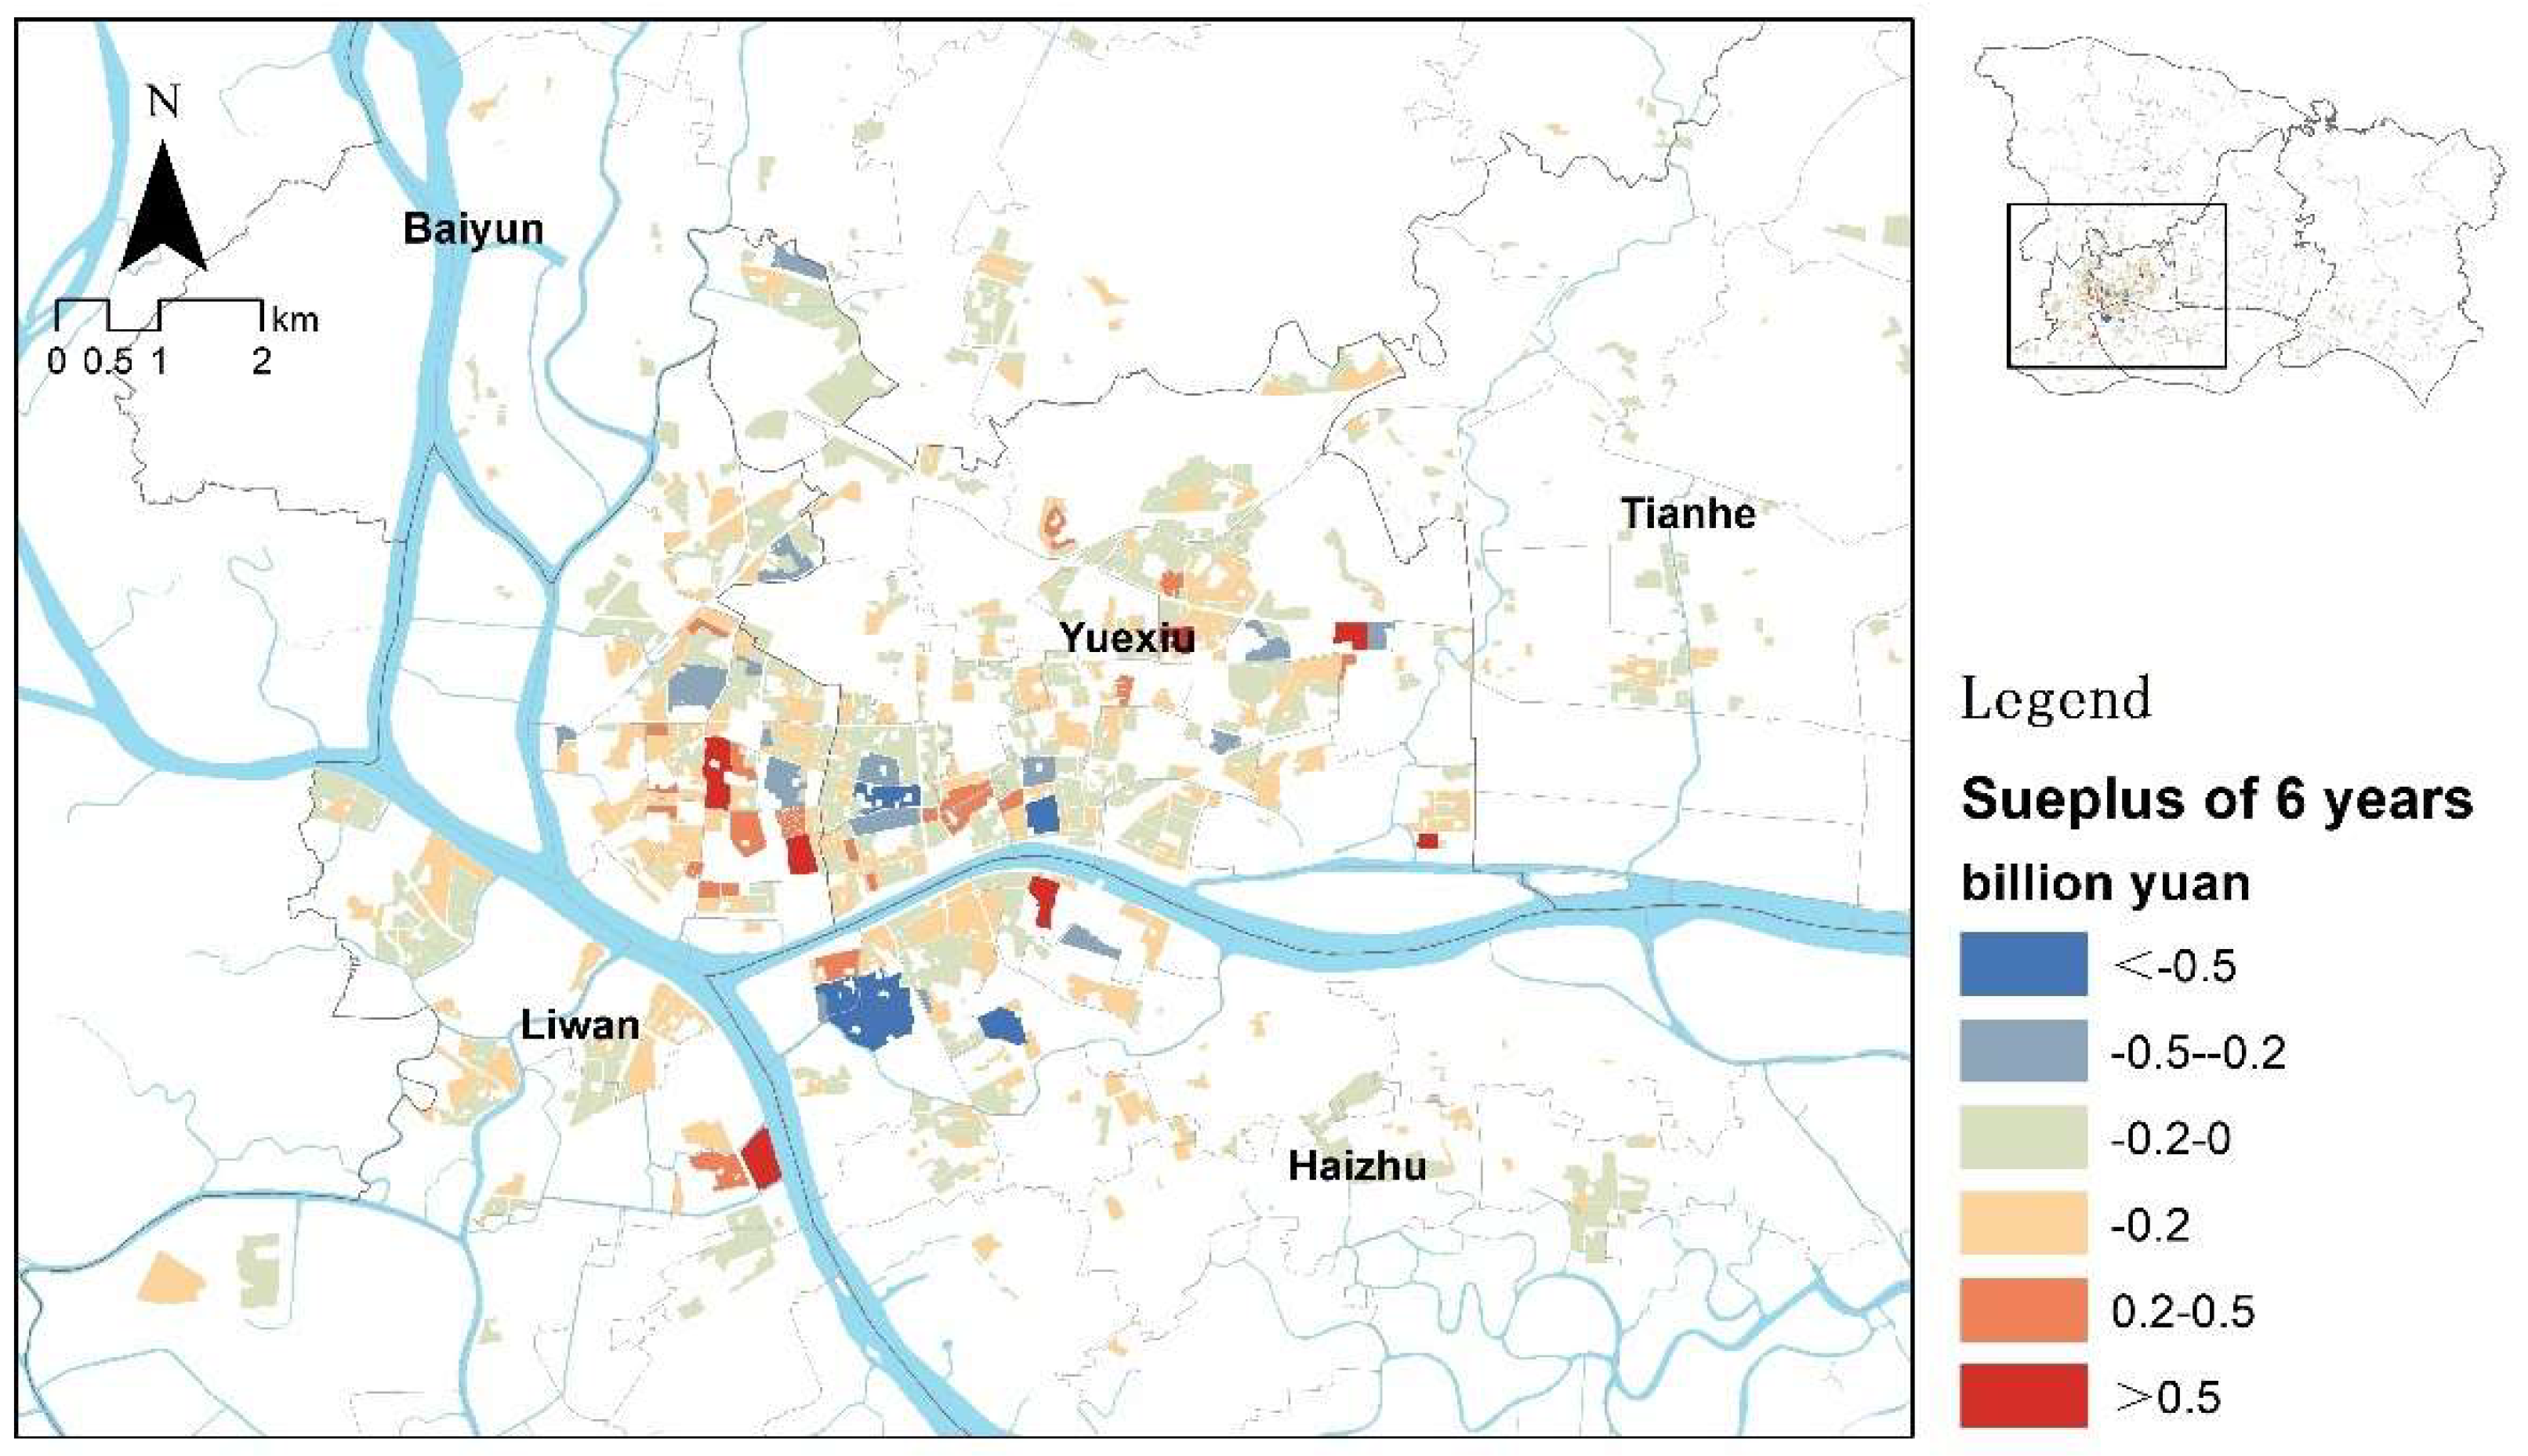
2.3.2. Project Regeneration Sequencing and Overall Coordination
- (1)
- Sequence of regeneration
- (2)
- Surplus of regeneration
3. Results
3.1. Economic Potential of Spatial Assets in Old Communities
3.2. Overall Arrangement of the Regeneration of Old Communities
4. Discussion
4.1. Research Reflection
4.2. Implementation Recommendations
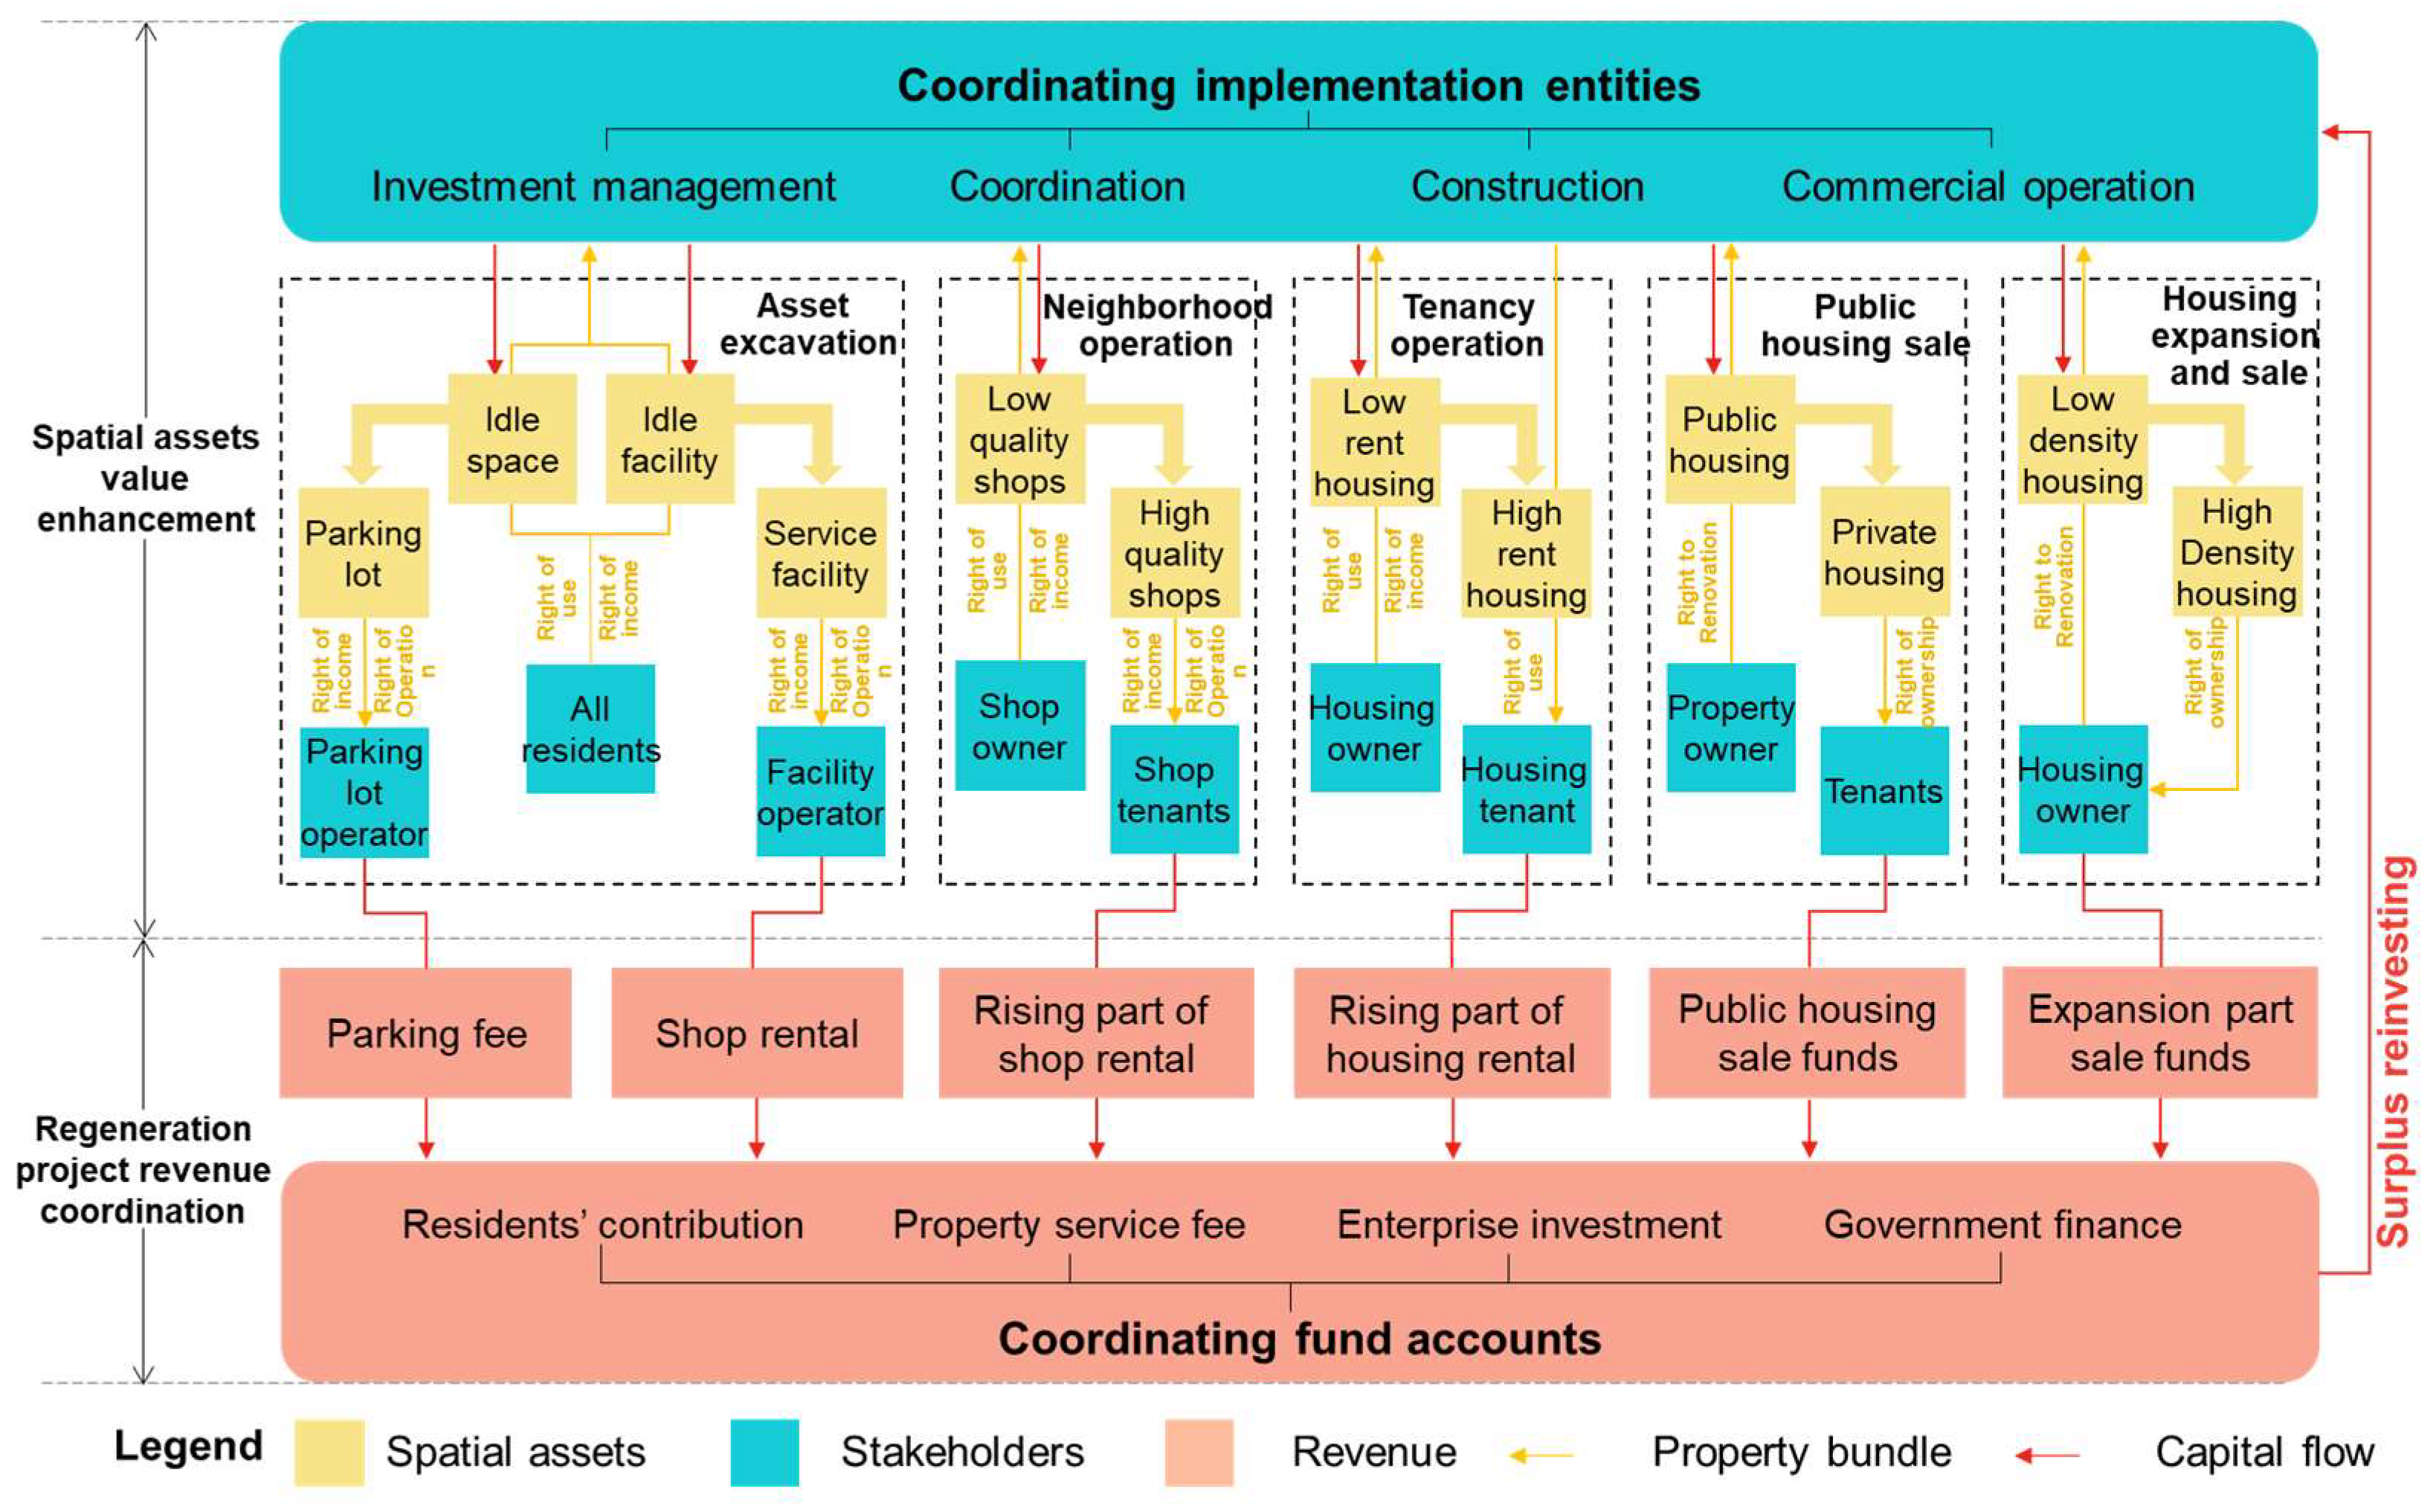
4.2.1. Coordinating Implementation Entities
4.2.2. Coordinating Fund Accounts
5. Conclusions
Author Contributions
Funding
Data Availability Statement
Acknowledgments
Conflicts of Interest
References
- Xinhua News Agency: Build beautiful cities and towns together and realize the dream of a safe home -- "China in the past decade" series of thematic press conferences focus on the achievements of housing and urban and rural construction in the new era. Available online: http://www.gov.cn/xinwen/2022-09/15/content_5709861.htm (accessed on 6 September 2024).
- People's Daily: In the first 10 months, 52,100 old urban communities were newly renovated nationwide. Available online: https://www.gov.cn/xinwen/2022-12/11/content_5731326.htm (accessed on 6 September 2024).
- Li, W.; Li, Q.; Liu, Y.; Wang, S.; Jia, L. Decision-making factors for renovation of old residential areas in Chinese cities under the concept of sustainable development. Environmental Science and Pollution Research. 2023, 30, 39695–39707. [CrossRef]
- Liu, G.; Hu, W.; Xie, F. Exploration and practice of renovation models for old residential communities in cities: A comparative study based on Chengdu, Guangzhou, and Shanghai. Urban and Rural Construction. 584, 05, 54–57.
- Zhu, S.; Li, D.; Jiang, Y. The impacts of relationships between critical barriers on sustainable old residential neighborhood renewal in China. Habitat International. 2020, 103, 102232. [CrossRef]
- Liu, Y.; Li, H.; Li, W.; Wang, S. Renovation priorities for old residential districts based on resident satisfaction: An application of asymmetric impact-performance analysis in Xi’an, China. PLOS ONE. 2021. 16,7. [CrossRef]
- Gent, W. The Context of Neighbourhood Regeneration in Western Europe. 2008. http://hdl.handle.net/11245/2.62178.
- Mareeva, V. M.; Ferwati, M. S.; Garba, S. B. Sustainable Urban Regeneration of Blighted Neighborhoods: The Case of Al Ghanim Neighborhood, Doha, Qatar. Sustainability, 2022, 14(12), 6963; [CrossRef]
- Laska, S.B.; Spain, D. Back to the City: Issues in Neighborhood Renovation. Pergamon Press. 2016.
- Couch, C.; Fraser, C.; Percy, S. Urban Regeneration in Europe. Blackwell Science. 2008.
- Blanco, E.; Raskin, K.; Clergeau, P. Towards regenerative neighbourhoods: An international survey on urban strategies promoting the production of ecosystem services. Sustainable Cities and Society. 2022, 80, 103784. [CrossRef]
- Shahraki, A. Renovation Programs in Old and Inefficient Neighborhoods of Cities. City, Territory, and Architecture. 2022, 9, 28. [CrossRef]
- Tian, L.; Xia, J. A comparative study of international models for the supply and development of rental housing and its implications for China. Architectural Journal. 2022, 643, 06, 11–17.
- Peng, Z.; Zhao, S.; Shen, L.; Ma, Y.; Zhang, Q.; Deng, W. Retrofit or rebuild? The future of old residential buildings in urban areas of China based on the analysis of environmental benefits. International Journal of Low-Carbon Technologies. 2022, 16, 4, 1422–1434. [CrossRef]
- Tang, Y.; Zhang, L.; Yin, X. Urban regeneration system and Beijing’s exploration: Multiple Stakeholders-Capital Source-Physical Space-Operation Service. Beijing: China City Press, 2023.
- Zhao, Y.; Shen, J. The last opportunity for growth transformation: The financial trap of urban renewal. Urban Planning. 2023, 47, 10, 11–22.
- Liu, D. Theoretical prototype and solutions to the collaboration dilemma in old residential community renewal: An analytical framework based on public choice theory. Urban Planning. 2022, 46, 12, 57–66.
- Zhang, Z.; Pan, J.; Qian, J. Collaborative governance for participatory regeneration practices in old residential communities within the Chinese context: Cases from Beijing. Land. 2023, 12, 7, 1427. [CrossRef]
- Zhao, Y.; Song, T. Financial balance analysis of urban renewal: Models and practices. Urban Planning. 2021, 45, 9, 53–61.
- Liu, G.; Fu, X.; Han, Q.; Huang, R.; Zhuang, T. Research on the collaborative governance of urban regeneration based on a Bayesian network: The case of Chongqing. Land Use Policy. 2021, 109, 105640. [CrossRef]
- Shen, T.; Yao, X.; Wen, F. The Urban Regeneration Engine Model: An analytical framework and case study of the renewal of old communities. Land Use Policy. 2021, 108, 105571. [CrossRef]
- Li, X.; Hui, E. C. M.; Chen, T.; Lang, W.; Guo, Y. From Habitat III to the new urbanization agenda in China: Seeing through the practices of the “three old renewals” in Guangzhou. Land Use Policy. 2019, 81, 513–522. [CrossRef]
- Tang, Y.; Yang, D. Urban Regeneration in China: Institutional Innovation in Guangzhou, Shenzhen, and Shanghai. Routledge, 2022.
- Wan, L. Exploring the dilemmas and pathways of sustainable micro-renovation in old residential areas of Guangzhou. Urban Observation. 2019, 60, 2, 65–71.
- Zhang, L.; Lin, Y.; Hooimeijer, P.; Geertman, S. Heterogeneity of public participation in urban redevelopment in Chinese cities: Beijing versus Guangzhou. Urban Studies. 2019, 57, 9. [CrossRef]
- Liu, Y.; Zhou, K.; Chen, X. Evaluation and extended reflections on the micro-renovation implementation of old residential areas in Guangzhou: Practice, effectiveness, and dilemmas. Urban Development Studies. 2020, 27, 10, 116–124.
- Gu, Z.; Zhang, X. Framing social sustainability and justice claims in urban regeneration: A comparative analysis of two cases in Guangzhou. Land Use Policy. 2021, 102, 105224. [CrossRef]
- Ge, J. The essence, definition, and characteristics of the concept of assets. Economic Dynamics. 2005, 05, 8–12.
- Huang, L. From "demand-based" to "asset-based": Insights from contemporary American community development studies. Interior Design. 2012, 27, 5, 3–7.
- Kretzmann, J.; McKnight, J. Building Communities from the Inside Out: A Path Toward Finding and Mobilizing a Community's Assets. Chicago: ACTA Publications, 1993.
- Kretzmann, J.; McKnight, J. Assets-based community development. National Civic Review. 1996, 85, 4, 23–29.
- Zhou, C. Endogenous community development: "Asset-based" community development theory and practical pathways. Social Work. 2014, 253, 4, 41–49+153.
- Rainey, V. D.; Robinson, L. K.; et al. Essential forms of capital for sustainable community development. American Journal of Agricultural Economics. 2003, 85, 3, 708–715.
- Gare, P. G.; Anna, L. H. Asset Building & Community Development. Los Angeles: Sage Publications, 2008.
- Ronald, F. F.; William, T. D. Urban Problems and Community Development. Washington, DC: Brookings Institution Press, 1999.
- Huang, L.; Luo, J.; Shen, M. Asset-based urban community renewal planning: An empirical study of Yuzhong District, Chongqing. Urban Planning Journal. 2022, 269, 3, 87–95.
- Kuang, X.; Li, J.; Lu, Y. Paths and practices of old community renewal based on the "asset-based" theory. Planner. 2022, 38, 3, 82–88.
- Li, W. Mapping urban land use by combining multi-source social sensing data and remote sensing imagery. Earth Science Informatics. 2021, 14, 1537–1545. [CrossRef]
- Anugraha, A. S.; Chu, H. J.; Ali, M. Z. Social sensing for urban land use identification. ISPRS International Journal of Geo-Information. 2020, 9, 9, 550. [CrossRef]
- Alogayell, H. M.; Kamal, A.; Alkadi, I. I.; Ramadan, M. S.; Ramadan, R. H.; Zeidan, A. M. Spatial modeling of land resources and constraints to guide urban development in Saudi Arabia’s NEOM region using geomatics techniques. Frontiers in Sustainable Cities. 2024, 6. [CrossRef]
- General Office of the State Council: Guiding Opinions of the General Office of the State Council on Comprehensively Promoting the Renovation of Old Urban Residential Communities (Guobanfa [2020] No. 23). Available online: https://www.gov.cn/zhengce/content/2020-07/20/content_5528320.html (accessed on 6 September 2024).
- Sun, Y.; Luo, S. A study on the current situation of public service facilities’ layout from the perspective of 15-minute communities: Taking Chengdu of Sichuan Province as an example. Land. 2024, 13, 7, 1110. [CrossRef]
- Dai, X.; Li, Z.; et al. The spatio-temporal pattern and spatial effect of installation of lifts in old residential buildings: Evidence from Hangzhou in China. Land. 2022, 11, 9, 1600. [CrossRef]
- Tan, Y.; Song, J.; et al. The mechanism of street markets fostering supportive communities in old urban districts: A case study of Sham Shui Po, Hong Kong. Land. 2024, 13, 3, 289. [CrossRef]
- Tang, Y.; Yin, X.; Liu, S. Reconstructing the supply and dynamics of urban regeneration systems in China. Urban and Regional Planning Research. 2022, 14, 1, 1–19.
- Liang, Y.; Jiang, M.; Liu, C.; et al. Issues and strategies in the renovation of old residential communities in Beijing under a funding balance perspective: A case study of Jinsong North Community. Shanghai Urban Planning. 2022, 02, 86–92.
- Fei, Y.; Chen, M.; Lin, Z.; et al. Achieving diverse integration through spatial innovation: Reflections on the renewal path of Xinyun Community along the new central axis in Guangzhou. Urban Development Studies. 2022, 29, 11, 65–72.
- Yang, C.; Xin, L. Social performance evaluation of the Caoyang New Village community renewal: Based on social network analysis. Urban and Rural Planning. 2020, 01, 20–28.
- Zhang, Z.; Tang, X.;Wang, Y. Evaluation of the intergenerational equity of public open space in old communities: A case study of Caoyang New Village in Shanghai. Land. 2023, 12, 7, 1347. [CrossRef]
- Zhou, Y. Real Estate Pricing and Practice. Harbin Institute of Technology Press, 2021.
- You, H.; Wang, C. L. Suggestions for promoting rental housing development in major cities in the new era: Reflections on why, what, and how. Beijing Planning Review. 2021, 198, 3, 11–15.
- Wu, Z.; Wu, J.; Zhang, J.; et al. Academic discussion on the implementation mechanism of urban old community renewal and renovation. Urban Planning Journal. 2021, 263, 3, 1–10.
- Tang, Y. Financial challenges and pathways for multi-capital involvement in old residential community renovation. Beijing Planning Review. 2020, 195, 6, 79–82.
- Qiao, Z.; Qin, J.; Li, D.; et al. The community land trust system and its comparison with the affordable housing system. Urban Development Studies. 2009, 16, 9, 33–36.
- Chen, F.; Shen, Y. Analysis and lessons from the community land trust model in the United States. Business and Management. 2015, 04, 144–146.
- Liu, F.; Zhang, Y. Analysis of urban renewal systems in Shenzhen: A perspective on property rights restructuring and benefit-sharing. Urban Development Studies. 2015, 22, 2, 25–30.
- Du, J. Technical approach and commentary on the three-dimensional definition of land property rights. China Land Science. 2023, 37, 11, 11–18.
- Trancik, R. Finding Lost Space: Theories of Urban Design. John Wiley & Sons, Inc., 1991.

| Way | Spatial assets | Endogeneous demand of residents | Exogenous opportunities for urban development | Economic benefits |
|---|---|---|---|---|
| Asset excavation |
Idle facilities & Idle space |
Requirements for service facilities, parking space, etc. | Continuous rental and operating income | |
| Neighborhood operation | Inefficient shops | Demand for upgrading of business forms | Guaranteed demand for facilities around scenic spots in the business district | |
| Tenancy operation | Low rent housing | Demand for rent increase & dwellings upgrading | Demand for employment and housing balance in employment agglomeration areas | |
| Public housing sale | Public housing | Residents' demand for obtaining property rights | Simplified management needs of the government | One-time asset sale funds |
| Housing expansion and sale |
Low density housing | Demand for expanding the area & add kitchen and bathroom facilities | Demand for people's livelihood and housing conditions | |
Disclaimer/Publisher’s Note: The statements, opinions and data contained in all publications are solely those of the individual author(s) and contributor(s) and not of MDPI and/or the editor(s). MDPI and/or the editor(s) disclaim responsibility for any injury to people or property resulting from any ideas, methods, instructions or products referred to in the content. |
© 2024 by the authors. Licensee MDPI, Basel, Switzerland. This article is an open access article distributed under the terms and conditions of the Creative Commons Attribution (CC BY) license (http://creativecommons.org/licenses/by/4.0/).


