1. Introduction
Rare earth elements are indispensable in the industrial sector, renowned for their exceptional magnetic, optical, and electrical attributes that underpin a myriad of applications across diverse industries and domains. The molten salt electrolysis of rare earth oxides represents a cornerstone technique in the metallurgy of rare earth metals, accounting for nearly 95% of the total metal production. The electrolysis of rare earths encompasses an electrochemical process characterized by the reduction of metal ions within the molten state [
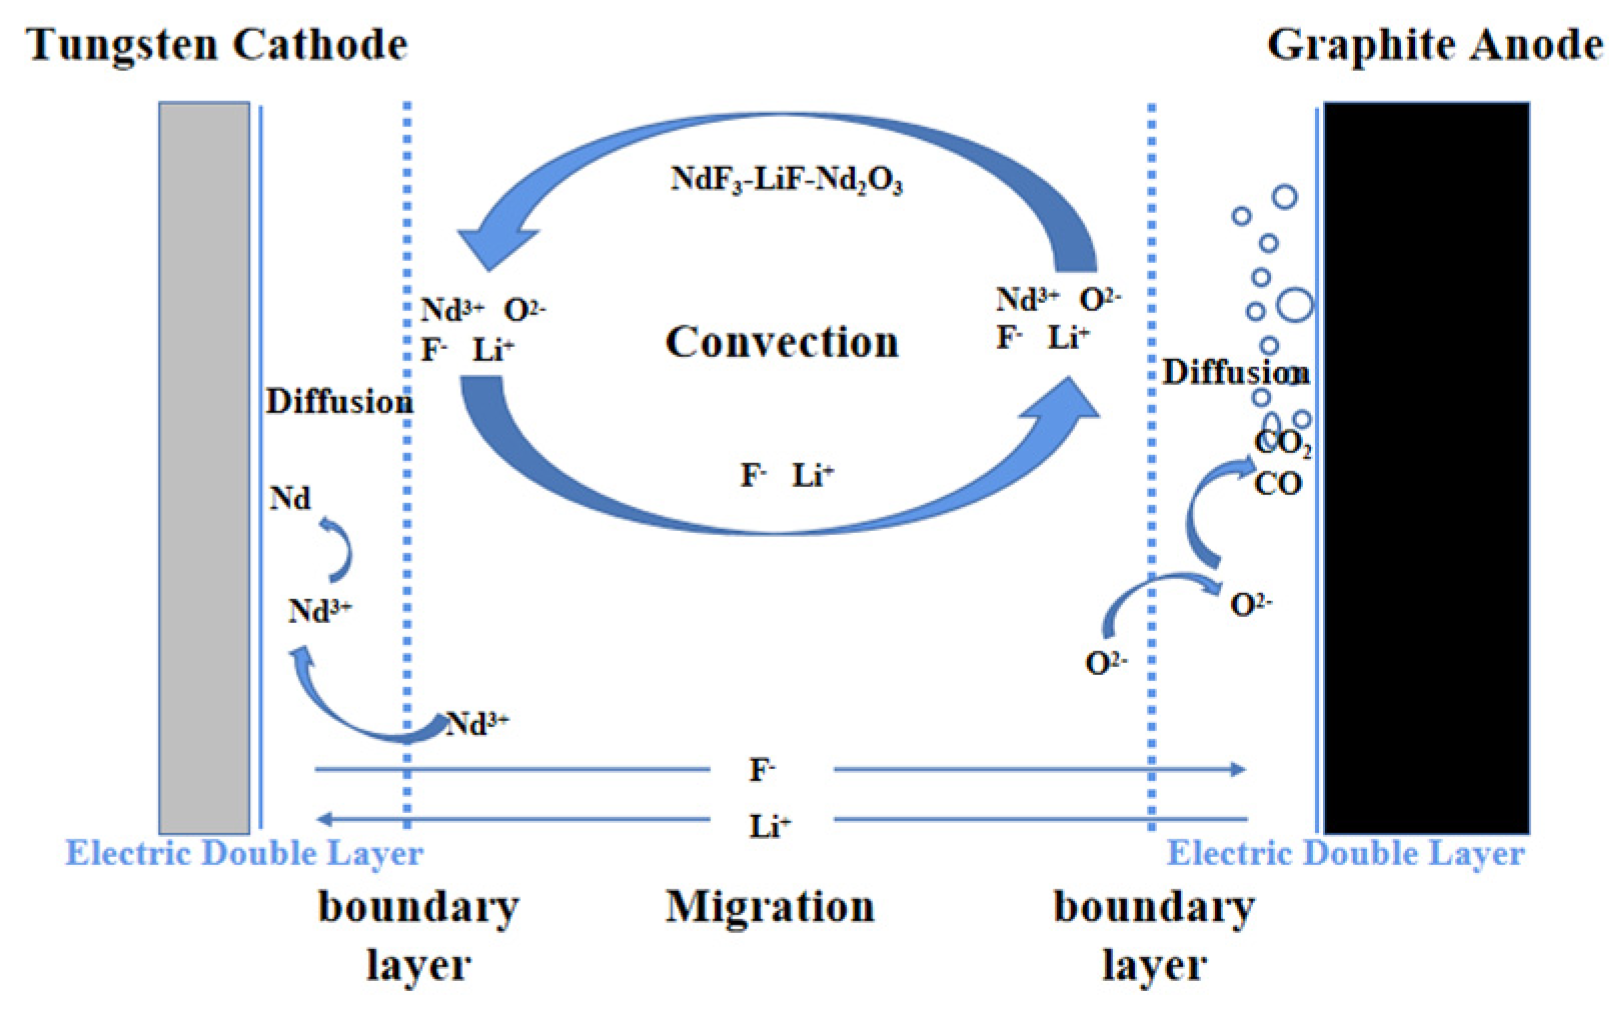
1]. Within the electrolytic cell, electrochemical factors such as electrochemical polarization and concentration polarization significantly affect the distribution of the electric field and should not be overlooked. The actual electrolysis process of neodymium is depicted in
Figure 1. In the melt, Nd
2O
3 is melted and decomposes into Nd
3+ and O
2-. The reactant Nd3+ moves from the interior of the bulk solution to the diffusion layer area near the cathode surface, where it ultimately undergoes an electronic reaction to produce elemental neodymium. Concurrently, O
2- migrates through the diffusion layer to the area near the anode surface, where it eventually reacts to form CO, which exerts a strong stirring effect on the electrolyte.
The electric field serves as the central driving force for the operation of rare earth electrolysis cells, playing a crucial role in the genesis of auxiliary physical fields. A plethora of scholarly research has been dedicated to the simulation of these electric fields, with experts meticulously examining the distribution by incorporating a spectrum of boundary conditions[2-4], electrode spacing[
5], depth of electrode immersion, materials, and structural configurations[6-7]. This has shed light on the voltage gradients within the cell, establishing a robust groundwork for further exploration of the electric field. Yet, the models predicated on Maxwell's equations have been limited to replicating the theoretical voltage drops across the melt[8-9], neglecting the nuanced electrochemical interactions occurring at the electrode interfaces. Consequently, the true voltage diminution between anodes and cathodes has eluded precise representation in holistic cell simulations.
In tackling this shortfall, the present study zeroes in on a 6KA rare earth electrolysis cell, merging the Nernst-Planck equation with the Butler-Volmer equation[10-14]. This integration, grounded in Maxwell's framework, has given rise to a sophisticated charge transfer paradigm within the electrolyte and at the electrode-electrolyte nexus. The simulation takes into account the heterogeneity of electrolyte concentrations, the intricacies of electrochemical polarization, and the effects of concentration polarization, culminating in the crafting of a holographic mathematical model that encapsulates the NdF3-LiF molten salt system's electrolytic process. The model's fidelity is affirmed through a rigorous comparison with empirical data, and a profound analysis of the electrochemical reactions' influence on cell voltage within rare earth electrolysis cells is presented.
2. Experimental
2.1 . Experimental System
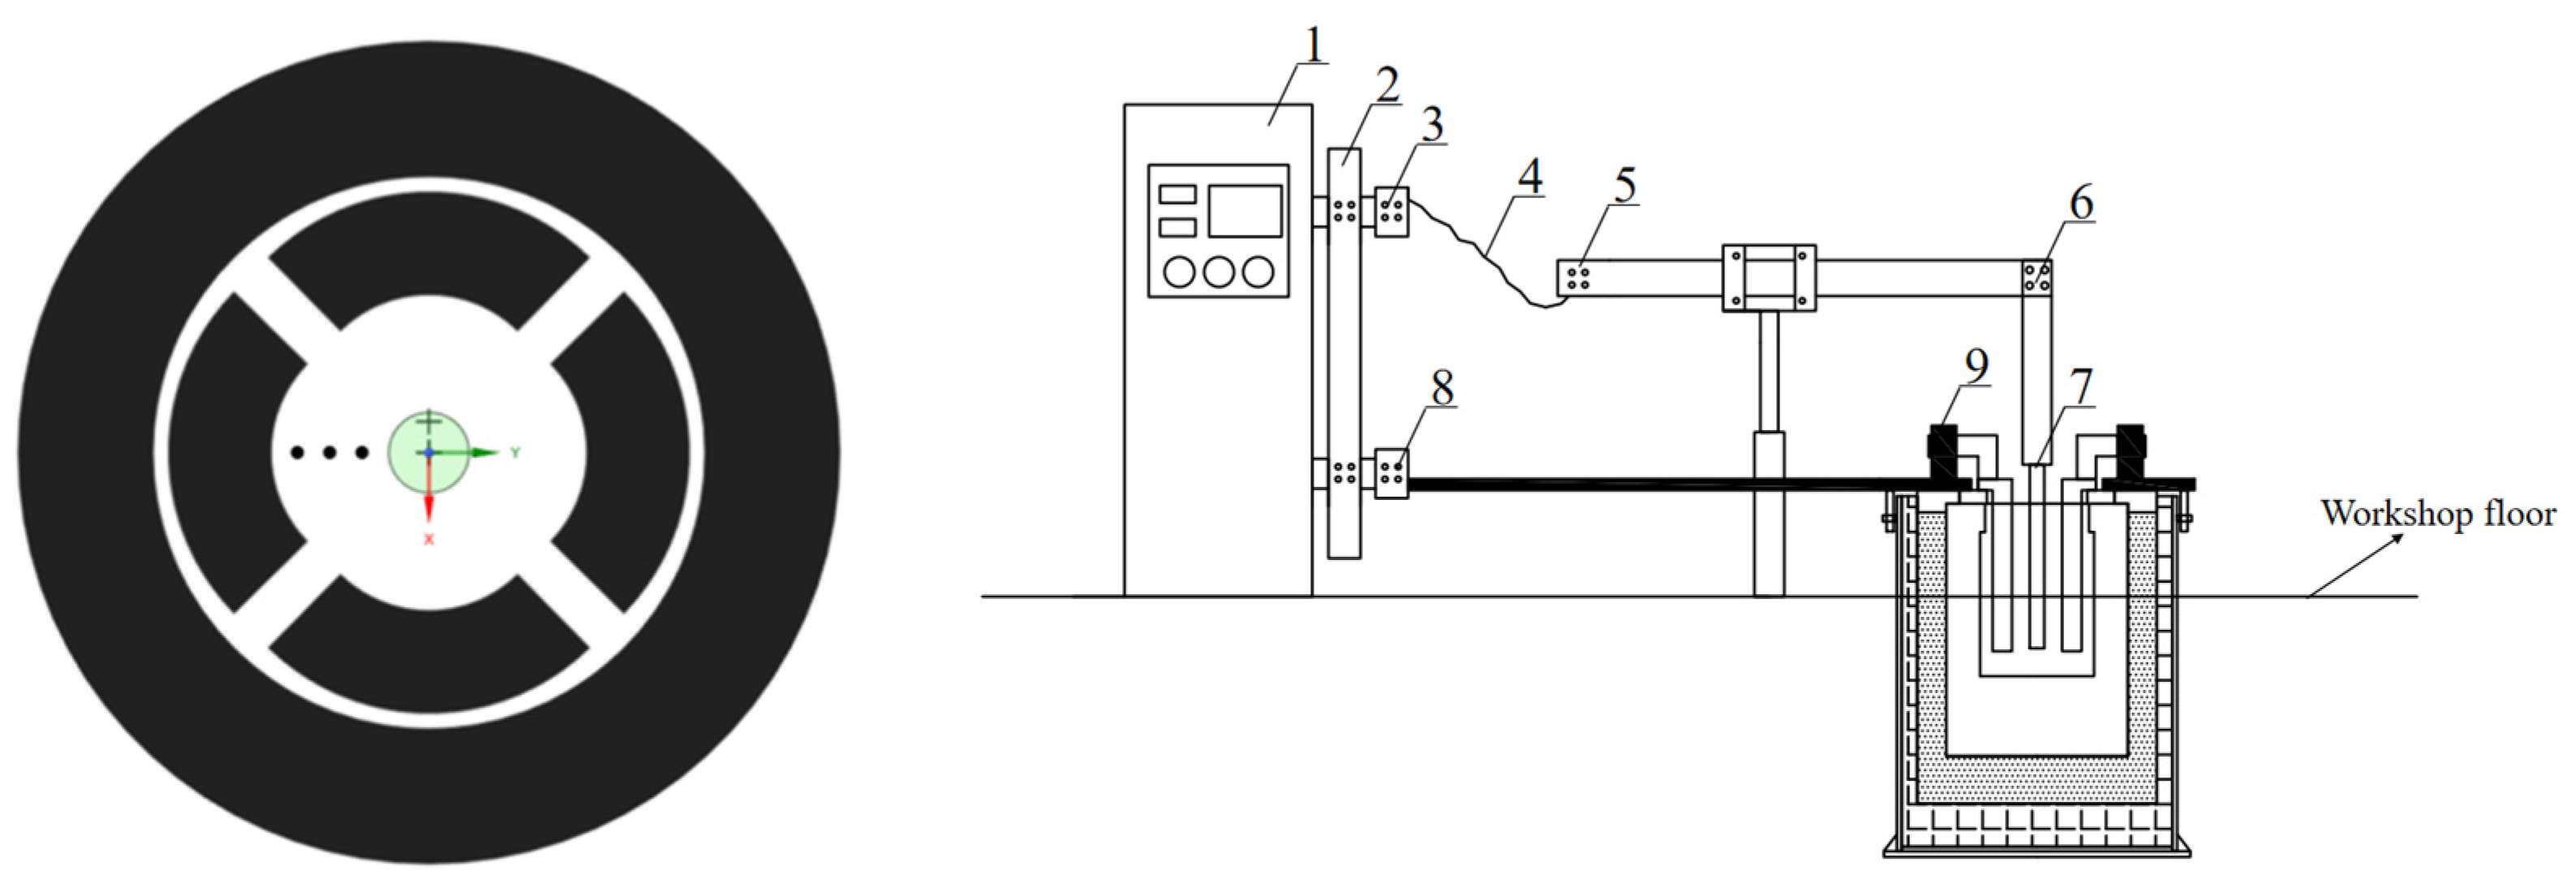
1. Power box loss voltage drop 2. Vertical contact voltage drop 3. Vertical bar and busbar contact 4. Electrode busbar 5. Bus and elevator contact 6. Horizontal and vertical beam joints 7. Cathode welding point 8. Anode and fixture contact 9. Fixture and anode contact
In this research, we conducted an in-depth investigation of a 6KA rare earth electrolytic cell. The structure of the electrolytic cell is intricately complex, and the internal temperature of the molten salt can soar to 1050°C, which poses an extremely high requirement for the temperature resistance of the measuring equipment. Therefore, we selected the surface of the molten salt as the measurement interface. To thoroughly analyze the distribution of the melt voltage drop, we set the anode as the reference point and evenly arranged three measurement points on the liquid surface between the anode and cathode for precise voltage measurements. Each point was measured three times to ensure the accuracy of the data, and the average value was taken as the final measurement result. The selection and layout of the measurement points on the surface of the molten salt in the electrolytic cell are detailed in
Figure 2(a). Subsequently, we meticulously measured the voltage within the cell, including the voltage drops across the busbar, copper bar, various contact points, and between the anode and cathode. After the measurements, we compared the obtained data with the total input voltage to verify their accuracy. The schematic distribution of voltage across the various components of the electrolytic cell is shown in
Figure 2(b).
2.2. Analysis of the Structure of Measured Electric Fields
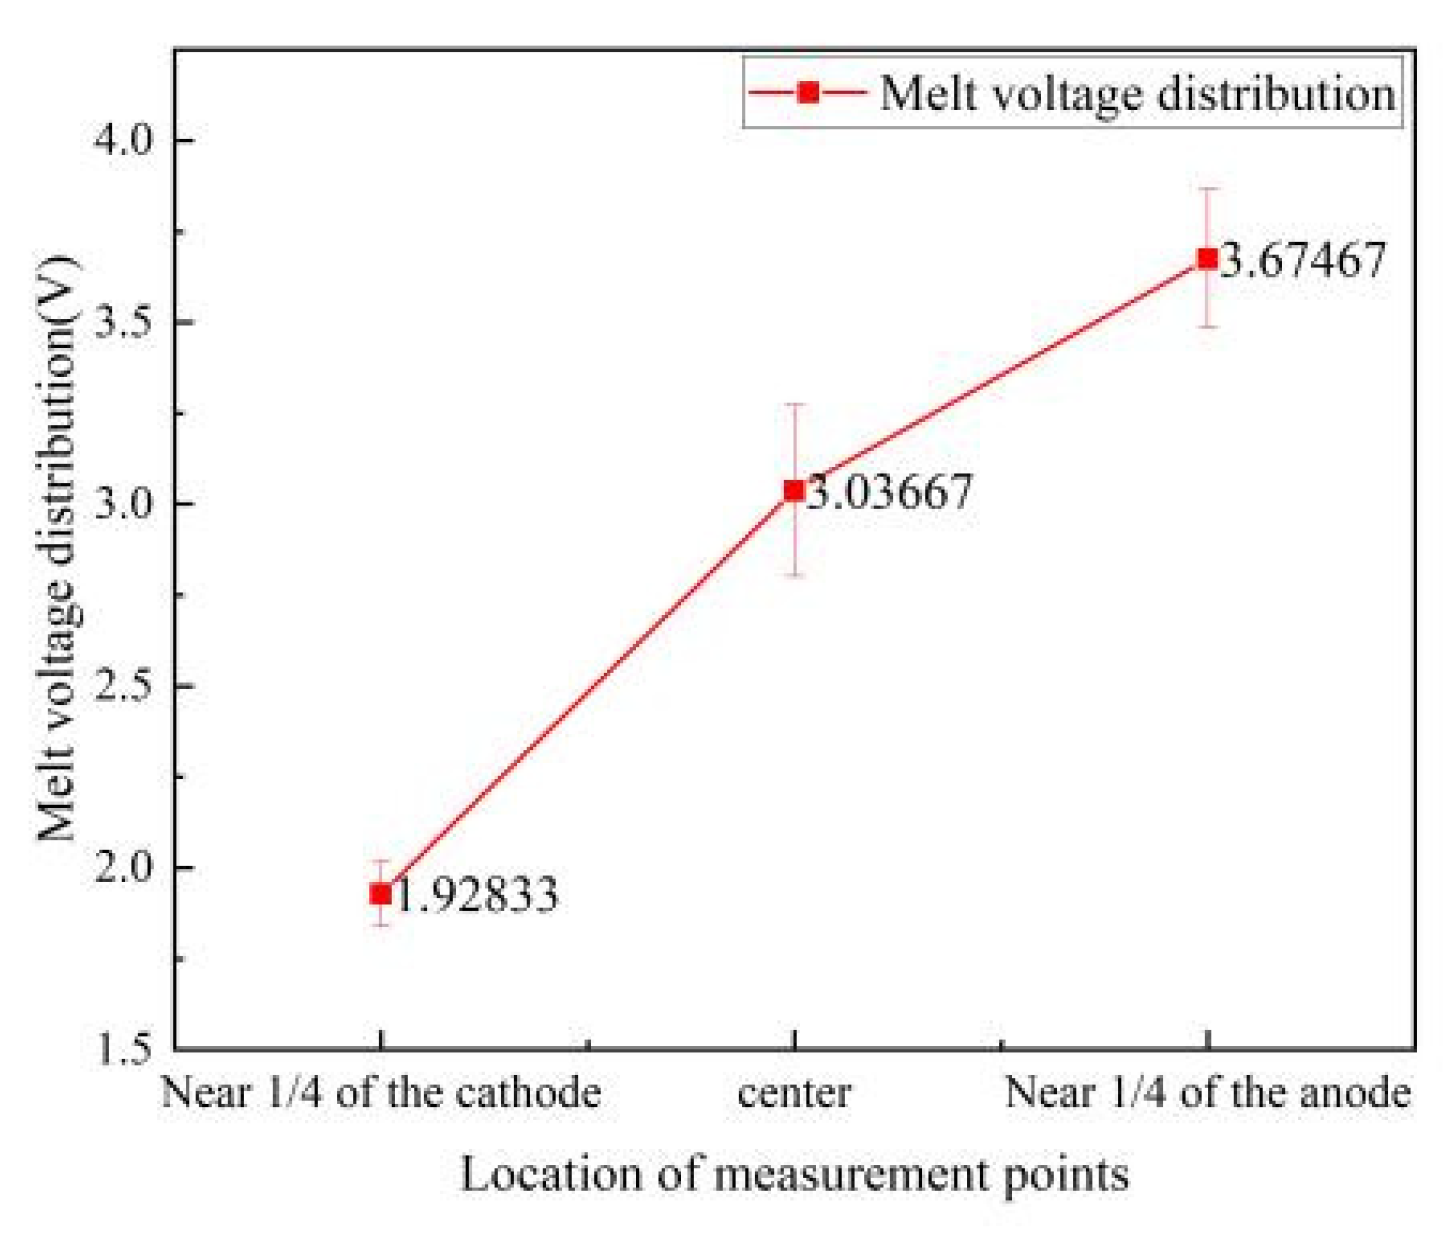
Figure 3 illustrates the distribution of the melt potential across the liquid surface of the electrolytic cell, which demonstrates a gradual and consistent ascent in potential from the cathode to the anode. At the midpoint of the liquid level between these electrodes, the melt voltage peaks at around 3 volts. Approaching one-fourth from the cathode, the voltage drop measures 1.928 volts, and near one-fourth from the anode, it reaches 3.675 volts. The voltage increment from the cathode's quarter point to the liquid's center is 1.108 volts, whereas from the center to the anode's quarter point, it is a more modest 0.638 volts. The progression of the voltage drop's increase is perceptibly mitigated as the distance extends, indicating a slowing trend.
At a current of 4010 amperes and a voltage of 9.1 volts, the precise measurements of the electrolytic cell's structures are meticulously documented in
Table 1. With a cumulative voltage drop of 9.09 volts, the figures align seamlessly with the intended 9.1 volts, affirming the veracity and dependability of our data. The cathode-to-anode voltage drop registers at 6.28 volts, while the residual 2.81 volts is categorized as structural voltage drop, deemed non-contributive to the electrolytic process. The most substantial voltage drop, peaking at 1.48 volts, is identified between the cathode rod and the copper weld near the surface of the molten salt, constituting a notable share of the overall structural voltage. This observation points to significant opportunities for optimization to enhance efficiency.
2.3. Analysis of Actual Decomposition Voltage Measurement
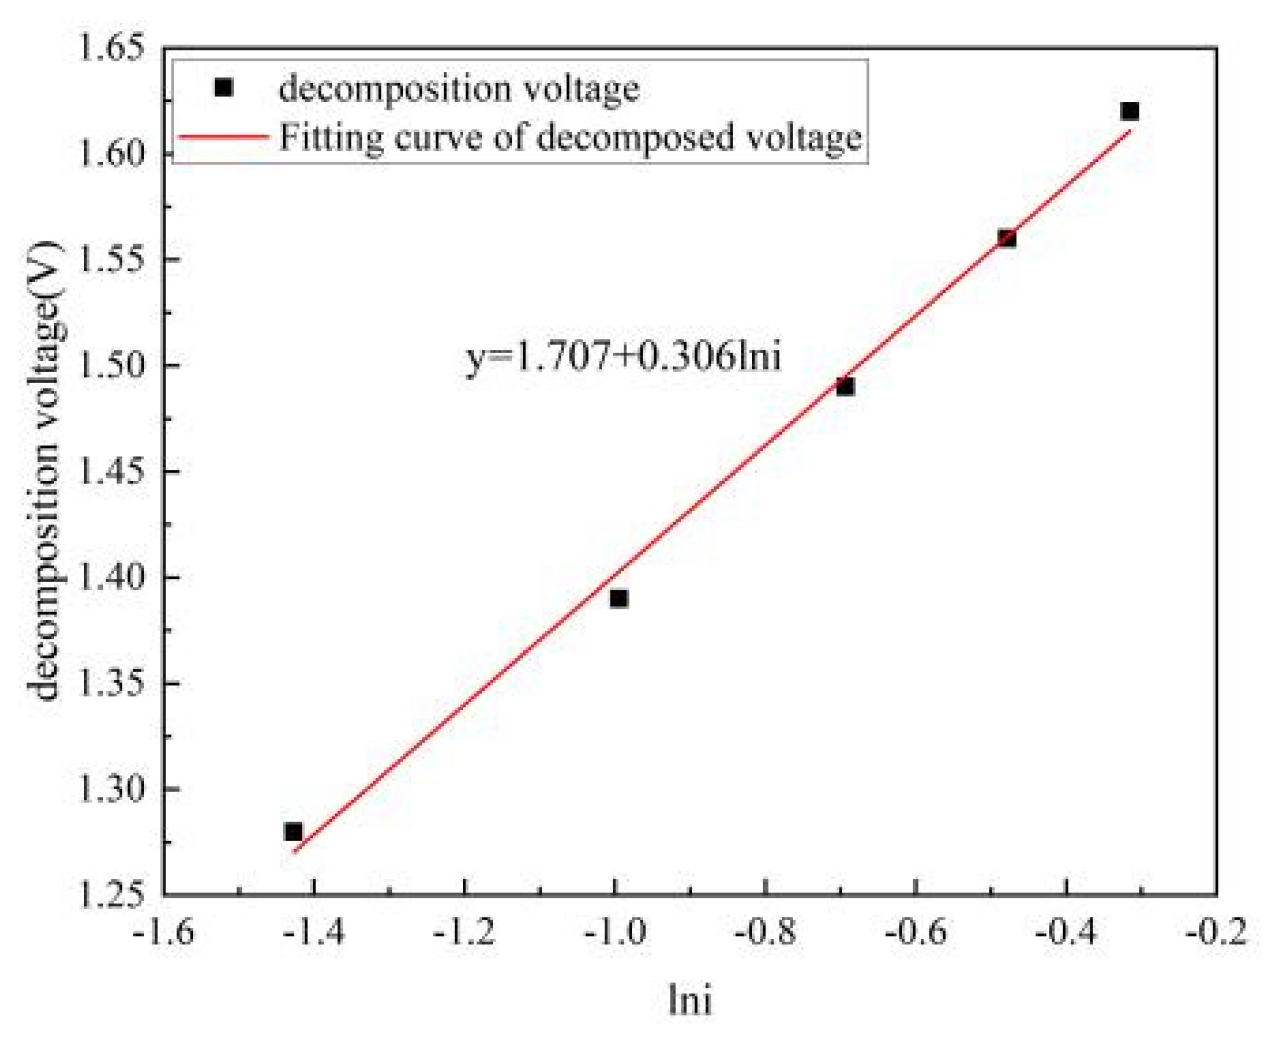
Figure 4 elegantly captures the relationship between the anode current density and the experimentally derived decomposition voltage of Nd
2O
3 at the steady temperature of 1050°C. Through a precise fit of the decomposition voltage under diverse anode current densities, we arrive at Equation (1):
This equation, at the temperature of 1050°C, clearly demonstrates a direct correlation between the anode current density and the actual decomposition voltage of Nd2O3. Given the model's average anode current density of 1.14 A/cm², the insertion of this value into our formula precisely calculates the actual decomposition voltage to be 1,747 volts, offering a nuanced understanding of the electrolysis process at this temperature.
3. Model Description
3.1. Physical Model
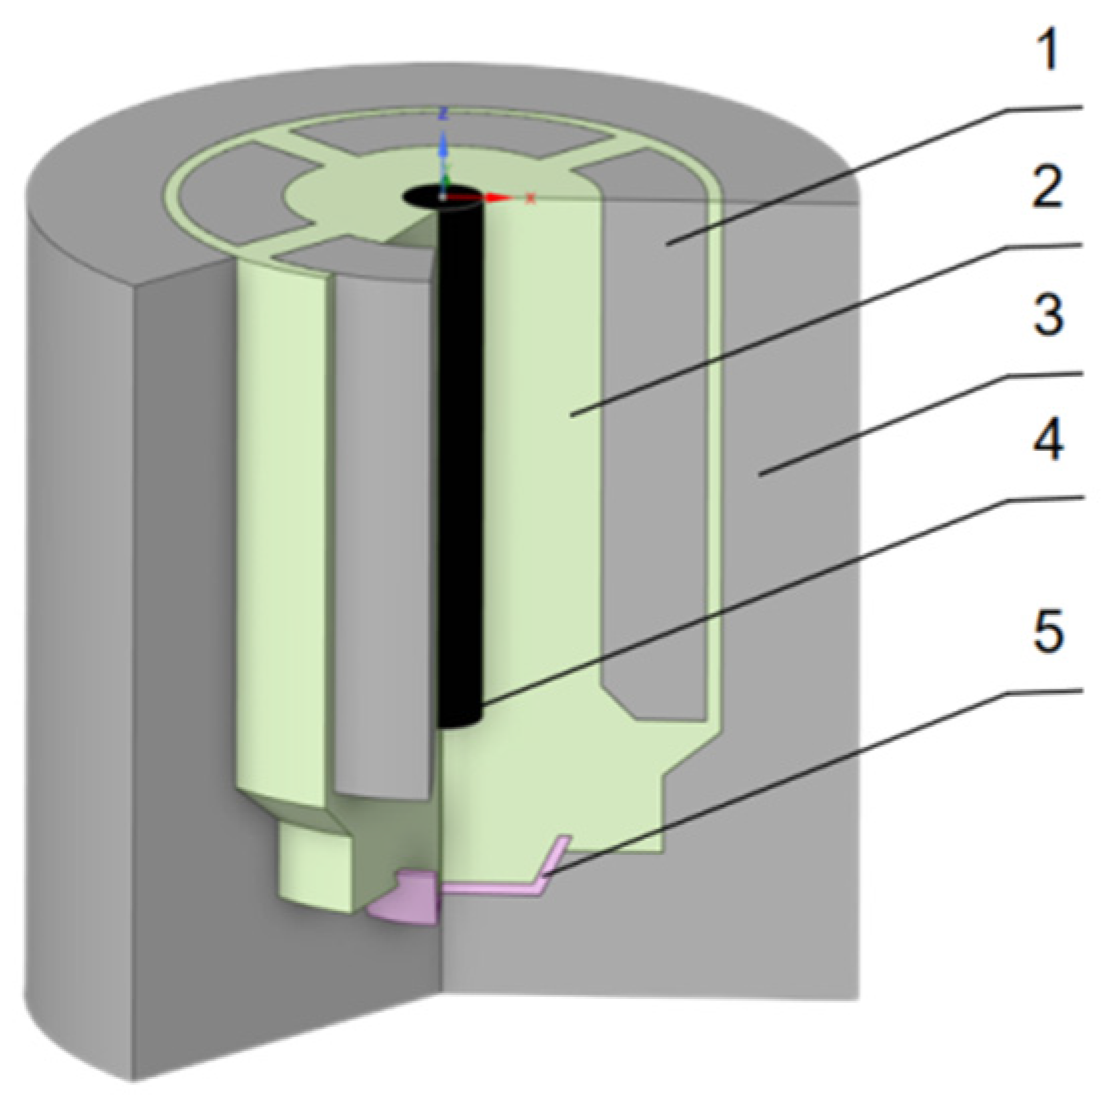
The holographic electric field model presented in this article pertains to a 6KA rare earth electrolytic cell with a modular design. It encompasses components such as the graphite anode, electrolyte, graphite crucible, tungsten cathode, and the molybdenum metal receiver. The layout of the cell's planar structure is elegantly displayed in
Figure 5, while
Table 2 provides a comprehensive overview of the electrical resistivity for each of these structures.
During the polarization process of the electrodes in rare earth electrolysis cells, the dynamic characteristics of the electrode behavior precisely mirror the dynamics of the control phases. These dynamics are of utmost importance as they are capable of influencing the overall reaction rate of the electrode. Consequently, the kinetic parameters that govern the electrode processes within rare earth electrolysis cells are exceptionally significant.
Table 3 provides a detailed presentation of the electrochemical parameters for these cells, capturing the essence of their operational nuances with finesse.
3.2. Governing Equation
The model for charge transfer in rare earth electrolytic cell electrolytes is derived from Poisson's equation using the Gaussian law. It can link the electrolyte potential to the ion distribution in the electrolyte, we arrive at Equation (2):
In the formula:∇—Electric field divergence;D—Electric displacement vector;ρv—Local current density;ε0εs=ε—absolute dielectric constant;E—electric field intensity;∇V—Potential gradient;zi—The number of charges of substance i;ci—Concentration of substance i
The mass transport of ions in electrolytes is usually given by the Nernst Planck equation, we arrive at Equation (3):
In the formula:Ni—Total flux of substance i;Di—diffusion coefficient;∇ci—concentration gradient;u—Flow Velocity
When contemplating the electrolyte concentration distribution and electrode polarization, the current in the electrolyte is given by the following formula, we arrive at Equation (4):
By replacing Ni with the Nernst Planck formula, the law of mass conservation and the law of charge conservation are combined to automatically satisfy the law of current conservation, we arrive at Equation (5):
(2)Model of charge transfer at the electrode-electrolyte interface
During the electrode reaction process. Based on the Butler Volmer equation, electrode changes were loaded. This will have an impact on local dynamics, we arrive at Equation (6):
In the formula:i0—Exchange current density;η—overpotential;αa、αc—The transmission coefficient of the anode and cathode,and αa+αc=1;cR—Concentration of substances in the melt near the cathode;cR,ref—Cathode surface substance concentration;cO—Concentration of substances in the melt near the anode;cO,ref—Anode surface substance concentration
3.3. Boundary Conditions
(1) Assumption and boundary conditions
Considering that there may be some discrepancies between the actual production process and theoretical simulation calculations, the following assumptions are made for the rare earth electrolysis cell:
1) Assume graphite anode and tungsten cathode are reversible polarization electrodes;
2) Assume that the outer wall of the graphite crucible is an insulator;
3) There is no leakage in the electrolytic cell, and the current is positive in and negative out;
4) The electrolytic cell structure is completely axisymmetric;
5) Assuming there are no bubbles floating, liquid metal products dripping, and electrolyte flow affecting the electric field distribution;
6) Assume that the electrolysis temperature does not fluctuate with time and remains stable at 1050 ℃;
7) Assume that the conductivity of each medium in the region is a fixed value.
(2) Electric field boundary conditions:
1) The total current streaming into the graphite anode is 4010A;
2) The cathode has a potential of 0 volts.
4. Simulation Results and Discussion
Maxwell's electromagnetic field equations stand as the bedrock of theoretical electromagnetism, occupying a position of paramount importance within the discipline. These foundational equations have consistently underpinned simulation research into the electric fields within rare earth electrolysis cells. Initially, the exploration of electric field distributions within electrolytes did not necessitate further derivation of Maxwell's equations. Yet, as our understanding deepened, we transitioned to modeling electrodes and electrolytes holistically, incorporating the evolving structures of both. The scope of simulation has broadened to encompass not only the electrolyte itself but also the chemical reactions occurring at the interface. The voltage across the anode and cathode cannot be simply modeled by Maxwell's equations, given that the electrolysis of rare earths is an intricate electrochemical process. The study of electric fields must also account for significant factors such as electrochemical and concentration polarization, which exert a profound influence on cell voltage. This research, exemplified by an electrolysis cell with a current of 4010 amperes, delves into the mechanisms by which electrochemical and concentration polarizations impact the cell voltage during the electrolysis process, providing a nuanced understanding of these complex dynamics.
4.1. Mesh Independency Study
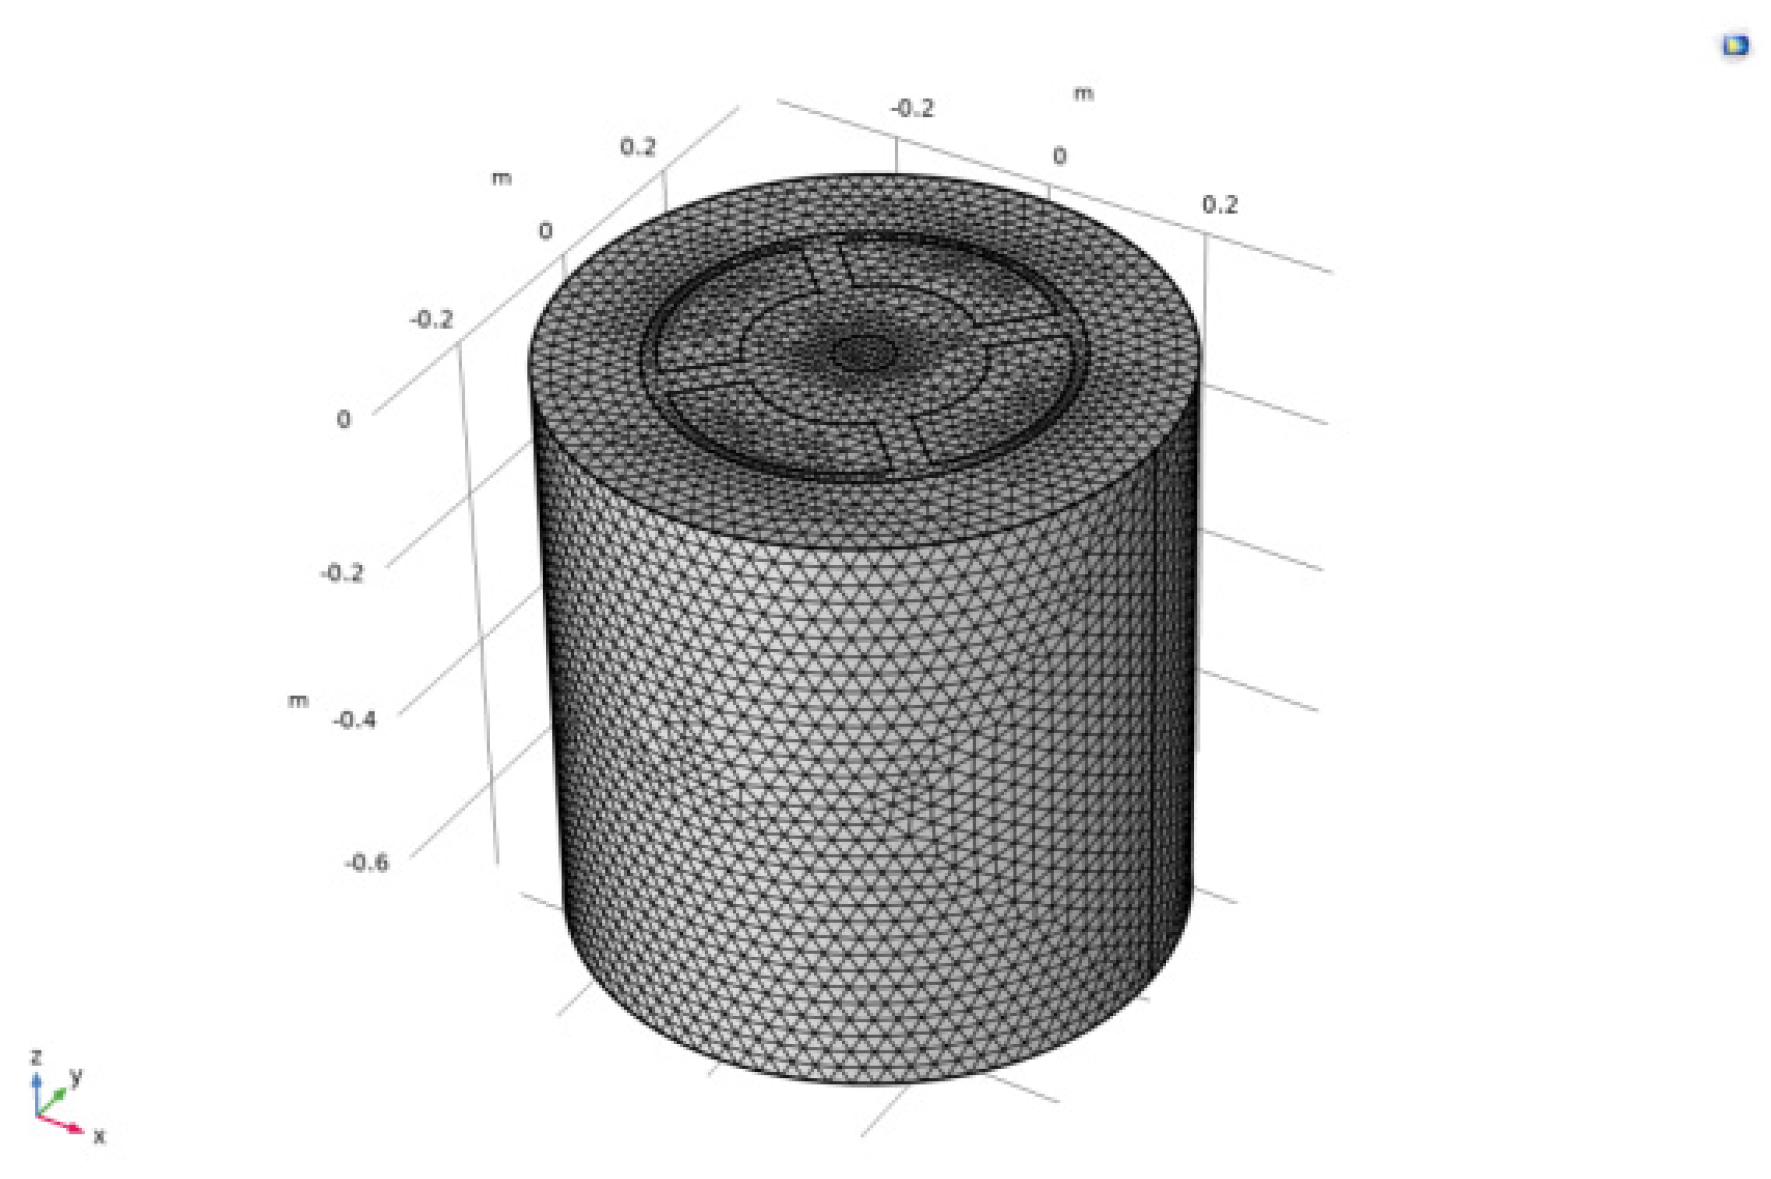
Modeling the 6KA rare earth electrolysis cell using Comsol 6.0 finite element software. The model consists of a graphite anode, an electrolyte, a graphite crucible, a tungsten cathode, and a molybdenum metal receiver. Calibrating the electrolyte grid unit using fluid dynamics. Control the size of grid cells between 0.00268 m and 0.0265 m, The numbers of finite elements are 2512,786.The grid is shown in
Figure 6.
4.2. Model Validation
This paper presents a model for a 6000-ampere rare earth electrolytic cell. By employing the previously described mathematical framework, an electrochemical electric field model for the cell has been developed. With the direct current set at 4010 amperes, the simulated voltage drops at the anode and cathode within the electrolytic cell are meticulously calculated. A detailed comparative analysis is performed to elucidate the distinctions between the conventional electric field model and the electrochemical electric field model. The precision of the simulation is substantiated through a rigorous comparison with empirical data obtained from on-site measurements using a multimeter.
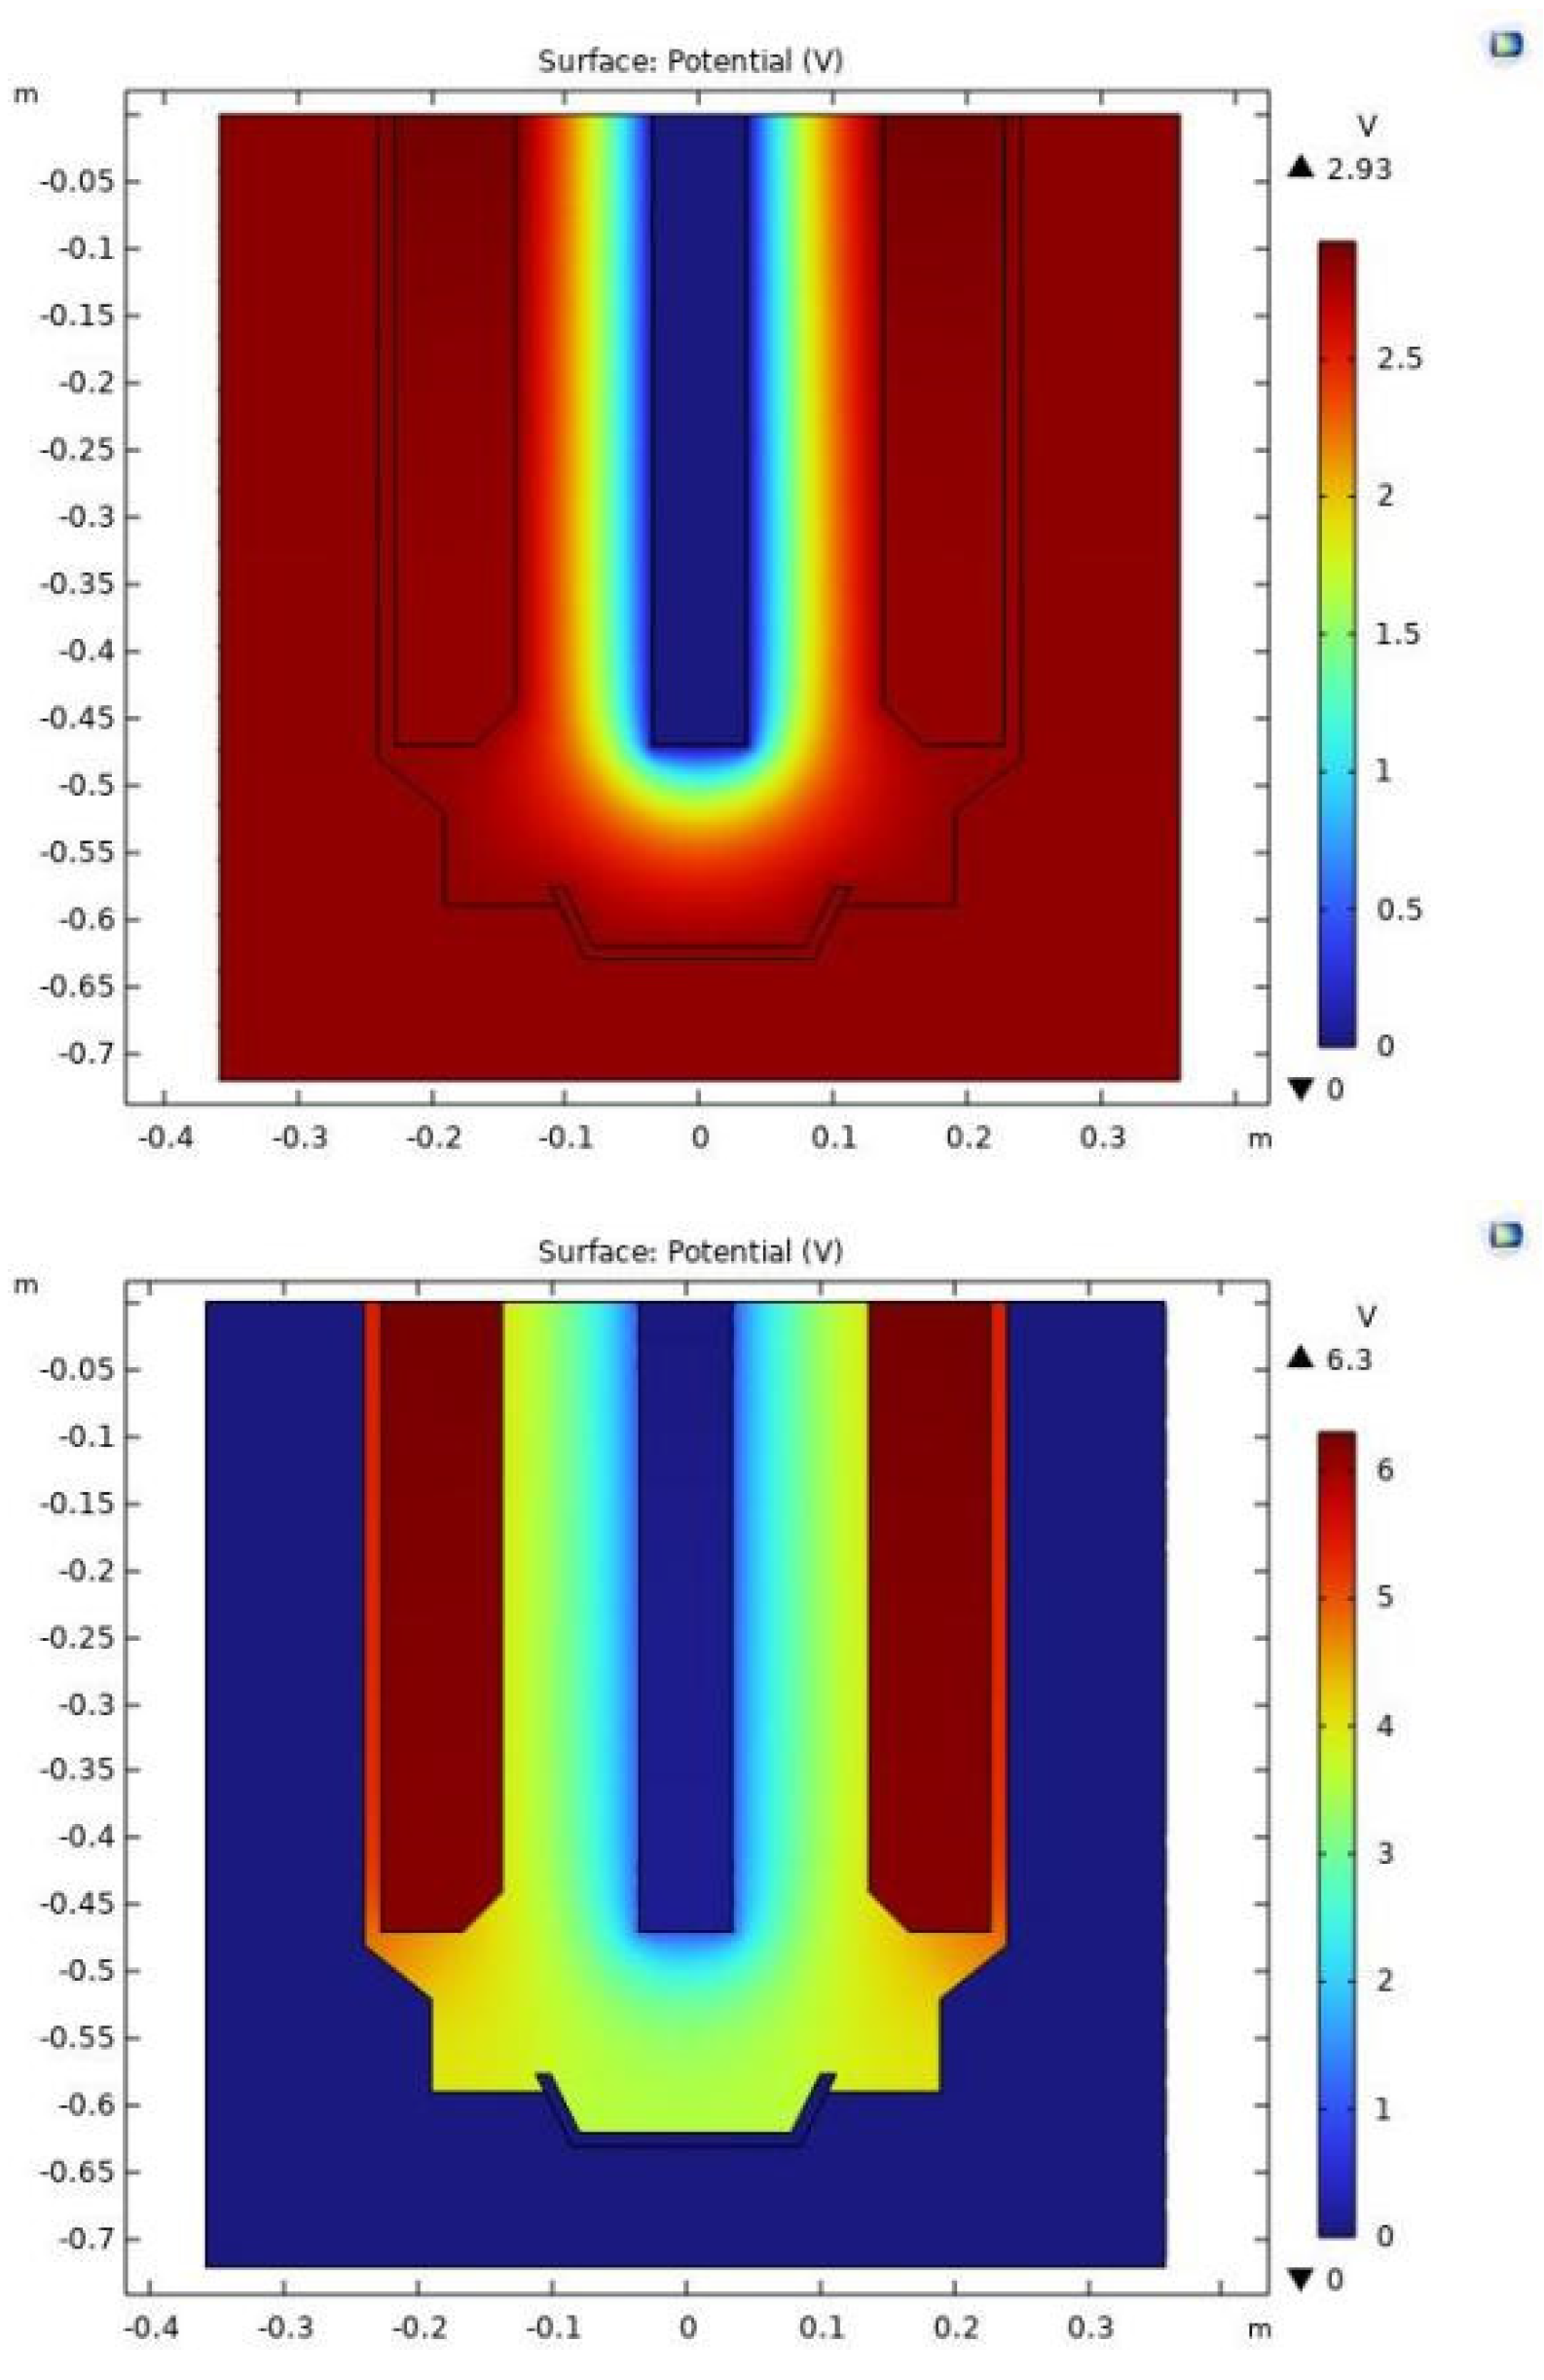
Figure 7(a) presents a conventional electric field model, which is markedly distinct from the field constructed by the holographic electric field model shown in
Figure 7(b). In the traditional model, current permeates the entire structure, with the peripheral graphite crucible holding a significant potential. In contrast, the holographic model indicates no current flow through the graphite crucible surrounding the electrolytic cell, assigning it a potential of zero, which is more reflective of real-world conditions. While the traditional model falls short in precisely simulating the voltage between the anode and cathode, the actual measured voltage drop is recorded at 6.28 volts. The variance between the measured and actual values amounts to 3.35 volts, providing only an approximation of the voltage drop within the molten state. The conventional model overlooks key elements such as electrochemical polarization, concentration polarization, electrolyte diffusion, convection, and electromigration at the electrode-electrolyte interface. The holographic electric field model, based on Maxwell's electromagnetic field equations, extends to derive the reaction formula at this interface. Consequently, the electric field forecasted by this model mirrors the actual electric field during rare earth electrolysis more closely. The simulation yields a voltage of 6.3 volts, a mere 0.02 volts above the 6.28 volts measured by the on-site multimeter, with an error margin of approximately 0.3%. Hence, the electrochemical electric field model adeptly captures the electric field distribution within rare earth electrolysis cells.
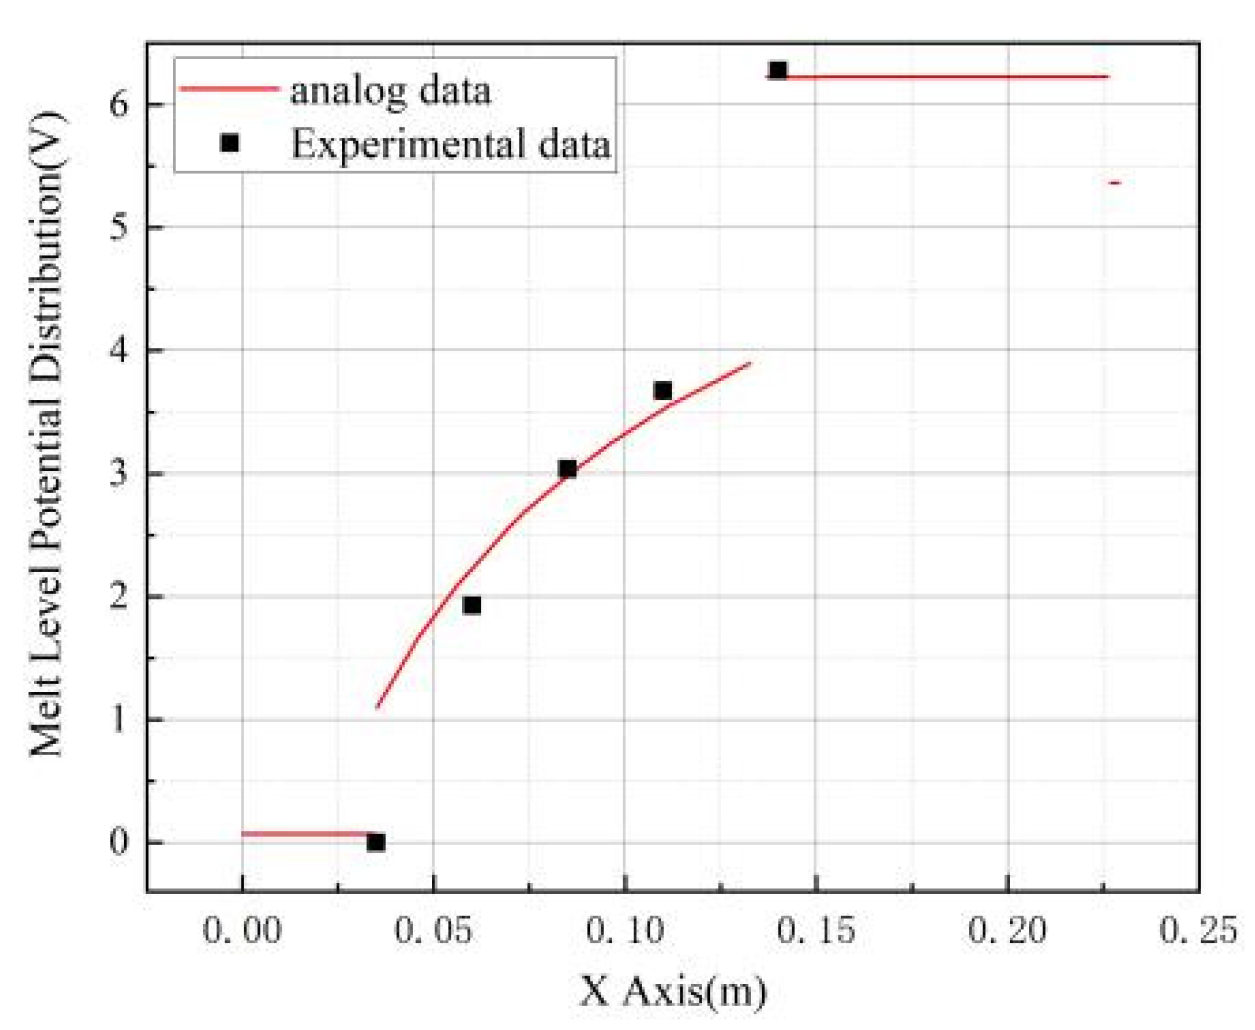
To further validate the precision of the model, we conducted a comparison between the experimentally measured liquid level data and voltage drop values at the anode and cathode of the electrolytic cell, and the simulated data, in the context of minor fluctuations in the axial potential distribution of the molten material. As depicted in
Figure 8, the experimentally measured liquid level potential aligns seamlessly with the simulated data. Additionally, the voltage drop between the anode and cathode, as ascertained through experimental determination, is in concordance with the simulated values. These findings collectively substantiate the model's accuracy and reliability.
Figure 8 illustrates a pronounced voltage leap at the interface between the electrode and the electrolyte in the numerical simulation, a result of the potential difference induced by the double electric layer at the interface. The combined interfacial potential difference at the anode and cathode amounts to 1.87 volts, which is the actual voltage required for the electrolytic cell to undergo decomposition. When compared to the total interfacial potential difference of 1.747 volts between the two electrodes, a slight variance of 0.123 volts is observed, equating to an error margin of around 5%. The simulated sum of local interfacial potential differences presented in
Figure 8 closely aligns with the experimentally determined decomposition voltage data. By substantiating the voltage drop across the anode and cathode, the distribution of the voltage drop within the melt, and the actual voltage for decomposition, this model lays a robust theoretical groundwork for future simulation endeavors, ensuring the precision of simulation outcomes.
4.3. Electrolyte Voltage Drop
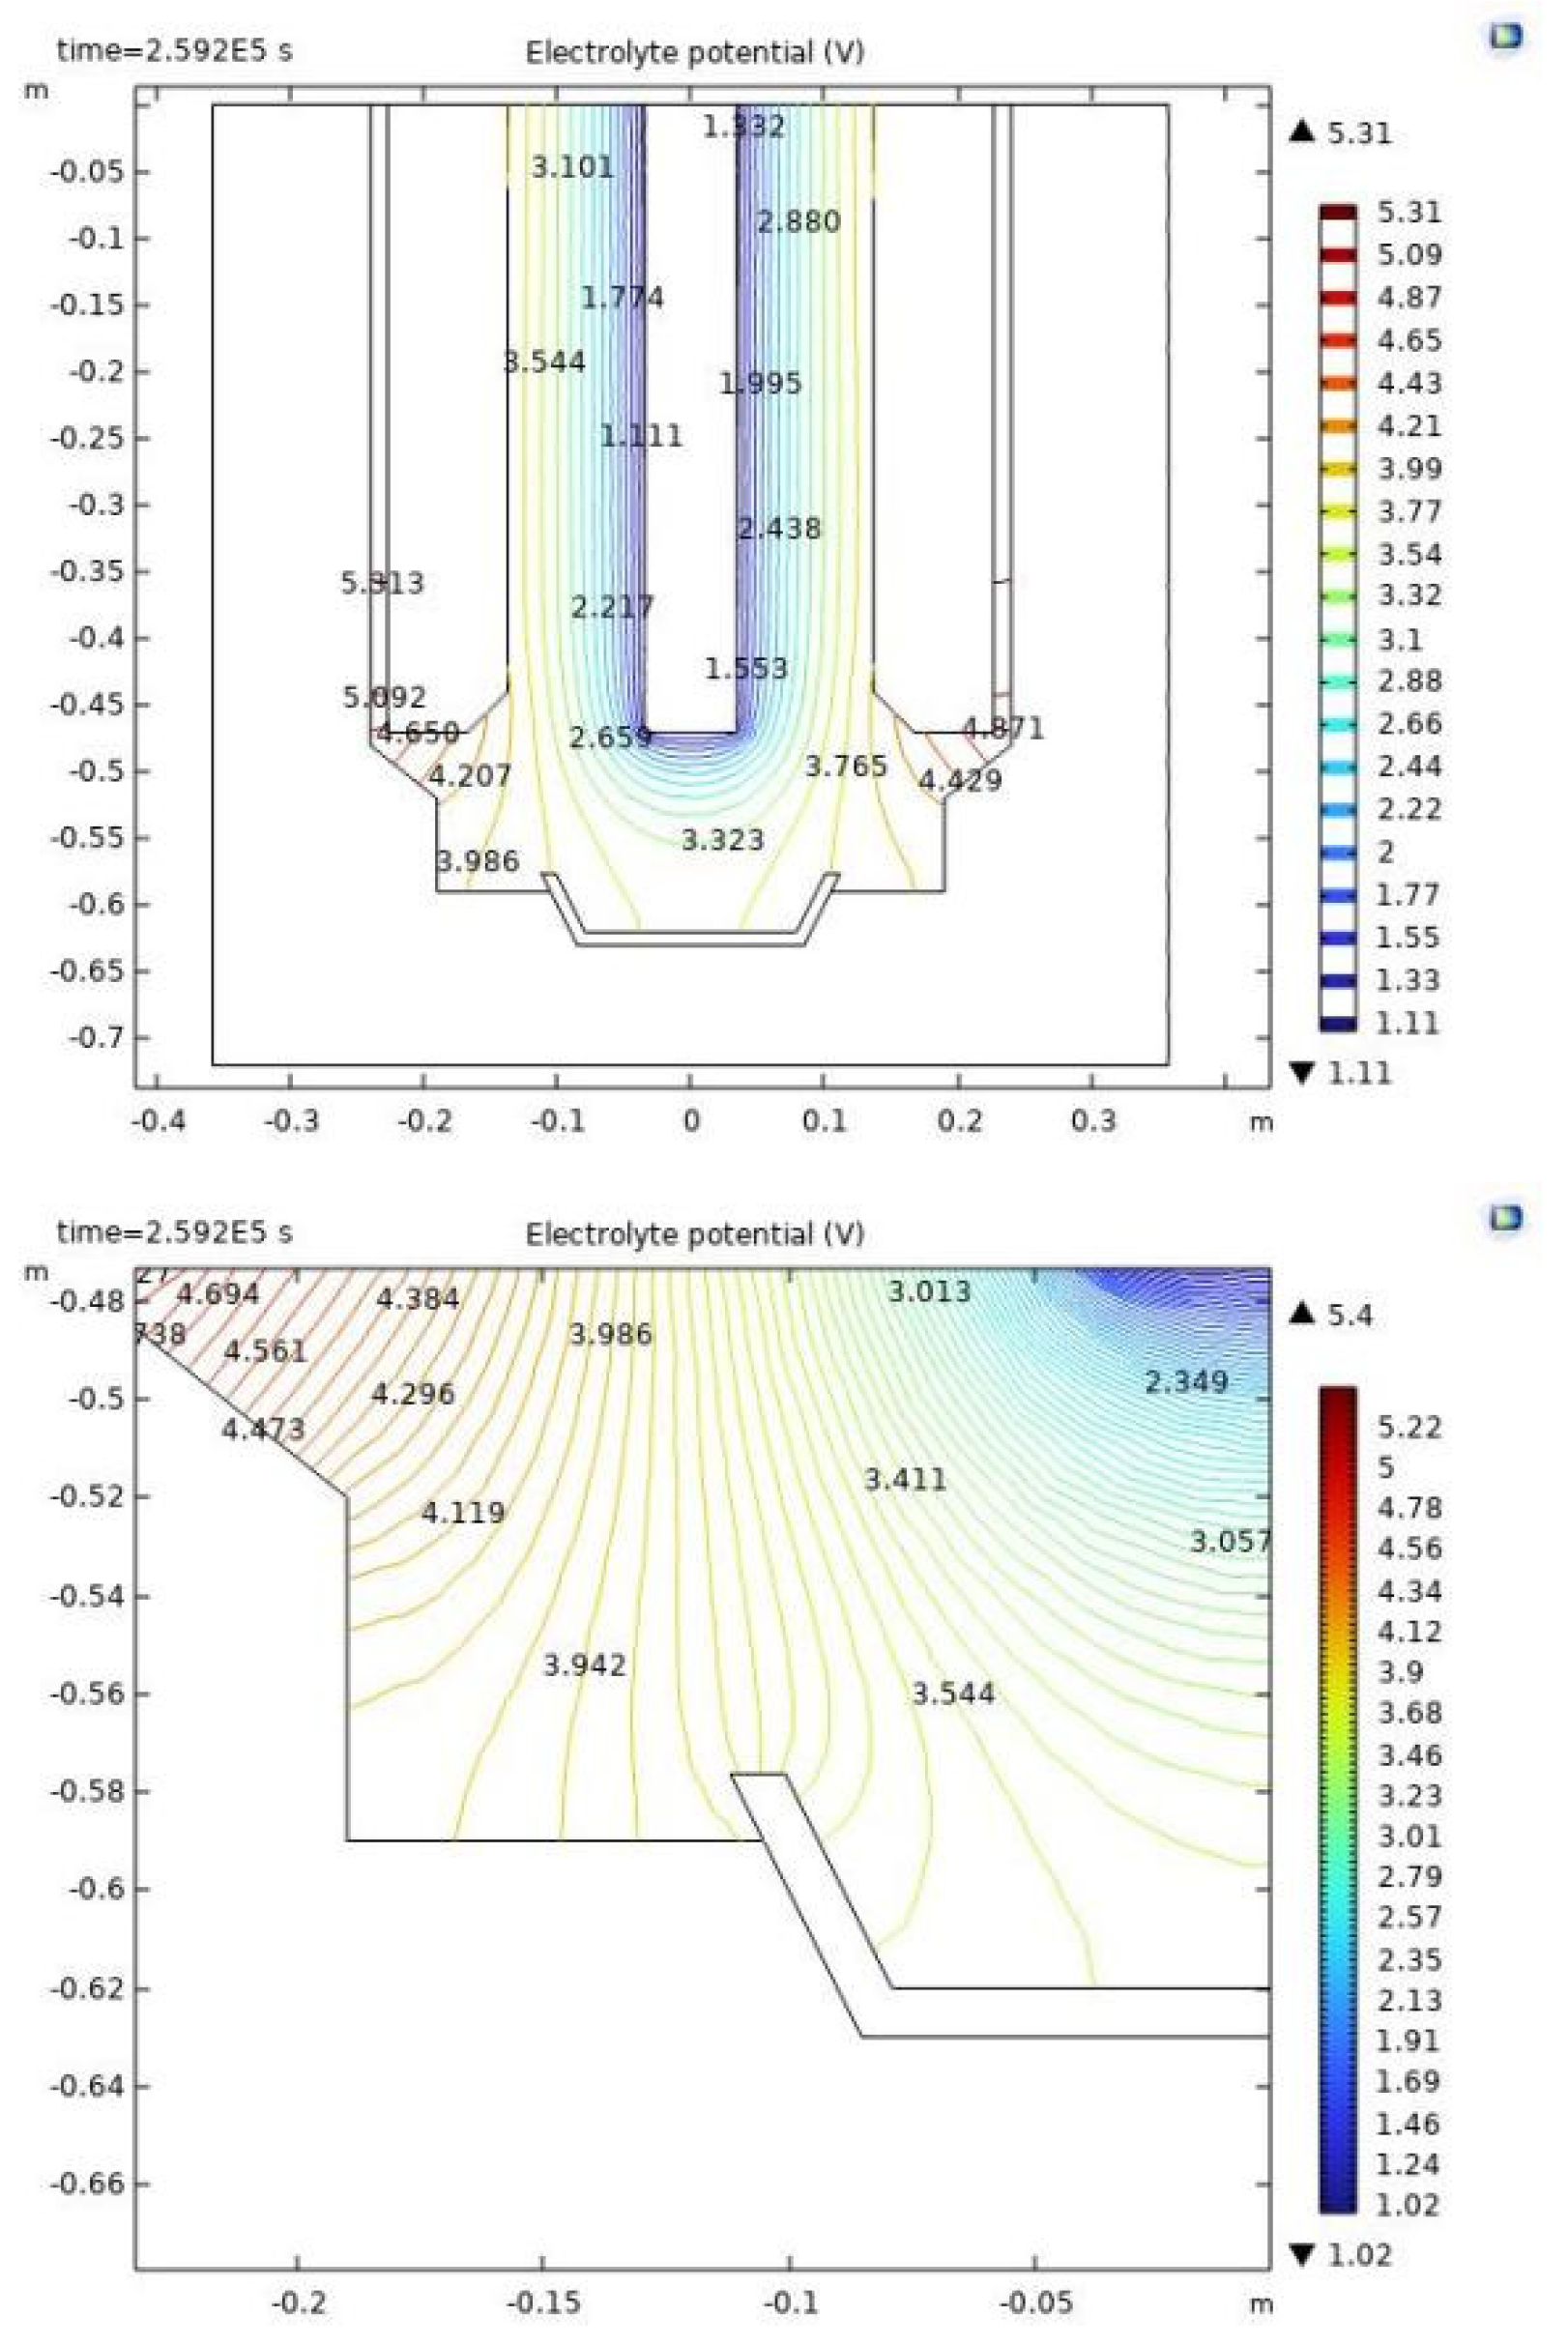
Utilizing simulation methodologies, we have delineated the distribution of electrolyte potential within the electrolytic cell, as illustrated in
Figure 9. The shifts in electrolyte potential are predominantly focused in the central zones of the anode and cathode, as well as the lower sector of the cathode. The critical area for the electrolysis of rare earths is demarcated between the anode and cathode, characterized by densely packed potential contour lines that escalate from the cathode to the anode, culminating in the anode's surface where the potential gradient is at its zenith. This aligns with the fundamental electrical behavior of current ingress at the anode and egress at the cathode. Within the cathode's lower region, the rate of potential alteration is notably subdued. The interior of the metal receiver experiences negligible potential fluctuation, facilitating the aggregation of the metal. Nonetheless, discernible potential disparities are observed at the peripheries of the metal receiver's extremities. The localized enlargement in
Figure 9(b) unveils pronounced potential disparities within a confined zone, potentially the underlying reason for the metal receiver's severe corrosion in real-world scenarios. The anode and graphite crucible exhibit negligible potential variance, signifying an imperceptible flow of current.
Additionally, discrepancies are observed between the melt voltage drops calculated by the holographic electric field model and the conventional electric field model. The holographic model reports a melt voltage drop of 4.43 volts, in contrast to the 3.36 volts indicated by the conventional model, highlighting a variance of 1.07 volts. This divergence is elucidated by Equation (7), which correlates the melt pressure drop with the cathode surface's current density.
In the formula:Ee—Theoretical voltage drop of electrolyte;ρe—Resistivity of electrolytes;DK—cathode current density;r—Cathode radius;DA—Anode Current Density
In conventional electric field models, the influence of geometry on voltage is the sole consideration, which typically results in an underestimation of the melt voltage drop. In contrast, the holographic electric field model transcends this limitation by taking into account more than just geometric parameters. The model accounts for the dynamic interplay of concentration and electrochemical polarization at the electrode interface, effectively introducing a resistance in series with the electrode-electrolyte junction that matches the polarization value. When the electrode experiences an unusually high current density, the polarization and the associated voltage drop escalates accordingly. This phenomenon induces significant variations in the actual current density across the electrode surface, exerting a profound impact on the melt voltage drop. The simulation's indication of a reduced melt voltage drop to 4.43 volts aligns well with practical observations.
4.4. Voltage Drop between Cathode and Anode
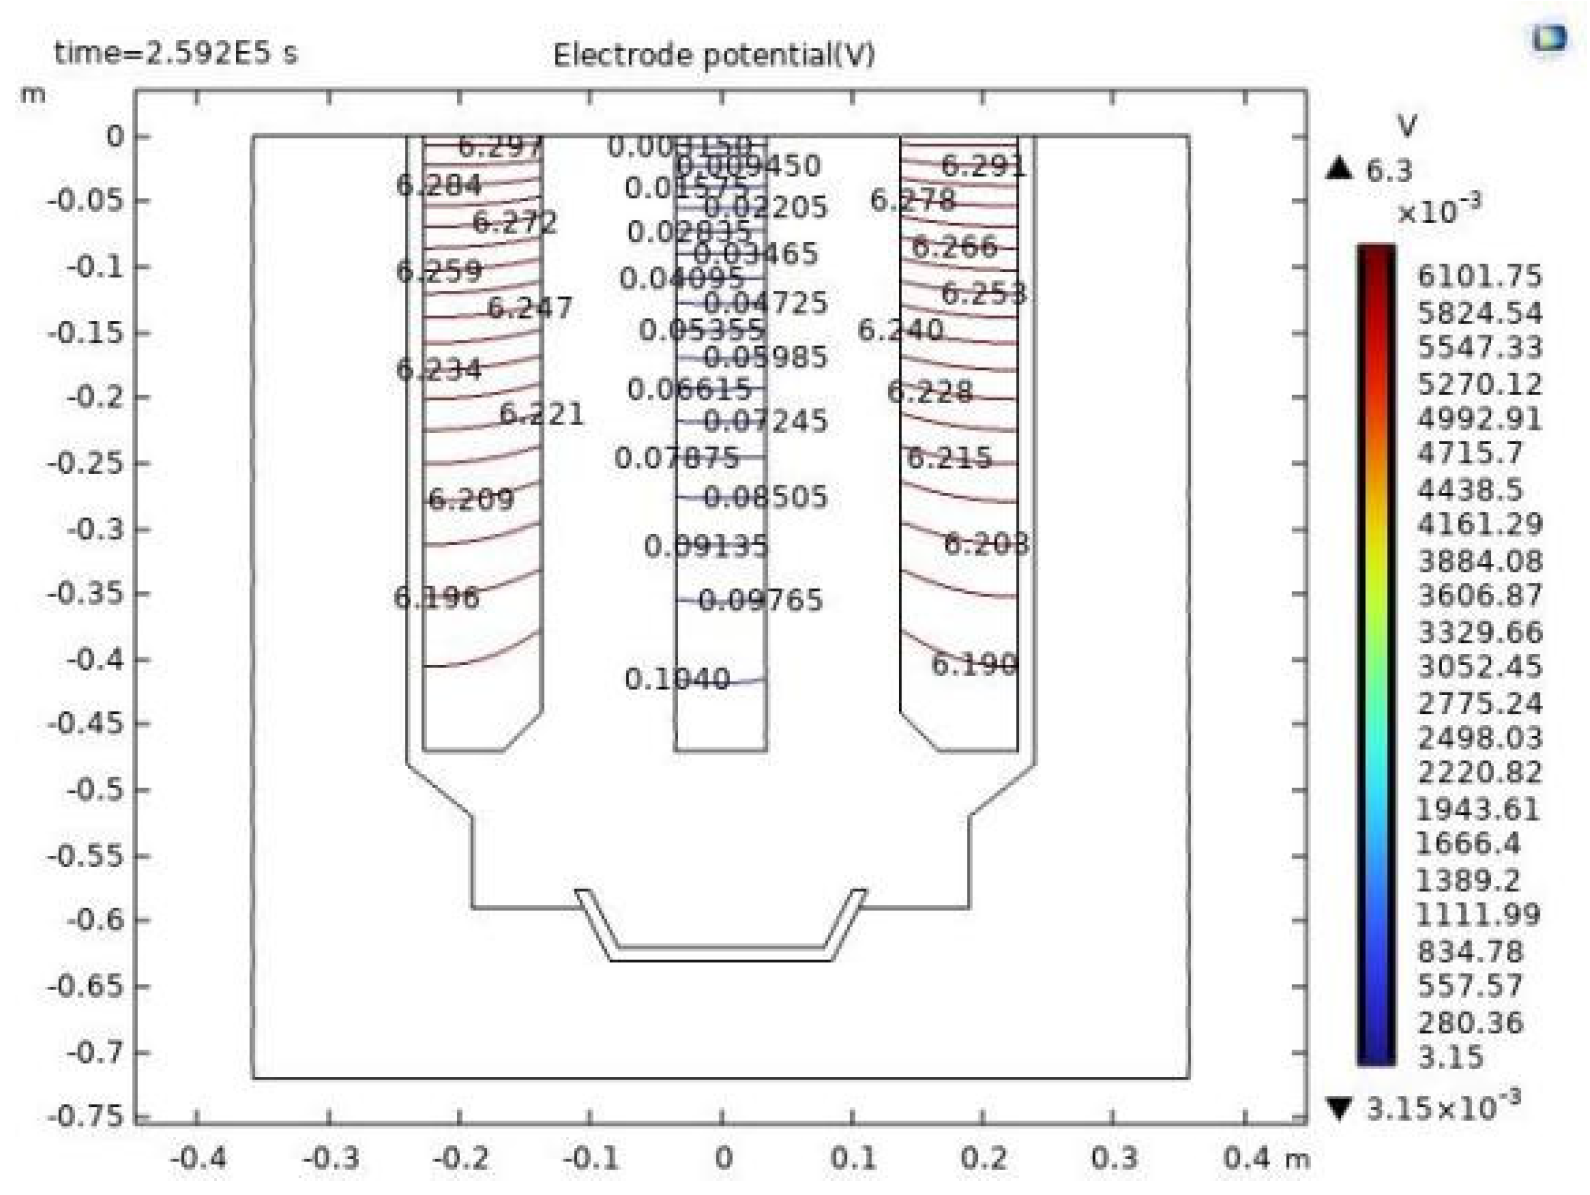
The cathode in this model is expertly fashioned from tungsten metal, and the anode is constructed from graphite. As premier conductors, they dutifully comply with Ohm's Law. The simulated anodic voltage drop measures 0.142 volts, whereas the cathodic voltage drop is recorded at 0.106 volts.
Figure 10 provides a detailed depiction of the voltage drop distribution across both the cathode and anode. It vividly illustrates that the potential of the tungsten cathode rod ascends with increasing longitudinal depth, while conversely, the potential of the graphite anode diminishes with depth. In the horizontal plane, the potential of the tungsten cathode rod maintains a steady state, and the potential of the graphite anode experiences minor variations, descending progressively as it diverges from the cathode.
4.5. Actual Decomposition Voltage
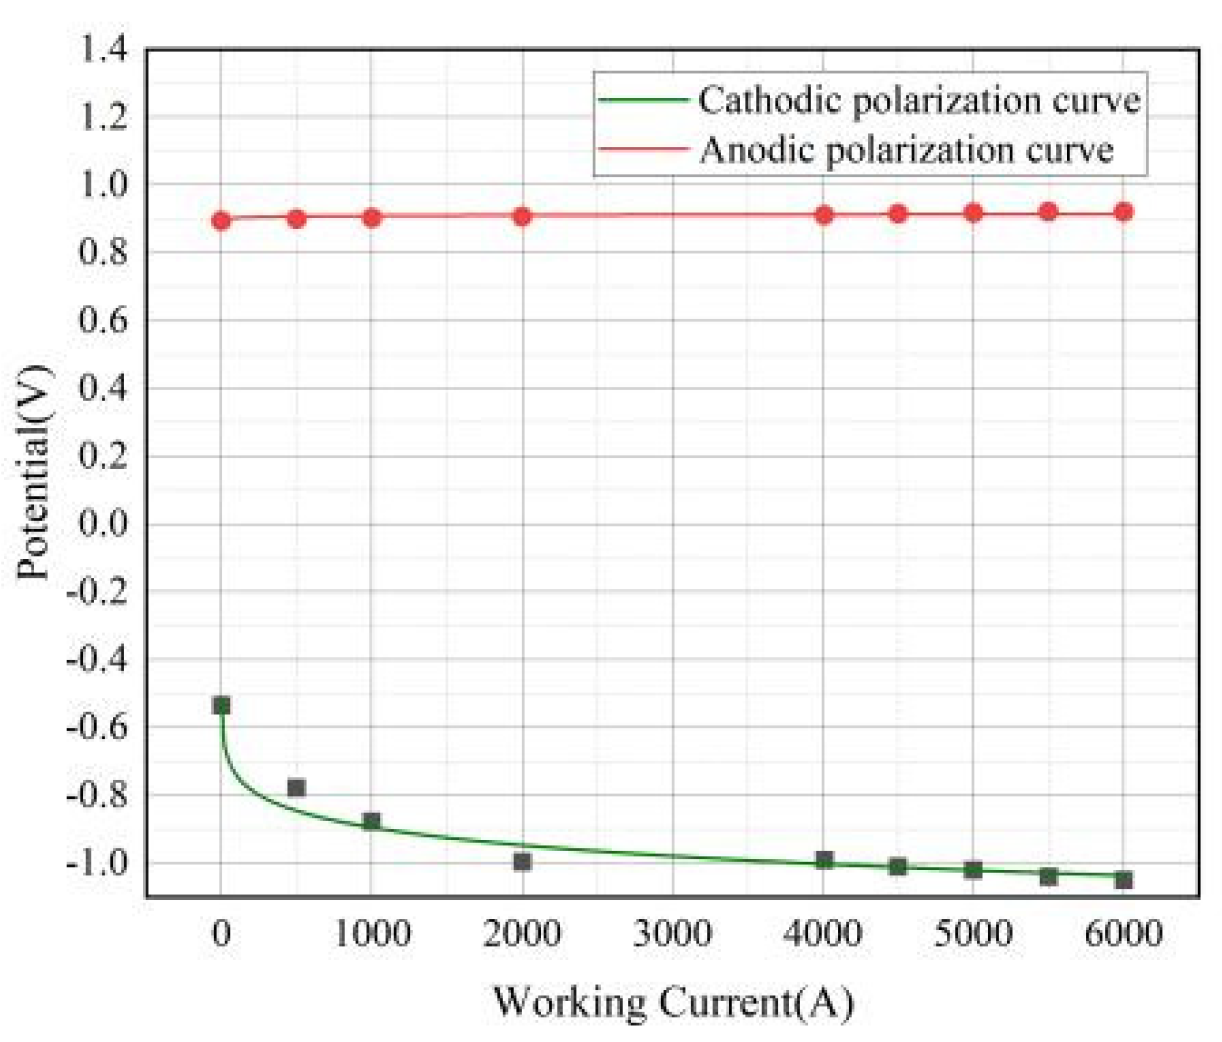
In real-world electrolytic processes, the electrolysis rate is a critical parameter to consider. Electrolysis can only be achieved when the applied voltage surpasses the theoretical decomposition voltage drop. Thus, the actual decomposition voltage includes both the theoretical voltage and the overvoltages at the anode and cathode. The currents discussed herein conform to Faraday's laws of electrolysis. An analysis is conducted on the interface area located 0.1 meters above the liquid surface, and voltage information is gathered by scanning the model with varying currents. After accounting for and eliminating the effects of the melt's ohmic voltage drop, the polarization curves for the cathode and anode are plotted, as illustrated in
Figure 11. The separation between these curves signifies the actual decomposition voltage.
In the electrolytic cell, the anode's potential is higher than that of the cathode, as shown in
Figure 8. When current is applied, the electrodes undergo polarization. The anode's potential shifts towards a more positive value, while the cathode's potential shifts towards a more negative value. As the current density increases, the separation between the polarization curves expands, corresponding to an increased energy consumption. With an increase in current, the cathodic polarization curve experiences notable alterations. The anodic polarization curve changes more gradually due to the larger surface area of the anode and the inherent difficulty in influencing it. Overpotential is the potential difference that arises from electrode polarization. As indicated in the figure, the anodic overpotential is 0.02 volts, the cathodic overpotential is 0.49 volts, and the theoretical decomposition voltage for Nd
2O
3, under a current of 4010 amperes, is 1.36 volts.
4.6. Voltage Balance of Electrolytic Cells
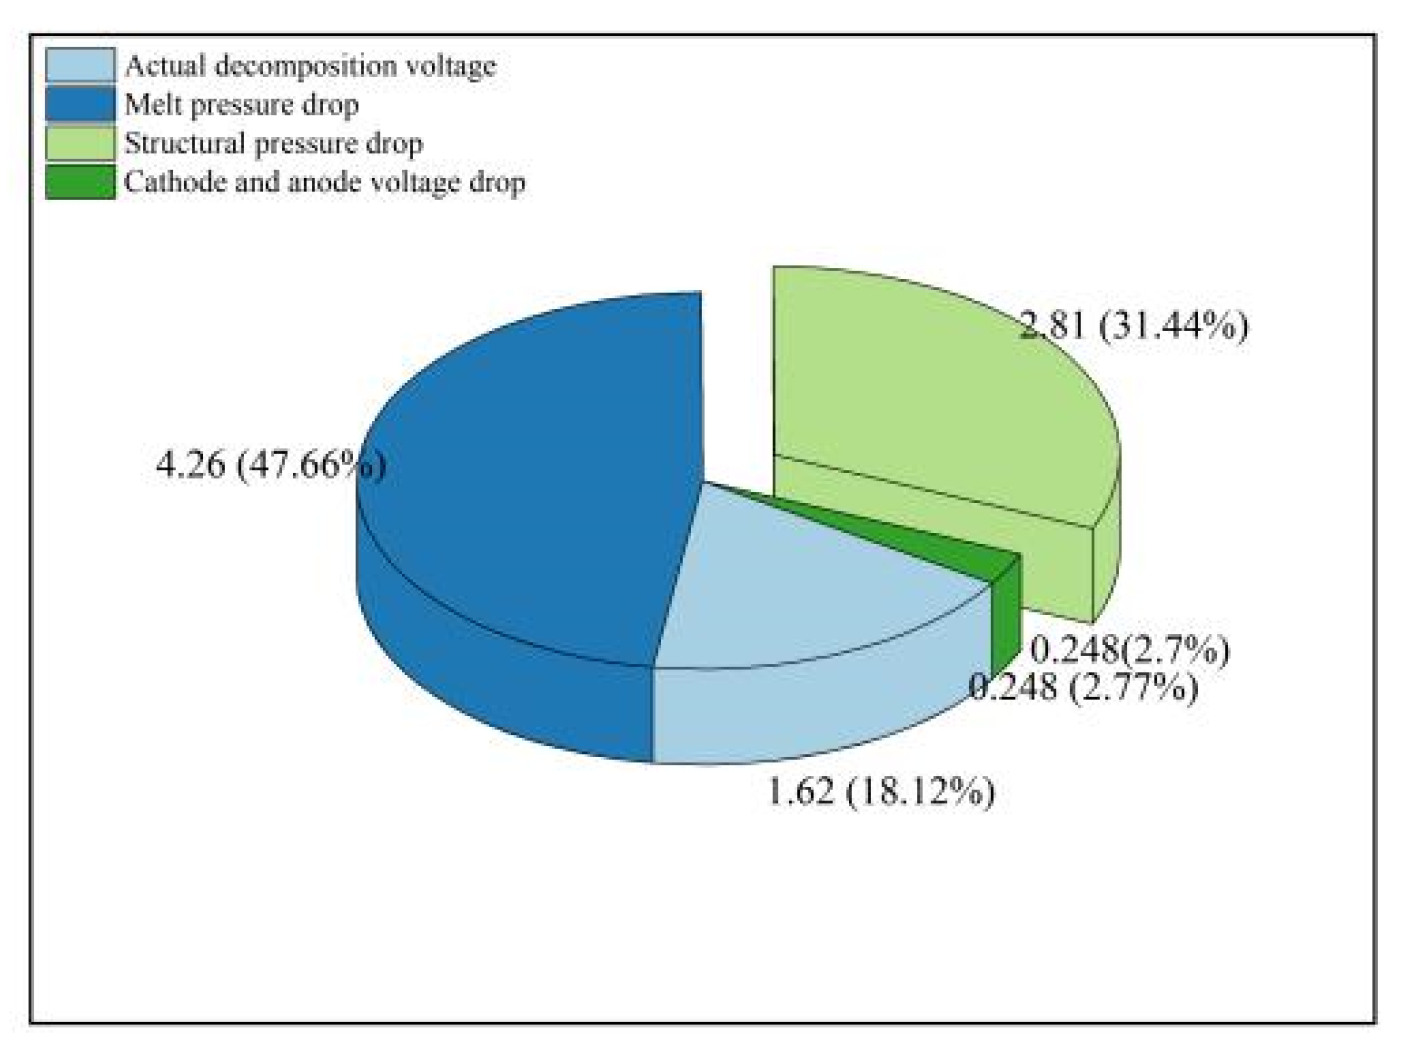
Figure 12 delineates the voltage equilibrium within the electrolytic cell, with data culled from numerical simulations and empirical measurements. The voltage drop specifically highlighted in the diagram is the structural voltage drop, standing at 2.81 volts and comprising 31.44% of the overall cell voltage, deemed an ineffectual voltage drop in the course of electrolysis. The excessive structural voltage drop is primarily attributed to the substantial voltage drop at the junction between the cathode tungsten and copper weld, estimated at around 1.48 volts. This is in stark contrast to the aluminum electrolytic cell structure, where such a drop constitutes a mere 5% of the total, suggesting ample room for enhancement in the rare earth cell design.
Post the elimination of the structural voltage drop, the residual figure represents the voltage drop across the anode and cathode, clocking in at 6.3 volts. When juxtaposed with the actual measured anode-to-cathode voltage drop of 6.28 volts, the discrepancy is a negligible 0.3%. The electrolyte's voltage drop is recorded at 4.43 volts, accounting for 47.66% of the aggregate cell voltage. The cumulative ohmic voltage drop across both the cathode and anode is 0.248 volts, representing a modest 2.7% of the total cell voltage. Influenced by positional and other factors, the actual decomposition voltage may exhibit some fluctuation, oscillating between 1.62 volts and 1.87 volts. Upon the exclusion of the ohmic voltage drop's impact on the cathode and anode, the figure settles at 1.62 volts, which corresponds to 18.12% of the total cell voltage.
5. Conclusion
Incorporating the Nernst-Planck and Butler-Volmer equations within the framework of Maxwell's equations, a holographic electrochemical electric field model has been meticulously crafted. This model achieves a remarkable simulation precision with an error margin of merely 0.3%. It stands as a powerful tool for accurately replicating the electric field distribution in the process of rare earth molten salt electrolysis, thereby providing a solid theoretical foundation that enhances our comprehension of the underlying electrolytic mechanisms and paves the way for the refinement of electrolytic techniques.
Acknowledgments
This research was supported by the National Natural Science Foundation of China(51964039); Inner Mongolia Natural Science Foundation Project(2022LHMS05004,2021GG0103, 2024RCTD008); Open Fund Project of State Key Laboratory of Baiyunebo Rare Earth Resources Research and Comprehensive Utiliza-tion(2021H2275).
References
- The Editorial Board of 'Nonferrous Metal Metallurgy' has authored the 'Chinese Metallurgical Encyclopedia' [M]. Published by Metallurgical Industry Press, Beijing, November 1998.
- Liu Z X, Shi H M, He Y D, Ni J Z. Computer simulation of the electric field [J]. Journal of Baotou Iron and Steel Institute,2003(1): 29-31, 35.
- Li R C, Yang X D, Wang K, Ni J Z. Research Progress of Bioinorganic Chemistry of Rare Earths [J]. Journal of the Chinese Society of Rare Earths, 2004, 22(1):1.
- Wang J L, Yang Y Q. Electric field analysis of rare earth molten salt electrolytic cell based on Comsol[J]. Nonferrous Metals Science and Engineering, 2016, 7(6): 30-34.
- Wu Y F, Liu Z X, Li Z T. Numerical simulation of the electric field [J]. Non-ferrous metals (smelting part), 2010(03):27-30.
- Lv X J, Zhang H X, Li S, Zeng X P. Effect of anode consumption of rare earth metal electrolytic tank on electric field [J]. Chinese Journal of Rare Earth Sciences, 2019,37(04):481-490.
- Zhang H X, Lv X J, Zhong S p, Wang J E, Liu S, Zeng X P, Jian Y Z. Electric field simulation and optimization of cathodic structure [J]. Chinese Journal of Rare Earth Sciences, 2020,38(05):667-676.
- Ren Yonghong, Wang Jinbao, He Youduo, Liu Zhongxing. Electric Field Calculation and Channel Voltage Analysis of Rare Earth Electrolytes [J]. Journal of Baotou Iron and Steel College, 2003 (04): 313-317.
- Chen G H, Wang X Q, Zhang Z H, Liu Z X, Wu Y F. Yongfu. Voltage balance calculation of rare earth molten salt electrolytic cell [J]. Rare, 2013,34(01):86-89.
- Werner J M, Zeng W, Free M L, Zhang Z, Cho j.Modeling and Validation of Local Electrowinning Electrode Current Density Using Two Phase Flow and Nernst-Planck Equations[J]. Journal of The Electrochemical Society,2018,165(5):E190-E207.
- Zeng W Z, Free M L, Werner J, Wang S J.Simulation and Validation Studies of Impurity Particle Behavior in Copper Electrorefining[J].Journal of The Electrochemical Society,2015,162(14):E338-E352.
- Zeng W Z, Werner J, Free M L.Experimental studies on impurity particle behavior in electrolyte and the associated distribution on the cathode in the process of copper electrorefining[J].Hydrometallurgy,2015,156:232-238. [CrossRef]
- Hemmati H, Mohebbi A, Soltani A, Daneshpajouh S.CFD modeling of the electrolyte flow in the copper electrorefining cell of Sarcheshmeh copper complex[J]. Hydrometallurgy,2013,139:54-63.
- Volgin V M, Davydow A D.Numerical simulation of natural convection of electrolyte solution with three types of ions in the electrochemical cell with vertical electrodes[J].Russian Journal of Electrochemistry,2010,46(12):1360-1372. [CrossRef]
- Gao P, Zhu Y M, Yu Y C. Electrochemistry 2nd Edition [M]. Chemical Industry Press, 2019.
- LiuK R, Chen J S, Wei X J. Determination of anode overpotential of neodymium electrolysis [J]. Journal of Materials and Metallurgy, 2003(01):38-41.
|
Disclaimer/Publisher’s Note: The statements, opinions and data contained in all publications are solely those of the individual author(s) and contributor(s) and not of MDPI and/or the editor(s). MDPI and/or the editor(s) disclaim responsibility for any injury to people or property resulting from any ideas, methods, instructions or products referred to in the content. |
© 2024 by the authors. Licensee MDPI, Basel, Switzerland. This article is an open access article distributed under the terms and conditions of the Creative Commons Attribution (CC BY) license (http://creativecommons.org/licenses/by/4.0/).
