Preprint
Article

Economy Contractions and the Rental Housing Affordability Situation in the Lagos Property Market: A Short-Term Outlook

Altmetrics

Downloads

65

Views

33

Comments

0

Submitted:

09 September 2024

Posted:

10 September 2024

You are already at the latest version

Alerts
Abstract
With real estate cycles being a subset of business cycles, contraction stages are often perceived as short-term, after which a revival of the property market sets in. The worsening Nigerian economy has further complicated the issues of housing supply and affordability in economic nerves like Lagos. This study examined the fundamental and associated factors contributing to rental housing affordability issues between 2019-2023 in Lagos. This article is produced with the intention of providing a market data update on rental housing price movements for both the mainland and island zones of Lagos, as well as comparing their affordability convenience for income-earners or households based on the rent-income ratio. The study adopted a mixed research design and various data sources were consulted in analyzing the fundamentals, rent and affordability trends. The study discovered that affordability convenience ratios for the various income bands had deteriorated further between 2019 and 2023 in Lagos mainland (8%) and island (9%). 67% and 80% of income earners are paying above the optimal 30% of their personal or household income in meeting their rental demand in Lagos mainland and island respectively. The paper suggested the application of fundamental, institutional and environmental strategies to combating the current phenomenon.
Keywords: 
Subject: Business, Economics and Management  -   Other

1. Introduction

Housing as a psychosocial symbol serves as a basis by which a man assesses his value with his counterparts and as an instrument of interacting with the environment. As such, it is the basic desire of man to afford a dwelling, which identifies him as a progressive social being. Housing affordability is one feature, especially in African emerging economies, since it is a reoccurring dilemma [1]. This recurring dilemma is a subset of a bigger issue; the housing deficit. In Lagos Nigeria alone, the housing deficit has been reported to exceed 2 million units [2,3]. Still, this is often overshadowed by slum dwellings, whose penetration ratio is high in sub-Saharan Africa. [4] noted that 61.7% of sub-Saharan Africa’s population are slum dwellers and this is seen to be growing as [5] observed 62% of sub-Saharan Africa has its urban population residing in slums. These growth levels in slum penetration ratio are the reactionary responses to unaffordable housing or its lack thereof [6].
In comparison, developed economies are witnesses to robust property markets and urban planning systems that can adequately manage their scarce resource (land) in response to growing demand for competitive uses. Thus, the market is prepared to respond to demand and achieve equilibrium in the short term but could be executed slowly due to increases in house prices [7]. This increase in house prices is one of many factors that may influence the housing supply rate or volume and could be governmental or non-governmental influenced [8,9]. With an above-average performing gross domestic product, most developed economies can sustainably regulate the opportunities of home ownership and its affordability, but is this the case with developing economies?
This article reviews the housing affordability situation in three phases; a review of the economic fundamentals witnessed in the nation in the last five years; the rating of affordability convenience and price movement of rental housing and office spaces in the mainland and island zones of Lagos for the past five years; and the possible factors responsible for the sustained price movement. Key indicators that impact housing and by extension, the real estate sector in a country is represented by key fundamentals such as interest rates, inflation rate, Gross Domestic Product, Gross National Income, and exchange rate, amongst others [10,11].

1.1. Statement of Problem

Segments in the Lagos property market is currently undergoing a surge in housing prices for rentals and sales. This phenomenon is gathering momentum at the worst of times; the stagflation period. Both prime and sub-prime zones are not left out in this wave, as affordable alternative housing options are becoming bleak. The bleeding state of the Nigerian economy has set in motion, a ‘total cost-transfer culture’ which has reflected in a basic need of man; accommodation. This phenomenon has come to be referred to as real estate Armageddon. With property cycles dependent on business cycles, it is certain that periods of booms and bursts affect the property market and impact the affordability capacity of potential property users, as they must devise strategies to thrive in them [12]. Therefore, movements in these cycles are occasioned by national, regional, or international forces whose impact may be short-term or long-term. The Nigerian economy has been experiencing a recessed economy since a drop in its GDP in 2022, due to its naira devaluation. Since then, Nigeria has slipped to the 4th largest economy in Africa, and although a shift of dependence on the oil sector to non-oil sectors has been earmarked as a plausible reason for the drop in economic performance, the key issues contributing to this current economic situation have not been adequately addressed.
Thus, with a showdown of unfavorable economic indices in the national and regional areas, the property markets are not shielded from its impact, especially during contraction stages. The Nigerian economy is experiencing some contraction characterized by declined employment, production, and income. If price stabilization and price deflation should feature progressively as described by [13], the reverse is the case in the Nigerian context. Price inflations have been sustained and it appears to be seeking new highs. What is more worrisome is the prolonged state of this contraction stage, as there are no signs of its slowing down and this could likely impact home affordability in the nation and mostly in commercial cities, i.e., Lagos in the short run.

2. Materials and Methods

2.1. National Economy and the Housing Affordability Situation in Sub-Saharan Africa

Countries of the world have been classified into three general classes; developed, economies in transition, and developing economies [14]. These classifications were made with consideration of their gross national income (GNI) which could be high-income, upper-middle income, lower-middle income, and lower income. These classifications are also shared by the World Bank, whose rankings per class are based off Atlas gross domestic product per capita. Economies of the world are classified by [16] into; advanced, emerging market, middle-income economies and low-income developing countries. Their criteria for classification are based on per capita income, export diversification and integration into the international financial system.
Table 1. Gross National Income per capita classification for countries.
GNI PER CAPITA GENERAL CLASSIFICATION SPECIFIC CLASSIFICATION
< $1,035 Developing Countries Low-income countries
$1,036 - $4,085 Developing Countries Lower-middle income countries
$4,086 - $12,615 Economies in Transition Upper-middle income countries
> $12,615 Developed Countries High-income countries
Source: [14].
The importance attached to this classification is shown in the purchasing power of a country’s currency and its potential for development captured in the GNI per capita. There exists the common conception that the propensity of households to afford housing is a reflection of their country’s economic performance. If one is to follow that thought, then advanced economies have a greater propensity for affordable housing than emerging or developed economies. In a study on housing affordability, [18] discovered that housing in more productive cities, tend to be less affordable and housing affordability worsens as city population, urban extent density and regulatory restrictions in land supply increase. Lagos and its ‘seam bursting’ population agrees with [18] discovery and its effect has become evident even in its subprime areas.
Table 2. Gross National Income per capita classification for countries.
GROUP GNI PER CAPITA
Low-income countries < $1,145
Lower-middle income countries $1,146 - $4,515
Upper-middle income countries $4,516 - $14,005
High-income countries > $14,005
Source: [19].
The state of the economy has an overarching impact on housing affordability, as it presents the metrics by which the economic performance of a nation for a fiscal year, can be adjudged. The works of [20,21,22] revealed the impact of a nation’s economic state on the condition of housing affordability within it. Under economic performances rated by international regulatory commissions like The World Bank, International Monetary Fund, United Nations, etc. most nations of the world have been grouped into classes based on their level of development. Nigeria falls in the class of lower-middle-income countries.

2.2. Fundamental Factors Contributing to the Present Contracted Economy

The Nigerian Gross Domestic Product has been witnessing a drop in economic performance before the Global pandemic years, which witnessed an international drop in the economic performance of most nations. From 2019, this drop in economic performance would also be seen in the per capita for both Gross Domestic Product (GDP) and Gross National Income (GNI).
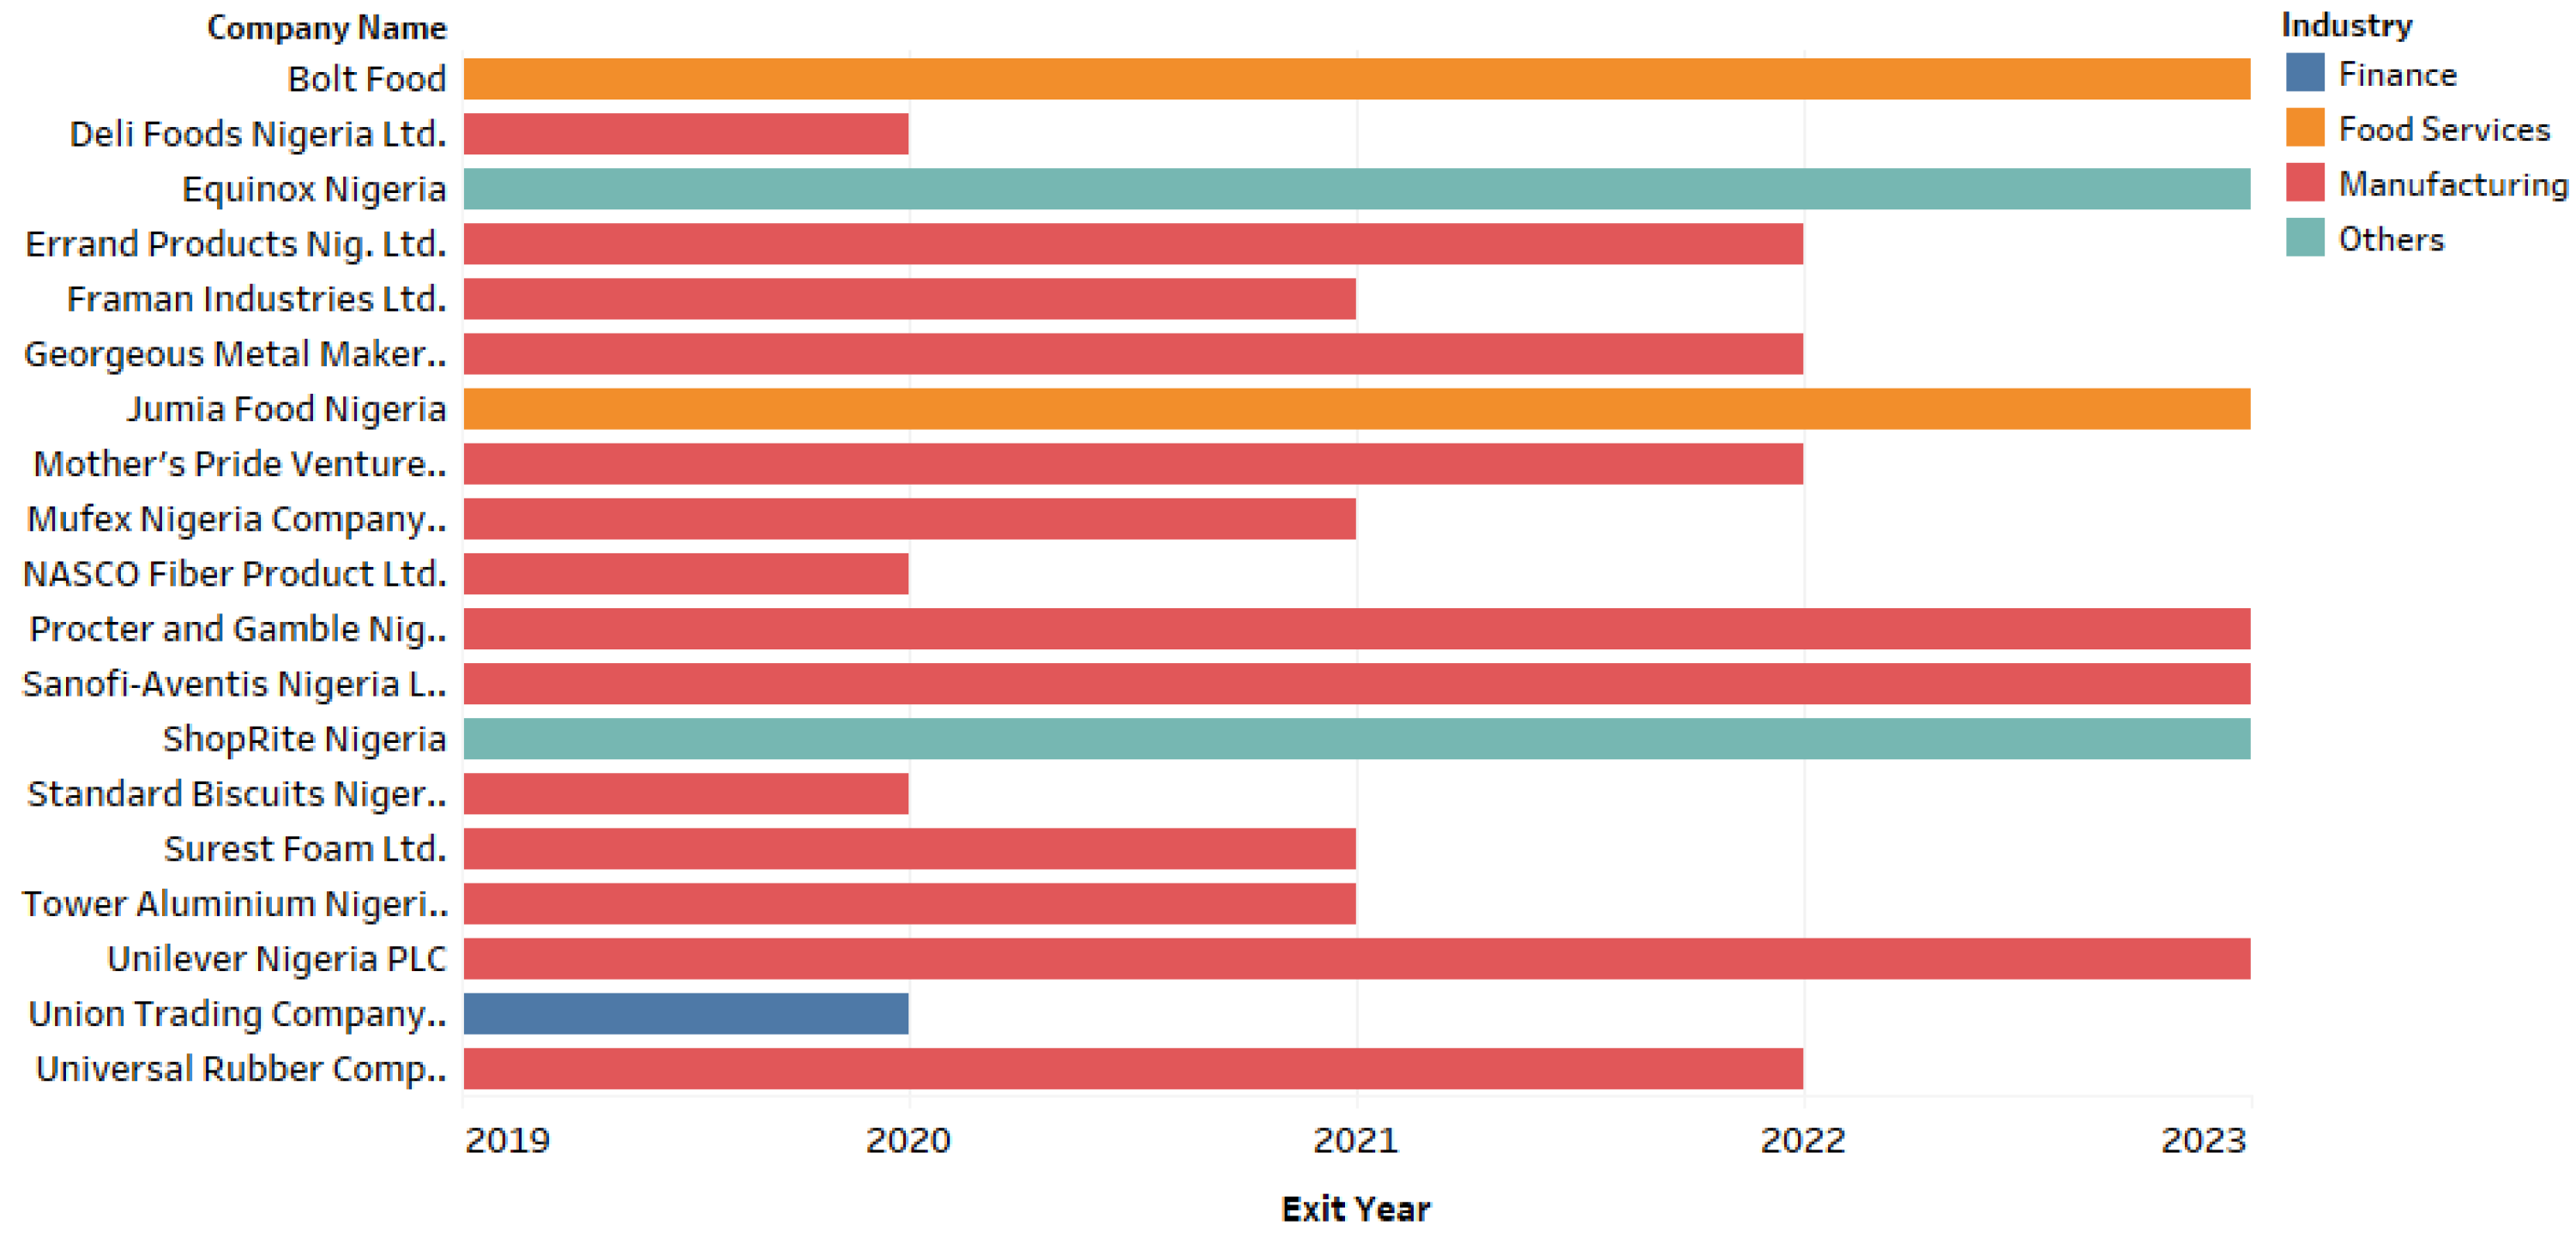
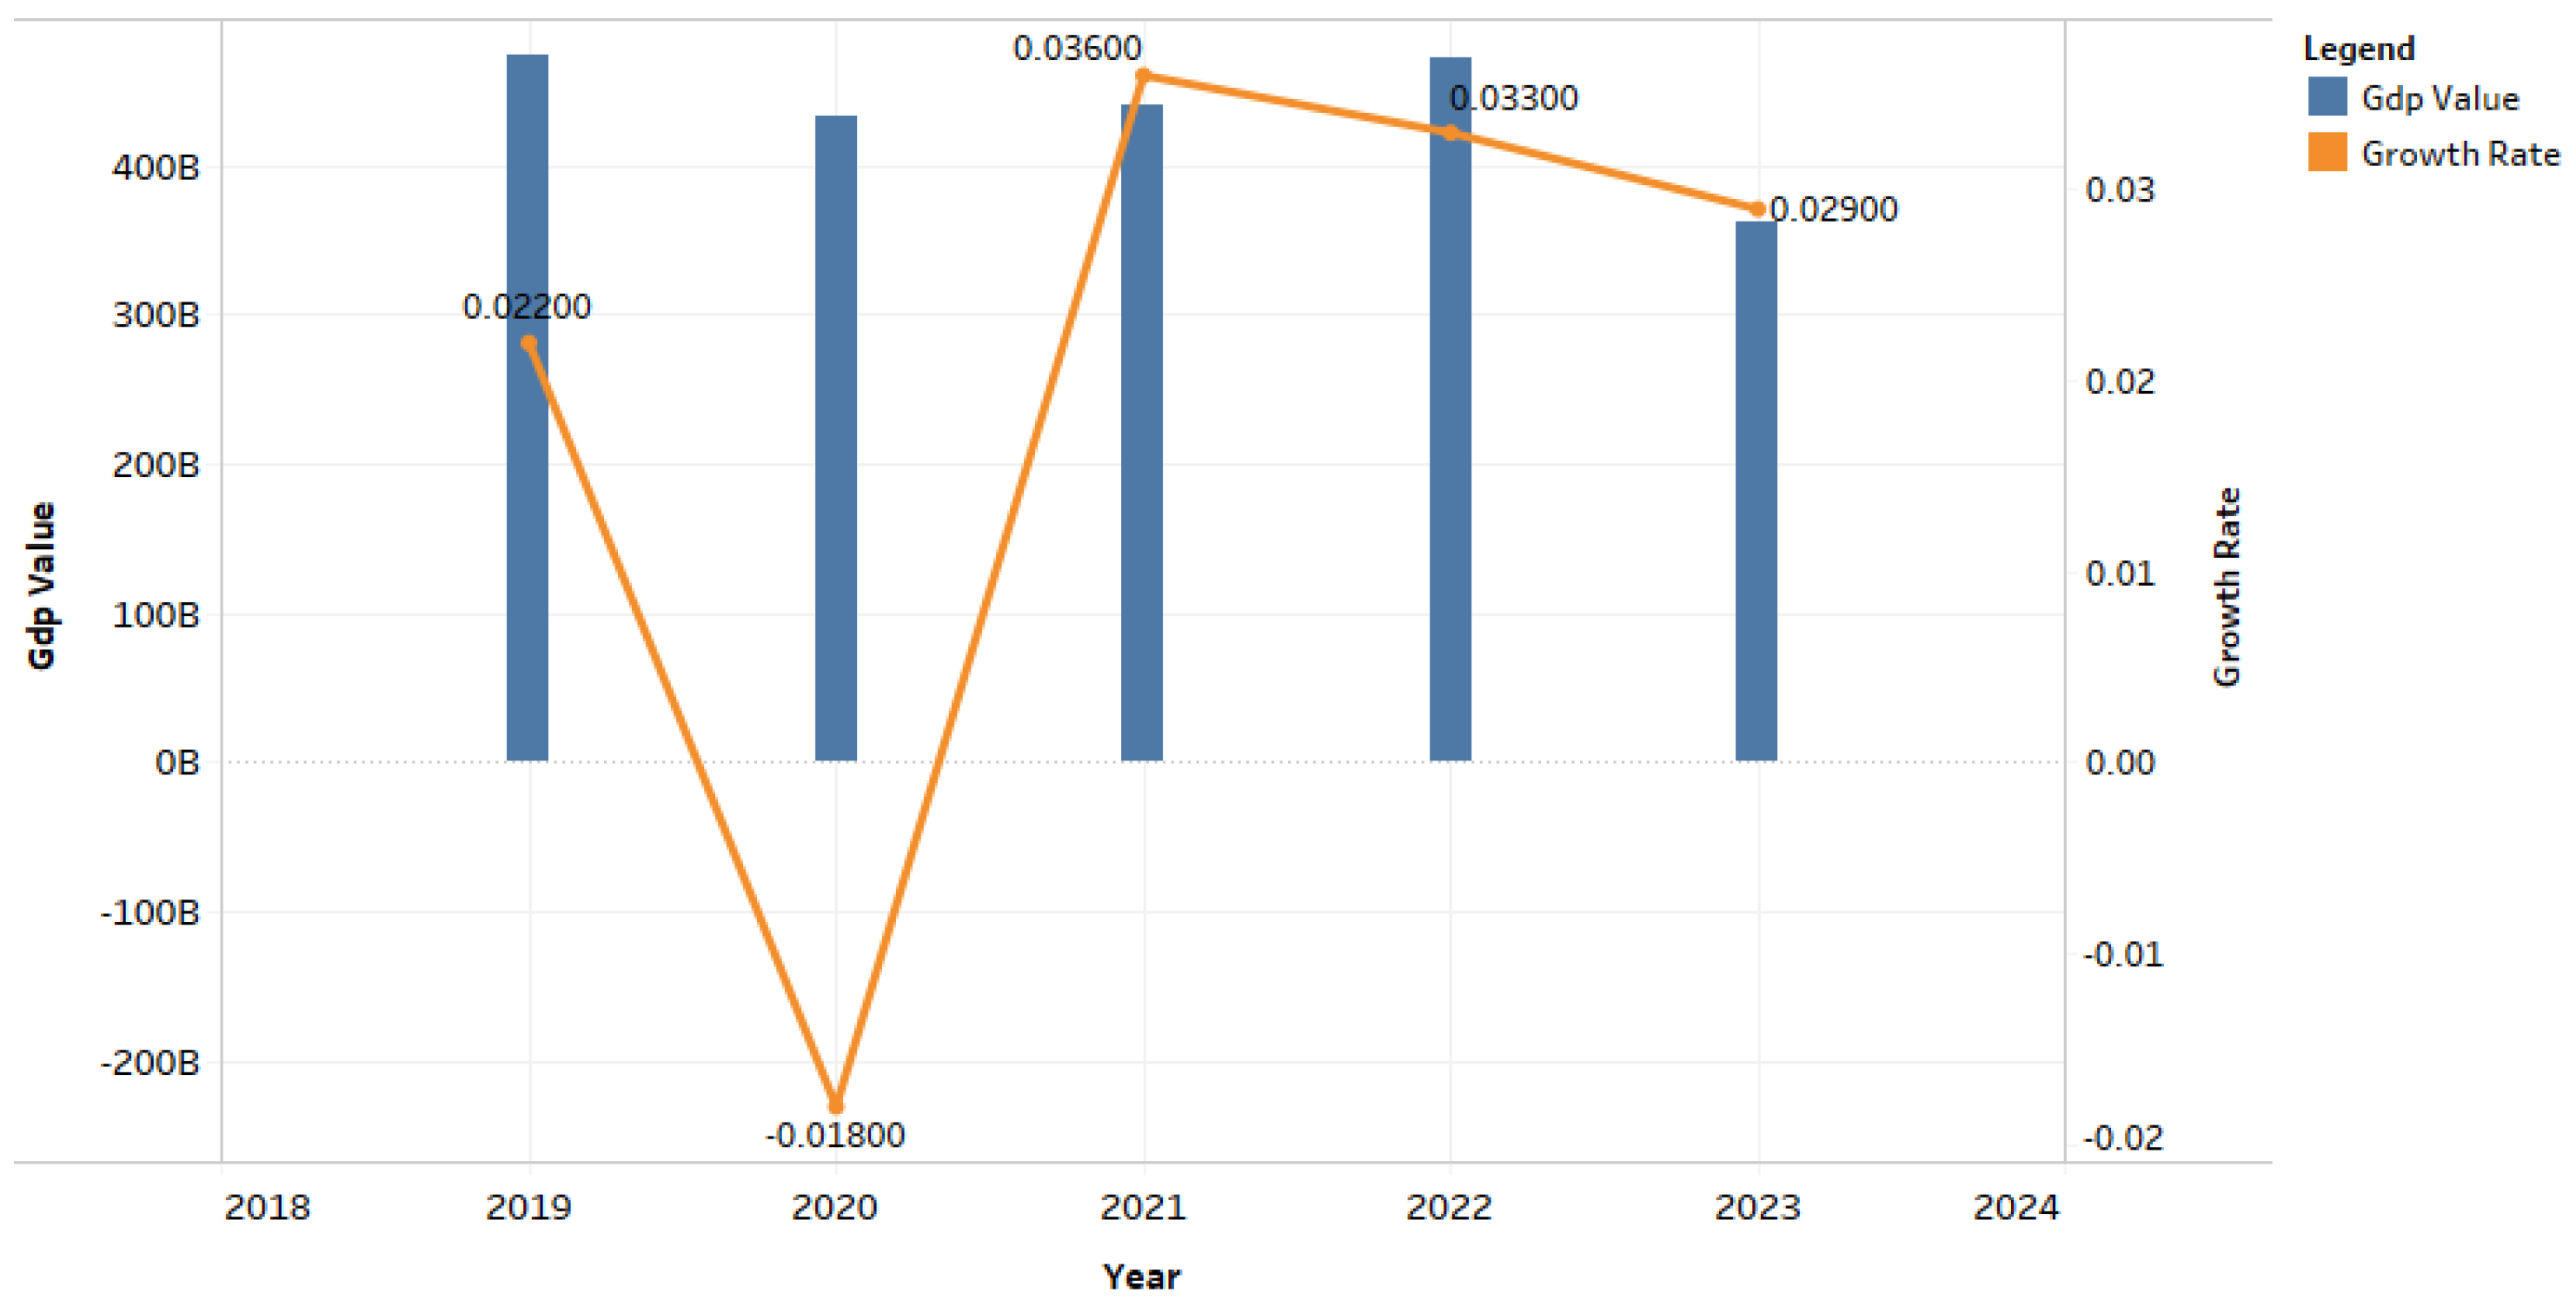
With external shocks playing a role in the recessed economic performance of the nation, the wrong mix of domestic policies has largely been attributed to its poor performance. The issue of fuel subsidy which was powering unsustainable costs and growing domestic and foreign debt, would lead to the government removing the fuel import subsidy. As [23] observed, high macroeconomic instabilities are prone to occur in such removal of fuel subsidies, without the deployment of ‘economic safety nets’ and ‘adjusted mechanisms’ to cushion the harsh impact. The systematic change of local currency value determination by the dollar to its determination by market forces; the sustained minimum wage of ₦30,000 since 2019 and the exit of over twenty-plus multinational companies between 2020 to 2023 contributed to the wrong mix of domestic policies that influenced the Nigerian GDP and GDP growth rate performance between 2019-2023.
Figure 1. Gross Domestic Product ($) and Growth rate Figures between 2019-2023. Source: [24].
Preprints 117775 g001
Figure 2. Exited Companies from Nigeria between 2019-2022. Source: [25,26].
Preprints 117775 g002
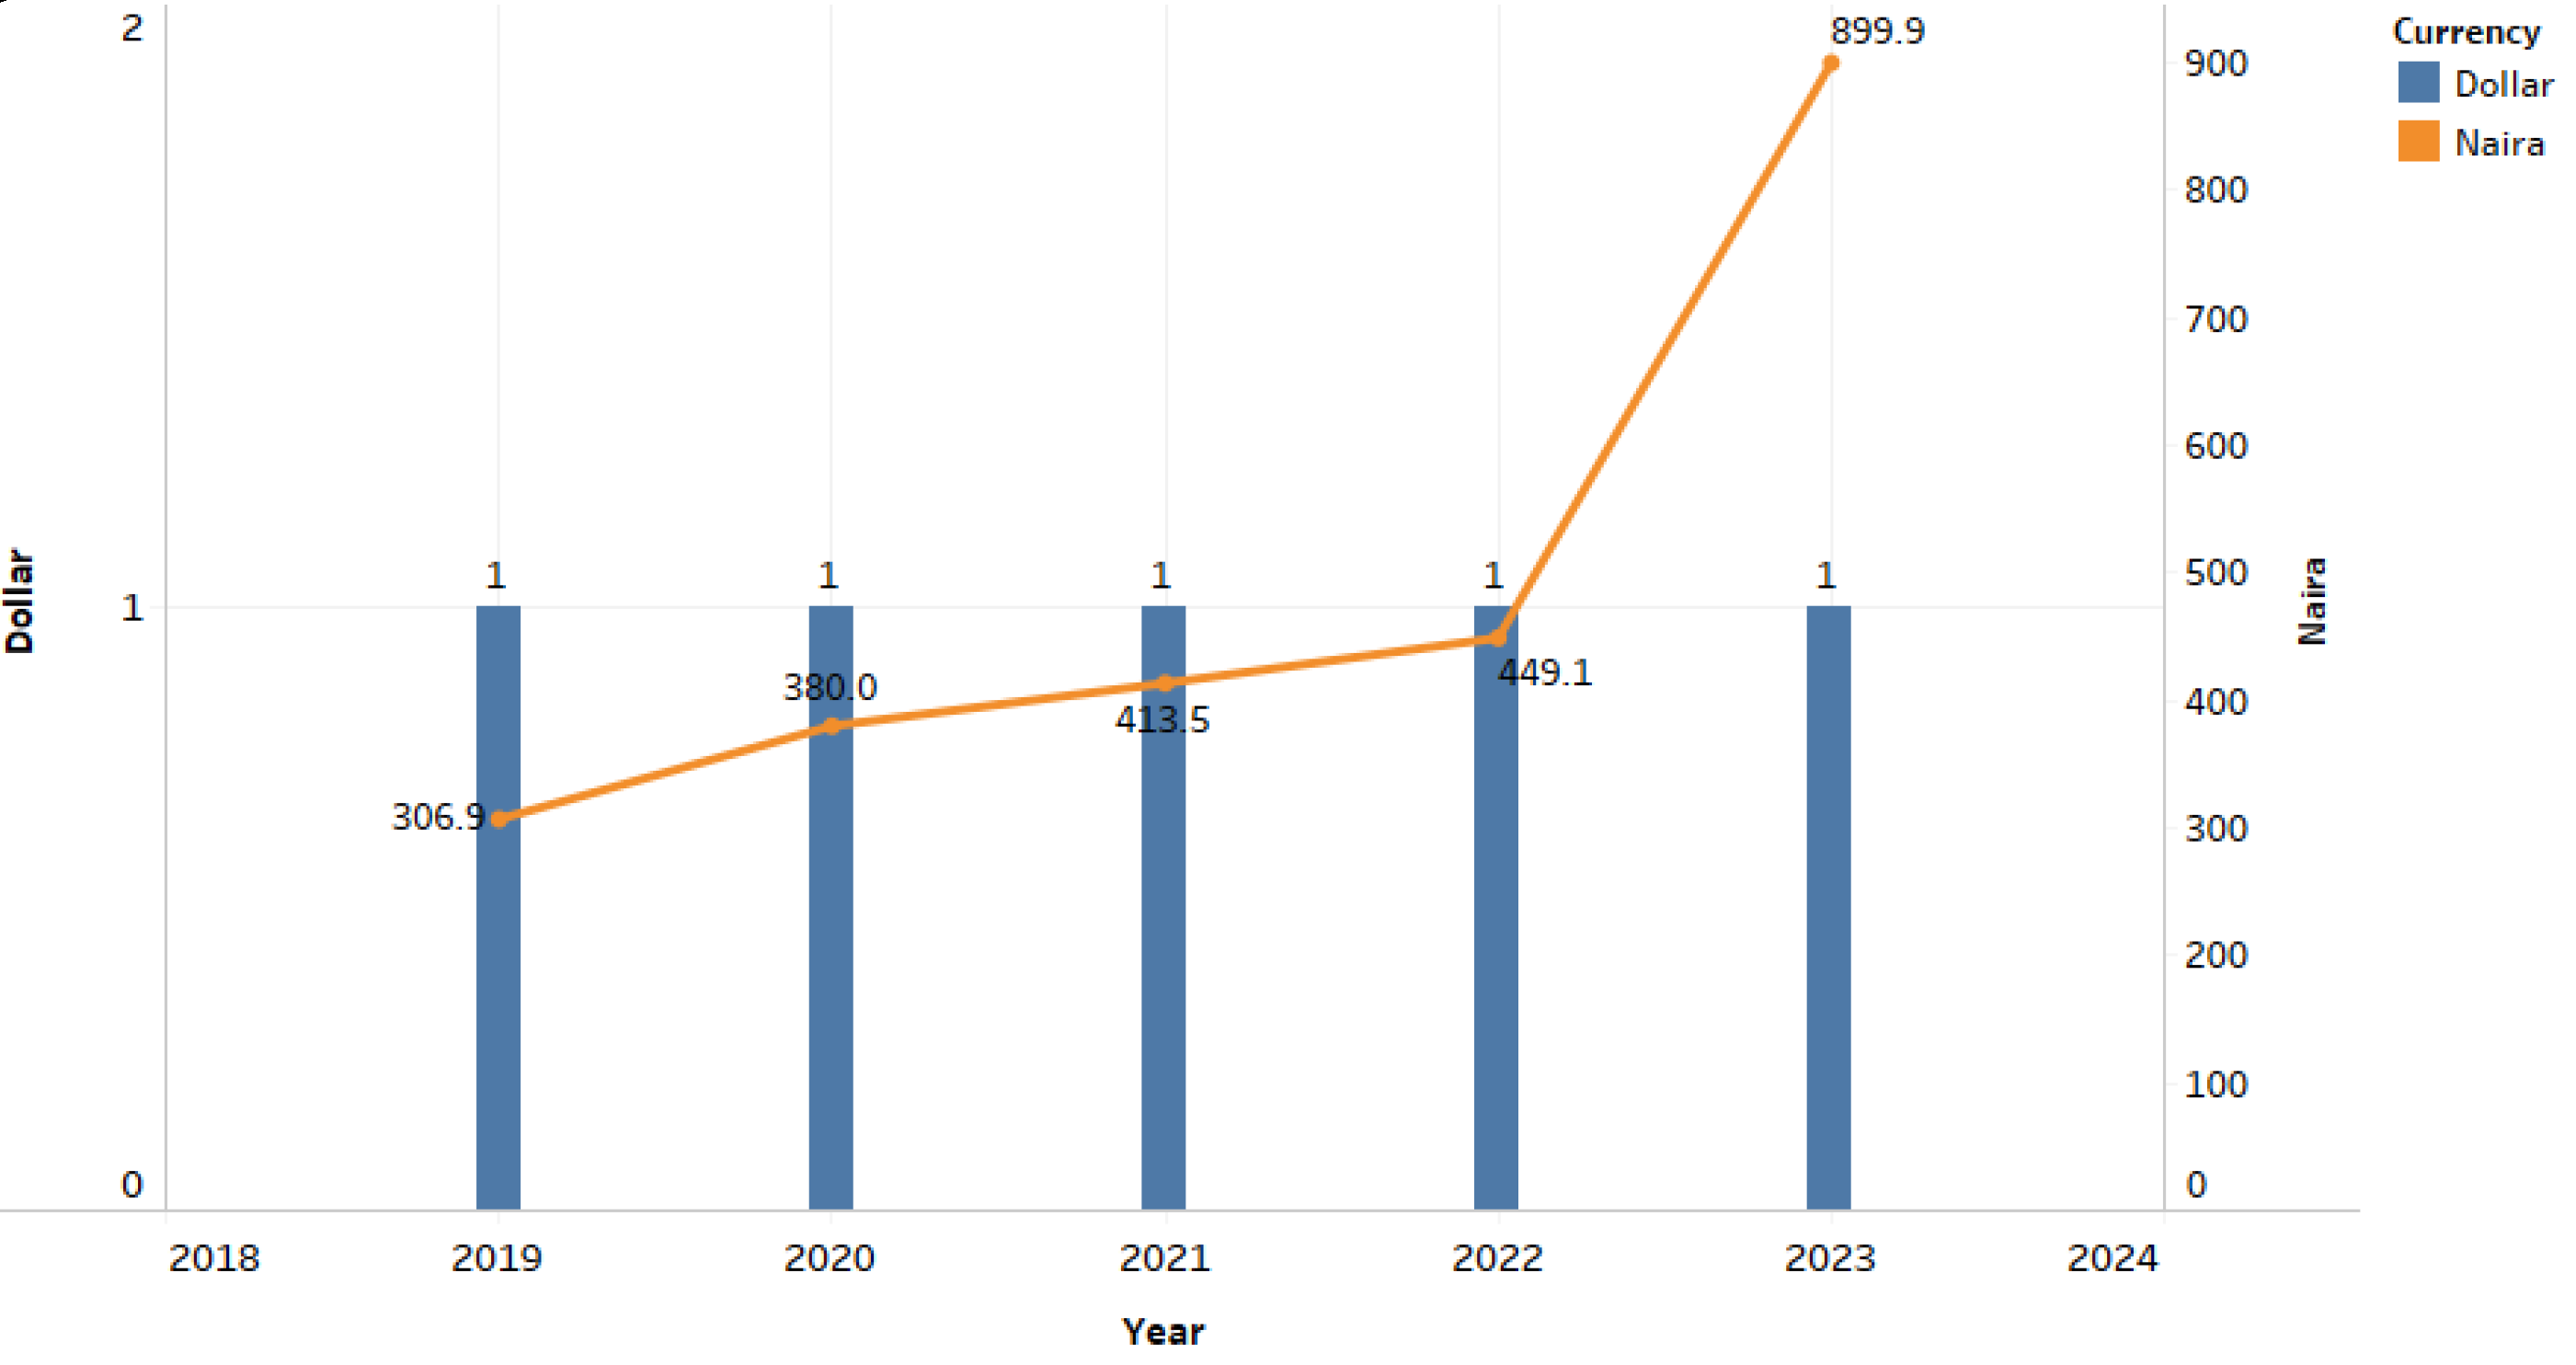
With the lifting of some forex controls and the direction of banks by the Central Bank of Nigeria to quote the naira at prevailing market rates, the Nigerian currency experienced another devaluation which has taken a toll on its purchasing power. Between 2022 and 2023, there is almost a 100% increase in its exchange equivalent to the naira and by the end of the first quarter of 2024, it is approaching 200%.
Figure 3. Dollar to Naira Exchange equivalent between 2019-2023. Source: [27,28,29,30,31].
Preprints 117775 g003
Table 3. Naira per International Purchasing Power Parity (PPP).
YEAR $
2019 1 129.269
2020 1 134.6
2021 1 146.7
2022 1 152.6
2023 1 165.8
Source: [32,33].
Table 4. Nigeria’s GDP and GNI per Capita between 2019-2023.
YEAR GDP ($) GNI ($)
2019 2,334 2,110
2020 2,074.6 2,110
2021 2,065.8 2,160
2022 2,162.6 2,160
2023 1,621.1 1,930
Source: [24].
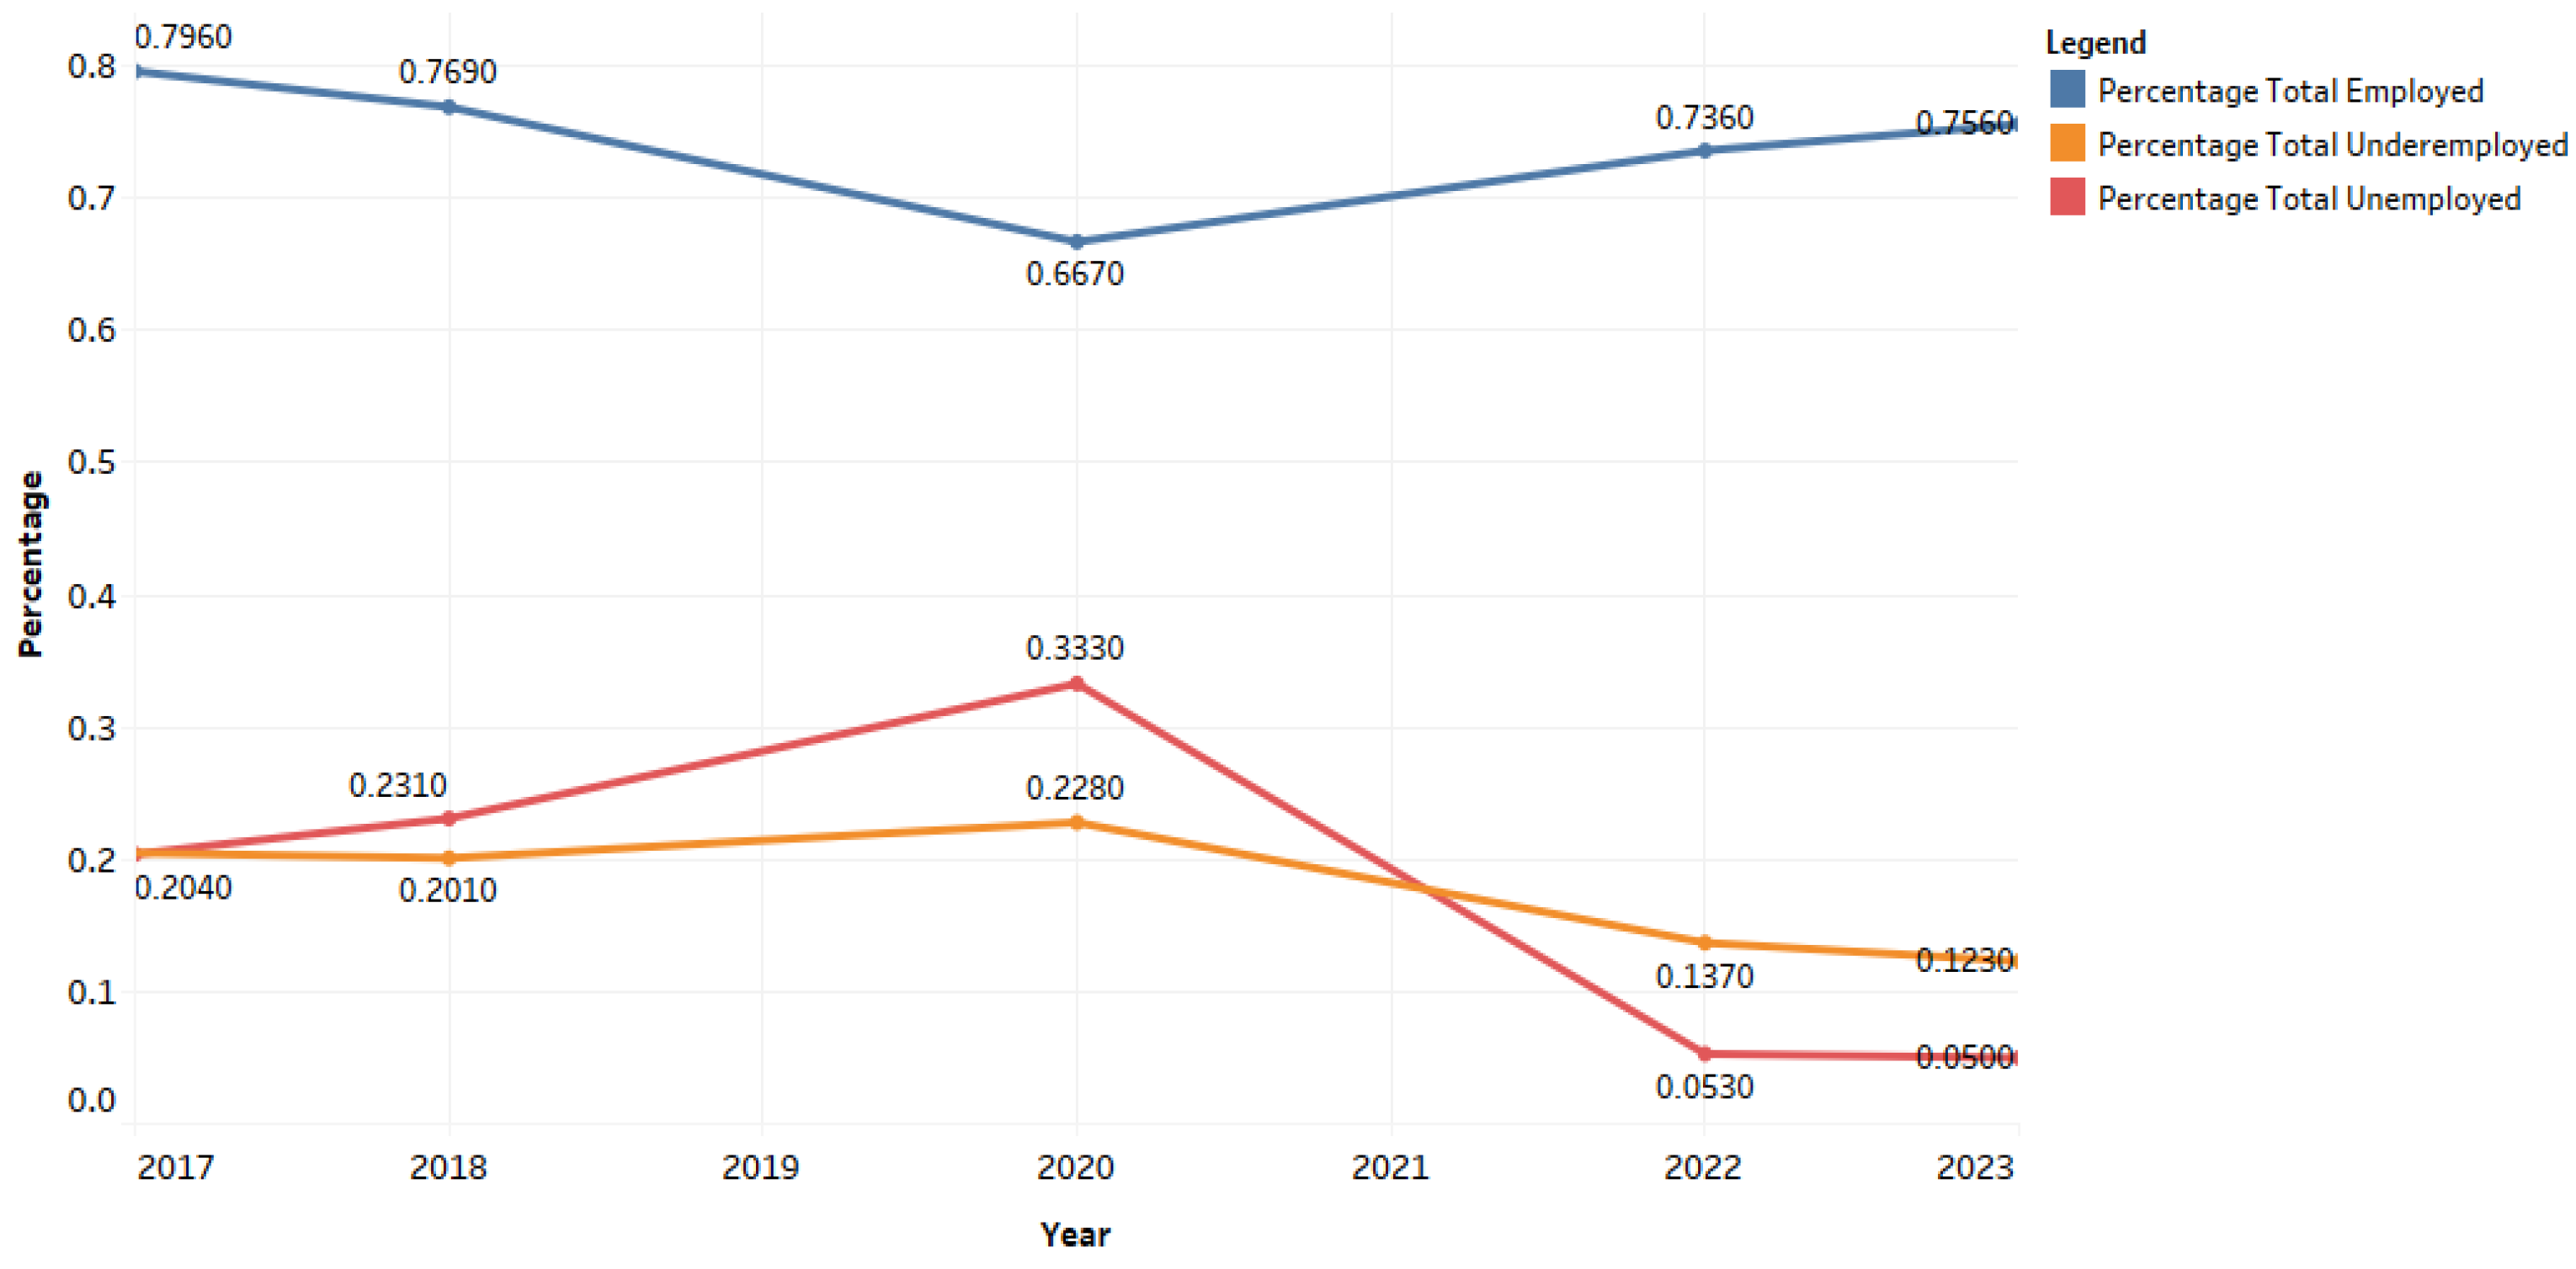
Table 5 serves as a productivity and prosperity measure for Nigeria between 2019-2023. With a drop in both GDP and GNI per capita, the average Nigerian citizen still falls within the lower-middle income countries classified by the United Nations and the World Bank. These fundamentals are used in appraising the consumer well-being and investment situation in the country. Thus, even with an improving workforce statistic, an average Nigerian worker faces the possibility of not affording basic needs such as housing due to dwindling economic performances.
Figure 6. Labour force statistics between 2017-2018, 2020 and 2022-2023 in Nigeria. Source: [34,35,36,37,38].
Preprints 117775 g004
The growth in a country’s workforce should indicate that productivity is its goal and revenue generation should witness an increase, but the Nigerian economy has witnessed less productivity and more spending in the last five years. The spending streak has not been outrageous like its sister countries with top economic performances in Africa, but it has been concerning for a nation trying to shake off its dependence on the oil sector.
Figure 7. Nigeria’s debt profile 2019-2023. Source: [39,40,41,42,43].
Preprints 117775 g005
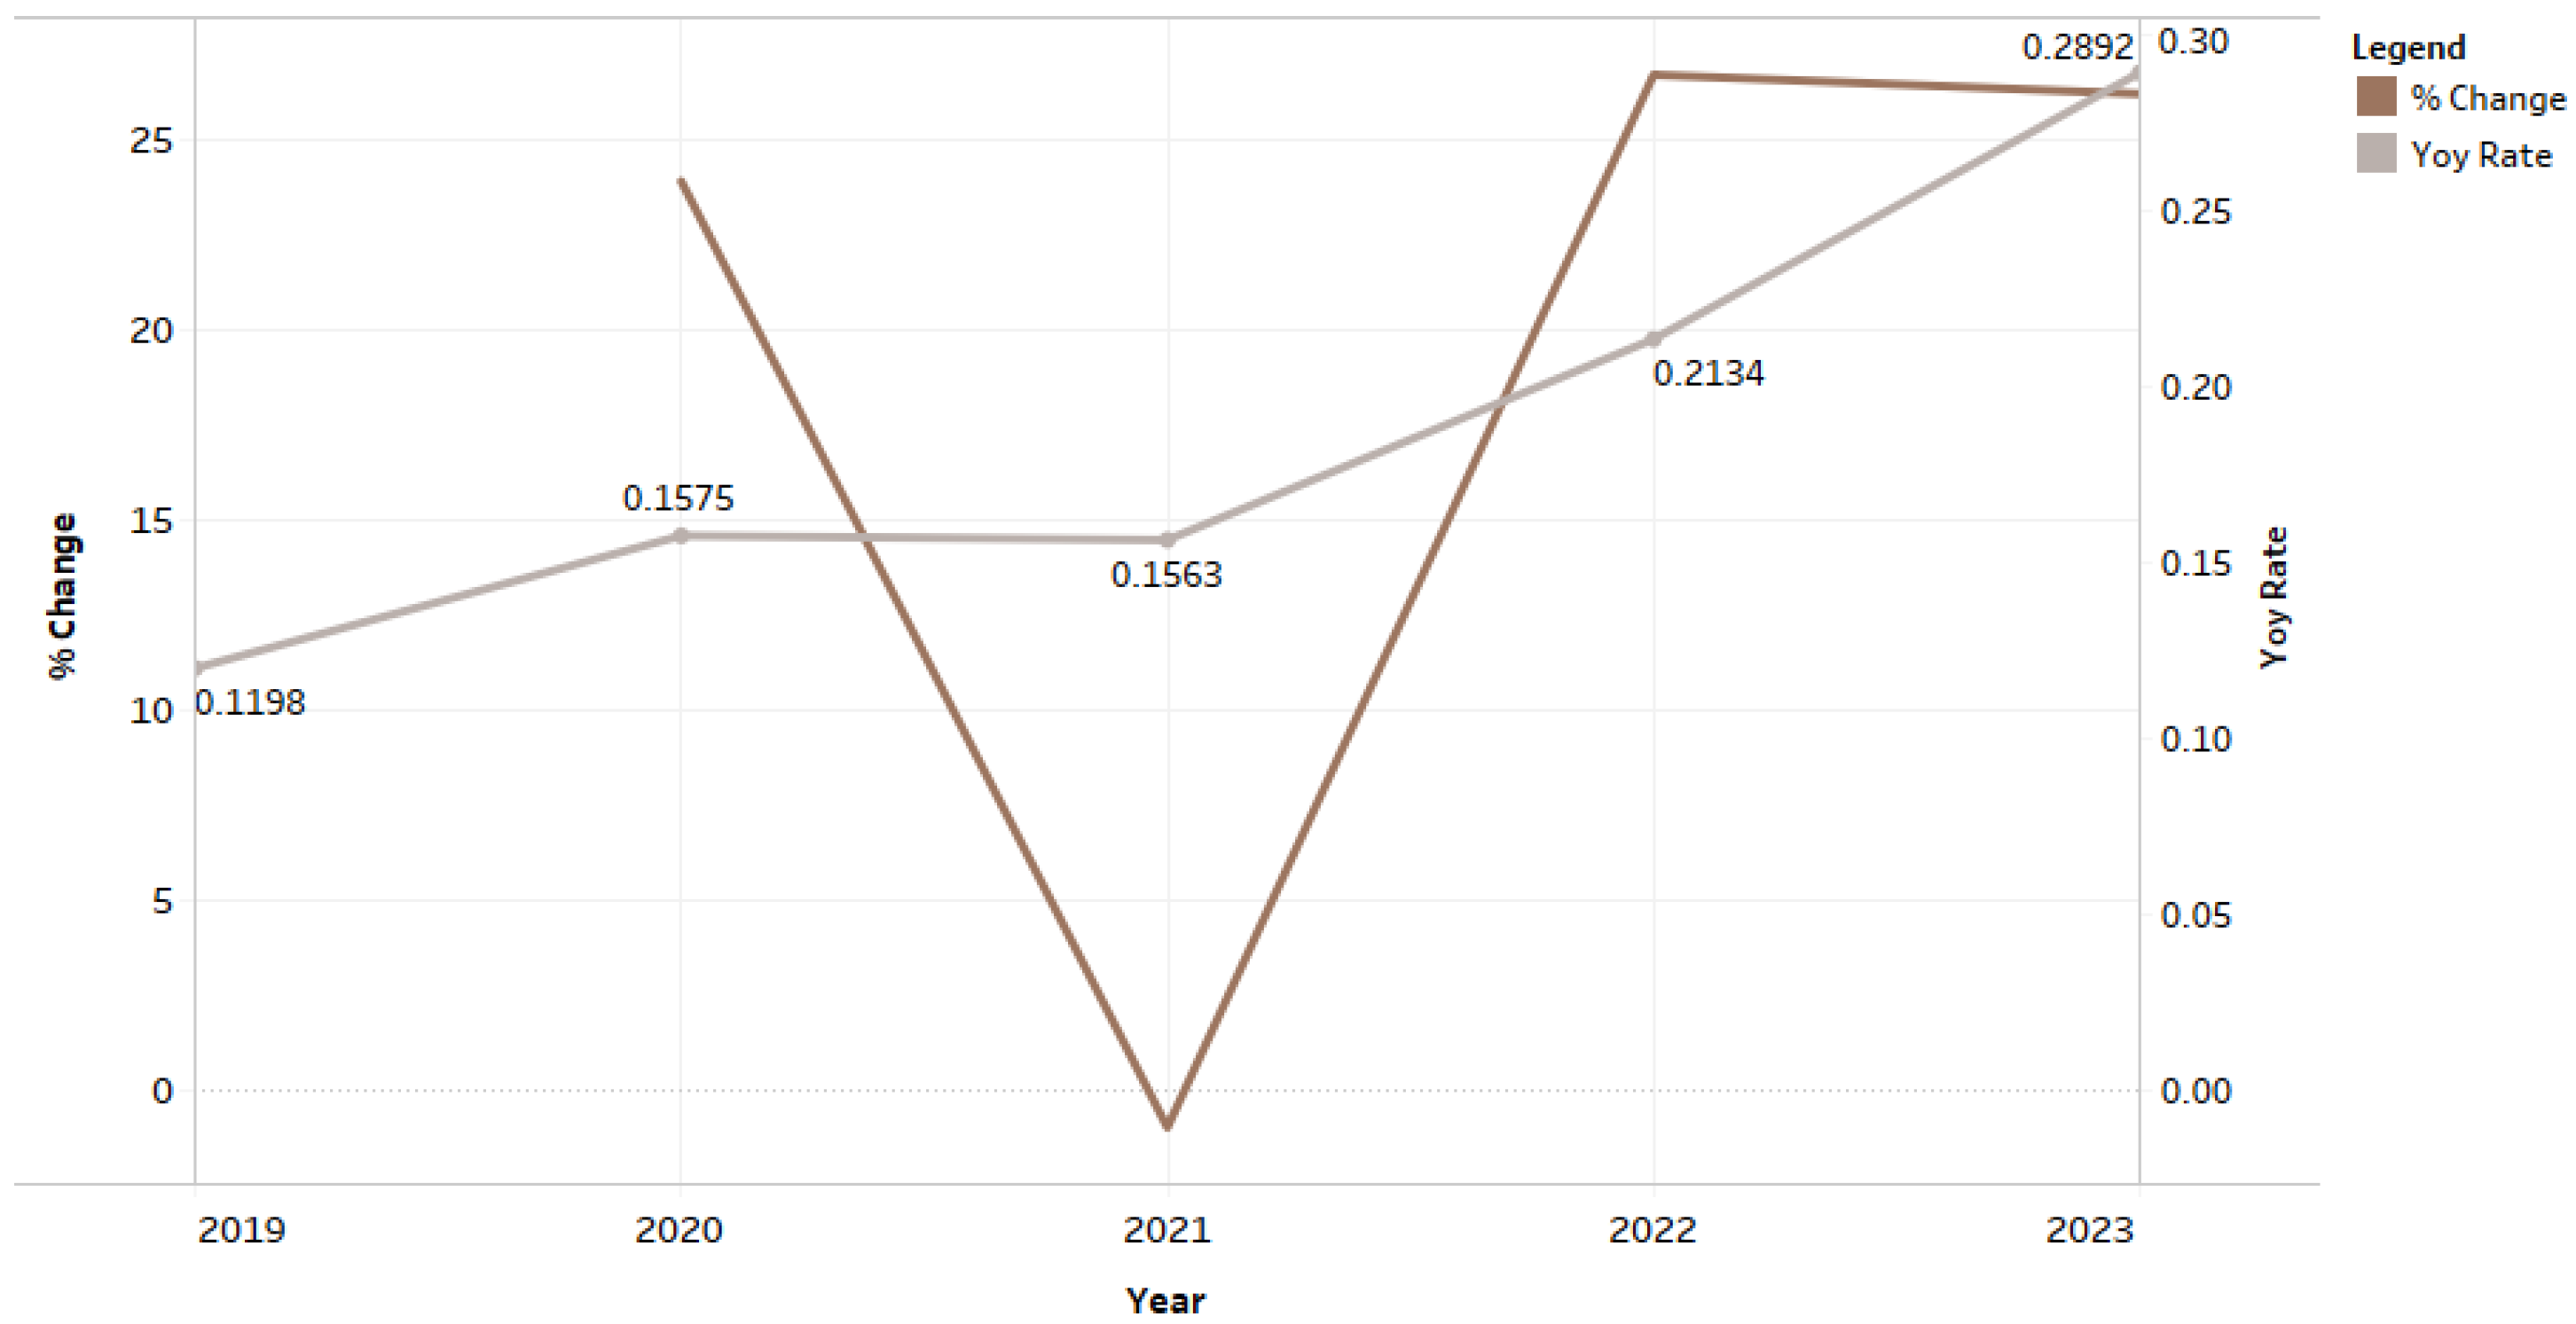
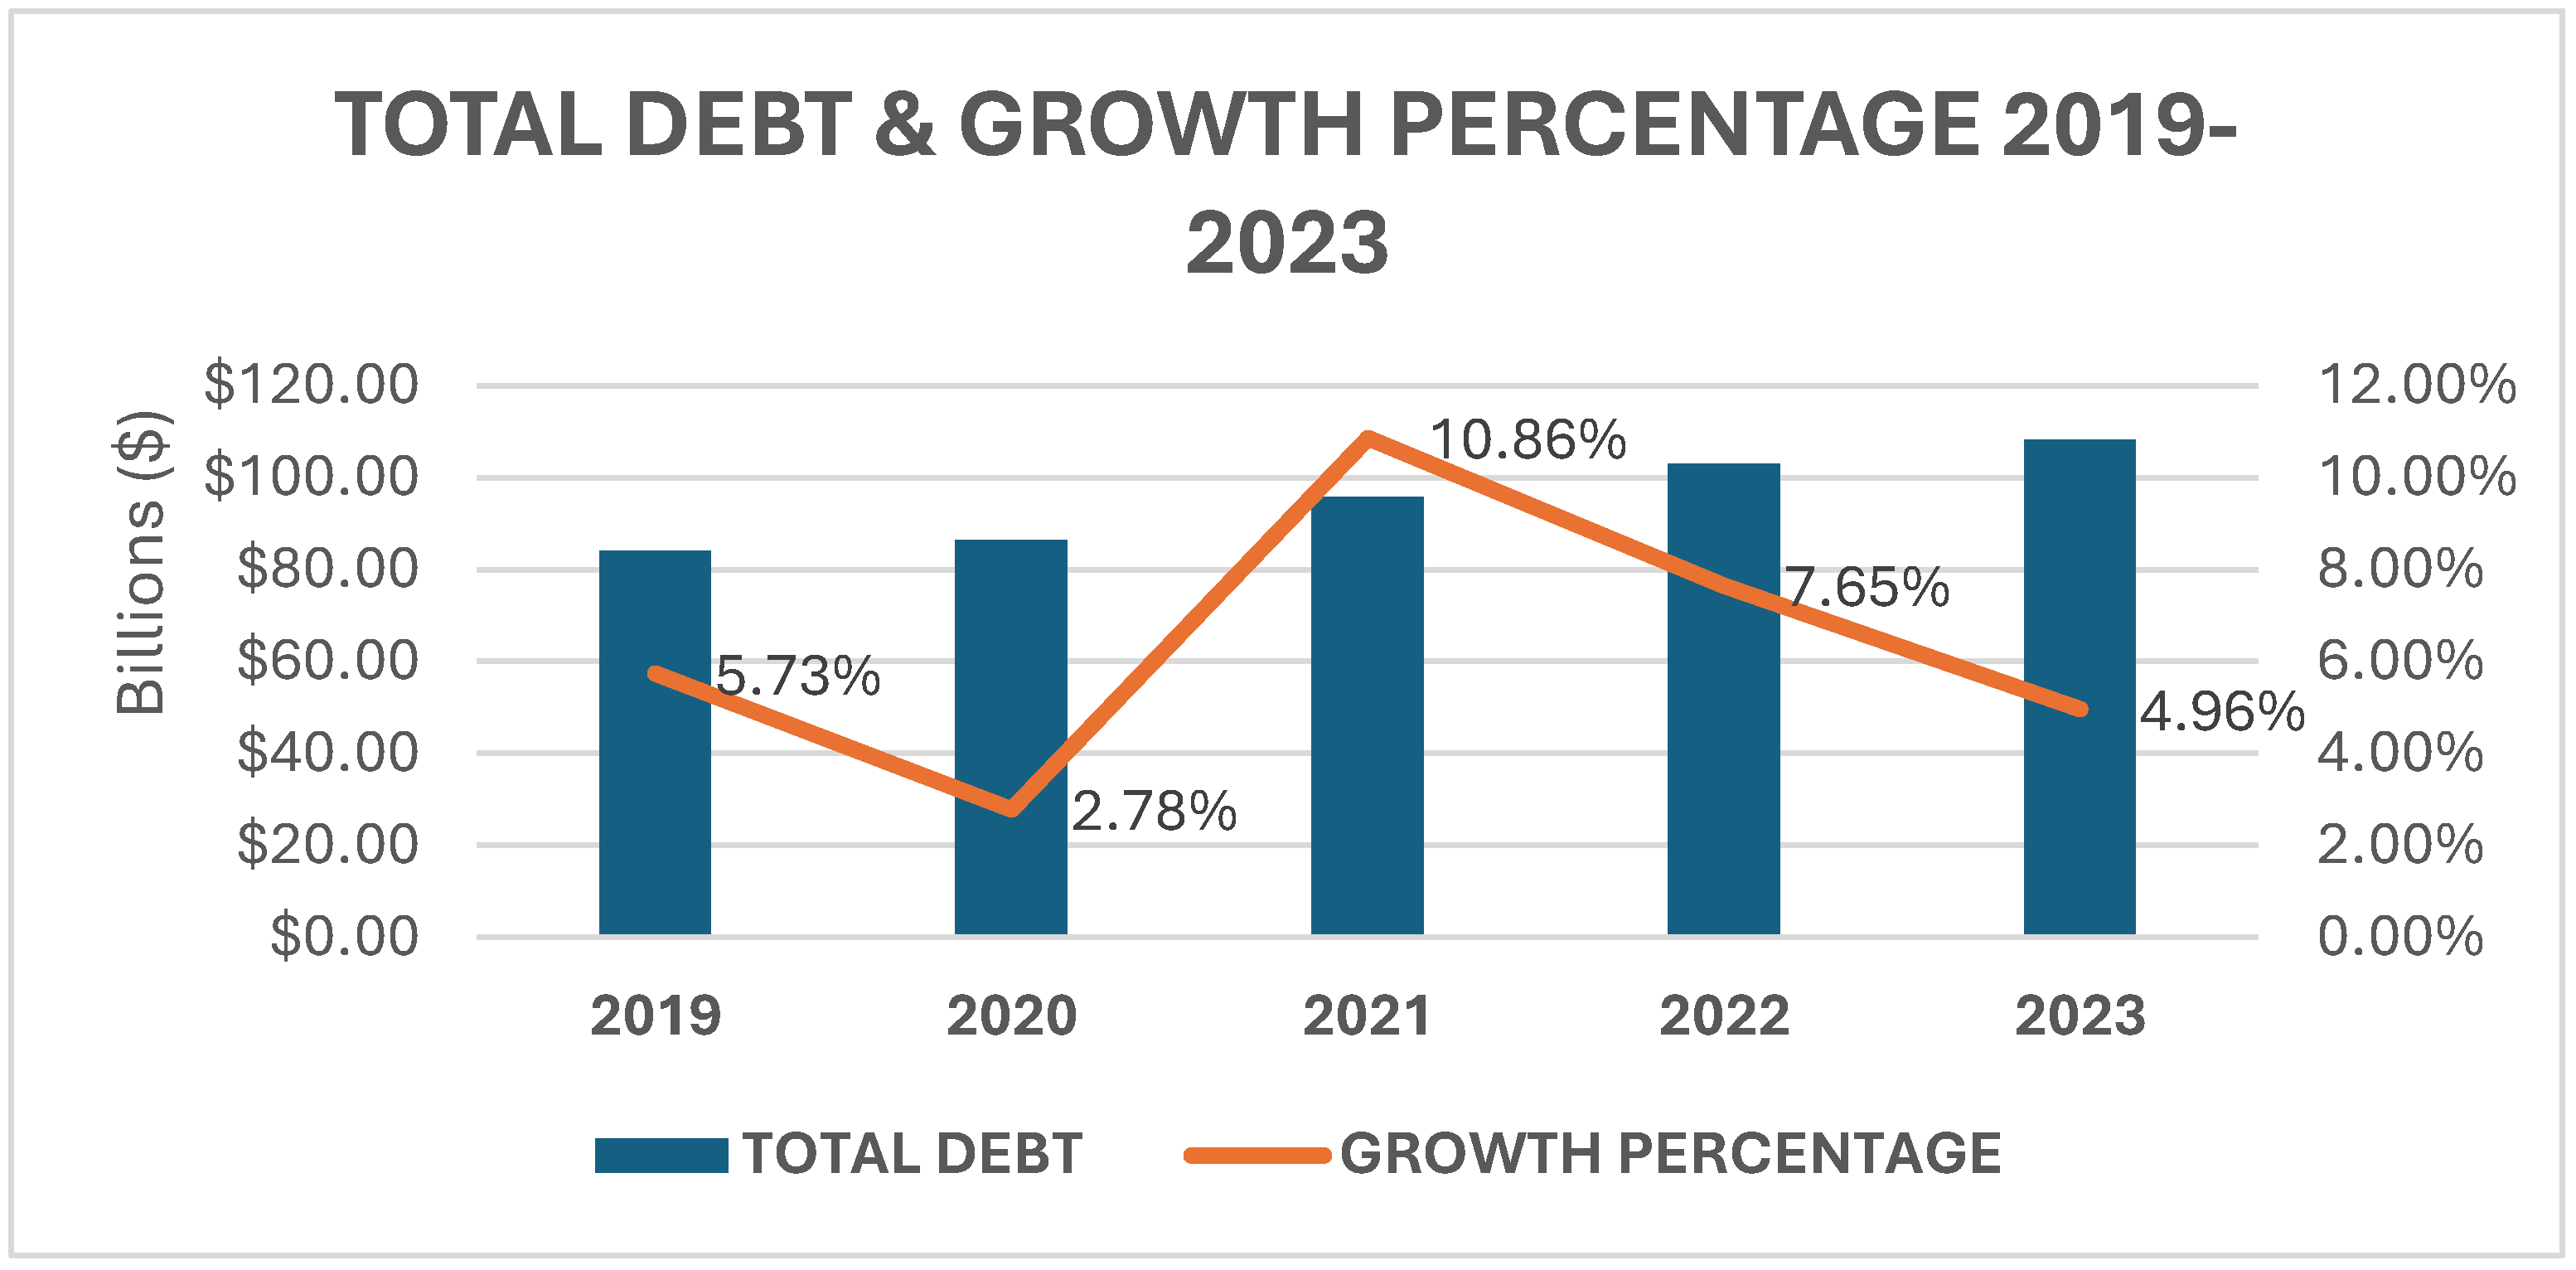
Nigeria’s debt profile has grown considerably, with a portion of its budget set out each year to offset it. Its largest leap in debt earned was recorded in 2020-2021 when a 10.86% increase in debt burden was realized. With the Buhari administration on one end, keen on executing key infrastructure within the nation, the monstrous fuel subsidy expenditure was eating deep into the financial resources of the nation on the other end and this further occasioned more borrowings.
Figure 8. Total debt & growth percentage 2019-2023. Source: [39,40,41,42,43].
Preprints 117775 g006
What is considered worrisome is the increased debt profile of the nation by the end of 2023, as the Tinubu administration had devoted itself to the removal of the fuel subsidy. Most high-performing economies in the world possess debt burdens but it doesn’t erode their performance and sustainability, as there are policies in place to ensure productivity and revenue are maximized. Nigeria has a lot to learn in that regard, as our policies are failing productive sectors from hitting their full potential and lacking the capacity to be taxed optimally in supporting the government’s revenue.
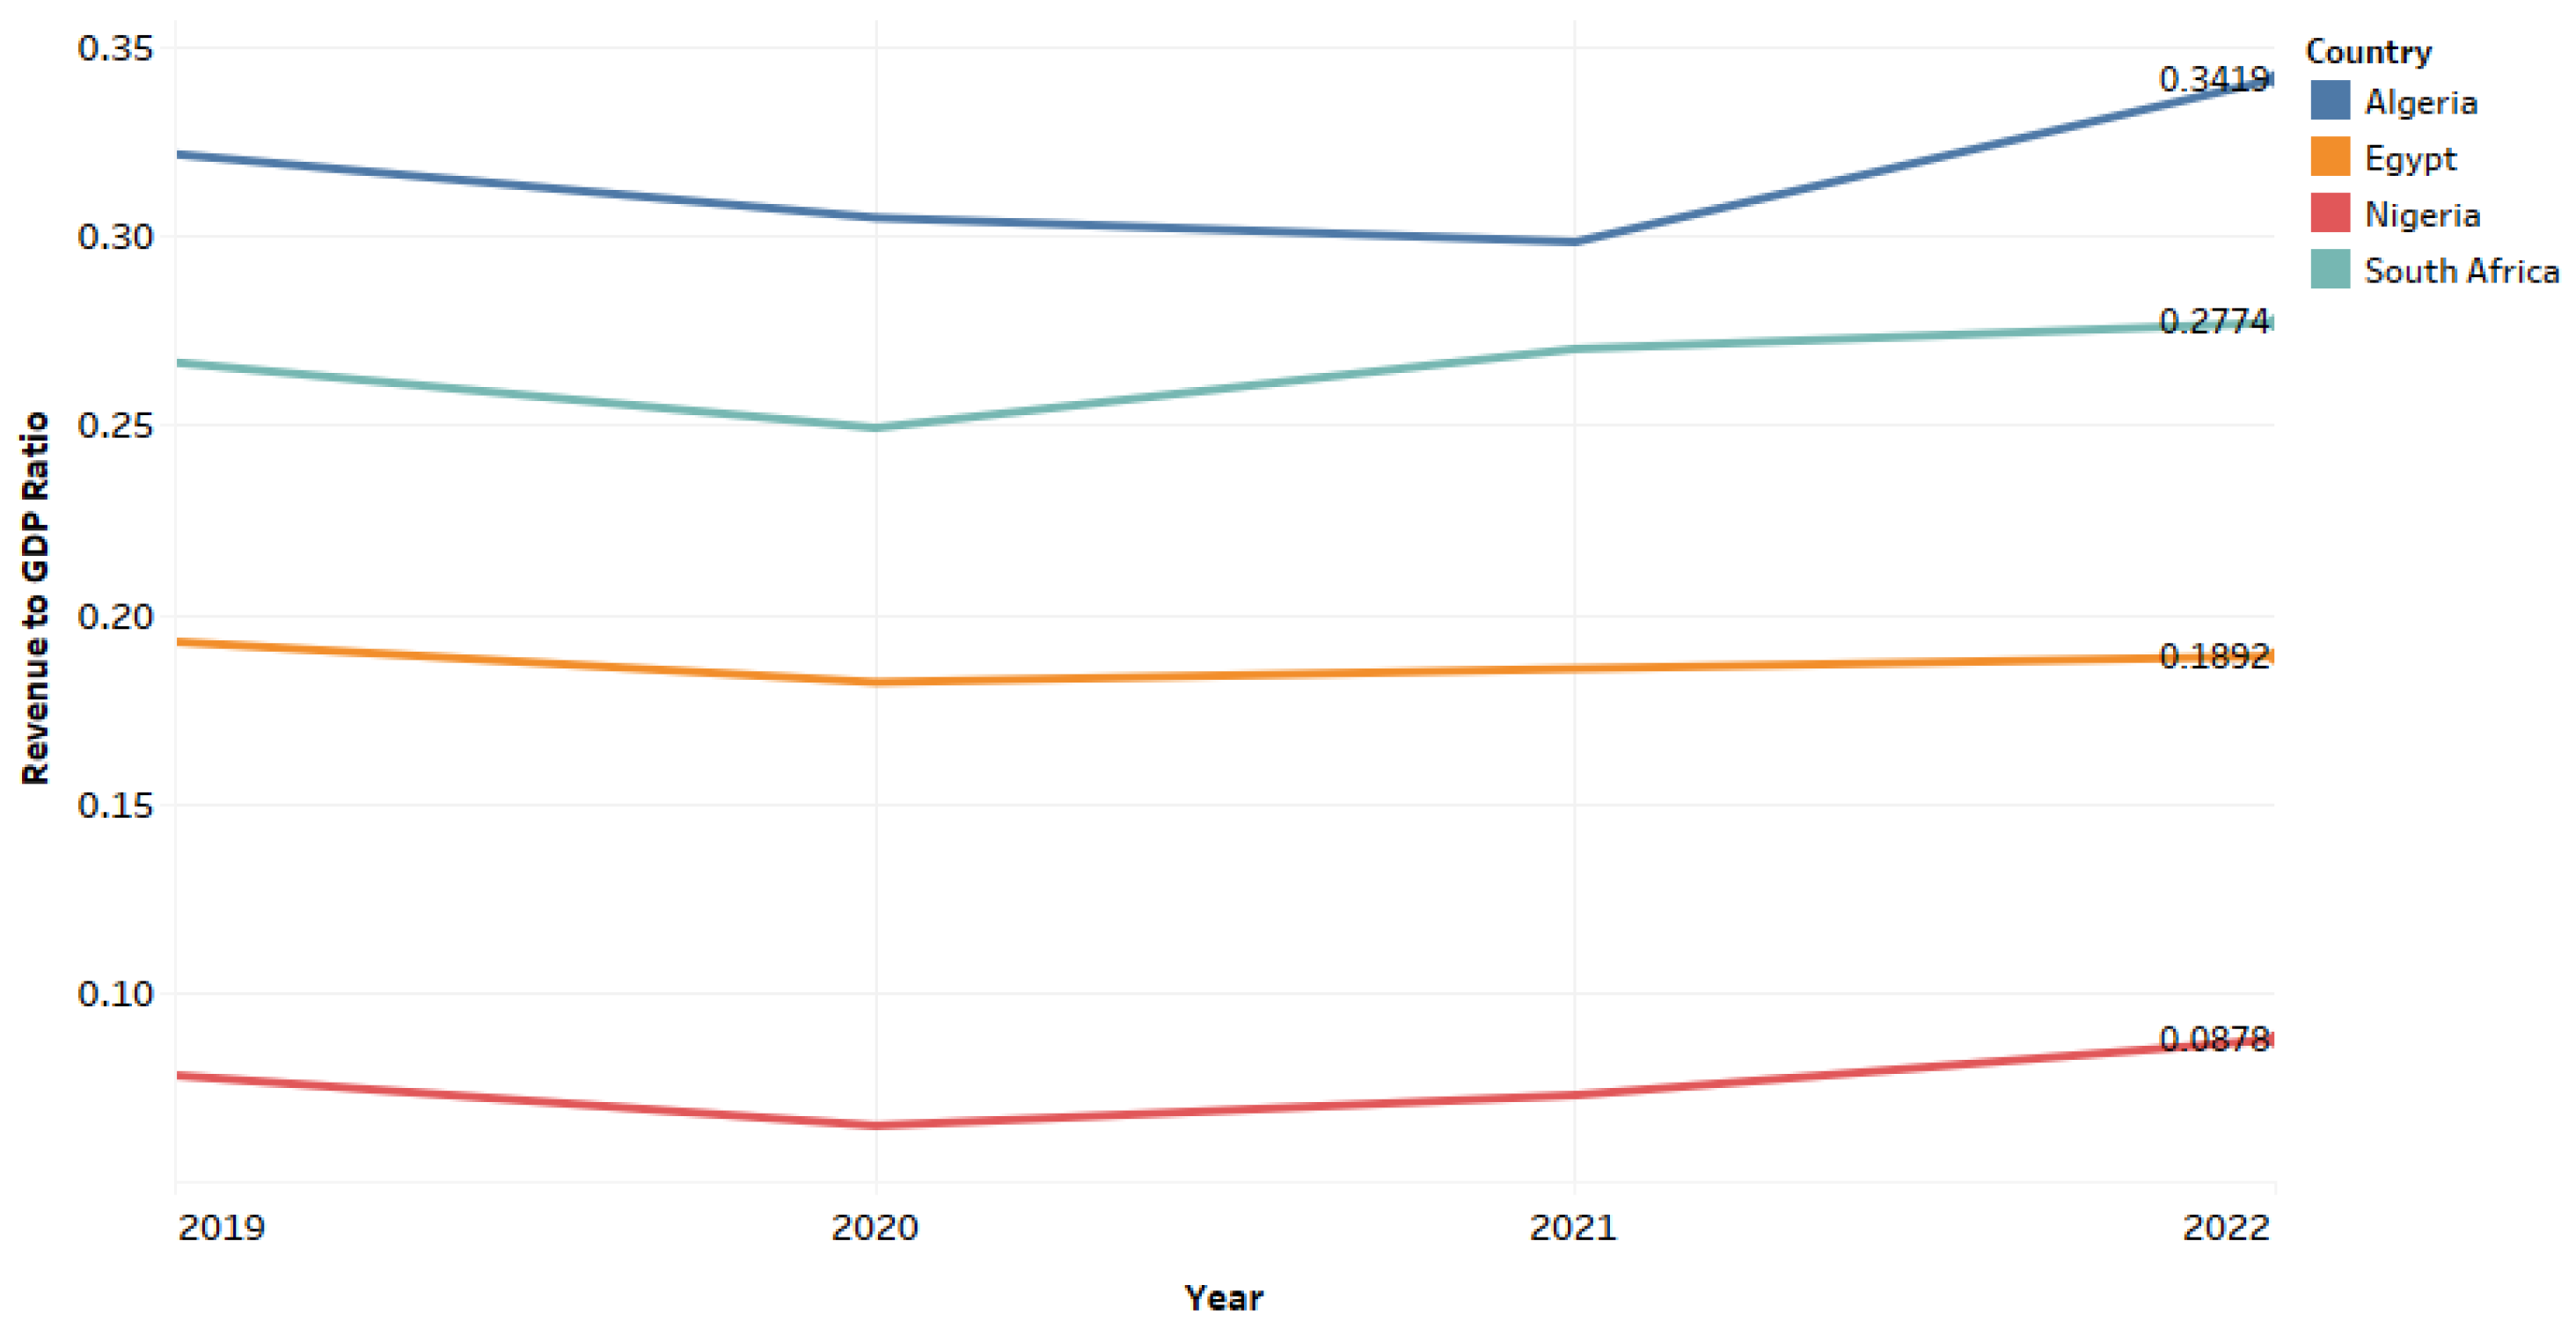
Figure 9. Revenue to GDP ratio of top economic African countries between 2019-2022. Source: [15,16,17].
Preprints 117775 g007
The above figure shows that other top-performing African economies have a revenue-to-GDP ratio higher than 10-20%. Nigeria has not hit the 20% landmark since its fall to 10% in 2009 [16]. Its last recorded revenue-to-GDP ratio higher than 10%, was recorded in 2011 at 17%. From 2014, it had not crossed beyond 10%.
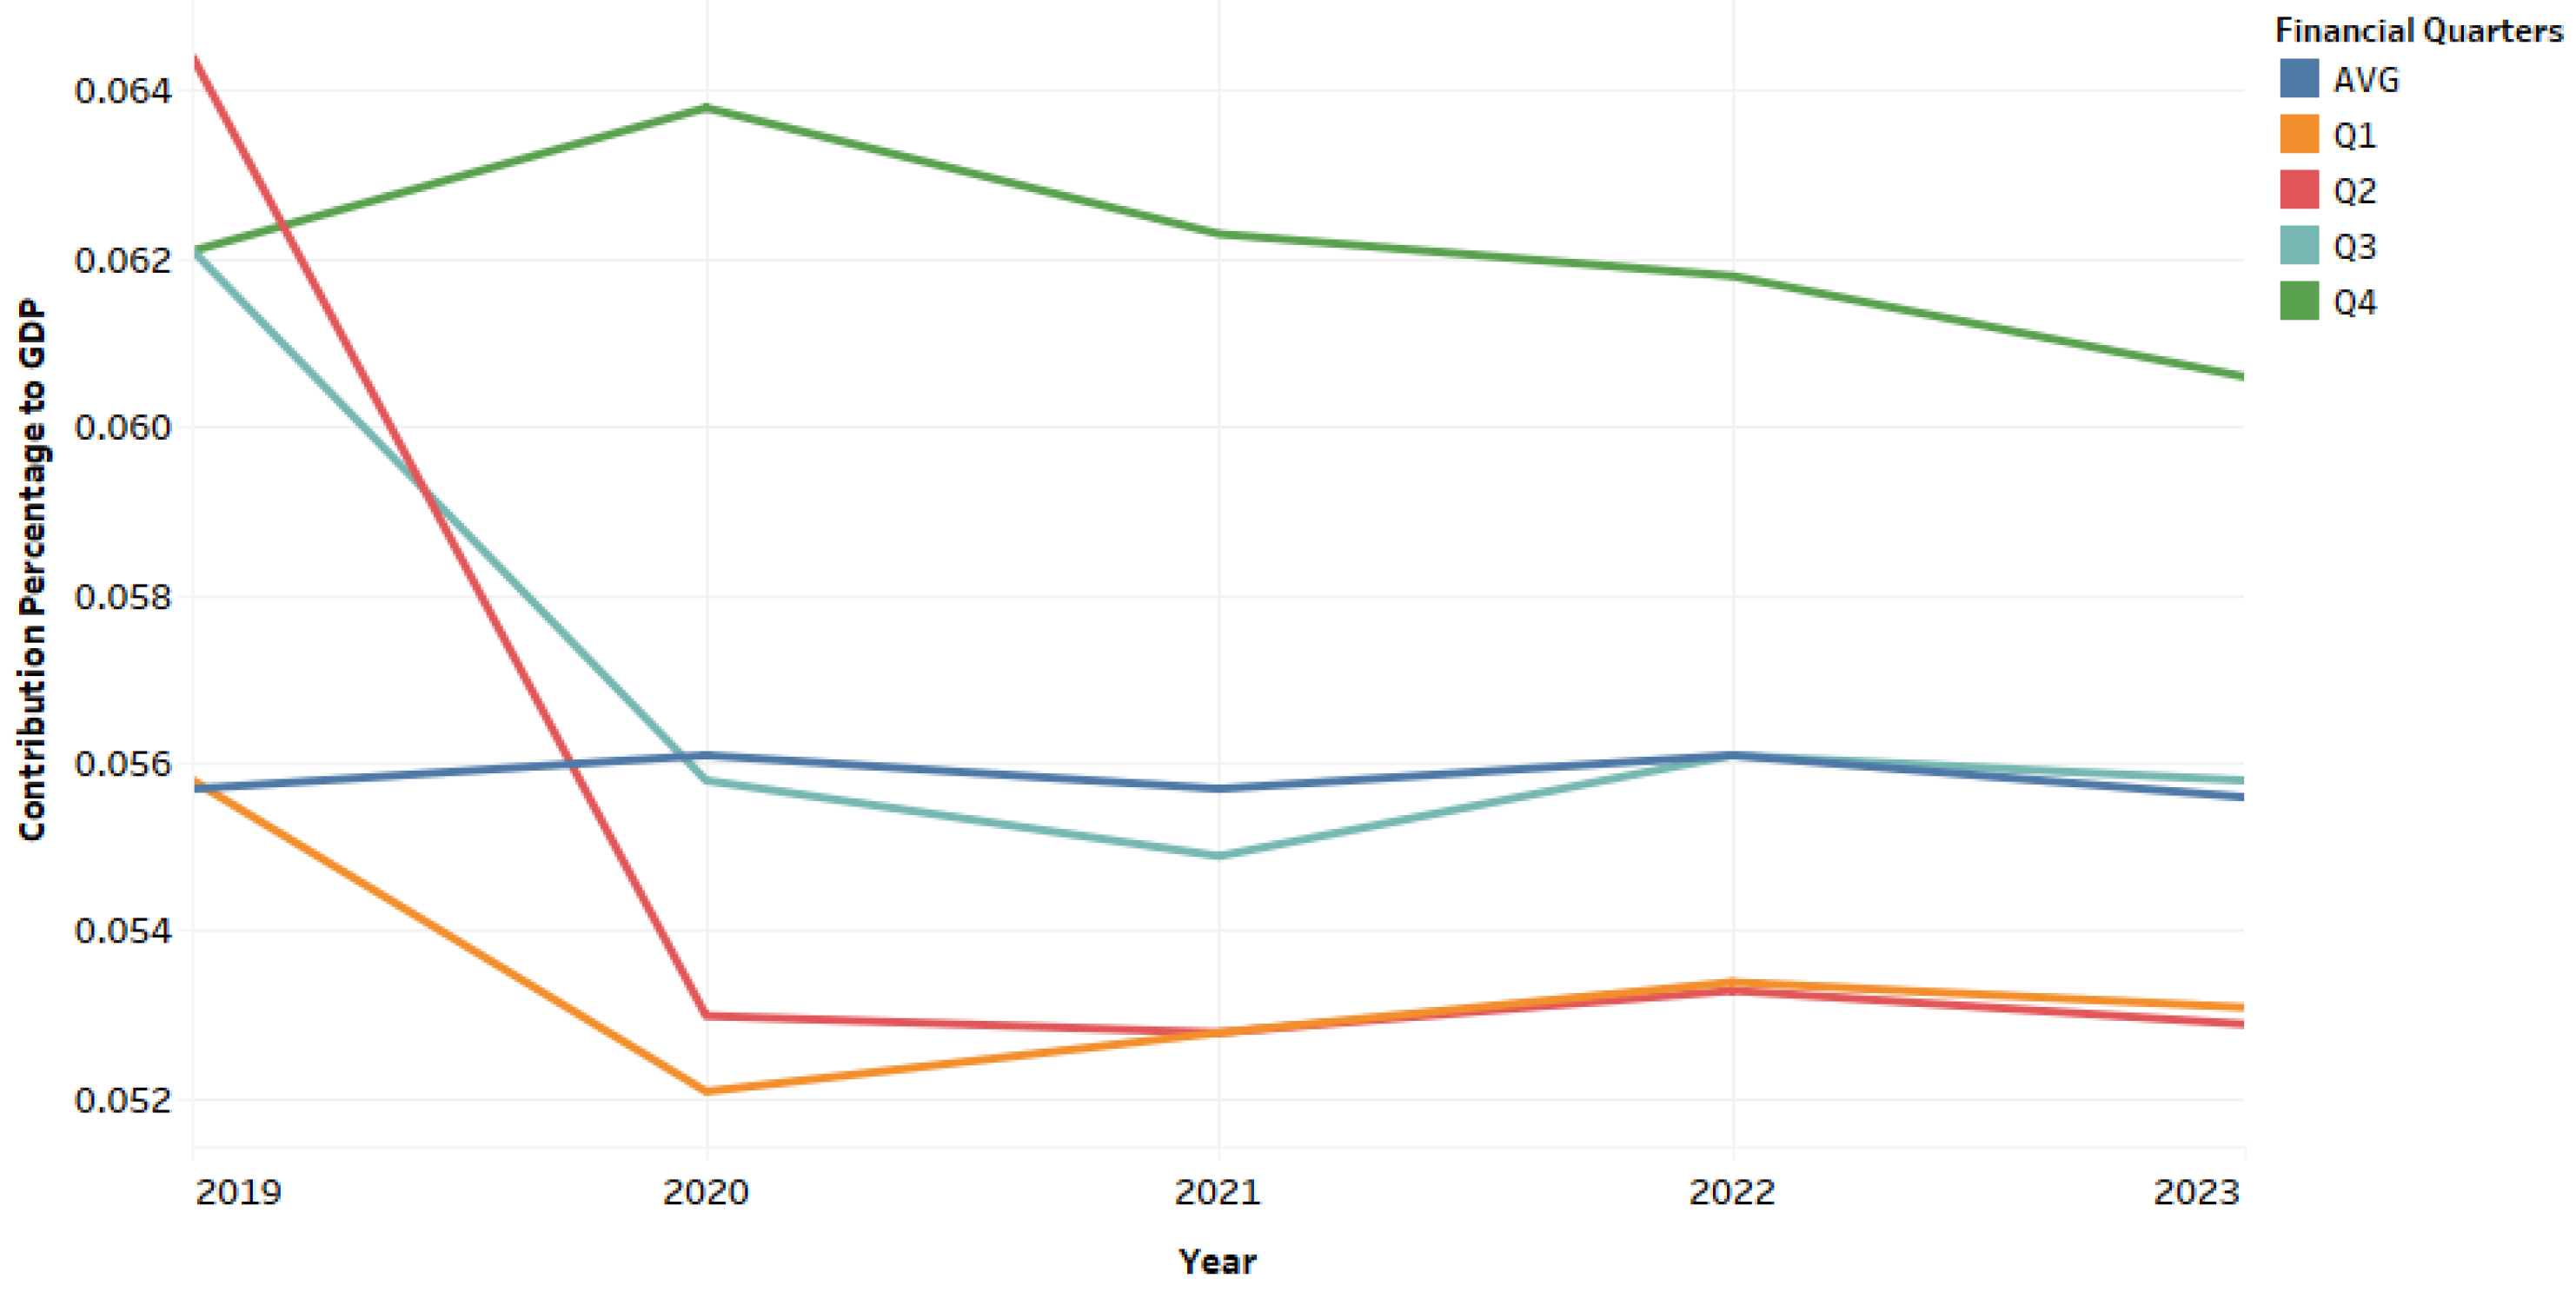
Figure 10. Real Estate Sector’s Quarterly Contribution to GDP between 2019-2023. Source: [44,45,46,47,48].
Preprints 117775 g008
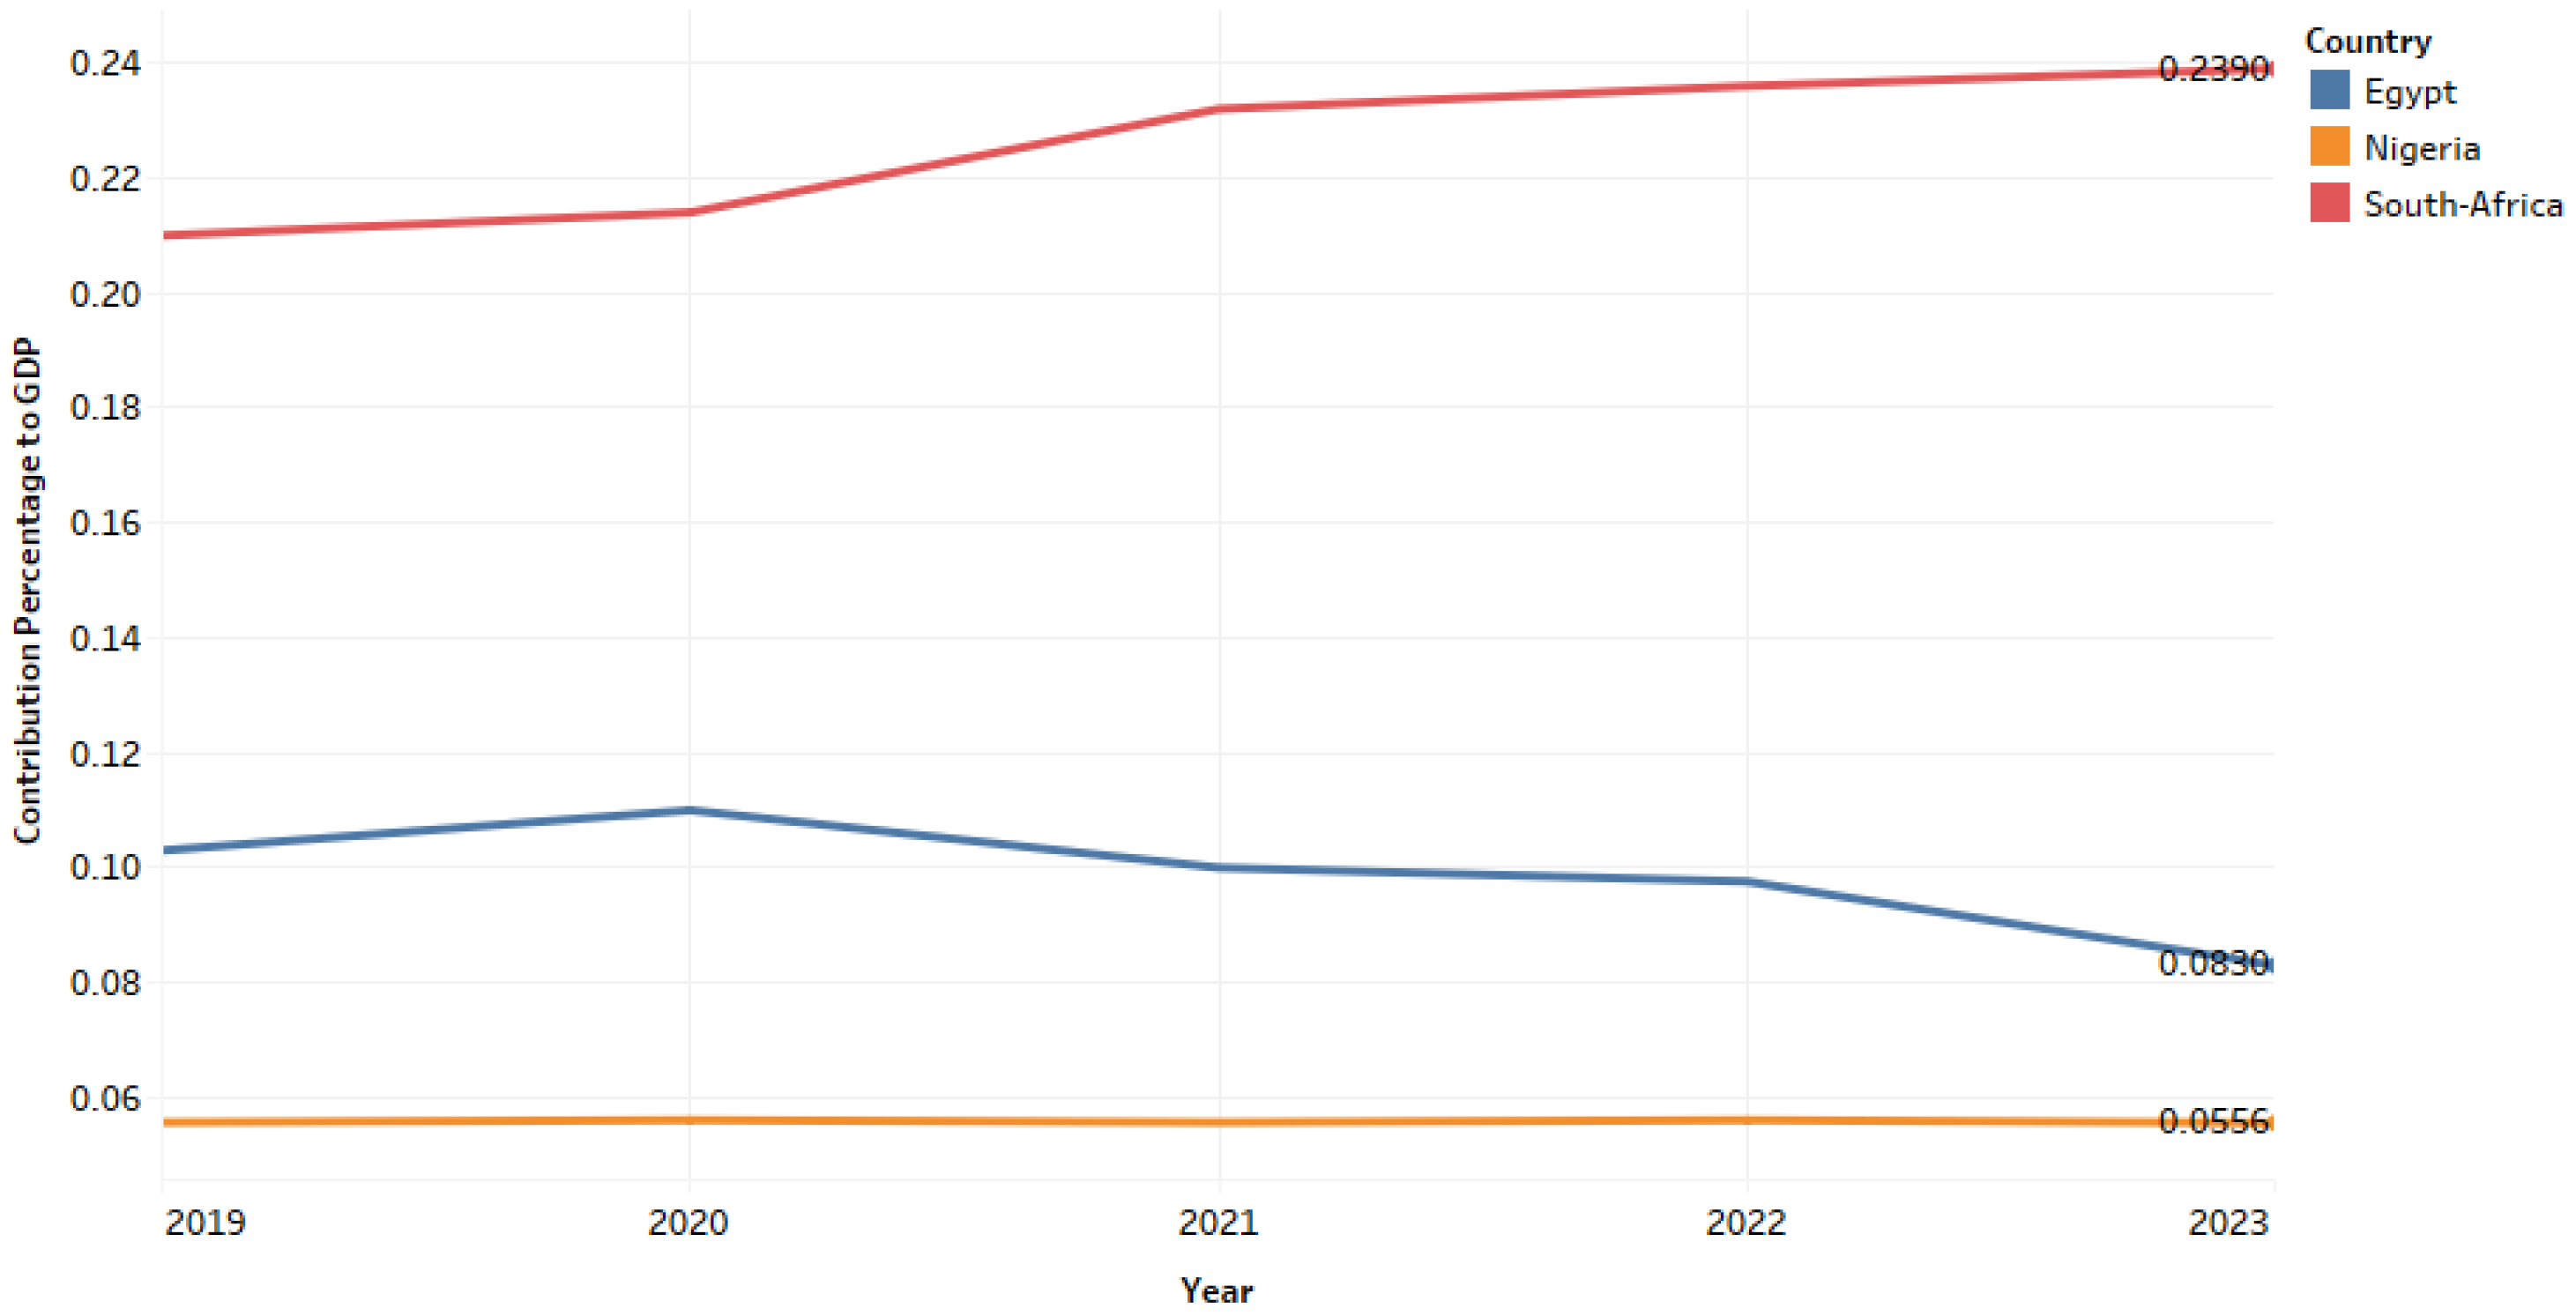
Even the contributions of the real estate sector are not spared from this recession, as there has been a drop in its sector contribution to the national real GDP from 6.41% recorded in 2018 to 5.56% at the end of the 2023 fiscal year. A quick comparison between top-performing African economies and their real estate contribution to real GDP between 2019 to 2023 impresses a lot about how improvement is needed in the Nigerian situation.
Figure 11. Comparisons of top performing African GDPs and their real estate contributions. Source: [32,44,45,46,47,48,49,50,51,52,53,54].
Preprints 117775 g009
Housing affordability in both rental and sale contexts have been affected by the rising price level of goods and services in the country. It has been adduced that a relationship exists between the rising inflation rate and construction prices in Nigeria [55]. Their submission correlates with the studies of [56,57,58].
The Nigerian inflation situation is the same for most developing economies, signified by double-digit rates and eroding purchasing power [59]. Such increase has been deduced as a consequence of sub-Saharan Africa’s poor manufacturing output [60]. Increased migration and urbanization, which for cities like the Lagos metropolis, leads to increased property demand, low property supply, and increased development costs.
With studies such as [61,62] which reveal house prices as stable inflation hedges in the long run, the prospect of affordability dims in the light of the present economic situation in the country. This is captured in the studies of [12,63,64,65,66] which reveal real estate hedging potential as intermittent, time-varying, asymmetric, sectorial differential and cyclic in periods. Housing as a product is dependent on inflation and where there is an increase in interest rates, it inspires a search for alternative accommodations and ultimately a depression in housing prices [67,68,69]
Figure 12. Year-on-Year inflation in Nigeria between 2019-2023. Source: [27,28,29,30,31,44,45,46,47,48].
Preprints 117775 g010
With the growing levels in the double-digits of the consumer price index in the country’s economy, its two-fold impact was witnessed in the reduced purchasing power of the naira for certain commodities and the rise in the cost/price of goods and services. This, in turn, has led to the adoption of the cost-transfer alternative by most business enterprises in a bid to stay afloat or break even.
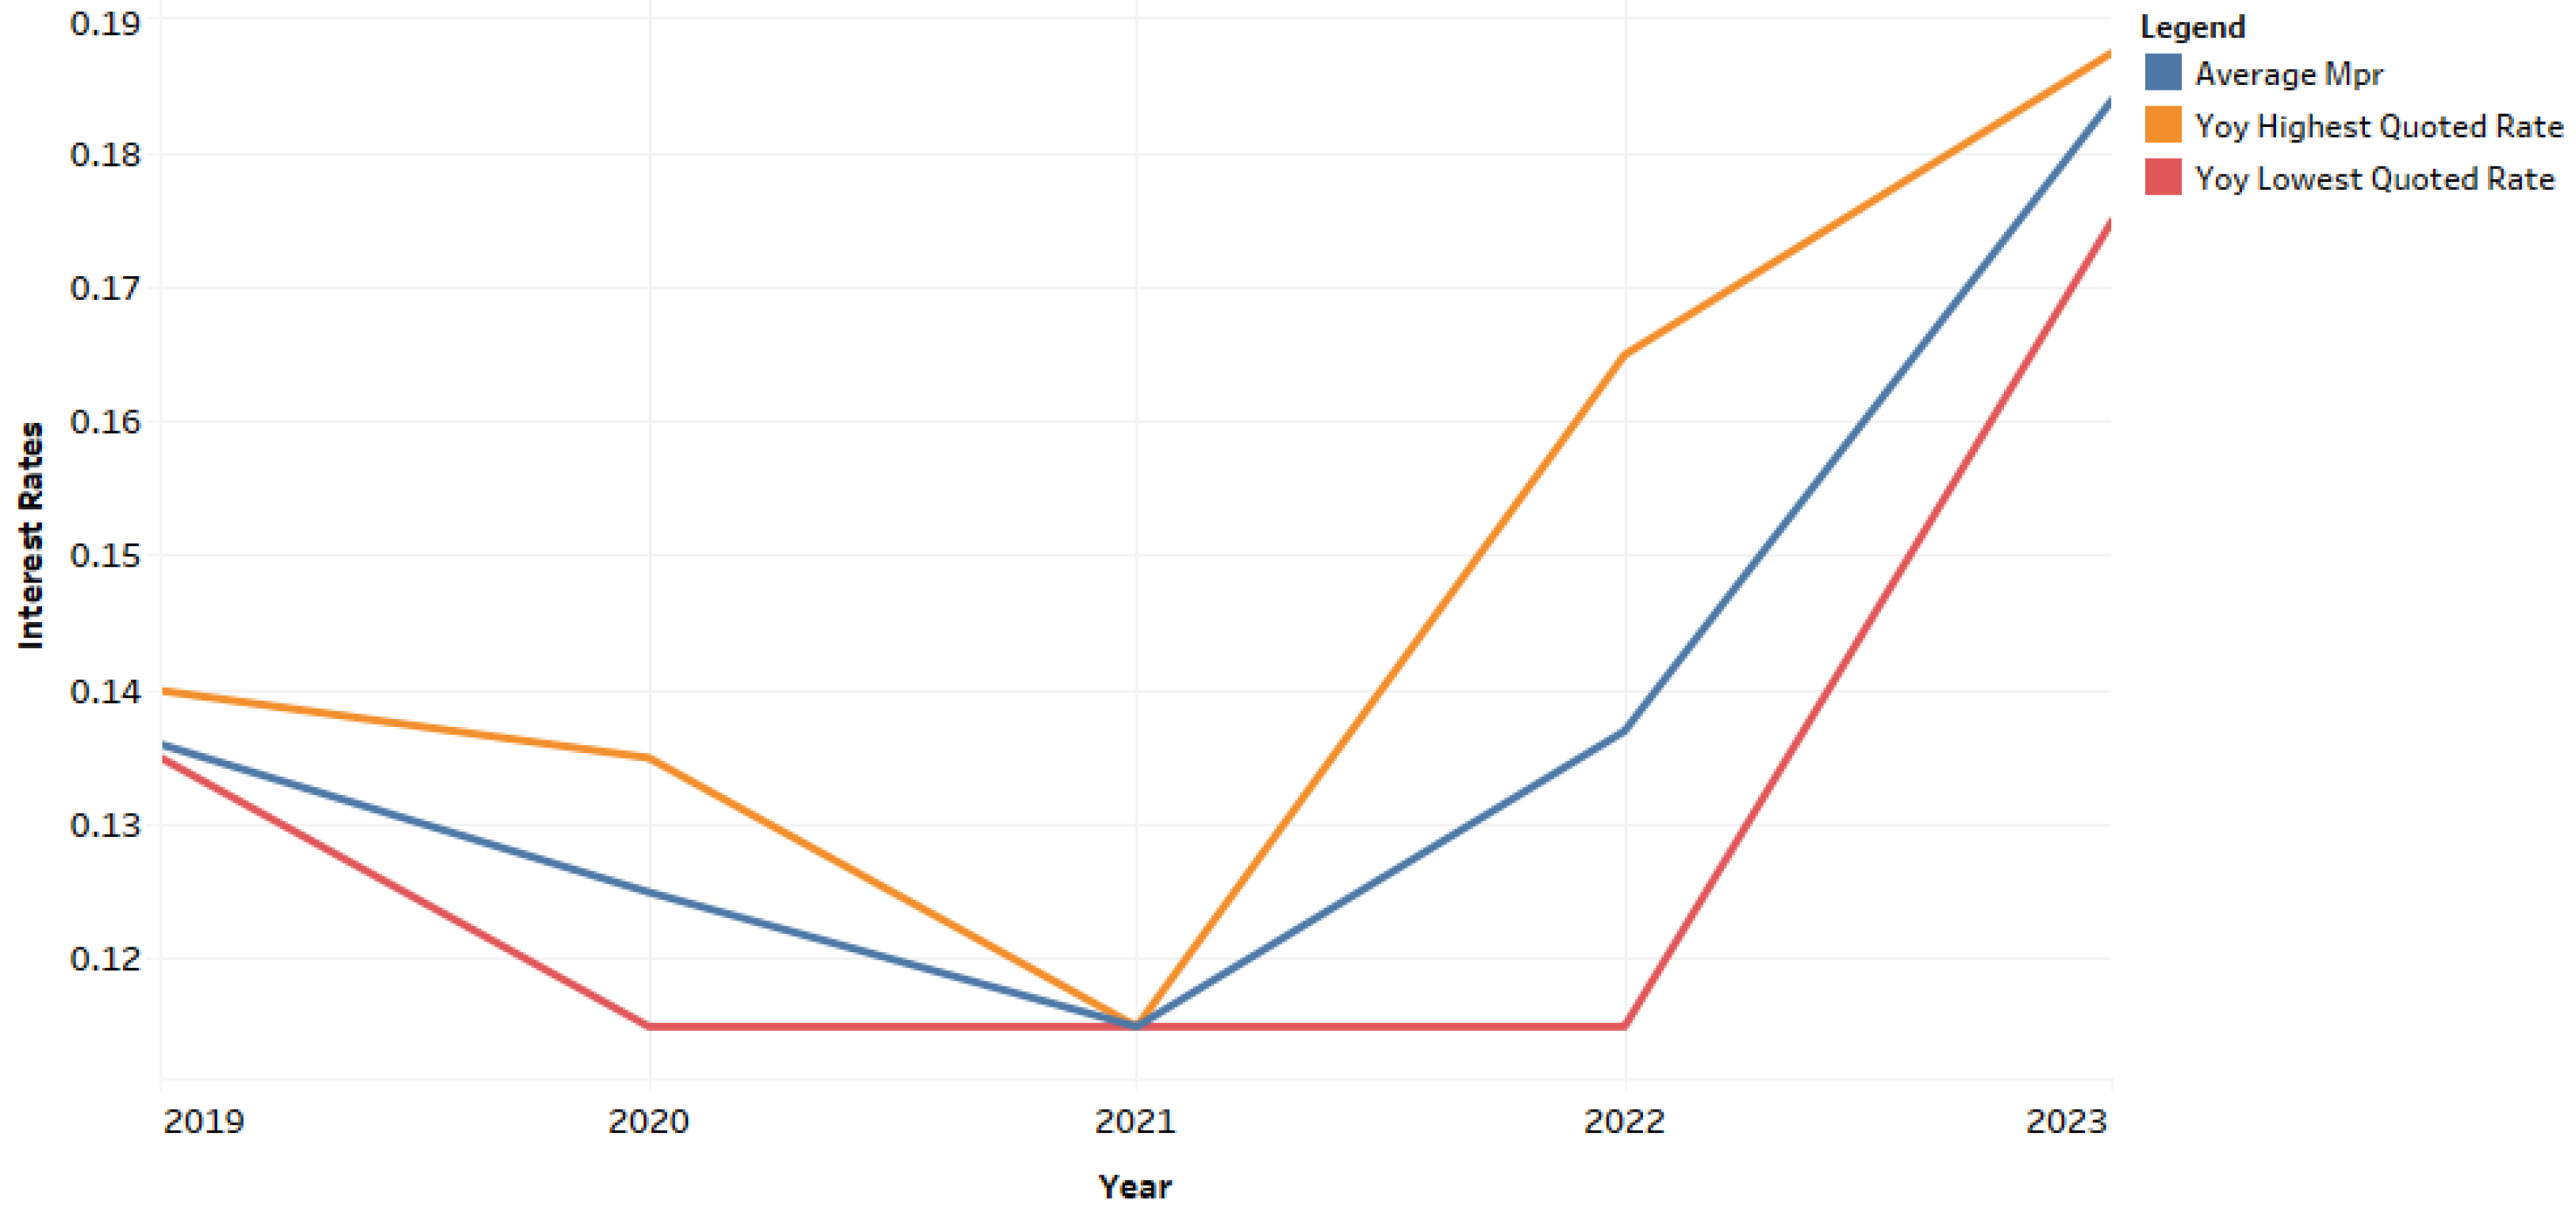
With a steadily rising year-on-year inflation rate (mostly influenced by food inflation), the nation’s interest rate spiked considerably over five years. These spikes were targeted at curbing rising inflation but it has slowed economic growth in 2024, such that the International Monetary Fund revised its economic growth projection for Nigeria in 2024 from 3.3% to 3.1%. With slowed production in the country due to a host of factors, more money chased the available stock of production. These available stocks of production have also begun to command higher costs/prices via transfer costs from producers and distributors alike. Thus, the ability to own and enjoy goods and services is available for those with above average means.
Figure 13. Nigeria’s interest rate between 2019-2023. Source: [27,28,29,30,31].
Preprints 117775 g011
From Figure 9, we see a 25% increase in the MPR between 2019 and 2023 and when placed side by side with the contributions of the real estate sector to the National real GDP between 2019-2023, we see that the policies instituted by the apex bank have not yet been able to create an investment environment, capable of increasing the country’s real GDP. The control measures adopted by the apex bank to avoid negative returns can be perceived as reactionary responses to the symptoms, as the main causes are yet to be addressed. Rising nominal interest rates are seen as a natural response to an economy experiencing free money and the opposite to one experiencing tight money, but its use as a metric to weigh monetary policy stances are often viewed as imperfect [70,71]. Nominal GDP growth and inflation can reveal the stability of a nation’s monetary background and this might explain why the impact of such a rise in interest rate might not necessarily be felt in the prices of various accommodation types in their respective markets [72,73]. Fluctuations in the country’s lending rate have been observed to influence price increases in properties [74,75]. With the ideology of housing affordability metamorphosing from the concepts of cost-to-income; and ease in accessing housing to sustainability, it has become clear that true housing affordability rests not only on the cost’s comparisons attached to it but also on its sustainability. Thus, a review of the economic trend of the nation, became necessary to reflect on the affordability and sustainability of housing needs today.
From the foregoing fundamentals, the nation Nigeria is going through one of its economic lows and while these events are anticipated to be cyclic, their impact on housing affordability to the common man is morphing into a luxurious choice.

2.3. Methodology

It is appropriate for research to follow a specific methodology. In this study, the mixed research design has been adopted. The mixed research design refers to a combination of qualitative and quantitative research techniques in finding answers to the research question.
The data used in this study were obtained from both primary and secondary sources via interviews, telephone surveys, and quarterly reports. Information on average passing rent for various rental accommodations within Lagos was sourced from quarterly real estate reports and field surveys, while data on country fundamentals were sourced from the country's online repositories.
Rent data for specific property types in Lagos were further analyzed for affordability convenience via the Rent-to-income Ratio. Several housing affordability indicators have been utilized in indicating the level of housing affordability. There are at least four types of measurement of housing affordability – price to income ratio (PIR), rent-to-income ratio (RIR), housing expenditure-to-income ratio, and residual income measure [76].
Utilizing average rents for specific housing stock in mainland and island zones, the rent-to-income ratio (RIR) was used to capture the percentage of annual monthly income that home dwellers would be expected to spend in renting homes. The ratio is represented thus;
RIR = M o n t h l y   R e n t G r o s s   I n c o m e   ( M o n t h l y )   x   100 %
The rule of thumb for optimum rent-to-income ratio is that anything above 30% and the chances of a tenant defaulting on their payments becomes likely possible. The idea is that the 70% balance should be directed towards other things, of which disposable income is part. The RIR was calculated using 2019 & 2023 rental figures.
3. Results

3.1. Lagos Mainland Rental Market Price Analysis

The Lagos mainland rental market is experiencing some increases in rental values for some accommodation types. This price increase, which is believed to have begun in late 2020, feature differently for locations in mainland, with the prime areas seeing higher values than the less prime ones. Before the advent of the Great Recession of 2008, [77]. reported that the constrained supply of new housing in prime areas must have stirred the hike in the price of homes. It is not uncommon that such a phenomenon has been taking form in Nigeria, particularly Lagos, whose housing situation has not been able to cater to its demand.
The Lagos occupant affordability using a price-to-income ratio metric was observed and the result was 14, which at the time was the highest and above the median ratio of 4.9 and the standard normative of 3.0 [18]. Such observations reinforce the idea that the affordability situation in Lagos is low and explain why informal housing is often a cheaper alternative resorted to by home dwellers. With informal housing, housing quality can assume an opportunity cost to affordability for some households [78].
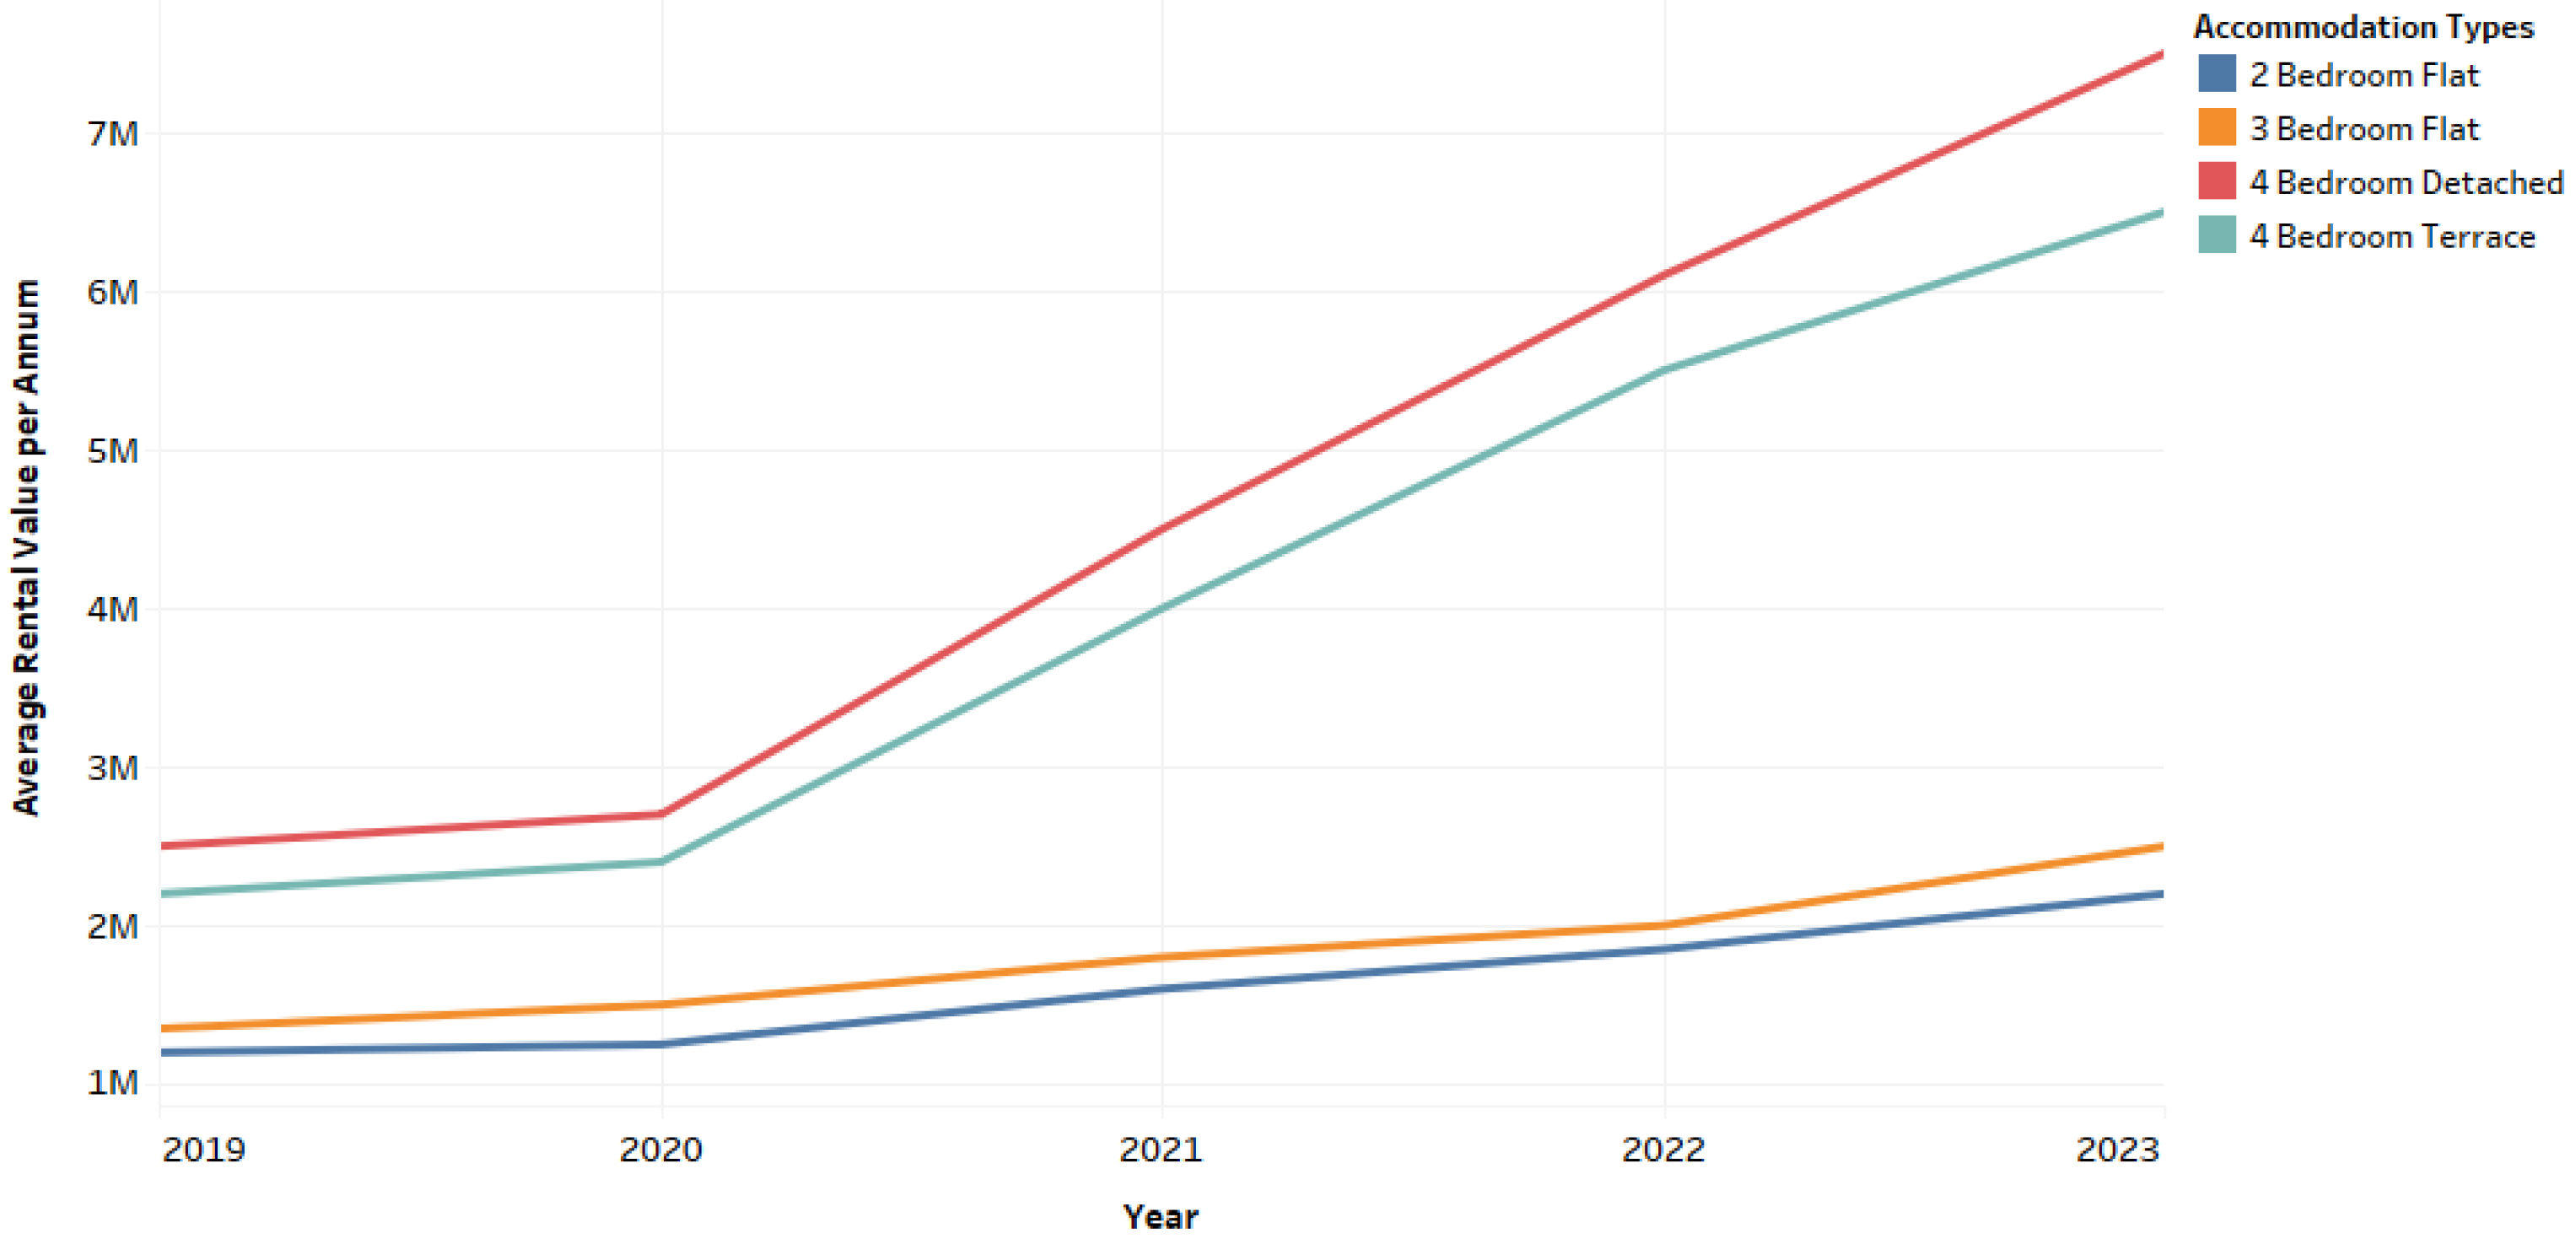
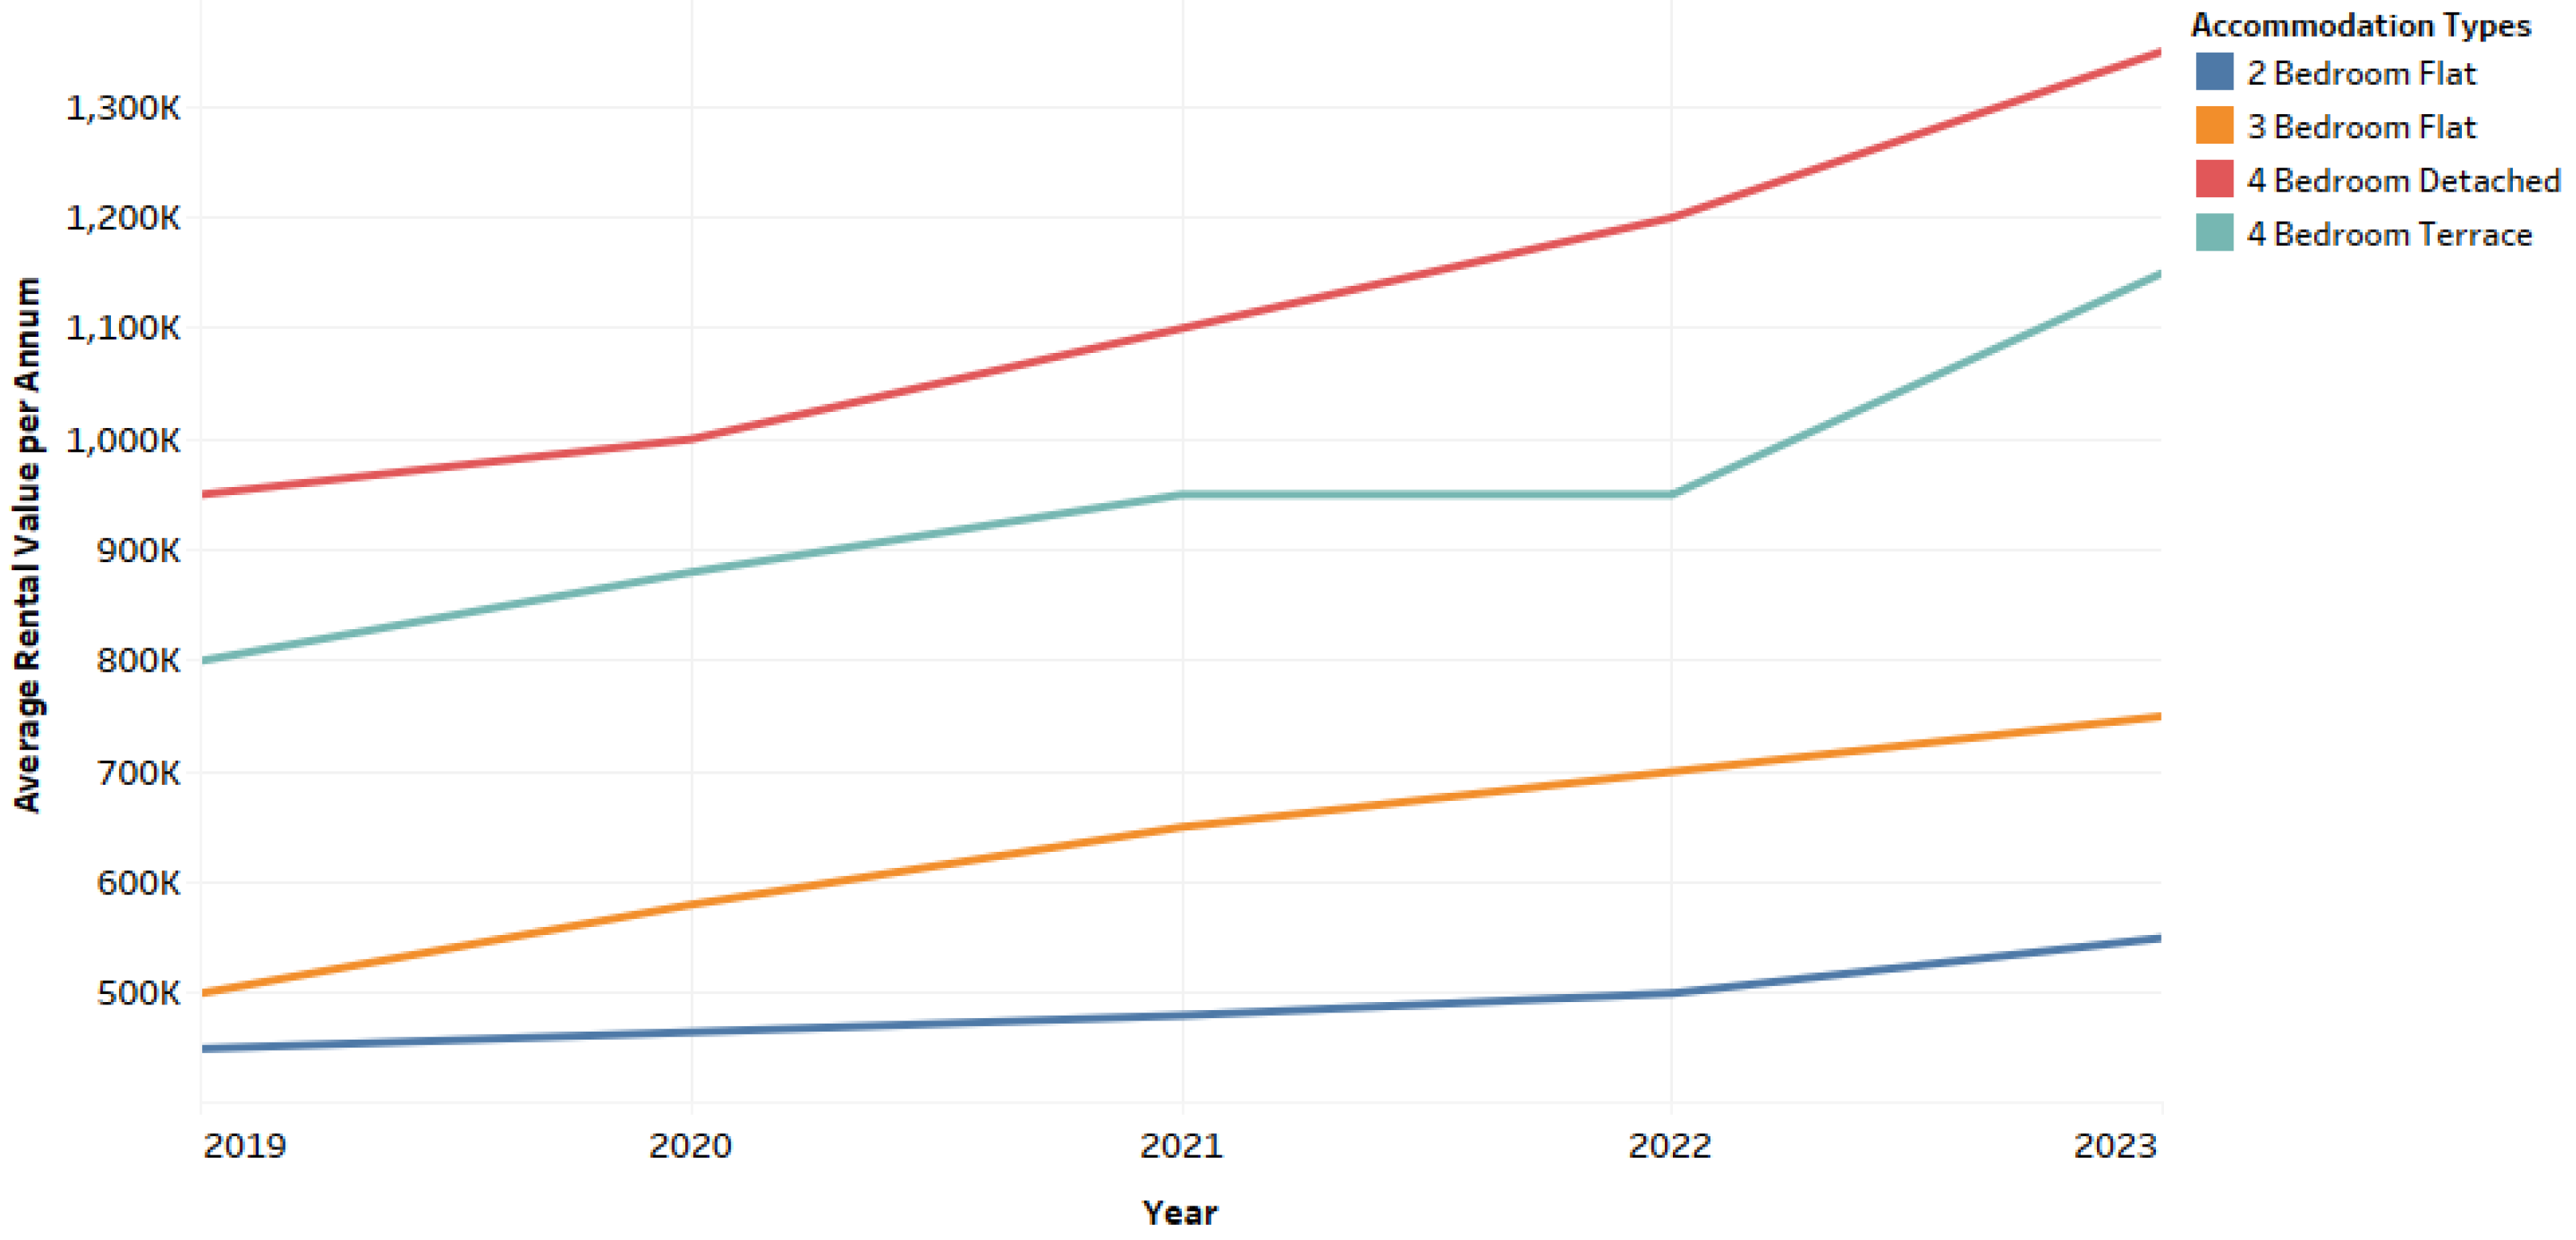
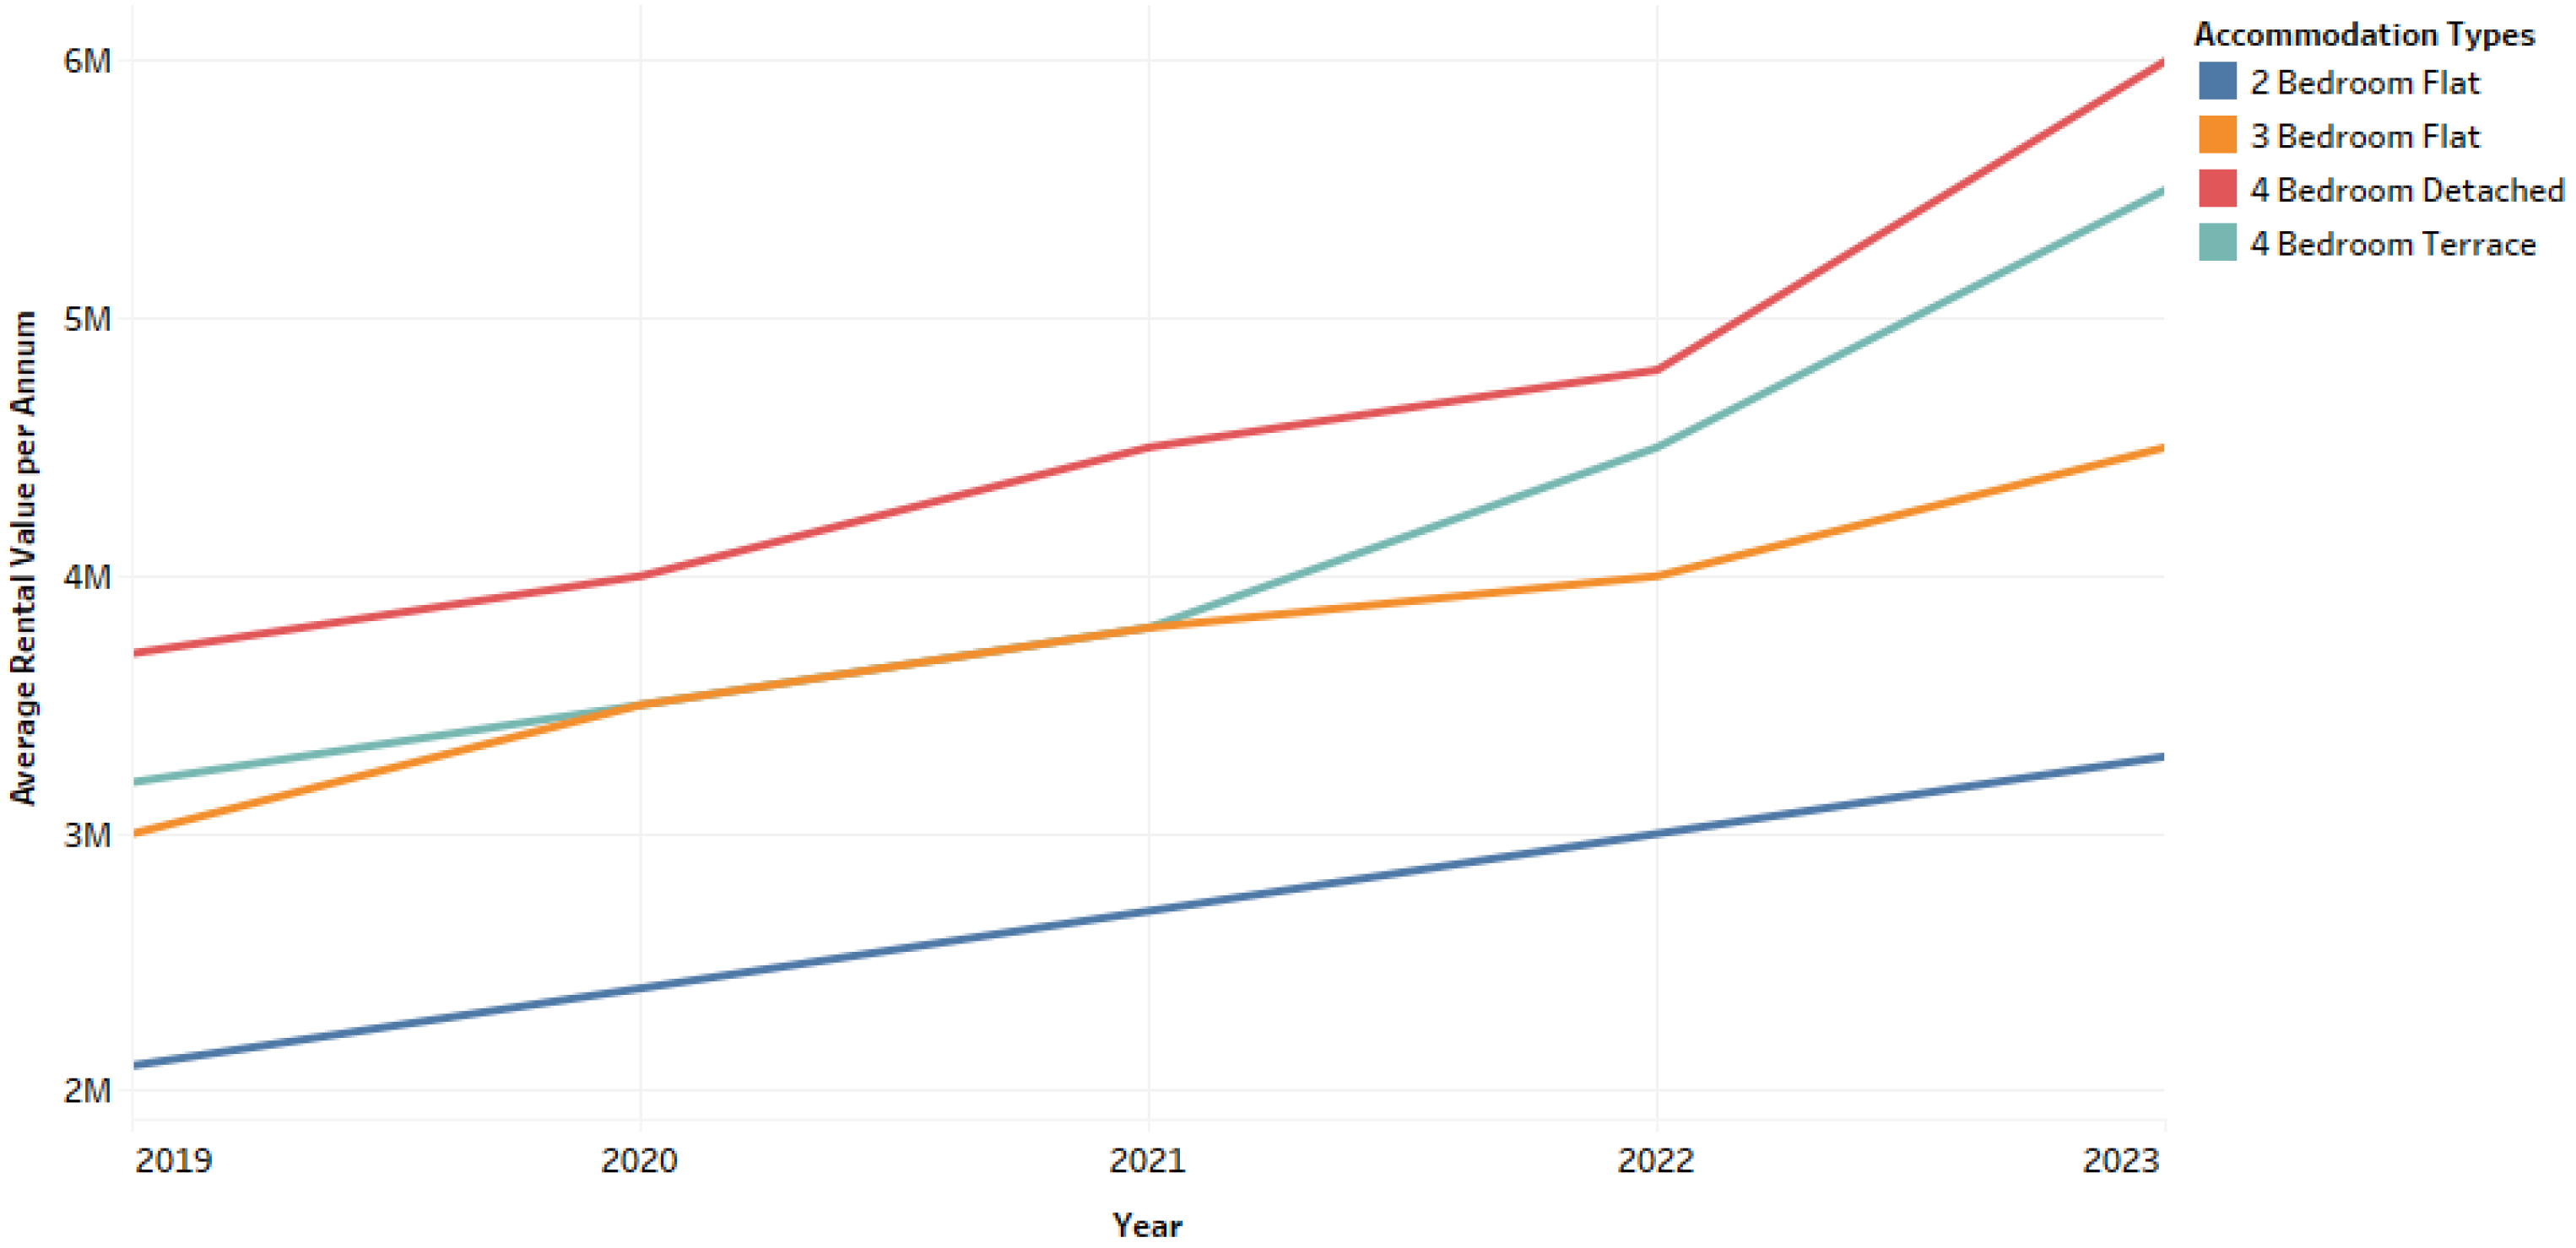
Figure 14. Accommodation values for property types in Surulere, Yaba, Ilupeju, and Gbagada axis between 2019-2023. Source: [79,80] & Ugwuejim et al.
Preprints 117775 g012
Table 5. Rent-Income-Ratio for SYIG in 2023.
INCOME BANDS AVERAGE INCOME 2BD APT 3BD APT 4BD DET DPLX 4BD TERR. DPLX
<30K ₦30,000.00 611% 694% 2083% 1806%
50K-100K ₦75,000.00 244% 278% 833% 722%
100K-150K ₦125,000.00 147% 167% 500% 433%
150K-300K ₦225,000.00 81% 93% 278% 241%
300K-500K ₦400,000.00 46% 52% 156% 135%
600K-1M ₦800,000.00 23% 26% 78% 68%
2M-5M ₦3,500,000.00 5% 6% 18% 15%
8M> ₦4,000,000.00 5% 5% 16% 14%
Source: Ugwuejim et al.
Table 6. Rent-Income-Ratio for SYIG in 2019.
INCOME BANDS AVERAGE INCOME 2BD APT 3BD APT 4BD DET DPLX 4BD TERR. DPLX
<30K ₦30,000.00 333.33% 375.00% 694.44% 611.11%
50K-100K ₦75,000.00 133.33% 150.00% 277.78% 244.44%
100K-150K ₦125,000.00 80.00% 90.00% 166.67% 146.67%
150K-300K ₦225,000.00 44.44% 50.00% 92.59% 81.48%
300K-500K ₦400,000.00 25.00% 28.13% 52.08% 45.83%
600K-1M ₦800,000.00 12.50% 14.06% 26.04% 22.92%
2M-5M ₦3,500,000.00 2.86% 3.21% 5.95% 5.24%
8M> ₦4,000,000.00 2.50% 2.81% 5.21% 4.58%
Source: Ugwuejim et al.
Surulere, Yaba, Ilupeju and Gbagada axis (S.Y.I.G.) experienced a steep in the rental values of its 4-bedrooms. This hike had created a scare for households who have either had to relocate to sub-prime areas or switch accommodation types that they can cater for. This axis is rated prime in Lagos Mainland. Its affordability convenience is low, as only those from the 600k-1M income band can conveniently afford 2-3 bedrooms and 2M-5M can afford 4 bedrooms.
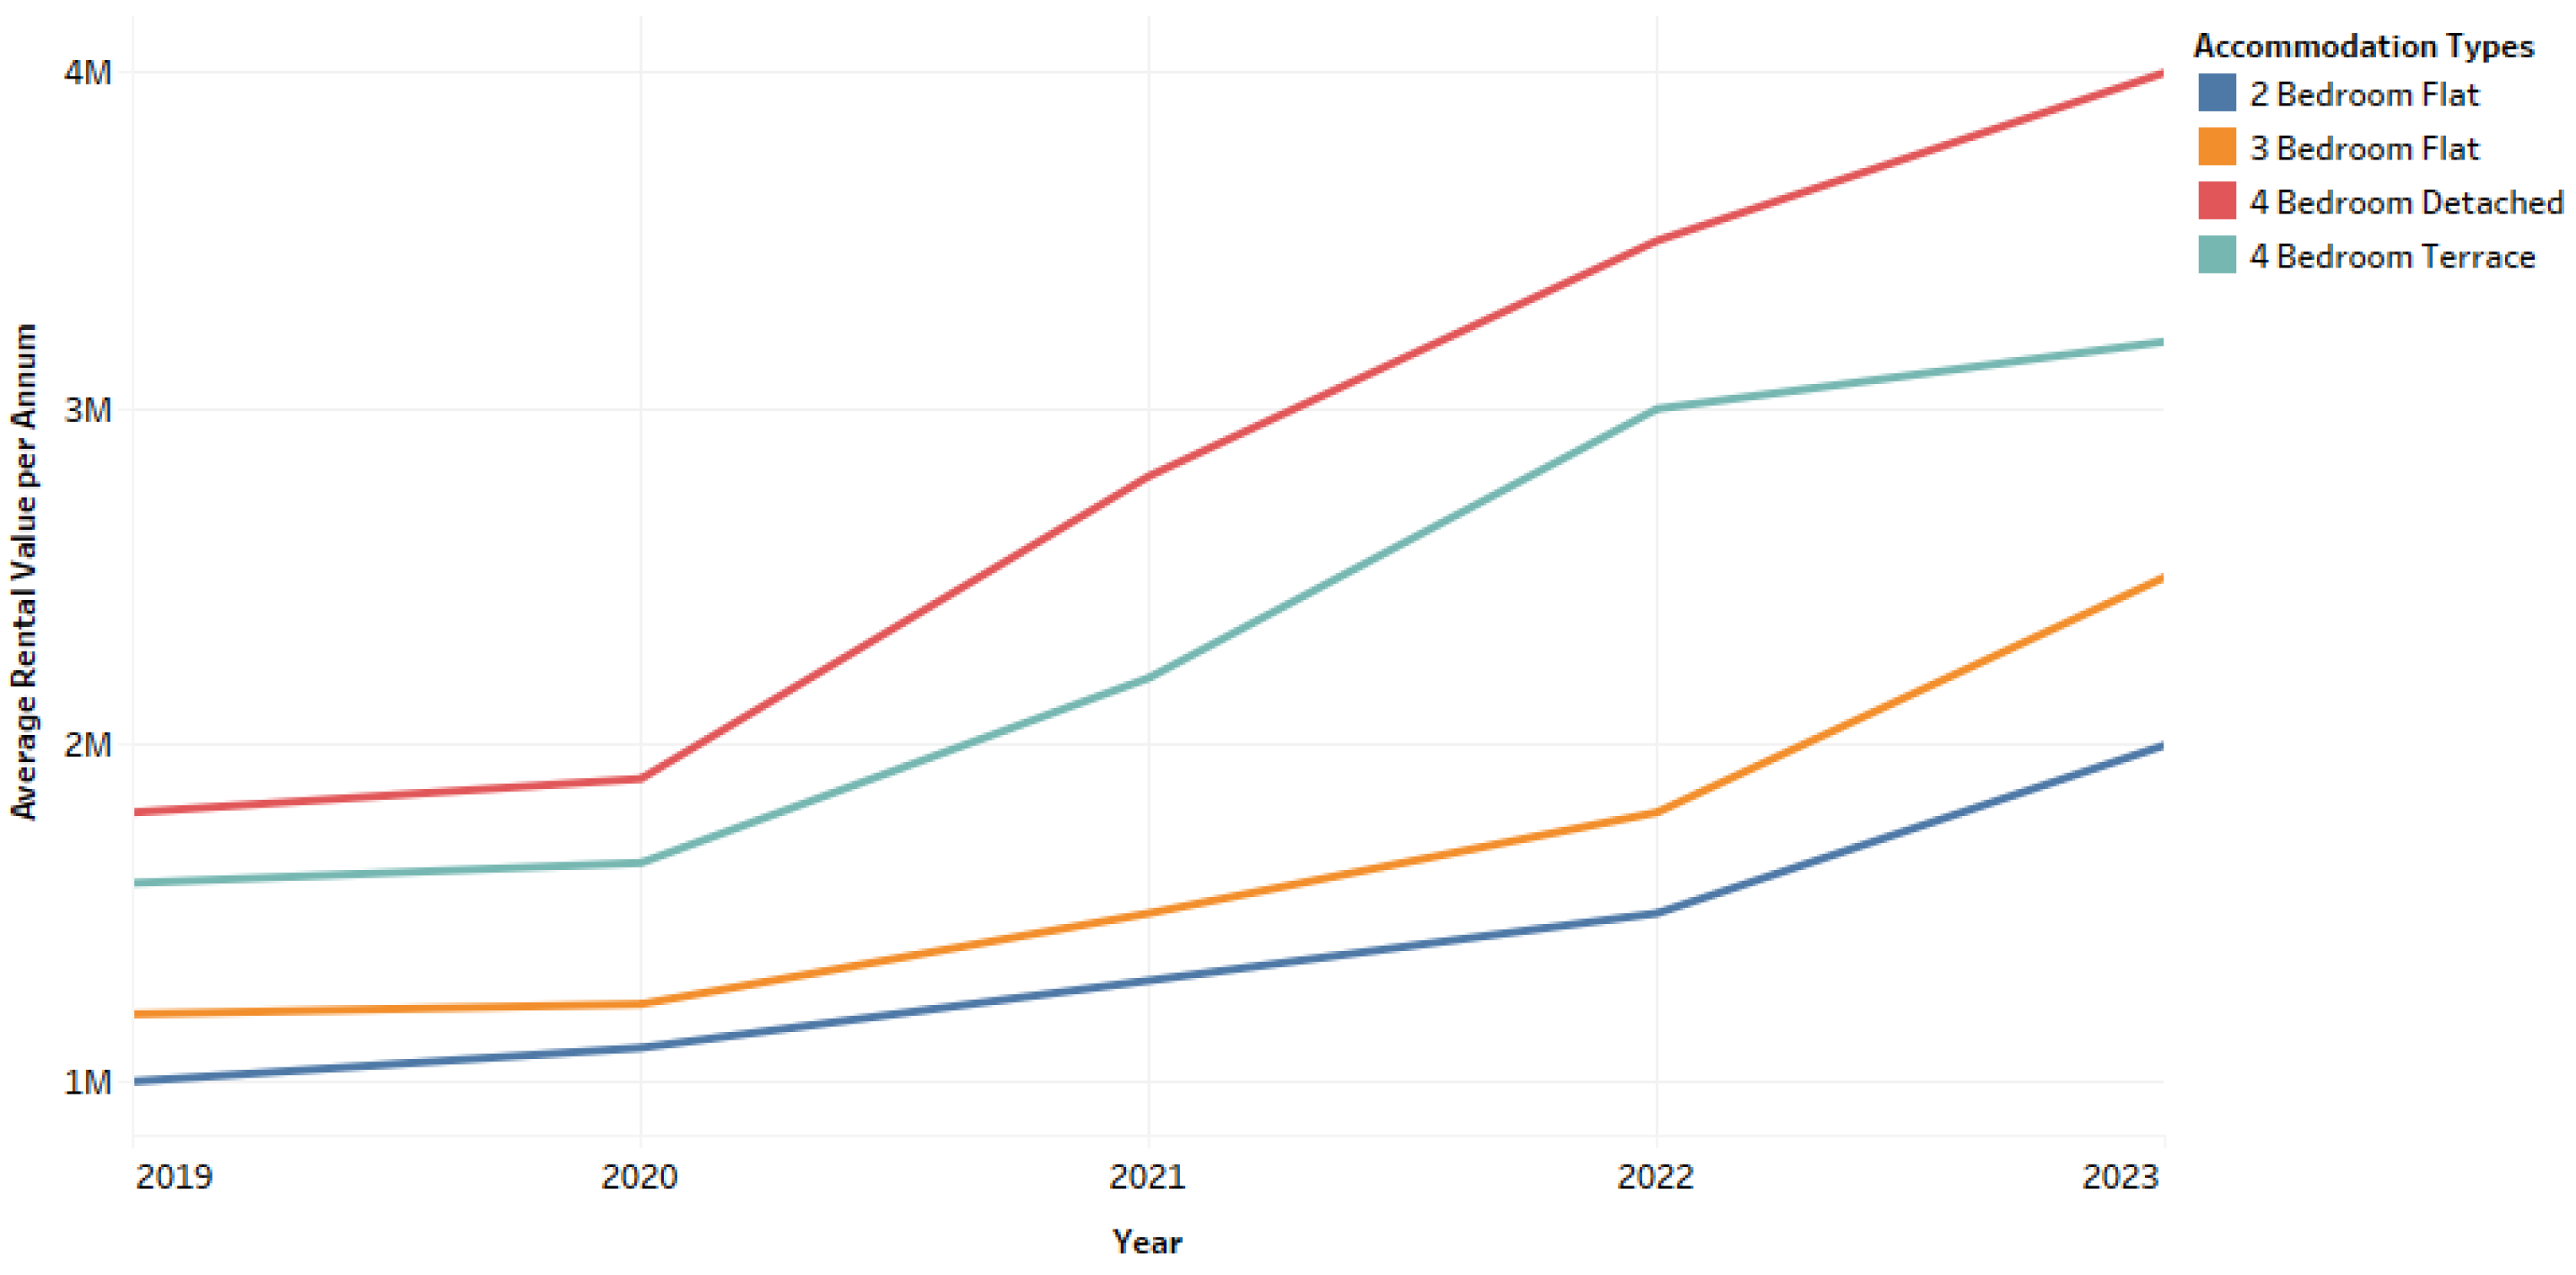
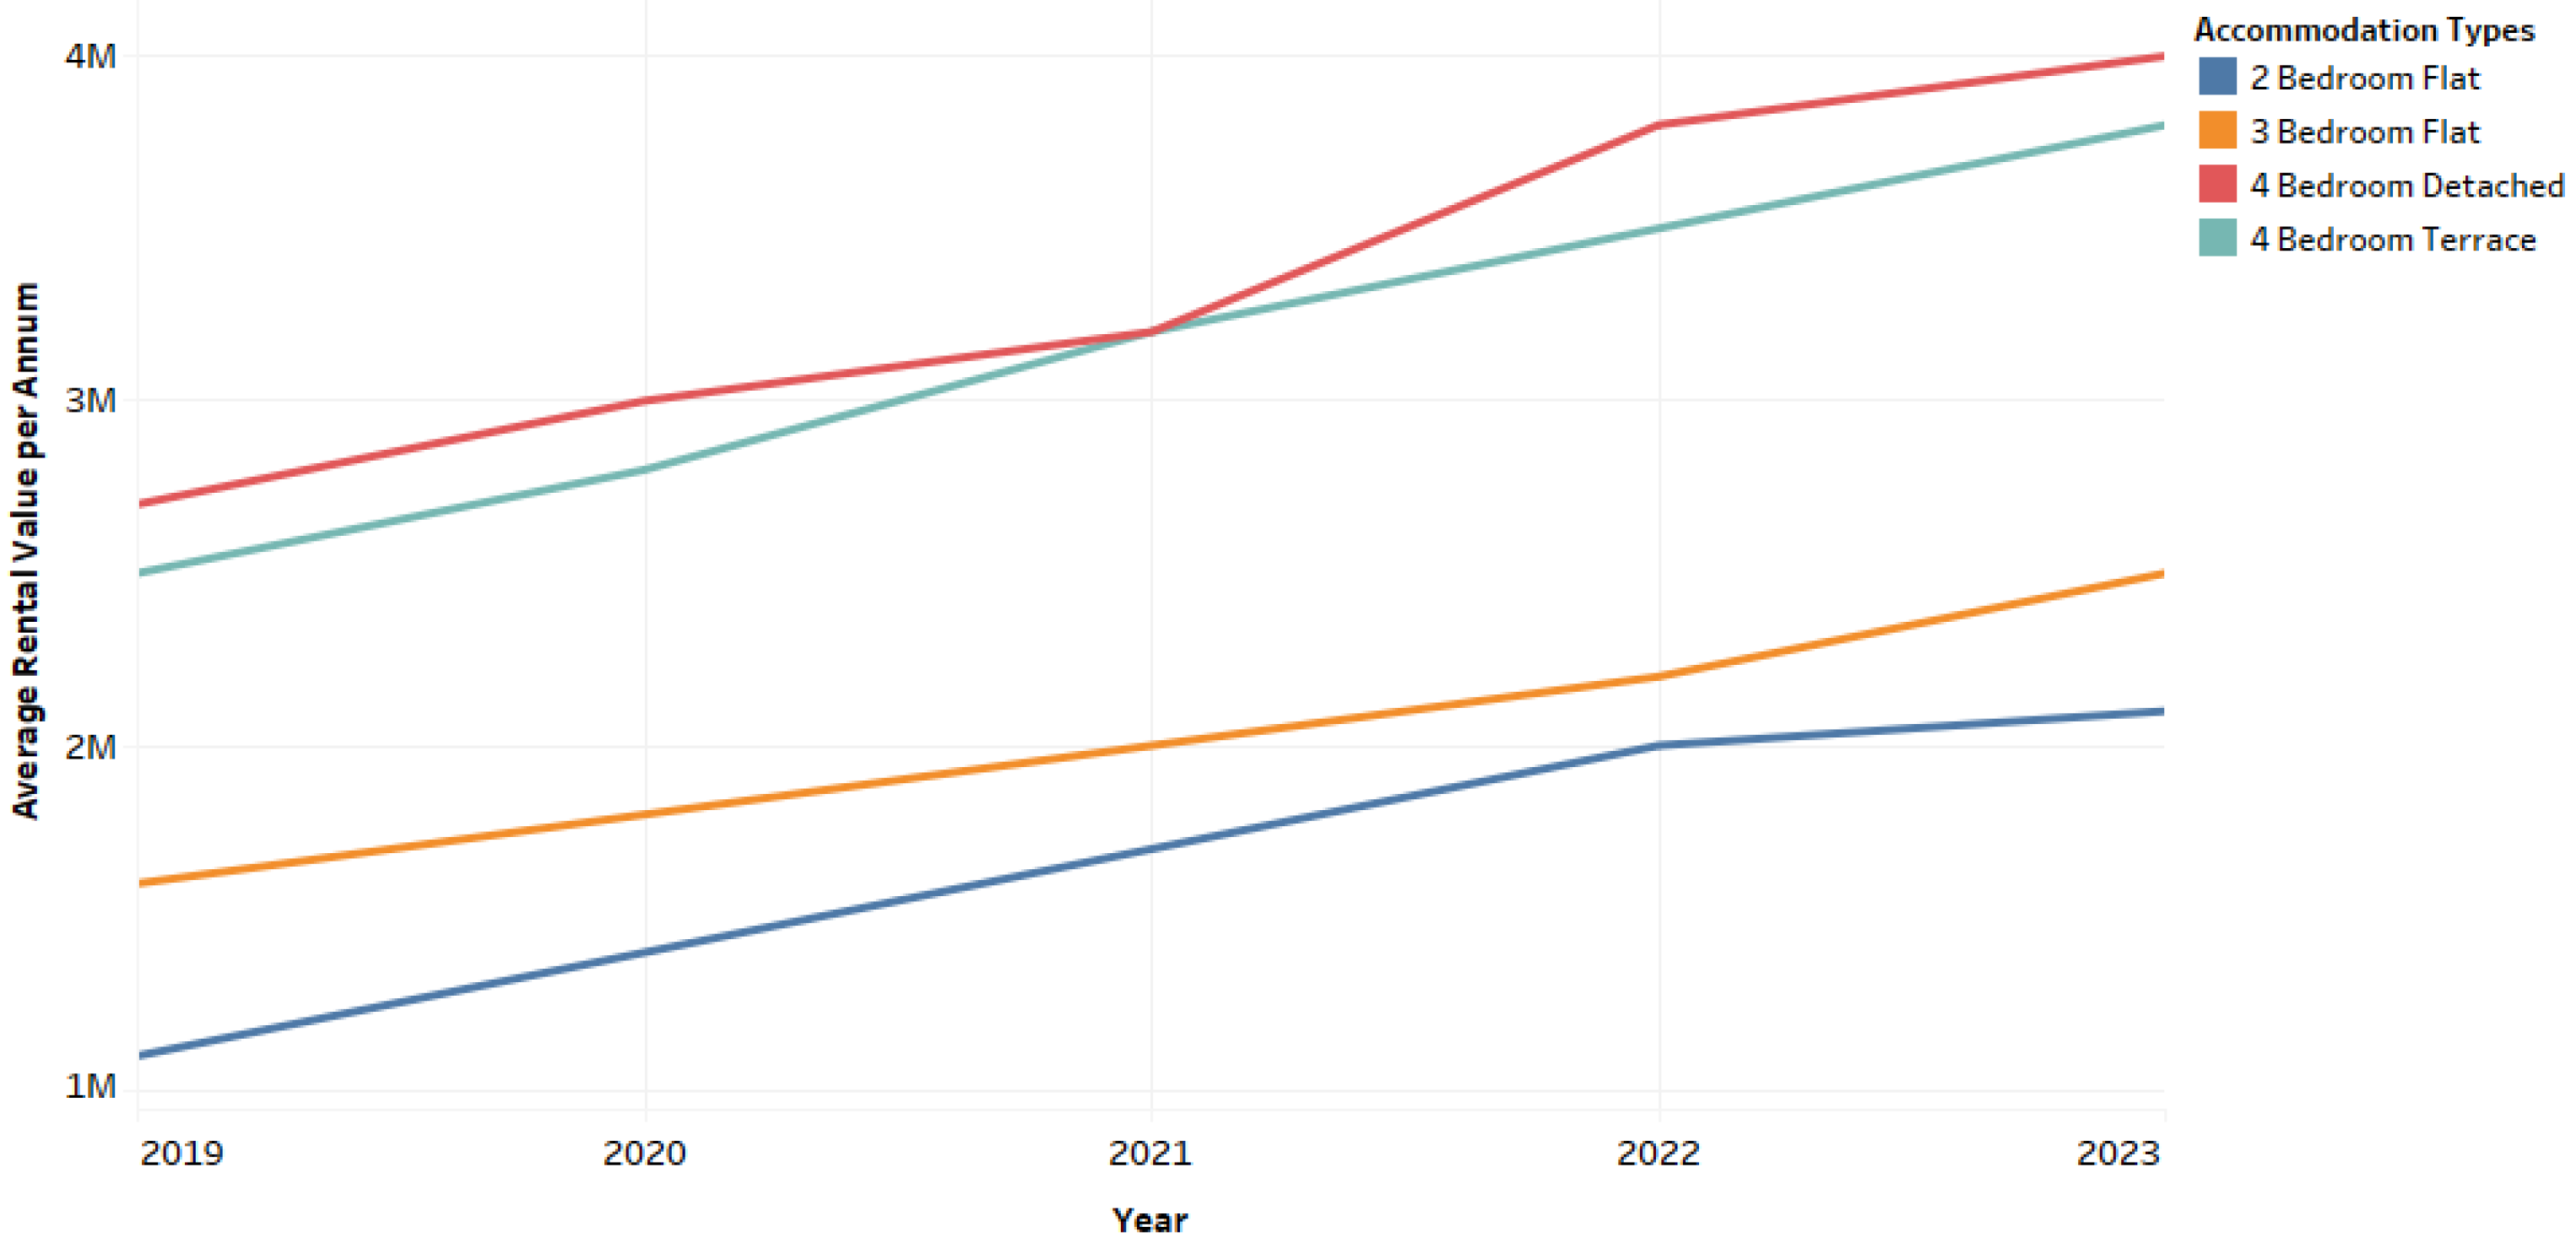
Figure 15. Accommodation values for property types in Amuwo-Odofin, Isolo, and Festac axis between 2019-2023. Source: [79,80] & Ugwuejim et al.
Preprints 117775 g013
Table 7. Rent-Income-Ratio for AIF in 2023.
INCOME BANDS AVERAGE INCOME 2BD APT 3BD APT 4BD DET DPLX 4BD TERR. DPLX
<30K ₦30,000.00 556% 694% 1111% 889%
50K-100K ₦75,000.00 222% 278% 444% 356%
100K-150K ₦125,000.00 133% 167% 267% 213%
150K-300K ₦225,000.00 74% 93% 148% 119%
300K-500K ₦400,000.00 42% 52% 83% 67%
600K-1M ₦800,000.00 21% 26% 42% 33%
2M-5M ₦3,500,000.00 5% 6% 10% 8%
8M> ₦4,000,000.00 4% 5% 8% 7%
Source: Ugwuejim et al.
Table 8. Rent-Income-Ratio for AIF in 2019.
INCOME BANDS AVERAGE INCOME 2BD APT 3BD APT 4BD DET DPLX 4BD TERR. DPLX
<30K ₦30,000.00 277.78% 333.33% 500.00% 441.67%
50K-100K ₦75,000.00 111.11% 133.33% 200.00% 176.67%
100K-150K ₦125,000.00 66.67% 80.00% 120.00% 106.00%
150K-300K ₦225,000.00 37.04% 44.44% 66.67% 58.89%
300K-500K ₦400,000.00 20.83% 25.00% 37.50% 33.13%
600K-1M ₦800,000.00 10.42% 12.50% 18.75% 16.56%
2M-5M ₦3,500,000.00 2.38% 2.86% 4.29% 3.79%
8M> ₦4,000,000.00 2.08% 2.50% 3.75% 3.31%
Source: Ugwuejim et al.
This axis is rated sub-prime in Lagos Mainland. With the prime areas becoming expensive to dwell in, axes like these have provided an abode for users with the means to afford. Nonetheless, its rise from late 2020 has the impact of gentrification to appreciate, as the migration of home users from prime neighborhoods or the presence of newly built, renovated, or refurbished homes in its neighborhood, had begun to create spikes in rental prices for 2-3-bedrooms.
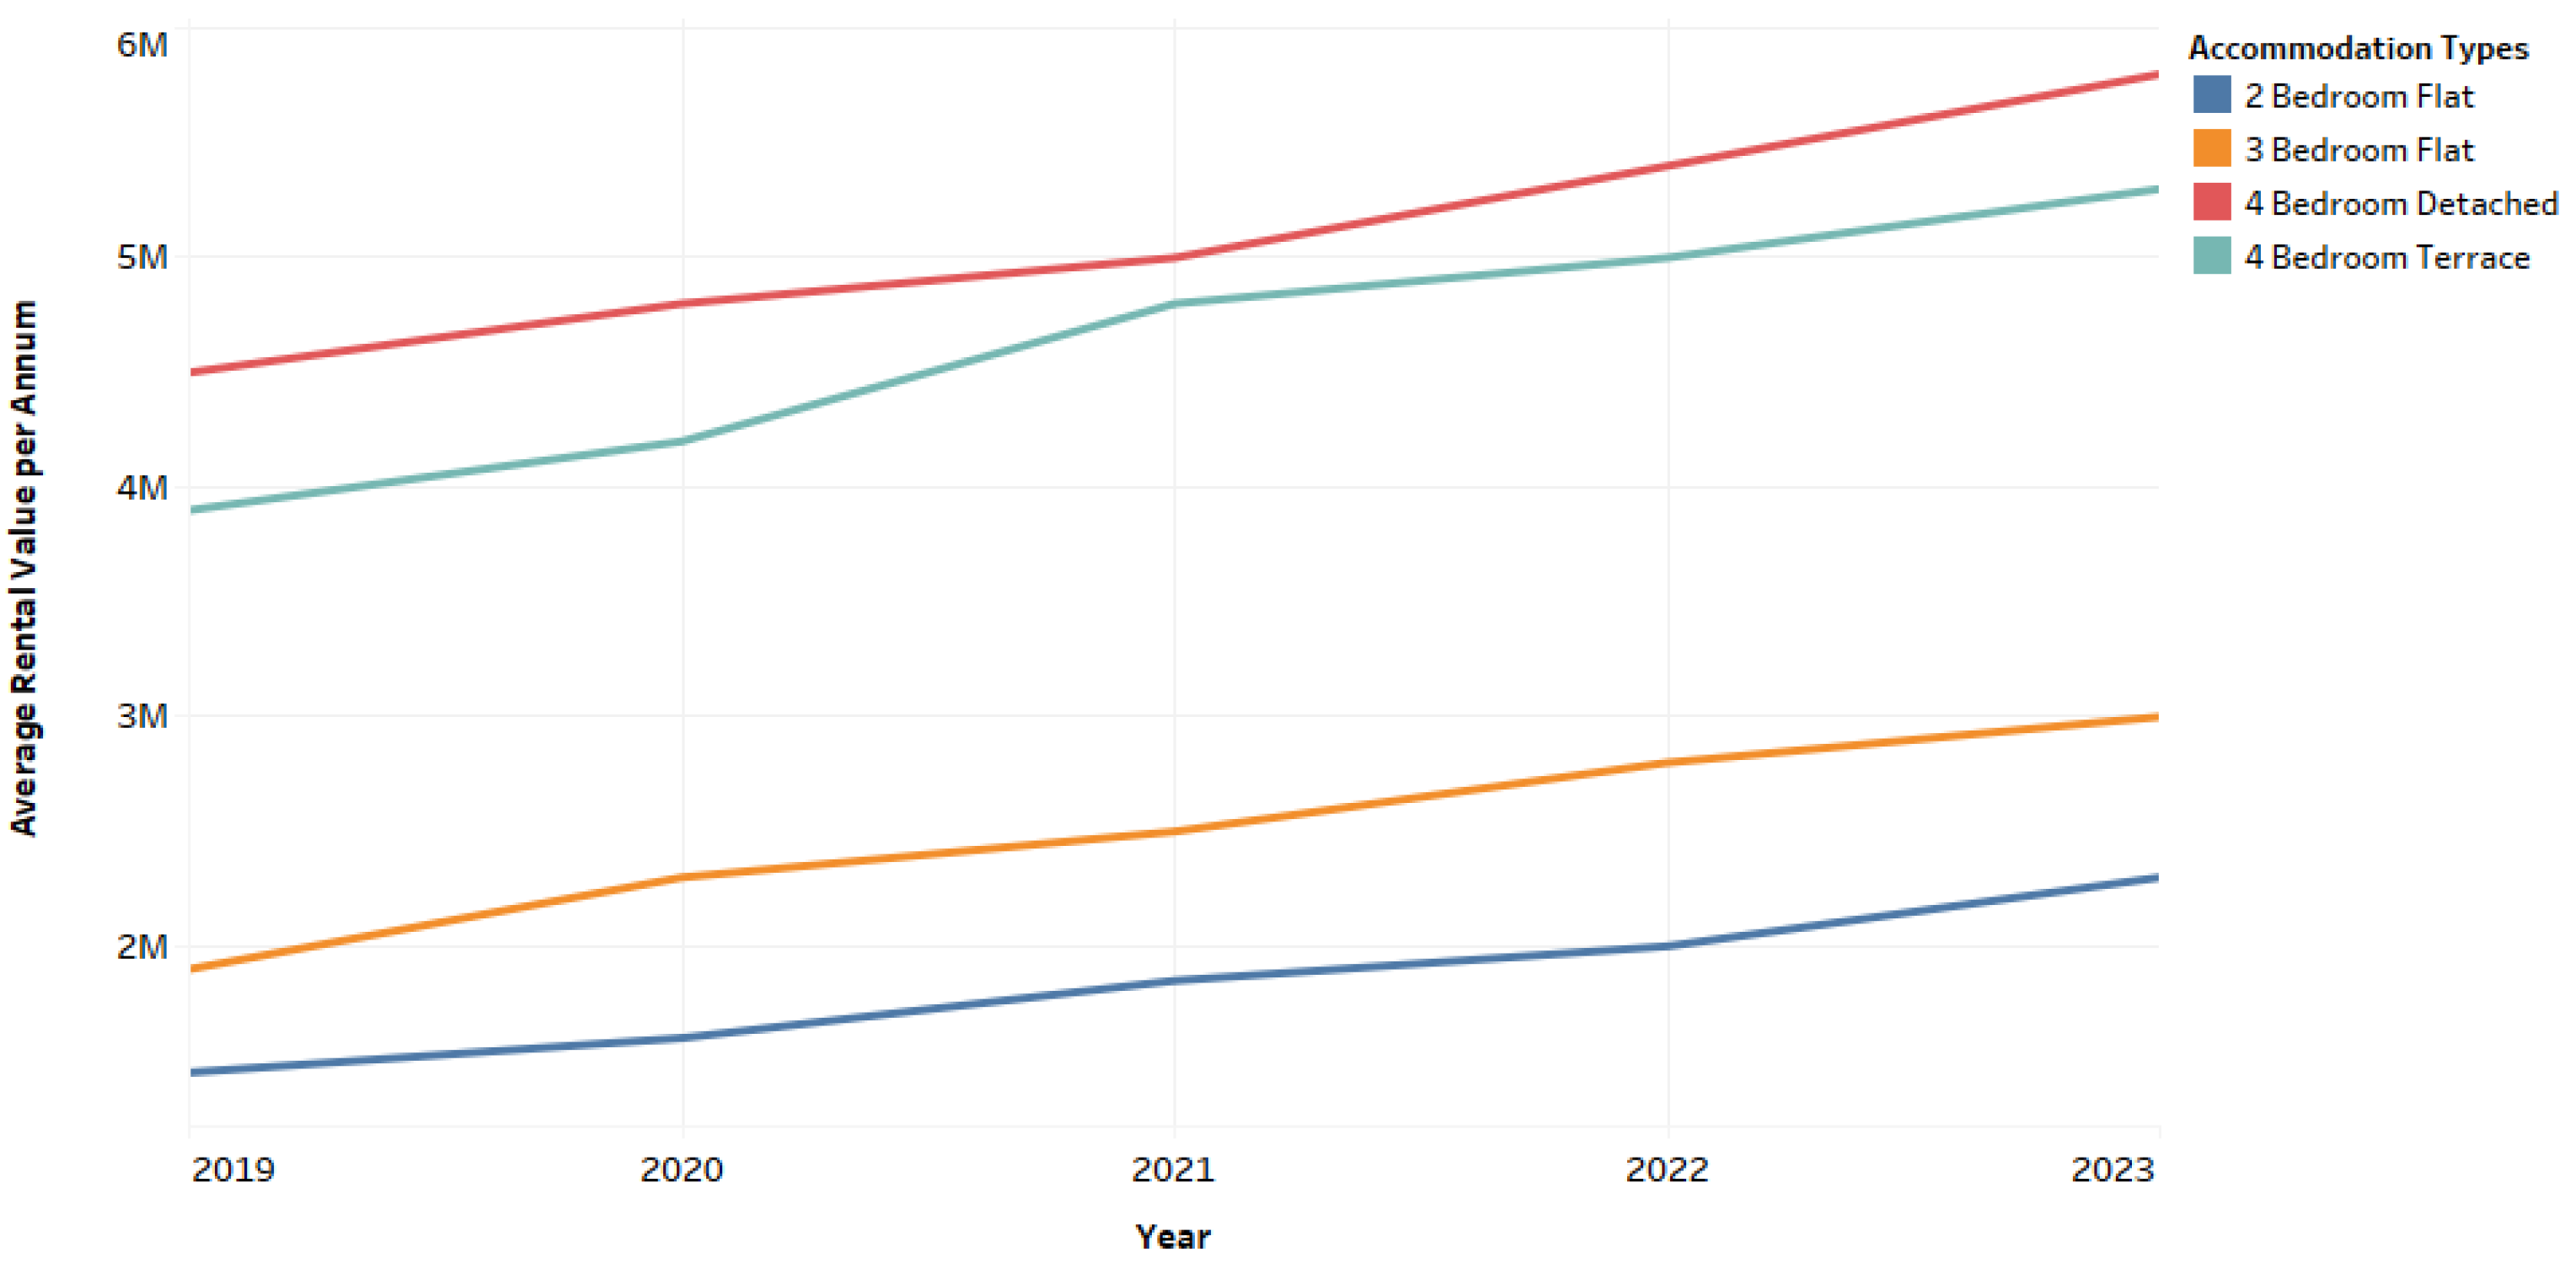
Figure 16. Accommodation values for property types in Ikeja GRA, Ikeja Main and Maryland axis between 2019-2023. Source: [79,80] & Ugwuejim et al.
Preprints 117775 g014
Table 9. Rent-Income-Ratio for IGM in 2023.
INCOME BANDS AVERAGE INCOME 2BD APT 3BD APT 4BD DET DPLX 4BD TERR. DPLX
<30K ₦30,000.00 1250% 1611% 2083% 1917%
50K-100K ₦75,000.00 500% 644% 833% 767%
100K-150K ₦125,000.00 300% 387% 500% 460%
150K-300K ₦225,000.00 167% 215% 278% 256%
300K-500K ₦400,000.00 94% 121% 156% 144%
600K-1M ₦800,000.00 47% 60% 78% 72%
2M-5M ₦3,500,000.00 11% 14% 18% 16%
8M> ₦4,000,000.00 9% 12% 16% 14%
Source: Ugwuejim et al.
Table 10. Rent-Income-Ratio for IGM in 2019.
INCOME BANDS AVERAGE INCOME 2BD APT 3BD APT 4BD DET DPLX 4BD TERR. DPLX
<30K ₦30,000.00 694.44% 833.33% 1527.78% 1388.89%
50K-100K ₦75,000.00 277.78% 333.33% 611.11% 555.56%
100K-150K ₦125,000.00 166.67% 200.00% 366.67% 333.33%
150K-300K ₦225,000.00 92.59% 111.11% 203.70% 185.19%
300K-500K ₦400,000.00 52.08% 62.50% 114.58% 104.17%
600K-1M ₦800,000.00 26.04% 31.25% 57.29% 52.08%
2M-5M ₦3,500,000.00 5.95% 7.14% 13.10% 11.90%
8M> ₦4,000,000.00 5.21% 6.25% 11.46% 10.42%
Source: Ugwuejim et al.
This axis which is the seat of power in Lagos Mainland is rated prime. Like other prime neighborhoods in this axis, rental prices began to rise in late 2020. Table 7 shows that the monthly income bands from below 30,000 to 1,000,000 are paying way above the optimum 30% of their gross income. This poses a risk for low-income earners with their gross income. This axis has an affordability convenience that is much lower than the SYIG axis.
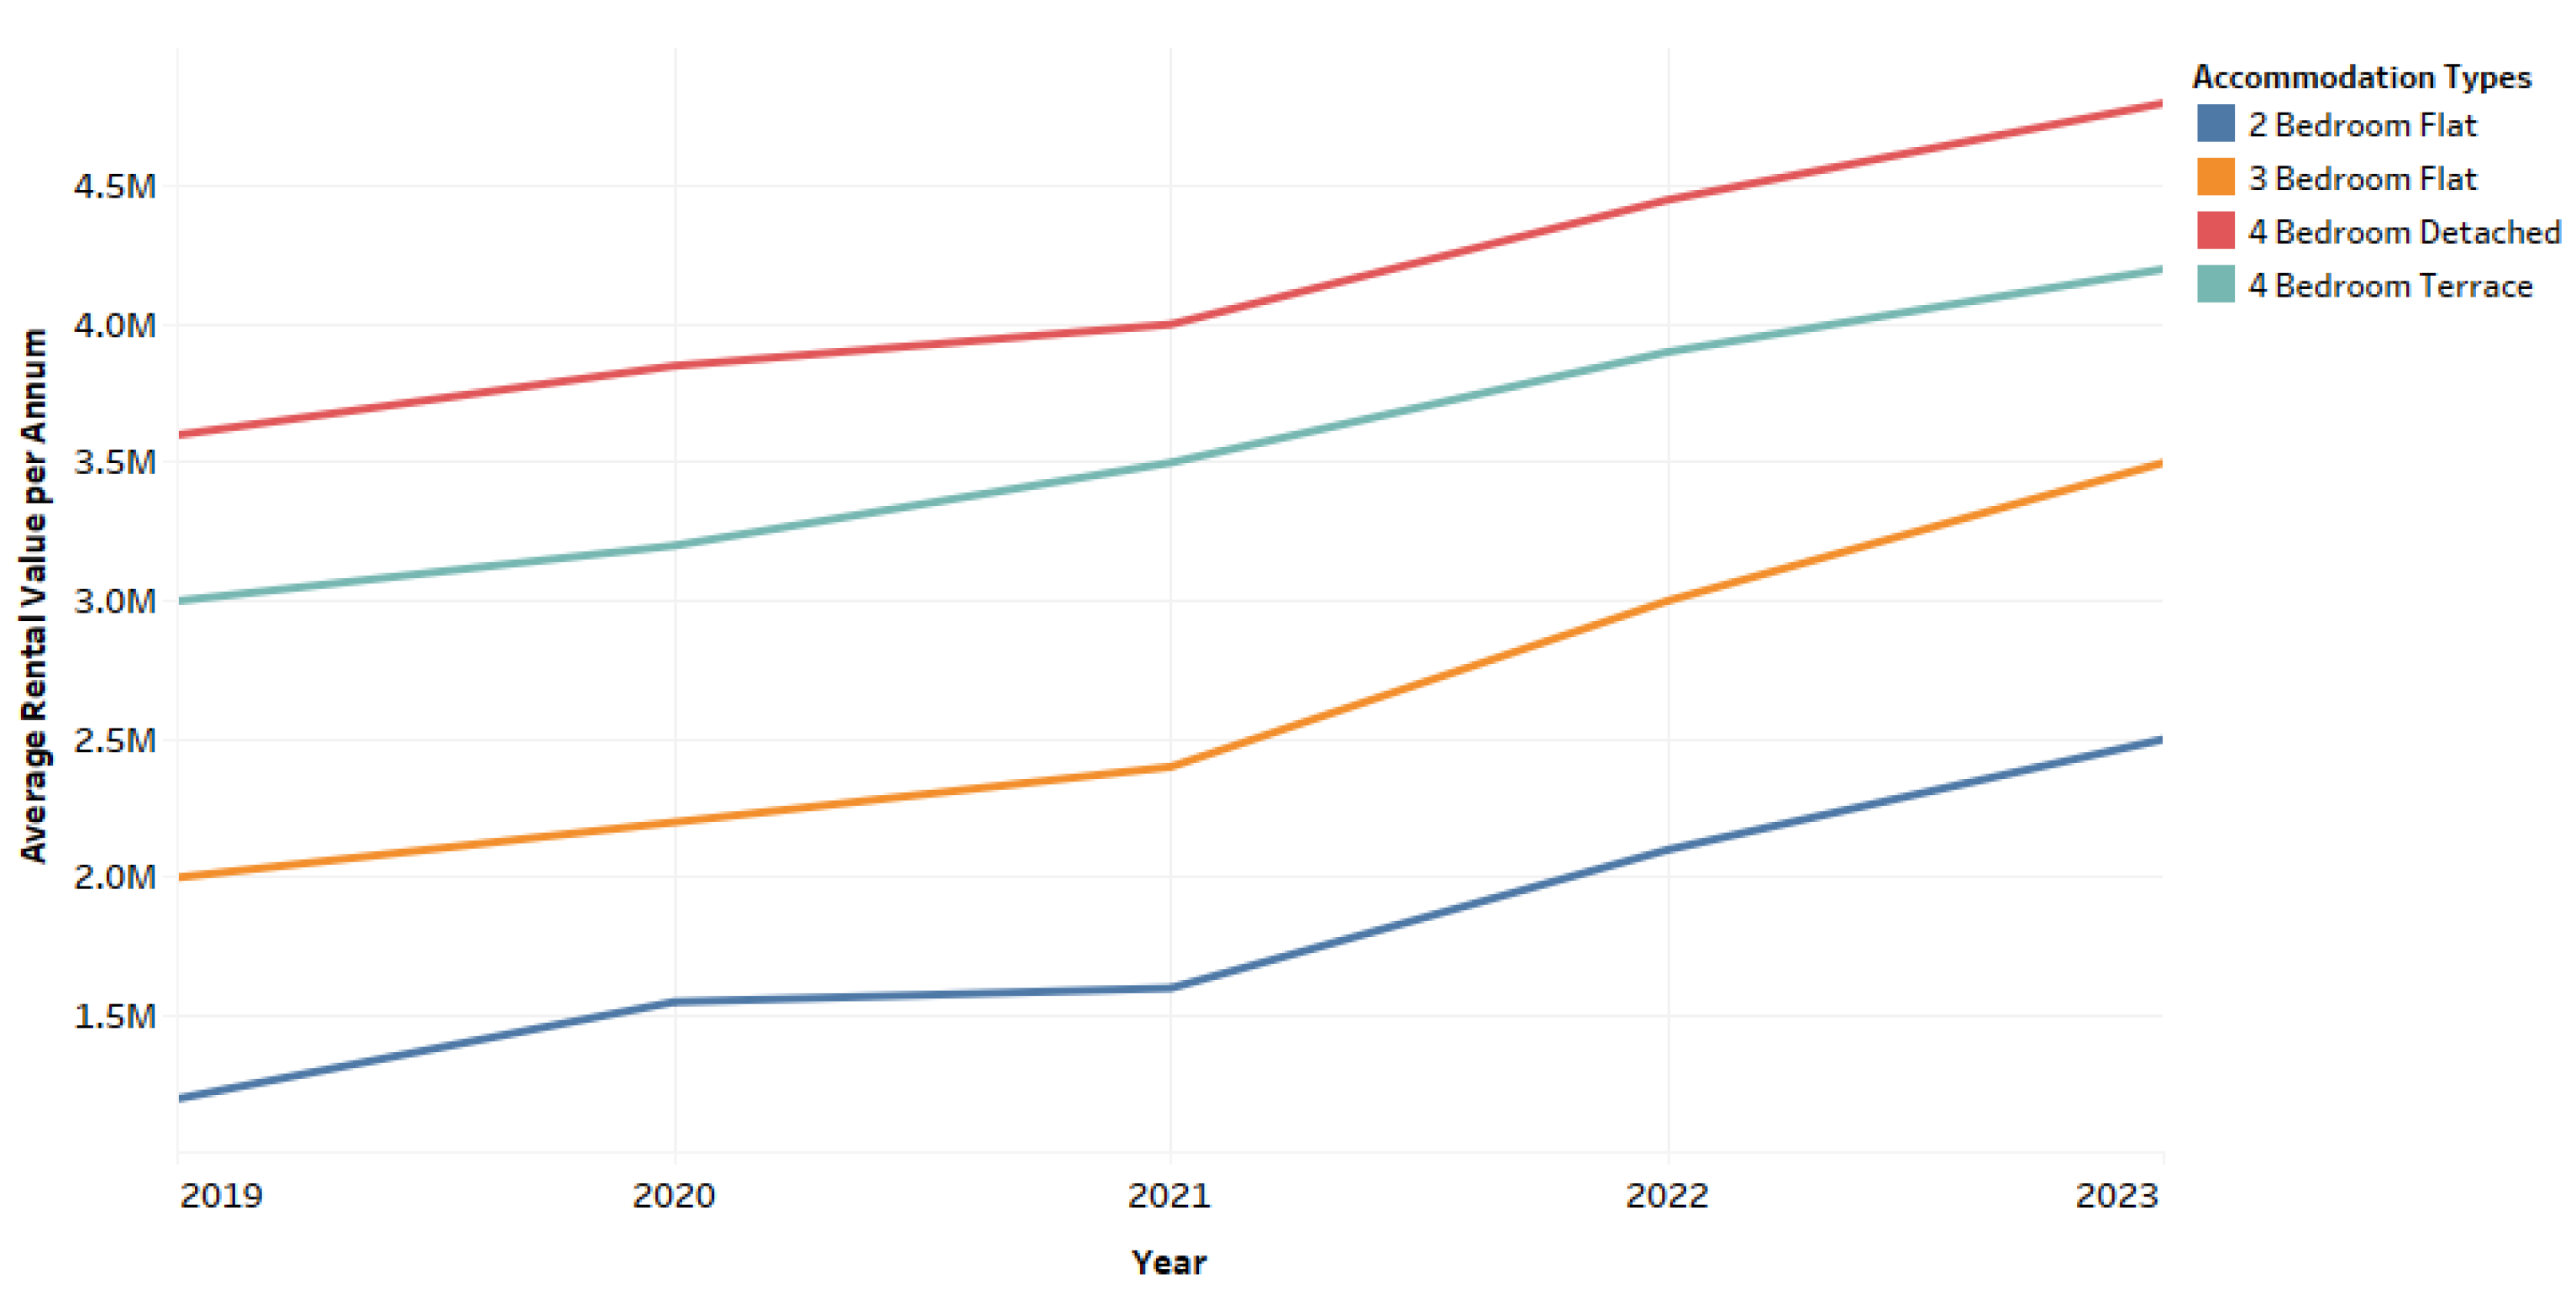
Figure 17. Accommodation values for property types in Ogudu and Magodo axis between 2019-2023. Source: [79,80] & Ugwuejim et al.
Preprints 117775 g015
Table 11. Rent-Income-Ratio for OM in 2023.
INCOME BANDS AVERAGE INCOME 2BD APT 3BD APT 4BD DET DPLX 4BD TERR. DPLX
<30K ₦30,000.00 639% 833% 1611% 1472%
50K-100K ₦75,000.00 256% 333% 644% 589%
100K-150K ₦125,000.00 153% 200% 387% 353%
150K-300K ₦225,000.00 85% 111% 215% 196%
300K-500K ₦400,000.00 48% 63% 121% 110%
600K-1M ₦800,000.00 24% 31% 60% 55%
2M-5M ₦3,500,000.00 5% 7% 14% 13%
8M> ₦4,000,000.00 5% 6% 12% 11%
Source: Ugwuejim et al.
Table 12. Rent-Income-Ratio for OM in 2019.
INCOME BANDS AVERAGE INCOME 2BD APT 3BD APT 4BD DET DPLX 4BD TERR. DPLX
<30K ₦30,000.00 402.78% 527.78% 1250.00% 1083.33%
50K-100K ₦75,000.00 161.11% 211.11% 500.00% 433.33%
100K-150K ₦125,000.00 96.67% 126.67% 300.00% 260.00%
150K-300K ₦225,000.00 53.70% 70.37% 166.67% 144.44%
300K-500K ₦400,000.00 30.21% 39.58% 93.75% 81.25%
600K-1M ₦800,000.00 15.10% 19.79% 46.88% 40.63%
2M-5M ₦3,500,000.00 3.45% 4.52% 10.71% 9.29%
8M> ₦4,000,000.00 3.02% 3.96% 9.38% 8.13%
Source: Ugwuejim et al.
Situated towards the city outskirts, these subprime neighborhoods are not left out of the impact of the real estate Armageddon forces in play. There still exists a distinction in prices between apartment building types and the large-family dwelling types. Also, prices within exclusive neighborhoods, makes for the difference when compared to open neighborhoods. Its affordability convenience is almost similar to SYIG.
Figure 18. Accommodation values for property types in Apapa axis between 2019-2023. Source: [79,80] & Ugwuejim et al.
Preprints 117775 g016
Table 13. Rent-Income-Ratio for Apapa in 2023.
INCOME BANDS AVERAGE INCOME 2BD APT 3BD APT 4BD DET DPLX 4BD TERR. DPLX
<30K ₦30,000.00 694% 972% 1333% 1167%
50K-100K ₦75,000.00 278% 389% 533% 467%
100K-150K ₦125,000.00 167% 233% 320% 280%
150K-300K ₦225,000.00 93% 130% 178% 156%
300K-500K ₦400,000.00 52% 73% 100% 88%
600K-1M ₦800,000.00 26% 36% 50% 44%
2M-5M ₦3,500,000.00 6% 8% 11% 10%
8M> ₦4,000,000.00 5% 7% 10% 9%
Source: Ugwuejim et al.
Table 14. Rent-Income-Ratio for Apapa in 2019.
INCOME BANDS AVERAGE INCOME 2BD APT 3BD APT 4BD DET DPLX 4BD TERR. DPLX
<30K ₦30,000.00 333.33% 555.56% 1000.00% 833.33%
50K-100K ₦75,000.00 133.33% 222.22% 400.00% 333.33%
100K-150K ₦125,000.00 80.00% 133.33% 240.00% 200.00%
150K-300K ₦225,000.00 44.44% 74.07% 133.33% 111.11%
300K-500K ₦400,000.00 25.00% 41.67% 75.00% 62.50%
600K-1M ₦800,000.00 12.50% 20.83% 37.50% 31.25%
2M-5M ₦3,500,000.00 2.86% 4.76% 8.57% 7.14%
8M> ₦4,000,000.00 2.50% 4.17% 7.50% 6.25%
Source: Ugwuejim et al.
The Apapa axis will possibly continue to witness high price movements in its rental properties, as its situation as the port city becomes evident daily. With the Nigerian port located at Apapa being responsible for over 40,000 job provisions [81], it is expected that quite a considerable amount of its population is resident within it, as the traffic situation between it and other axes used to be a complicated one years ago. The Apapa axis affordability convenience is low.
Figure 19. Accommodation values for property types in Ikorodu axis between 2019-2023. Source: [79,80] & Ugwuejim et al.
Preprints 117775 g017
Table 15. Rent-Income-Ratio for Ikorodu in 2023.
INCOME BANDS AVERAGE INCOME 2BD APT 3BD APT 4BD DET DPLX 4BD TERR. DPLX
<30K ₦30,000.00 153% 208% 375% 319%
50K-100K ₦75,000.00 61% 83% 150% 128%
100K-150K ₦125,000.00 37% 50% 90% 77%
150K-300K ₦225,000.00 20% 28% 50% 43%
300K-500K ₦400,000.00 11% 16% 28% 24%
600K-1M ₦800,000.00 6% 8% 14% 12%
2M-5M ₦3,500,000.00 1% 2% 3% 3%
8M> ₦4,000,000.00 1% 2% 3% 2%
Source: Ugwuejim et al.
Table 16. Rent-Income-Ratio for Ikorodu in 2019.
INCOME BANDS AVERAGE INCOME 2BD APT 3BD APT 4BD DET DPLX 4BD TERR. DPLX
<30K ₦30,000.00 125.00% 138.89% 263.89% 222.22%
50K-100K ₦75,000.00 50.00% 55.56% 105.56% 88.89%
100K-150K ₦125,000.00 30.00% 33.33% 63.33% 53.33%
150K-300K ₦225,000.00 16.67% 18.52% 35.19% 29.63%
300K-500K ₦400,000.00 9.38% 10.42% 19.79% 16.67%
600K-1M ₦800,000.00 4.69% 5.21% 9.90% 8.33%
2M-5M ₦3,500,000.00 1.07% 1.19% 2.26% 1.90%
8M> ₦4,000,000.00 0.94% 1.04% 1.98% 1.67%
Source: Ugwuejim et al.
The Ikorodu property market with the aid of an infrastructure boost, began to experience enhanced patronage right after the successful flagging off of its 22km Mile 12-Ikorodu Bus Rapid Transit extension [82,83]. This enhancement would open its zone to new dwellers and prospective homeowners seeking to exit the prime sections in Lagos mainland for affordable developments of their choice. Even with the fourth mainland bridge proposed in 2022 and projected to be completed in 2027 [84], the Ikorodu zone has begun to experience a steady rise in rental prices, especially after the global pandemic. One factor often singled out is the entry of ‘gentrifiers’, whose presence makes for an influence in rental prices in neighborhoods in a short-run. Another factor that has been identified is the ‘cost-transfer’ option which had been influenced by worsening economic performances in the country, thus leading goods and services owners to hike prices based on current market prices.
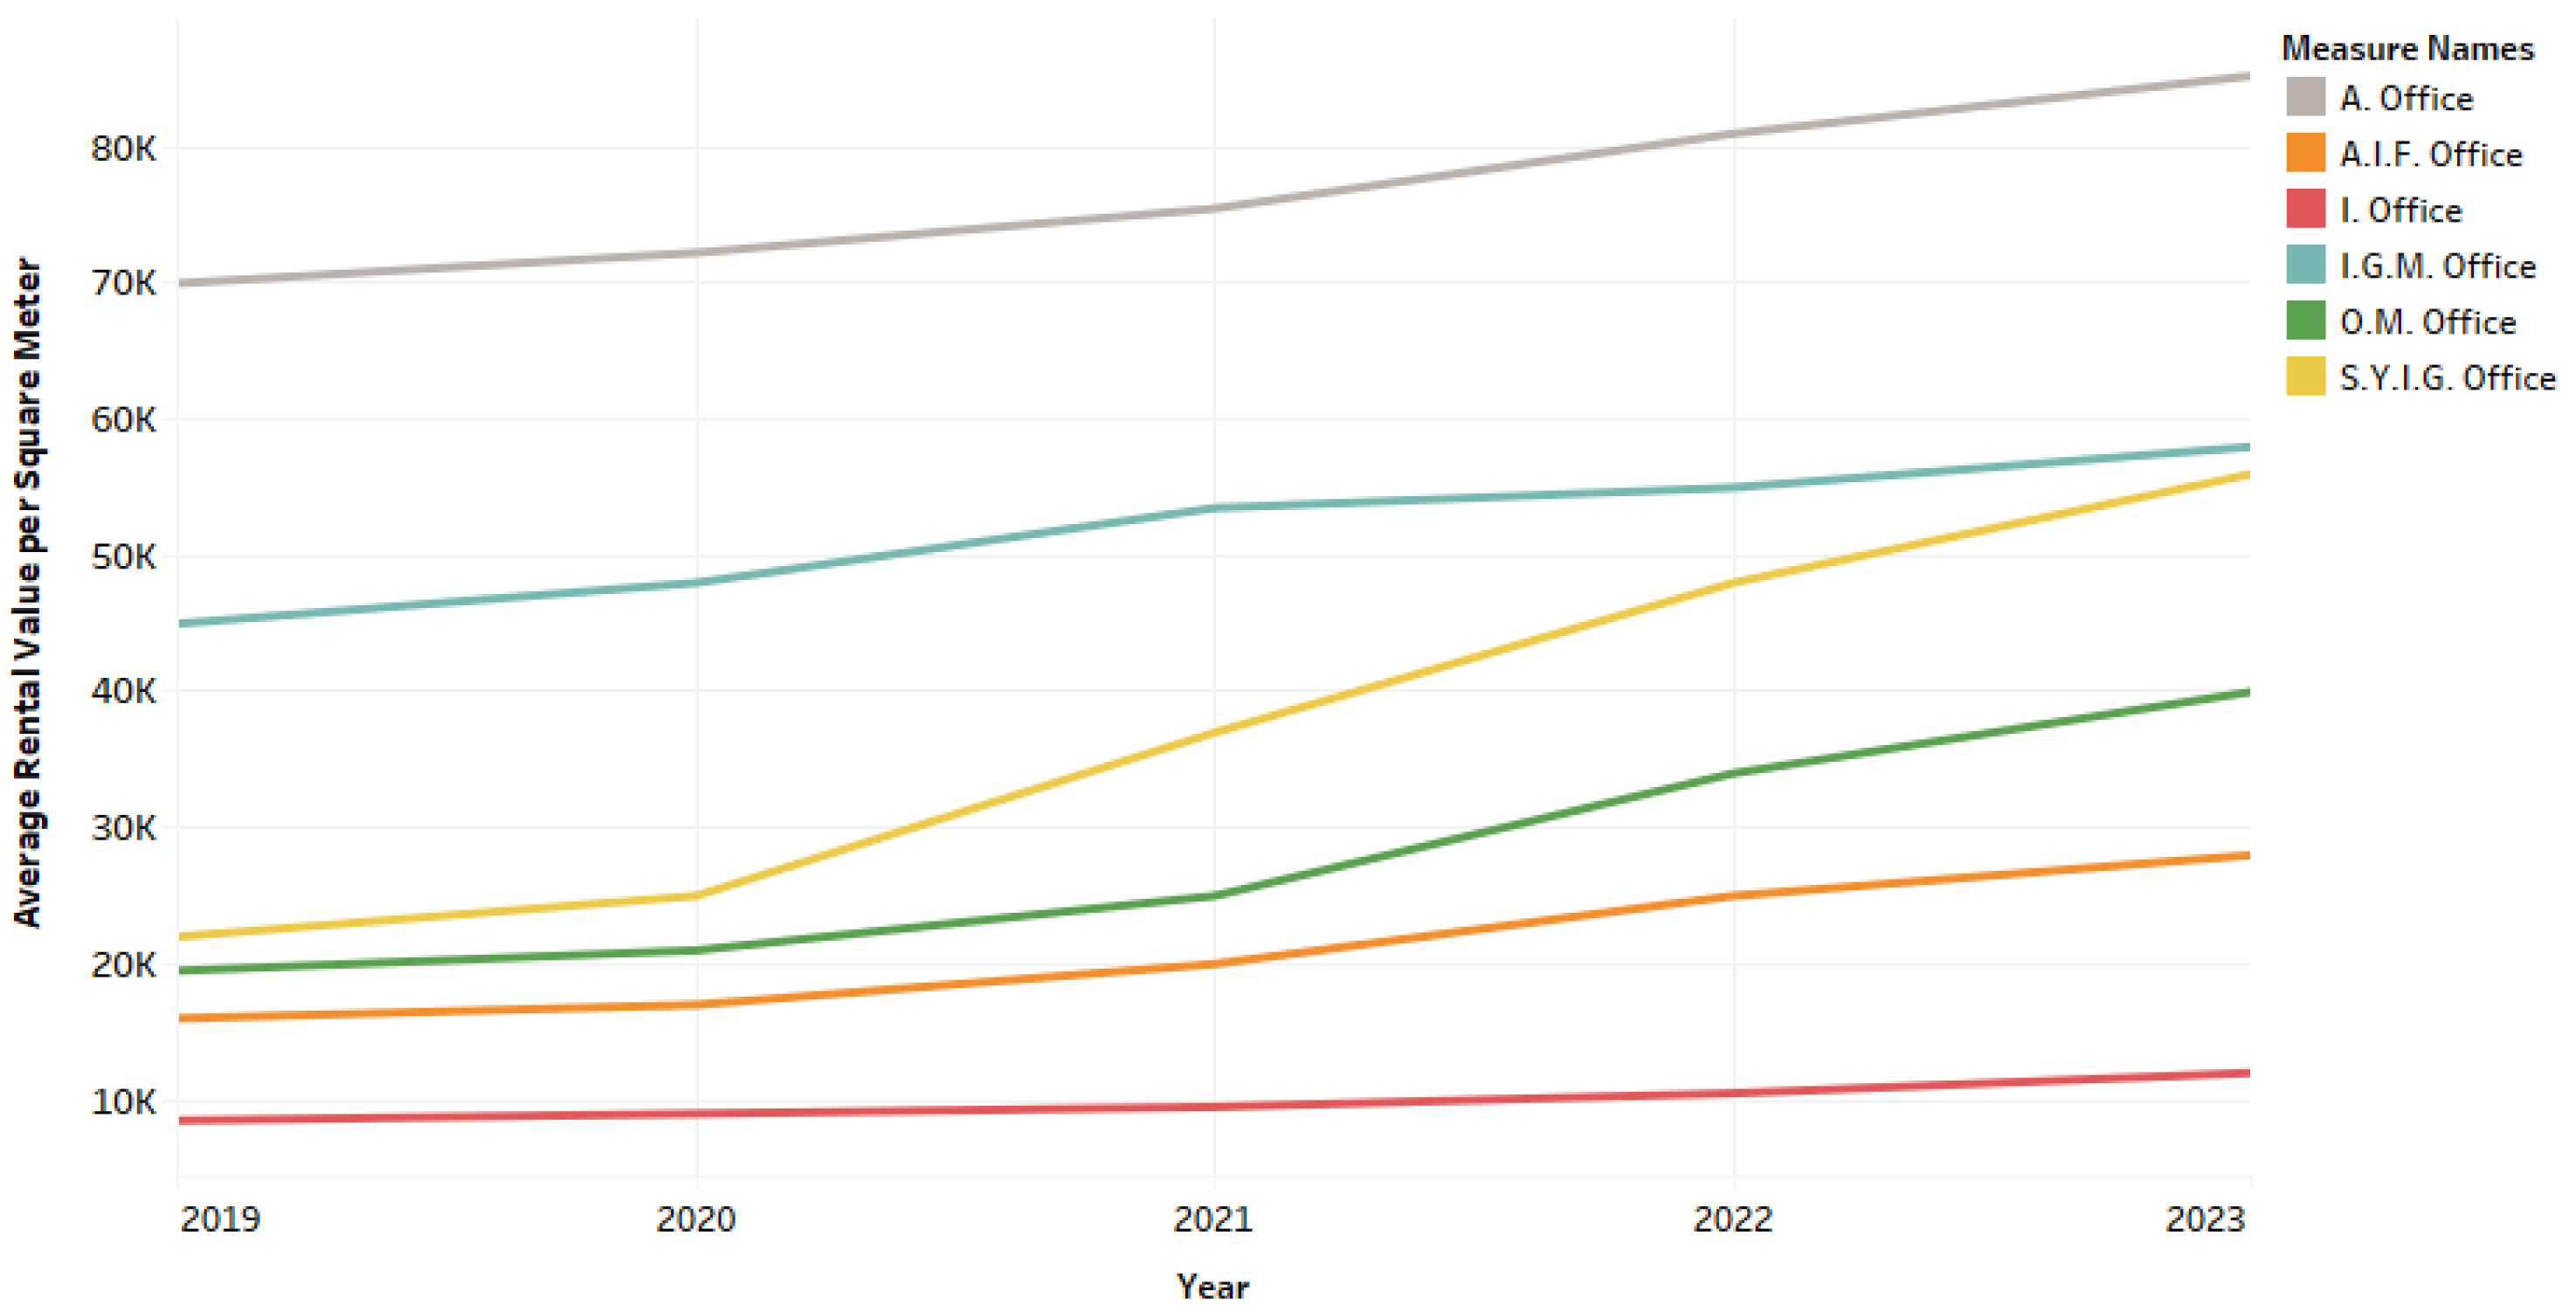
Figure 20. Accommodation rental values for offices in Lagos Mainland zone between 2019-2023. Source: [79,80] & Ugwuejim et al.
Preprints 117775 g018
From Figure 16, offices in Apapa (A) and Ikeja GRA/Maryland (IGM) zones have always had high rental values in the mainland, but since 2020, the other zones have begun to pick up in prices, with the Surulere, Yaba, Ilupeju and Gbagada (SYIG) zones gaining on IGM by 2023. This is understandable as a handful of residential homes in the Surulere/Yaba zones are metamorphosing into commercial uses.
A key takeaway from the mainland rental situation is that in situations where inelastic housing supply exists due to the area being built up, regulatory constraints, or unavailability of land, the available stock responds to accommodating demand through increased rents [85].

3.2. Lagos Island Rental Market Price Analysis

The Lagos Island property market axis, stands at the fore of real estate brilliance in Nigeria, as quite several high-valued properties are situated here. This is the California of real estate investments in Nigeria, and as such there exists a natural competition for real estate prices within it. Unlike its mainland counterpart, the island market is prone to a higher influence of business or real estate cycles. Below are the average rental values captured between 2019-2023;
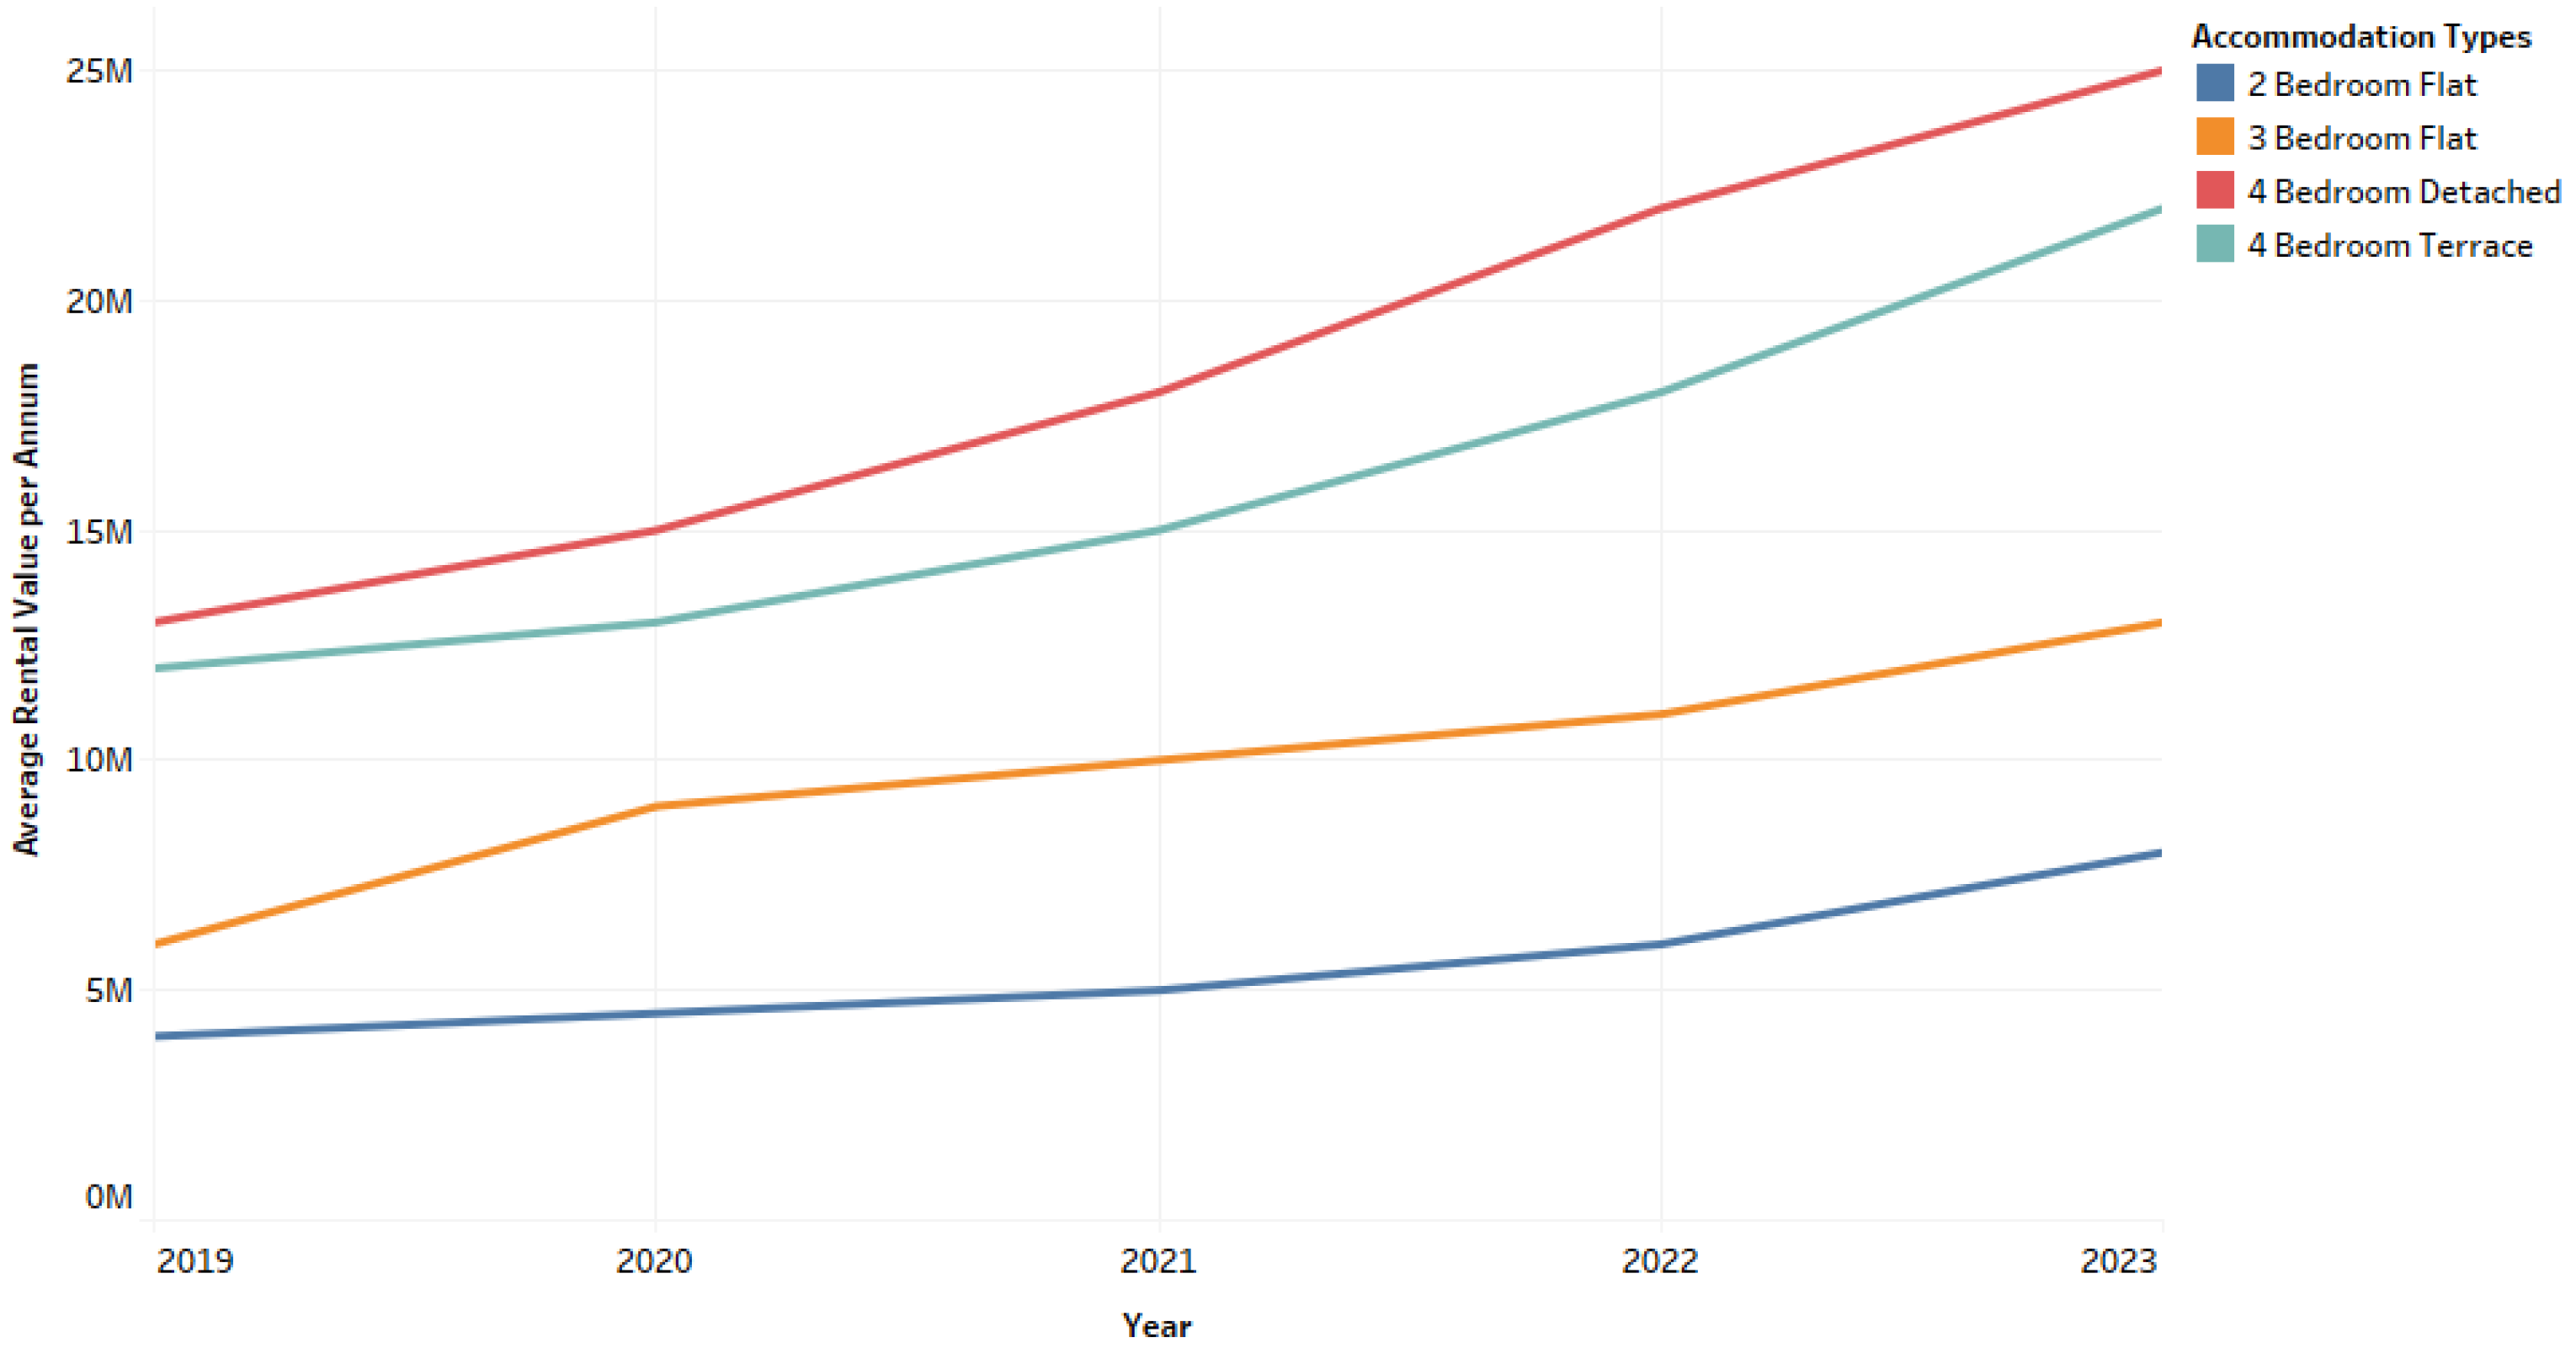
Figure 21. Accommodation rental values for property types in Lagos Island, Old Ikoyi and Southwest Ikoyi axis between 2019-2023. Source: [79,80] & Ugwuejim et al.
Preprints 117775 g019
Table 17. Rent-Income-Ratio for LIS in 2023.
INCOME BANDS AVERAGE INCOME 2BD APT 3BD APT 4BD DET DPLX 4BD TERR. DPLX
<30K ₦30,000.00 2222% 3611% 6944% 6111%
50K-100K ₦75,000.00 889% 1444% 2778% 2444%
100K-150K ₦125,000.00 533% 867% 1667% 1467%
150K-300K ₦225,000.00 296% 481% 926% 815%
300K-500K ₦400,000.00 167% 271% 521% 458%
600K-1M ₦800,000.00 83% 135% 260% 229%
2M-5M ₦3,500,000.00 19% 31% 60% 52%
8M> ₦4,000,000.00 17% 27% 52% 46%
Source: Ugwuejim et al.
Table 18. Rent-Income-Ratio for LIS in 2019.
INCOME BANDS AVERAGE INCOME 2BD APT 3BD APT 4BD DET DPLX 4BD TERR. DPLX
<30K ₦30,000.00 1111.11% 1666.67% 3611.11% 3333.33%
50K-100K ₦75,000.00 444.44% 666.67% 1444.44% 1333.33%
100K-150K ₦125,000.00 266.67% 400.00% 866.67% 800.00%
150K-300K ₦225,000.00 148.15% 222.22% 481.48% 444.44%
300K-500K ₦400,000.00 83.33% 125.00% 270.83% 250.00%
600K-1M ₦800,000.00 41.67% 62.50% 135.42% 125.00%
2M-5M ₦3,500,000.00 9.52% 14.29% 30.95% 28.57%
8M> ₦4,000,000.00 8.33% 12.50% 27.08% 25.00%
Source: Ugwuejim et al.
With a reputation as the most expensive zone in Lagos, accommodation rentals here are simply a definition of ‘accept or choose elsewhere.’ Its residential market has considerably witnessed leaps and bounds in its market prices and it is unlikely it will slow down. Interestingly, property investors do not seem to reduce the prices as they understand that with most location hotspots, willing consumers can step up based on its exclusive provisions. The affordability ease here is very low.
Figure 22. Accommodation rental values for property types in Victoria Island and Oniru axis between 2019-2023. Source: [79,80] & Ugwuejim et al.
Preprints 117775 g020
Table 19. Rent-Income-Ratio for VO in 2023.
INCOME BANDS AVERAGE INCOME 2BD APT 3BD APT 4BD DET DPLX 4BD TERR. DPLX
<30K ₦30,000.00 2083% 3333% 5139% 4444%
50K-100K ₦75,000.00 833% 1333% 2056% 1778%
100K-150K ₦125,000.00 500% 800% 1233% 1067%
150K-300K ₦225,000.00 278% 444% 685% 593%
300K-500K ₦400,000.00 156% 250% 385% 333%
600K-1M ₦800,000.00 78% 125% 193% 167%
2M-5M ₦3,500,000.00 18% 29% 44% 38%
8M> ₦4,000,000.00 16% 25% 39% 33%
Source: Ugwuejim et al.
Table 20. Rent-Income-Ratio for VO in 2019.
INCOME BANDS AVERAGE INCOME 2BD APT 3BD APT 4BD DET DPLX 4BD TERR. DPLX
<30K ₦30,000.00 1250.00% 1666.67% 3055.56% 2500.00%
50K-100K ₦75,000.00 500.00% 666.67% 1222.22% 1000.00%
100K-150K ₦125,000.00 300.00% 400.00% 733.33% 600.00%
150K-300K ₦225,000.00 166.67% 222.22% 407.41% 333.33%
300K-500K ₦400,000.00 93.75% 125.00% 229.17% 187.50%
600K-1M ₦800,000.00 46.88% 62.50% 114.58% 93.75%
2M-5M ₦3,500,000.00 10.71% 14.29% 26.19% 21.43%
8M> ₦4,000,000.00 9.38% 12.50% 22.92% 18.75%
Source: Ugwuejim et al.
Next in line is the Victoria/Oniru axis, whose 2-sided coin characteristic, blends the luxurious location choice of home and office accommodation. This axis is also witnessing a considerable share of price leaps right from 2020 and it is projected to continue. The affordability convenience here is low as only the last two income bands can conveniently afford below 30% of their income or earnings monthly on the quoted rent.
Figure 23. Accommodation rental values for property types in Lekki Phase 1, Osapa and Chevron axis between 2019-2023. Source: [79,80] & Ugwuejim et al.
Preprints 117775 g021
Table 21. Rent-Income-Ratio for LOC in 2023.
INCOME BANDS AVERAGE INCOME 2BD APT 3BD APT 4BD DET DPLX 4BD TERR. DPLX
<30K ₦30,000.00 917% 1250% 1667% 1528%
50K-100K ₦75,000.00 367% 500% 667% 611%
100K-150K ₦125,000.00 220% 300% 400% 367%
150K-300K ₦225,000.00 122% 167% 222% 204%
300K-500K ₦400,000.00 69% 94% 125% 115%
600K-1M ₦800,000.00 34% 47% 63% 57%
2M-5M ₦3,500,000.00 8% 11% 14% 13%
8M> ₦4,000,000.00 7% 9% 13% 11%
Source: Ugwuejim et al.
Table 22. Rent-Income-Ratio for LOC in 2019.
INCOME BANDS AVERAGE INCOME 2BD APT 3BD APT 4BD DET DPLX 4BD TERR. DPLX
<30K ₦30,000.00 583.33% 833.33% 1027.78% 888.89%
50K-100K ₦75,000.00 233.33% 333.33% 411.11% 355.56%
100K-150K ₦125,000.00 140.00% 200.00% 246.67% 213.33%
150K-300K ₦225,000.00 77.78% 111.11% 137.04% 118.52%
300K-500K ₦400,000.00 43.75% 62.50% 77.08% 66.67%
600K-1M ₦800,000.00 21.88% 31.25% 38.54% 33.33%
2M-5M ₦3,500,000.00 5.00% 7.14% 8.81% 7.62%
8M> ₦4,000,000.00 4.38% 6.25% 7.71% 6.67%
Source: Ugwuejim et al.
The Lekki/Osapa/Chevron axis is also experiencing growth in its residential rentals. As an alternative rental location for home dwellers who can’t afford the high prices in Lekki Phase 1, V.I., or Ikoyi, the Osapa and Chevron axis provides a much more affordable apartment option for young and single families in the Island zone. The affordability ease here is low as only the last two income bands can conveniently afford below 30% of their income or earnings monthly on the quoted rent.
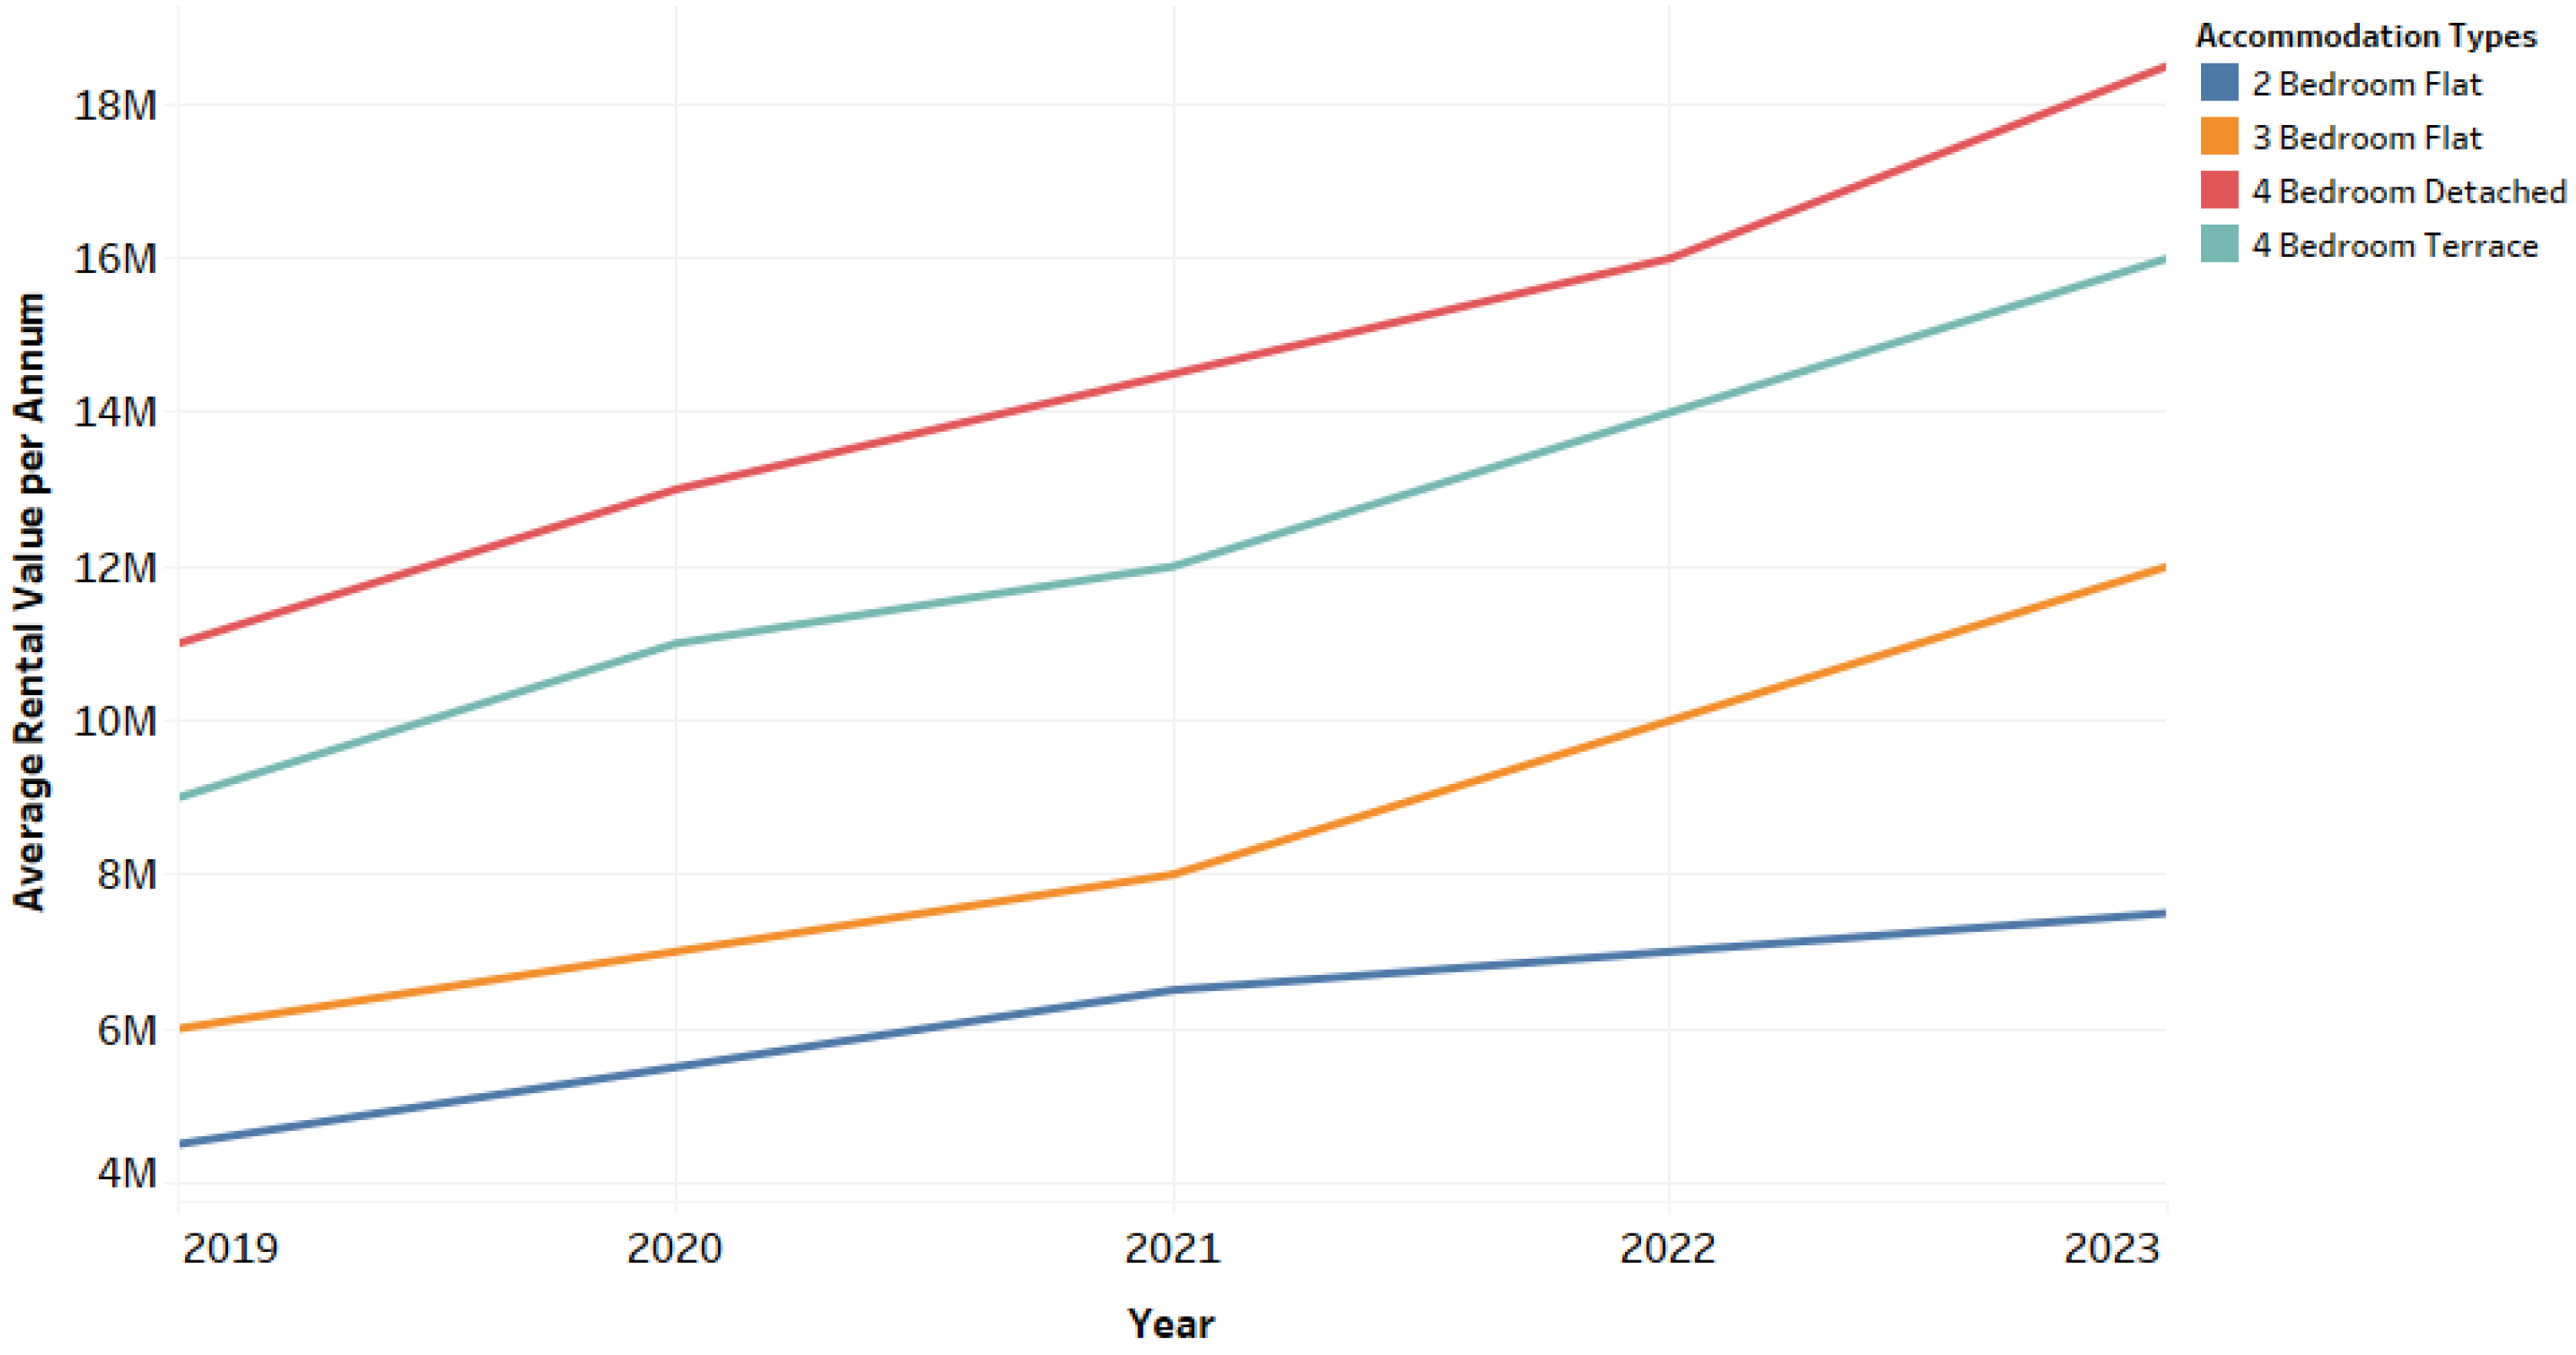
Figure 24. Accommodation rental values for property types in Ajah, Sangotedo and Lakowe axis between 2019-2023. Source: [79,80] & Ugwuejim et al.
Preprints 117775 g022
Table 23. Rent-Income-Ratio for ASL in 2023.
INCOME BANDS AVERAGE INCOME 2BD APT 3BD APT 4BD DET DPLX 4BD TERR. DPLX
<30K ₦30,000.00 583% 694% 1111% 1056%
50K-100K ₦75,000.00 233% 278% 444% 422%
100K-150K ₦125,000.00 140% 167% 267% 253%
150K-300K ₦225,000.00 78% 93% 148% 141%
300K-500K ₦400,000.00 44% 52% 83% 79%
600K-1M ₦800,000.00 22% 26% 42% 40%
2M-5M ₦3,500,000.00 5% 6% 10% 9%
8M> ₦4,000,000.00 4% 5% 8% 8%
Source: Ugwuejim et al.
Table 24. Rent-Income-Ratio for ASL in 2019.
INCOME BANDS AVERAGE INCOME 2BD APT 3BD APT 4BD DET DPLX 4BD TERR. DPLX
<30K ₦30,000.00 305.56% 444.44% 750.00% 694.44%
50K-100K ₦75,000.00 122.22% 177.78% 300.00% 277.78%
100K-150K ₦125,000.00 73.33% 106.67% 180.00% 166.67%
150K-300K ₦225,000.00 40.74% 59.26% 100.00% 92.59%
300K-500K ₦400,000.00 22.92% 33.33% 56.25% 52.08%
600K-1M ₦800,000.00 11.46% 16.67% 28.13% 26.04%
2M-5M ₦3,500,000.00 2.62% 3.81% 6.43% 5.95%
8M> ₦4,000,000.00 2.29% 3.33% 5.63% 5.21%
Source: Ugwuejim et al.
This axis presents the cheapest options in apartment buildings in the Island zone of late and just like the Magodo axis in the Lagos mainland zone, its location at the outskirts of Lagos is witnessing influences from market prices within Lagos. The affordability convenience here is low as only the last 2-3 income bands can conveniently afford below 30% of their income or earnings monthly on the quoted rent. It is still the cheapest option in the Island zone.
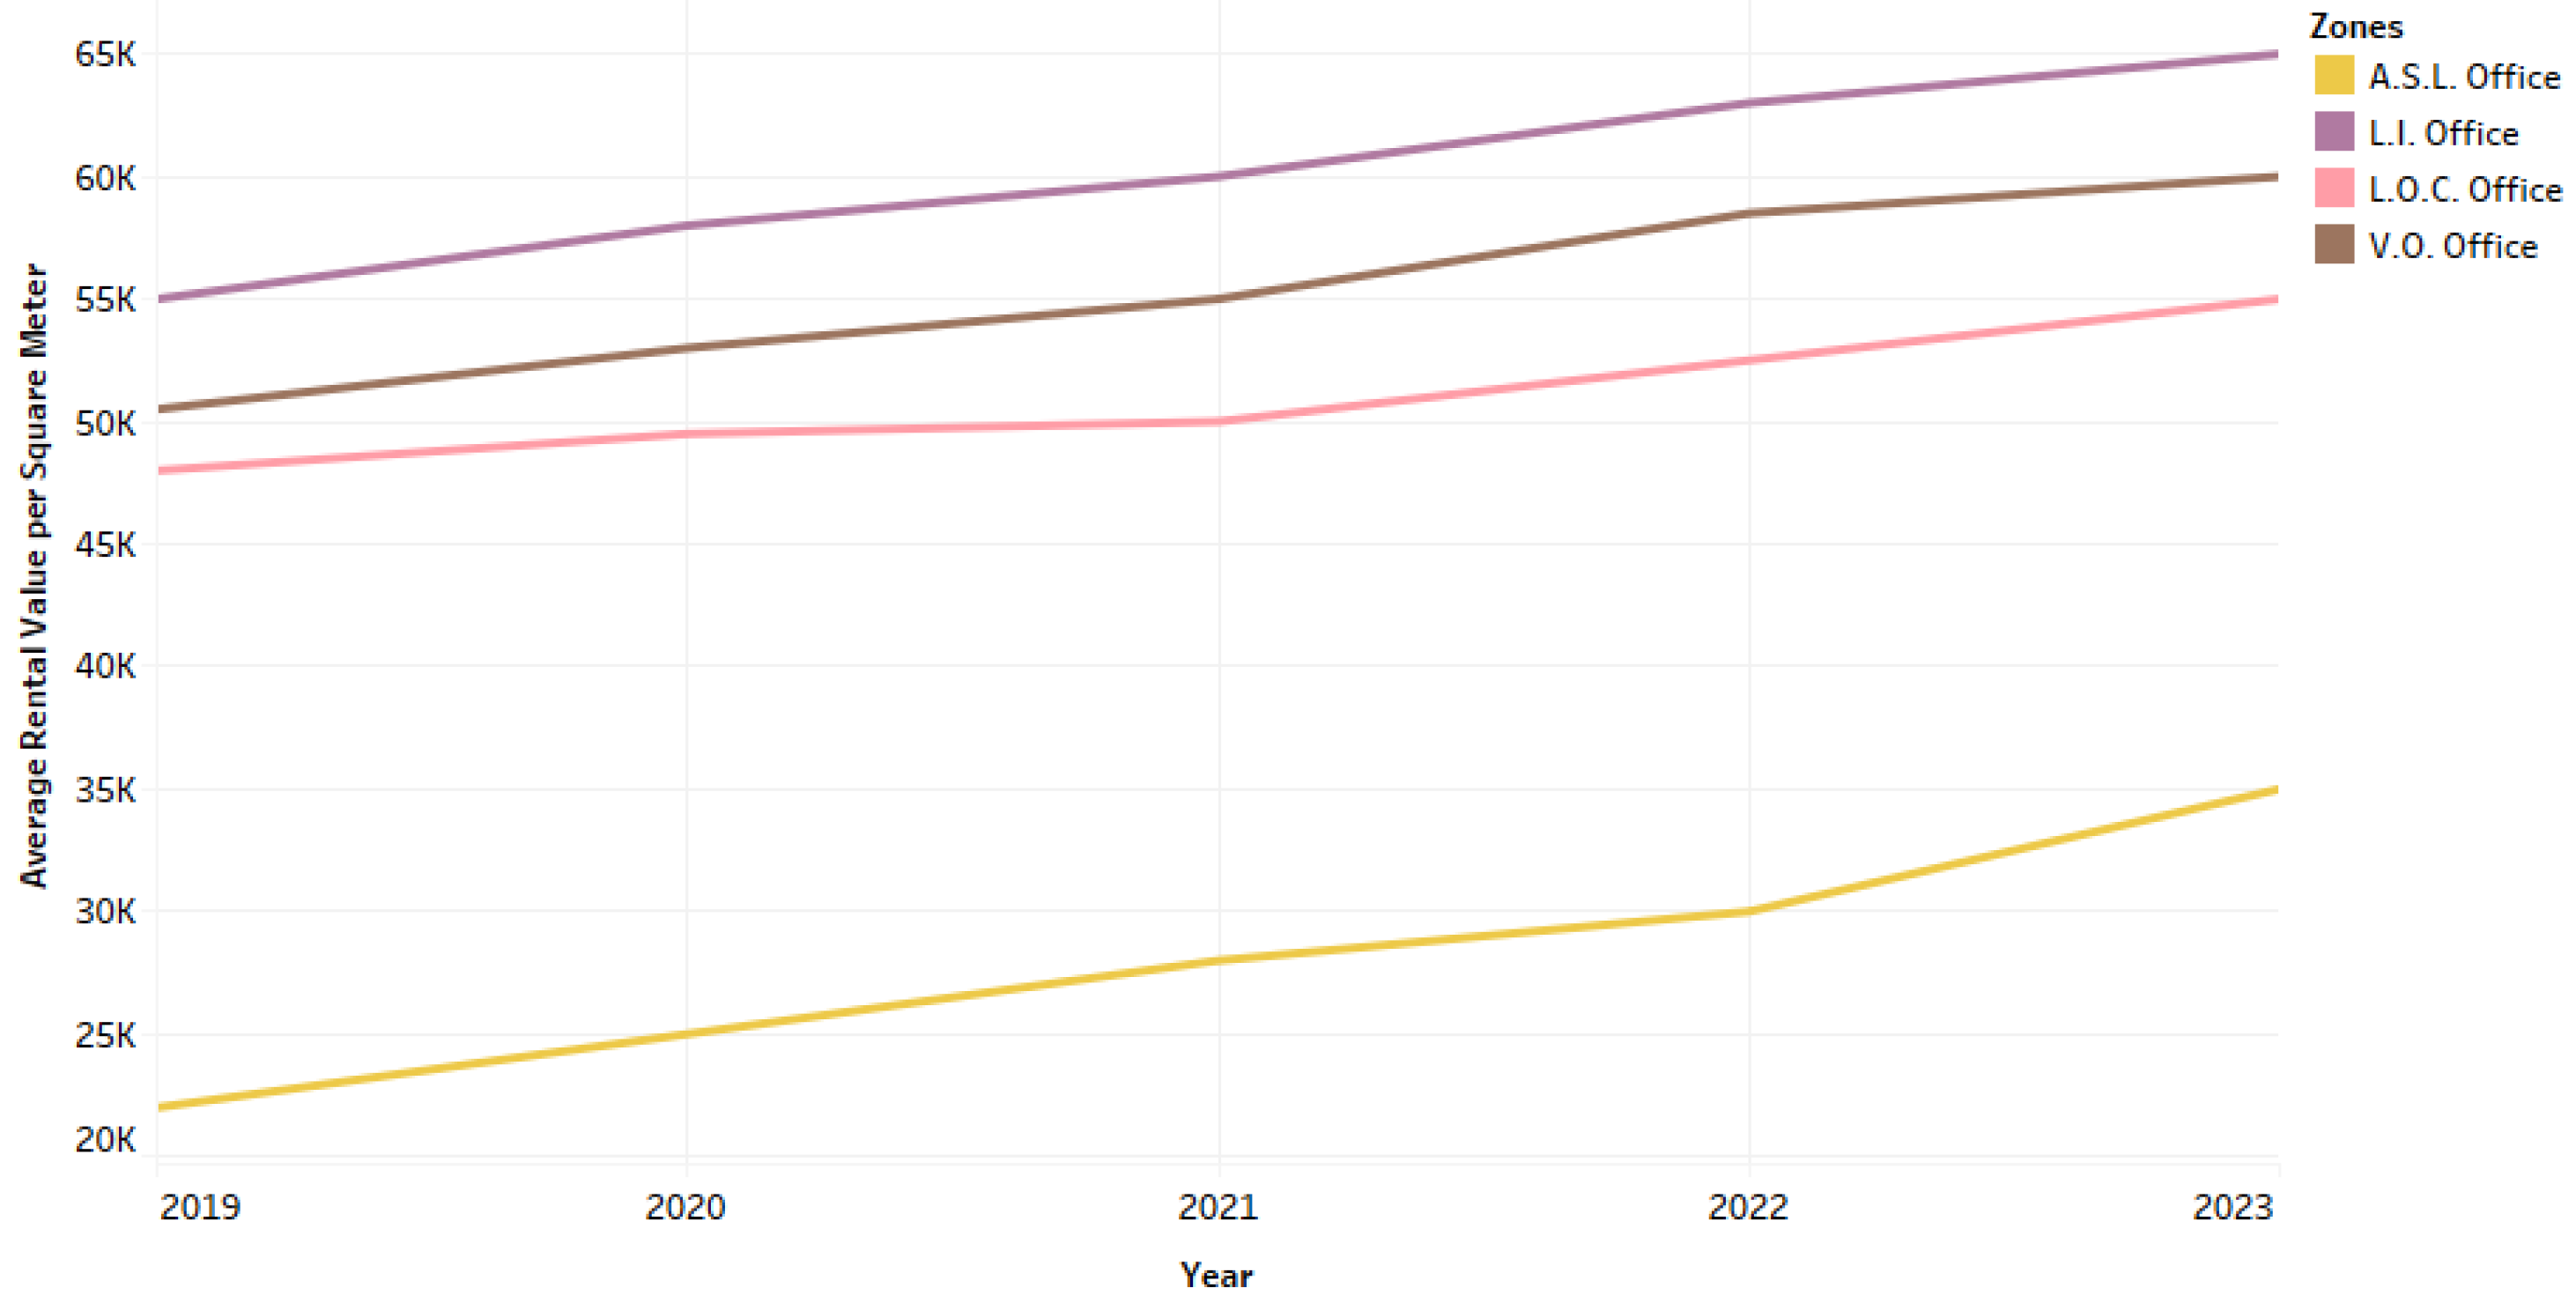
Figure 25. Accommodation rental values for offices in Lagos Island zone between 2019-2023. Source: [79,80] & Ugwuejim et al.
Preprints 117775 g023
The Ajah axis is currently the cheapest-priced rental office location on Island and it is contrasted by the Lagos Island/Ikoyi sections whose rent per square meter is the highest. The considerable distance between rent prices for offices in the other axes in Lagos Island and the Ajah axis is explained by factors such as the level of infrastructural development, nearness to a central area, prestige, accessibility, and location.
Not much has changed in the office rental price, as the post pandemic offered a chance for office rentals to gestate the economic shocks and rebound later.
Based on the information from the RIR tables for the various axes in mainland and island zones of Lagos in tables 5-24, the comparison of the ease in affording residential housing across the various accommodation types between 2019 and 2023 is shown in the table below;
Table 25. Affordability Convenience Comparison Index.
LOCATION 2019 2023
LAGOS MAINLAND
SYIG 43% 31%
AIF 43% 31%
IGM 28% 25%
OM 31% 28%
Apapa 41% 28%
Ikorodu 59% 56%
AVERAGE 41% 33%
LAGOS ISLAND
LIS 22% 9%
VO 25% 13%
LOC 28% 25%
ASL 41% 31%
AVERAGE 29% 20%
Source: Ugwuejim et al.
The above table shows comparisons between percentages of convenience for various residential rental accommodations in Lagos mainland and Island. Based on the comparisons between 2019 and 2023, we see that in terms of convenience in affording rental accommodations, income earners and households in Lagos mainland and island are experiencing an 8% and 9% increase in its difficulty respectively.

4. Discussion

4.1. Other Factors Contributing to the Real Estate Armageddon

  • Gentrification and the impact of neighbourhood outliers:
The changes associated with neighborhood gentrification usually start with the entry of outliers who kickstart changes in housing quality, infrastructure supply, and service delivery. Although their impact might not be felt immediately, their presence has a ripple effect on the market perception of house owners within the neighborhood. Neighborhood Outliers are simply individuals or groups whose taste in housing accommodations, sets them apart from regular features in a neighborhood. A relatable example is the entry of high-end property users in an open street, whose property renovation demands and attendant infrastructure needs, improve on the house or street quality. The higher the possibility of such cases, the greater the chances of high rental price movements happening. The decision-making of most property owners is often influenced by current market perceptions, which most times are irrational to economic realities on the ground.
2
The rising cost of building materials
Nigeria’s heavy reliance on imported building materials accounts for over 90% of the resources used in housing construction [87]. Looking at the economic trend between 2019-2023, it is plausible that such reliance has become worse cost-wise. With property investors keen on seeing their investments completed no matter the costs incurred, those willing to hold onto the investments after completion, pass on the compensation via high rents to its final users. Some others are considerate to subsidize rent within the first year and go supersonic in following years.
3.
Building permit and title paperwork complications
With the insufficient housing supply in Lagos, the complications surrounding building permits and title paperwork still frustrate the supply of potential housing to date. Between 2023-2024, Lagos state witnessed a series of housing demolitions in various axes in mainland and island zones owing to their situation on water channels or ownership of lands without perfected titles. Most home owners are often reluctant to engage in the improved process of title perfection of their properties due to fear of the complications and possible frustrations that they perceive to experience in it. Therefore, with the demolition of homes/houses or their potential earmarking for demolition in an area, it is expected that houses within the specified area would witness more demand than supply and with effective demand commanding action, the property market becomes a ‘landlord’s market.’
4.
Inadequate Infrastructure and its perceived influence on housing prices
With infrastructure (physical and social) being the thread that weaves economic bases into existence, it is often perceived as a markup factor to housing prices in areas where it is provided [83]. Contrary to this perception in developing and third world countries, the government in advanced or transitioning economies makes it a duty of care to provide infrastructure as a basic need and contribution to the human development index of its citizens. If the provision of infrastructure falls to the private investors, it is rational that such costs be transferred in the prices of the finished development or in its rental.
5.
Increased household spending and reduced disposable income
In response to the poor economic performance Nigeria has recorded in a while, most households are witnessing increased household spending a considerable amount of their earnings or disposable income consumed by increased household costs. This is part affects not only their propensity to save but also their options to own a home or alternatives to rent. This explains why informal housing is mostly popular in some mainland areas. The fact that recent income bands cannot support or sustain most household costs monthly, worsens the prospects of affording choice home rentals or purchases.
This deterioration in income earners and household capacity to conveniently afford rental housing in the study area is shown in table 25, which shows that with the exception of Ikorodu axis, other areas have an affordability convenience ratio that is less than 50% for both 2019 and 2023.
Price movements of Lagos mainland rental housing between 2019 and 2023 has resulted to 33% of the income band population having the capacity to conveniently afford rent figures for the various rental accommodations in 2023, compared to 41% in 2019. In Lagos Island, price movements have also influenced 20% of the income band population having the capacity to conveniently afford rent figures for the various rental accommodations in 2023, compared to 29% in 2019.

5. Conclusions

With a great deal of Nigeria’s working population paying more than average their monthly salaries as housing costs and the devalued state of the naira, it has become imperative for the government to initiate affordability strategies that can best manage the growing strain of housing demand and the associated risks it could potentially create for the zones in their jurisdiction. Housing remains one of man’s most prized needs and to effectively control development in a conurbation like Lagos, means and options should be put in place.
In combating this multi-faceted phenomenon, fundamental, institutional, and environmental strategies are hereby recommended;
1.
Fundamental Strategies
Fundamental strategies relate to economic actions that can help cushion the impact of the regressed economy. One means of achieving that is via subsidies and assistance programs. The state government in collaborating with the federal government initiatives in citizen-centred subsidy programs can help alleviate the price burden of rising goods and services experienced in most households. In such periods where revenue is much lesser than expenditure, the government can initiate and supervise production via assistance programs targeted at generating revenue. Fundamental strategies also apply in the granting of state tax holidays or subsidized tariffs to business owners as well.
2.
Institutional Strategies
This refers to policies and actions that can be initiated by the state, local, or community development agencies to improve housing affordability within their zones. These agencies can encourage housing development via public-private partnerships, with zoning regulations and subsidies to aid such development within their respective zones. The option of enforcing inclusionary zoning also exists, as well as the setting up of land banks or land trusts to control the tendency of land speculation. Also, the improvement of building permit and title paperwork processes will go a long way to encouraging new developments in their respective zones. Finally, government agencies with human faces via communication channels on social media or town hall meetings will be more equipped to respond to housing affordability issues experienced in their respective zones.
3.
Environmental Strategies
This strategy addresses the need for sustainability and technology inclusion in developing affordable housing. Technological advancements have inspired newer construction methods with lesser carbon footprints and reliance on carbon-induced materials. An example is the 3D-printing of houses, prefabricated houses, or the inclusion of locally-processed materials in building construction. At cheaper costs of building houses that are climate-friendly and sustainable, housing affordability can be realized on a much larger scale. Another option is to improve the existing stock of housing or the renovation of informal units to accommodate lower-income classes.

Author Contributions

With respect to this article, here are the contributions; Conceptualization: Ugwuejim S..; methodology, Ugwuejim et al; software, Ugwuejim S. and Iruobe P..; validation, Ugwuejim et al.; formal analysis, Ugwuejim et al; investigation, Rimamsichi J. and Ugwuejim S..; resources, Ugwuejim et al; data curation, Ugwuejim S. and Rimamsichi J.; writing—original draft preparation, Ugwuejim S.; writing—review and editing, Ugwuejim et al; visualization, Ugwuejim S.; supervision, Iruobe P. All authors have read and agreed to the published version of the manuscript.

Funding

This research received no external funding and The APC was funded by Ugwuejim et al.

Data Availability Statement

Acknowledgments

The authors will like to acknowledge the support of real estate firms who assisted with real time market data for the work. Also, we acknowledge every source of secondary data utilized in this study.

Conflicts of Interest

The authors declare no conflicts of interest. The funders had no role in the design of the study; in the collection, analyses, or interpretation of data; in the writing of the manuscript; or in the decision to publish the results”.

References

  1. Oyalowo, B.A. , Nubi, T.G. & Lawanson, T.O. (2018). Housing Affordability, Government Intervention and Housing Informality: An African Dilemma? Journal of African Real Estate Research, 3(2), pp.63-86. [CrossRef]
  2. Behr, D.M. (2021). Introducing the adequate housing index (AHI). World Bank. Pp. 1-7. Accessed from https://openknowledge.worldbank.org/server/api/core/bitstreams/e3820a80-1028-5393-9500- c5e5ccf3976d/content. 3820. [Google Scholar]
  3. Estate Intel (2023). 2023 Lagos Real Estate Development Pipeline Report. Vol. 2, pp. 1-20. Accessed from https://estateintel.com/reports/2023-lagos-real-estate-pipeline-report.
  4. The United Nations Human Settlements Programme. The State of African Cities 2014: Re-Imagining Sustainable Urban Transitions. Nairobi: United Nations Human Settlements Program; 2014.
  5. Amegah, K.A. (2021). Slum decay in Sub-Saharan Africa. Environ Epidemiol, 5(3), pp.1-3.
  6. World Bank (2008). Climate change, disaster risk, and the urban poor: Cities building resilience for a changing world. Urban Development Series. Accessed from https://documents1.worldbank.org/curated/en/644301468338976600/pdf/683580PUB0EPI0067869B09780821388457.pdf.
  7. Worthington, A.C. (2012). The Quarter Century Record on Housing Affordability, Affordability Drivers and Government Response Policies in Australia. International Journal of Housing Markets and Analysis, 5, 235–252.
  8. Paciorek, A. (2013). Supply Constraints and Housing Market Dynamics. Journal of Urban Economics, 77(1), pp.11-26.
  9. Gyourko, J. & Molloy, R. (2015). Regulation and Housing Supply. Handbook of Regional and Urban Economics, Vol. 5: 1289-1337, ed. Gilles Duranton, J. Vernon Henderson and William C. Strange. Elsevier B.V.
  10. Rewane, B. (2016). The Role of the Real Estate Sector in Reshaping the Economy. A paper delivered at the FIABCI-Nigeria Seminar on 27 January, 2016, Lagos, Nigeria. Retrieved from http://www.fiabci.it/wp- content/uploads/2016/02/BISMARK- REWANE-NYD-2016-1.pdf.
  11. Nguyen, J. (2015). Four Key Factors that Drive the Real Estate Market. Accessed from www.investopedia.com/articles/mortgages-real-estate.
  12. Otegbulu, A. (2022). Property Development and Investment Decision Analysis. University Press Plc.
  13. Fanning, S.F. (2005). Market Analysis for Real Estate. Appraisal Institute, Chicago.
  14. United Nations (2014). Country Classification. Pp. 1-6. Accessed from https://www.un.org/en/development/desa/policy/wesp/wesp_current/2014wesp_country_classification.pdf.
  15. IMF (2019). Information on revenue and debt to gdp. Accessed from https://www.imf.org/external/datamapper/profile/NGA.
  16. IMF (2023). Information on revenue and debt to gdp. Accessed from https://www.imf.org/external/datamapper/profile/NGA.
  17. Statista (2022). Government revenue as gdp share in Egypt. Accessed from https://www.statista.com/statistics/1227769/general-government-revenue-as-gdp-share-in-egypt/.
  18. Kallergis, A.; Angel, S.; Liu, Y.; Blei, A.M.; Sanchez, A.G. & Lamson-Hall, P. (2018). Housing Affordability in a global perspective. Working Paper WP18AK1, pp. 1-35.
  19. World Bank (2024). New World Bank country classifications by income level: 2024-2025. Accessed from https://blogs.worldbank.org/en/opendata/world-bank-country-classifications-by-income-level-for-2024- 2025. 2024.
  20. Adetiloye, K.A. , & Eke, P.O. (2016). Financial Architecture, Real Estate Market and Economic Development in Sub-Saharan African Countries: Evidence from Nigeria. Journal of South African Business Research, Vol. 2016, pp. 1-7. [CrossRef]
  21. Ojo, A. T. (2010). The Nigerian Maladapted Financial System: Reforming Tasks and Development Dilemma in Nigeria. Charted Institute of Banker Press, Nigeria: pp. 1-70.
  22. African Union for Housing (2020). Nigeria’s Housing Economic Value Chain: Assessing the Affordable Housing Market Main Findings and Recommendations, pp.1-6. Accessed from http://www.auhf.co.za/.
  23. Omotosho, B. S. (2019). Oil price shocks, fuel subsidies and macroeconomic (in)stability in Nigeria, CBN Journal of Applied Statistics, ISSN 2476-8472, The Central Bank of Nigeria, Abuja, 10(2), pp. 1-38. [CrossRef]
  24. World Bank (2023). Nigeria. Accessed from https://data.worldbank.org/country/NG.
  25. Punch Newspaper (2024). Multinationals exit costs Nigeria N94tn in five years. Accessed from https://punchng.com/multinationals-exit-costs-nigeria-n94tn-in-five-years/.
  26. AIT (2024). Solutions to exit of foreign companies from Nigeria. AIT Live. Accessed from https://ait.live/special-report-solutions-to-exit-of-foreign-companies-from-nigeria/#:~:text=In%202023%2C%20more%20than%2010,Bolt%20Food%20%26%20Jumia%20Food%20Nigeria.
  27. Central Bank of Nigeria (2019). Money Market Indicators. Accessed from https://www.cbn.gov.ng/rates/mnymktind.asp.
  28. Central Bank of Nigeria (2020). Money Market Indicators. Accessed from https://www.cbn.gov.ng/rates/mnymktind.asp.
  29. Central Bank of Nigeria (2021). Money Market Indicators. Accessed from https://www.cbn.gov.ng/rates/mnymktind.asp.
  30. Central Bank of Nigeria (2022). Money Market Indicators. Accessed from https://www.cbn.gov.ng/rates/mnymktind.asp.
  31. Central Bank of Nigeria (2023). Money Market Indicators. Accessed from https://www.cbn.gov.ng/rates/mnymktind.asp.
  32. CEIC (2024). Nigeria Purchasing Power Parity. Accessed from https://www.ceicdata.com/en/Nigeria/governance-economic-environment-and-growth-non-oecd-member-annual/ng-purchasing-power-parity.
  33. KNOEMA (2024). Purchasing power parity conversion factor for gross domestic product. Accessed from https://knoema.com/atlas/Nigeria/topics/Economy/Inflation-and-prices/Purchasing-power-parity?mode=amp.
  34. National Bureau of Statistics (2017). Labor Force Statistics - Volume I: Unemployment and Underemployment Report (Q4 2017-Q3 2018). Accessed from https://nigerianstat.gov.ng/elibrary/read/856.
  35. National Bureau of Statistics (2018). Labor Force Statistics. Accessed from https://nigerianstat.gov.ng/elibrary/read/856.
  36. National Bureau of Statistics (2020). Labor Force Statistics. Accessed from https://nigerianstat.gov.ng/elibrary/read/856.
  37. National Bureau of Statistics (2022). Labor Force Statistics. Accessed from https://nigerianstat.gov.ng/elibrary/read/856.
  38. National Bureau of Statistics (2023). Labor Force Statistics. Accessed from https://nigerianstat.gov.ng/elibrary/read/856.
  39. Debt Management Office (2019) Debt Stock. Accessed from https://www.dmo.gov.ng/debt- profile/external-debts/external-debt-stock.
  40. Debt Management Office (2020) Debt Stock. Accessed from https://www.dmo.gov.ng/debt- profile/external-debts/external-debt-stock.
  41. Debt Management Office (2021) Debt Stock. Accessed from https://www.dmo.gov.ng/debt- profile/external-debts/external-debt-stock.
  42. Debt Management Office (2022) Debt Stock. Accessed from https://www.dmo.gov.ng/debt- profile/external-debts/external-debt-stock.
  43. Debt Management Office (2023) Debt Stock. Accessed from https://www.dmo.gov.ng/debt- profile/external-debts/external-debt-stock.
  44. National Bureau of Statistics (2019). Nigeria Gross Domestic Product Report. Accessed from https://nigerianstat.gov.ng/elibrary/read/937.
  45. National Bureau of Statistics (2020). Nigeria Gross Domestic Product Report. Accessed from https://nigerianstat.gov.ng/elibrary/read/937.
  46. National Bureau of Statistics (2021). Nigeria Gross Domestic Product Report. Accessed from https://nigerianstat.gov.ng/elibrary/read/937.
  47. National Bureau of Statistics (2022). Nigeria Gross Domestic Product Report. Accessed from https://nigerianstat.gov.ng/elibrary/read/937.
  48. National Bureau of Statistics (2023). Nigeria Gross Domestic Product Report. Accessed from https://nigerianstat.gov.ng/elibrary/read/937.
  49. Stats SA (2019). Gross Domestic Product. Accessed from https://www.statssa.gov.za/.
  50. Stats SA (2020). Gross Domestic Product. Accessed from https://www.statssa.gov.za/.
  51. Stats SA (2021). Gross Domestic Product. Accessed from https://www.statssa.gov.za/.
  52. Stats SA (2022). Gross Domestic Product. Accessed from https://www.statssa.gov.za/.
  53. Stats SA (2023). Gross Domestic Product. Accessed from https://www.statssa.gov.za/.
  54. Savills (2021). The Property Report: Egypt. pp. 1-7. Accessed from https://www.savills.com.eg/pdf/savills-egypt-property-report-2021---en-(1).pdf.
  55. Oghenekevwe, O.; Olusola, O. & Chukwudi, U.S. (2014). An assessment of the impact of inflation on Construction material prices in nigeria. PM World Journal, 3(4), pp. 1-10.
  56. Onashile, O. (2008). Construction costs have increased by over 30% in Nigeria. Vanguard. Retrieved from http://www.vanguardngr.com/content/view/21943/143/.
  57. Oyediran, S.O. (2006). Modeling inflation dynamics in the Construction sector of a Developing Economy. A paper Presented in shaping the change xxiiifig congress Munich, Germany, October 8-13.
  58. Okafor, B.N. & Onuoha, D.C. (2016). Analyses of Land and Housing Price Inflation in Nigeria, A Study of Federal Capital Territory Abuja from 1999 to 2009. Civil and Environmental Research, 8(7), pp. 1-5.
  59. Nwosu, A.E.; Bello, V.A.; Oyetunji, A.K. & Amaechi, C.V. (2024). Dynamics of the Inflation-Hedging Capabilities of Real Estate Investment Portfolios in the Nigerian Property Market. Buildings 2024, 14, 72. [Google Scholar] [CrossRef]
  60. Ekekwe, N. Digital Skills Provide a Development Path for Sub-Saharan Africa. Harvard Business Review, Issue: 07, Ahead-of-Print Version. 2023. Available online: https://hbr.org/2023/07/digital-skills-provide-a- development-path-for-sub-saharan-africa, 2023; 07. [Google Scholar]
  61. Anari, A. & Kolari, J. (2002). House prices and inflation. Real Estate Economics, 30(1), pp. 67-75.
  62. Abiodun, Doherty (2013). “Factors that make property value increase” Punch News Online August 27, 2013. Accessed from http://www.punchng.com/business/am-business/factors-that-make-property-value- increase/.
  63. Obereiner, D. and Kurzrock, B. (2012). Inflation-hedging properties of indirect real estate investments in Germany. Journal of Property Investment & Finance, 30, 3, pp. 218-240.
  64. Christou, C. , Gupta, R., Nyakabawo, W. and Wohar, M.E. (2018). Do house prices hedge inflation in the US? A quantile cointegration approach. International Review of Economics and Finance, 54, 15–26.
  65. Yeap, G.P. and Lean, H.H. (2017). Asymmetric inflation hedge properties of housing in Malaysia: New evidence from nonlinear ARDL approach. Habitat International, 62, pp. 11-21.
  66. Taderera, M. & Akinsomi, O. (2020). Is commercial real estate a good hedge against inflation? Evidence from South Africa. Pp. 1-7. Accessed from https://www.researchgate.net/profile/Omokolade-Kola-Akinsomi/publication/332752085_Is_commercial_real_estate_a_good_hedge_against_inflation_Evidence_from_South_Africa/links/5cc7f2a9299bf12097896399/Is-commercial-real-estate-a-good-hedge-against-inflation-Evidence-from-South-Africa.pdf?trk=public_post_comment-text.
  67. Mayes, D.G. (1979). The property boom: the effects of building society behaviour on house prices. Oxford: Martin Robertson.
  68. Tsatsaronis, K. & Zhu, H. (2004). What drives housing price dynamics: Cross country evidence. BIS Quarterly review, March pp. 65 - 78.
  69. Musvoto, E. & Boshoff, D. G.B. (2015). The 2008 economic recession: Impact on the residential real estate market. Paper presented at The 3rd Human and Social Sciences at the Common Conference October; 5 - 9 2015. [Google Scholar] [CrossRef]
  70. Friedman, M. (1997). Rx for Japan: Back to the Future. Wall Street Journal.
  71. Mishkin, F.S. (2016). The Economics of Money, Banking, and Financial Markets, 11th ed. New York: Pearson.
  72. Bernanke, B.S. (2002). Asset-price ‘bubbles’ and monetary policy. In: Speech before the New York Chapter of the National Association for Business Economics, New York, NY, 15 October.
  73. Miller, N.G.; Sklarz, M. & Thibodeau, T.G. (2005). The Impact of Interest Rates and Employment on Nominal Housing Prices. International Real Estate Review, 8(1), pp. 26-30.
  74. Olowofeso, E. & Oyetunji, A.K. (2013). Interest Rate as a Determinant of Housing Prices in Lagos State, Nigeria. International Journal of Economic Development Research and Investment, 4(3), pp. 2-7.
  75. Vonlanthen, J. (2023). Interest rates and real estate prices: a panel study. Swiss Journal of Economics and Statistics, 159(6), pp. 1-5. [CrossRef]
  76. Sani, M.M. (2015). Price to income ratio approach in housing affordability. Journal of Economics, Business and Management, 3(12), pp. 1190-1193. [CrossRef]
  77. Sumner, S. & Erdmann, K. (2020). Housing Policy, Monetary Policy, and the Great Recession. Mercatus Research,pp. 1-7. Accessed from https://mercatus.org/publications/monetary-policy/housing-policymonetary-policy-great-recession.
  78. Stone, M.E. (2006). What is housing affordability? The Case for the Residual Income Approach. Housing Policy Debate, 17, 151–184.
  79. Ubosi Eleh (2019). The Nigeria Real Estate Report. Pp. 71-80. Accessed from www.ubosieleh.com.
  80. NIESV (2024). NIESV Real Estate Market Report 2021-2023. Pp. 72-75.
  81. Vanguard (2024). Economic crisis: Slump in port operations puts 40,000 jobs at risk — Investigation. Accessed from https://www.vanguardngr.com/2024/07/economic-crisis-slump-in-port-operations-puts- 40000-jobs-at-risk-investigation/.
  82. Ochonma, M. (2015). Lagos govt opens 22km Mile12-Ikorodu BRT extension. BusinessDay. Accessed from https://businessday.ng/transport/article/lagos-govt-opens-22km-mile12-ikorodu-brt-extension/.
  83. Iruobe, P.O. & Ugwuejim, S.C. (2021). Infrastructure as an enabling framework for development synergy in growing economies: Appraising the contributions of social investment in Lagos. Land use Planning and Environmental Management in Nigeria. Alheribooks.
  84. Ubanagu, M. (2024). 10 things to know about proposed Fourth Mainland Bridge. Punch Newspaper. Accessed from https://punchng.com/10-things-to-know-about-proposed-fourth-mainland-bridge/.
  85. Glaeser, Edward L., and Joseph Gyourko. 2008. Rethinking Federal Housing Policy. Washington, DC: The AEI Press.
  86. Glaeser, E. & Gyourko, J. (2017). The Economic Implications of Housing Supply. Zell/Lurie Working Paper #802, pp. 1-7.
  87. BuyLetLive (2024). Solving Nigeria’s housing crisis with alternative building materials. Nairametrics. Accessed from https://nairametrics.com/2024/04/19/solving-nigerias-housing-crisis-with-alternative- building-materials/.
Disclaimer/Publisher’s Note: The statements, opinions and data contained in all publications are solely those of the individual author(s) and contributor(s) and not of MDPI and/or the editor(s). MDPI and/or the editor(s) disclaim responsibility for any injury to people or property resulting from any ideas, methods, instructions or products referred to in the content.
Copyright: This open access article is published under a Creative Commons CC BY 4.0 license, which permit the free download, distribution, and reuse, provided that the author and preprint are cited in any reuse.
Prerpints.org logo

Preprints.org is a free preprint server supported by MDPI in Basel, Switzerland.

Subscribe

© 2024 MDPI (Basel, Switzerland) unless otherwise stated