Preprint
Article

Farmers’ Perception Assessment of Water and Agronomic Management in Rice Irrigation Schemes in Togo

Altmetrics

Downloads

84

Views

43

Comments

0

Submitted:

09 September 2024

Posted:

10 September 2024

You are already at the latest version

Alerts
Abstract
This paper assessed rice farmers' perceptions of agricultural and irrigation practices through their choices. A survey was carried out among 278 rice farmers on five irrigation schemes in three agro-ecological zones of Togo, viz. the savannah region, the forest region and the coastal region. The sample of random respondents was selected from a list of rice farmers provided by the managers of these irrigated schemes. Data collected through face-to-face interviews using kobocollect software were analyzed with R 4.2 software, and the Pearson test was validated at the 5% level. The results showed that the socio-economic characteristics of the rice growers, such as access to agricultural credit, experience, non-agricultural activities, membership of a rice growers' cooperative, gender, level of education and training in growing irrigated rice, and farm labor, significantly influenced the choice of agronomic practices and irrigation management. Characteristics such as experience, training and hired farm labor enhanced paddy yields, while access to agricultural credit was unproductive. Chemical clearing combined with stump removal, tiller ploughing, transplanting and high plant density are the agricultural practices that increased paddy yields, while tiller mudding and basal mineral fertilization were inefficient. In the same way, water distribution by demand, water depth above the soil of less than 5 cm, use of water-saving technologies and farmer's knowledge of how to improve water and fertilizer use-efficiency also helped to boost paddy yields. For sustainable rice production in the context of labor shortages and the financial resources required, future studies will focus on the effectiveness of motorized mudding and agricultural credits for rice farmers. Furthermore, considering the crucial role of training in the adopting of good agricultural and irrigation practices, future research will study strategies for wide diffusion of knowledge to rice producers.
Keywords: 
Subject: Biology and Life Sciences  -   Agricultural Science and Agronomy

1. Introduction

Rice (Oryza sativa L.), widely farmed all around the world, is an important cereal crop for the majority of the human population worldwide, as a staple food [1,2,3,4]. Previous studies showed that rice provides 23 to 50% of total calories for almost half of the global population [5,6]. Hence paddy cultivation is crucial in the fight against food insecurity and farmer poverty and a downward trend in rice-growing productivity would undermine global food security [7,8]. According to Saha, et al. [9], rice is called “Global Grain” due to its importance as a staple food for over half of the world's population. In the same way, in the face of rising population growth, climate change, changing food habits and various conflicts, rice yields need to be improved to meet future food demand [4]. Unfortunately, the increase in yields has not been significant enough to meet the ever-increasing global demand for rice, due to a number of constraints [7]. Notably, declining and stagnating yields are the main threats to rice cultivation [3,10]. Labor shortages, water scarcity, higher rice production cost and resource degradation, including multiple nutrient deficiencies, soil salinity and groundwater depletion are constraints to sustainable rice production [9,10,11]. In the same way, climate change, abiotic stresses, water crisis, energy crisis, low nitrogen use efficiency, increasing micronutrient deficiencies, increasing labor costs, decreasing labor availability, low soil fertility, less efficient management of crops, soil and water and increasing methane emissions are further threats to rice farming [3,8,12].
Rice cultivation, the most water consumer crop, is highly sensitive to water stress due to its high water requirements [2,3,13]. According to Nawaz, et al. [3], flood-grown rice accounted for over 75% of worldwide production.. Besides, Fu, et al. [14] added paddy production required not only high water usage, but also much fertilizer. Consequently, irrational water and fertilizer applications are sources of environmental problems. Paddy farmers think that more nitrogen fertilizer improves yields [15]. However, Fu, et al. [14] argued that rice production contributes to the pollution of surface and groundwater through the leaching and runoff of nitrogen and phosphorus. Previous studies found that frequent irrigation and excessive fertilization in rice cultivation caused losses of nitrogen and phosphorus [16,17]. In China, annual runoff losses of nitrogen and phosphorus from rice fields were estimated at 272.6 ± 101.2 Gg/yr-1 and 17.0 ± 6.4 Gg/yr-1 respectively. In the same way, Ibrahim, et al. [12] revealed over the span of thirty years (1990–2020), that the gap between potential yields and paddy yields obtained by rice producers remains high due to poor water and fertilizer management. Alam, et al. [15] explained that nitrogen use efficiency (NUE) in rice cultivation is 20-40%, with a large unused portion ranging from 60-80% contributing to the degradation of soil, water and air quality.
To reduce the problems, several alternative solutions were proposed for sustainable rice farming. According to Shekhawat, et al. [8], the paddy production constraints led to a paradigm shift in the agronomic management of rice-growing practices. The application of shallow-wet irrigation and innovative irrigation technologies would contribute to mitigate the fertilizer losses and hence reduce pollution in rice-growing areas [18]. A number of water management strategies at different scales are proposed and implemented [16]. Previous studies showed that compared to continuously flooded irrigation, water saving-irrigation practices such as alternate wetting and drying can reduce irrigation water and fertilizer losses through runoff and leaching [19,20]. Liu, et al. [16] demonstrated that efficient irrigation water management combined with good agricultural practices such as optimizing fertilization increased water use efficiency and reduced diffuse nitrogen and phosphorus pollution. Optimum water management at field level is the most effective method of reducing nitrogen and phosphorus losses, compared with efficient fertilization management [18]. An integrated soil, crop and fertilizer management strategy would be an effective approach to improving nitrogen use efficiency and, consequently, significantly reducing nitrogen losses by 2030 and minimize adverse environmental issues [15]. Ladha, et al. [7] argued that management practices combined with regular improved cultivar replacement enabled annual production to be maintained at a sustainable level. According to Jin, et al. [13], water-saving practices compared to continuously flooded practice, can increase denitrification loss. In addition, conservation rice growing, including soil and water conservation technologies, such as transplanting, zero tillage and efficient application of water, use of organic and inorganic fertilizers and chemicals, would be a key asset for sustainable rice production [11,15,21].
Similarly, good farming practices as incorporation of rice straw residues reduce nitrogen leaching losses through microbial nitrogen immobilization, due to the high C/N ratio [17,22]. In the same way, the creation of new rice varieties that are less water-demanding, short-cycle and stress-tolerant offers an alternative for optimal water management [11]. In the Sahel, the decision-support tools are used for agronomic management (nutrient, weed and integrated rice crop management practices) and water management practices (salinity-control technologies, water-saving technologies) [12]. Unfortunately, even though farmers have some knowledge about applying fertilizer and fertilizer rates, land preparation, using improved varieties, pests and diseases management, market information, and storage and processing food, most rice farmers lack knowledge of irrigation water management [23].
In addition, Ibrahim, et al. [12] showed that previous research has focused little on plot-level practices and the sustainability of rice-growing systems. For this reason, Ijachi, et al. [5] recommended training of farmers on soil and water management and climate friendly practices that mitigate climate variability in rice production. Ismael, et al. [24] also, suggested small-holder farmers need more assistance and technical support to identify and adopt more productive and less costly Rice Farming Systems. For sustainable rice production, we need to identify specific critical points in agronomic and water management in irrigation schemes, by assessing rice growers' perception, for future research.

2. Materials and Methods

2.1. Study Area

The study was carried out on five rice irrigation schemes in Togo's three agro-ecological zones: Kovie and Agome-Glouzou irrigation fields (coastal region), Beme and Tutu irrigation fields (forest region), and the Koumbeloti irrigation field (Savannah region). The geographical coordinates of these sites are latitude 6°33'21''N, longitude 1°39'58''E and altitude 17 m for Agome-Glouzou; latitude 6°20'44''N, longitude 1°07'56''E and altitude 26 m for Kovie ; latitude 7°05'25''N, longitude 0°43'22''E and altitude 281 m for Beme; latitude 7°05'05''N, longitude 0°43'33''E and altitude 274 m for Tutu; latitude 10°23'58''N, longitude 0°28'39''E and altitude 125 m for Koumbeloti (Figure 1). The three agro-ecological zones were chosen due to their climatic and physical-morphological differences (relief, vegetation, pedology). The coastal and forest zones have a tropical Guinean climate characterized by two dry and two rainy seasons, while the savannah zone has a tropical Sudanian climate characterized by one rainy and one dry season [25]. According to MERF [25], average annual temperatures and rainfall are respectively 27°C/1,000 mm in the coastal zone; 25°C/1,400 mm in the forest zone; and 28°C/1,000 mm in the savannah region.

2.2. Questionnaire, Sampling, and Data Collection

2.2.1. Questionnaire

A semi-structured questionnaire with open and closed-end questions was used. The questions cover the five domains of sustainable intensification, including agricultural productivity, economic indicators, environmental condition, human condition and social action [26]. So, the data consist of:
  • ▪ Rice farmers’ socioeconomic characteristics (e.g. gender, age, marital status, education level, irrigated rice production experience, type of land tenancy, membership in farmers’ cooperative, sources of income, accessing to agricultural credit, marketing information, etc.);
  • ▪ Agronomic management practices (e.g. plots number, method of plot clearance, ploughing method, mudding method, rice seeds access, rice planting methods, weed and pest control, amount and timing of fertilization, cropping systems practice, rice production knowledge, training in rice production, labor source, agricultural extension access, etc.);
  • ▪ Irrigation water management practices (e.g. training in irrigation, training on water-saving, water availability, equitable water distribution, conflicts on irrigation water, water-saving practices, water delivery method, water level above the soil, water level below the soil surface before the next irrigation, irrigation frequency, amount of irrigation water used per each application, irrigation schedule regularly respected, water available for the entire production season, drainage, etc.);
  • ▪ Famers’ perception on water and agronomic practices (e.g. water productivity, knowledge of water-use-efficiency, knowledge of water-saving methods, knowledge of irrigation period and water amount applied, water shortage on the irrigation scheme, water wastage factors, effect of water deficit on rice yields, effect of excess water on rice yields, effect of excess water on fertilizer use-efficiency, drainage water using in case of water shortage, soil salinity problem, water management improving, inappropriate pesticides and fertilizers use effect on rice yield and water quality, mulches and compost use advantage, access of advisory service, etc.).

2.2.2. Sampling, Data Collection and Analysis

The farmers’ list of each rice irrigation scheme was used for sampling and data collection. The sample of respondents randomly chosen among the farmers whose list was provided by irrigation scheme office. The sample number from each irrigation scheme (Table 1) was determined through equation (1) [27]:
n =   N 1 + N e 2
Where; n = sample of rice farmers, N = total number of farmers using irrigation scheme and e = precision level (5 %).
Data was collected from April to July 2023, using the kobocollect software by face-to-face interviews including a direct observation through field visits. Only rice farmers on irrigated schemes were surveyed. The survey data analysis was done through R-software 4.2 for analysis of the determinants of irrigation water and agronomic management at a 5 % significance level [27].

2.3. Conceptual Framework of the Study

Firstly, once socio-demographic, agronomic and irrigation data were collected and analyzed, the effect of socio-economic characteristics on the adoption of agronomic and irrigation practices was assessed. The different choices of agricultural practices and irrigation water management implemented by rice farmers are their perception on water and agronomic management. It was also evaluated how these data affected the yields of paddy rice. Secondly, two categories of rice growers were distinguished on the basis of their yields: "the less yielding rice growers", whose yields were below the overall average, and " the high yielding rice growers ", whose yields were higher than average. Finally, the socio-economic characteristics as well as the agronomic and water management practices that contributed to good yields were highlighted. Figure 2 indicates the conceptual framework of this study.

3. Results

3.1. Respondents' Socio-Economic Characteristics

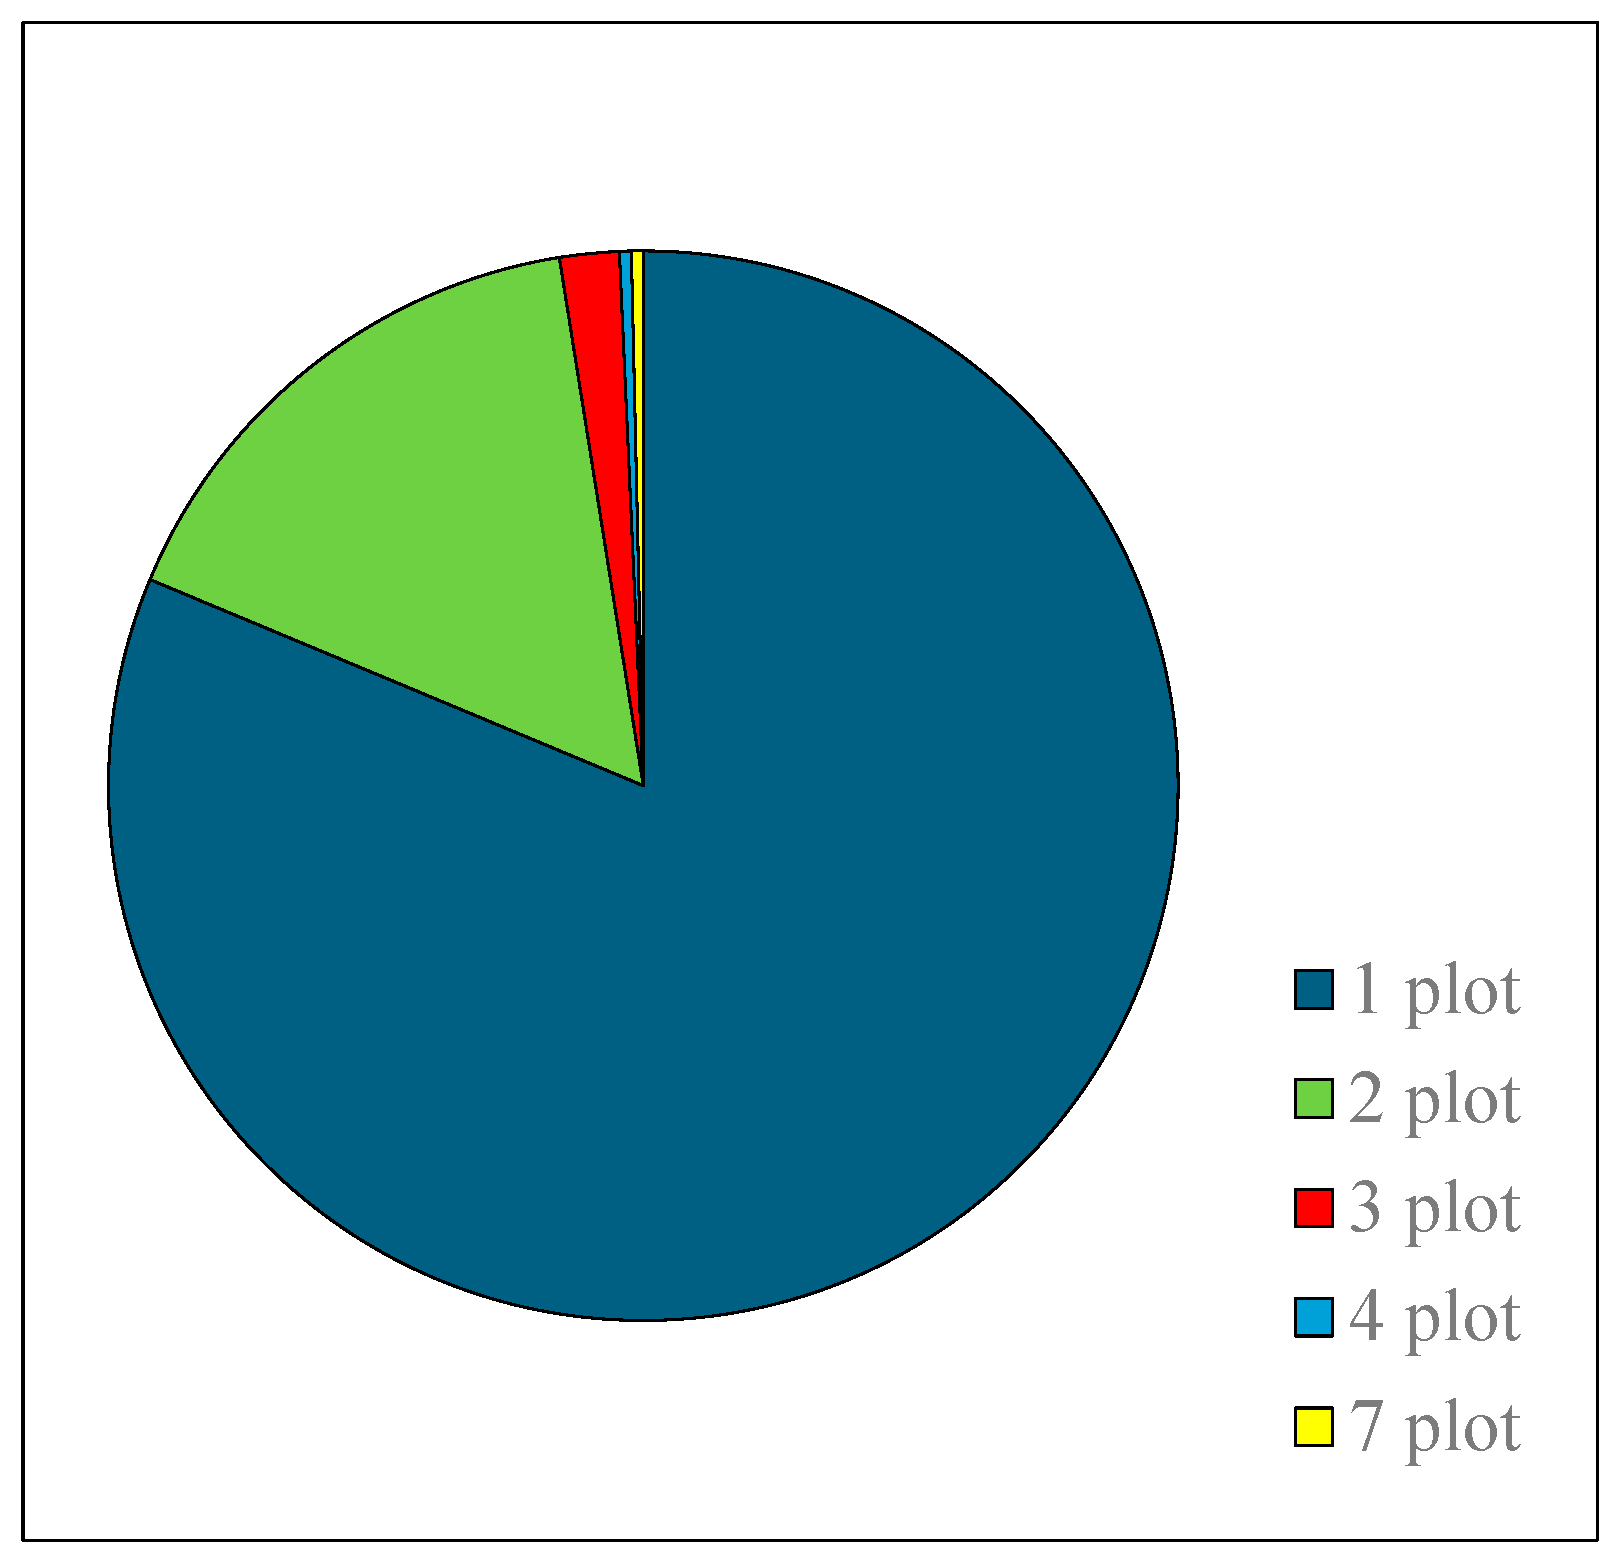
The socio-economic characteristics of rice farmers are shown in Table 1. The results showed that female rice growers accounted for half of all rice growers. The average age of rice farmers was 44.5 years, with 7% under 27 and 13% over 58. Approximately, less than 6% of rice farmers were single, compared with over 85% married. More than two-thirds of the rice growers surveyed had a primary or secondary education (Primary & JHS) with rates of illiterates and university graduates of 19% and 4% respectively. Average experience in irrigated rice farming is 9 years, with around 40% of farmers having less than 5 years' experience and 20% having more than 15 years. Many rice growers, i.e. 65%, used rented plots, compared with 21% who had their own or family land. Over 80% of rice growers were members of agricultural cooperatives, while 62% were producers whose only income was from farming. Trade, handicrafts and livestock farming were the main sources of income, in ascending order, in addition to rice production. Agricultural credit was accessed to over 64% of rice growers. The proportion of farmers using sharecroppers was 86%, while 14% used family labor. The majority of rice growers (80.9%) had a single plot on the irrigated fields, versus 19.1% who had more than two plots (Figure 3).
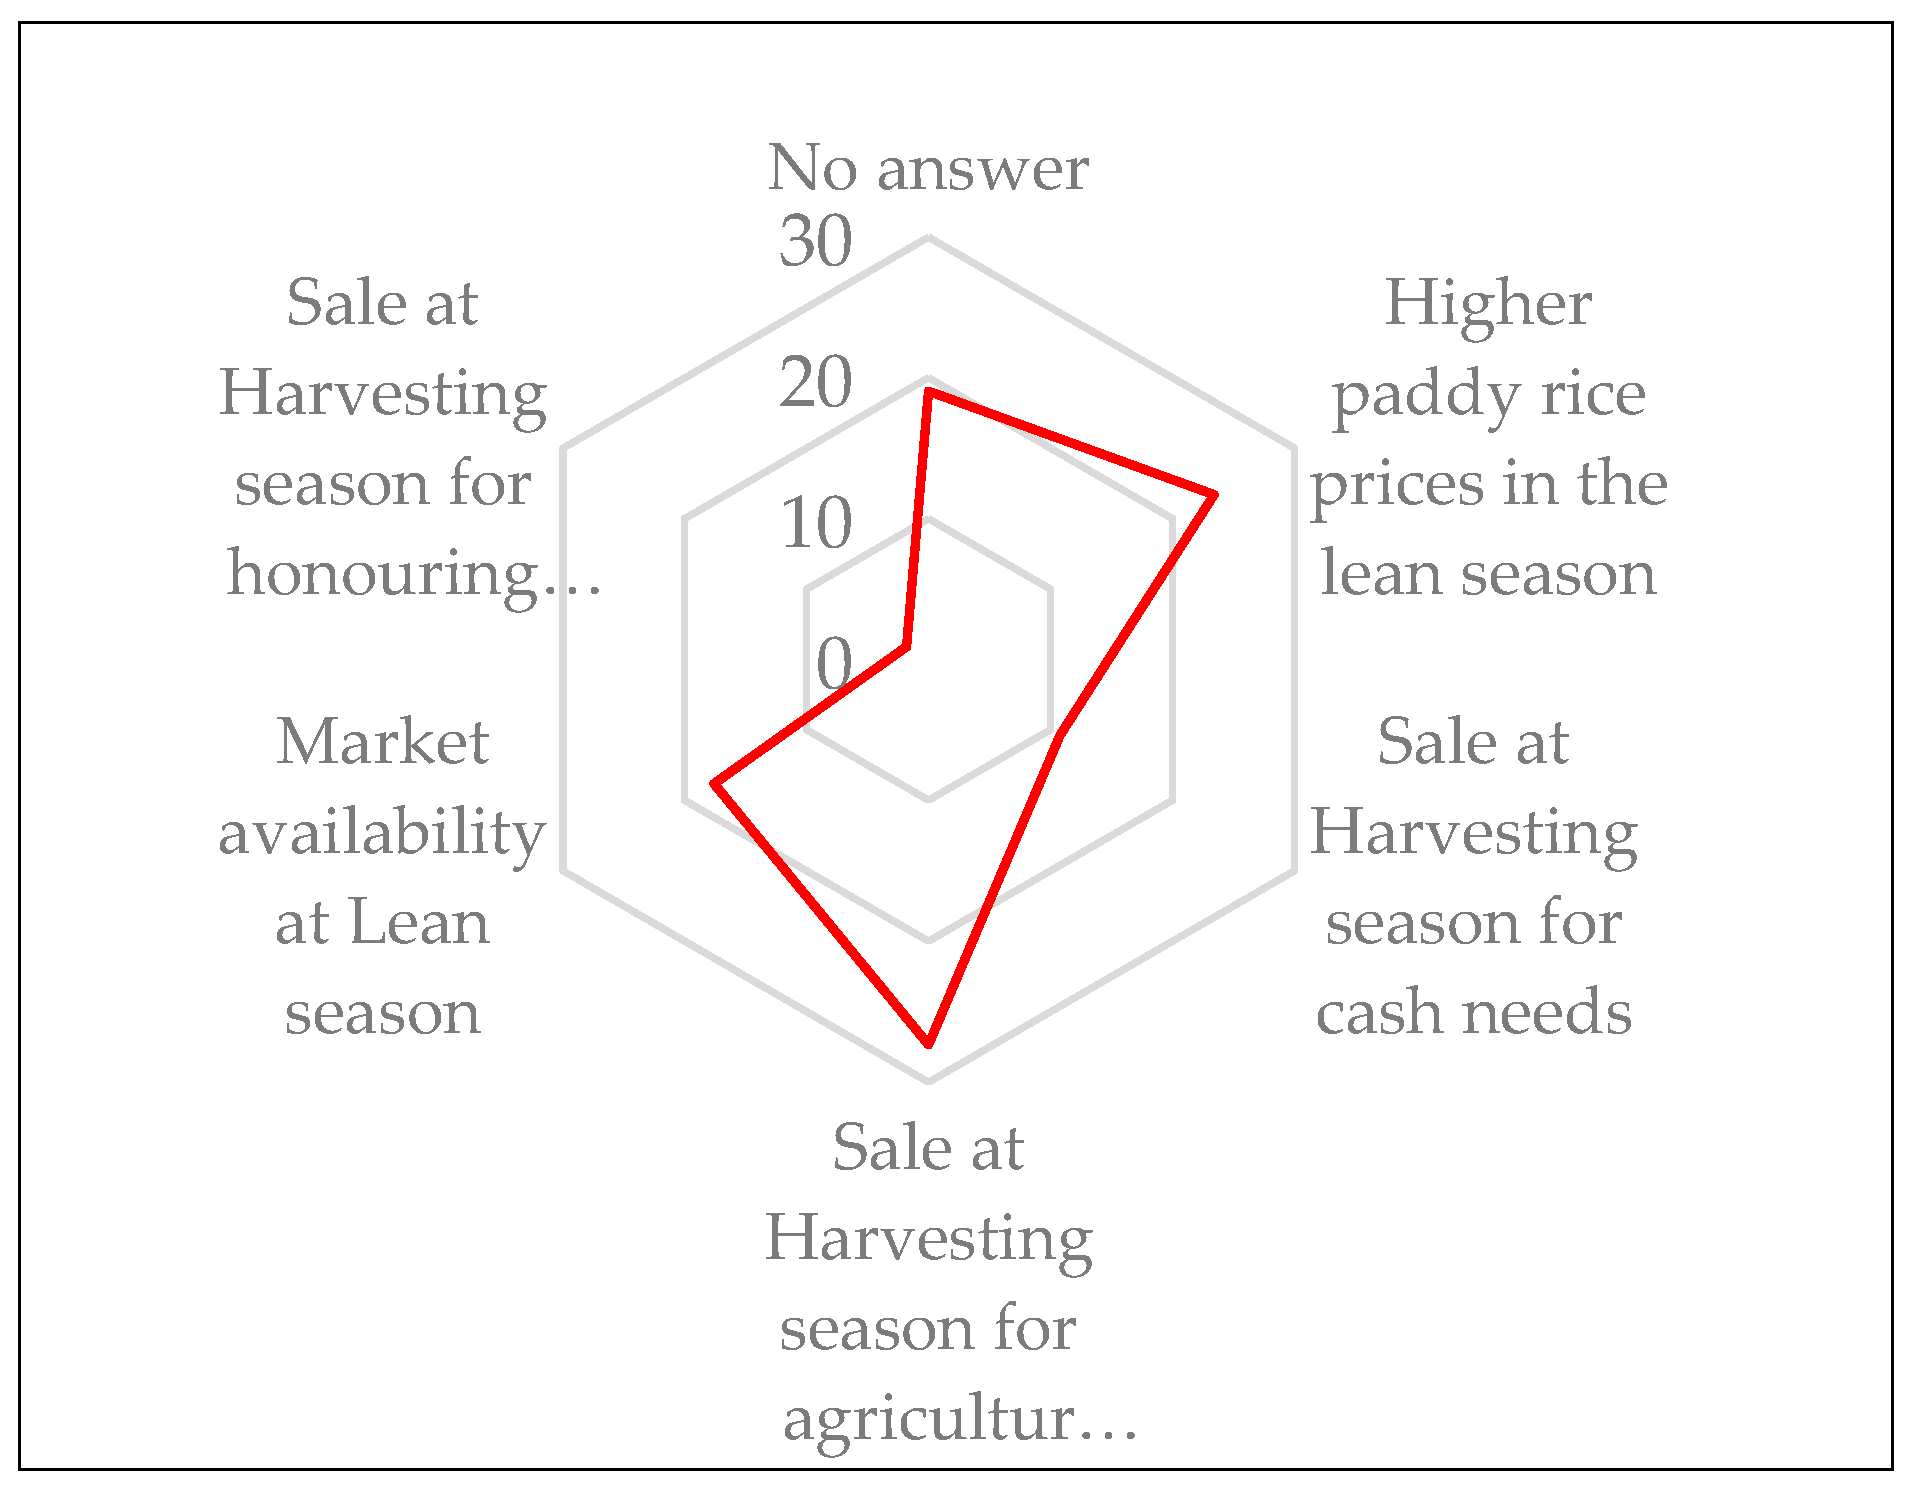
Fewer growers (27%) stocked up on rice for the lean season than those who sold immediately at harvest (62%). Rice growers representing 40% sold their paddy at harvest for cash needs (10.8%), repayment of agricultural credit (27.3%) or to honor market contracts (1.8%) (Figure 4). Over half of producers (53%) sold their harvest in the form of white rice, as opposed to 47% who sold paddy immediately. For 63% of producers and 37% of rice growers, the market was available, and for those who responded (54%), it was mainly Aggregators (32.7%), traders (18%) and households (3.2%) before production.

3.2. Agronomic Practices in Irrigation Schemes

3.2.1. Training Attended in Rice Production

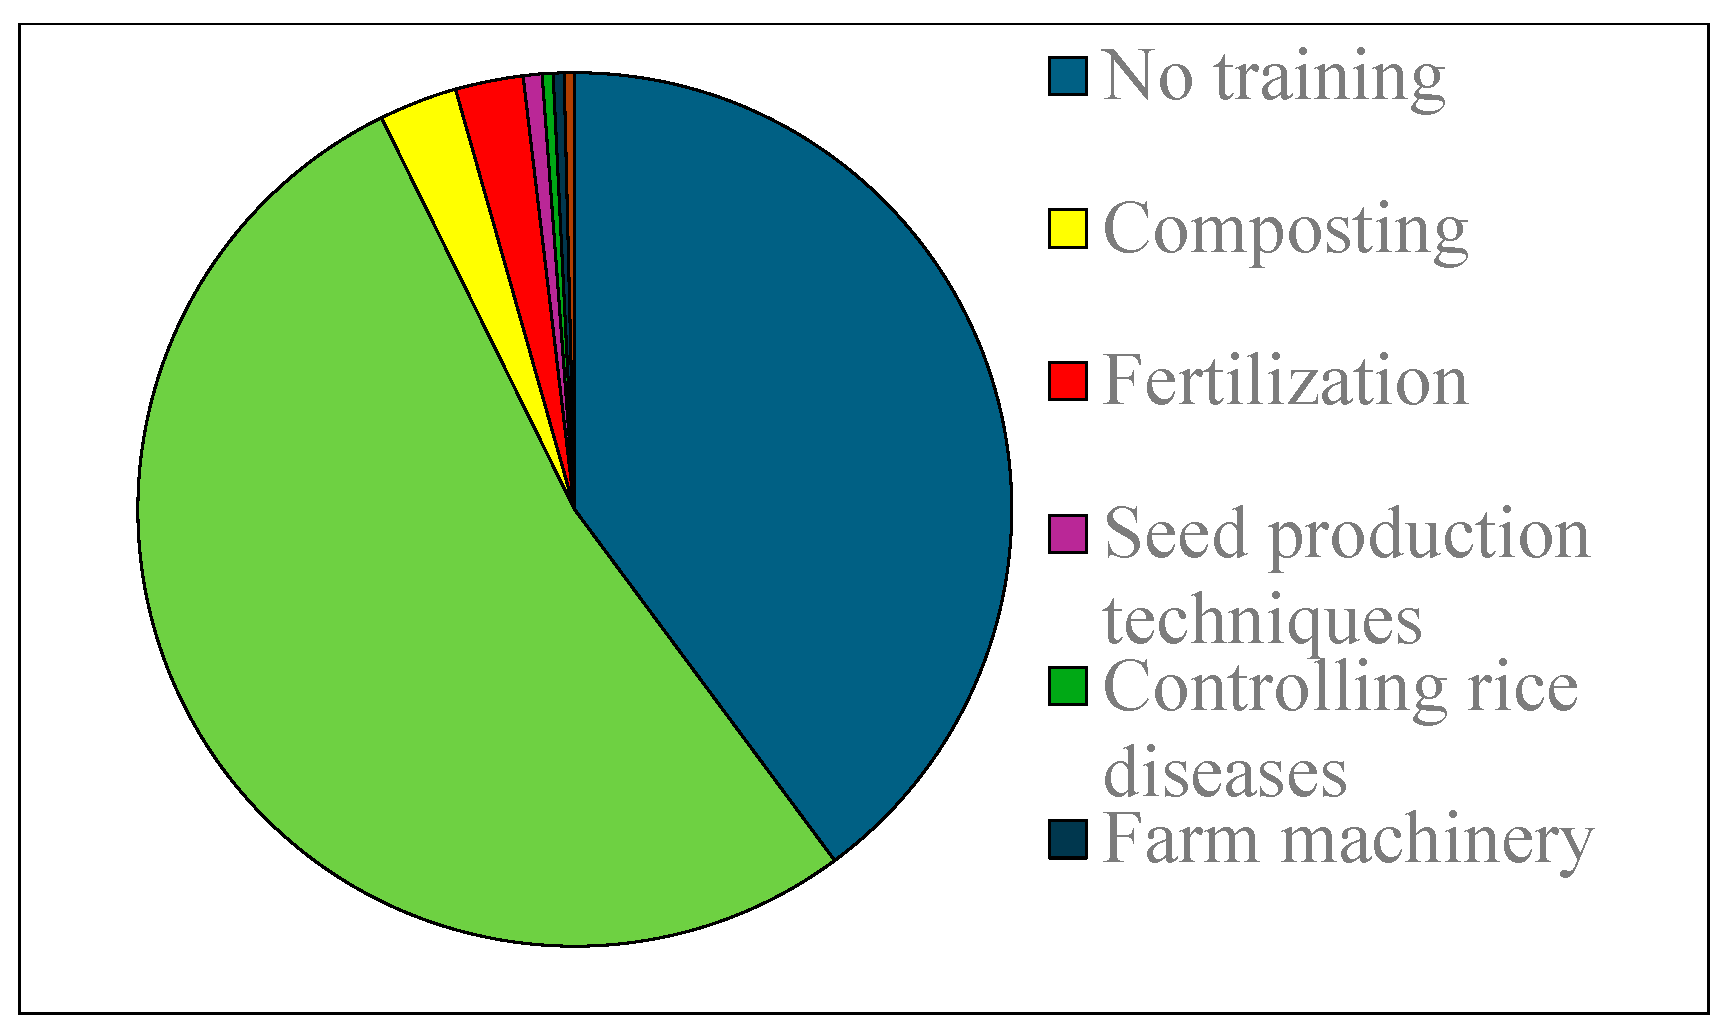
Survey results showed that 61% of rice growers had received training in rice production, whereas 39% had not (Figure 5). The training sessions included composting, mineral fertilization, economic profitability and rice seed production. The rate of female and male rice farmers trained was 53% and 65% respectively. Nevertheless, the Pearson test showed that the number of women trained was significantly higher than the number of men, at the 5% level (p-value = 0.01138).

3.2.3. Soil Preparation

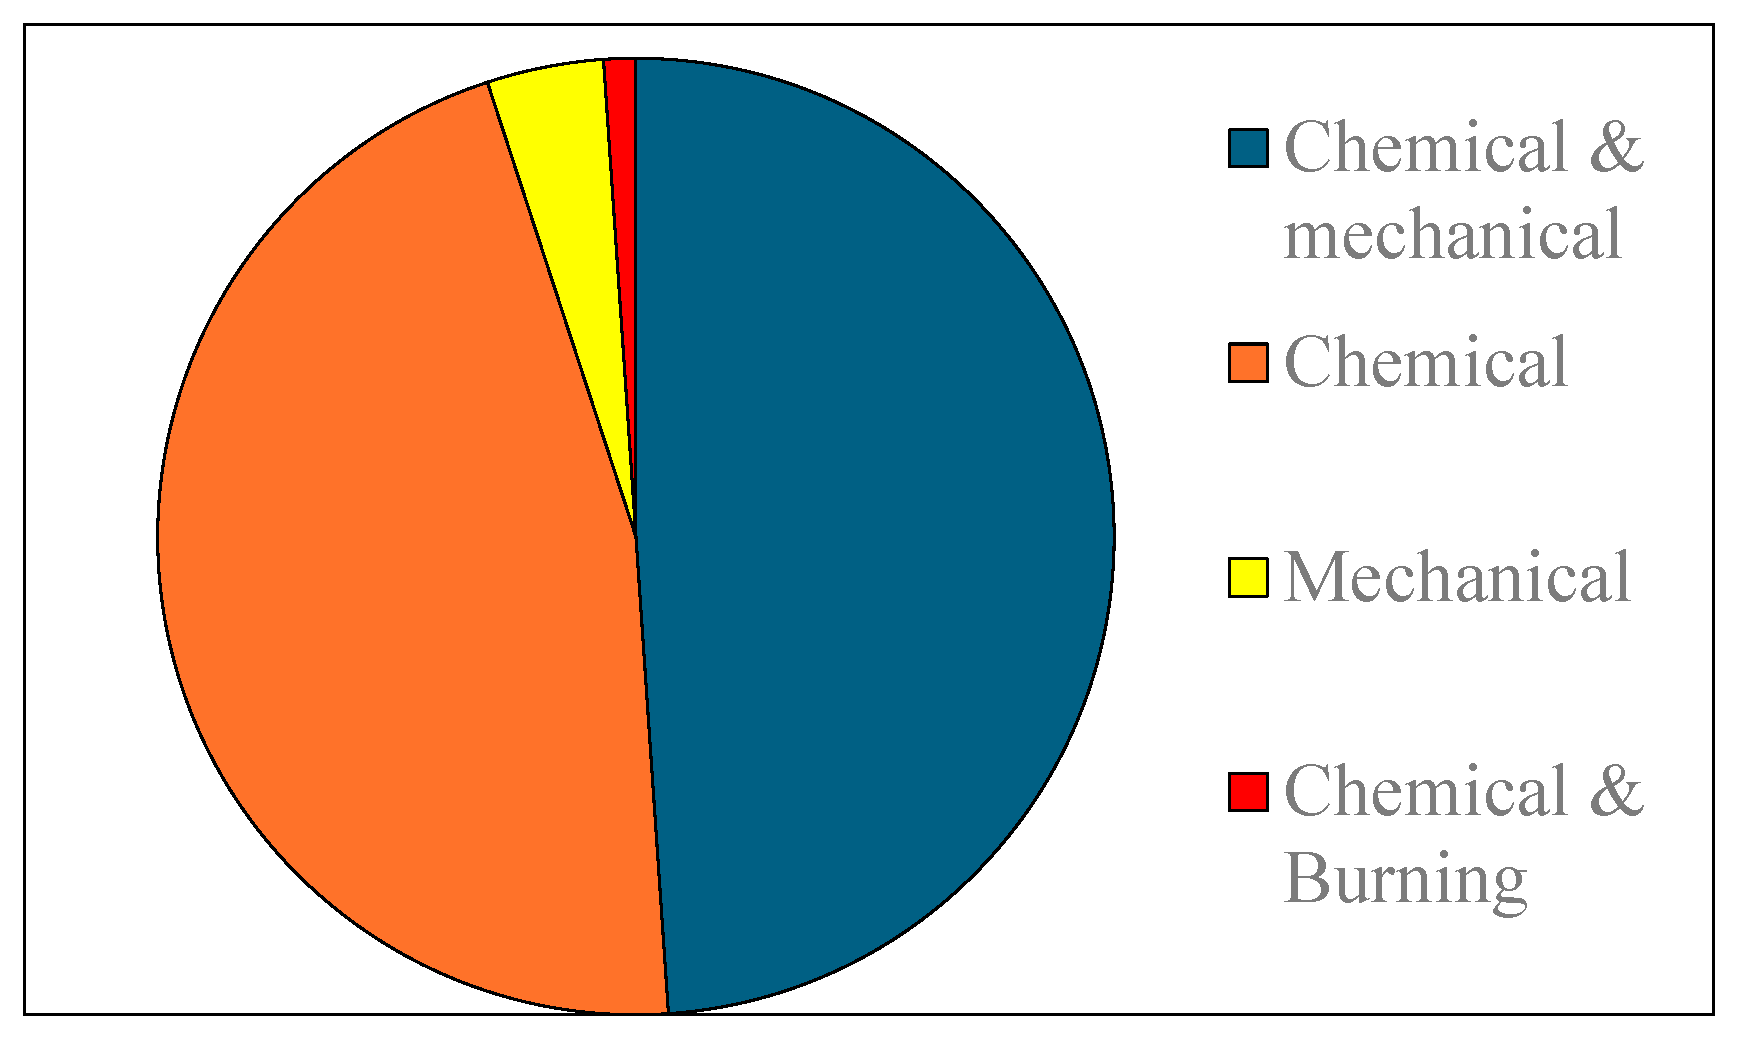
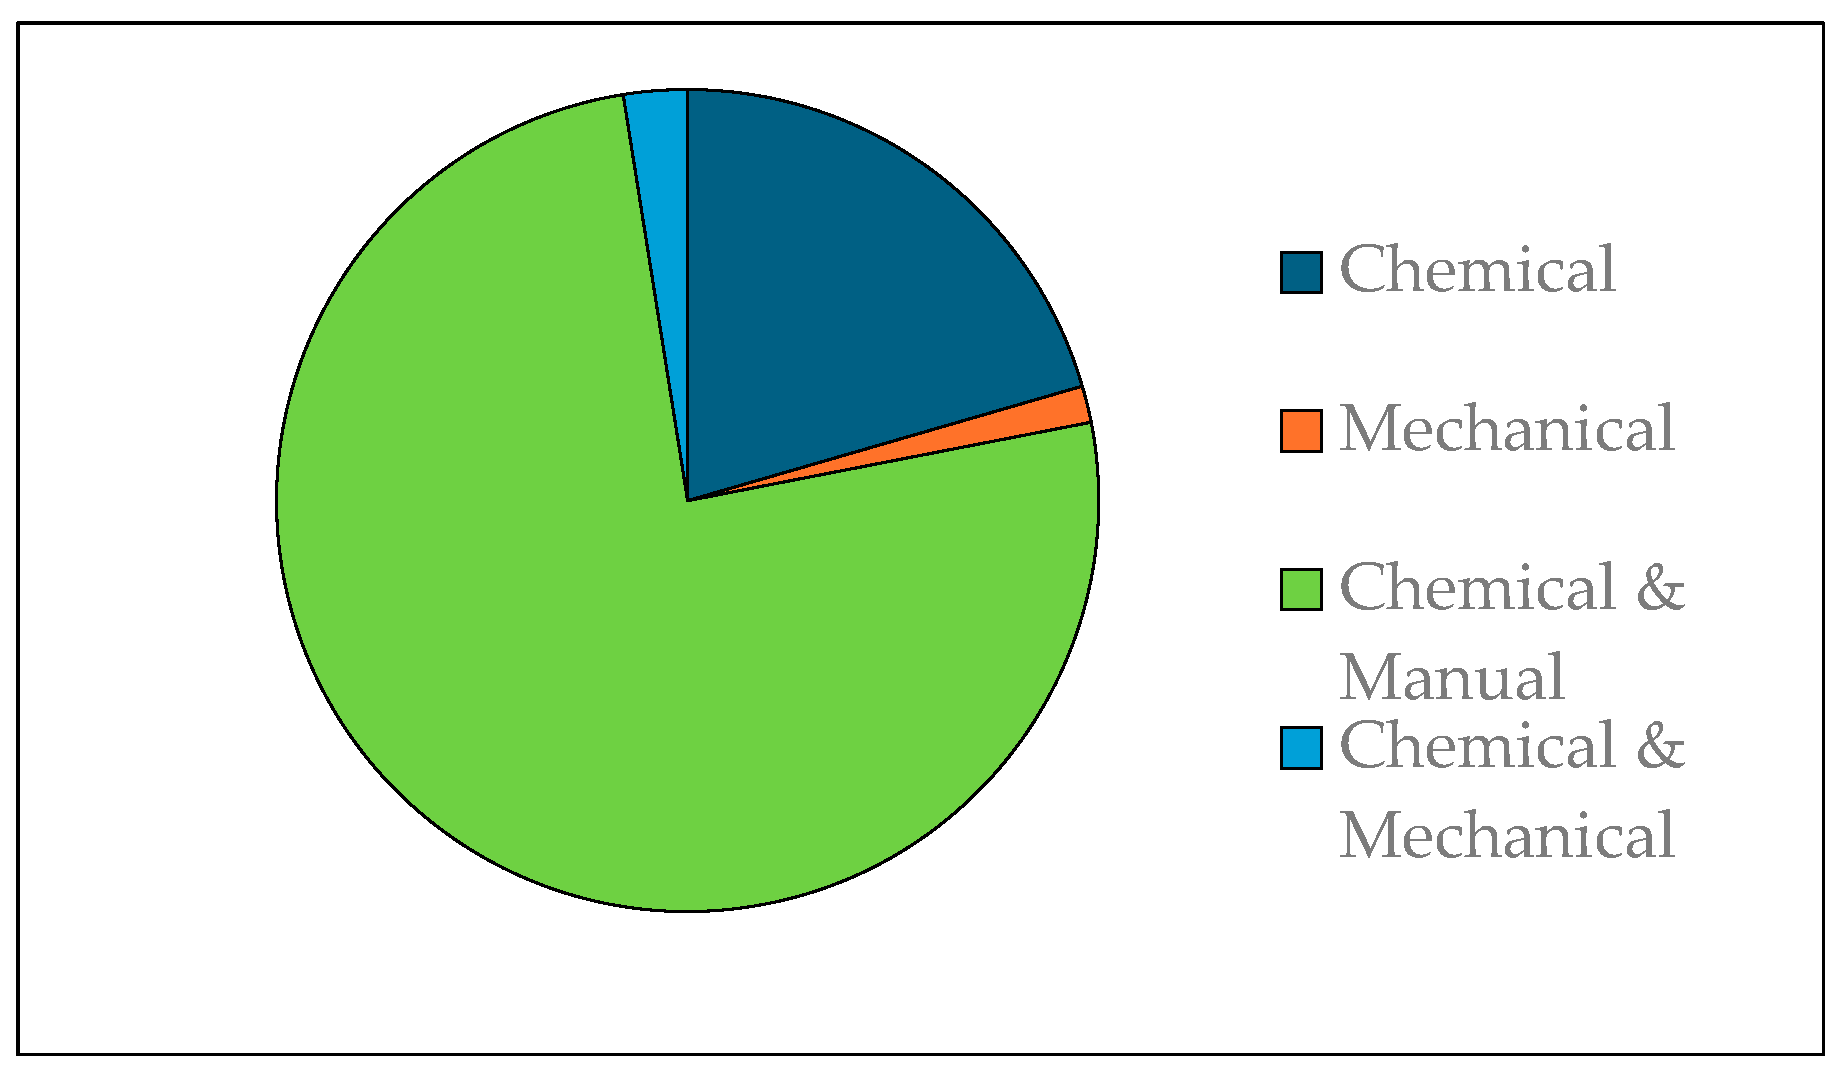
To clear the plots, almost all (96%) of the growers applied chemical products, half of whom, in addition to herbicides, combined mechanical methods to keep the plots perfectly cleared brush (Figure 6). The choice of clearing method was influenced by a number of socio-economic characteristics. Access to agricultural credit significantly affected the clearing method at the 5% level (p-value = 0.033447). Indeed, 52% of non-credited farmers opted for chemical clearing only, compared with 36% of credited farmers, while 60% of credited rice farmers opted for combined mechanical and chemical clearing, vs. 43% of non-credited farmers. This means that rice growers with financial resources requested mechanical land clearing following the chemical herbicides treatment. The farmer's experience in irrigated rice growing also had an impact on the clearing method at the 5% significance level (p-value = 0.002475). Approximately, more than 52% of farmers with 11 - 15 years’ experience chose chemical land clearing only, while 53% of farmers with above 15 years’ experience and 52% of farmers with Below 5 years’ experience adopted combined chemical and mechanical land clearing. The level of education also affected the adoption of a particular type of land clearing (p-value = 0.017302). More than half of JHS (51.8%) and SHS (50.1%) farmers preferred combined mechanical and chemical land clearing, while 60% of university rice growers opted for chemical land clearing only. However, no preference was shown by illiterate and primary-level farmers.
Around 55% of rice growers aged between 38-47 years and 48 - 57 years used chemical clearing only, while 53% of growers aged 18 - 27 years, 63% of growers aged 58 - 67 years and 38-63% of growers aged above 68 years used chemical clearing combined with mechanical clearing. On the other hand, 71.3% of growers aged 28 - 37 years used chemical clearing combined with burning. The Pearson test reveals that the age of rice growers (p-value = 0.047531) at the 5% significance level. It should also be added that available manpower affects the choice of clearing type at the 5% threshold (p-value = 0.013249), as does the rice farmer's source of income (p-value = 8.6244e-12). Farmers who have another source of income in addition to agriculture (handicrafts, trade and livestock) prefer chemical clearing only (89%), whereas rice farmers who practice only agriculture opt for chemical and mechanized clearing (40%), in order to have a cleanly cleared plot.
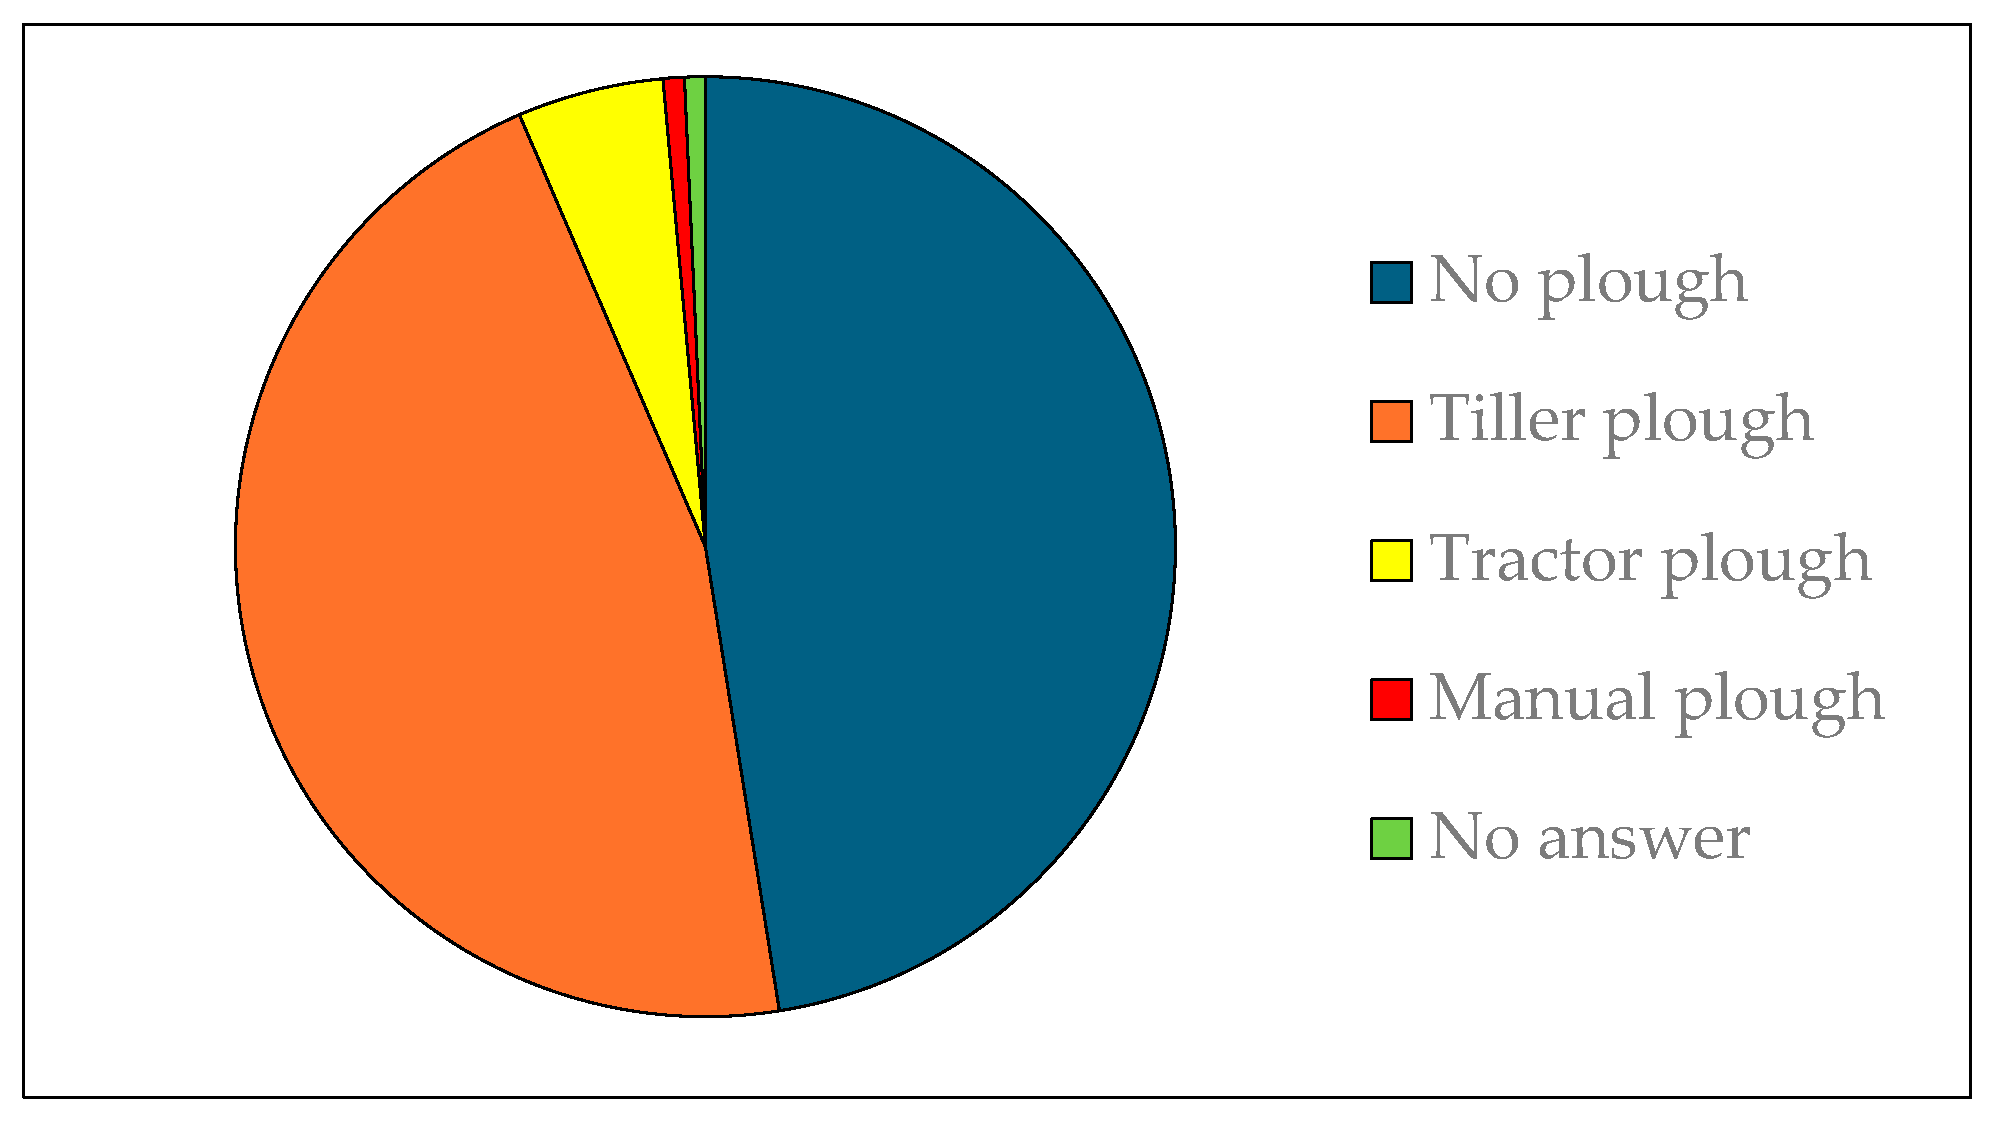
Zero ploughing accounted for 47.5% of farmers versus 46.0% for tiller ploughing (Figure 7). The Pearson test revealed that grower experience significantly influencing the choice of ploughing method with a p-value = 1.2901e-05. Growers with less than 10 years' experience were more inclined to use tiller and tractor ploughing, while growers with more than 11 years' experience favoured zero tillage and manual ploughing. Also, membership of a rice-growers' cooperative was found to influence the choice of ploughing type at the 5% significance level (p-value = 1.4452e-8). Indeed, growers who were members of a cooperative practiced more motorized plowing. The producer's source of income also affected the choice of ploughing method for p-value = 8.6244e-12.
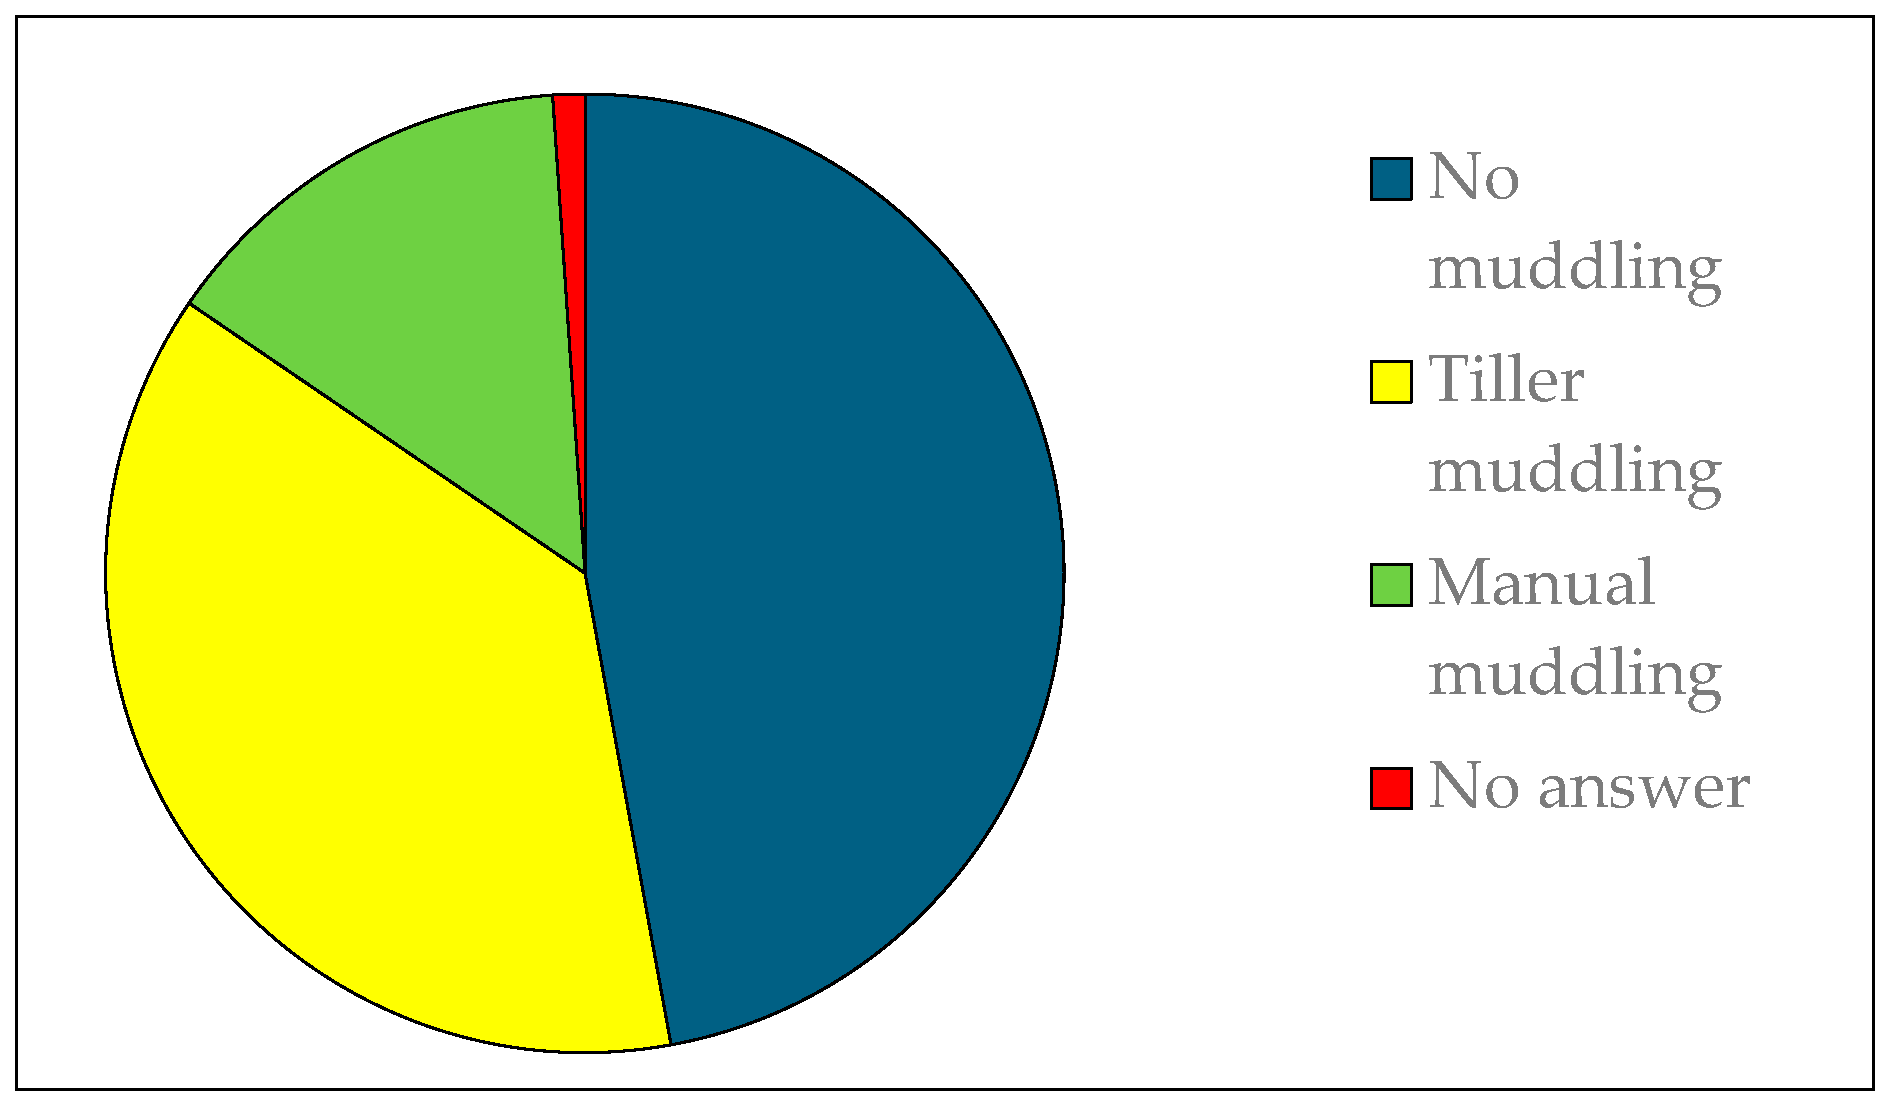
As with ploughing, 47.1% of rice farmers opted for no muddling and 37.4% for tiller muddling (Figure 8). Statistical analysis showed that several socio-economic factors had an impact on rice farmers' choice of mudding method at the 5% significance level. Access to agricultural credit influenced the choice of mudding method with a p-value = 2.2504e-10. The percentage of farmers without access to agricultural credit who adopted no muddling was 75%, while the percentage of farmers with access to agricultural credit who adopted tiller muddling was 88.5%. Rice growers with access to agricultural credit prefer tiller muddling.
The choice of tiller mudding method was influenced by the farmer's rice-growing experience (p-value = 0.012339). The tendency to use tiller mudding decreased with experience, i.e. those with less experience adopted more tiller mudding (55% for farmers with below 5 years’ experience, 20% for farmers with 6 - 10 years’ experience, 13% for farmers with 11 - 15 years’ experience and 11% for farmers with Above 15 years’ experience). Membership of a rice cooperative was a factor in the choice of mudding method, at p-value = 5.1297e-10, because around 75% of rice growers who were not members of an agricultural cooperative adopted zero and manual mudding, whereas 41% of growers who were members of a rice cooperative practiced tiller mudding. Adoption of the type of mudding also depended on the level of education of the rice farmer, with a p-value = 0.0038393. Preference for tiller mudding decreases with increasing level of education (45.5% for uneducated, 44.0% for primary, 30.5% for JHS and 19.2% for SHS). Plot ownership and mudding method were also related, with p-value = 0.00. Approximately, 88.8% of producers using public plots practiced mudding with tiller, whereas 87.5% of rice growers using family lands and 71.5% using rented plots adopted zero mudding, due to the availability of agricultural machinery on public irrigated schemes.

3.2.4. Setting Up the Growing Operation

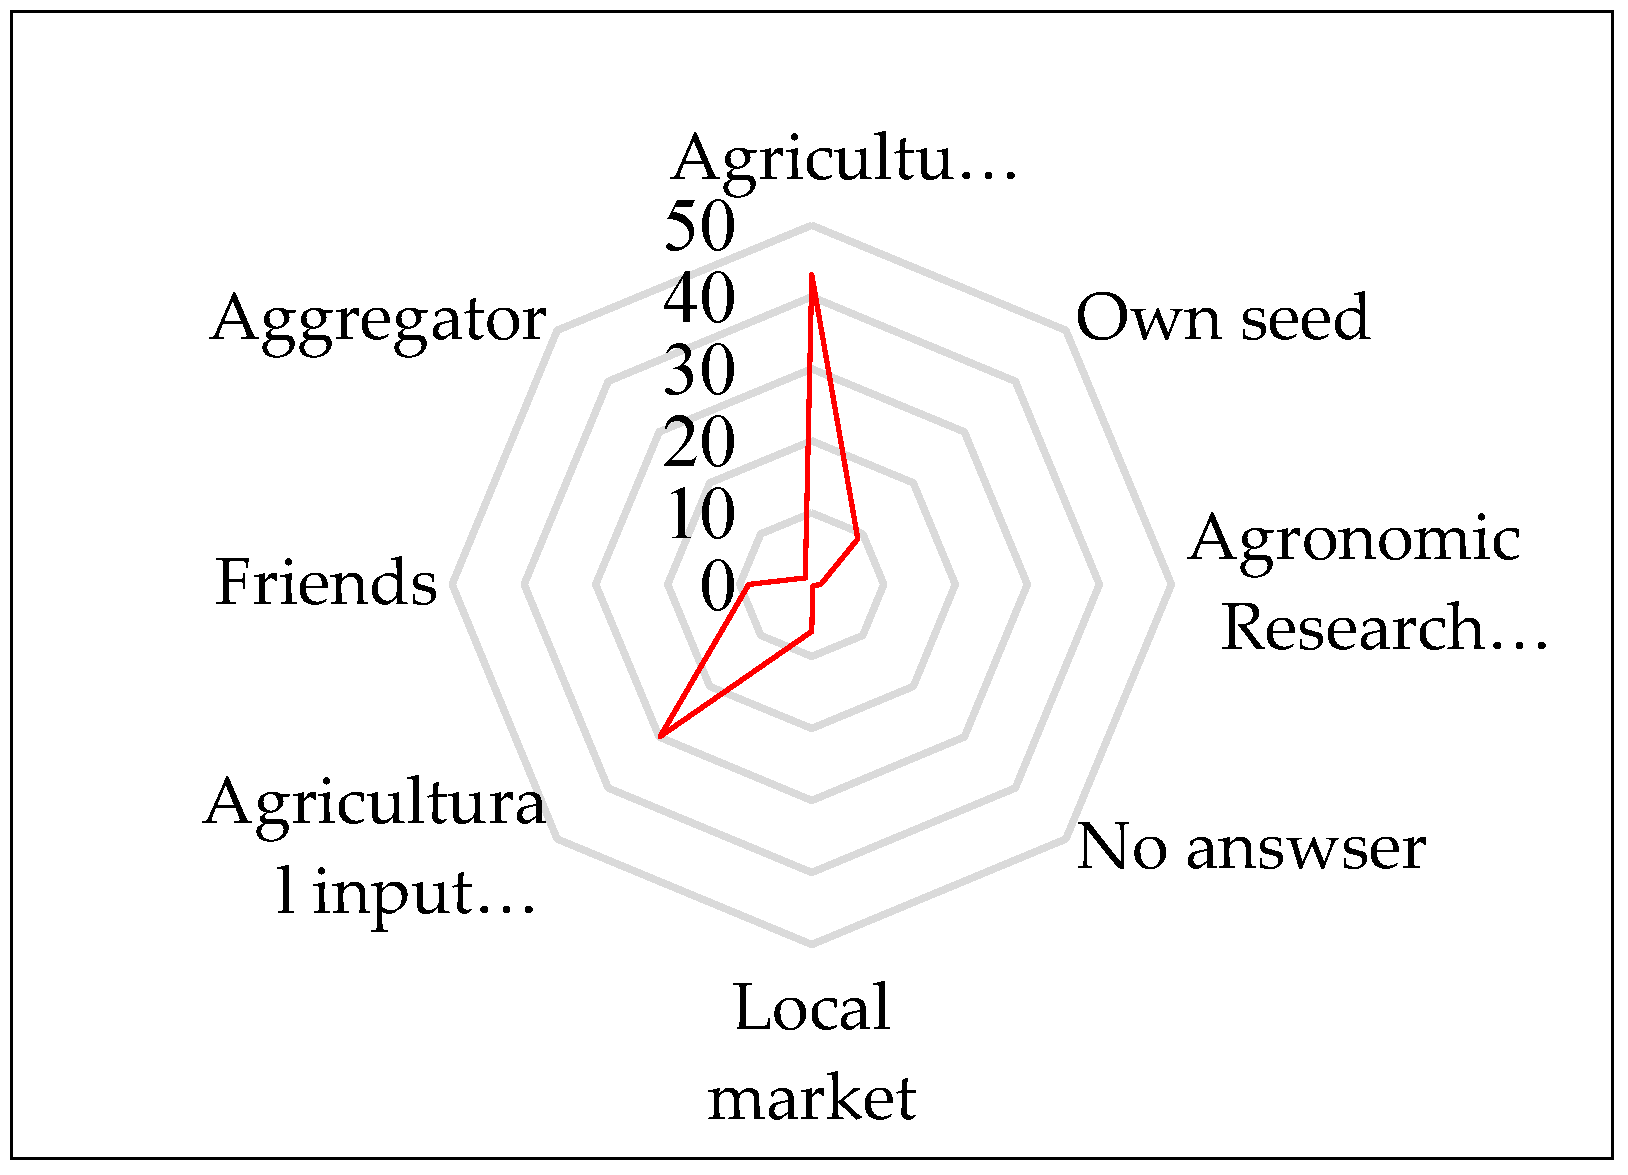
Three cultivars, including IR 841 (83%), Chapeau vert (14.4%), GR34 (1.1%) and Nerica (0.4%), with seed purchased from agricultural extension service (43.1%) and agricultural input shop (29.8%), were planted on irrigated fields (Figure 9). Rice transplanting was widely practiced (83%), compared with 17% of farmers who opted for direct seeding. Pearson's statistical test showed that the choice of sowing method is linked to gender at the 5% significance level (P-value of 0.010401). In comparison, women adopting transplanting were less numerous than men at the 5% significance level according to the Pearson test (p-value = 0.005). Access to agricultural credit and sowing method are linked at the 5% significance level with a p-value = 0.00, as 98.9% of rice farmers who obtained agricultural credit practiced transplanting, compared with 55% of rice farmers who have not had access to agricultural credit. Training also influences the adoption of the sowing method with a p-value = 1.4609e-06. Only 8.3% of trained farmers use direct seeding, compared with 30.3% of untrained farmers. Farmer experience has a significant influence on the choice of sowing type at the 5% significance level (p-value = 5.8013e-06). The rate of transplanting decreases as rice-growing experience increases, in the order of 84.7% for below 5 years’ growers, 81.3% for 6 - 10 years’ growers and 61.70% for 11 - 15 years’ growers. Nevertheless, 100% of growers above 15 years opted for transplanting.
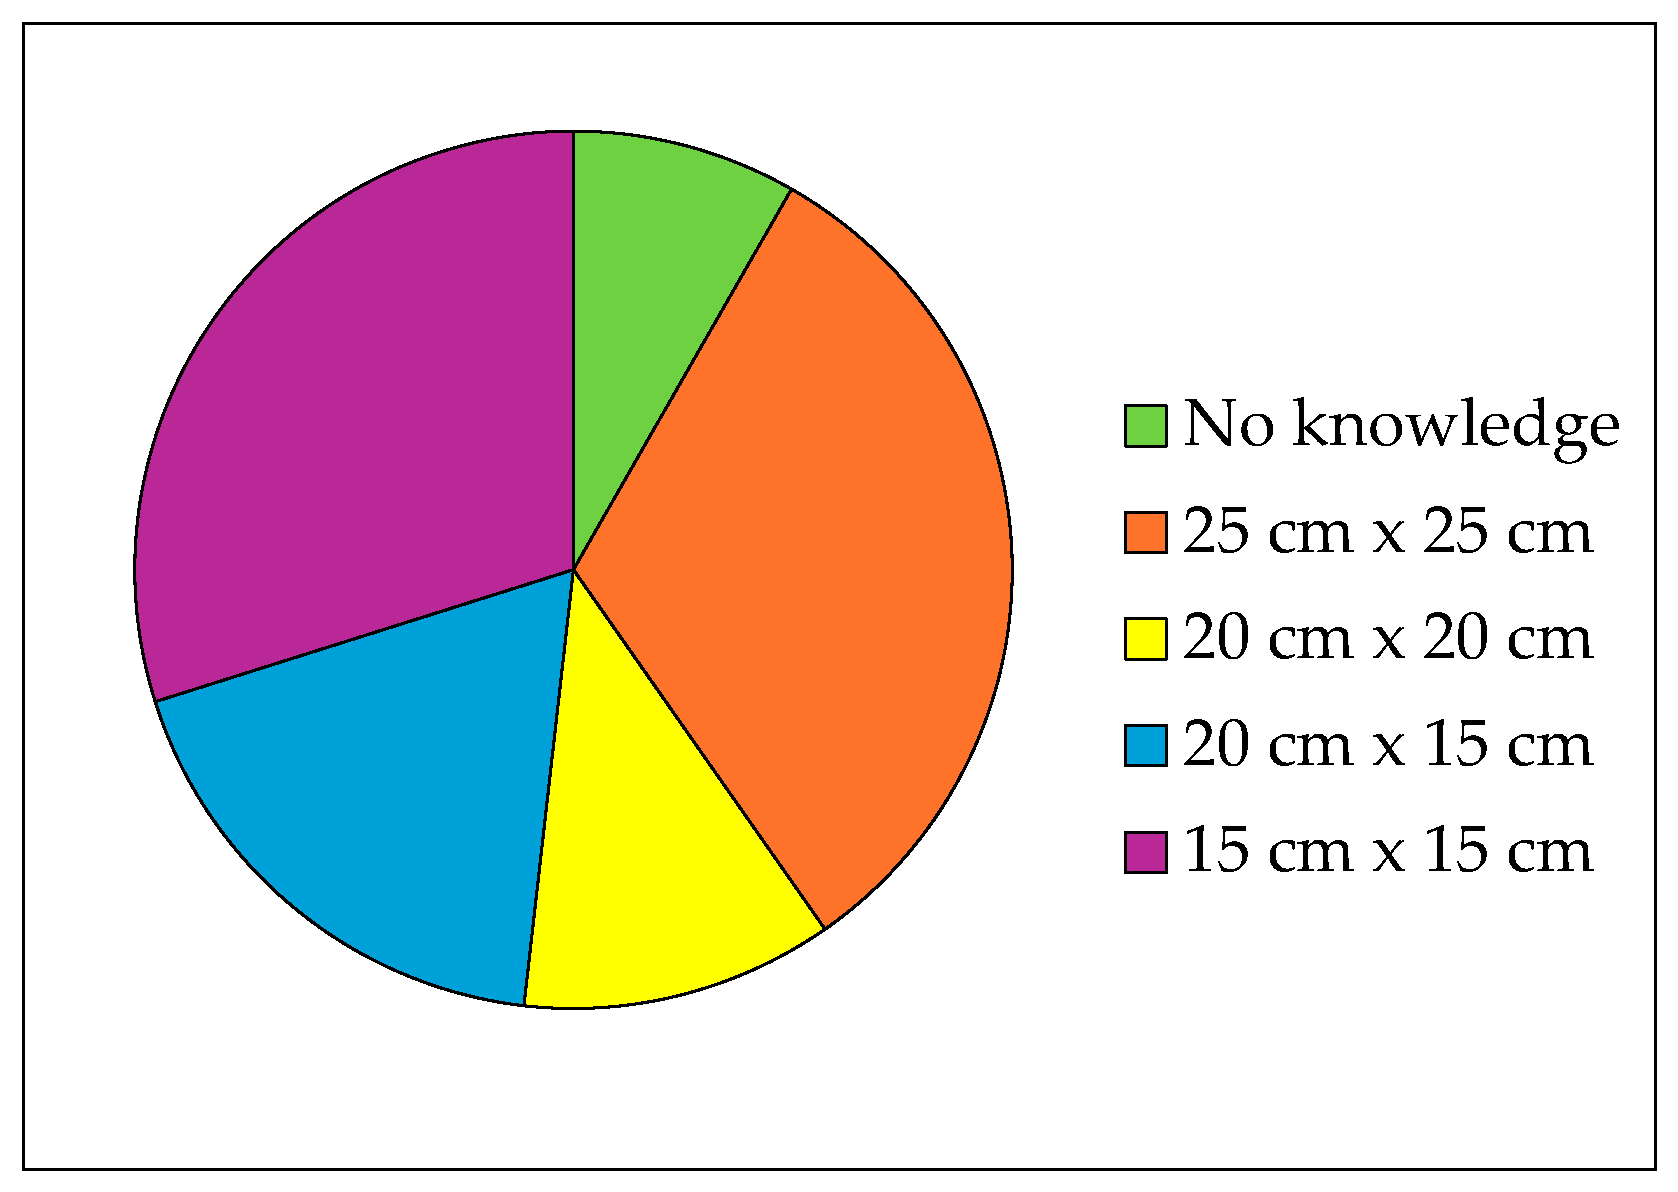
Cultivation patterns varied on irrigated fields, with 25 cm x 25 cm and 15 cm x 15 cm being the most popular (Figure 10). Statistical analysis shows that the choice of cropping pattern is affected at the 5% significance level by access to credit (p-value = 0.00). For example, over 93% of rice growers who adopted the 25 cm x 25 cm cropping pattern, essentially by transplanting, had access to credit, whereas around 94% of growers who adopted the 20 cm x 20 cm cropping pattern by direct sowing did not obtain agricultural credit.
Grower experience influenced the choice of cropping pattern at the 5% threshold (p-value = 2.3895e-08). Experienced growers with more than 15 years' experience preferred the 15 cm x 15 cm cultivation pattern, while the order of adoption of the 25 cm x 25 cm cultivation pattern decreased from growers with less than 5 years' experience (47%), growers with 6 - 10 years' experience (33%), growers with 11 - 15 years' experience (26%) and growers with 15 years' experience (4%). Gender and choice of cropping pattern were also linked for p-value = 0.0035642, because men preferred the 25 cm x 25 cm and 15 cm x 15 cm cropping patterns compared with women, whereas women adopted the 15 cm x 20 cm cropping pattern. Nursery time before transplanting was above 12 days for 71% of respondents and 8 - 12 days for only 9% of growers, with 20% of growers having no idea about nursery time. The farmers who opted for continuous monocropping of rice (58%) and rotation crops were okra (10.1%) and vegetable coret (1.8%). Training influenced the choice of cropping pattern at the 5% threshold (p-value = 4.1254e-10) because the majority of trained rice growers adopted a 25 cm x 25 cm cropping pattern.

3.2.5. Fertilization and Weed Control

Almost all respondents (99.3%) did not apply compost as basal fertilizer. On the other hand, 98.9% of rice growers applied mineral fertilizer in the form of N15P15K15 or urea 46%. A large number of rice growers (96.4%) did not apply N15P15K15 as a basal fertilizer (Table 2). Nevertheless, two weeks after transplanting, over 40% of growers applied N15P15K15 fertilizer at doses ranging from 50 to 600 kg/ha, with a peak of 200 kg/ha (24%). At seven weeks after transplanting, 96.8% of growers had not applied any dose of N15P15K15 fertilizer, although small numbers of growers had applied doses ranging from 50 to 200 kg/ha. One week after transplanting, 30% of those responding had applied various doses of urea fertilizer (46% ranging from 50 to 400 kg/ha), while 70% of rice growers reported applying no fertilizer at all (Table 3).
Nevertheless, by the seventh week after transplanting, 73% of growers had applied urea in doses ranging from 25 to 500 kg/ha, with a peak of 200 kg/ha (40%), as recommended by the agricultural extension services. At week ten, 80% of rice growers had not applied any urea fertilizer at all (46%). At the same time, 20% had applied doses of 46% urea ranging from 25 to 500 kg/ha, with a peak of 50 kg/ha (15%).
Table 4. Amount & timing of urea application.
Application period of Urea fertilizer Amount applied (kg/ha) Percentage of farmers (%)
One week after planting 0 69,4
50 14,0
100 14,7
200 1,4
400 0,4
Seven weeks after planting 0 27,0
25 0,4
50 1,8
100 16,5
150 11,5
200 39,6
300 1,4
400 1,1
500 0,7
Ten weeks after planting 0 71,9
25 0,7
50 15,5
100 6,1
150 1,4
200 0,7
300 0,4
500 1,8
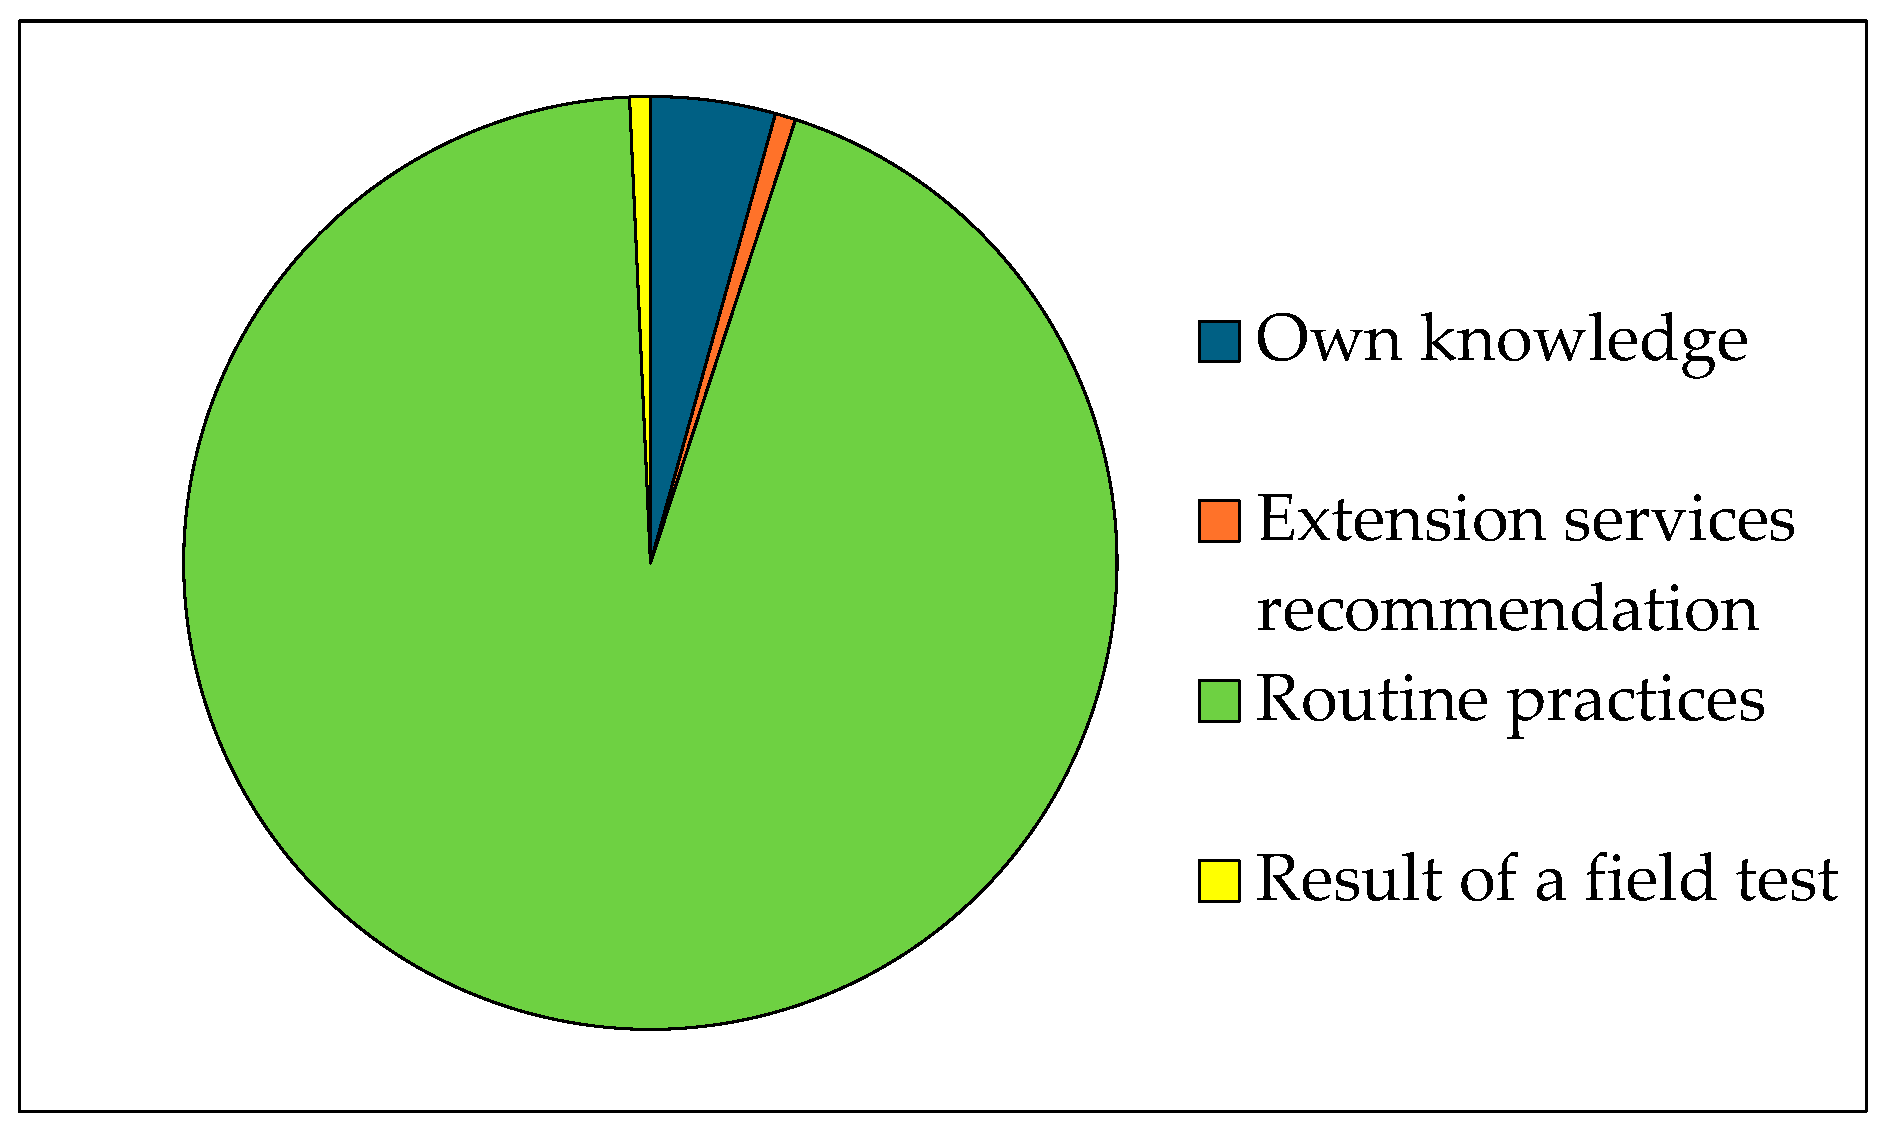
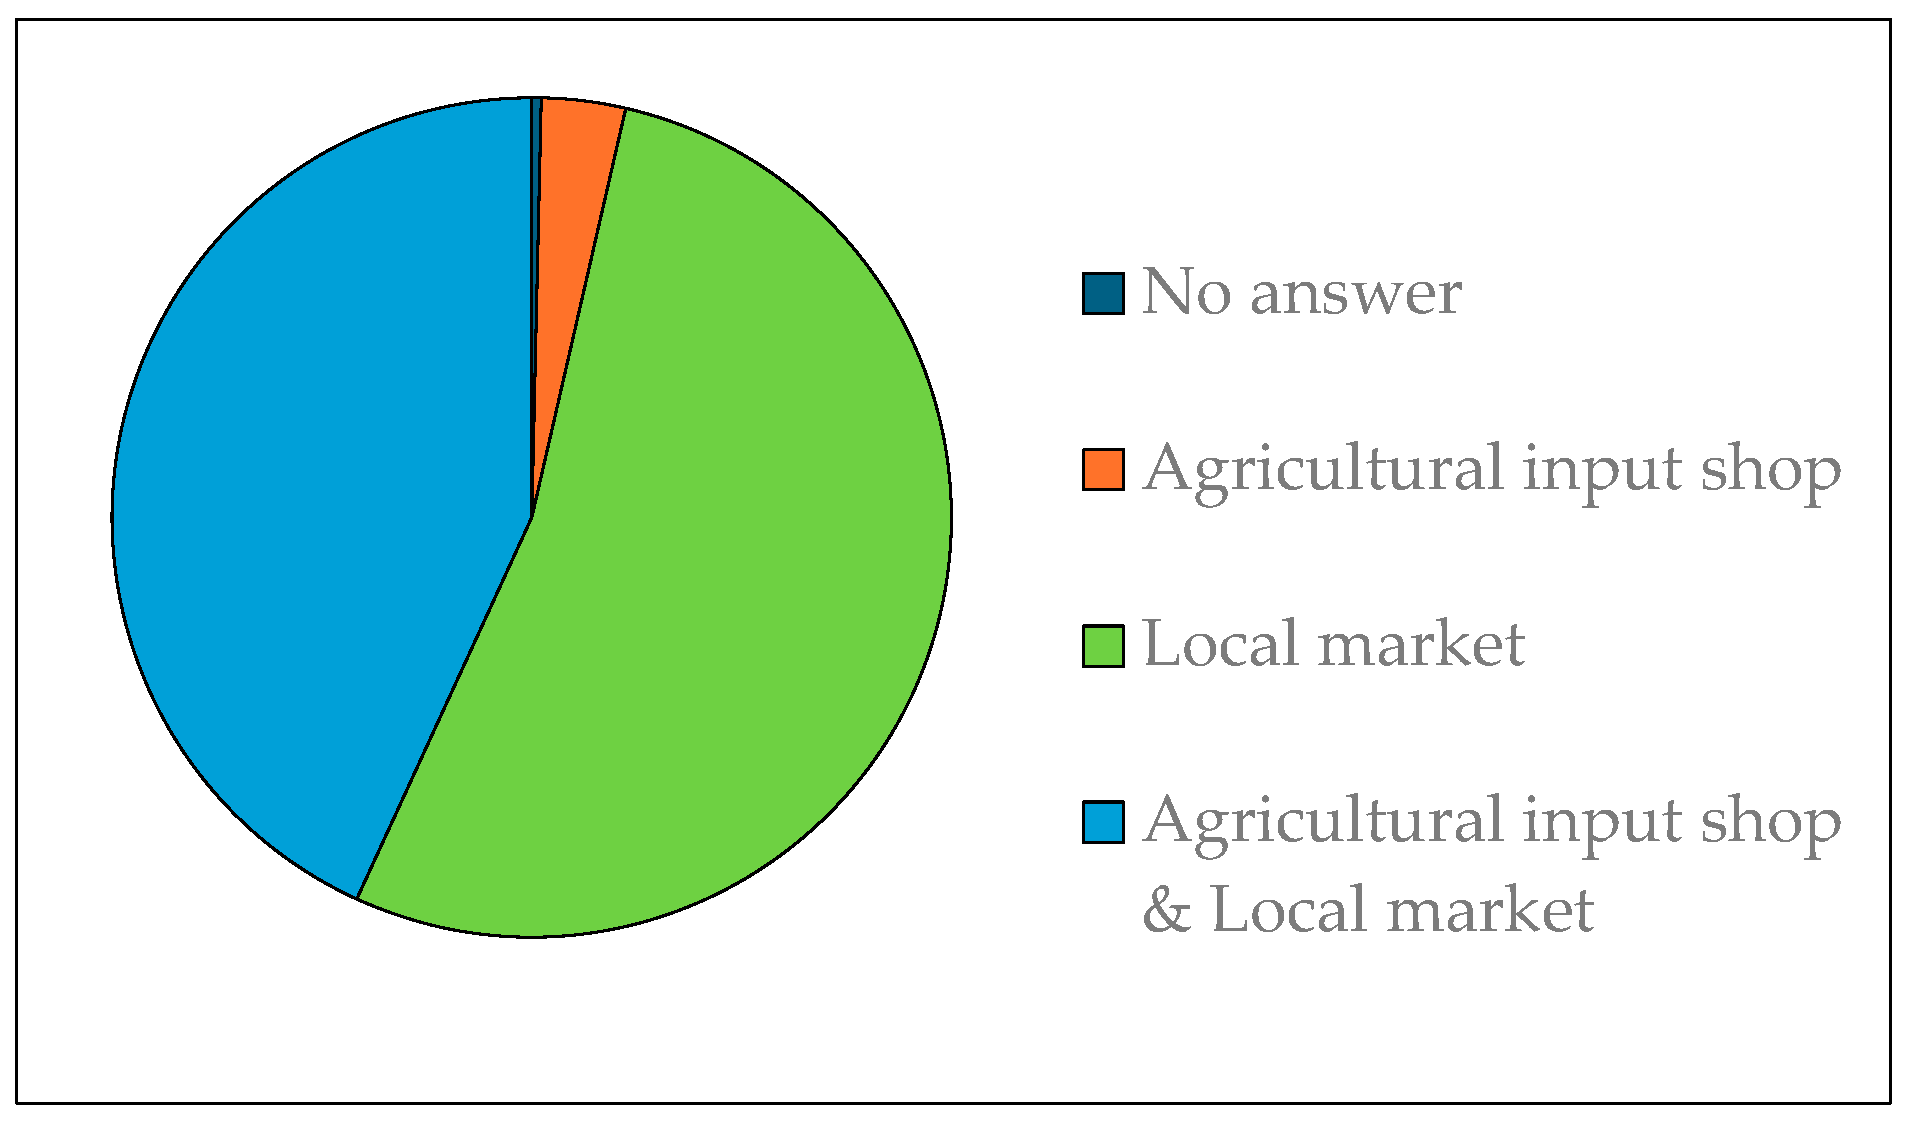
Fertilizer doses applied under rice were based on different sources, mainly routine practices (94.2%) and own knowledge (4.3%) (Figure 11). The recommendations of agricultural extension services had a considerable impact on the choice of fertilizer doses. Herbicides were used by 98.6% of rice growers to control weeds (Figure 12). Nonetheless, some combined this chemical method with manual or mechanical methods. These chemical herbicides were purchased from local markets (53.2%), generally unauthorized products, and from agricultural input stores (43.2%) (Figure 13).

3.3. Irrigation Practices

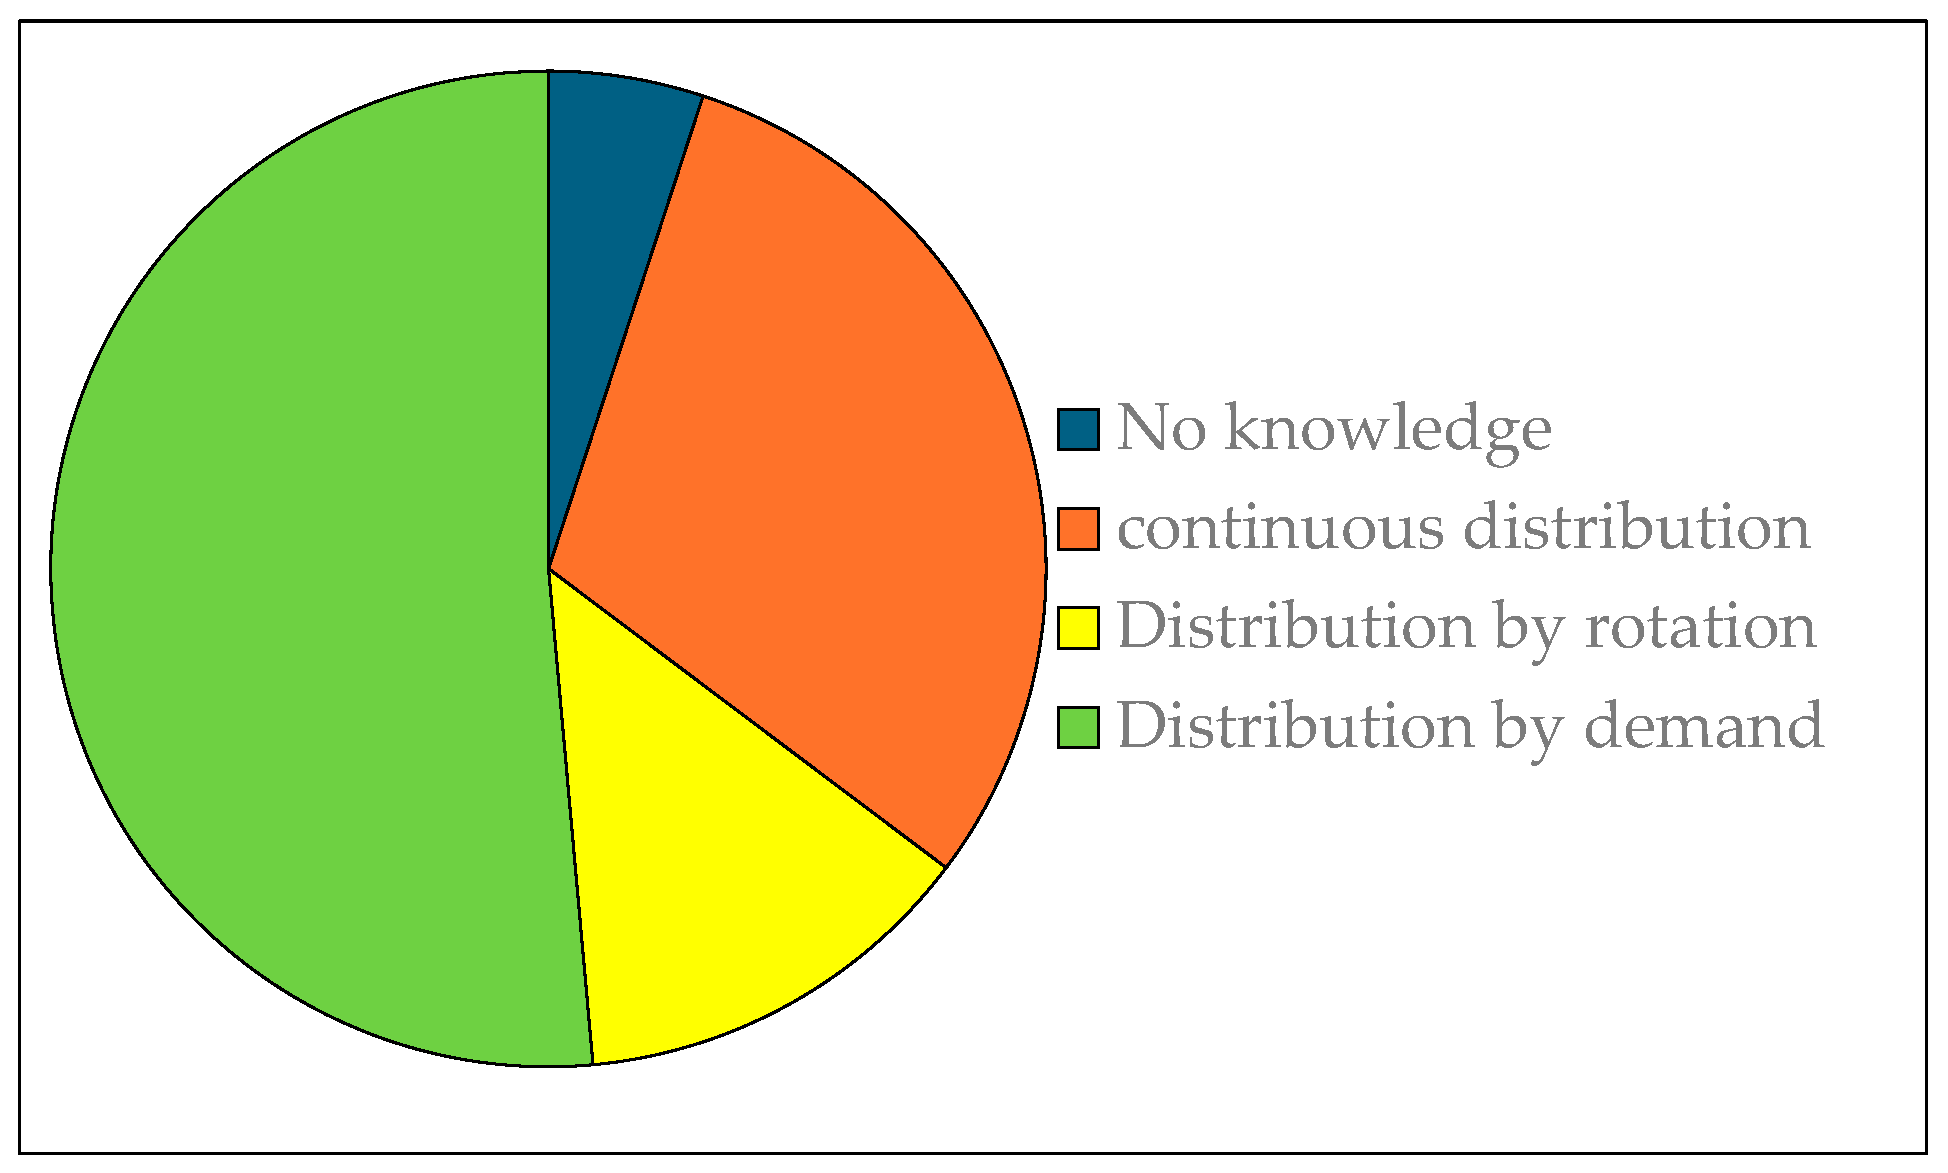
Only 6.1% of rice growers have received training in rice irrigation, 64.7% of whom have received training in irrigation and drainage techniques, and 35.3% of whom have received training in water management. According to the respondents, water is distributed on irrigated fields in three ways: on-demand distribution (51.4%), continuous distribution (30.2%) and rotational distribution (13.3%) (Figure 14). In any event, 100% of rice growers were unaware of the amount of irrigation water used for each application.
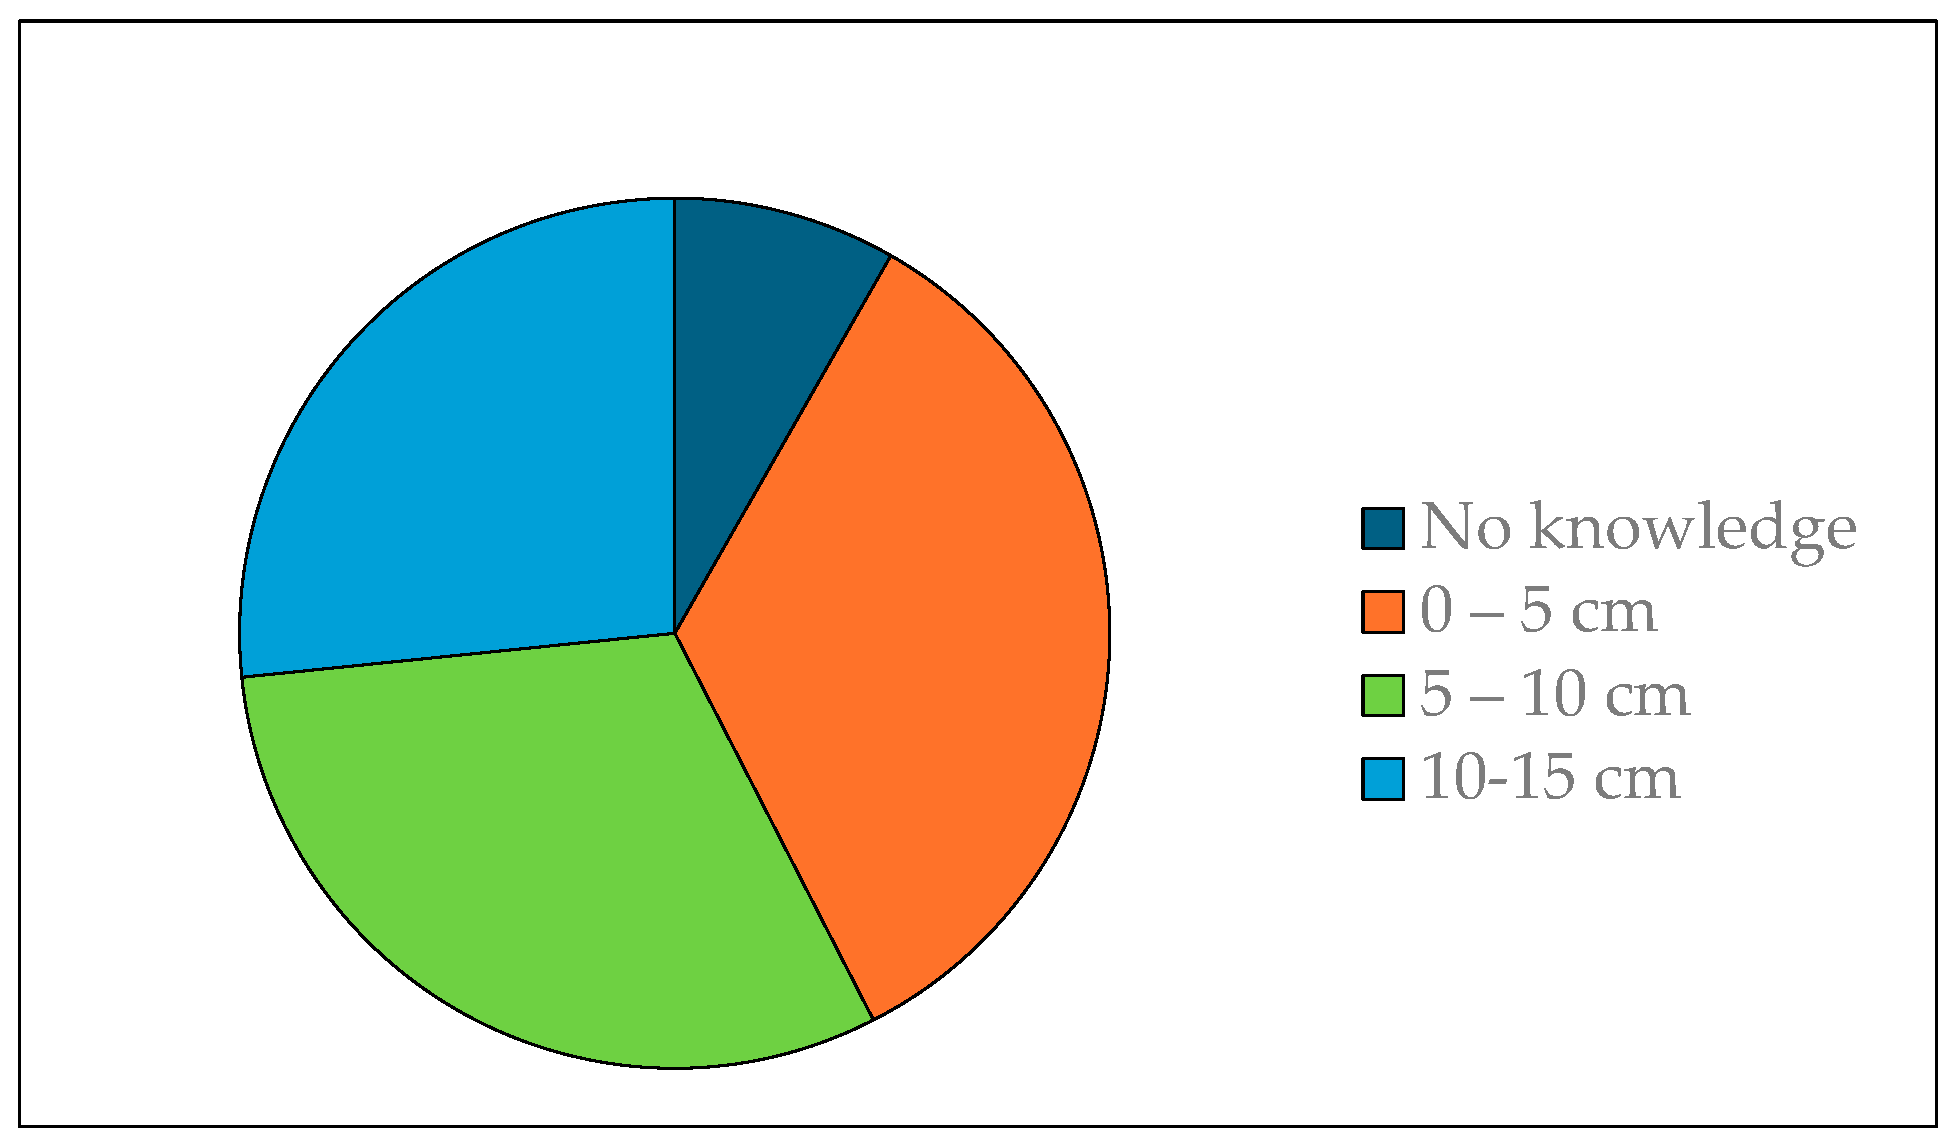
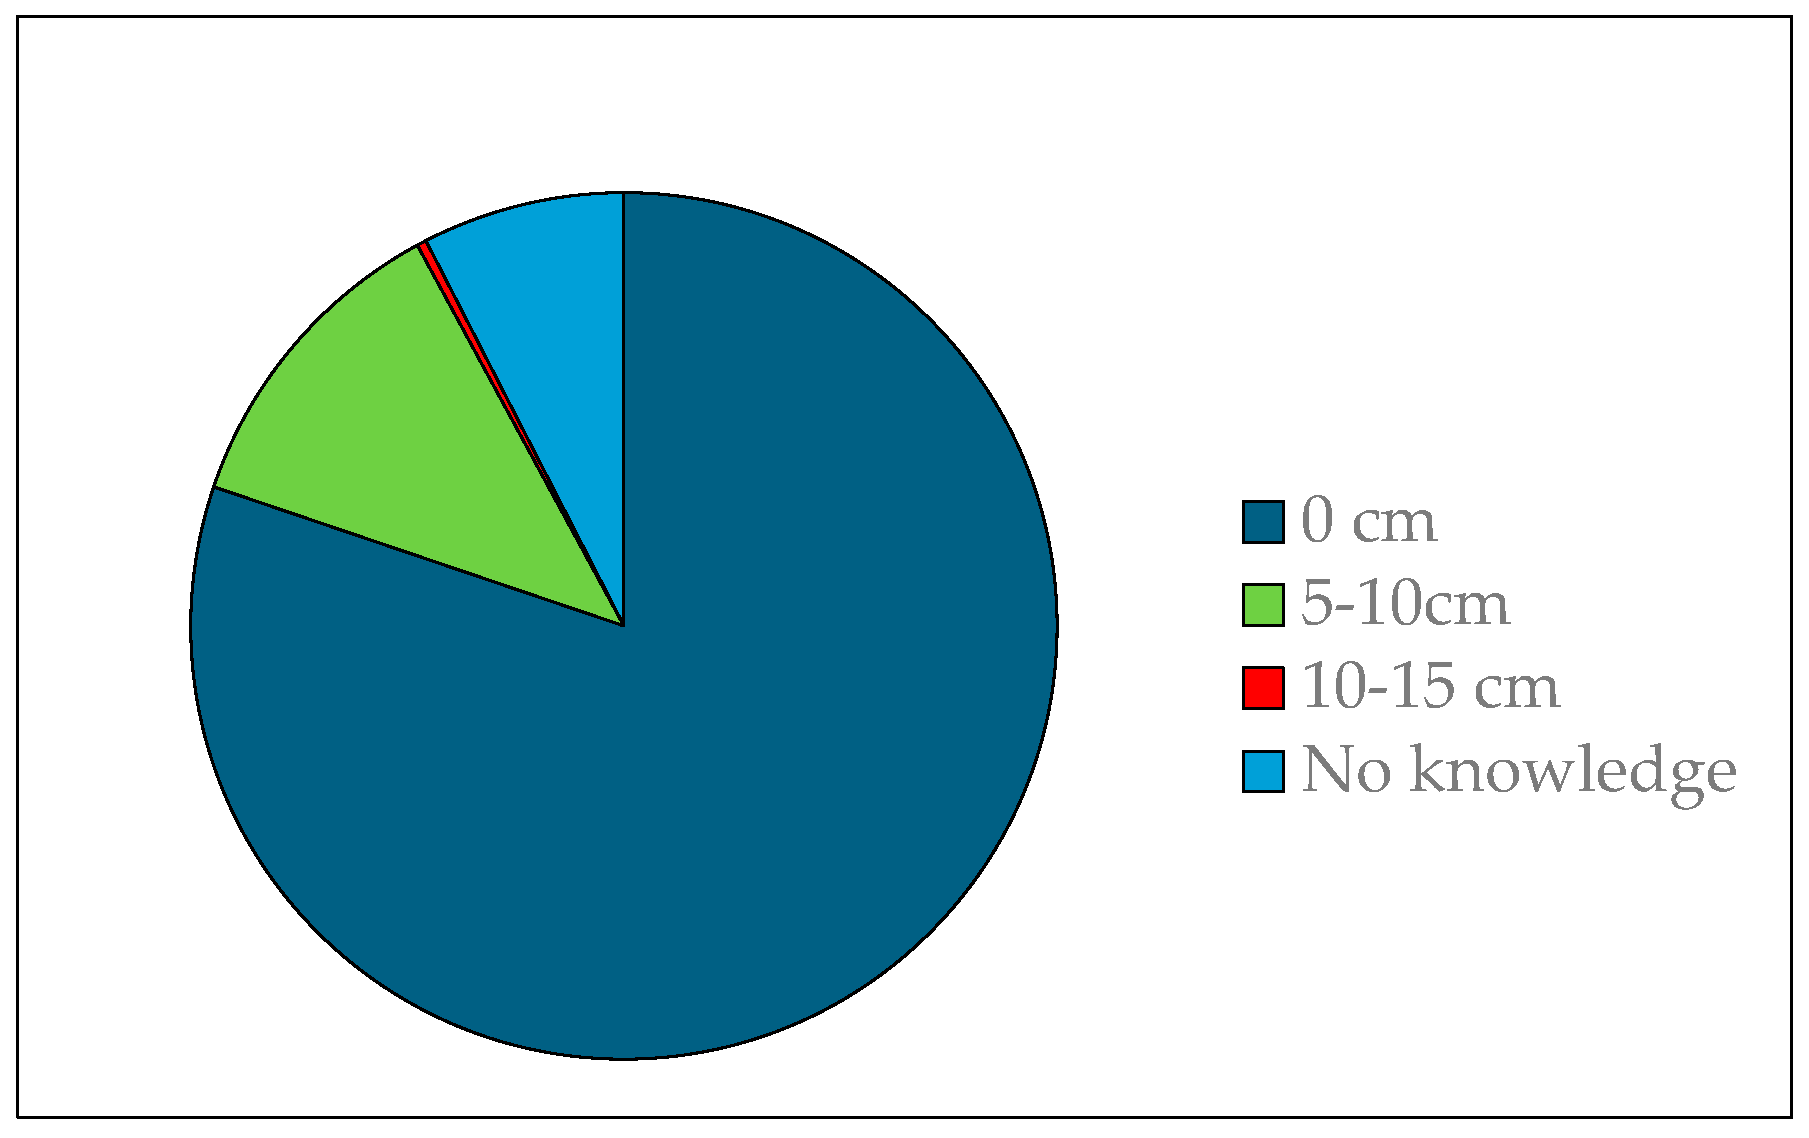
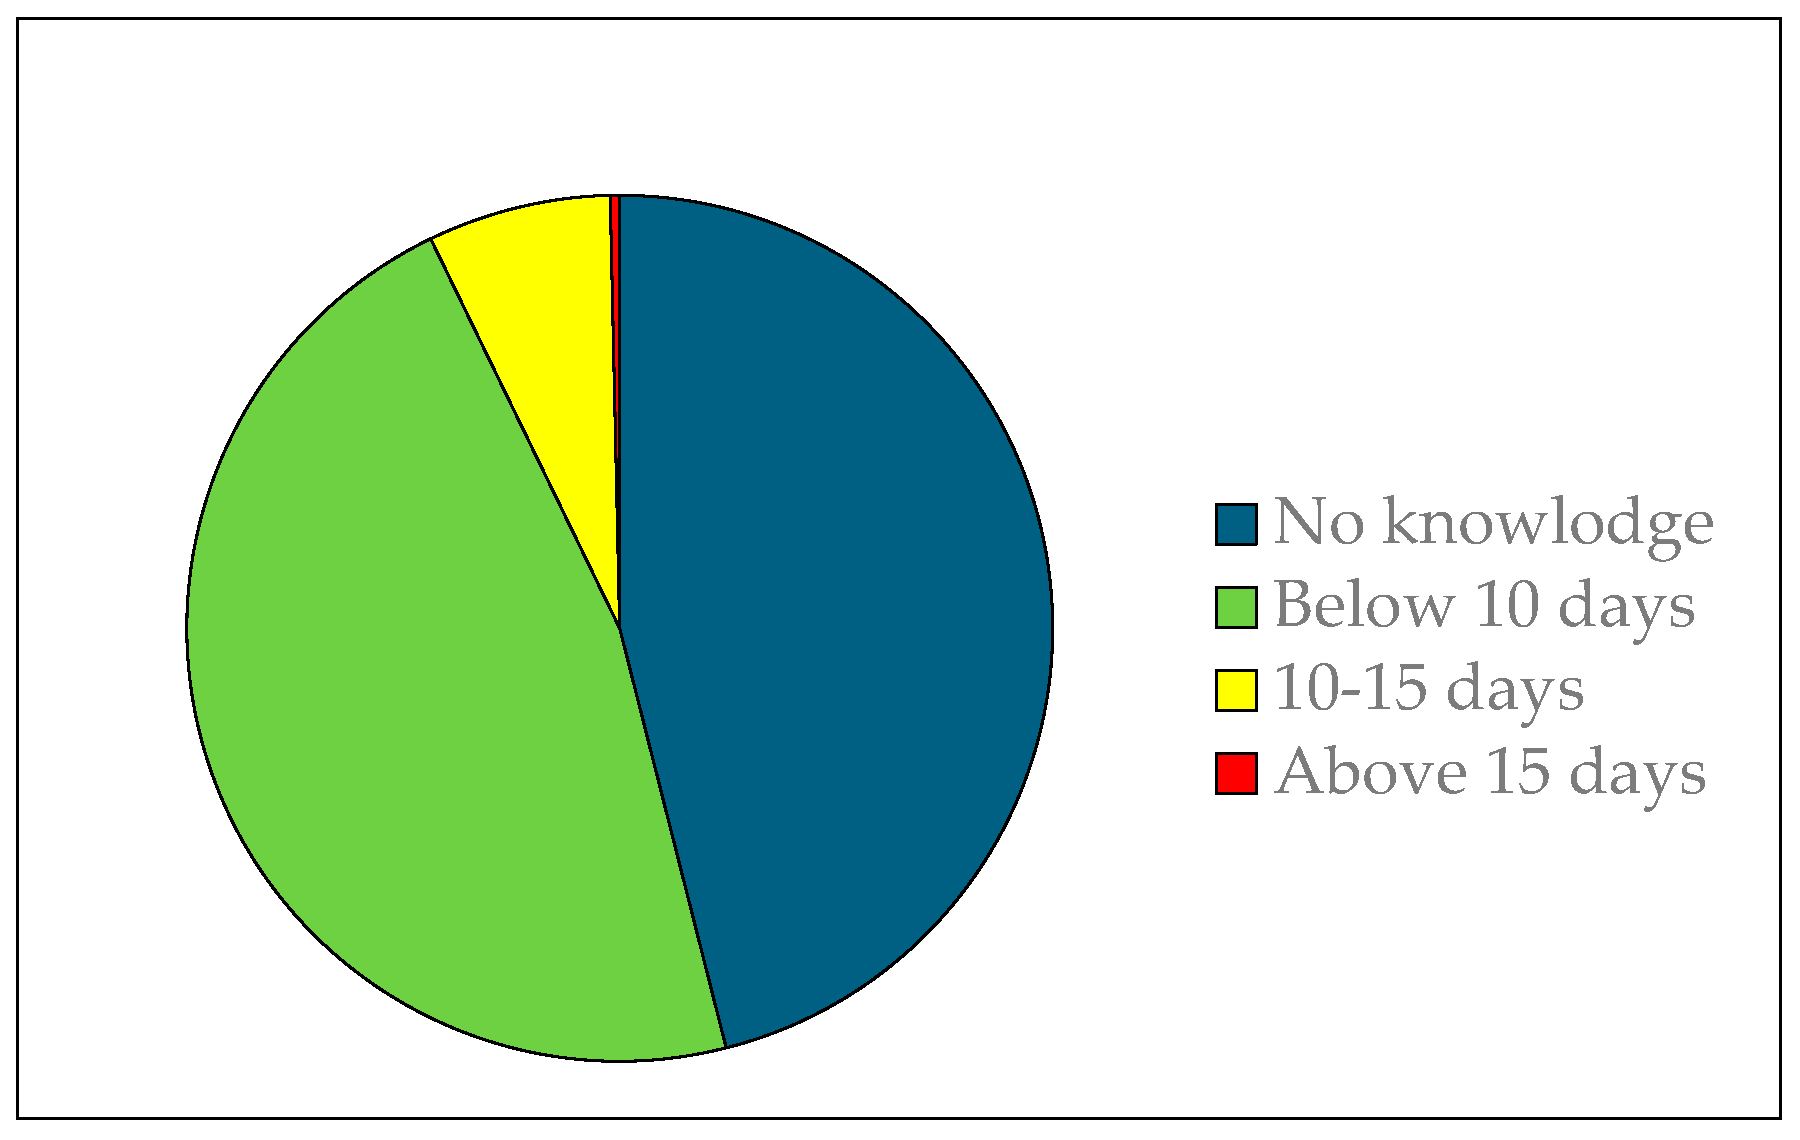
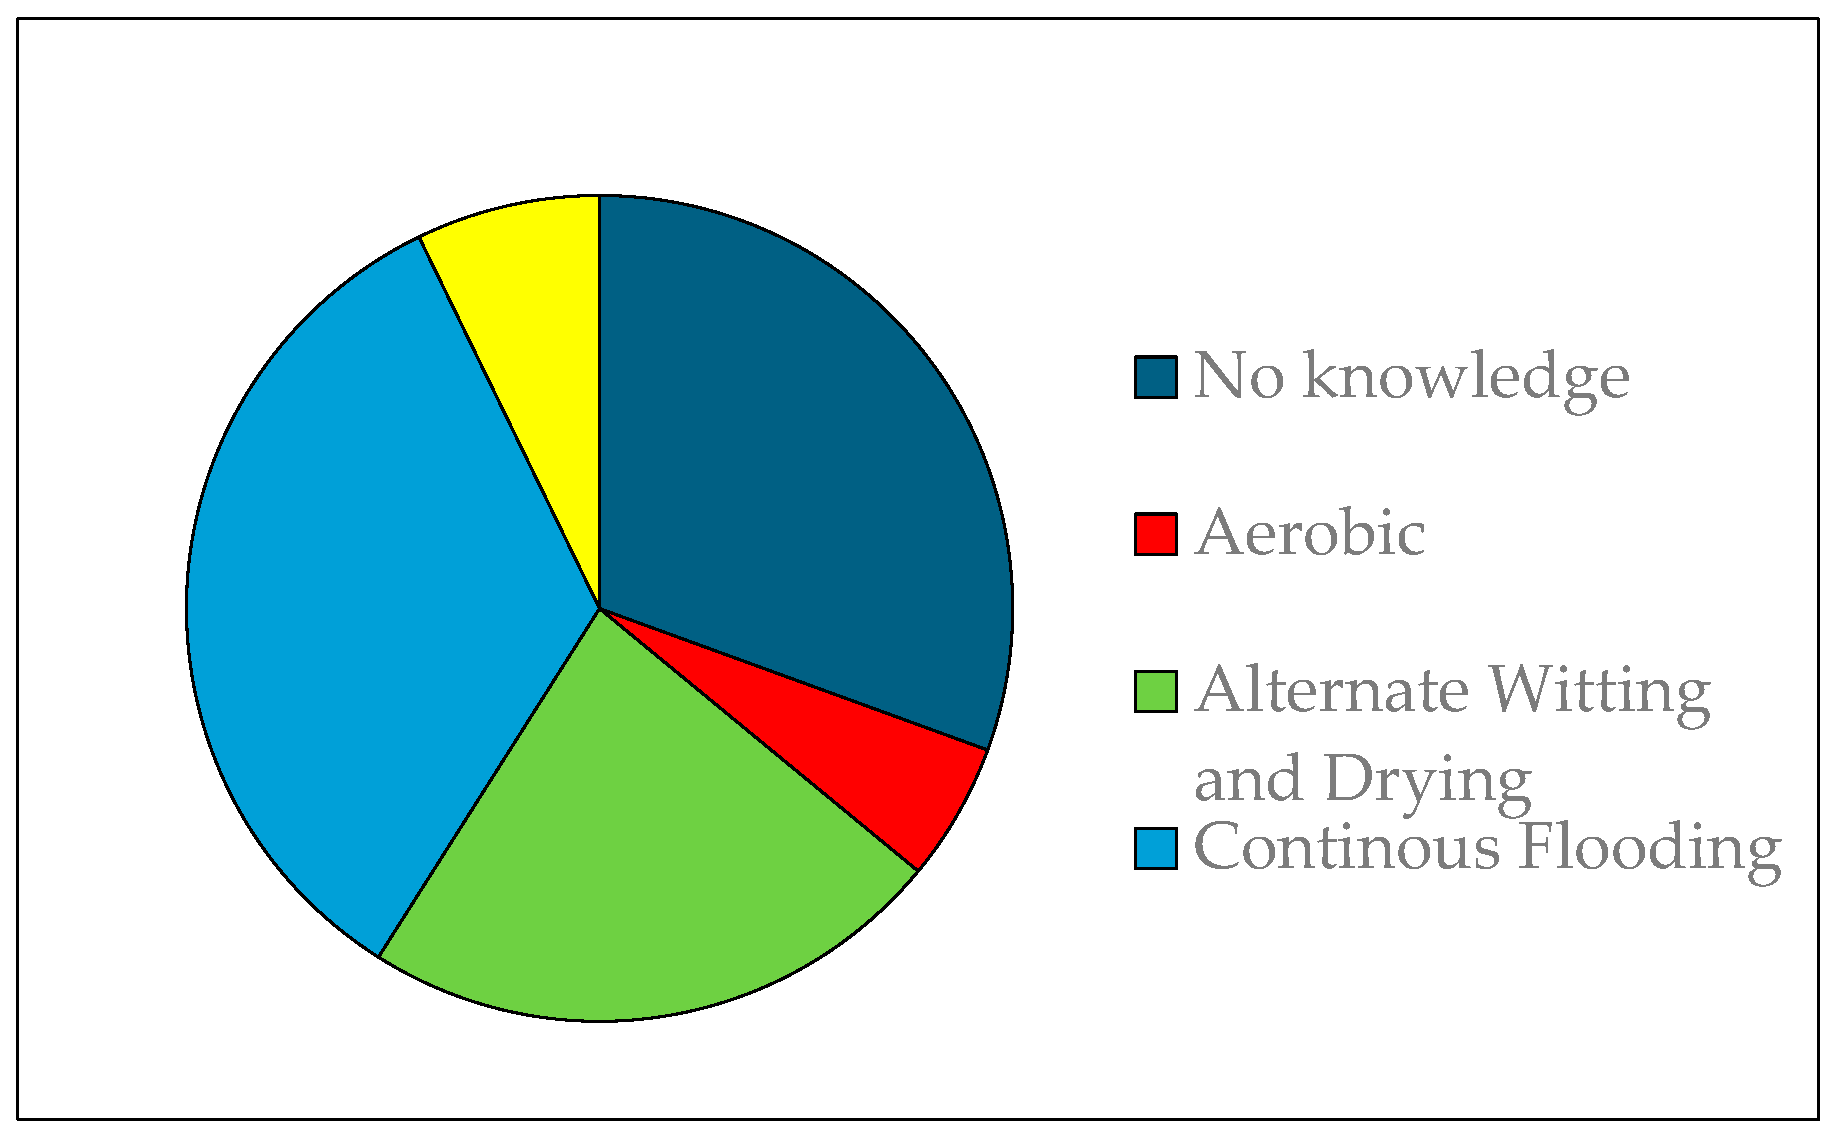
The water level above ground after irrigation varies from 0 to 15 cm, with over 57.5% opting for a water level between 5 and 15 cm (Figure 15) and 80.2% of rice growers irrigated when water depth was below the soil surface (Figure 16). Farmer training affected the choice of water level above ground after irrigation at the 5% threshold. Overall, 62% of trained rice growers adopted a water level between 5 and 15 cm, compared with less than 31% of untrained growers. However, around 54% of untrained rice growers versus 34% of trained growers preferred a blade of 0 cm above ground after irrigation. With regard to the dependence of grower experience on the water level above ground after irrigation, over 60% of growers with below 5 years of experience adopted between 5 -15 cm, while the oldest were in the order of 40%. Irrigation frequency on irrigated perimeters was ignored by 46.0% of farmers, and for 46.8% of respondents, irrigation frequency was below 10 days (Figure 17). Over 30.6% of respondents were unaware of the water-saving technology used, with 33.8% adopting continuous flood irrigation and 23.0% practicing AWD (Figure 18).
Regarding water distribution at plot level, 52.2% believed that water distribution was fair, versus 40% who didn't, and 8% who didn't know whether water was available for everyone. Moreover, 60.8% of growers acknowledged that the irrigation schedule was regularly respected, as opposed to 39.2% who didn't think so. According to 58% of growers, there were conflicts over irrigation water on irrigated perimeters, compared with 42% of rice growers. Access to the irrigation extension was available to only 5.4% of growers, compared with 94.6% who had no such access.

3.4. Famers’ Perception on Water and Agronomic Management

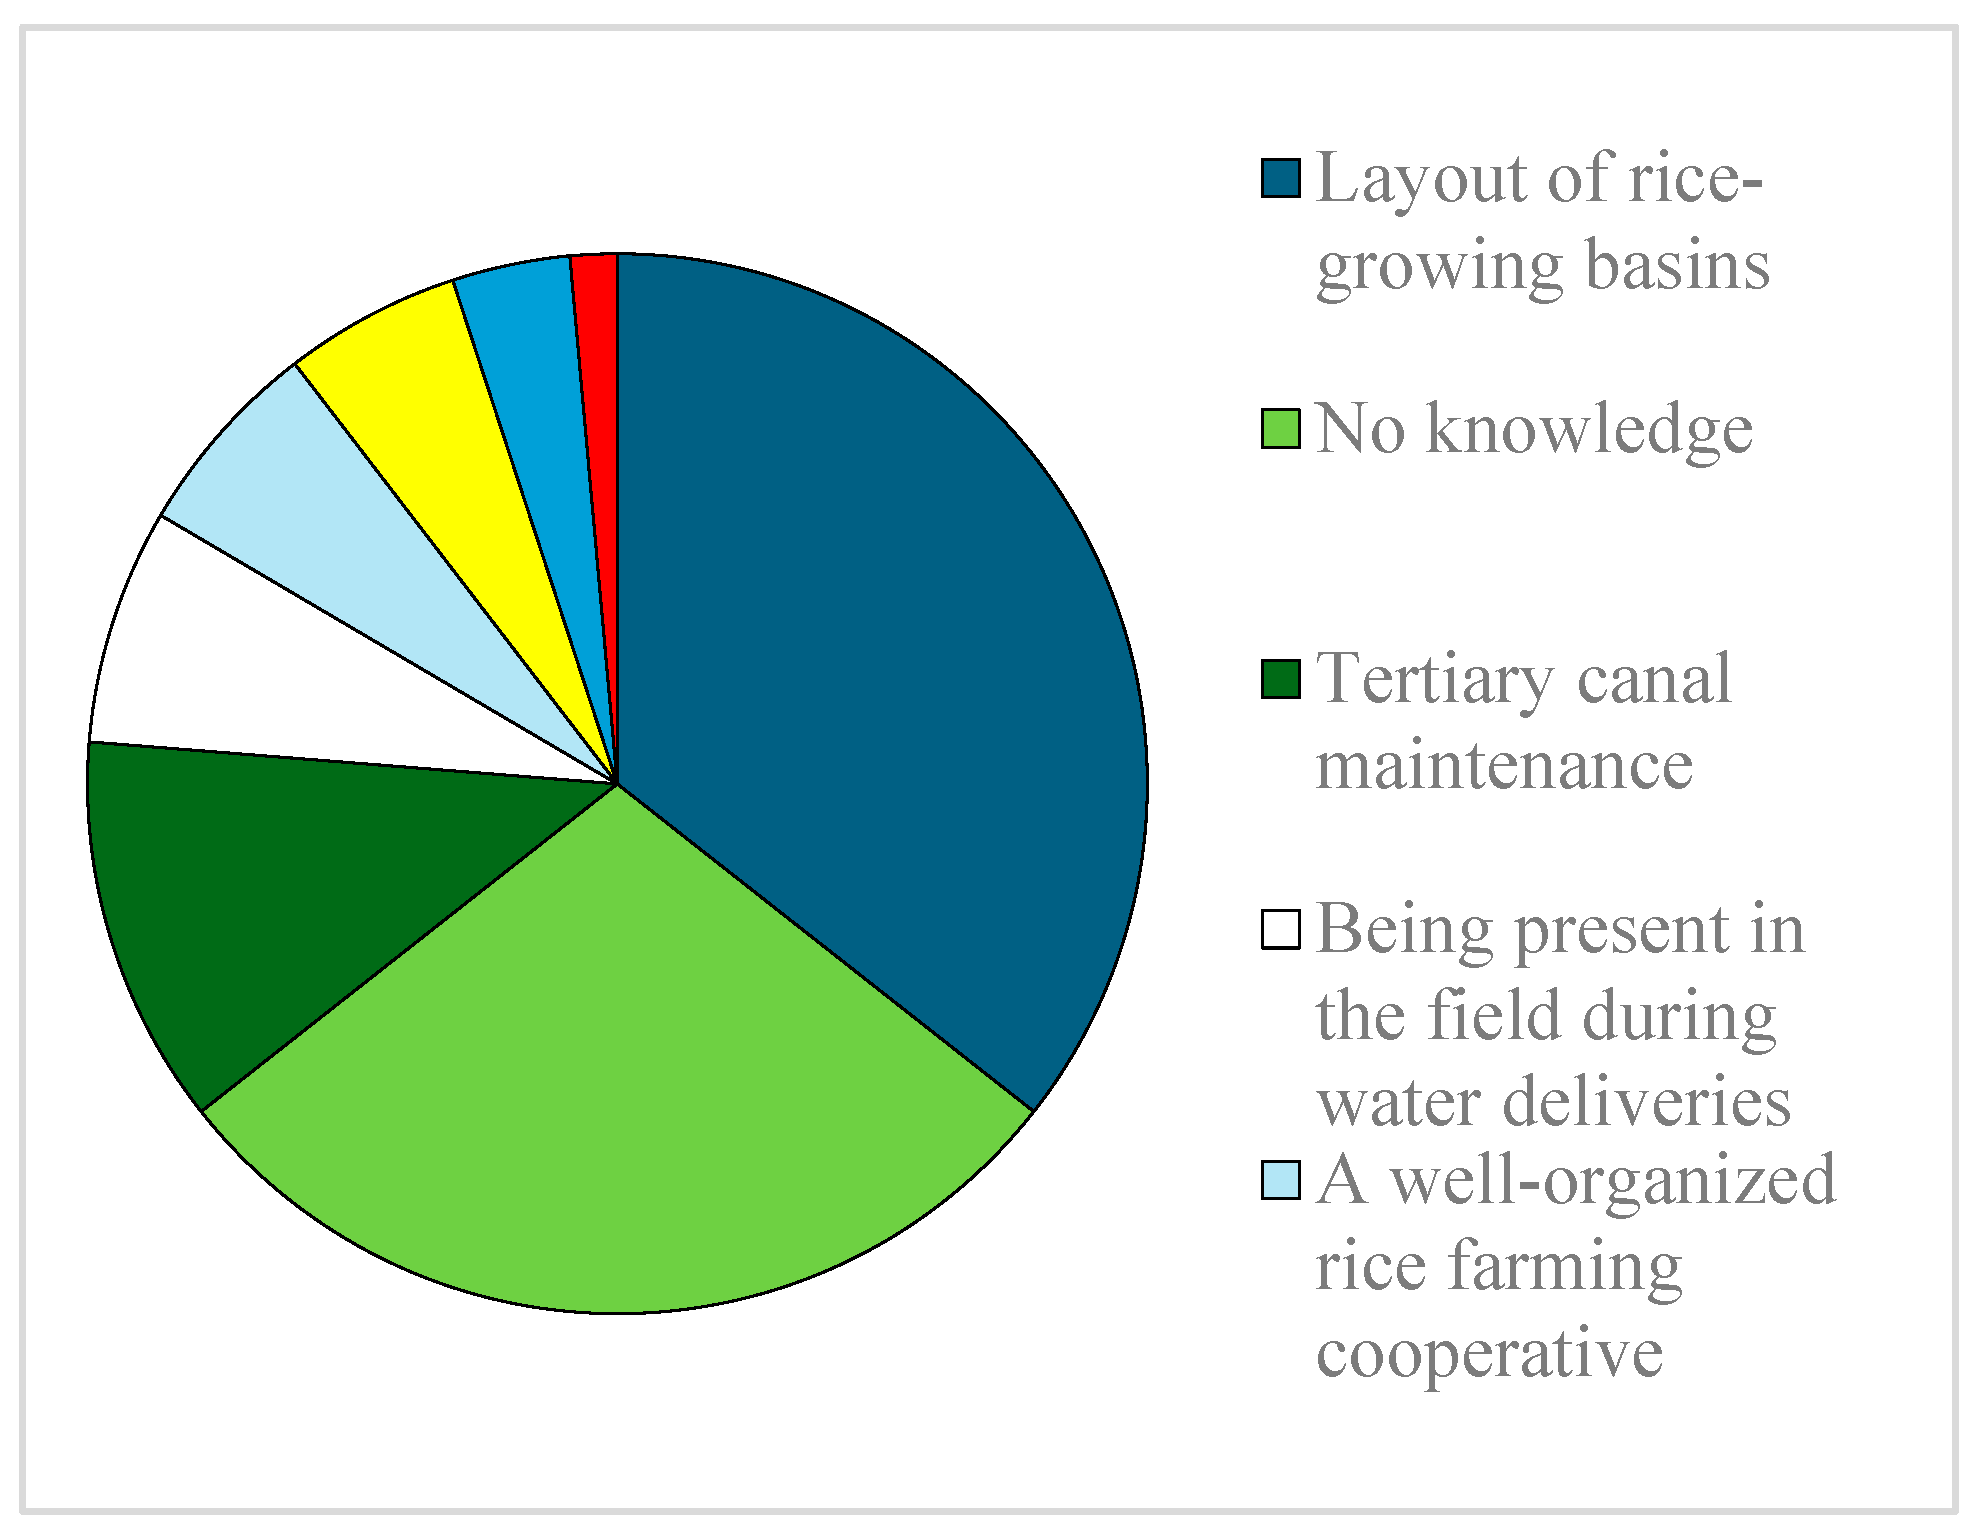
Almost all (98.2% vs. 1.8%) of the rice farmers surveyed had no knowledge of water productivity, and only fewer than 1.1% vs. 98.9% felt that water productivity could be improved through timely water delivery. Over 63.3% had no knowledge of water-use-efficiency and around 36.7% thought that water delivery as required improved water-use efficiency. Farmers' perception of water-saving methods for rice irrigation was variable (Figure 19). An estimated 29% had no knowledge of irrigation water-saving methods. According to some, irrigation water saving methods were layout of rice-growing basins (36%), maintenance of tertiary canals (12%), being present in the field during water deliveries (7%), dam bulding (4%). Nevertheless, few growers thought that the methods for saving irrigation water were water delivery as required (5%) and good production scheduling (1%). Statistical analysis revealed that, at the 5% confidence level, training had improved farmers' knowledge of irrigation water saving. For example, of untrained farmers, 42% had no knowledge of water saving in irrigated rice production, compared with 28% of trained farmers. In addition, the grower's experience helped improve his knowledge of water-saving strategies in irrigated rice production to the 5% level. However, after more than 15 years' experience, 65% of growers were no longer applying water-saving methods.
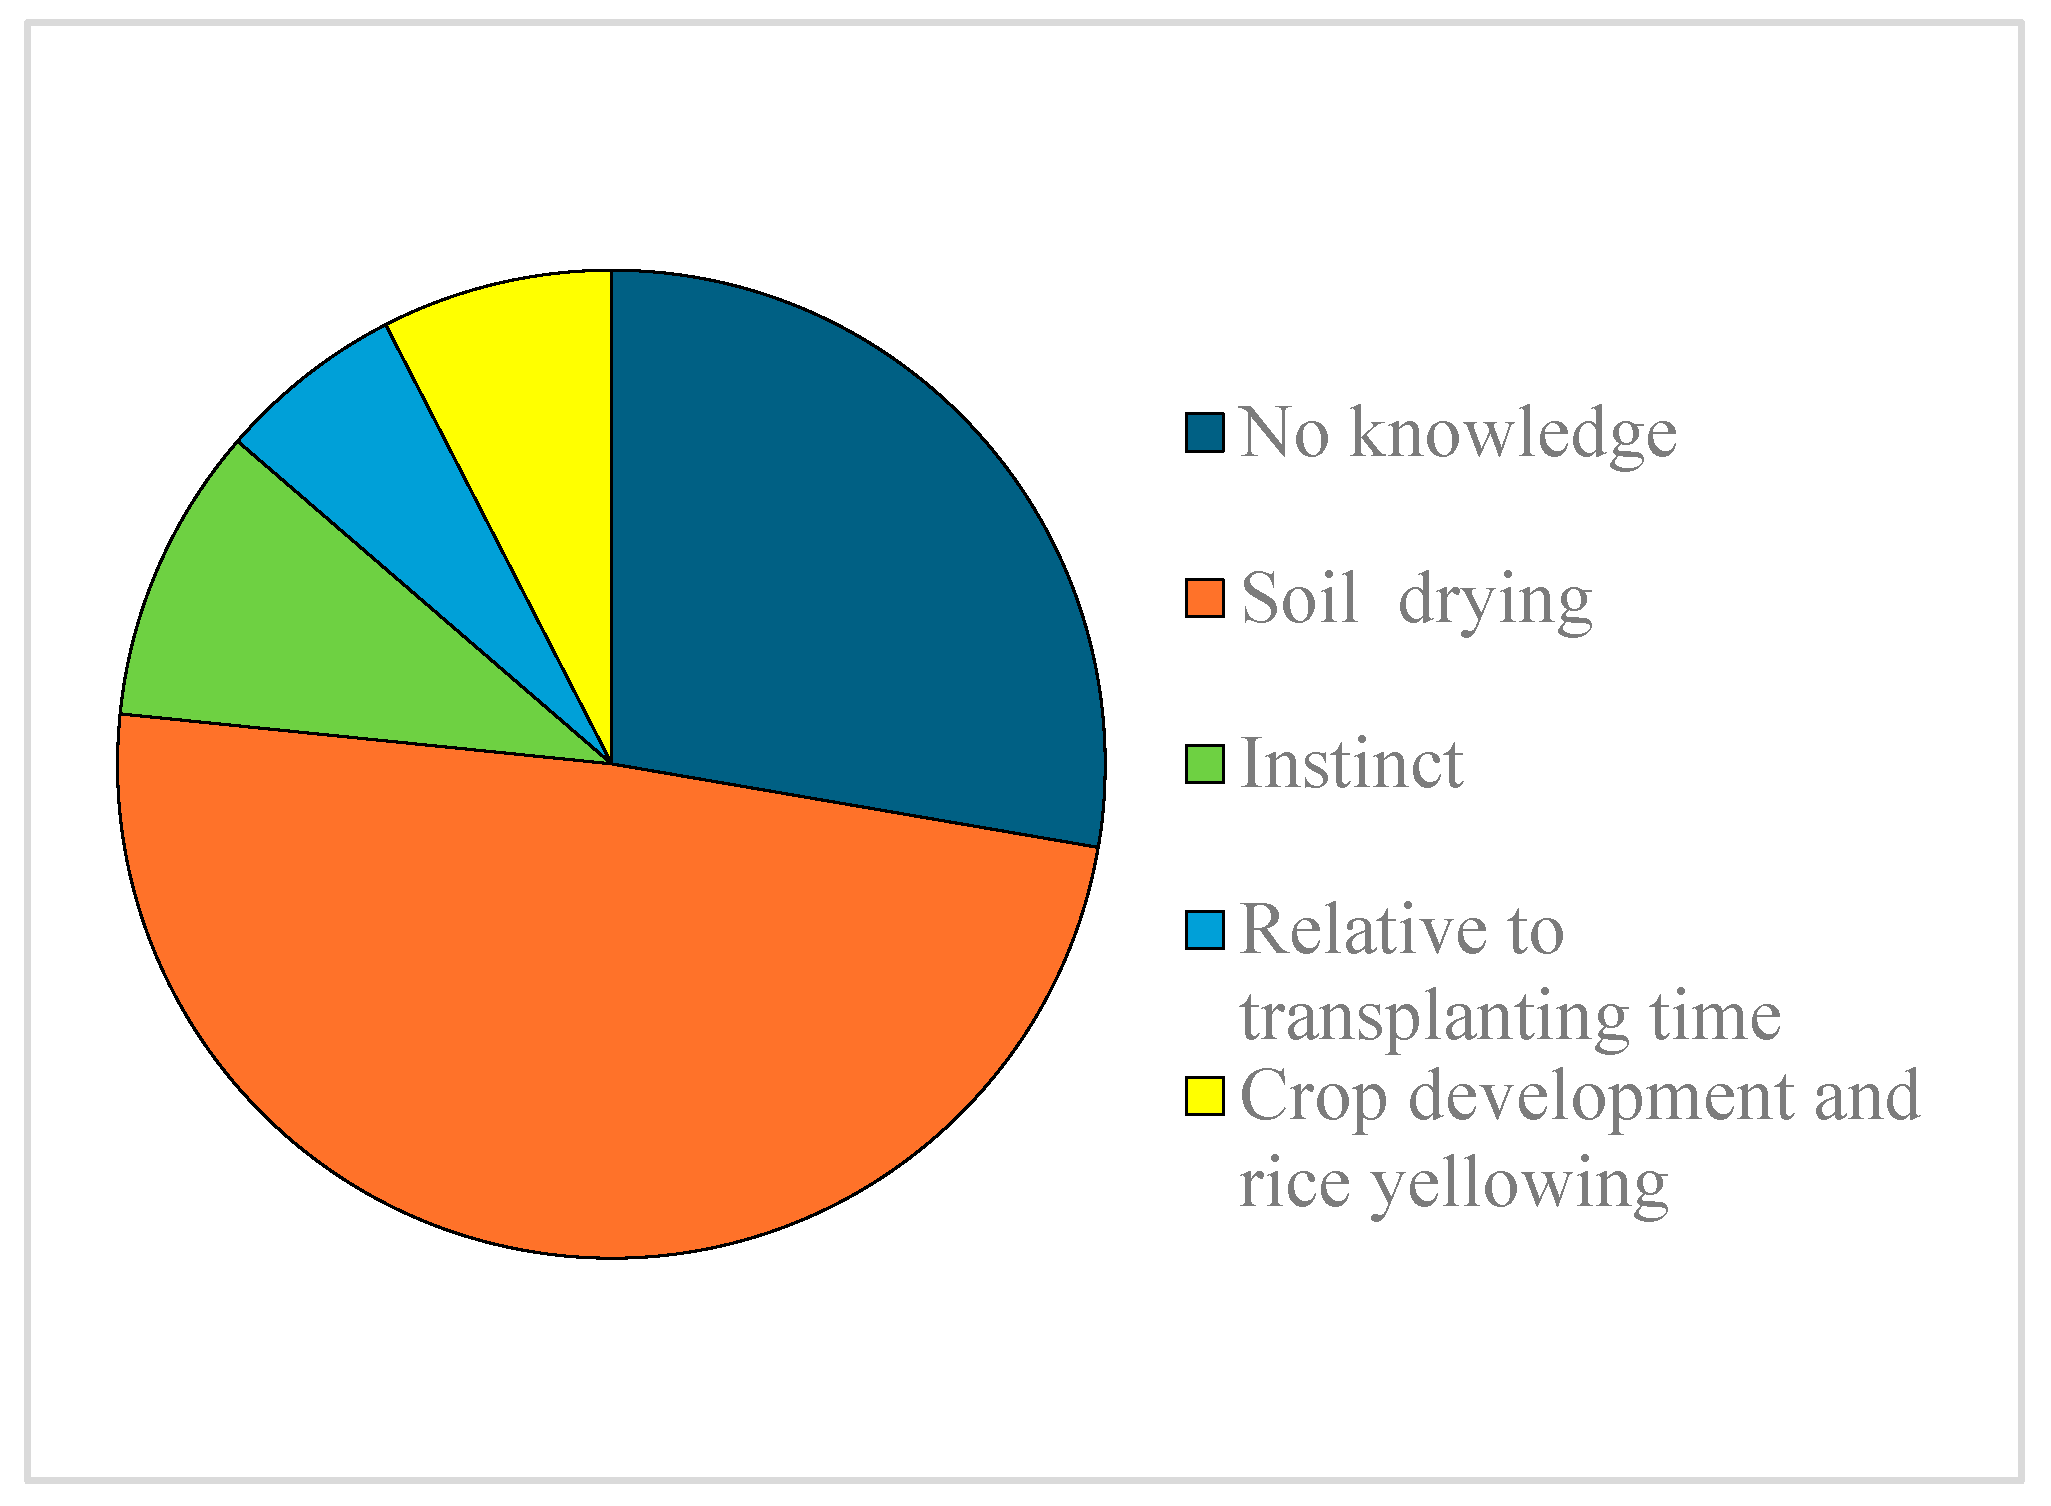
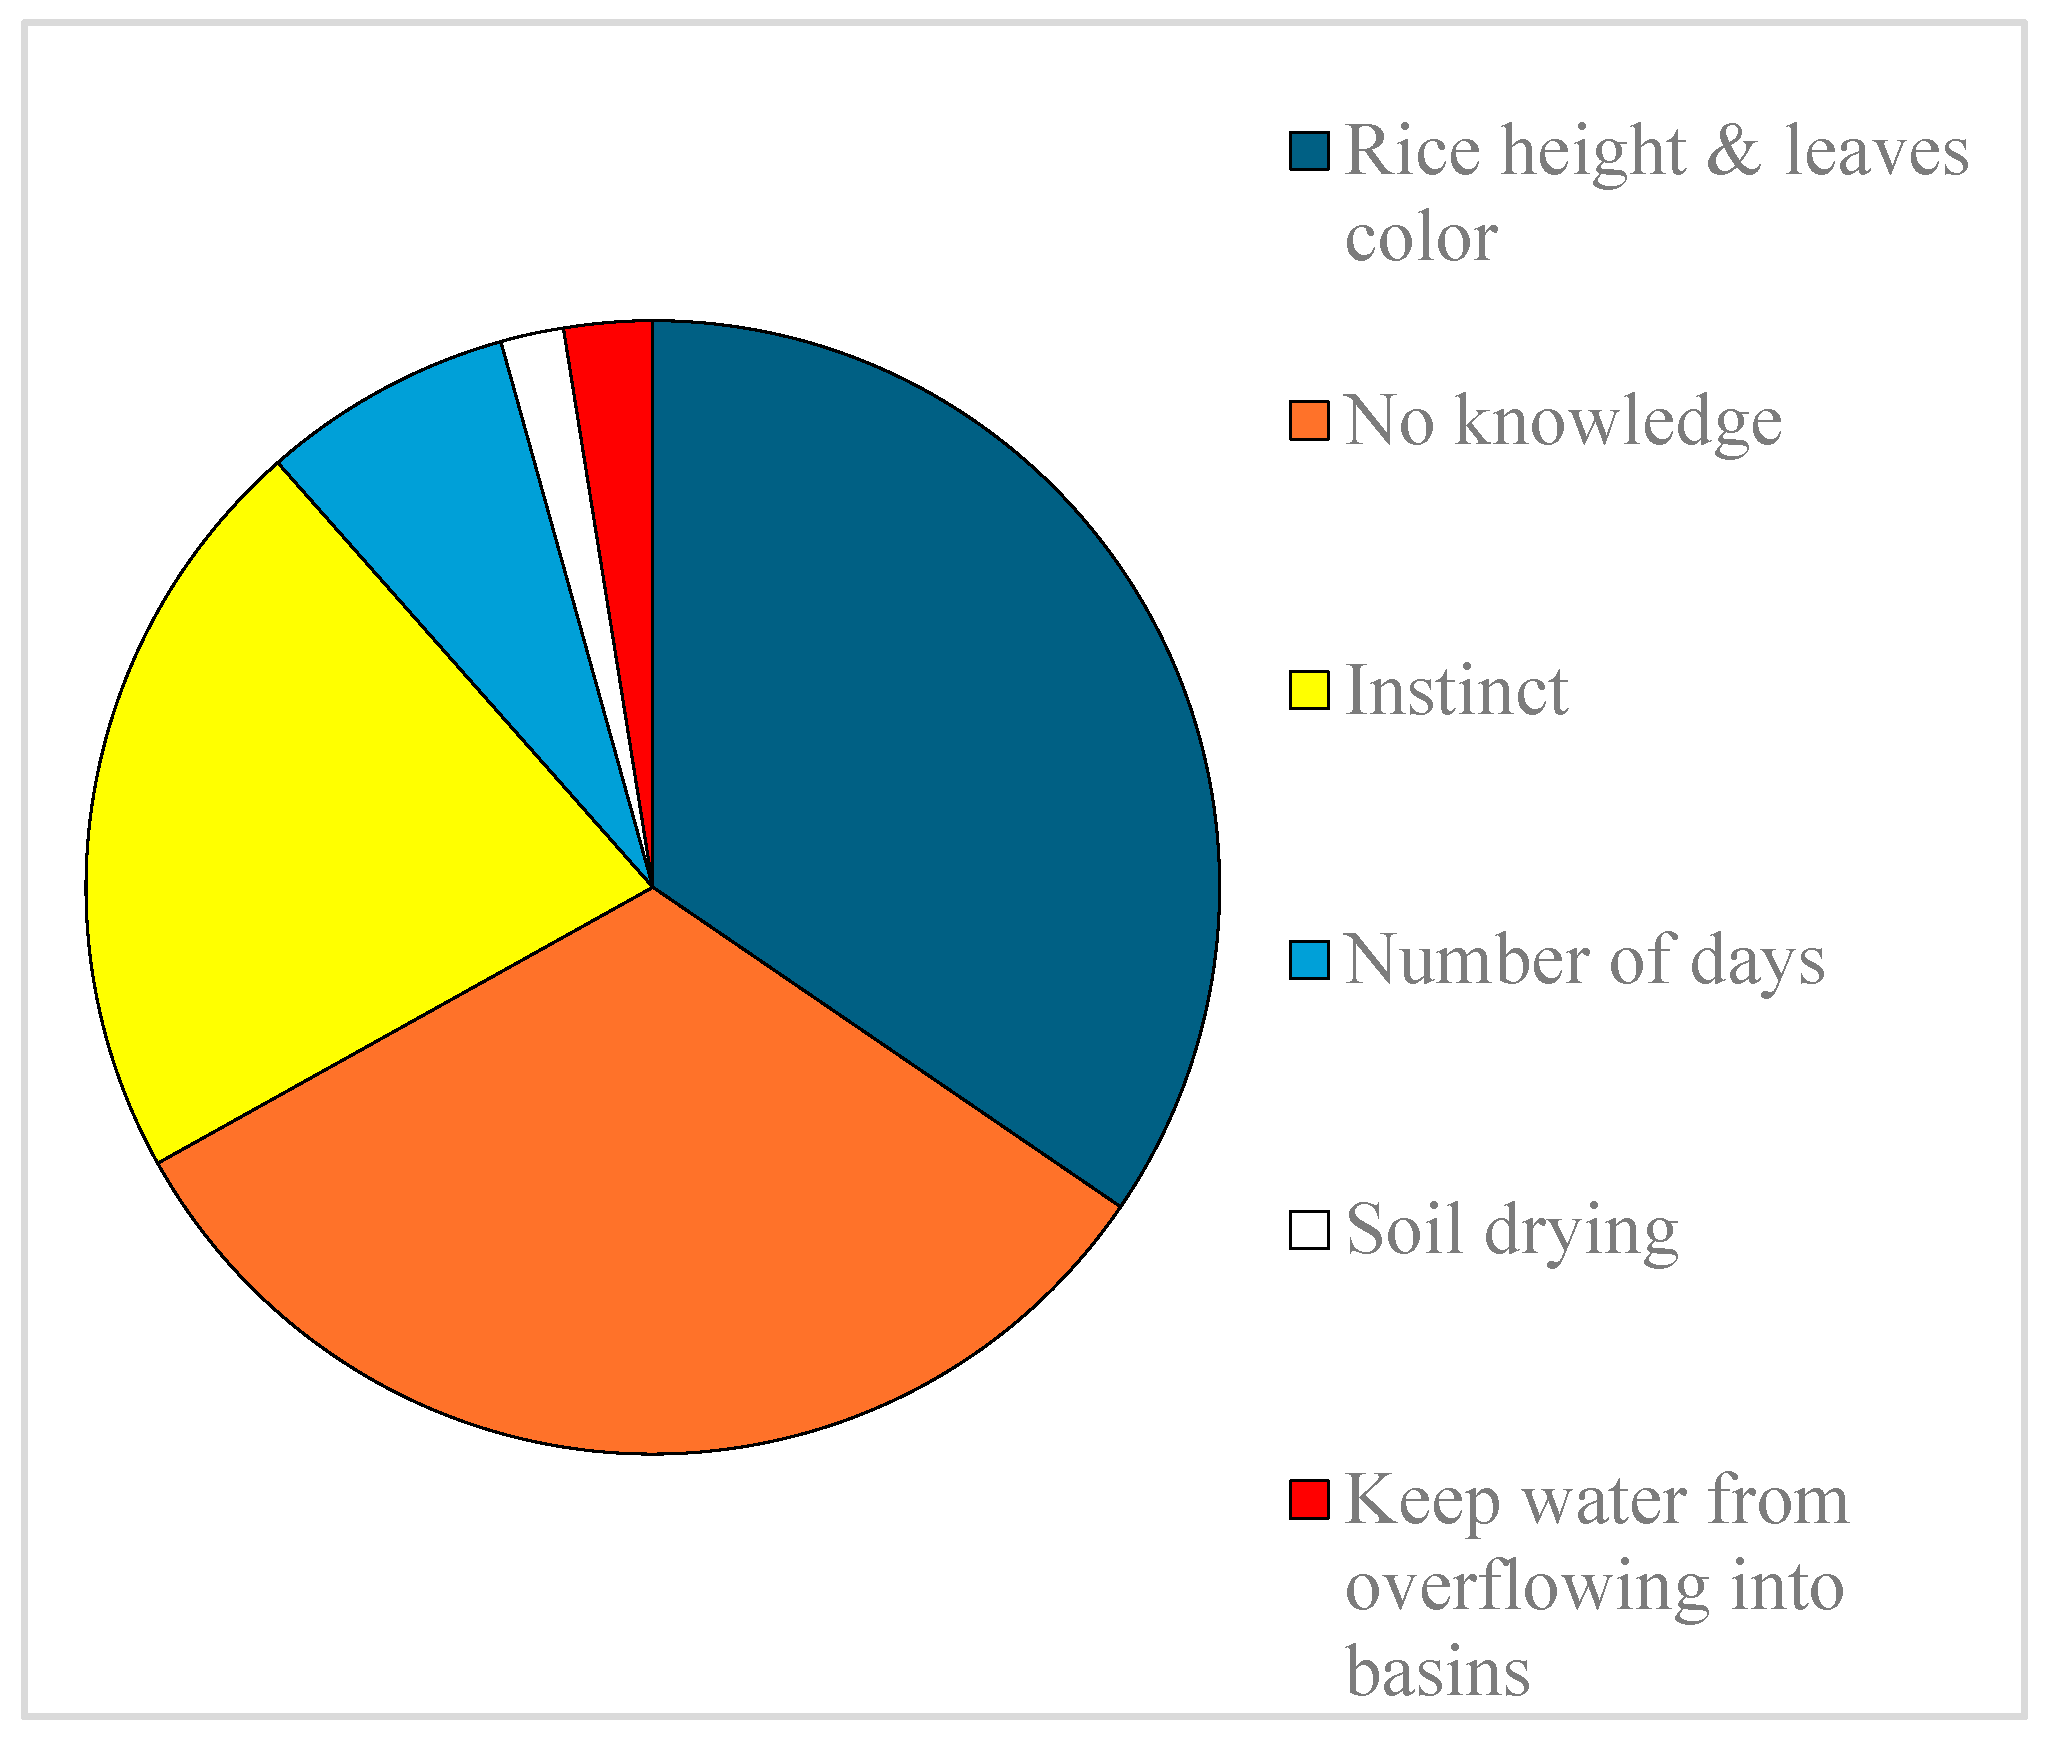
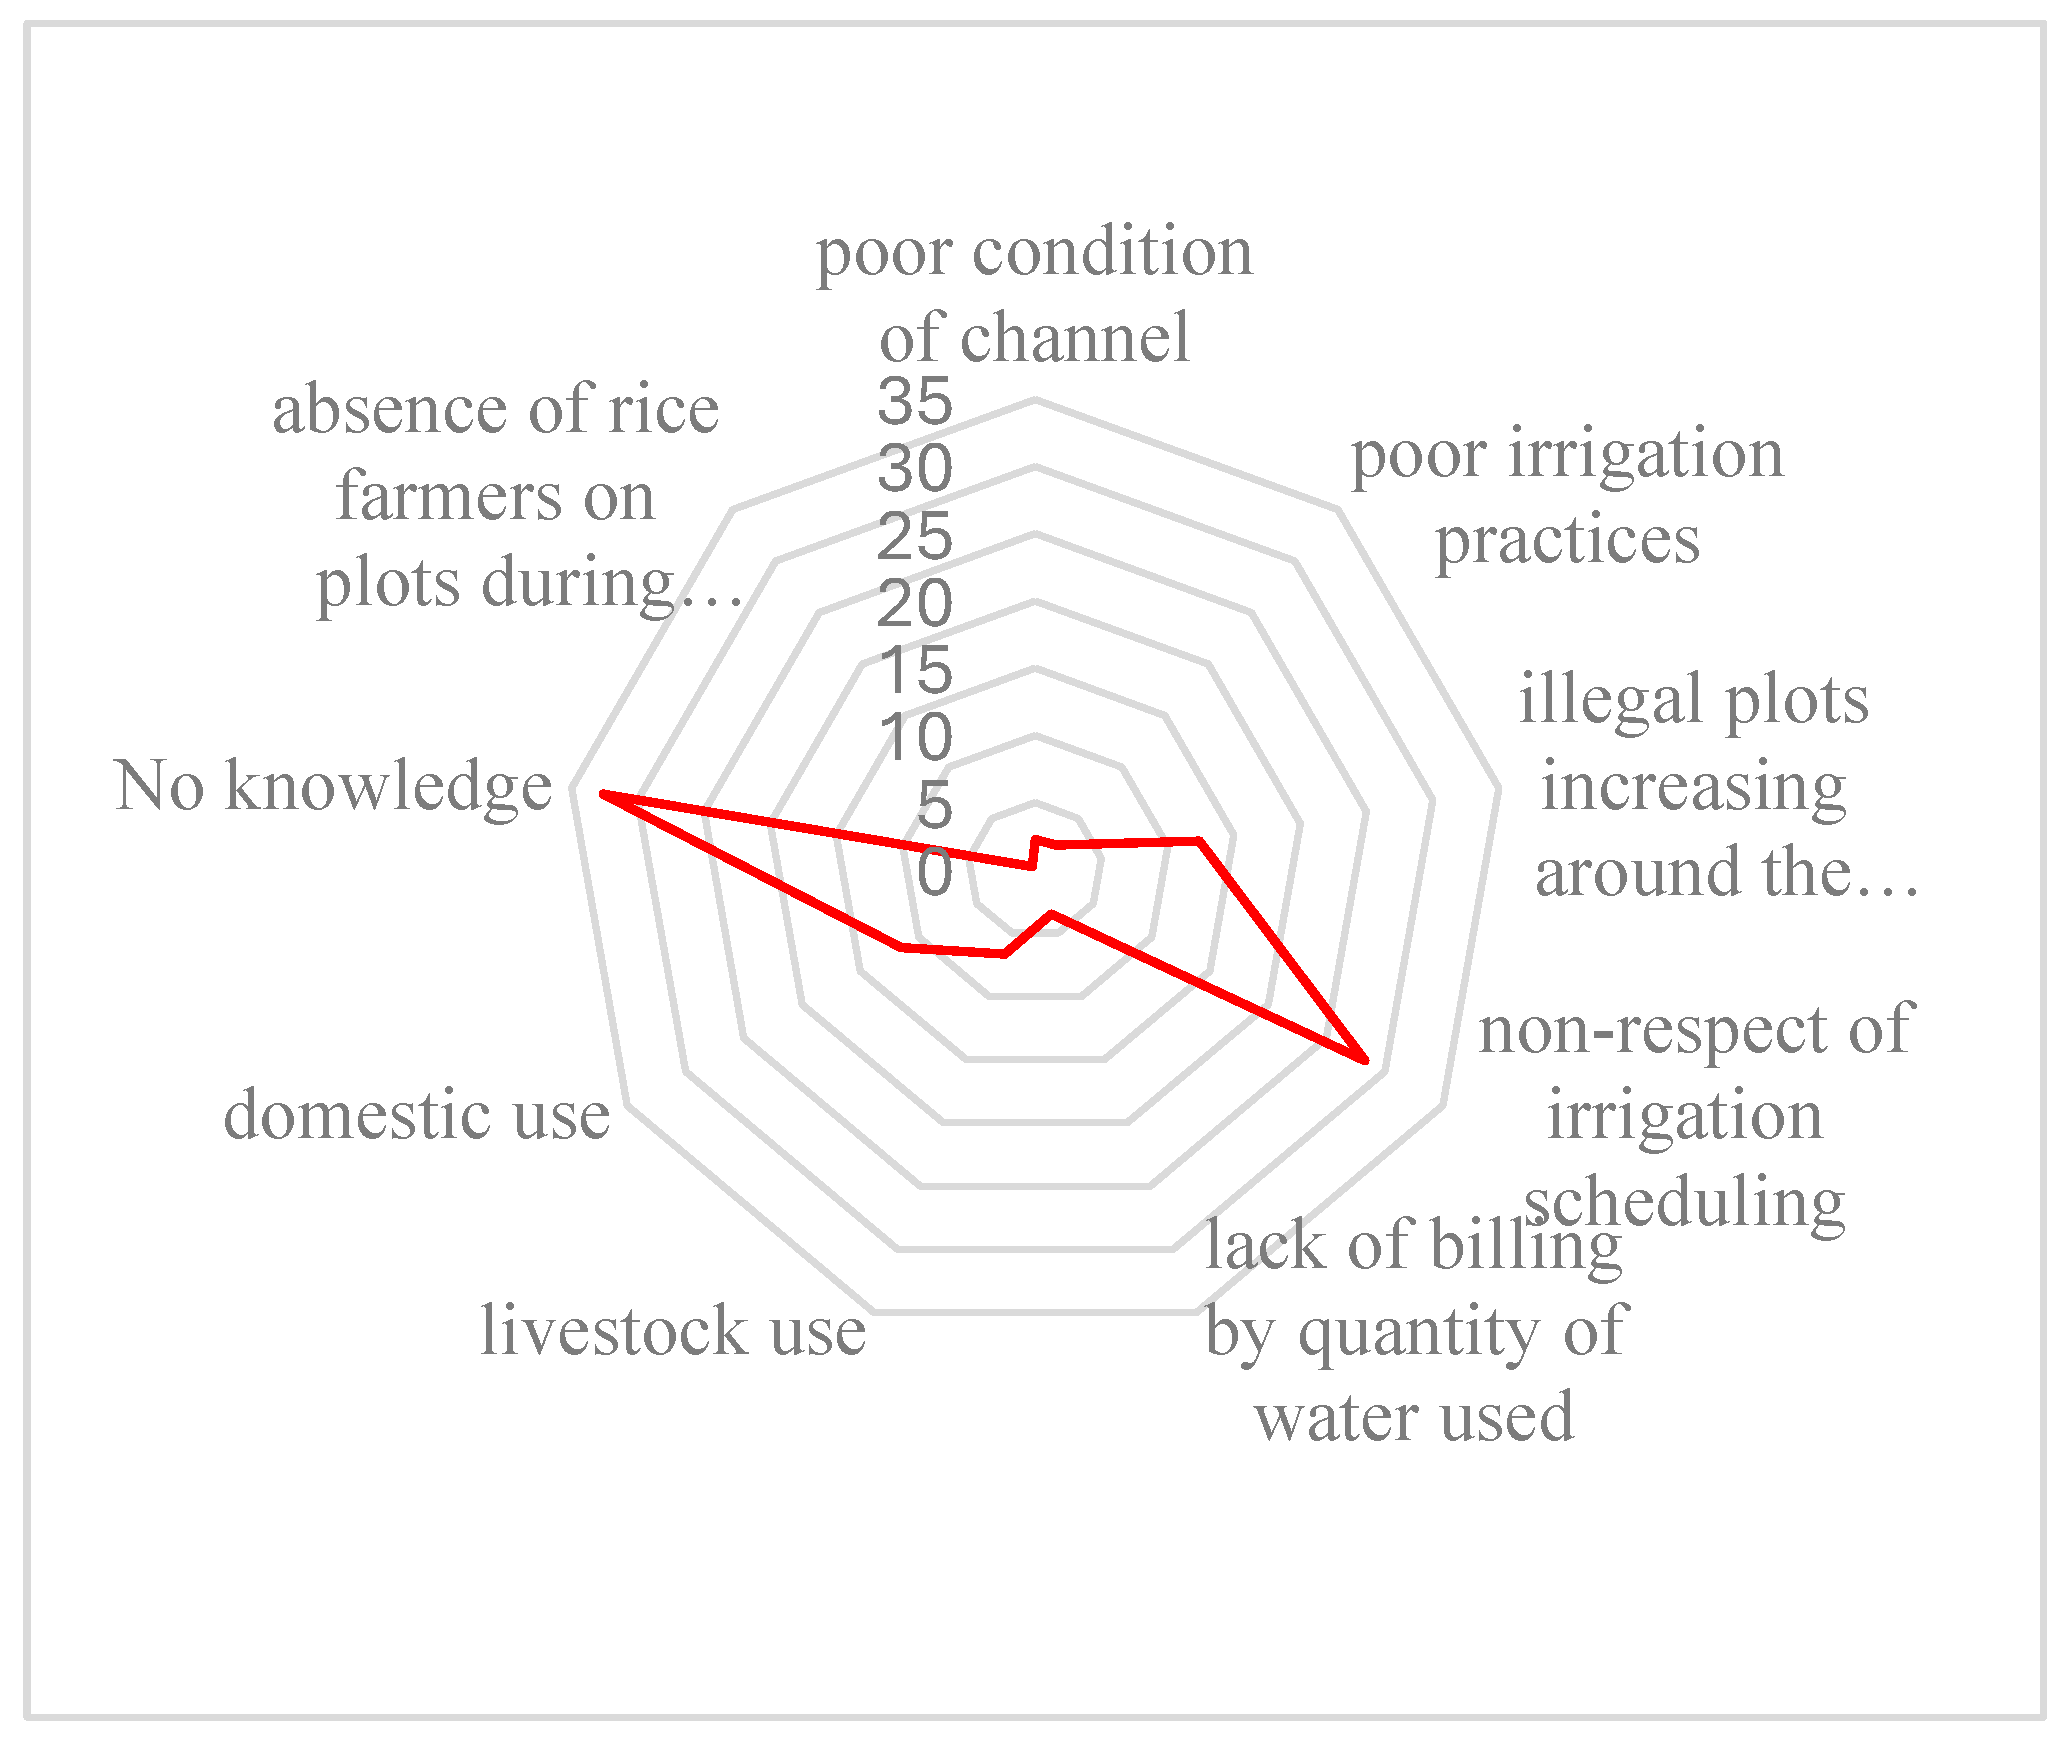
Close to 28% of rice farmers did not know how to determine the irrigation period, while 49% thought they irrigated when the soil was dry (Figure 20). Others irrigated by intuition (10%) or in relation to the transplanting period (6%) and the yellowing of the rice crop. To determine the amount of water to irrigate, over 32% of rice growers had no knowledge at all, and around 35% relied on rice height and leaves color, followed by 22% on intuition (Figure 21). Meanwhile, less than 3% of rice growers used dikes to keep water from overflowing into basins. The factors for wasting irrigation water cited by growers were multiple, and the most recurrent included channel poor condition (32.6%) and poor irrigation practices (28.3%) respectively (Figure 22). In the same way, factors such as illegal plots increasing around the irrigation scheme (12.4%), Non-respect of irrigation scheduling (11.5%) and Lack of billing by quantity of water used (6.6%) result in high overall water losses.
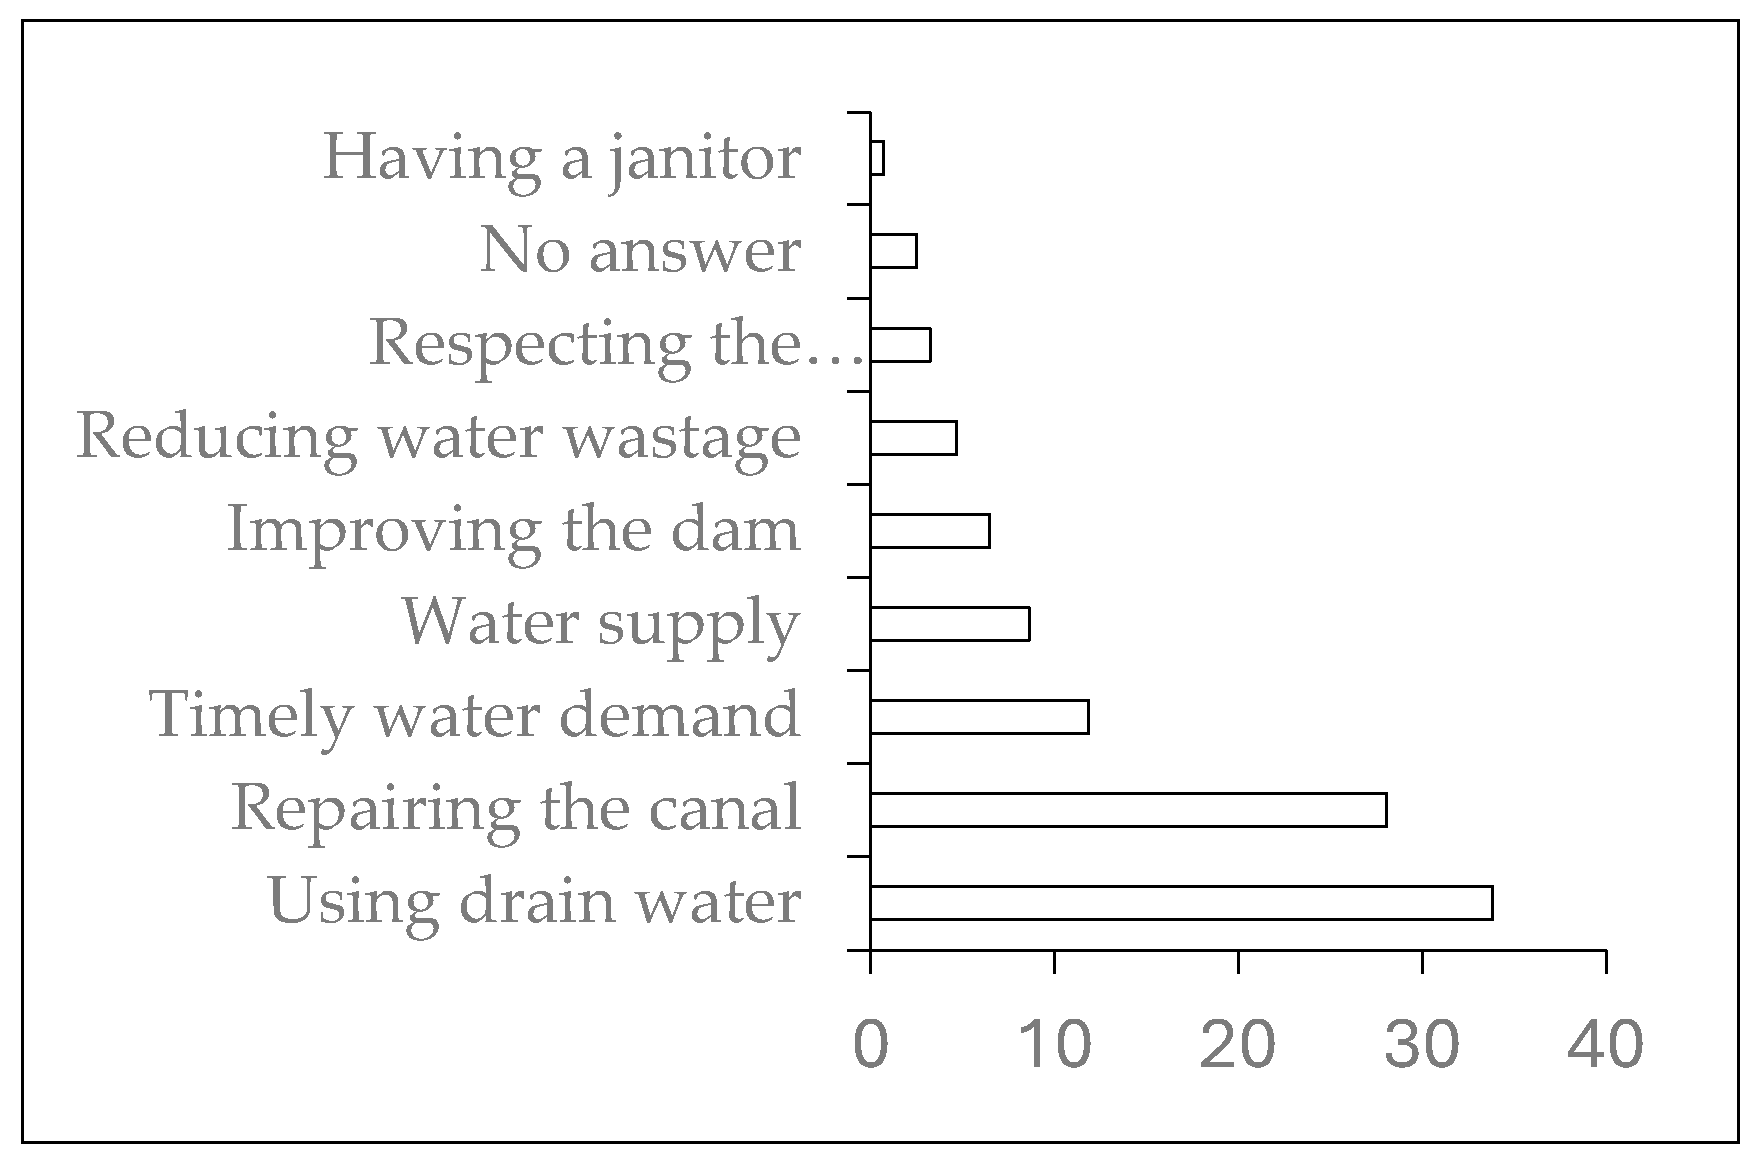
Over 97% versus 3% of growers agreed that the shortage of irrigation water was affecting paddy rice yields. To reduce the water deficit in rice irrigation, 34% of rice growers proposed using drain water, 28% suggested repairing the canal and 7% timely water demand (Figure 23). As well, other growers thought that reducing water wastage (5%), respecting the irrigation schedule (3%) and having a janitor (1%) could reduce the irrigation water deficit on the irrigated perimeter. To make up for this deficit, 28% of rice growers used drainage water. With regard to the potential risks associated with the use of drainage water, 73% of rice growers were unaware and 25% felt that the use of drainage water presented no risk.
Like irrigation water deficit, some 77.3% of growers versus 22.7% and 80.2% versus 19.8% respectively acknowledge that excess irrigation water has a negative effect on paddy rice yields and fertilizer use efficiency. Thus, to reduce excess irrigation water, 27% of growers did not know how to proceed, 69% suggested improving drainage and only 4% recommended avoiding over-irrigation.
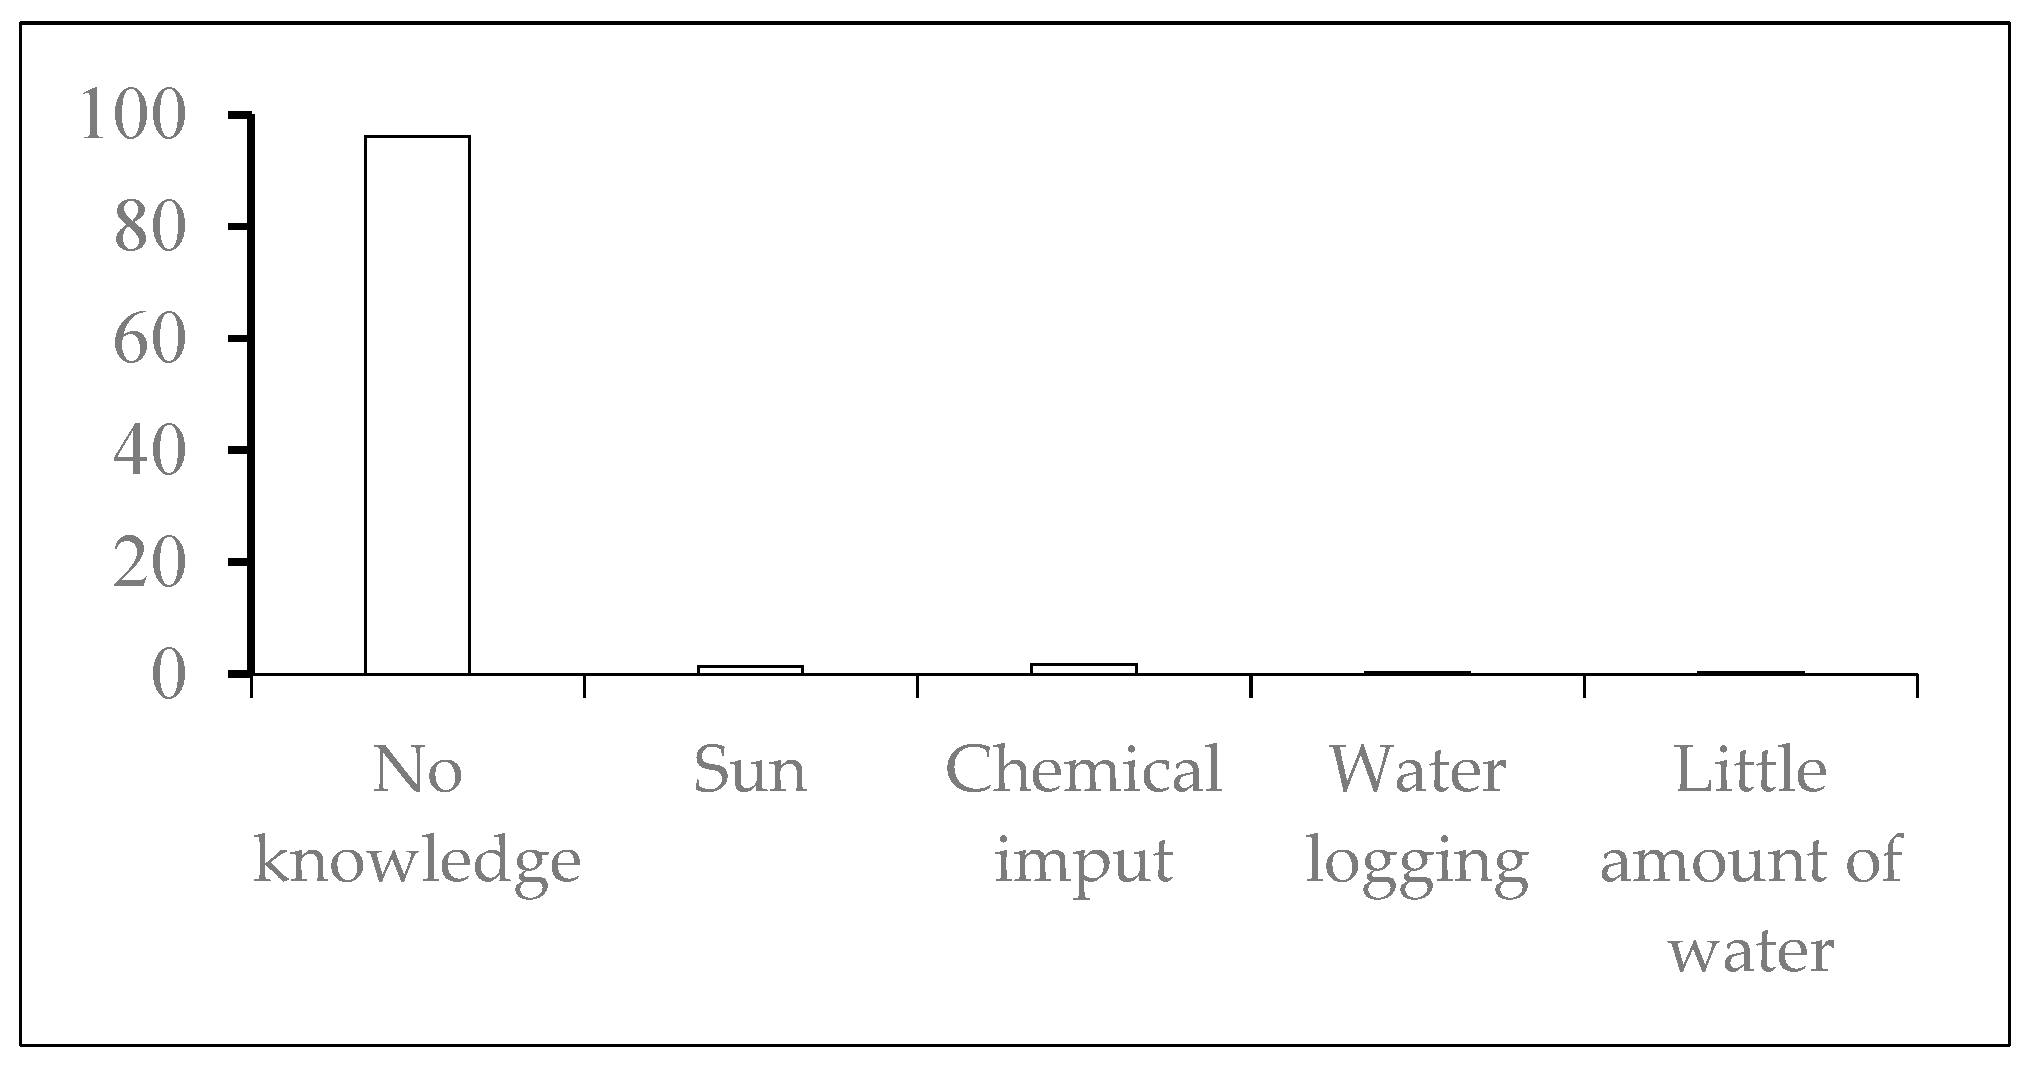
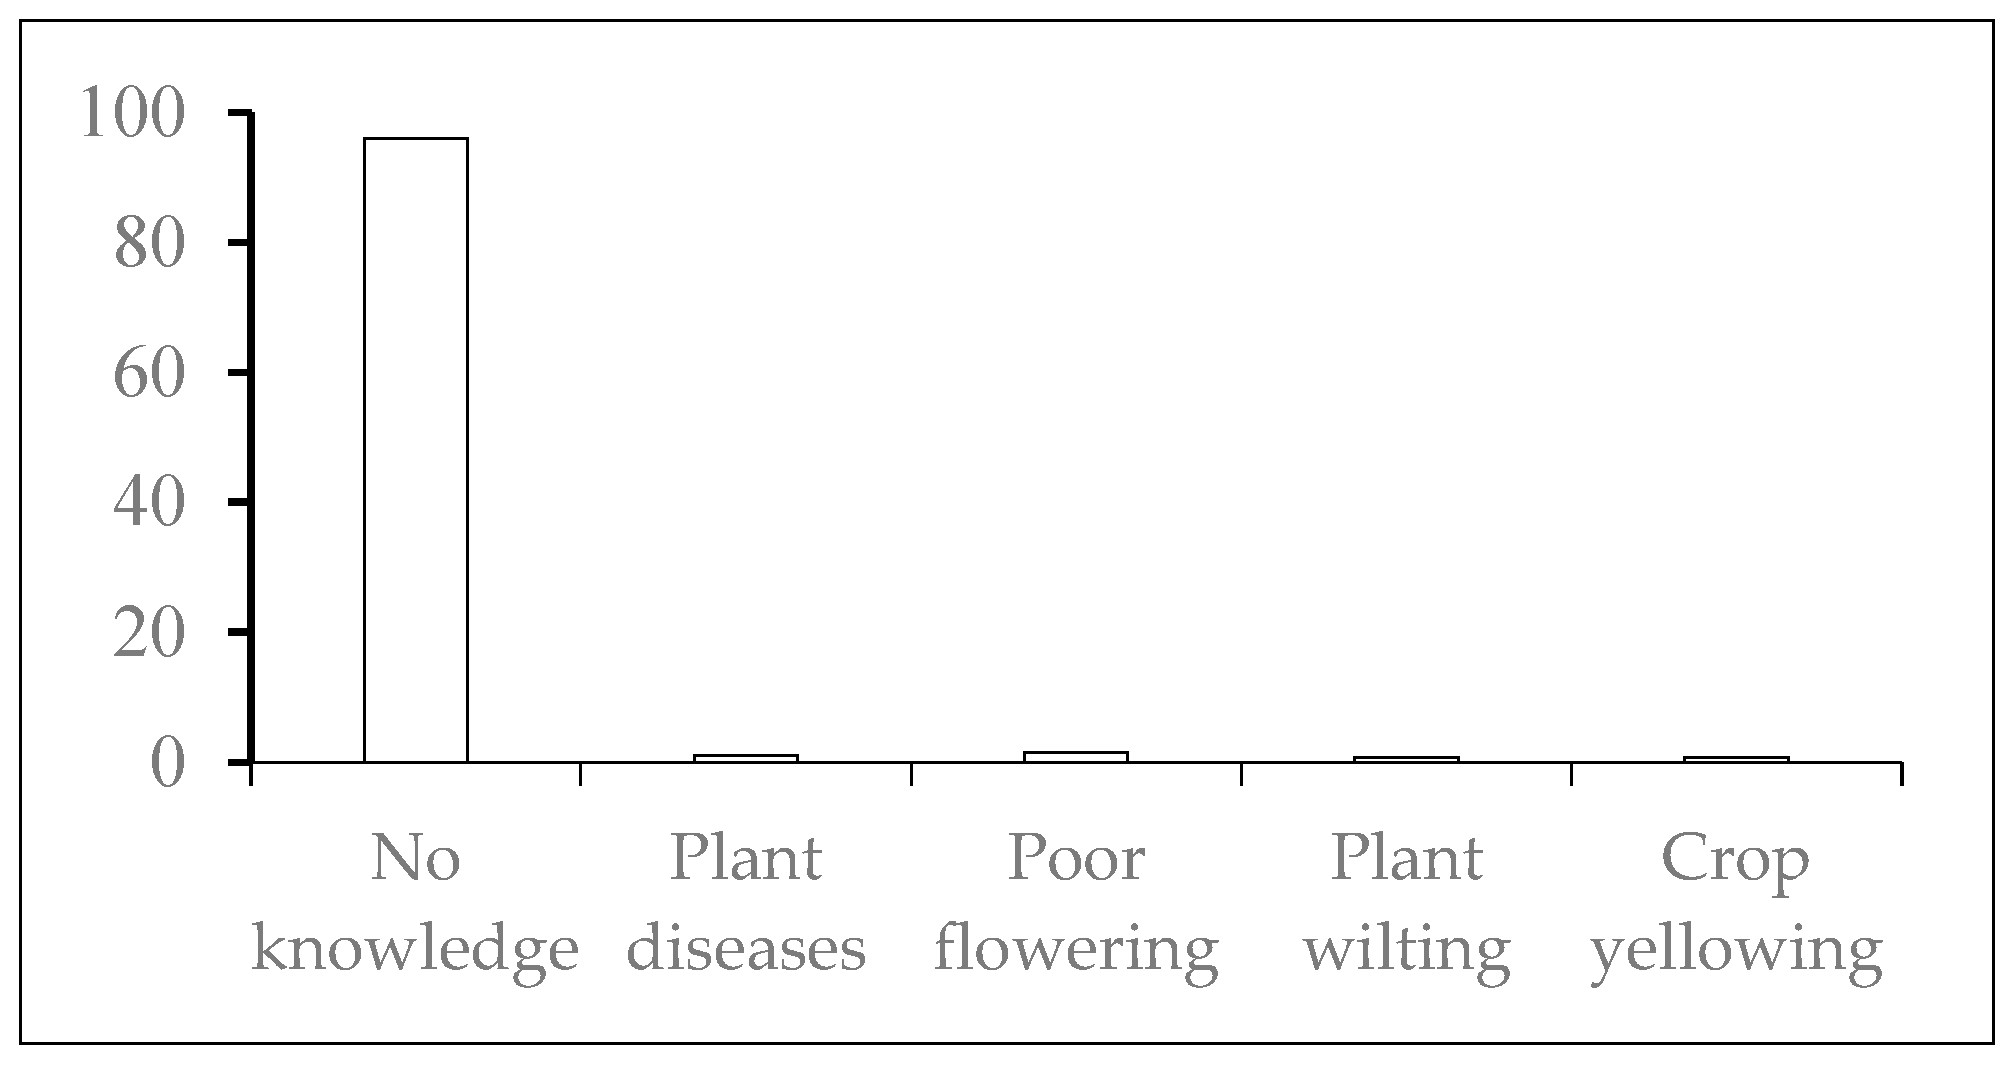
Rice growers (95.7%) had no knowledge of soil salinity and 96% were unaware of its causes (Figure 25). However, 4.3% thought that the causes of salinity could be chemical inputs (1.8%), water logging (0.4%) and little amount of water (0.4%). As for the causes of salinity, 96% of rice growers were unaware of the consequences of salinity on rice production (Figure 26). Nevertheless, 4% of growers thought that soil salinity was the cause of plant diseases, poor flowering, plant wilting and crop yellowing.
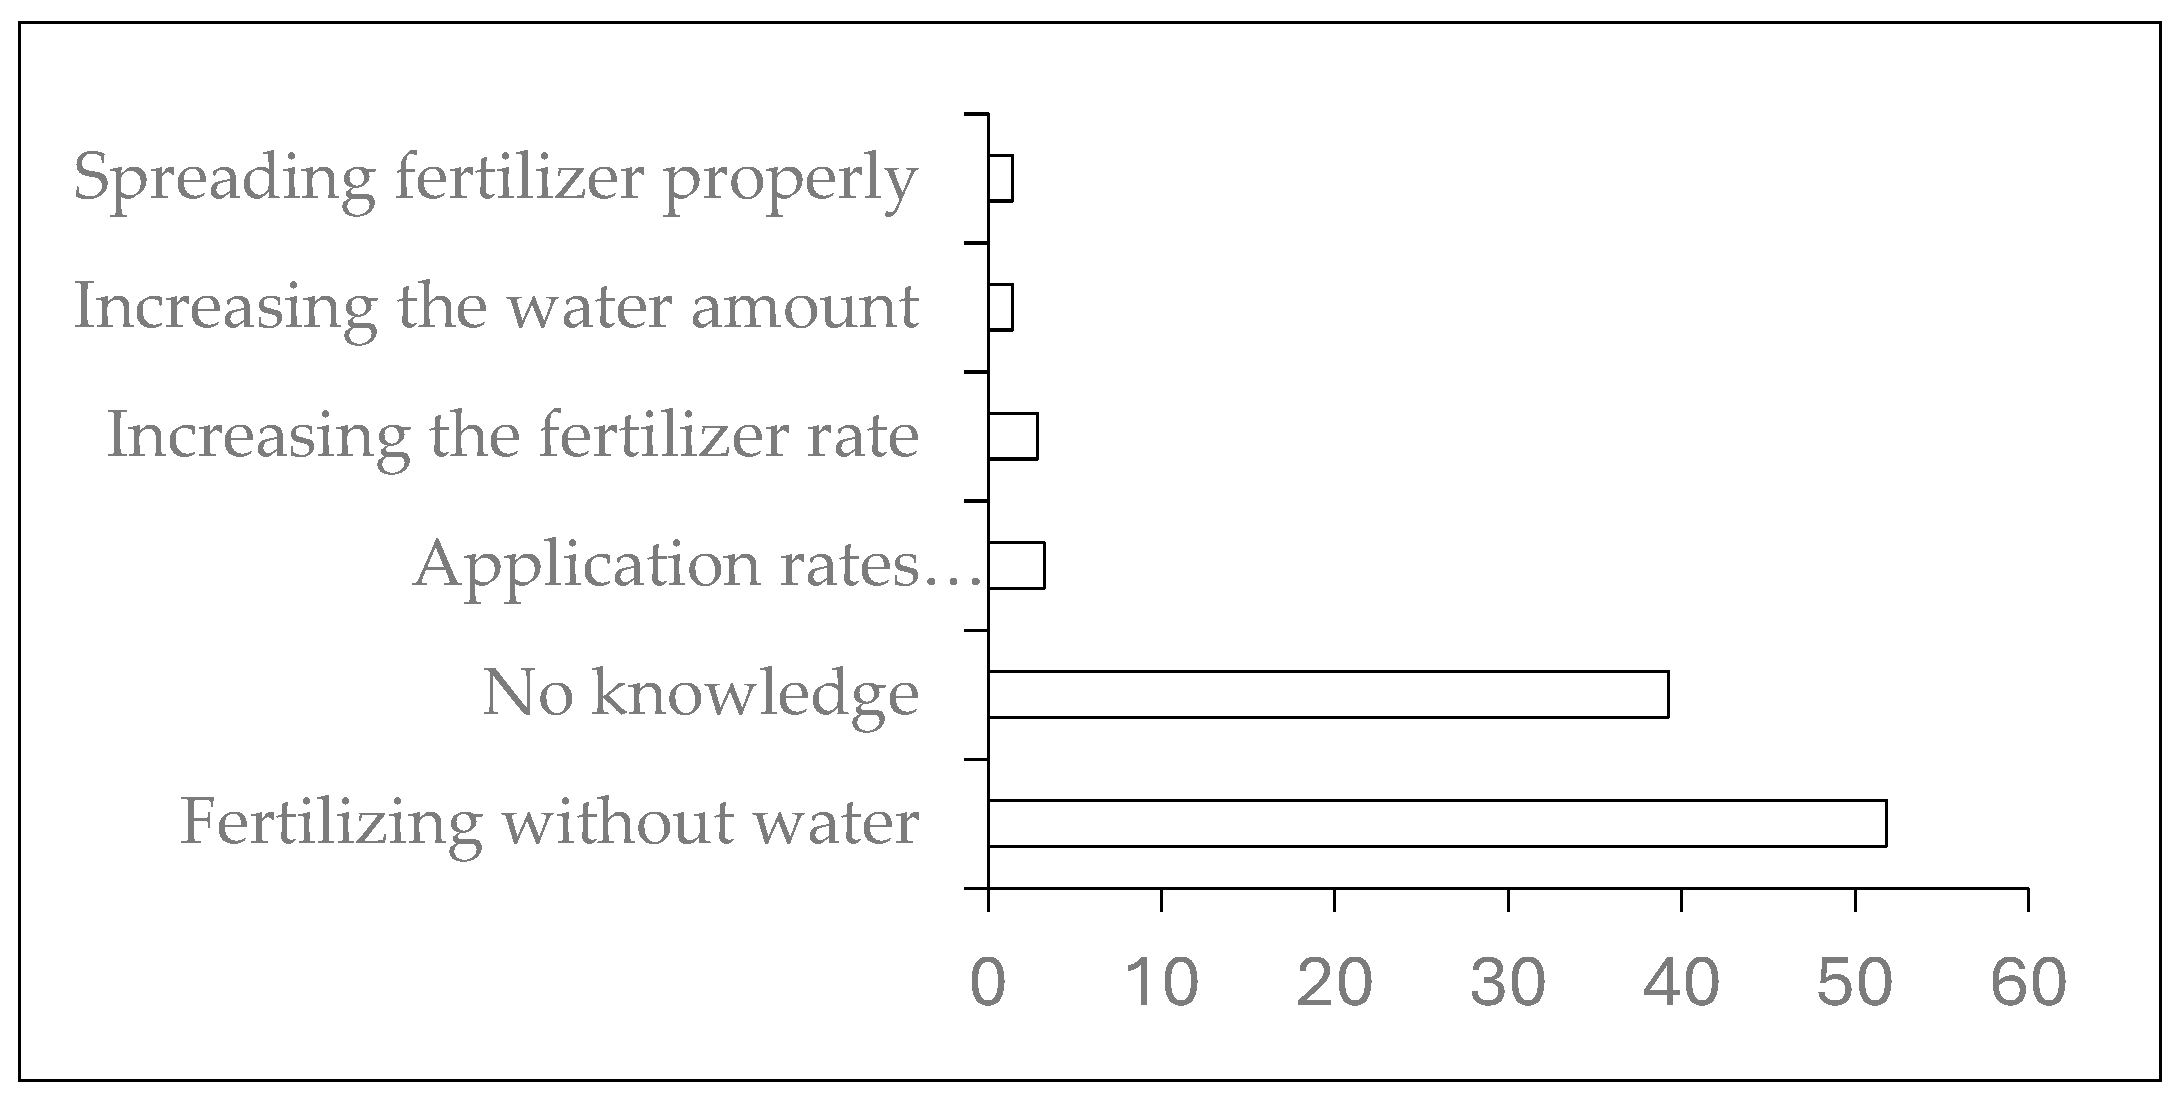
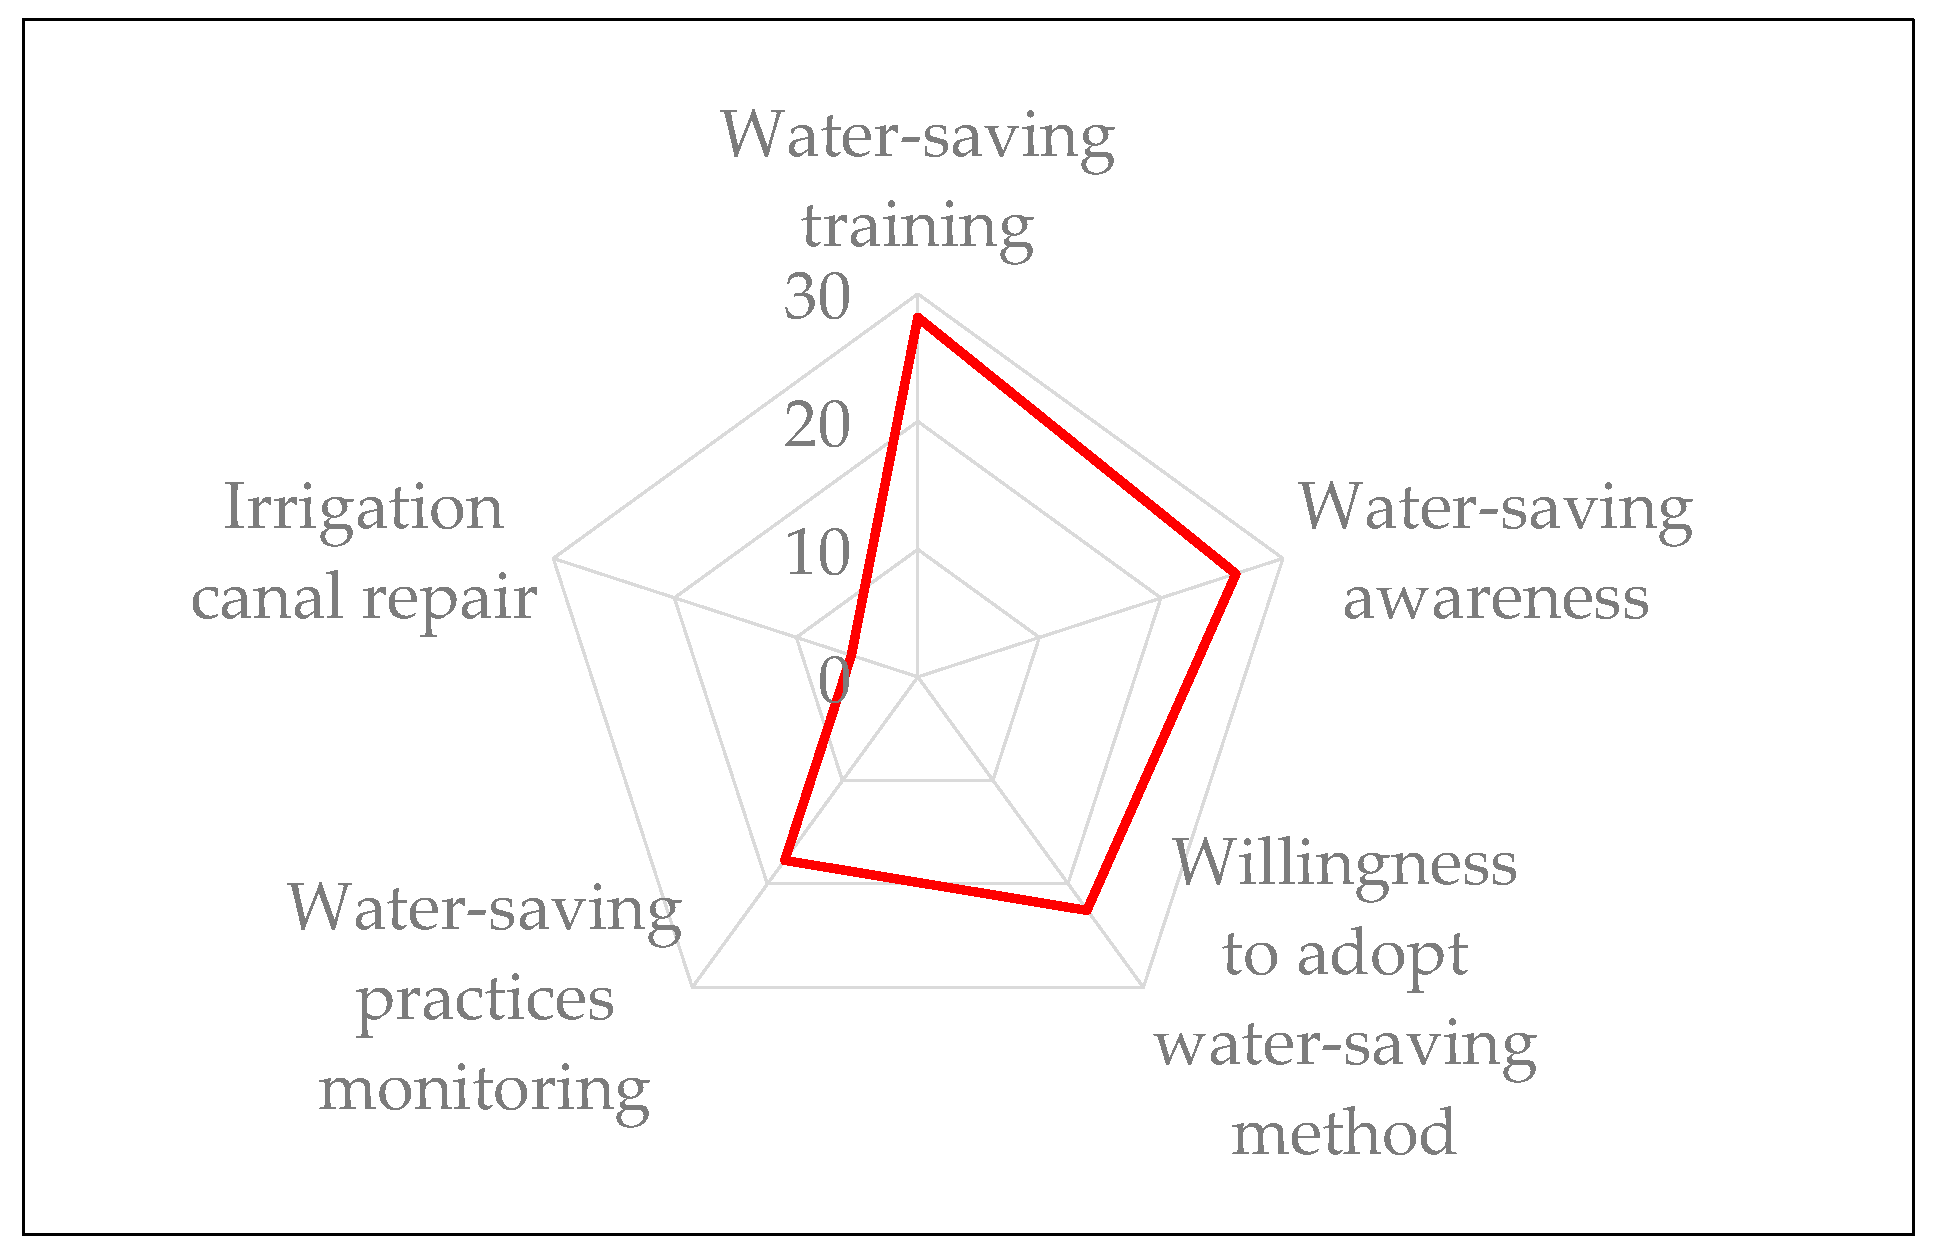
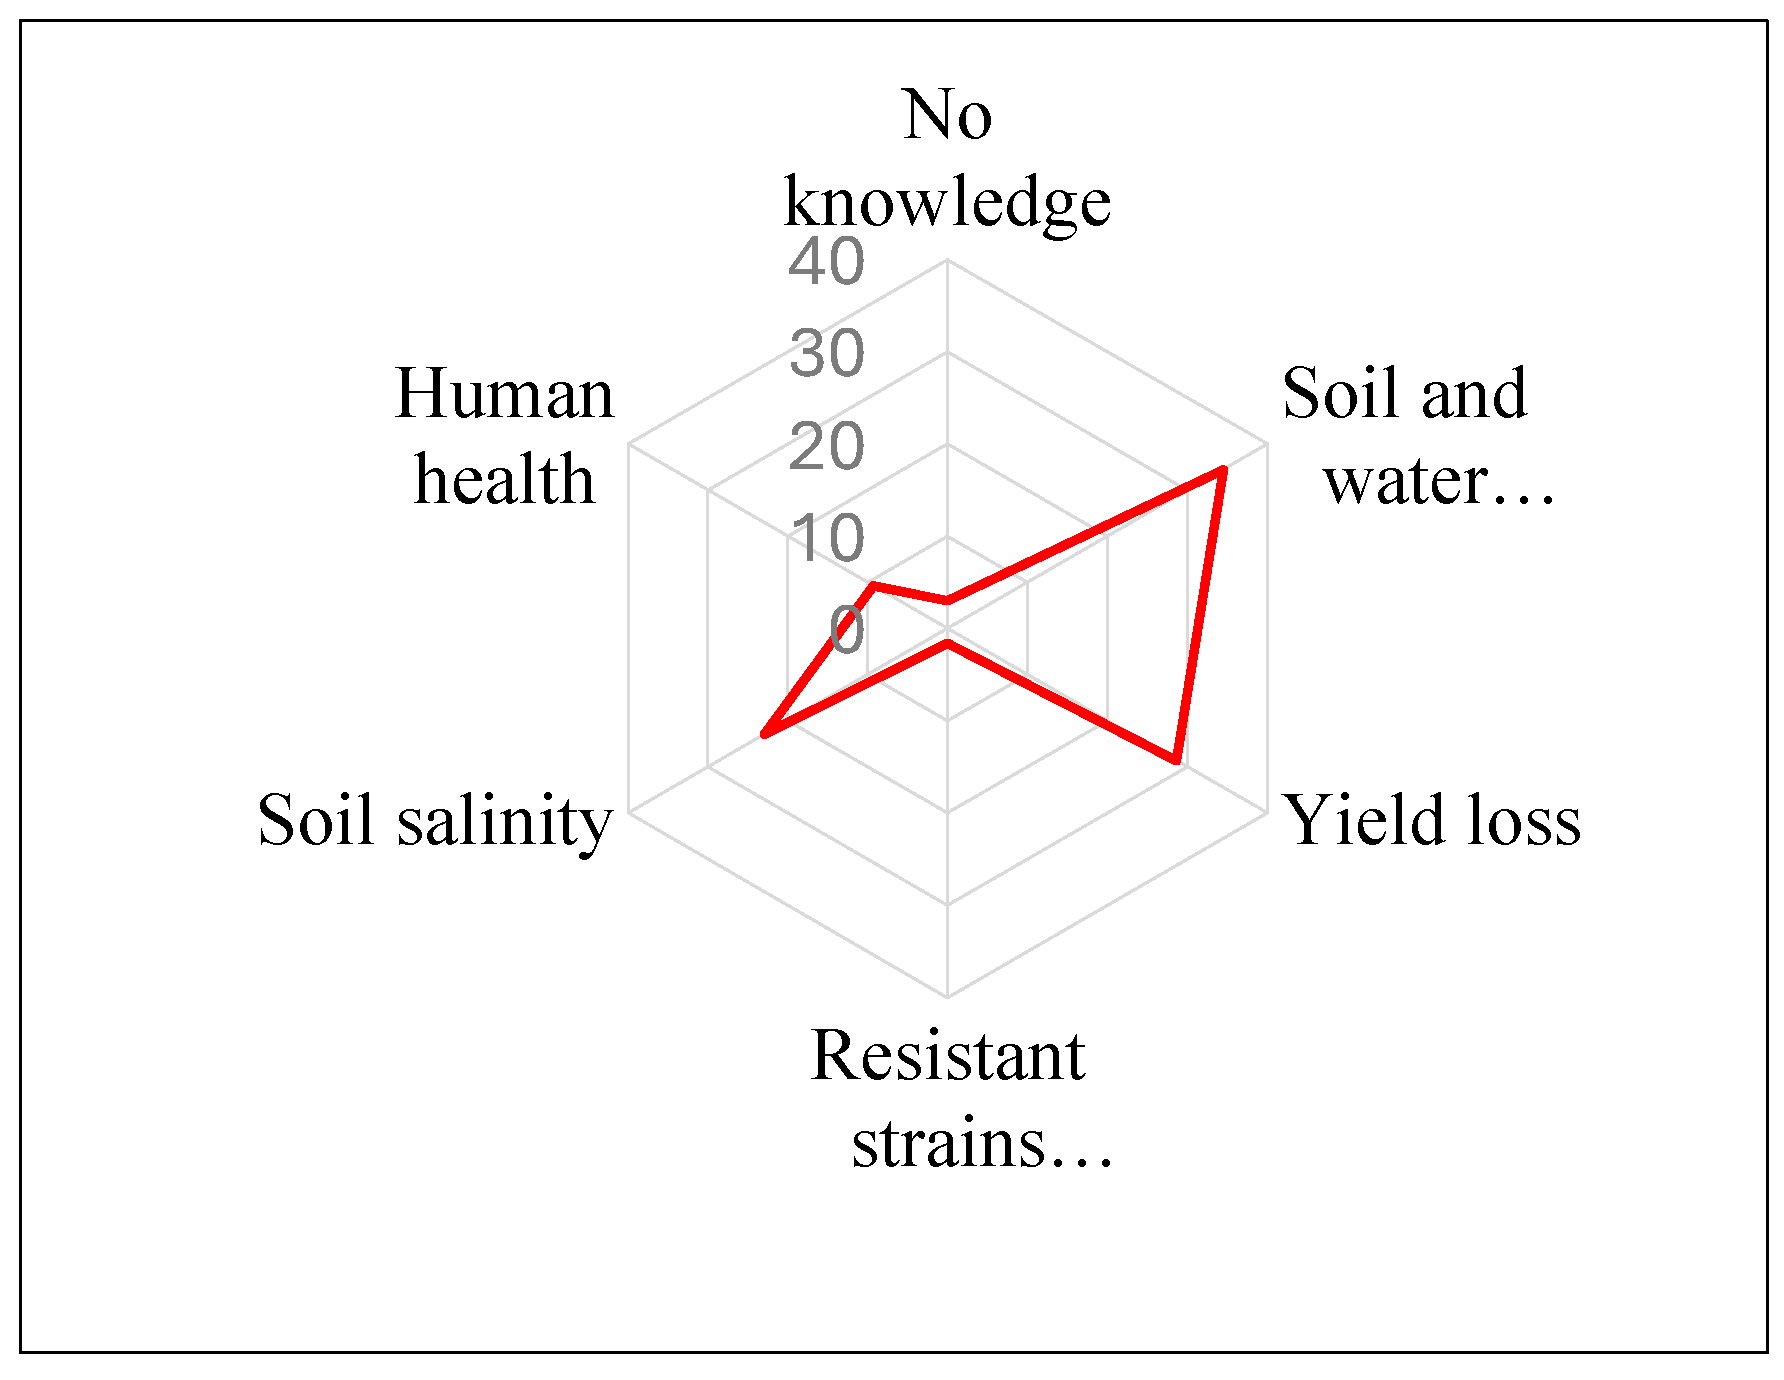
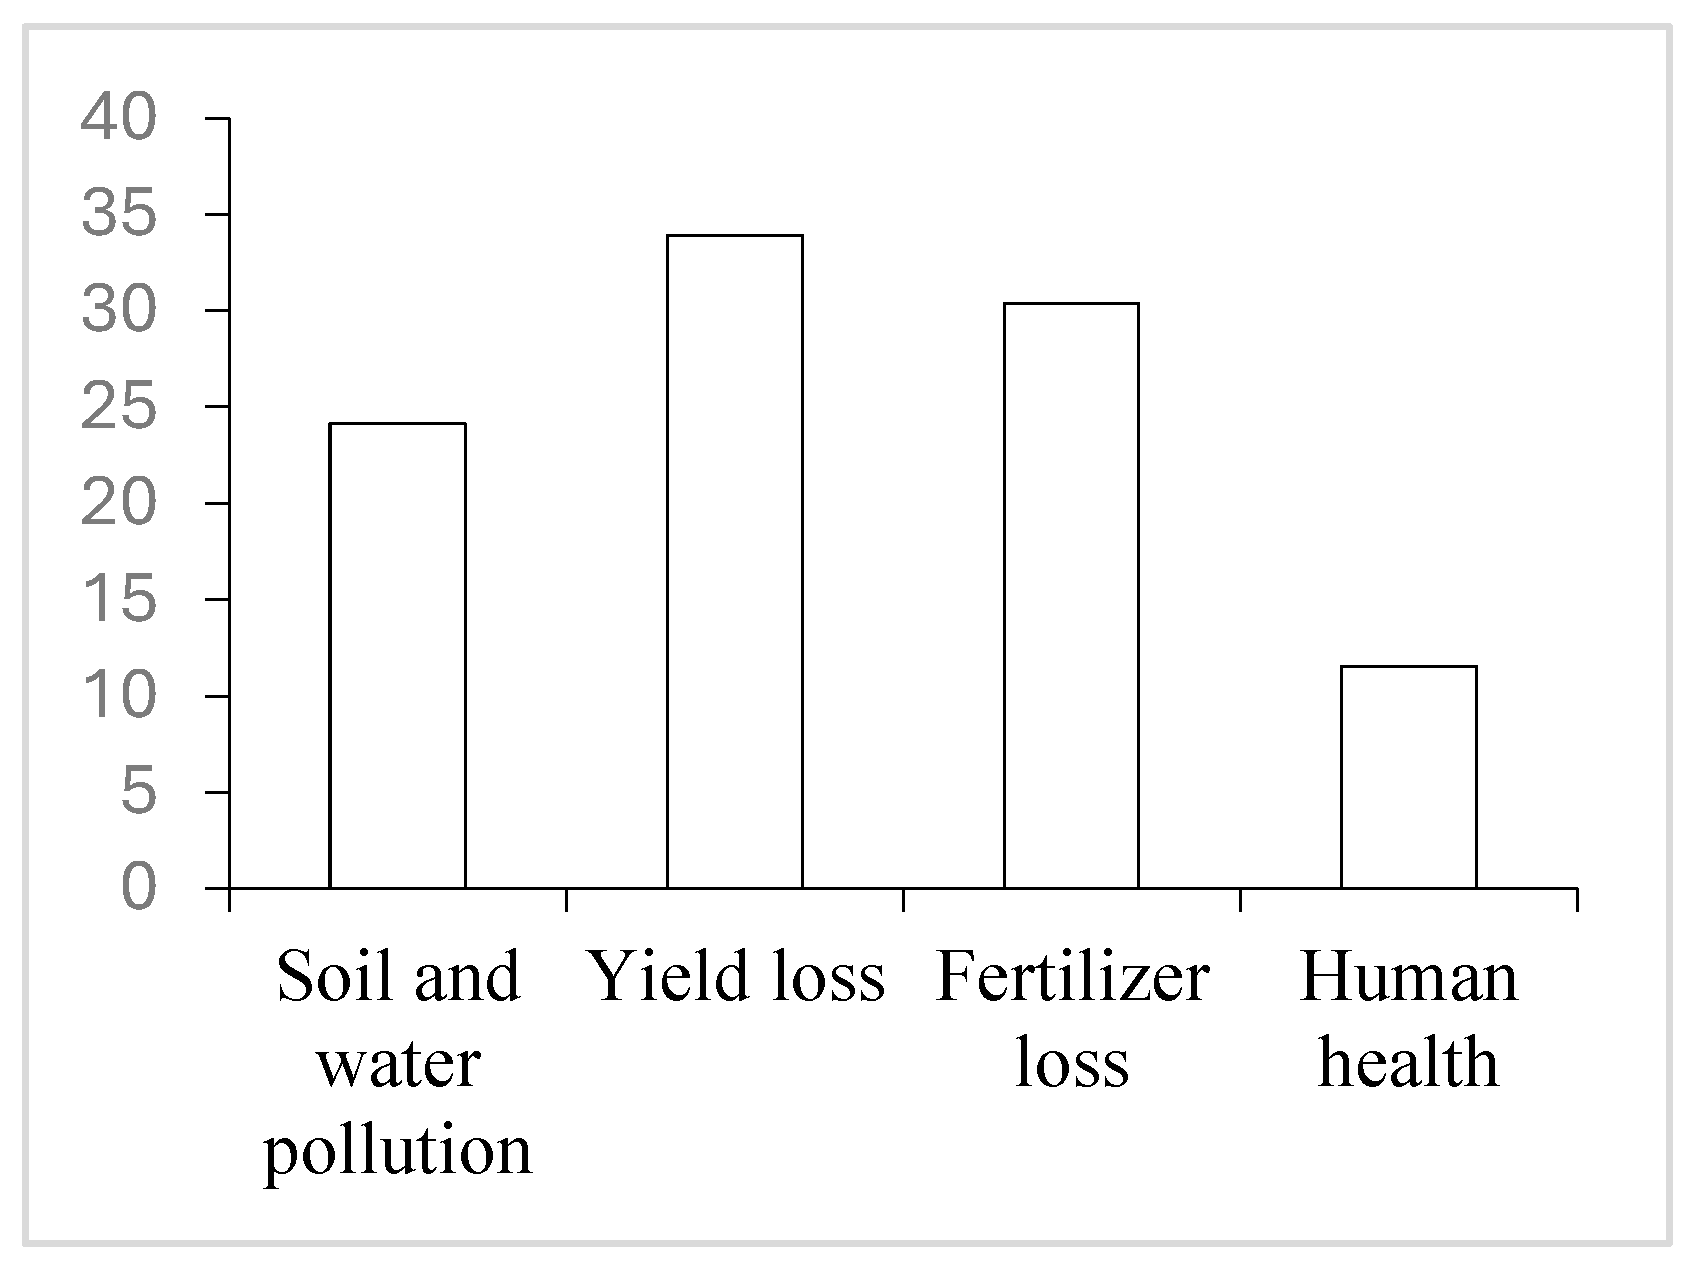
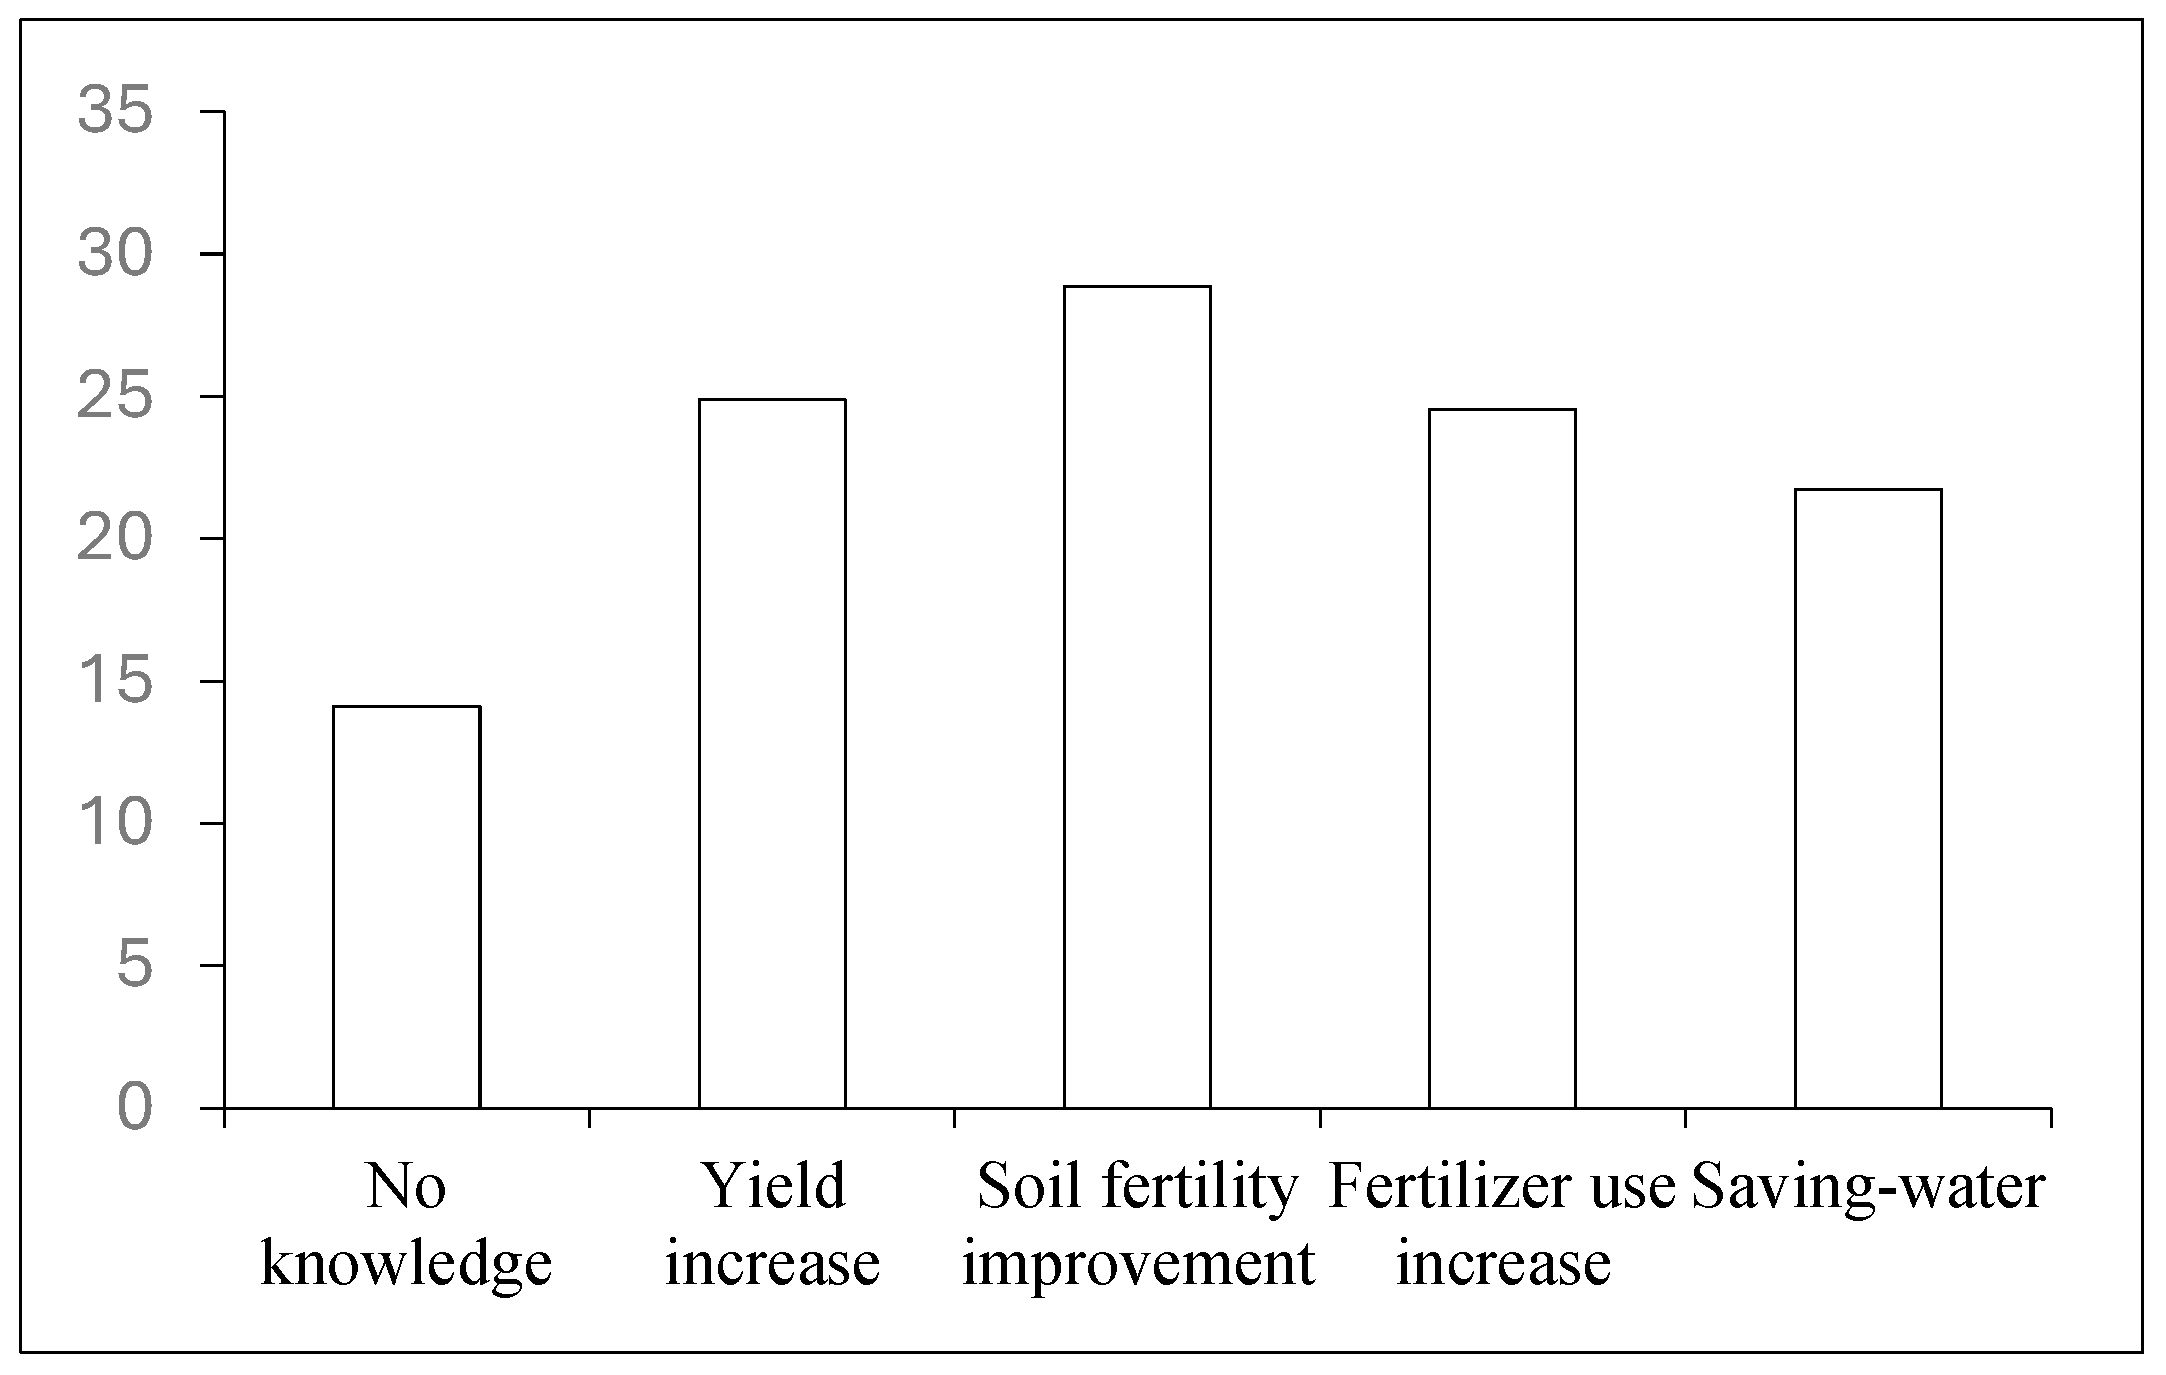
When asked how to improve irrigation water management, growers suggested Water-saving training (28.1%), Water-saving awareness (26.1%), Willingness to adopt water-saving method (22.5%), Water-saving practices monitoring (17.7%) and Irrigation canal repair (5.5%) (Figure 27). Rice producers expressed different views on the disadvantages of inappropriate pesticide use (Figure 28). The main consequences highlighted were soil and water pollution (34.5%), Yield loss (28.6%) and Soil salinity (23.0%). In the same way, rice growers considered that inappropriate use of fertilizers caused yield loss (33.9%), Fertilizer loss (30.4%) and oil and water pollution (24.2%) (Figure 29). However, they recognized the positive effects of mulches and compost use on soil fertility improvement (28.9%), yield increase (24.9%), fertilizer use increase (24.5%) and saving-water (21.7%) (Figure 30).

3.5. Impact of Socio-Economic Characteristics, Farming Practices and Irrigation Water Management on Paddy Rice Yields

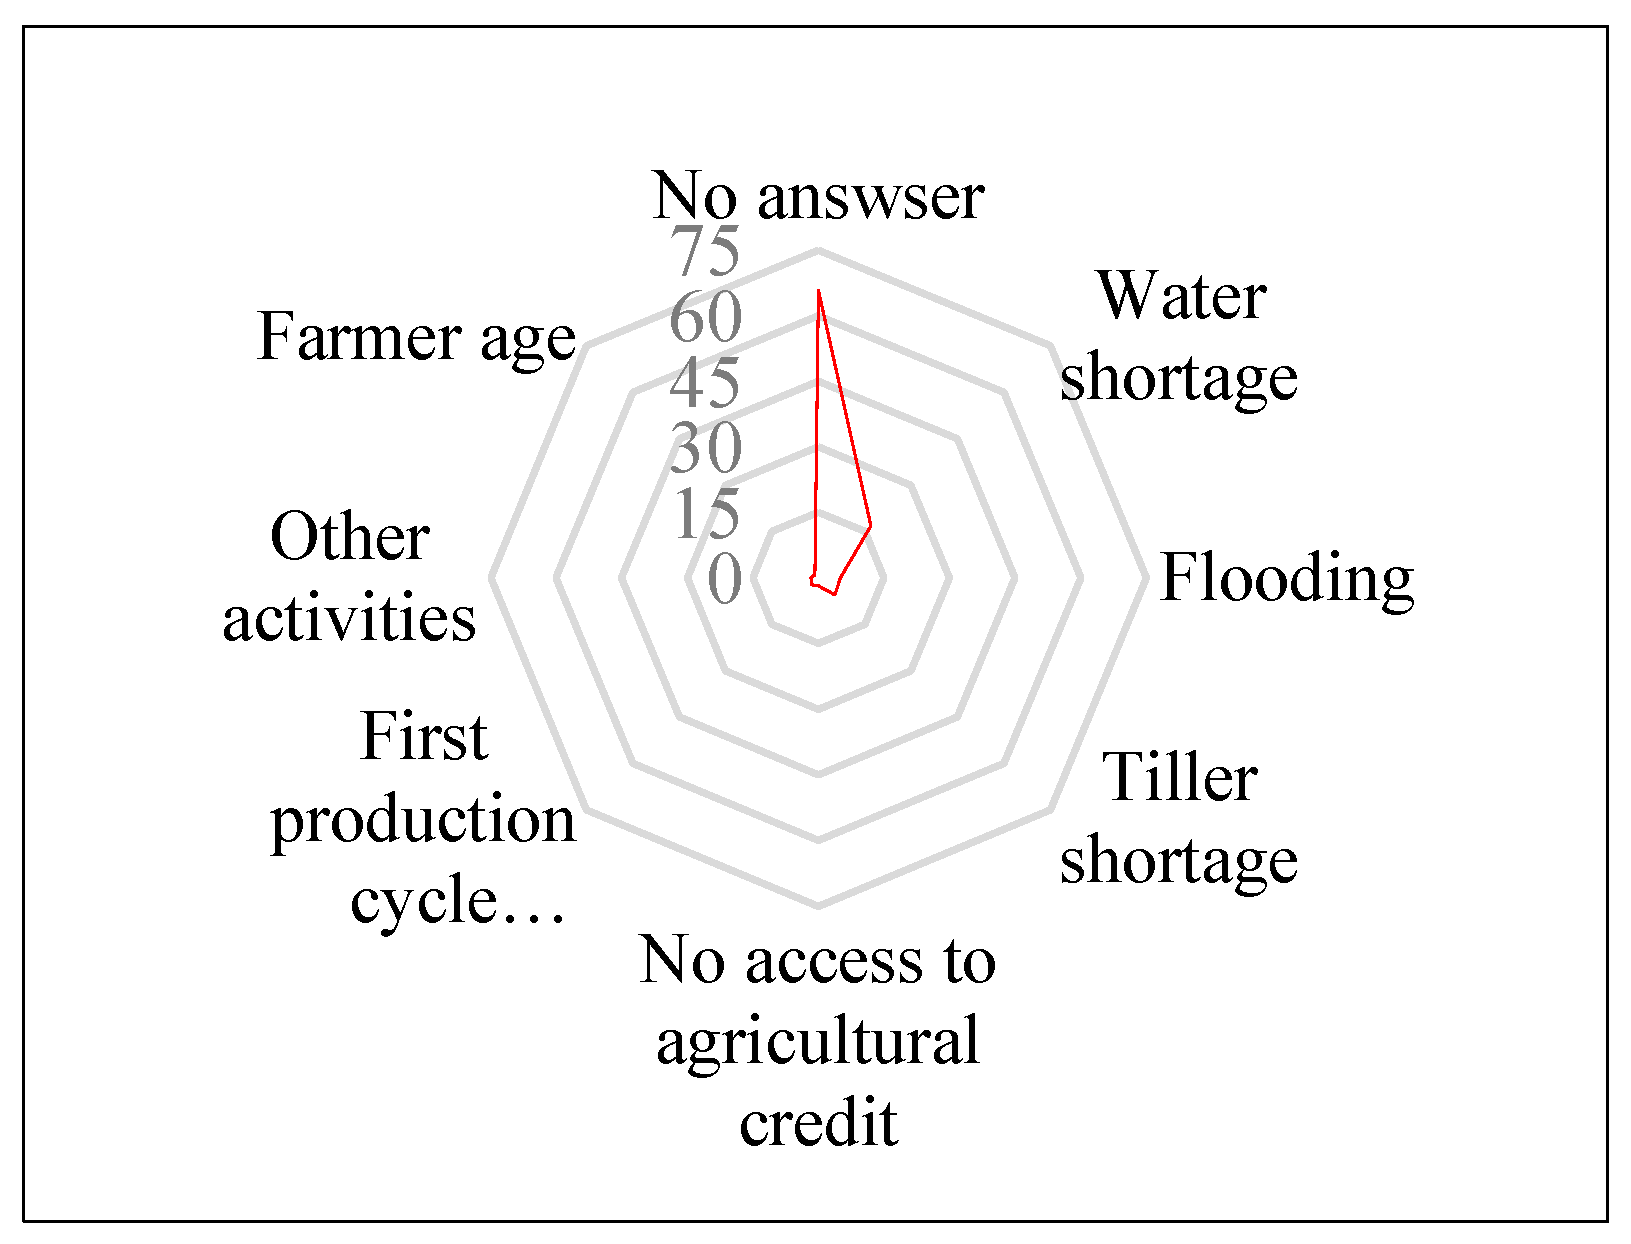
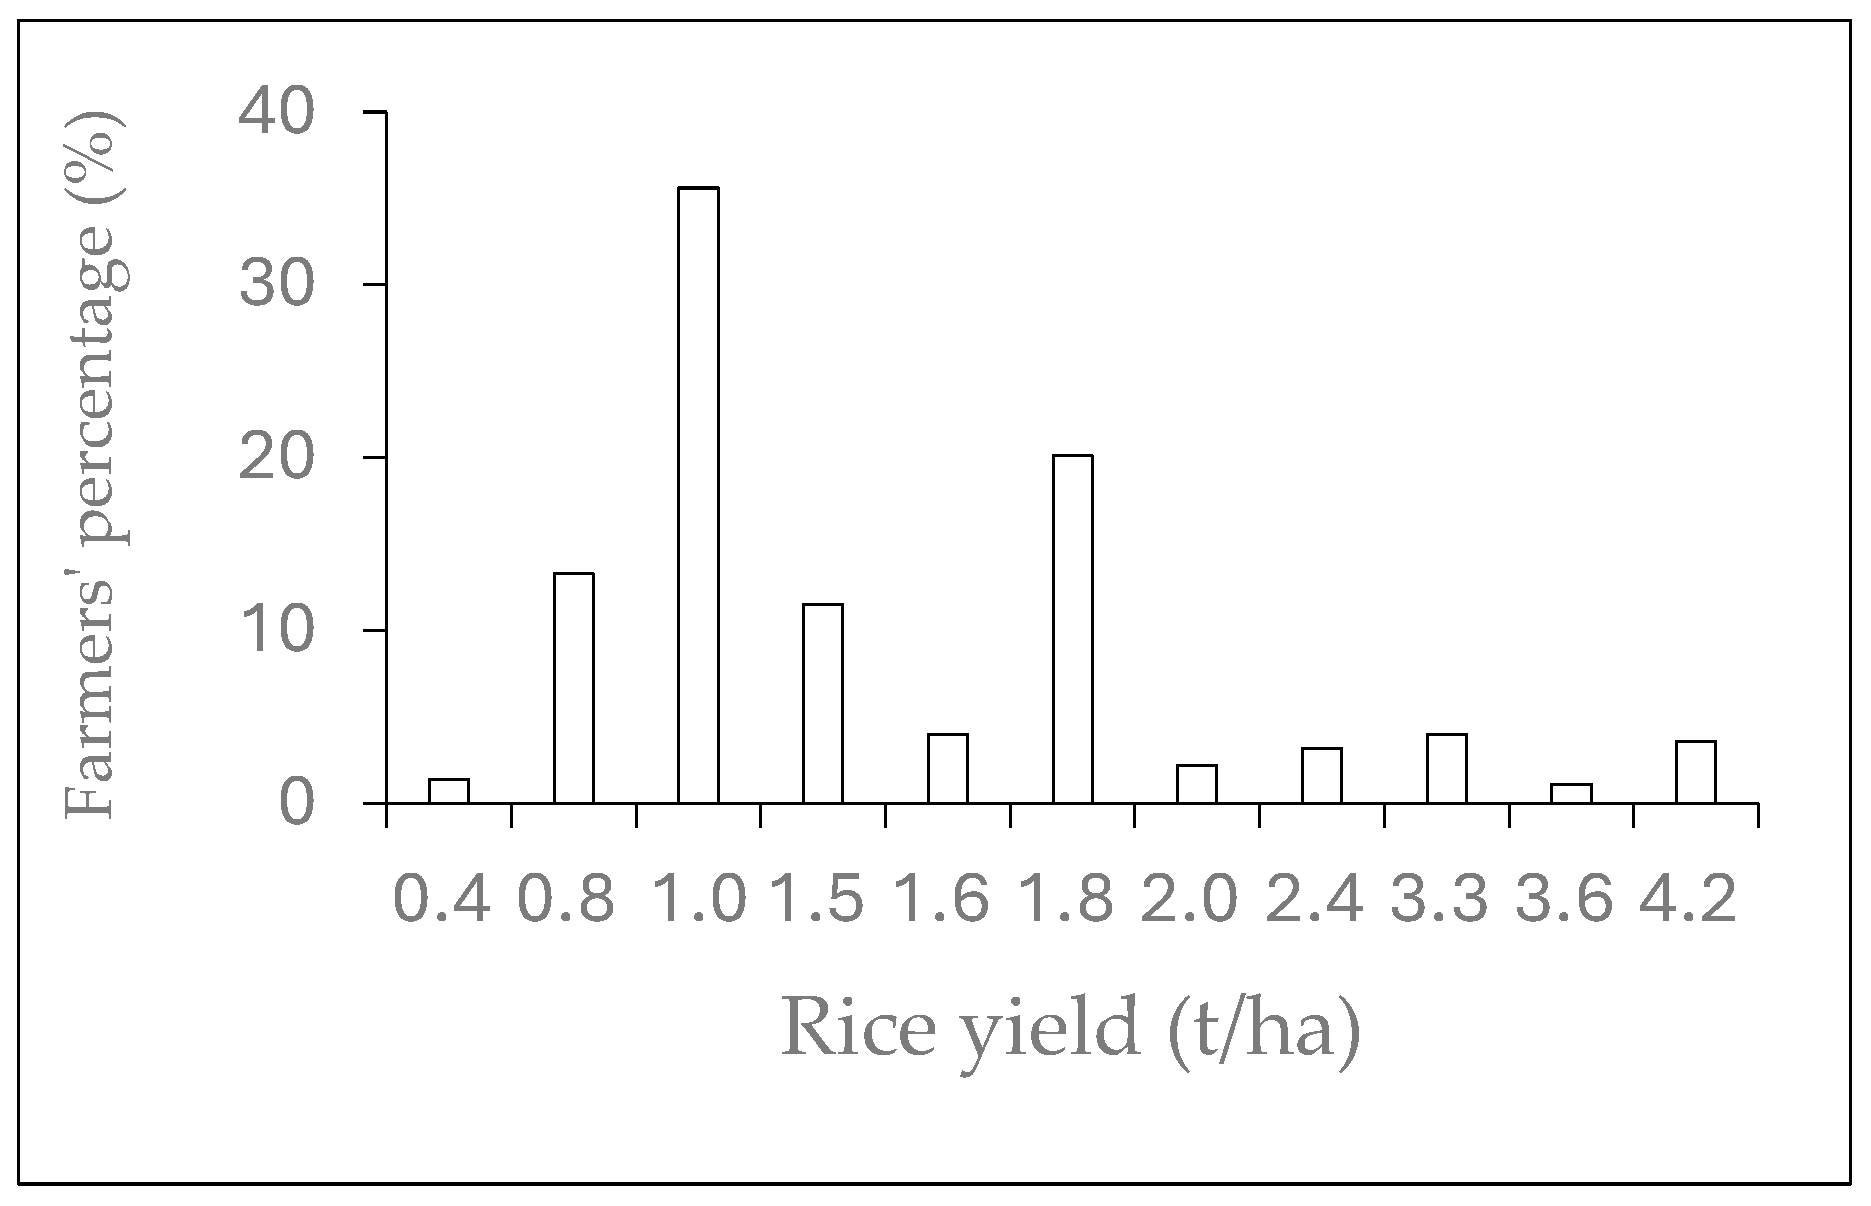
Rice growers producing twice a year were estimated at 65.5%, compared with 34.2% of growers producing only once a year. However, 0.4% of rice growers produce three times a year. The Reasons due to one production cycle a year were diverse (Figure 31). In ascending order, respondents ranked water shortage, tiller shortage and flooding as the most important reasons. Paddy yields were low, ranging from 0.4 to 4.2 t/h, with an average yield of 1.5 t/ha (Figure 32). Fewer than 7.6% (21/278) achieved above-average paddy yields. The values showed that 62% of rice growers were below average, and over 88% of growers did not achieve a yield exceeding 2 t/ha, despite the 6 - 8 t/ha potential of the cultivar (IR841) mostly planted.
Pearson's statistical tests showed that some socio-demographic characteristics had an effect on paddy yield. The impact of farmers' age on paddy yields was not significant. Nonetheless, no farmer aged 18-27 or over 68 obtained a yield higher than the overall average (1.5 t/ha). In addition, growers obtaining yields in excess of 1.5 t/ha were limited to a maximum of two plots. Producer income sources also had a significant impact on paddy rice yields at the 5% confidence level (p-value = 0.00), because among producers who obtained more than 1.5 t/ha, the majority were rice growers who only practiced agriculture. Statistical analysis also showed that labor sources affected yields at the 5% significance level (p-value = 6.7845e-06). Sharecroppers accounted for 95% of farmers who achieved yields of over 1.5 t/ha. Access to credit and paddy yield were significantly linked (p-value = 0.00). Among producers who obtained more than 1.5 t/ha, access to agricultural credit was only 23.8% versus 76.2%. Grower experience influenced yield at the 5% significance level (p-value = 8.3061e-06), as among those with above-average yields, growers with 6-11 years' experience accounted for 57%, following producers with less than 5 years' experience (24%). Rice growers with more than 15 years' experience were less represented (19%).
Several farming practices affected paddy yield substantially. Clearing method was shown to have a significant effect on yield at the 5% confidence level, with a p-value of 0.00. Farmers using combined chemical and mechanical land clearing accounted for 52.3% of those who obtained more than 1.5t/ha, compared with 38% of those using chemical land clearing alone. The statistical test showed that the ploughing type affected yields at the 5% threshold (p-value = 1.3323e-15), because, among growers who obtained 1.5 t/ha, 57% opted for tiller ploughing and 38% for no ploughing. The type of muddling had a significant incidence on yields at the 5% level. Among rice growers who obtained more than 1.5 t/ha, manual muddling, no muddling and tiller muddling accounted for 57%, 33% and 10% respectively. The sowing method strongly contributed to paddy yield, and among farmers who obtained more than 1.5 t/ha, direct seeding accounted for 43% and transplanting for 57%. In the same way, the cropping pattern showed a significant effect on paddy yields at the 5% confidence level. Rice growers opting for the 15 cm x 20 cm and 20 cm x 20 cm cropping patterns accounted for 55.5% and 27.8% respectively of those achieving over 1.5 t/ha.
The Pearson test revealed a dependency between different fertilizer doses, fertilizer types and rice yield at the 5% confidence level. Applying N15P15K15 as a basal fertilizer affected yield for p-value = 0.000000. Over 95% of farmers who obtained 1.5t/ha did not apply any N15P15K15 as basal fertilizer. Meanwhile, applying N15P15K15 one week after sowing produced no effect on yield at the 5% confidence level (p-value = 0.40630). Of the farmers who obtained 1.5 t/ha, 67% applied zero amount of N15P15K15 and 19% applied 50kg/ha of N15P15K15 after one week of sowing. Fertilizing with N15P15K15 at seven and ten weeks after sowing yielded a significant effect for p-value = 0.024235 and p-value of 0.033371 respectively. Seven and ten weeks after sowing, farmers who applied zero N15P15K15 accounted respectively for 67% and 95% of farmers with above-average yields. The application of urea as a fertilizer had no effect on paddy rice yield at the 5% confidence level (p-value = 0.57826). Among rice growers who obtained more than 1.5 t/ha, 100% applied zero amount of urea as background fertilizer, 90.5% applied zero amount of urea one week after sowing and 100% applied zero amount of urea two weeks after sowing. Furthermore, the application of urea seven weeks after sowing had a significant effect on paddy yield at the 5% threshold (p-value 0.0042413). In fact, 90.5% of growers with yields of over 1.5 t/ha applied zero urea seven weeks after sowing. Among the best rice growers, 57%, 19% and 19% applied 100 kg/ha of urea, 50 kg/ha of urea and 150 kg/ha of urea respectively ten weeks after sowing.
Training in irrigation or water management had an effect on paddy rice yield at the 5% threshold (p-value = 8.9308e-08). Farmers who had been trained in irrigation represented 57.1% of farmers who obtained more than 1.5 t/ha, compared with 42.9% of those who had no training. Water delivery method affected rice yields significantly at the 5% confidence level (p-value = 0.00000). Among those with more than 1.5 t/ha, the number of farmers using the "distribution by demand" water delivery method was higher (67%), while the number of farmers using the "continuous distribution" method was lower (5%). Like water delivery method on irrigation scheme, water level above soil has a significant effected on yield at the 5% confidence level (p-Value of 0.00). Farmers with a water level above soil of between 0 and 5 cm accounted for around 81% of those producing more than 1.5 t/ha, while 19% were farmers with no water and producing under rainfed conditions. The water-saving technology adopted significantly affected yield with a p-value of 0.00000. Indeed, growers who opted for AWD represented more than 76.2% of rice growers who obtained more than the overall average yield (1.5 t/ha). Among those who obtained 1.5 t/ha, 86% felt that water saving could be implemented through the realization of rice paddocks. Among growers who obtained 1.5 t/ha, those who felt that excess irrigation water reduced the efficiency of fertilizer use accounted for over 76%. In addition, 33% and 38% respectively felt that fertilizer use efficiency could be improved by applying the recommended doses and appropriate practices.

4. Discussion

4.1. Socio-Demographic Features

Similar to small-scale irrigation schemes in Ethiopia [28] and Kenya [29], female accounted for 50% of male in irrigated fields in Togo. On the other hand, the proportion of female was higher in Togo than in Iran and Japan, where male represented 100% [30] and 97.5% [31] respectively. In comparison to lowland rice farming, where women represented 15% of male [32], the female rate in irrigation schemes was higher (32%), due to policies to promote women's access to irrigated lands. The mean age of rice farmers in Togo's irrigated schemes was 44.5 years, in the same range as the findings of Ojo, et al. [33], Kadipo, et al. [29] and Sharifzadeh and Abdollahzadeh [30] who found respectively that the mean age of farmers was 47 years in Nigeria, 41 years in Kenya and 45.7 years in Iran. According to Faysse, et al. [34], the low rate of rice farmers younger than 27 years of age (7%) in Togo was similar to the youth rate in Thailand irrigated farms due to the unattractiveness of rice farming to young farmers. The uneducated farmers proportion in Togo (19.4%) was higher than 2.9%, while the university graduates rate (3.6%) was lower in Togo than 7.7% in Indonesia [35]. In the same way, Prasetyo, et al. [36] showed that in Indonesia, the elementary school education rate is lower than in Togo, while the JHS and SHS education rates are higher (48.1% and 23.1% vs. 30.2% and 9.4%). However, the 87% rate of rice producers with JSH level or less was close to the 90% rate reported by Haneishi [37] in sub-Saharan Africa. The low level of education among farmers could be a constraint to the innovative rice-growing practices adoption.
Married rice farmers represented 85%, similarly close to 80% in Nigeria [33], but less than 95% in Japan [31]. The rice growers in irrigation systems in Togo possessed 9 years' experience in rice production farming. Compared to Nigerian and Japanese rice producers with experience of 15 years [33] and 26 years [31] respectively, Togolese farmers were less experienced. Meanwhile, rice farmers on irrigated schemes have more experience of rice production than their Kenyan counterparts, whose average experience is 7 years [29]. According to Zhou, et al. [38], farmers' level of education and farming experience have contributed to improving the irrigation water use-efficiency.
In addition, the agricultural credit access rate for Togolese rice farmers was 36%. This rate was similar to 37% reported by Kadipo et al. [29] in Kenya and 36% demonstrated by Angella, et al. [39] in Uganda. Nevertheless, compared with Nigeria and Japan, where the rate of access to agricultural credit was 57% [33] and 92% [31] respectively, the rate of access to agricultural credit was low in Togo. Members of a rice-growers' cooperative accounted for over 82.4% of respondents. This rate was higher than the Membership in local farmers' association rate (45.7%) reported in Japan by Oo and Usami [31]. The policy of promoting and supporting farmers' cooperatives, and especially membership of a cooperative, a condition before obtaining a plot on irrigated fields in Togo, may explain the high rate of cooperative member rice producers. Land-owning rice farmers are in the minority in Togo, constituting one tenth. By contrast, landowners counted for a third of producers in Bangladesh [40], 45% in Indonesia [41] and 65% in the Philippines [42]. This insecure land tenure situation could compromise the implementation of good agronomic and irrigation water management practices. According to Koirala, et al. [42], land ownership had a significant influence on technical efficiency, as farmers who rented land showed higher technical inefficiency. Agriculture was the sole source of income for over 62% of rice farmers in Togo. Compared to Bangladesh, this rate was twice as high for producers (32%) whose sole source of income was agriculture [40].

4.2. Agronomic and Irrigation Practices

The higher rate of farmers trained in good rice production practices (61%) in Togo compared to 44.5% in Japan [31]. Nevertheless, this rate was lower than that of farmers trained (76.7%) in rice production and soil and water conservation in Uganda [39]. The rate of rice farmers using herbicides in irrigation schemes in Togo (96%) was substantially higher than the average in Togo (57%) and in sub-Saharan Africa, where 44% of farmers use herbicides in irrigated fields [43]. Moreover, this rate of producers using herbicides on rice fields corroborates with the 93% rate recorded in Ghana by Obiri, et al. [44]. According to previous studies, the herbicides use was ever-increasing due to a farm labor lack [44,45,44]. The consequences included the resistance development in some species of weeds [46], deterioration of fauna, flora, soil fertility, groundwater and surface water quality, and producers' health [44,48].
Young rice growers on Togolese irrigated schemes preferred motorized ploughing and mudding because, according to Liu, et al. [49], young rice growers were more susceptible to adopting the technologies evaluated. Furthermore, the fact that rice growers belonging to an agricultural cooperative benefiting from agricultural extension services improved the rate of adoption of innovative technologies [49,50], which justified the cooperative members' preference for motorized ploughing and mudding. Moreover, members of agricultural cooperatives got easy access to agricultural machinery for ploughing and mudding, due to the promoting producer cooperative policy. In the same way, the low investment capacity of rice farmers justified the positive impact of access to agricultural credit on access to agricultural machinery for ploughing and mudding.
The high rate of rice transplanting was due to the SRI extension, requiring transplanting, on irrigated fields, while in lowland rainfed rice cultivation, the rate of transplanting was 14% [32]. According to et al. [32], transplanting required additional knowledge and work (therefore more labor and financial resources), which would explain the low rate of women transplanting and the high rates of trained producers with agricultural credit adopting transplanting. In addition, the introduction of transplanting into rice-growing systems in Togo was recent, which would explain its adoption by trained growers and young rice growers, and the reticence shown by older farmers.
The 5-15 cm water depth above the soil adopted by more than half the rice growers on irrigated schemes was similar to the 8-15 cm water depth maintained by continuous flooding in Mississippi [51]. This approach was due to a lack of access to extension services for good irrigation practices, insufficient training in water management, and ignorance of water-saving irrigation methods for rice cultivation. In fact, only 5% of rice farmers had accessed irrigation extension services, whereas the rate of access to irrigation services in Ghana and Benin was 38% [52] and 94%[53] respectively.
Additionally, rice farmers' perceptions of water productivity, water use efficiency, irrigation water saving methods, irrigation timing and quantity, potential risks associated with drainage water use, soil salinity, fertilizer use efficiency, etc. show that rice farmers' knowledge of irrigation water management and agronomic practices is very low. Nevertheless, over 70% of trained rice farmers have an acceptable knowledge of effective fertilizer management in rice cultivation. This confirmed that the main reason for poor performance is the lack of training for irrigation managers [38].

4.3. Grain Yields of Paddy Rice in Irrigated Fields

4.3.1. Socio-Economic Characteristics Impact on Paddy Rice Yields

Rice growers whose exclusive income source was agriculture took great care in their farming activities, which explains the higher yields obtained compared to producers with other off-farm income sources. The findings corroborate previous research [54,55] which demonstrated that off-farm activities negatively affected farmers' technical efficiency. Nonetheless, other authors found that off-farm income-generating activities significantly improved rice yields [56,57,58,59]. Compared with producers employing household labor, the sharecroppers use revealed a professional and economic character to agricultural production, justifying the high yields achieved by farmers using sharecroppers. Even though previous studies demonstrated that agricultural credit improved paddy rice yields in Kenya, Benin and Bangladesh [60,61,62], the results highlighted that the majority of rice farmers who accessed credit failed to achieve good yields. These findings corroborate the studies carried out in Tanzania by Nakano and Magezi [63] and in Togo by Agbodji and Johnson [64], who demonstrated that agricultural credit was not sufficient to improve rice productivity.
In fact, farmers sometimes use agricultural credit for other social needs or non-farming activities, and only a very small part of it is devoted to agriculture. The administrative formalities involved in granting credit were time-consuming, and credit arrived late after the start of the agricultural season. For this reason, Anang, et al. [65] felt that credit should be targeted at good farmers needing to improve their production through external financing. The results showed that the more experienced rice farmers (over 15 years) achieved low yields compared with the medium (6 - 11 years) and low (less than 5 years) experienced farmers. This may be due to the reluctance of older farmers to adopt agricultural innovations, as well as to their reduced physical strength. However, these results contradicted the findings of Adedoyin, et al. [66] who found that more experienced rice growers had better yields compared to less experienced growers.

4.3.2. Farming Practices and Irrigation Management Effects on Paddy Rice Yields

Chemical and mechanical clearing ensured that the plots were well completely devoid of stumps before ploughing, which explains the good yields on these plots types compared with others. Compared with tiller ploughing, zero-till gave lower paddy yields. The results corroborate earlier studies which found that zero-tillage had no significant effect on rice yields in China [67], but rather reduced rice yields compared with conventional tillage [68]. Indeed, zero-tillage reduced nitrogen uptake and nitrogen use-efficiency [68], which would explain this poor performance. On the other hand, Alam, et al. [69] proved that zero tillage combined with certain good practices brought good rice yields compared with transplanting. In addition, Cheboi, et al. [70] showed that compared with conventional ploughing, shallow hand hoe ploughing induced high paddy yields because tractor ploughing was deep and displaced fertile soil at depth, leaving it unavailable for rice growth [71,72]. According to et al. [70], manual tilling improved irrigation water use-efficiency.
In contrast to ploughing, manual mudding and zero-muddling induced high paddy yields because tiller muddling would accentuate drainage and consequently leaching losses of fertilizers. These results corroborate the findings reported by Kalita, et al. [73], who concluded that mudding with a power tiller reduced paddy yields. Minimizing tillage farming in general helped to reduce the additional water use in land preparation [45]. However, in China and India, the research carried out Wang, et al. [74] showed that the agricultural machinery use improved yields.
According to the results, transplanting, despite its high water and labor requirements compared with direct seeding [75,76], induced higher rice yields. Some authors [77] showed that transplanting improved yields compared with direct seeding, and for others [78], direct seeding and transplanting induced significant yield similarities. However, other authors [79,80] found that direct seeding improved paddy yields more than transplanting. The densities of plants with the highest yields were 33.3 hills m-2 (15 cm x 20 cm) and 25 hills m-2 (20 cm x 20 cm) respectively. This trend of improving paddy rice yields with plant density was similar to the studies carried out by Alipour and Mobasser [81], who showed that the 30 cm x 10 cm (33.3 hills m-2) cropping pattern provided a higher yield than the 20 cm x 20 cm (25 hills m-2) cropping pattern, which also induced a higher yield than the 25 cm x 25 cm (16 hills m-2) cropping pattern. Abduh, et al. [82] also demonstrated that the 25 cm x 12.5 cm (32 hills m-2) cropping pattern was more productive than the 25 cm x 25 cm (16 hills m-2) cropping pattern. Therefore, the 25 cm x 25 cm cropping pattern being widely promoted in irrigation schemes was less efficient. However, , Murugesan, et al. [83] showed that yields obtained under the 25 cm x 25 cm and 30 cm x 10 cm cropping patterns were equivalent. On the other hand, Chadhar, et al. [84] thought that the 25 cm × 25 cm cropping pattern was ideal for rice production, as its reduction or increase would cause a considerable drop in paddy yield.
Respondents' answers showed that applying N15P15K15 fertilizer and 46% urea less than two weeks after sowing was ineffective. This would be due to the fact that before this period, the root system of young rice seedlings was not yet fixed for efficient nutrient uptake. Furthermore, as the irrigation method was flooding, mineral fertilizers can be lost through percolation before being used by the crops. In the other hand, in rainfed lowland rice, applying N15P15K15 mineral fertilizer as a basal fertilizer before sowing proved effective [32].
On-demand water distribution was more successful than rotational or continuous distribution. In fact, on-demand water distribution means that water can be supplied at the grower's request, i.e. at the right time and in the right quantity. On the other way, with rotational distribution, the grower is obliged to wait for his turn, even if he was in need, while with continuous distribution, water supply and other agricultural operations were difficult to control on rice field. The water depth above soil after irrigation was less than 5 cm, enabling high yields to be achieved. According to Afifah, et al. [85], water depths between 1 - 5 cm produced statistically similar yields. Furthermore, Sosiawan and Annisa [86] revealed an underperformance of shallow irrigation (3 - 5 cm) compared to deep irrigation (˃ 7 cm) in terms of paddy yields. In contrast, Chandra, et al. [87] recommended 2-5 cm flooding for high yields. Also, growers adopting the AWD water-saving method were more productive as argued by some authors [88-91].

5. Conclusions

In this research paper, the perceptions of rice growers in irrigated fields regarding agronomic practices and irrigation water management were assessed. Farmers' perceptions express their choices in terms of agronomic and irrigation practices. The socio-economic characteristics of growers influencing these choices were also studied. In the same way, the effect of respondents' socio-demographic profiles and agricultural and irrigation practices on paddy rice yields was also evaluated. The results revealed that farmer training in irrigated rice production and non-household farm labor use were positive for good farming and irrigation practices adoption, and hence high yields. In contrast, rice grower's experience, off-farm activities and access to agricultural credit negatively affected yields. Chemical combined mechanical clearing, tiller ploughing, transplanting, high plant densities and required doses of fertilizer applying at the convenient times were some of the farming practices that helped improve yields. On the contrary, tiller mudding was counter-productive. Furthermore, on-demand water distribution, above-soil water depth, water-saving strategies and knowledge of efficient water and fertilizer management methods were also irrigation practices that boosted yields. In view of these results, the study suggested that research should focus on training strategies covering as many producers as possible. In the same way, the real causes of the under-performance of agricultural credit and tiller mudding must be analyzed with a view to sustainable rice production, as agriculture modernization cannot be effective without farm machinery and access to agricultural credit.

Author Contributions

conceptualisation, A.A., I.K.D, A.G.S. and A.R.N.; questionnaire drafting, A.A.; correcting and validating the questionnaire, I.K.D, A.G.S. and A.R.N.; sampling and data collection, A.A.; analyzing and interpreting data, A.A., I.K.D, A.G.S. and A.R.N.; manuscript drafting, A.A.; comments and validation of draft manuscript, I.K.D, A.G.S. and A.R.N. The authors reviewed and approved the manuscript version submitted for publication.

Funding

Principal author A.A. is a West African Center for Water, Irrigation and Sustainable Agriculture (WACWISA) scholar, University for Development Studies, P. O. Box TL 1882, Tamale, Ghana.

Data Availability Statement

The data collected and analyzed are available and can be provided on request from the corresponding author.

Acknowledgments

The authors would like to express their deep gratitude to WACWISA/UDS for granting a PhD scholarship to Mr. Alfassassi AROUNA. They are also grateful to Mr. Adjiwanou ATIGLO-GBENOU, lecturer at the University of Lomé, who provided financial assistance for data collection. Thanks are also due to Prof Koffi DJAMAN, Associate Professor, New Mexico State University, for his encouragement and scientific support. Finally, the authors express special gratitude to the rice farmers interviewed, to the heads of the agricultural extension service agencies for their support, and to the director general of the agricultural extension service for authorizing these surveys on irrigated fields.

Conflicts of Interest

This article presents no conflict of interest and may be published

References

  1. Sarwar, N.; Ahmad, S.; Khan, M.A.; Hasanuzzaman, M. World Rice Production: An Overview. Modern Techniques of Rice Crop Production 2022, 3-12.
  2. Kumar, A.; Sengar, R.; Pathak, R.K.; Singh, A.K. Integrated approaches to develop drought-tolerant rice: Demand of era for global food security. Journal of Plant Growth Regulation 2023, 42, 96-120. [CrossRef]
  3. Nawaz, A.; Rehman, A.U.; Rehman, A.; Ahmad, S.; Siddique, K.H.; Farooq, M. Increasing sustainability for rice production systems. Journal of Cereal Science 2022, 103, 103400. [CrossRef]
  4. Gunasekaran, A.; Seshadri, G.; Ramasamy, S.; Muthurajan, R.; Karuppasamy, K.S. Identification of Newer Stable Genetic Sources for High Grain Number per Panicle and Understanding the Gene Action for Important Panicle Traits in Rice. Plants 2023, 12, 250. [CrossRef]
  5. Ijachi, C.; Sennuga, S.O.; Bankole, O.-L.; Okpala, E.F.; Preyor, T.J. Assessment of climate variability an d effective coping strategies used by rice farmers in Abuja, Nigeria. International Journal of Agriculture and Food Science 2023, 5, 137-143. [CrossRef]
  6. Simkhada, K.; Thapa, R. Rice blast, a major threat to the rice production and its various management techniques. Turkish Journal of Agriculture-Food Science and Technology 2022, 10, 147-157. [CrossRef]
  7. Ladha, J.K.; Radanielson, A.M.; Rutkoski, J.E.; Buresh, R.J.; Dobermann, A.; Angeles, O.; Pabuayon, I.L.B.; Santos-Medellín, C.; Fritsche-Neto, R.; Chivenge, P. Steady agronomic and genetic interventions are essential for sustaining productivity in intensive rice cropping. Proceedings of the National Academy of Sciences 2021, 118, e2110807118. [CrossRef]
  8. Shekhawat, K.; Rathore, S.S.; Chauhan, B.S. Weed management in dry direct-seeded rice: A review on challenges and opportunities for sustainable rice production. Agronomy 2020, 10, 1264. [CrossRef]
  9. Saha, S.; Munda, S.; Singh, S.; Kumar, V.; Jangde, H.K.; Mahapatra, A.; Chauhan, B.S. Crop establishment and weed control options for sustaining dry direct seeded rice production in eastern India. Agronomy 2021, 11, 389. [CrossRef]
  10. Schneider, P.; Asch, F. Rice production and food security in Asian Mega deltas—A review on characteristics, vulnerabilities and agricultural adaptation options to cope with climate change. Journal of Agronomy and Crop Science 2020, 206, 491-503. [CrossRef]
  11. Kumar, N.; Chhokar, R.; Meena, R.; Kharub, A.; Gill, S.; Tripathi, S.; Gupta, O.; Mangrauthia, S.; Sundaram, R.; Sawant, C. Challenges and opportunities in productivity and sustainability of rice cultivation system: a critical review in Indian perspective. Cereal Research Communications 2021, 1-29. [CrossRef]
  12. Ibrahim, A.; Saito, K.; Bado, V.B.; Wopereis, M.C. Thirty years of agronomy research for development in irrigated rice-based cropping systems in the West African Sahel: Achievements and perspectives. Field Crops Research 2021, 266, 108149. [CrossRef]
  13. Jin, W.; Cao, W.; Liang, F.; Wen, Y.; Wang, F.; Dong, Z.; Song, H. Water management impact on denitrifier community and denitrification activity in a paddy soil at different growth stages of rice. Agricultural Water Management 2020, 241, 106354. [CrossRef]
  14. Fu, J.; Wang, C.; Adalibieke, W.; Jian, Y.; Bo, Y.; Cui, X.; Zhou, F. Declines in nutrient losses from China’s rice paddies jointly driven by fertilizer application and extreme rainfall. Agriculture, Ecosystems & Environment 2023, 353, 108537. [CrossRef]
  15. Alam, M.S.; Khanam, M.; Rahman, M.M. Environment-friendly nitrogen management practices in wetland paddy cultivation. Frontiers in Sustainable Food Systems 2023, 7, 1020570. [CrossRef]
  16. Liu, L.; Ouyang, W.; Wang, Y.; Lian, Z.; Pan, J.; Liu, H.; Chen, J.; Niu, S. Paddy water managements for diffuse nitrogen and phosphorus pollution control in China: A comprehensive review and emerging prospects. Agricultural Water Management 2023, 277, 108102. [CrossRef]
  17. Wang, Y.; Li, Y.; Liu, F.; Li, Y.; Song, L.; Li, H.; Meng, C.; Wu, J. Linking rice agriculture to nutrient chemical composition, concentration and mass flux in catchment streams in subtropical central China. Agriculture, ecosystems & environment 2014, 184, 9-20. [CrossRef]
  18. Fu, J.; Jian, Y.; Wu, Y.; Chen, D.; Zhao, X.; Ma, Y.; Niu, S.; Wang, Y.; Zhang, F.; Xu, C. Nationwide estimates of nitrogen and phosphorus losses via runoff from rice paddies using data-constrained model simulations. Journal of cleaner production 2021, 279, 123642. [CrossRef]
  19. Wang, Y.; Chen, J.; Sun, Y.; Jiao, Y.; Yang, Y.; Yuan, X.; Lærke, P.E.; Wu, Q.; Chi, D. Zeolite reduces N leaching and runoff loss while increasing rice yields under alternate wetting and drying irrigation regime. Agricultural Water Management 2023, 277, 108130. [CrossRef]
  20. Carrijo, D.R.; Lundy, M.E.; Linquist, B.A. Rice yields and water use under alternate wetting and drying irrigation: A meta-analysis. Field Crops Research 2017, 203, 173-180. [CrossRef]
  21. Djaman, K.; Mel, V.C.; Diop, L.; Sow, A.; El-Namaky, R.; Manneh, B.; Saito, K.; Futakuchi, K.; Irmak, S. Effects of alternate wetting and drying irrigation regime and nitrogen fertilizer on yield and nitrogen use efficiency of irrigated rice in the Sahel. Water 2018, 10, 711. [CrossRef]
  22. Leon, A.; Kohyama, K. Estimating nitrogen and phosphorus losses from lowland paddy rice fields during cropping seasons and its application for life cycle assessment. Journal of Cleaner Production 2017, 164, 963-979. [CrossRef]
  23. Achichi, C.; Sennuga, S.O.; Osho-Lagunju, B.; Alabuja, F. Effect of Farmers' Socioeconomic Characteristics on Access to Agricultural Information in Gwagwalada Area Council, Abuja. Discoveries in Agriculture and Food Sciences 2023, 10, 28-47. [CrossRef]
  24. Ismael, F.; Mbanze, A.A.; Ndayiragije, A.; Fangueiro, D. Understanding the dynamic of rice farming systems in southern mozambique to improve production and benefits to smallholders. Agronomy 2021, 11, 1018. [CrossRef]
  25. MERF. Stratégie et Plan d’Action National pour la Biodiversité du Togo (SPANB 2011-2020); Ministère de l'environnement et des ressources forestières: 2014; p. 174.
  26. Musumba, M.; Grabowski, P.; Palm, C.; Snapp, S. Guide for the Sustainable Intensification Assessment Framework. 2007, 46.
  27. Chinasho, A.; Bedadi, B.; Lemma, T.; Tana, T.; Hordofa, T.; Elias, B. Farmers’ perceptions about irrigation roles in climate change adaptation and determinants of the choices to WUE-improving practices in southern Ethiopia. Air, Soil and Water Research 2022, 15, 11786221221092454. [CrossRef]
  28. Assefa, E.; Ayalew, Z.; Mohammed, H. Impact of small-scale irrigation schemes on farmers livelihood, the case of Mekdela Woreda, North-East Ethiopia. Cogent Economics & Finance 2022, 10, 2041259. [CrossRef]
  29. Kadipo Kaloi, F.; Isaboke, H.N.; Onyari, C.N.; Njeru, L.K. Determinants influencing the adoption of rice intensification system among smallholders in mwea irrigation scheme, Kenya. Advances in Agriculture 2021, 2021, 1-8. [CrossRef]
  30. Sharifzadeh, M.S.; Abdollahzadeh, G. The impact of different education strategies on rice farmers’ knowledge, attitude and practice (KAP) about pesticide use. Journal of the Saudi Society of Agricultural Sciences 2021, 20, 312-323. [CrossRef]
  31. Oo, S.P.; Usami, K. Farmers’ perception of good agricultural practices in rice production in Myanmar: A case study of Myaungmya District, Ayeyarwady Region. Agriculture 2020, 10, 249. [CrossRef]
  32. Arouna, A.; Gbenou, A.A.; M’boumba, E.B.; Badabake, S.M. Effects of Sowing Methods on Paddy Rice Yields and Milled Rice Quality in Rainfed Lowland Rice in Wet Savannah, Togo. American Journal of Agricultural Science, Engineering, and Technology 2023, 7, 7-15. [CrossRef]
  33. Ojo, T.O.; Baiyegunhi, L.J.; Adetoro, A.A.; Ogundeji, A.A. Adoption of soil and water conservation technology and its effect on the productivity of smallholder rice farmers in Southwest Nigeria. Heliyon 2021, 7. [CrossRef]
  34. Faysse, N.; Aguilhon, L.; Phiboon, K.; Purotaganon, M. Mainly farming… but what's next? The future of irrigated farms in Thailand. Journal of Rural Studies 2020, 73, 68-76.
  35. Rozaki, Z.; Triyono; Indardi; Salassa, D.I.; Nugroho, R.B. Farmers’ responses to organic rice farming in Indonesia: Findings from central Java and south Sulawesi. Open Agriculture 2020, 5, 703-710. [CrossRef]
  36. Prasetyo, H.; Karmiyati, D.; Setyobudi, R.H.; Fauzi, A.; Pakarti, T.A.; Susanti, M.S.; Khan, W.A.; Neimane, L.; Mel, M. Local rice farmers’ attitude and behavior towards agricultural programs and policies. Pakistan Journal of Agricultural Research 2022, 35, 663-677. [CrossRef]
  37. Haneishi, Y. Rice in Uganda: Production Structure and Contribution to Household Income Generation and Stability. Graduate School of Horticulture, Chiba University 2014.
  38. Zhou, Q.; Deng, X.; Wu, F.; Li, Z.; Song, W. Participatory irrigation management and irrigation water use efficiency in maize production: evidence from Zhangye City, Northwestern China. Water 2017, 9, 822. [CrossRef]
  39. Angella, N.; Dick, S.; Fred, B. Willingness to pay for irrigation water and its determinants among rice farmers at Doho Rice Irrigation Scheme (DRIS) in Uganda. Journal of Development and Agricultural Economics 2014, 6, 345-355.
  40. Moon, N.N.; Hossain, M.E.; Khan, M.A.; Rahman, M.A.; Saha, S.M. Land tenure system and its effect on productivity, profitability and efficiency of boro rice production in northern part of Bangladesh. Turkish Journal of Agriculture-Food Science and Technology 2020, 8, 2433-2440. [CrossRef]
  41. Djanggola, A.R.; Basir, M.; Anam, H.; Ichwan, M. Rainfed and Irrigated Rice Farmers Profiles: A Case Study from Banggai, Indonesia. Age 2021, 25, 2.
  42. Koirala, K.H.; Mishra, A.; Mohanty, S. Impact of land ownership on productivity and efficiency of rice farmers: The case of the Philippines. Land use policy 2016, 50, 371-378. [CrossRef]
  43. Rodenburg, J.; Johnson, J.-M.; Dieng, I.; Senthilkumar, K.; Vandamme, E.; Akakpo, C.; Allarangaye, M.D.; Baggie, I.; Bakare, S.O.; Bam, R.K. Status quo of chemical weed control in rice in sub-Saharan Africa. Food Security 2019, 11, 69-92. [CrossRef]
  44. Obiri, B.; Obeng, E.; Oduro, K.; Apetorgbor, M.; Peprah, T.; Duah-Gyamfi, A.; Mensah, J. Farmers’ perceptions of herbicide usage in forest landscape restoration programs in Ghana. Scientific African 2021, 11, e00672. [CrossRef]
  45. Peterson, M.A.; Collavo, A.; Ovejero, R.; Shivrain, V.; Walsh, M.J. The challenge of herbicide resistance around the world: a current summary. Pest management science 2018, 74, 2246-2259. [CrossRef]
  46. Bouwman, T.; Andersson, J.; Giller, K. Herbicide induced hunger? Conservation Agriculture, ganyu labour and rural poverty in Central Malawi. The Journal of Development Studies 2021, 57, 244-263. [CrossRef]
  47. Ofosu, R.; Agyemang, E.D.; Márton, A.; Pásztor, G.; Taller, J.; Kazinczi, G. Herbicide resistance: managing weeds in a changing world. Agronomy 2023, 13, 1595. [CrossRef]
  48. Tyohemba, R.L.; Pillay, L.; Humphries, M.S. Bioaccumulation of current-use herbicides in fish from a global biodiversity hotspot: Lake St Lucia, South Africa. Chemosphere 2021, 284, 131407. [CrossRef]
  49. Liu, Y.; Ruiz-Menjivar, J.; Zhang, L.; Zhang, J.; Swisher, M.E. Technical training and rice farmers’ adoption of low-carbon management practices: The case of soil testing and formulated fertilization technologies in Hubei, China. Journal of Cleaner Production 2019, 226, 454-462. [CrossRef]
  50. Wossen, T.; Abdoulaye, T.; Alene, A.; Haile, M.G.; Feleke, S.; Olanrewaju, A.; Manyong, V. Impacts of extension access and cooperative membership on technology adoption and household welfare. Journal of rural studies 2017, 54, 223-233. [CrossRef]
  51. Massey, J.H.; Walker, T.W.; Anders, M.M.; Smith, M.C.; Avila, L.A. Farmer adaptation of intermittent flooding using multiple-inlet rice irrigation in Mississippi. Agricultural Water Management 2014, 146, 297-304. [CrossRef]
  52. Emmanuel, D.; Owusu-Sekyere, E.; Owusu, V.; Jordaan, H. Impact of agricultural extension service on adoption of chemical fertilizer: Implications for rice productivity and development in Ghana. NJAS: wageningen journal of life sciences 2016, 79, 41-49. [CrossRef]
  53. Nonvide, G.M.A. A re-examination of the impact of irrigation on rice production in Benin: An application of the endogenous switching model. Kasetsart Journal of Social Sciences 2019, 40, 657-662. [CrossRef]
  54. Maligalig, R.; Demont, M.; Umberger, W.J.; Peralta, A. Off-farm employment increases women's empowerment: Evidence from rice farms in the Philippines. Journal of Rural Studies 2019, 71, 62-72. [CrossRef]
  55. Onyenekwe, S.; Okorji, E. Effects of off-farm work on the technical efficiency of rice farmers in Enugu state, Nigeria. Journal of Agricultural Economics and Development 2015, 4, 044-050.
  56. Nehring, R. The Impacts of Off-Farm Income on Farm Efficiency, Scale, and Profitability Rice Farms. 2015.
  57. Ahmed, M.H.; Melesse, K.A. Impact of off-farm activities on technical efficiency: evidence from maize producers of eastern Ethiopia. Agricultural and Food Economics 2018, 6, 1-15. [CrossRef]
  58. Anang, B.T. Effect of non-farm work on agricultural productivity: Empirical evidence from northern Ghana; 9292562622; WIDER working paper: 2017. [CrossRef]
  59. Anang, B.T.; Nkrumah-Ennin, K.; Nyaaba, J.A. Does off-farm work improve farm income? Empirical evidence from Tolon district in northern Ghana. Advances in Agriculture 2020, 2020, 1-8. [CrossRef]
  60. Njeru, T.N.; Mano, Y.; Otsuka, K. Role of access to credit in rice production in sub-Saharan Africa: The case of Mwea irrigation scheme in Kenya. Journal of African Economies 2016, 25, 300-321. [CrossRef]
  61. Nonvide, G.M.A. Effect of adoption of irrigation on rice yield in the municipality of Malanville, Benin. African Development Review 2017, 29, 109-120. [CrossRef]
  62. Jimi, N.A.; Nikolov, P.V.; Malek, M.A.; Kumbhakar, S. The effects of access to credit on productivity: separating technological changes from changes in technical efficiency. Journal of Productivity Analysis 2019, 52, 37-55. [CrossRef]
  63. Nakano, Y.; Magezi, E.F. The impact of microcredit on agricultural technology adoption and productivity: Evidence from randomized control trial in Tanzania. World Development 2020, 133, 104997. [CrossRef]
  64. Agbodji, A.E.; Johnson, A.A. Agricultural credit and its impact on the productivity of certain cereals in Togo. Emerging Markets Finance and Trade 2021, 57, 3320-3336. [CrossRef]
  65. Anang, B.T.; Bäckman, S.; Sipiläinen, T. Agricultural microcredit and technical efficiency: The case of smallholder rice farmers in Northern Ghana. Journal of Agriculture and Rural Development in the Tropics and Subtropics (JARTS) 2016, 117, 189-202.
  66. Adedoyin, A.O.; Shamsudin, M.N.; Radam, A.; AbdLatif, I. Effect of improved high yielding rice variety on farmers productivity in Mada, Malaysia. Int J Agric Sic Vet Med 2016, 4, 39-52.
  67. Huang, M.; Zhou, X.; Cao, F.; Xia, B.; Zou, Y. No-tillage effect on rice yield in China: A meta-analysis. Field Crops Research 2015, 183, 126-137. [CrossRef]
  68. Liang, X.; Zhang, H.; He, M.; Yuan, J.; Xu, L.; Tian, G. No-tillage effects on grain yield, N use efficiency, and nutrient runoff losses in paddy fields. Environmental Science and Pollution Research 2016, 23, 21451-21459. [CrossRef]
  69. Alam, M.K.; Islam, M.M.; Salahin, N.; Hasanuzzaman, M. Effect of tillage practices on soil properties and crop productivity in wheat-mungbean-rice cropping system under subtropical climatic conditions. The scientific world journal 2014, 2014. [CrossRef]
  70. Cheboi, P.K.; Siddiqui, S.A.; Onyando, J.; Kiptum, C.K.; Heinz, V. Effect of ploughing techniques on water use and yield of rice in maugo small-holder irrigation scheme, Kenya. AgriEngineering 2021, 3. [CrossRef]
  71. Zingore, S.; Wairegi, L.; Ndiaye, M.K. Guide pour la gestion des systèmes de culture de riz. Consortium Africain pour la Santé des Sols, Nairobi 2014.
  72. Cheboi, P.K. Water retention and yield of rice crop under different land preparation techniques in Maugo smallholder irrigation scheme, Homa Bay county, Kenya. University of Eldoret, 2021.
  73. Kalita, J.; Ahmed, P.; Baruah, N. Puddling and its effect on soil physical properties and growth of rice and post rice crops: A review. Journal of Pharmacognosy and Phytochemistry 2020, 9, 503-510.
  74. Wang, J.; Chen, K.Z.; Das Gupta, S.; Huang, Z. Is small still beautiful? A comparative study of rice farm size and productivity in China and India. China Agricultural Economic Review 2015, 7, 484-509. [CrossRef]
  75. Xu, L.; Li, X.; Wang, X.; Xiong, D.; Wang, F. Comparing the grain yields of direct-seeded and transplanted rice: A meta-analysis. Agronomy 2019, 9, 767. [CrossRef]
  76. Kaur, J.; Singh, A. Direct seeded rice: Prospects, problems/constraints and researchable issues in India. Current agriculture research Journal 2017, 5, 13. [CrossRef]
  77. Walia, U.; Walia, S.; Sidhu, A.; Nayyar, S. Productivity of direct seeded rice in relation to different dates of sowing and varieties in Central Punjab. Journal of Crop and Weed 2014, 10, 126-129.
  78. Liu, H.; Hussain, S.; Zheng, M.; Peng, S.; Huang, J.; Cui, K.; Nie, L. Dry direct-seeded rice as an alternative to transplanted-flooded rice in Central China. Agronomy for Sustainable Development 2015, 35, 285-294. [CrossRef]
  79. Bahua, M.I.; Gubali, H. Direct seed planting system and giving liquid organic fertilizer as a new method to increase rice yield and growth (Oryza sativa L.). AGRIVITA Journal of Agricultural Science 2020, 42, 68-77. [CrossRef]
  80. Tao, Y.; Chen, Q.; Peng, S.; Wang, W.; Nie, L. Lower global warming potential and higher yield of wet direct-seeded rice in Central China. Agronomy for Sustainable Development 2016, 36, 1-9. [CrossRef]
  81. Alipour Abookheili, F.; Mobasser, H.R. Effect of planting density on growth characteristics and grain yield increase in successive cultivations of two rice cultivars. Agrosystems, Geosciences & Environment 2021, 4, e20213. [CrossRef]
  82. Abduh, A.M.; Hanudin, E.; Purwanto, B.H.; Utami, S.N.H. Effect of Plant Spacing and Organic Fertilizer Doses on Methane Emission in Organic Rice Fields. Environment & Natural Resources Journal 2020, 18. [CrossRef]
  83. Murugesan, P.; SENTHIVEL, T.; NANDHAKUMAR, M. Influence of plant spacing and weed management practices on the growth and yield of paddy (oryza sativa l.). Journal of advanced studies in agricultural, biological and environmental sciences 2020, 7.
  84. Chadhar, A.R.; Nadeem, M.A.; Ali, H.H.; Safdar, M.E.; Raza, A.; Adnan, M.; Hussain, M.; Ali, L.; Kashif, M.S.; Javaid, M.M. Quantifying the impact of plant spacing and critical weed competition period on fine rice production under the system of rice intensification. 2020.
  85. Afifah, A.; Jahan, M.S.; Khairi, M.; Nozulaidi, M. Effect of various water regimes on rice production in lowland irrigation. Australian Journal of Crop Science 2015, 9, 153-159.
  86. Sosiawan, H.; Annisa, W. Yield Response and Water Productivity for Rice Growth With Several Irrigations Treatment in West Java. Sriwijaya Journal of Environment 2019, 4, 109-116. [CrossRef]
  87. Chandra, M.S.; Kumar, K.A.; Madhavi, M.; Chary, D.S. Effect of alternate wetting and drying (AWD) irrigation method on yield and economic potential of different rice (Oryza sativa L.) varieties in puddled soil. IJCS 2019, 7, 968-973.
  88. Mote, K.; Praveen Rao, V.; Ramulu, V.; Avil Kumar, K.; Uma Devi, M. Standardization of alternate wetting and drying (AWD) method of water management in lowland rice (Oryza sativa L.) for upscaling in command outlets. Irrigation and drainage 2018, 67, 166-178. [CrossRef]
  89. Ishfaq, M.; Farooq, M.; Zulfiqar, U.; Hussain, S.; Akbar, N.; Nawaz, A.; Anjum, S.A. Alternate wetting and drying: A water-saving and ecofriendly rice production system. Agricultural Water Management 2020, 241, 106363. [CrossRef]
  90. Sriphirom, P.; Chidthaisong, A.; Towprayoon, S. Effect of alternate wetting and drying water management on rice cultivation with low emissions and low water used during wet and dry season. Journal of cleaner production 2019, 223, 980-988. [CrossRef]
  91. Kumar, K.A.; Rajitha, G. Alternate wetting and drying (AWD) irrigation-a smart water saving technology for rice: a review. International Journal of Current Microbiology and Applied Sciences 2019, 8, 2561-2571. [CrossRef]
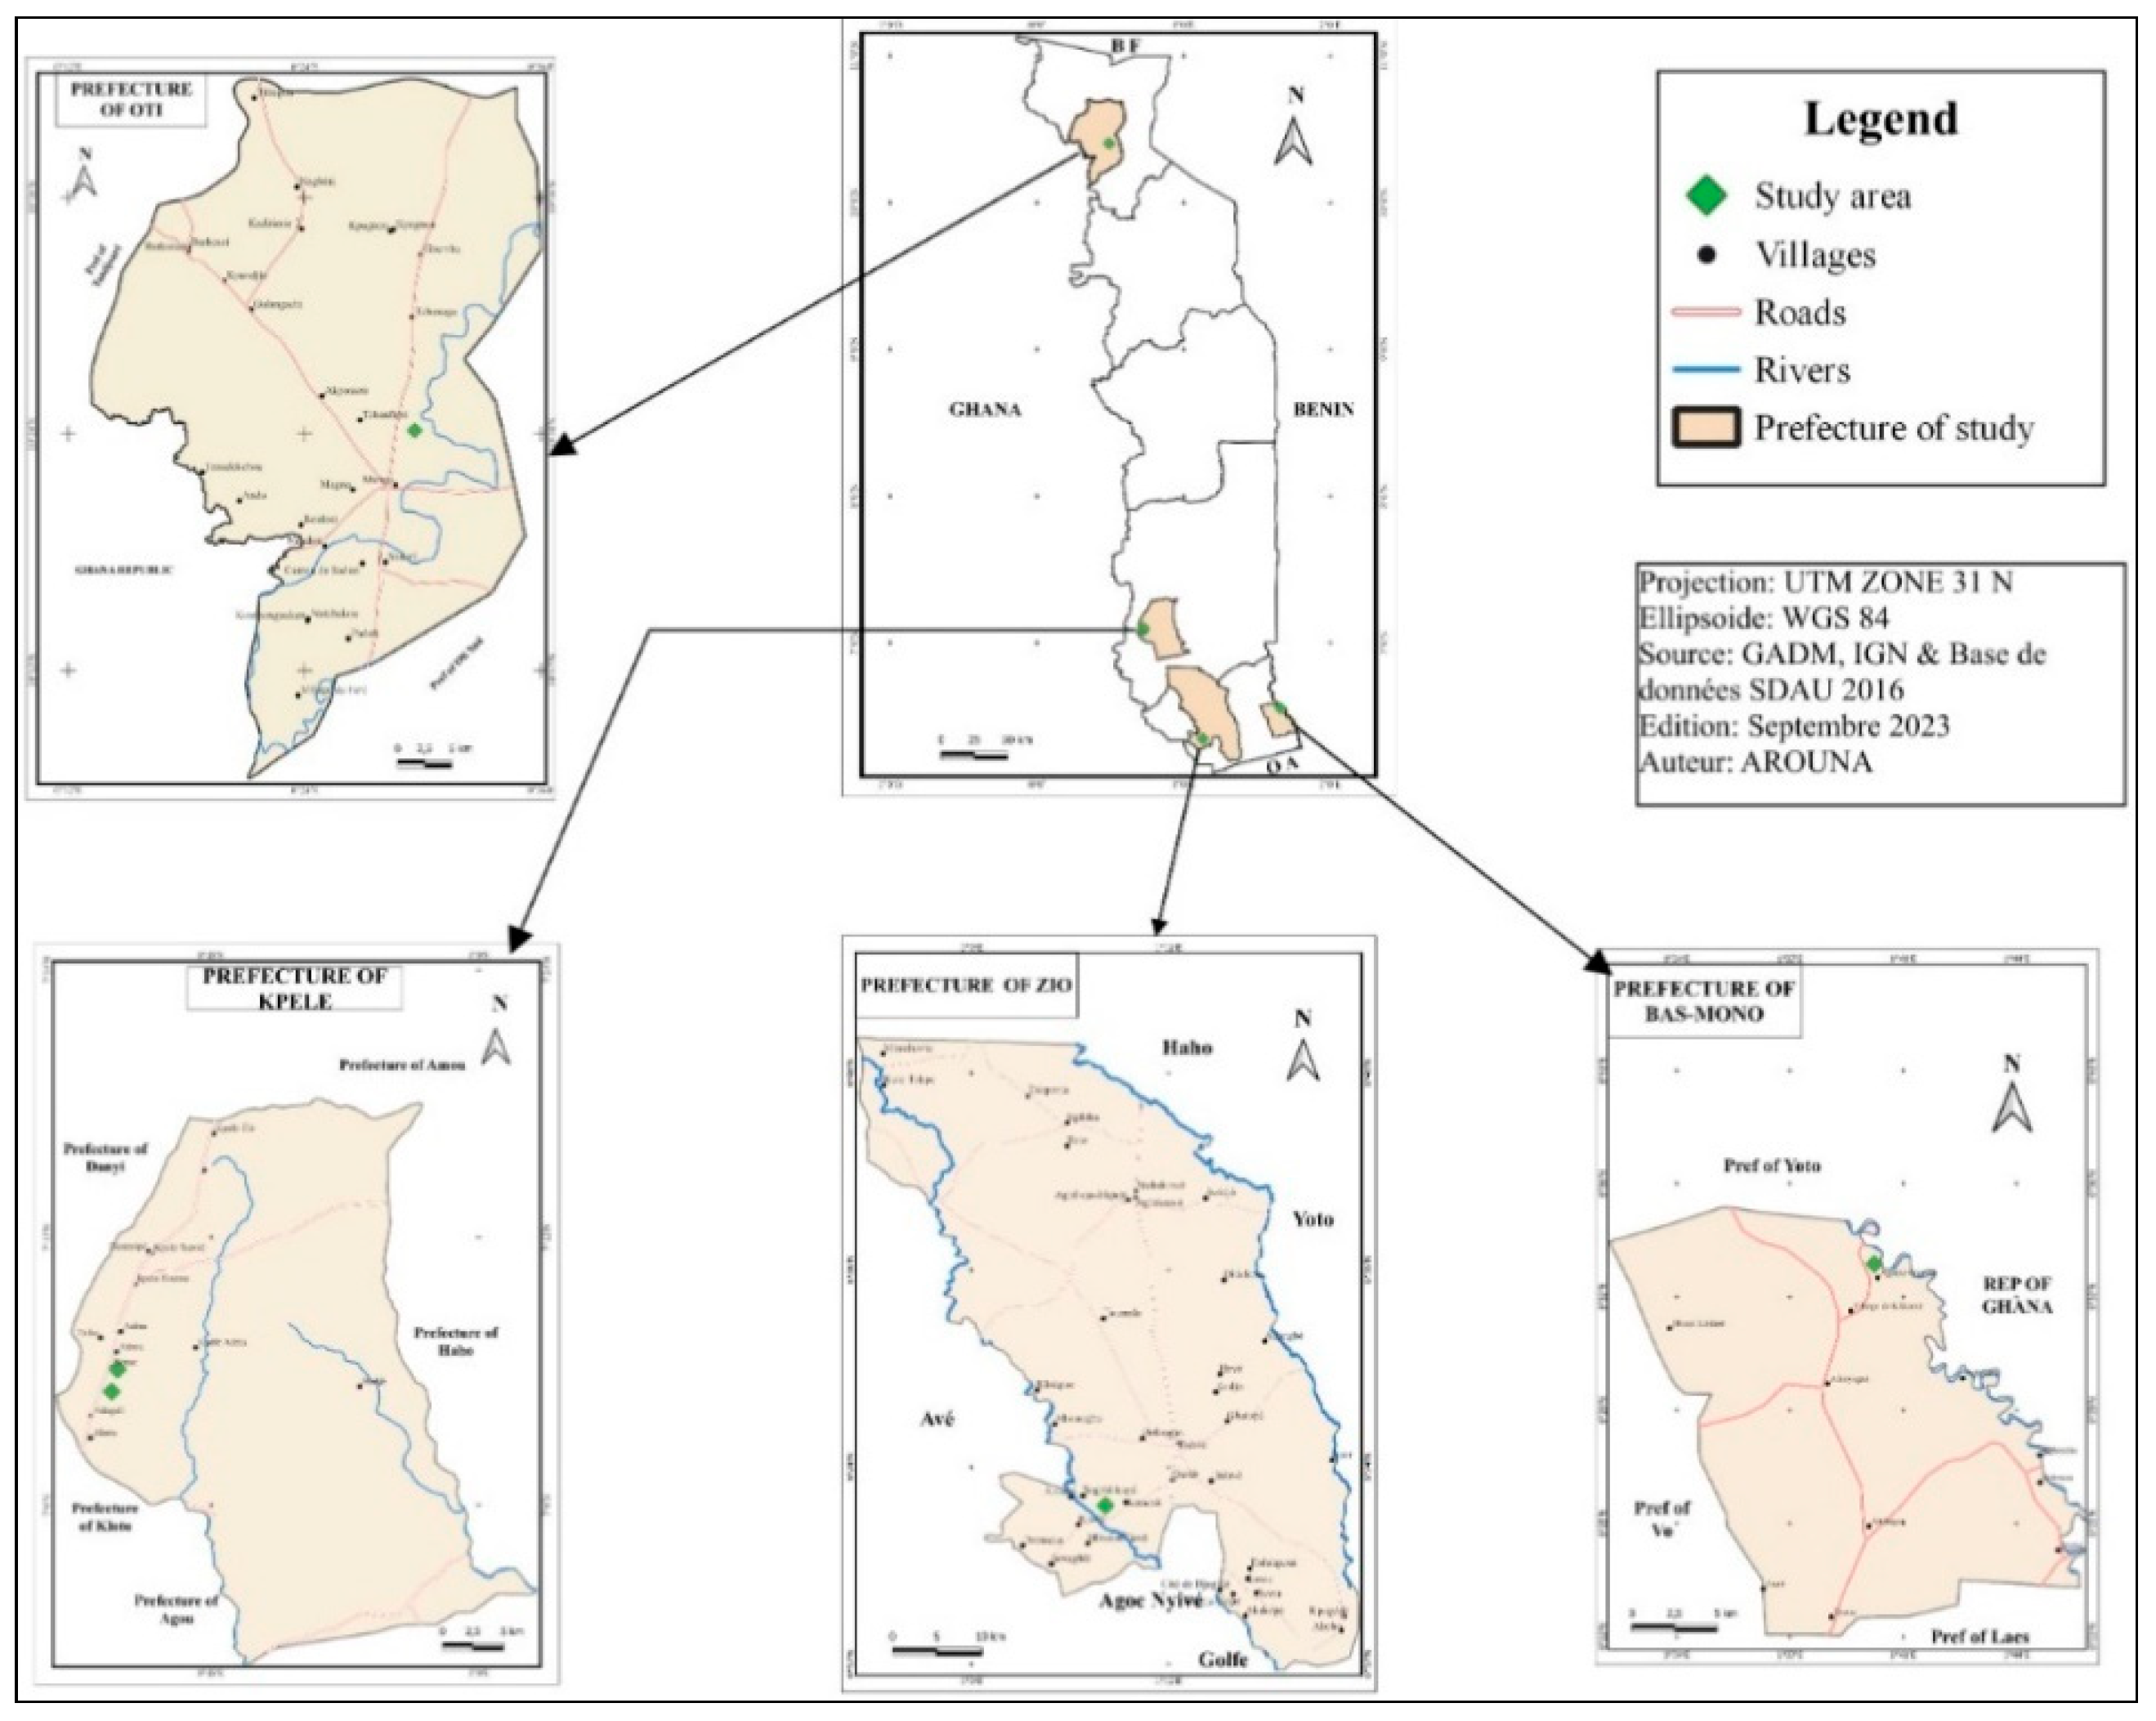
Figure 1. Study area.
Preprints 117770 g001
Figure 2. A conceptual framework.
Preprints 117770 g002
Figure 3. Number of plots used.
Preprints 117770 g003
Figure 4. Reasons for choosing the harvest sales period.
Preprints 117770 g004
Figure 5. Training attended in rice production.
Preprints 117770 g005
Figure 6. Plot clearing practices.
Preprints 117770 g006
Figure 7. Plot plough practices.
Preprints 117770 g007
Figure 8. Plot muddling practices.
Preprints 117770 g008
Figure 9. Seed purchase place.
Preprints 117770 g009
Figure 10. Crop spacing adopted.
Preprints 117770 g010
Figure 11. Basis for the quantity of fertilizer applied to the rice.
Preprints 117770 g011
Figure 12. Weed control.
Preprints 117770 g012
Figure 13. Herbicide purchase place.
Preprints 117770 g013
Figure 14. Water supply mode.
Preprints 117770 g014
Figure 15. Water level above the soil after irrigation.
Preprints 117770 g015
Figure 16. Water level above the soil surface before the next irrigation.
Preprints 117770 g016
Figure 17. Irrigation frequency.
Preprints 117770 g017
Figure 18. Water-saving technologies.
Preprints 117770 g018
Figure 19. Knowledge on water-saving methods.
Preprints 117770 g019
Figure 20. Determining the irrigation period.
Preprints 117770 g020
Figure 21. Determine the water amount to apply.
Preprints 117770 g021
Figure 22. Water wastage factorsTo improve the fertilizer-use efficiency, more than half the growers (51.8%) recommended fertilizing without water, 3.2% thought application rates recommended for fertilizers and 2.9% suggested increasing the fertilizer rate (Figure 24). On the other hand, over 39% of rice growers did not know how to improve fertilizer-use efficiency. The Pearson statistic showed that training improved farmers' knowledge of fertilizer-use efficiency at the 5% level. In fact, 65% of untrained growers did not know how to improve fertilizer-use efficiency, whereas 71% of trained farmers felt that to increase fertilizer-use efficiency, it was necessary to drain the water before fertilizing and to respect the recommended amount. However, the growers' experience had no impact on the strategy for improving fertilizer-use efficiency to the 5% level. Furthermore, over 94.6% had no access to irrigation advisory service for improving water management, which would justify the poor performance of irrigated fields.
Preprints 117770 g022
Figure 23. Water deficit reducing strategies.
Preprints 117770 g023
Figure 24. Fertilizer use-efficiency improvement.
Preprints 117770 g024
Figure 25. Salinity causes.
Preprints 117770 g025
Figure 26. Salinity consequences.
Preprints 117770 g026
Figure 27. Water management improvement.
Preprints 117770 g027
Figure 28. Inappropriate pesticides use.
Preprints 117770 g028
Figure 29. Inappropriate fertilizers use.
Preprints 117770 g029
Figure 30. Mulches and compost use.
Preprints 117770 g030
Figure 31. Reasons due to one production cycle/year.
Preprints 117770 g031
Figure 32. Yield from last production cycle.
Preprints 117770 g032
Table 1. Study samples.
Region Rice irrigation schemes Sample of rice farmers
Coastal region Kovie 76
Agome- Glouzou 92
Forest region Kpele Beme 44
Kpele Tutu 36
Savannah region Koumbeloti 30
Total 278
Table 2. Farmers' socio-demographic characteristics.
Profile of producers Women Men Total
Gender 90 188 278
Age No knowledge 0 4 4
18 – 27 years 4 15 19
28 – 37 years 11 46 57
38-47 years 33 55 88
48 – 57 years 27 47 74
58 – 67 years 14 20 34
above 68 years 1 2 3
Marital status No answer 0 1 1
Divorced 1 0 1
Married 70 169 239
Single 4 12 16
Widower/widow 15 6 21
Educations background None 32 22 54
Primary 39 65 104
JHS 14 70 84
SHS 3 23 26
University 2 8 10
Experience Below 5 years 35 76 111
6 – 10 years 16 48 64
11 – 15 years 21 27 48
above 15 years 18 37 56
Type of tenancy No answer 0 1 1
Clan-based 12 20 32
Own 5 22 27
Public 25 64 89
Rented 48 81 129
Member’s of farmers cooperative No answer 0 6 6
No member 10 33 43
Member 80 149 229
Source income Agriculture 56 116 172
Agriculture & Trade 25 15 40
Agriculture & Handicrafts 3 33 35
Agriculture & Livestock 6 24 30
Agricultural credit access Agricultural credit access 40 60 100
No Agricultural credit access 50 128 178
Table 3. Amount & timing of N15P15K15 application.
Application period of N15P15K15 fertilizer Amount applied (kg/ha) Percentage of farmers (%)
Basal 0 96,4
150 1,8
200 1,1
250 0,4
Two weeks after planting 0 38,8
50 1,4
100 6,5
150 11,2
200 24,1
250 0,4
300 10,1
400 6,1
500 1,1
600 0,4
Seven weeks after planting 0 96,8
25 0,4
50 1,1
100 1,1
200 0,7
Disclaimer/Publisher’s Note: The statements, opinions and data contained in all publications are solely those of the individual author(s) and contributor(s) and not of MDPI and/or the editor(s). MDPI and/or the editor(s) disclaim responsibility for any injury to people or property resulting from any ideas, methods, instructions or products referred to in the content.
Copyright: This open access article is published under a Creative Commons CC BY 4.0 license, which permit the free download, distribution, and reuse, provided that the author and preprint are cited in any reuse.
Prerpints.org logo

Preprints.org is a free preprint server supported by MDPI in Basel, Switzerland.

Subscribe

© 2024 MDPI (Basel, Switzerland) unless otherwise stated