Submitted:
16 September 2024
Posted:
16 September 2024
You are already at the latest version
Abstract
Keywords:
1. Introduction
2. The LMT Station, Instruments, and Datasets
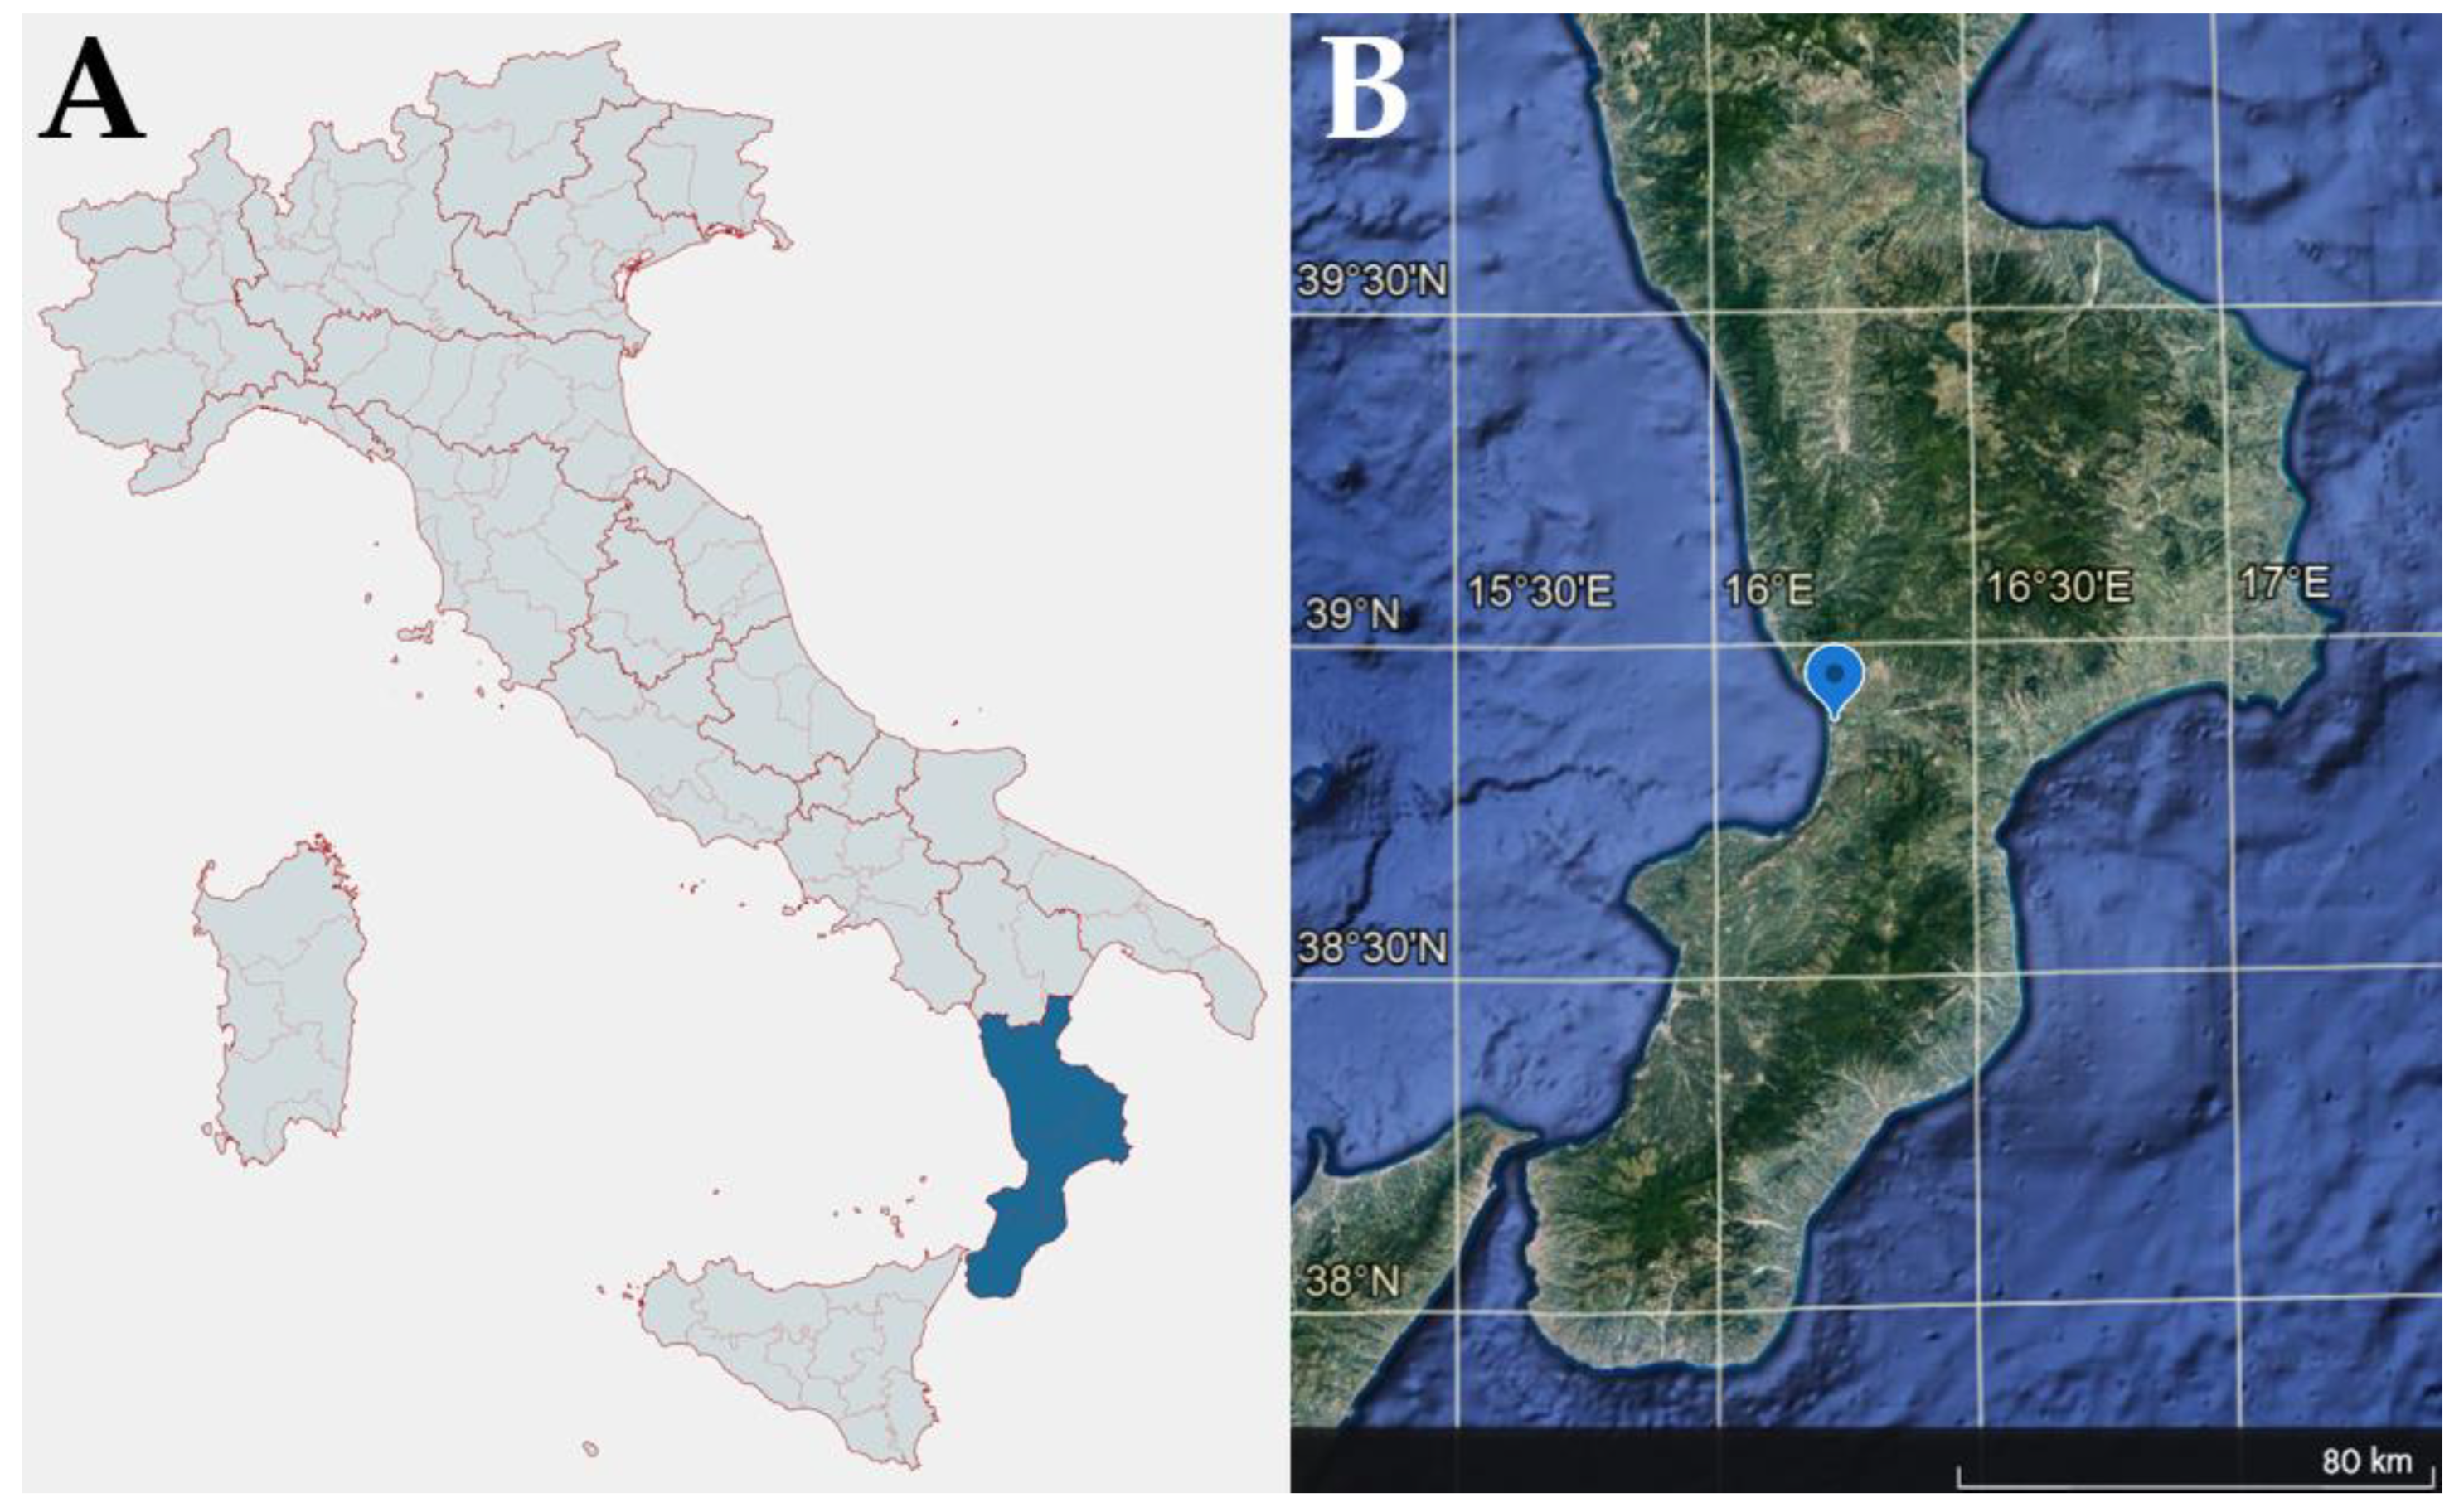
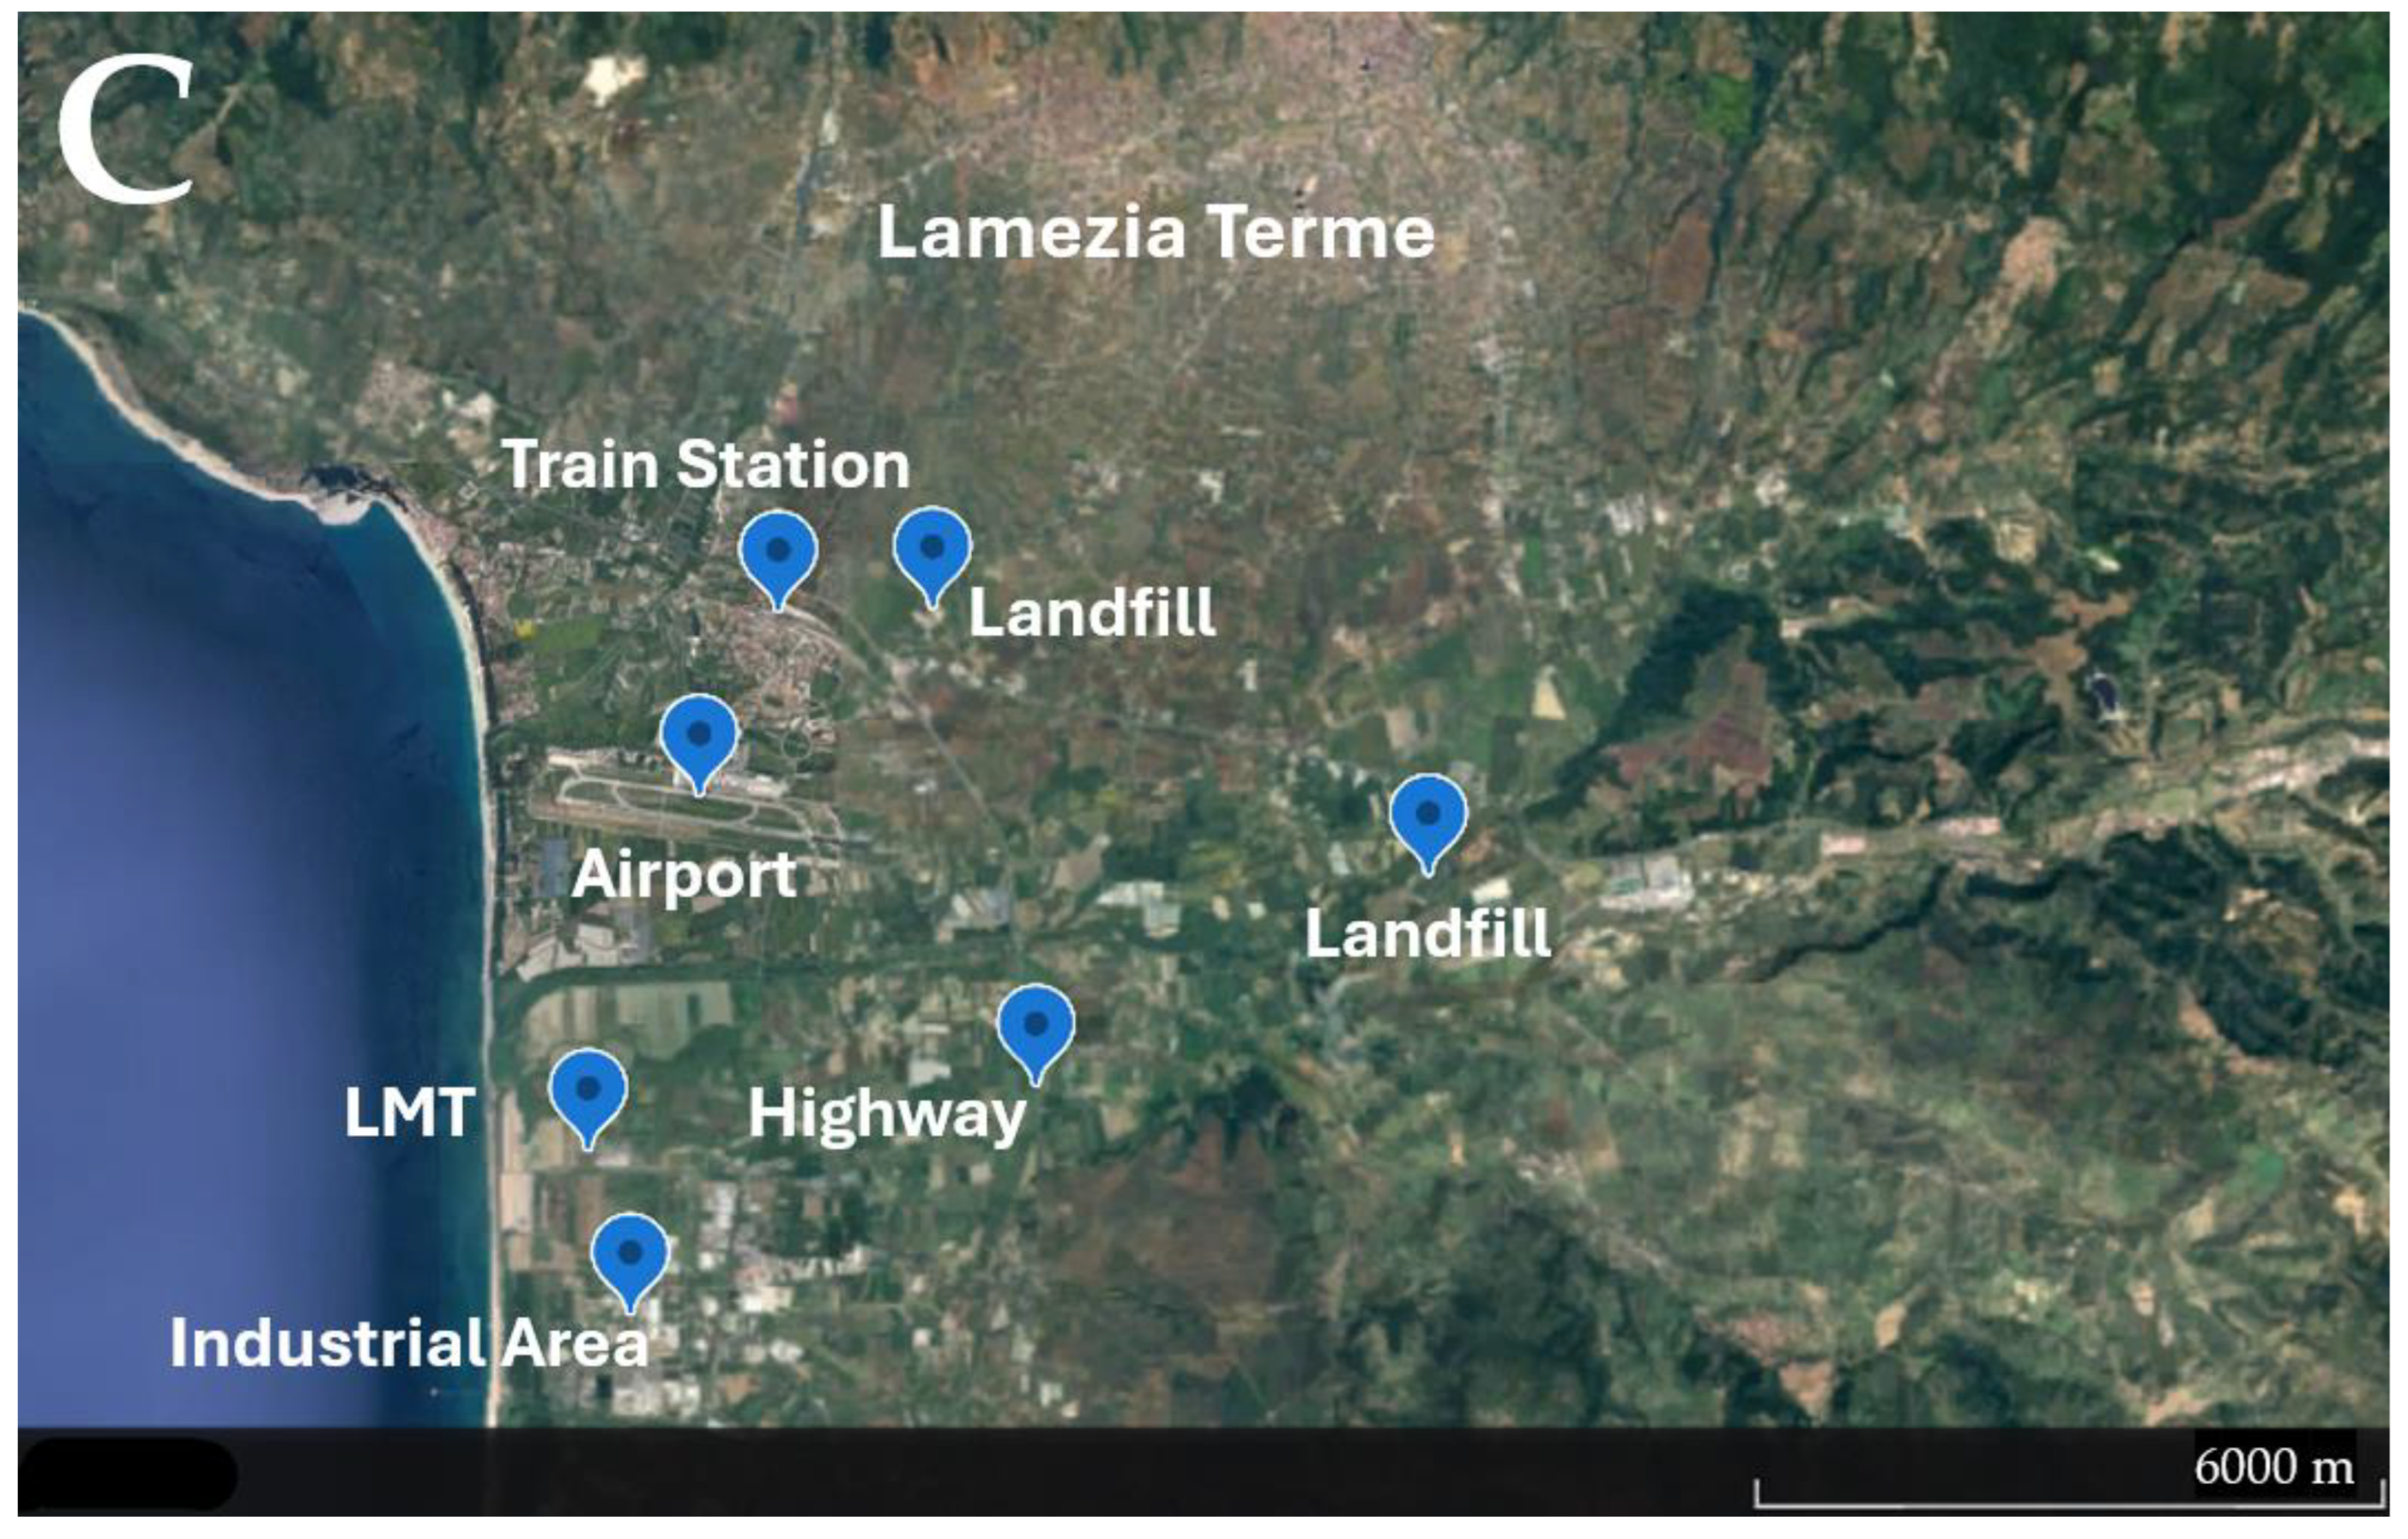
2.1. Characterization of the LMT Site
2.2. Instruments and Datasets
3. Results
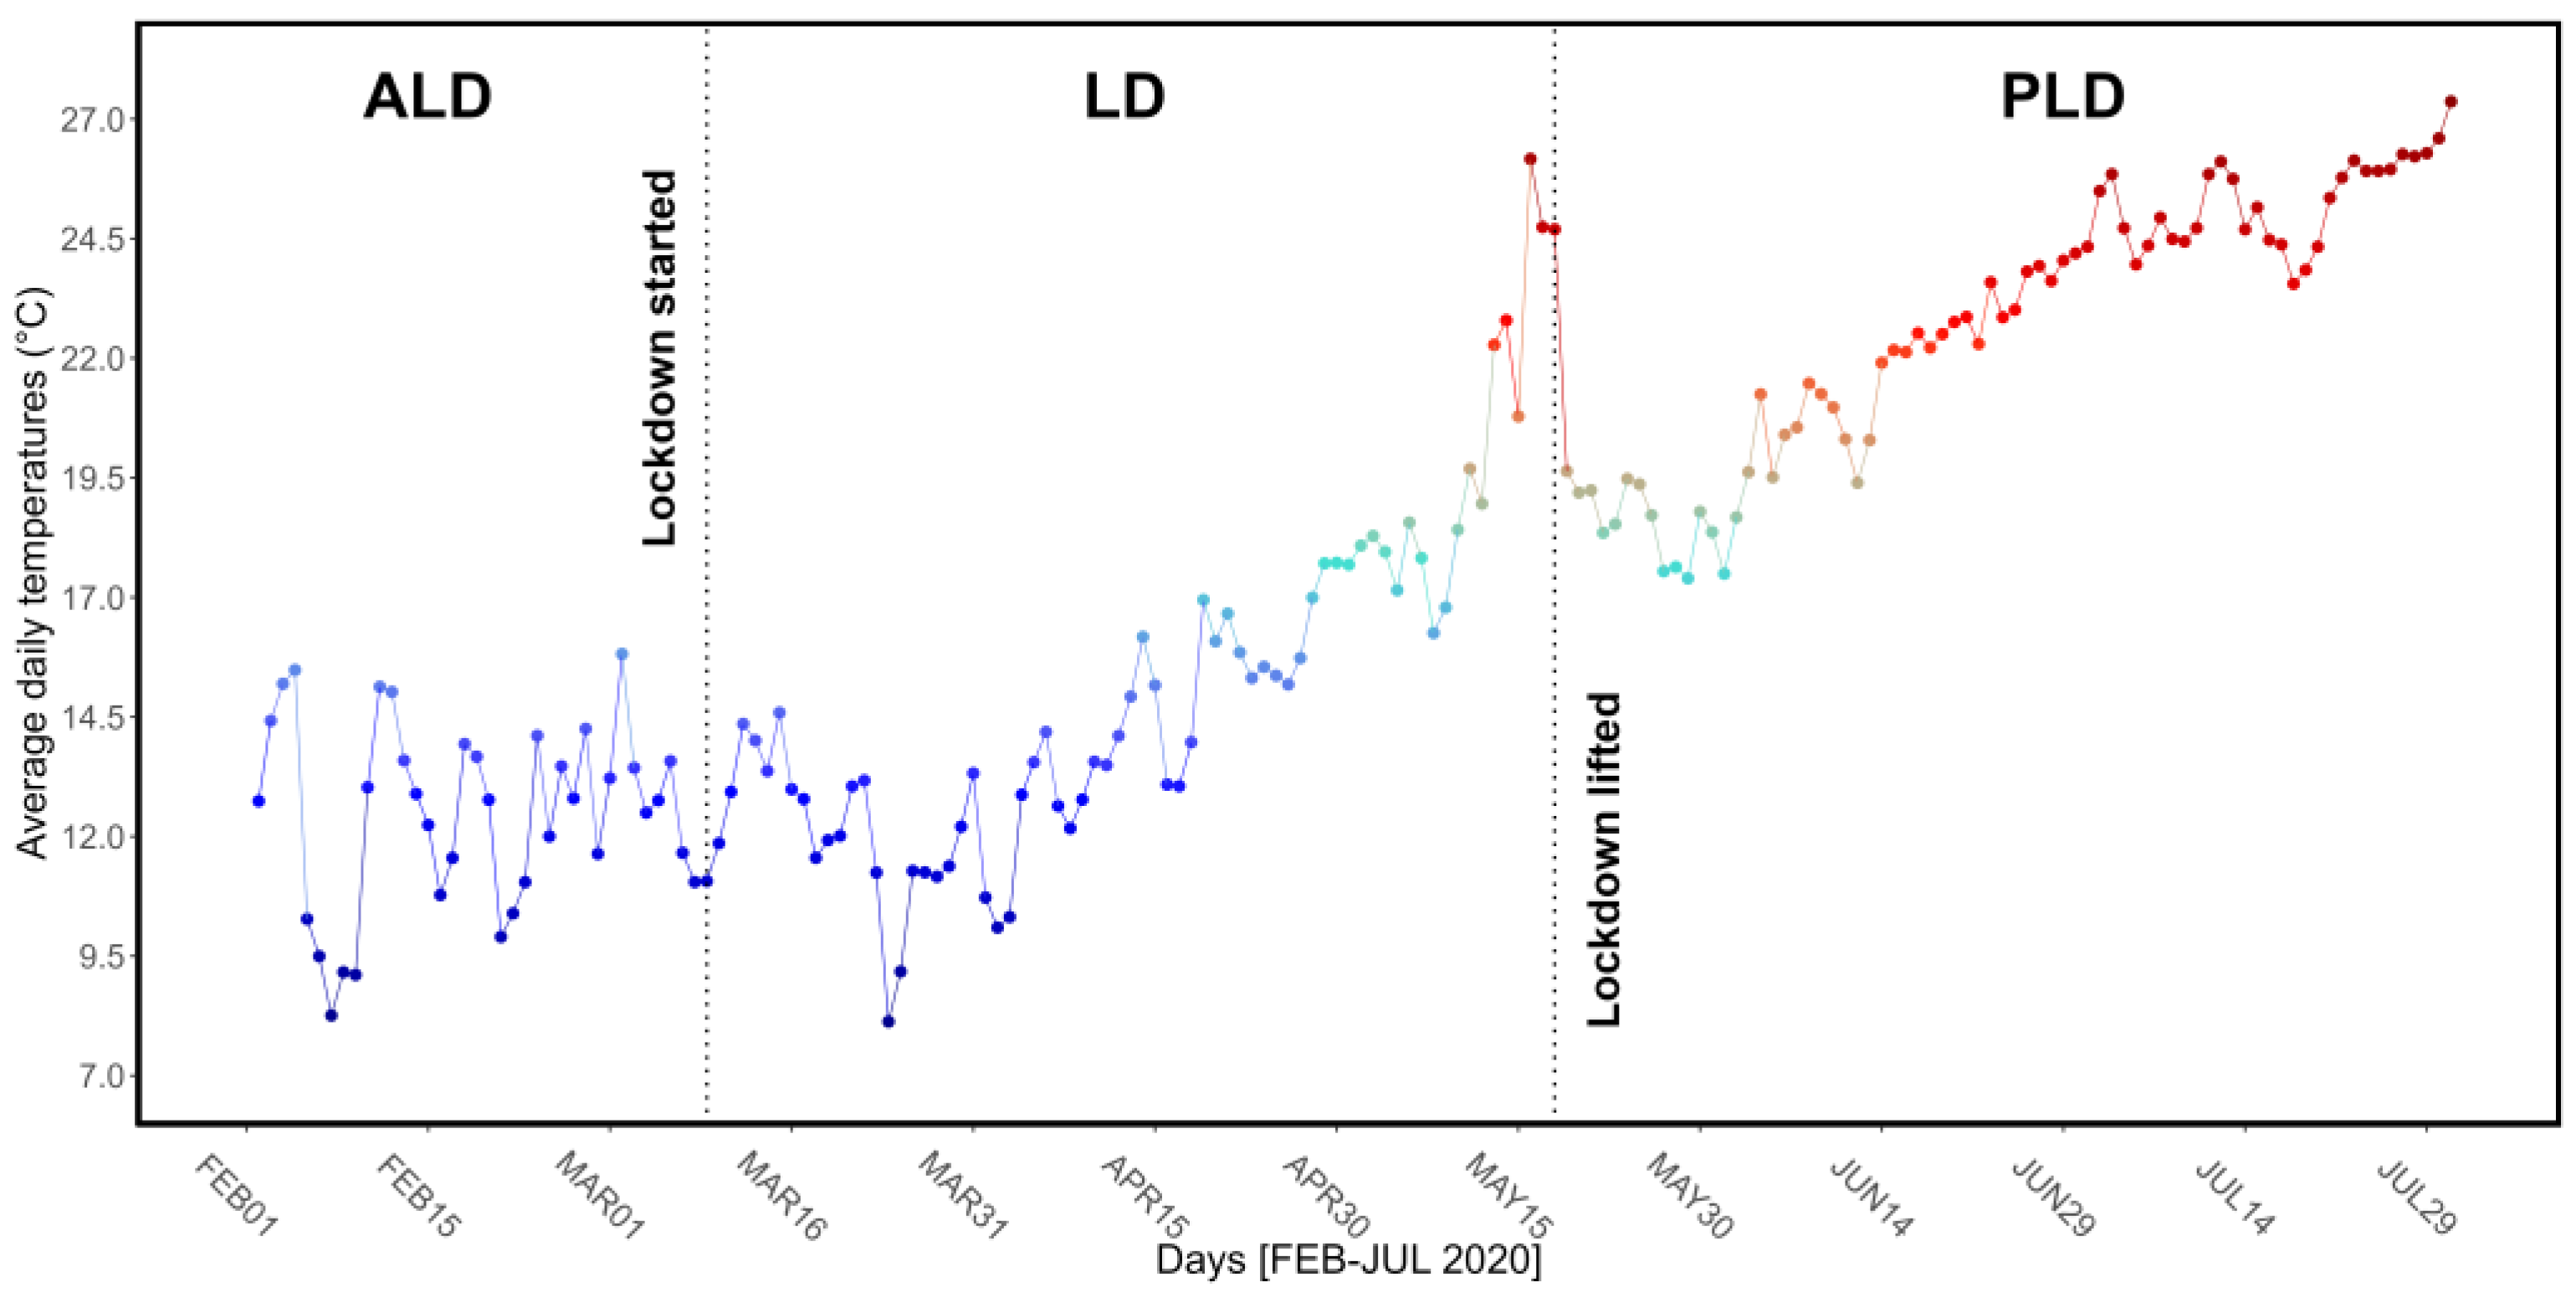
3.1. Daily Temperatures and Correlations with Observed Parameters
3.2. Hourly Averaged Trends
3.3. Daily ALD, LD, and PLD Cycles
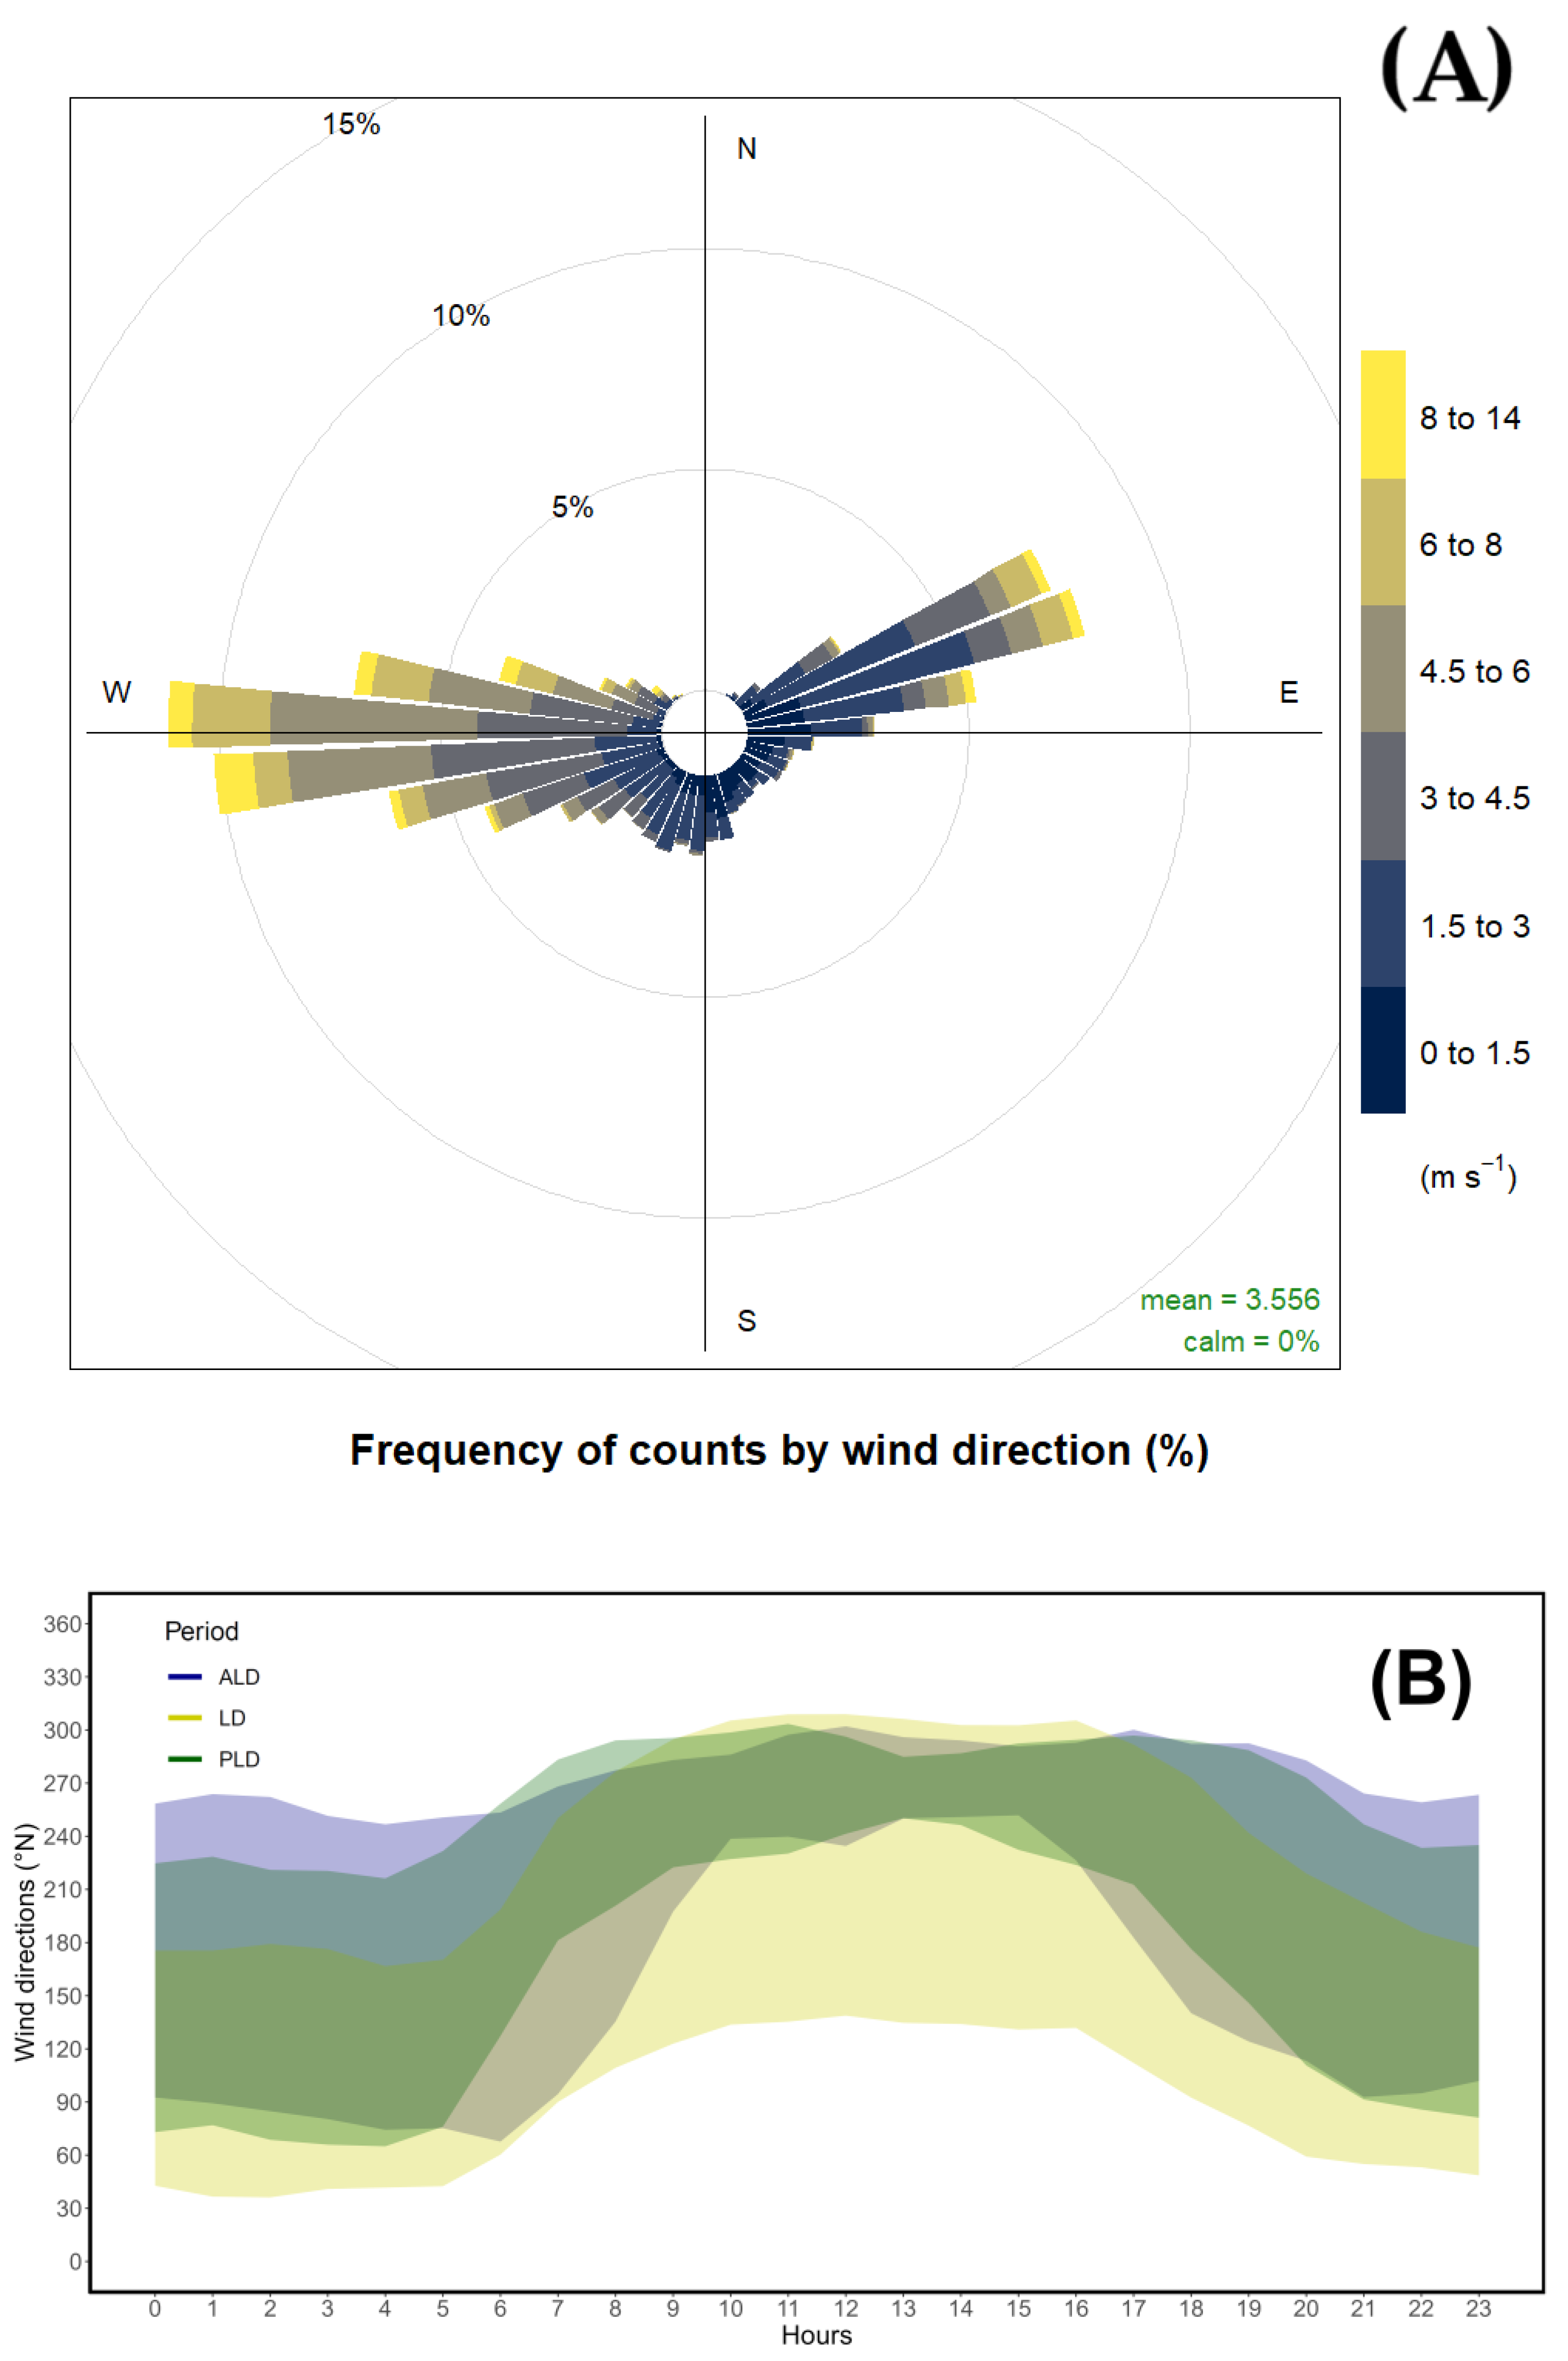
3.4. Integration of Wind Data
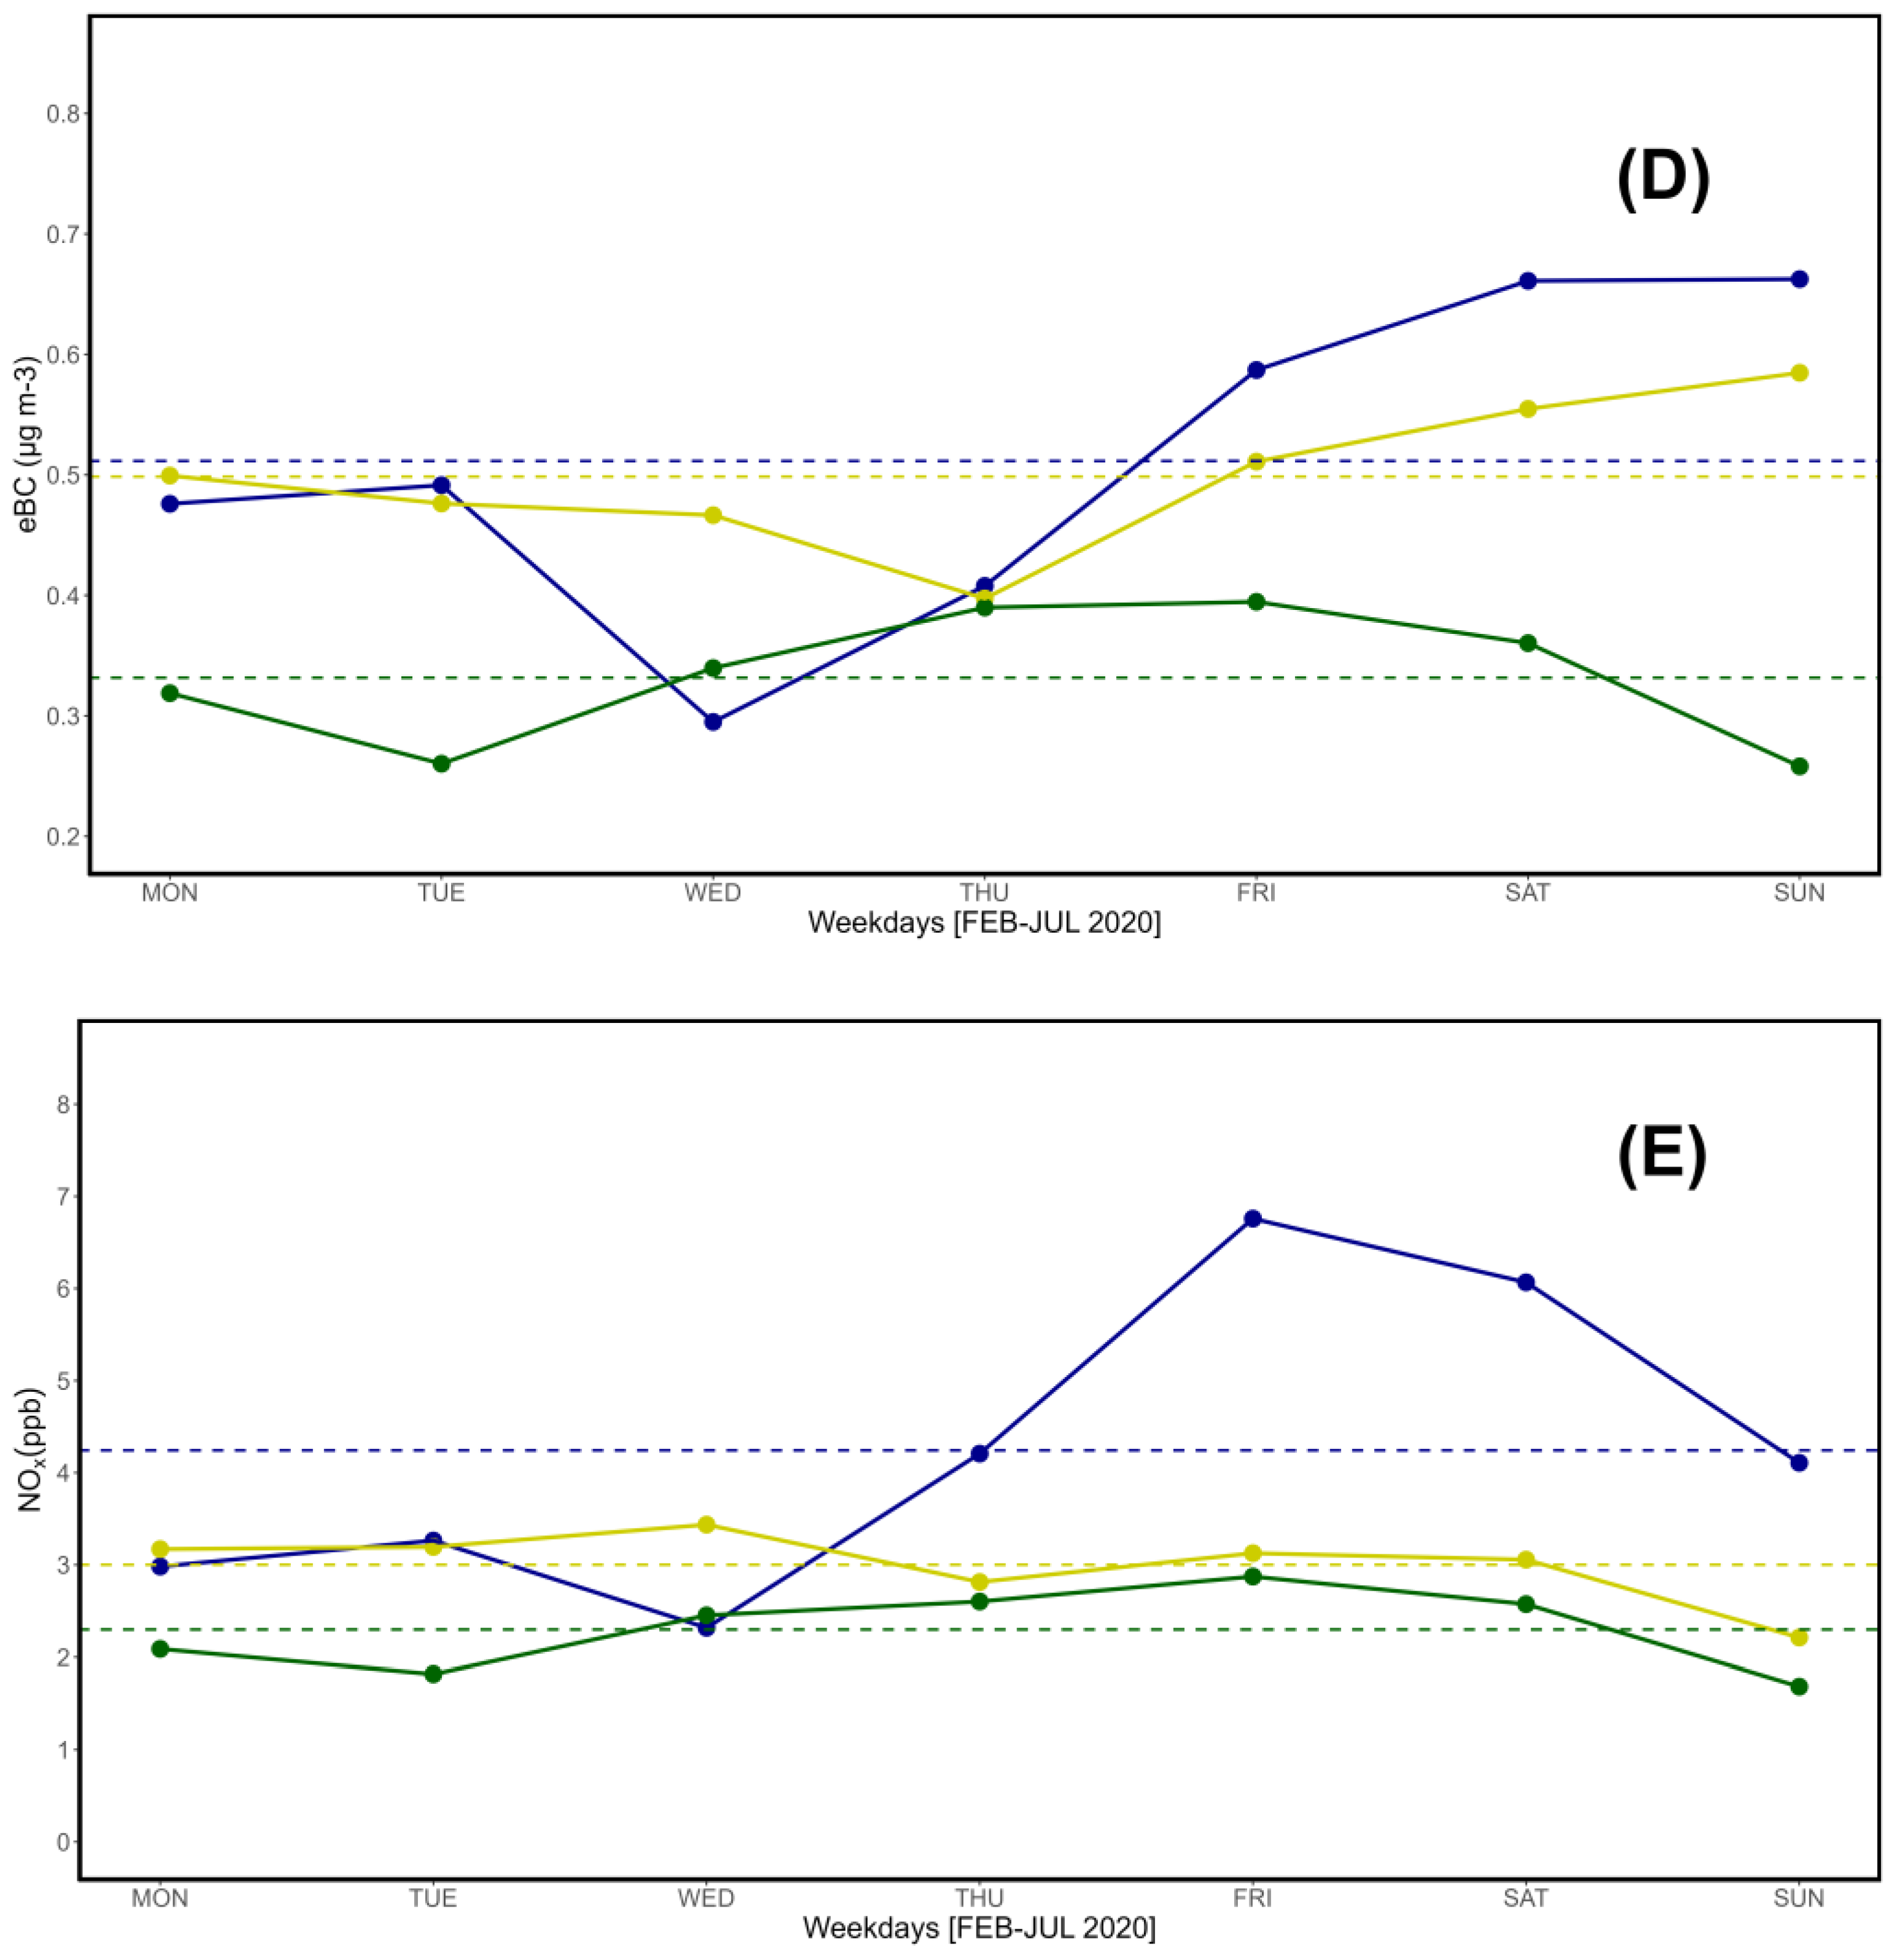
3.5. Assessment of Weekly Cycles
4. Discussion
5. Conclusions
Author Contributions
Funding
Data Availability Statement
Acknowledgments
Conflicts of Interest
References
- Italian Republic. Decree of the President of the Council of Ministers, March 9th 2020. GU Serie Generale n. 62. https://www.gazzettaufficiale.it/eli/id/2020/03/09/20A01558/sg.
- Italian Republic. Decree of the President of the Council of Ministers, May 18th 2020. GU Serie Generale n. 127. https://www.gazzettaufficiale.it/eli/id/2020/05/18/20A02727/sg.
- Bai, Y.; Zhou, Y.; Alatalo, J.M.; Hughes, A.C. Changes in Air Quality during the First-Level Response to the Covid-19 Pandemic in Shanghai Municipality, China. Sustainability 2020, 12, 8887. [Google Scholar] [CrossRef]
- Bherwani, H., Nair, M., Musugu, K.; Gautam, S.; Gupta, A.; Kapley, A.; Kumar, R. Valuation of air pollution externalities: comparative assessment of economic damage and emission reduction under COVID-19 lockdown, Air. Qual. Atmos. Health 2020, 13, 683–694. [CrossRef]
- Bolaño-Ortiz, T.R.; Puliafito, S.E.; Berná-Peña, L.L.; Pascual-Flores, R.M.; Urquiza, J.; Camargo-Caicedo, Y. Atmospheric Emission Changes and Their Economic Impacts during the COVID-19 Pandemic Lockdown in Argentina. Sustainability 2020, 12, 8661. [Google Scholar] [CrossRef]
- Jia, C.; Fu, X.; Bartelli, D.; Smith, L. Insignificant Impact of the “Stay-At-Home” Order on Ambient Air Quality in the Memphis Metropolitan Area, U.S.A, Atmosphere 2020, 11, 630. [CrossRef]
- Piccoli, A.; Agresti, V.; Balzarini, A.; Bedogni, M.; Bonanno, R.; Collino, E.; Colzi, F.; Lacavalla, M.; Lanzani, G.; Pirovano, G.; Riva, F.; Riva, G.M.; Toppetti, A.M. Modeling the Effect of COVID-19 Lockdown on Mobility and NO2 Concentration in the Lombardy Region, Atmosphere 2020, 11(12), 1319. [CrossRef]
- Sharma, S.; Zhang, M.; Anshika, Gao, J.; Zhang, H.; Kota, S.H. Effect of restricted emissions during COVID-19 on air quality in India, Sci. Total Environ. 2020, 728, 138878. [CrossRef]
- Venter, Z.S.; Aunan, K.; Chowdhury, S.; Lelieveld, J. COVID-19 lockdowns cause global air pollution declines, Proc. Natl. Acad. Sci. USA 2020, 117(32), 18984–18990. [Google Scholar] [CrossRef]
- Zhang, Z.; Arshad, A.; Zhang, C.; Hussain, S.; Li, W. Unprecedented Temporary Reduction in Global Air Pollution Associated with COVID-19 Forced Confinement: A Continental and City Scale Analysis, Remote Sens. 2020, 12, 2420. [CrossRef]
- Le Quéré, C.; Jackson, R.B.; Jones, M.W.; Smith, A.J.P.; Abernethy, S.; Andrew, R.M.; De-Gol, A.J.; Willis, D.R.; Shan, Y.; Canadell, J.G.; Friedlingstein, P.; Creutzig, F.; Peters, G.P. Temporary reduction in daily global CO2 emissions during the COVID-19 forced confinement, Nat. Clim. Change 2020, 10, 647–653. [Google Scholar] [CrossRef]
- Tondelli, S.; Farhadi, E.; Akbari Monfared, B.; Ataeian, M.; Tahmasebi Moghaddam, H.; Dettori, M.; Saganeiti, L.; Murgante, B. Air Quality and Environmental Effects Due to COVID-19 in Tehran, Iran: Lessons for Sustainability. Sustainability 2022, 14, 15038. [Google Scholar] [CrossRef]
- Khalaf, A.T.; Wei, Y.; Wan, J.; Abdul Kadir, S.Y.; Zainol, J.; Jiang, H.; Abdalla, A.N. How Did the Pandemic Affect Our Perception of Sustainability? Enlightening the Major Positive Impact on Health and the Environment. Sustainability 2023, 15, 892. [Google Scholar] [CrossRef]
- Laughner, J.L.; Neu, J.L.; Schimel, D.; Wennberg, P.O.; Barsanti, K.; Bowman, K.W.; Chatterjee, A.; Croes, B.E.; Fitzmaurice, H.L.; Henze, D.K.; Kim, J.; Kort, E.A.; Liu, Z.; Miyazaki, K.; Turner, A.J.; Anenberg, S.; Avise, J.; Cao, H.; Crisp, D.; de Gouw, J.; Eldering, A.; Fyfe, J.C.; Goldberg, D.L.; Gurney, K. R.; Hasheminassab, S.; Hopkins, F.; Ivey, C.E.; Jones, D.B.A.; Liu, J.; Lovenduski, N.S.; Martin, R.V.; McKinley, G.A.; Ott, L.; Poulter, B.; Ru, M.; Sander, S.P.; Swart, N.; Yung, Y.L.; Zeng, Z.-C. Societal shifts due to COVID-19 reveal large-scale complexities and feedbacks between atmospheric chemistry and climate change. Proc. Natl. Acad. Sci. USA 2021, 118, e2109481118. [Google Scholar] [CrossRef] [PubMed]
- Peng, S.; Lin, X.; Thompson, R.L.; Xi, Y.; Liu, G.; Hauglustaine, D.; Lan, X.; Poulter, B.; Ramonet, M.; Saunois, M.; Yin, Y.; Zhang, Z.; Zheng, B.; Ciais, P. Wetland emission and atmospheric sink changes explain methane growth in 2020. Nature 2022, 612, 477–482. [Google Scholar] [CrossRef]
- Stevenson, D.S.; Derwent, R.G.; Wild, O.; Collins, W.J. COVID-19 lockdown emission reductions have the potential to explain over half of the coincident increase in global atmospheric methane, Atmos. Chem. Phys. 2022, 22, 14243–14252. [Google Scholar] [CrossRef]
- Prather, M.J. Lifetimes and Eigenstates in Atmospheric Chemistry, Geophys. Res. Lett. 1994, 21(9), 801–804. [Google Scholar] [CrossRef]
- Derwent, R.G.; Collins, W.J.; Johnson, C.E.; Stevenson, D.S. Transient Behaviour of Tropospheric Ozone Precursors in a Global 3-D CTM and Their Indirect Greenhouse Effects, Clim. Change 2001, 49, 463–487. [Google Scholar] [CrossRef]
- Stevenson, D.S.; Young, P.J.; Naik, V.; Lamarque, J.-F.; Shindell, D.T.; Voulgarakis, A.; Skeie, R.B.; Dalsoren, S.B.; Myhre, G.; Berntsen, T.K.; Folberth, G.A.; Rumbold, S.T.; Collins, W.J.; MacKenzie, I.A.; Doherty, R.M.; Zeng, G.; van Noije, T.P.C.; Strunk, A.; Bergmann, D.; Cameron-Smith, P.; Plummer, D.A.; Strode, S.A.; Horowitz, L.; Lee, Y.H.; Szopa, S.; Sudo, K.; Nagashima, T.; Josse, B.; Cionni, I.; Righi, M.; Eyring, V.; Conley, A.; Bowman, K.W.; Wild, O.; Archibald, A. Tropospheric ozone changes, radiative forcing and attribution to emissions in the Atmospheric Chemistry and Climate Model Intercomparison Project (ACCMIP), Atmos. Chem. Phys. 2013, 13, 3063–3085. [Google Scholar] [CrossRef]
- McNorton, J.; Bousserez, N.; Agustí-Panareda, A.; Balsamo, G.; Cantarello, L.; Engelen, R.; Huijnen, V.; Inness, A.; Kipling, Z.; Parrington, M.; Ribas, R. Quantification of methane emissions from hotspots and during COVID-19 using a global atmospheric inversion. Atmos. Chem. Phys. 2022, 22, 5961–5981. [Google Scholar] [CrossRef]
- Lan, X.; Thoning, K.W.; Dlugokencky, E.J. Trends in Globally-Averaged CH4, N2O, and SF6 Determined from NOAA Global Monitoring Laboratory Measurements. Version 2024-06, 2024. Available online: https://gml.noaa.gov/ccgg/trends_doi.html (accessed on 16 July 2024).
- D’Amico, F.; Ammoscato, I.; Gullì, D.; Lo Feudo, T.; De Pino, M.; Cristofanelli, P.; Malacaria, L.; Parise, D.; Sinopoli, S.; De Benedetto, G.; Calidonna, C.R. Integrated analysis of methane cycles and trends at the WMO/GAW station of Lamezia Terme (Calabria, Southern Italy), Atmosphere 2024, 15(8), 946. [CrossRef]
- Lopez-Coto, I.; Ren, X.; Karion, A.; McKain, K.; Sweeney, C.; Dickerson, R.R.; McDonald, B.C.; Ahn, D.Y.; Salawitch, R.J.; He, H.; Shepson, P.B.; Whetstone, J.R. Carbon Monoxide Emissions from the Washington, DC, and Baltimore Metropolitan Area: Recent Trend and COVID-19 Anomaly, Environ. Sci. Technol. 2022, 56(4), 2172–2180. [Google Scholar] [CrossRef]
- Gamal, G.; Abdeldayem, O.M.; Elattar, H.; Hendy, S.; Gabr, M.E.; Mostafa, M.K. Remote Sensing Surveillance of NO2, SO2, CO, and AOD along the Suez Canal Pre- and Post-COVID-19 Lockdown Periods and during the Blockage. Sustainability 2023, 15, 9362. [Google Scholar] [CrossRef]
- Conte, M.; Dinoi, A.; Grasso, F.M.; Merico, E.; Guascito, M.R.; Contini, D. Concentration and size distribution of atmospheric particles in southern Italy during COVID-19 lockdown period, Atmos. Environ. 2022, 295, 119559. [Google Scholar] [CrossRef]
- Giardi, F.; Nava, S.; Calzolai, G.; Pazzi, G.; Chiari, M.; Faggi, A.; Andreini, B.P.; Collaveri, C.; Franchi, E.; Nincheri, G.; Amore, A.; Becagli, S.; Severi, M.; Traversi, R.; Lucarelli, F. PM10 variation, composition, and source analysis in Tuscany (Italy) following the COVID-19 lockdown restrictions, Atmos. Chem. Phys. 2022, 22, 9987–10005. [Google Scholar] [CrossRef]
- Marinello, S.; Lolli, F.; Gamberini, R. The Impact of the COVID-19 Emergency on Local Vehicular Traffic and Its Consequences for the Environment: The Case of the City of Reggio Emilia (Italy). Sustainability 2021, 13, 118. [Google Scholar] [CrossRef]
- Mashayekhi, R.; Pavlovic, R.; Racine, J.; Moran, M.D.; Manseau, P.M.; Duhamel, A.; Katal, A.; Miville, J.; Niemi, D.; Peng, S.J.; Sassi, M.; Griffin, D.; McLinden, C.A. Isolating the impact of COVID-19 lockdown measures on urban air quality in Canada, Air Qual. Atmos. Health 2021, 14, 1549–1570. [Google Scholar] [CrossRef]
- Gualtieri, G.; Brilli, L.; Carotenuto, F.; Vagnoli, C.; Zaldei, A.; Gioli, B. Long-Term COVID-19 Restrictions in Italy to Assess the Role of Seasonal Meteorological Conditions and Pollutant Emissions on Urban Air Quality, Atmosphere 2022, 13(7), 1156. [CrossRef]
- Yusup, Y.; Ramli, N.K.; Kayode, J.S.; Yin, C.S.; Hisham, S.; Mohamad Isa, H.; Ahmad, M.I. Atmospheric Carbon Dioxide and Electricity Production Due to Lockdown. Sustainability 2020, 12, 9397. [Google Scholar] [CrossRef]
- Tan, C.H.; Ong, M.Y.; Nomanbhay, S.M.; Shamsuddin, A.H.; Show, P.L. The Influence of COVID-19 on Global CO2 Emissions and Climate Change: A Perspective from Malaysia. Sustainability 2021, 13, 8461. [Google Scholar] [CrossRef]
- Venturi, S.; Randazzo, A.; Tassi, F.; Gioli, B.; Buccianti, A.; Gualtieri, G.; Capecchiacci, F.; Cabassi, J.; Brilli, L.; Carotenuto, F.; Santi, R.; Vagnoli, C.; Zaldei, A.; Vaselli, O. Unveiling the changes in urban atmospheric CO2 in the time of COVID-19 pandemic: A case study of Florence (Italy), Sci. Total Environ. 2021, 795, 148877. [Google Scholar] [CrossRef] [PubMed]
- Kar, S.; Ghosh, I.; Show, S.; Sen, A.; Gupta, T.; Chowdhury, P.; Chatterjee, T.; RoyChowdhury, A. Impact of Coronavirus (COVID-19) Outbreak on Society, Air Quality, and Economy in India: A Study of Three “P”s of Sustainability in India. Sustainability 2021, 13, 2873. [Google Scholar] [CrossRef]
- Putaud, J.P.; Pozzoli, L.; Pisoni, E.; Martins Dos Santos, S.; Lagler, F.; Lanzani, G.; Dal Santo, U.; Colette, A. Impacts of the COVID-19 lockdown on air pollution at regional and urban background sites in northern Italy, Atmos. Chem. Phys. 2021, 21(10), 7597–7609. [Google Scholar] [CrossRef]
- Addas, A; Maghrabi, A. The Impact of COVID-19 Lockdowns on Air Quality—A Global Review, Sustainability 2021, 13(18), 10212. [CrossRef]
- Baldasano, J.M. COVID-19 lockdown effects on air quality by NO2 in the cities of Barcelona and Madrid (Spain), Sci. Total Environ. 2020, 741, 140353. [Google Scholar] [CrossRef]
- Giani, P.; Castruccio, S.; Anav, A.; Howard, D.; Hu, W.; Crippa, P. Short-term and long-term health impacts of air pollution reductions from COVID-19 lockdowns in China and Europe: a modelling study, The Lancet 2020, 4(10), E474-E482. [CrossRef]
- Menut, L.; Bessagnet, B.; Siour, G.; Mailler, S.; Pennel, R.; Cholakian, A. Impact of lockdown measures to combat Covid-19 on air quality over western Europe, Sci. Total Environ. 2020, 741, 140426. [Google Scholar] [CrossRef]
- Petetin, H.; Bowdalo, D.; Soret, A.; Guevara, M.; Jorba, O.; Serradell, K.; Pérez García-Pando, C. Meteorology-normalized impact of the COVID-19 lockdown upon NO2 pollution in Spain, Atmos. Chem. Phys. 2020, 20(18), 11119–11141. [Google Scholar] [CrossRef]
- Ciarelli, G.; Jiang, J.; El Haddad, I.; Bigi, A.; Aksoyoglu, S.; Prévôt, A.S.H.; Marinoni, A.; Shen, J.; Yan, C.; Bianchi, F. Modeling the effect of reduced traffic due to COVID-19 measures on air quality using a chemical transport model: impacts on the Po Valley and the Swiss Plateau regions, Environ. Sci. Atmospheres 2021, 1(5), 228–240. [Google Scholar] [CrossRef]
- Guevara, M.; Jorba, O.; Soret, A.; Petetin, H.; Bowdalo, D.; Serradell, K.; Tena, C.; Denier van der Gon, H.; Kuenen, J.; Peuch, V.-H.; Pérez García-Pando, C. Time-resolved emission reductions for atmospheric chemistry modelling in Europe during the COVID-19 lockdowns, Atmos. Chem. Phys. 2021, 21(2), 773–797. [Google Scholar] [CrossRef]
- Dinoi, A.; Gullì, D.; Ammoscato, I.; Calidonna, C.R.; Contini, D. Impact of the Coronavirus Pandemic Lockdown on Atmospheric Nanoparticle Concentrations in Two Sites of Southern Italy, Atmosphere 2021, 12(3), 352. [CrossRef]
- Cristofanelli, P.; Busetto, M.; Calzolari, F.; Ammoscato, I.; Gullì, D.; Dinoi, A.; Calidonna, C.R.; Contini, D.; Sferlazzo, D.; Di Iorio, T.; Piacentino, S.; Marinoni, A.; Maione, M.; Bonasoni, P. Investigation of reactive gases and methane variability in the coastal boundary layer of the central Mediterranean basin. Elem. Sci. Anth. 2017, 5, 12. [Google Scholar] [CrossRef]
- Zheng, B.; Chevallier, F.; Ciais, P.; Yin, Y.; Deeter, M.N.; Worden, H.M.; Wang, Y.; Zhang, Q.; He, K. Rapid decline in carbon monoxide emissions and export from East Asia between years 2005 and 2016. Environ. Res. Lett. 2018, 13(4), 044007. [Google Scholar] [CrossRef]
- Bolin, B.; Eriksson, E. Changes in the carbon dioxide content of the atmosphere and sea due to fossil fuel combustion. Rossby Memorial Vol. 1959, 130–146. [Google Scholar]
- Wilson, D. Quantifying and comparing fuel-cycle greenhouse-gas emissions: Coal, oil and natural gas consumption. Energy Policy 1990, 18(6), 550–562. [Google Scholar] [CrossRef]
- Scheraga, J.D.; Leary, N.A. Improving the efficiency of policies to reduce CO2 emissions. Energy Policy 1992, 20(5), 394–404. [Google Scholar] [CrossRef]
- Smith, I.M. CO2 and climatic change: An overview of the science. Energy Convers. Manag. 1993, 34(9-11), 729-735. [CrossRef]
- Danny Harvey, L.D. A guide to global warming potentials (GWPs). Energy Policy 1993, 21(1), 24–34. [Google Scholar] [CrossRef]
- Keeling, C.D.; Whorf, T.P.; Wahlen, M.; van der Plichtt, J. Interannual extremes in the rate of rise of atmospheric carbon dioxide since 1980. Nature 1995, 375, 666–670. [Google Scholar] [CrossRef]
- Clairotte, M.; Suarez-Bertoa, R.; Zardini, A.A.; Giechaskiel, B.; Pavlovic, J.; Valverde, V.; Ciuffo, B.; Astorga, C. Exhaust emission factors of greenhouse gases (GHGs) from European road vehicles. Environ. Sci. Eur. 2020, 32, art.no. 125. [CrossRef]
- Lee, D.S.; Fahey, D.; Forster, P.M.; Newton, P.J.; Wit, R.C.N.; Lim, L.L.; Owen, B.; Sausen, R. Aviation and global climate change in the 21st century. Atmos. Environ. 2009, 43, pgs. 3520–3537. [CrossRef]
- Lee, D.S.; Fahey, D.W.; Skowron, A.; Allen, M.R.; Burkhardt, U.; Chen, Q.; Doherty, S.J.; Freeman, S.; Forster, P.M.; Fuglestvedt, J.; Gettelman, A.; DeLeón, R.R.; Lim, L.L.; Lund, M.T.; Millar, R.J.; Owen, B.; Penner, J.E.; Pitari, G.; Prather, M.J.; Sausen, R.; Wilcox, L.J. The contribution of global aviation to anthropogenic climate forcing for 2000 to 2018. Atmos. Environ. 2021, 244, 117834. [Google Scholar] [CrossRef]
- Saunois, M.; Stavert, A.R.; Poulter, B.; Bousquet, P.; Canadell, J.G.; Jackson, R.B.; Raymond, P.A.; Dlugokencky, E.J.; Houweling, S.; Patra, P.K.; Ciais, P.; Arora, V.K.; Bastviken, D.; Bergamaschi, P.; Blake, D.R.; Brailsford, G.; Bruhwiler, L.; Carlson, K.M.; Carrol, M.; Castaldi, S.; Chandra, N.; Crevoisier, C.; Crill, P.M.; Covey, K.; Curry, C.L.; Etiope, G.; Frankenberg, C.; Gedney, N.; Hegglin, M.I.; Höglund-Isaksson, L.; Hugelius, G.; Ishizawa, M.; Ito, A.; Janssens-Maenhout, G.; Jensen, K.M.; Joos, F.; Kleinen, T.; Krummel, P.B.; Langenfelds, R.L.; Laruelle, G.G.; Liu, L.; Machida, T.; Maksyutov, S.; McDonald, K.C.; McNorton, J.; Miller, P.A.; Melton, J.R.; Morino, I.; Müller, J.; Murguia-Flores, F.; Naik, V.; Niwa, Y.; Noce, S.; O’Doherty, S.; Parker, R.J.; Peng, C.; Peng, S.; Peters, G.P.; Prigent, C.; Prinn, R.; Ramonet, M.; Regnier, P.; Riley, W.J.; Rosentreter, J.A.; Segers, A.; Simpson, I.J.; Shi, H.; Smith, S.J.; Steele, L.P.; Thornton, B.F.; Tian, H.; Tohjima, Y.; Tubiello, F.N.; Tsuruta, A.; Viovy, N.; Voulgarakis, A.; Weber, T.S.; van Weele, M.; van der Werf, G.R.; Weiss, R.F.; Worthy, D.; Wunch, D.; Yin, Y.; Yoshida, Y.; Zhang, W.; Zhang, Z.; Zhao, Y.; Zheng, B.; Zhu, Q.; Zhu, Q.; Zhuang, Q. The Global Methane Budget 2000–2017. Earth Syst. Sci. Data 2020, 12, pgs. 1561–1623. [Google Scholar] [CrossRef]
- Chang, J.; Peng, S.; Ciais, P.; Saunois, M.; Dangal, S.R.S.; Herrero, M.; Havlík, P.; Tian, H.; Bousquet, P. Revisiting enteric methane emissions from domestic ruminants and their δ13CCH4 source signature. Nat. Commun. 2019, 10, 3420. [Google Scholar] [CrossRef]
- Edwards, D.P.; Emmons, L.K.; Hauglustaine, D.A.; Chu, D.A.; Gille, J.C.; Kaufman, Y.J.; Pétron, G.; Yurganov, L.N.; Giglio, L.; Deeter, M.N.; Yudin, V.; Ziskin, D.C.; Warner, J.; Lamarque, J.-F.; Francis, G.L.; Ho, S.P.; Mao, D.; Chen, J.; Grechko, E.I.; Drummond, J.R. Observations of carbon monoxide and aerosols from the Terra satellite: Northern Hemisphere variability. J. Geophys. Res. Atmospheres 2004, 109(D24). [CrossRef]
- Lighty, J.S.; Veranth, J.M.; Sarofim, A.F. Combustion aerosols: Factors governing their size and composition and implications to human health. J. Air Waste Manage. Assoc. 2000, 50(9), 1565–1618. [Google Scholar] [CrossRef] [PubMed]
- Horvath, H. Atmospheric light absorption: A review. Atmos. Environ. Part A 1993, 27, 293–317. [Google Scholar] [CrossRef]
- Jacobson, M.Z. Strong radiative heating due to the mixing state of black carbon in atmospheric aerosols. Nature. 2001, 409, 695–697. [Google Scholar] [CrossRef]
- Chameides, W.L.; Bergin, M. Soot takes center stage. Science 2002, 297, 2214–2215. https://www.science.org/doi/10.1126/science.1076866.
- Bond, T.C.; Doherty, S.J.; Fahey, D.W.; Forster, P.M.; Berntsen, T.; DeAngelo, B.J.; Flanner, M.G.; Ghan, S.; Kärcher, B.; Koch, D.; Kinne, S.; Kondo, Y.; Quinn, P.K.; Sarofim, M.C.; Schultz, M.G.; Schulz, M.; Venkataraman, C.; Zhang, H.; Zhang, S.; Bellouin, N.; Guttikunda, S.K.; Hopke, P.K.; Jacobson, M.Z.; Kaiser, J.W.; Klimont, Z.; Lohmann, U.; Schwarz, J.P.; Shindell, D.; Storelvmo, T.; Warren, S.G.; Zender, C.S. Bounding the role of black carbon in the climate system: A scientific assessment. J. Geophys. Res. Atmospheres 2013, 118(11), 5380–5552. [Google Scholar] [CrossRef]
- Hassan, F.; Chaudhry, M.U.; Yasir, M.; Asghar, M.N.; Sarkodie, S.A. Monitoring the Impact of COVID-19 Lockdown on the Production of Nitrogen Dioxide (NO2) Pollutants Using Satellite Imagery: A Case Study of South Asia. Sustainability 2021, 13, 7184. [Google Scholar] [CrossRef]
- Yoo, S.; Managi, S. Lockdowns Save People from Air Pollution: Evidence from Daily Global Tropospheric NO2 Satellite Data. Sustainability 2021, 13, 11777. [Google Scholar] [CrossRef]
- Jacob, D.J. Introduction to atmospheric chemistry, Princeton University Press, 1999.
- Seinfeld, J.H.; Pandis, S.N. Atmospheric Chemistry and Physics, A Wiley-Inter Science Publication, John Wiley & Sons Inc., Hoboken, New Jersey, 2006.
- Federico, S.; Pasqualoni, L.; De Leo, L.; Bellecci, C. A study of the breeze circulation during summer and fall 2008 in Calabria, Italy. Atmos. Res. 2010, 97(1-2), pgs. 1-13. [CrossRef]
- Federico, S.; Pasqualoni, L.; Sempreviva, A.M.; De Leo, L.; Avolio, E.; Calidonna, C.R.; Bellecci, C. The seasonal characteristics of the breeze circulation at a coastal Mediterranean site in South Italy. Adv. Sci. Res. 2010, 4, pgs. 47–56. [Google Scholar] [CrossRef]
- Gullì, D.; Avolio, E.; Calidonna, C.R.; Lo Feudo, T.; Torcasio, R.C.; Sempreviva, A.M. Two years of wind-lidar measurements at an Italian Mediterranean Coastal Site. In European Geosciences Union General Assembly 2017, EGU – Division Energy, Resources & Environment, ERE. Energy Procedia 2017, 125, pgs. 214–220. [Google Scholar] [CrossRef]
- Avolio, E.; Federico, S.; Miglietta, M.M.; Lo Feudo, T.; Calidonna, C.R.; Sempreviva, A.M. Sensitivity analysis of WRF model PBL schemes in simulating boundary-layer variables in southern Italy: An experimental campaign. Atmos. Res. 2017, 192, 58–71. [Google Scholar] [CrossRef]
- Lo Feudo, T.; Calidonna, C.R.; Avolio, E.; Sempreviva, A.M. Study of the Vertical Structure of the Coastal Boundary Layer Integrating Surface Measurements and Ground-Based Remote Sensing. Sensors 2020, 20, 6516. [Google Scholar] [CrossRef]
- Donateo, A.; Lo Feudo, T.; Marinoni, A.; Calidonna, C.R.; Contini, D.; Bonasoni, P. Long-term observations of aerosol optical properties at three GAW regional sites in the Central Mediterranean. Atmos. Res. 2020, 241, 104976. [Google Scholar] [CrossRef]
- D’Amico, F.; Ammoscato, I.; Gullì, D.; Lo Feudo, T.; De Cristofanelli, M.; Cristofanelli, P.; Malacaria, L.; Parise, D.; Sinopoli, S.; De Benedetto, G.; Calidonna, C.R. Anthropic-induced variability of greenhouse gases and aerosols at the WMO/GAW coastal site of Lamezia Terme (Calabria, Southern Italy): towards a new method to assess the weekly distribution of gathered data, submitted to MDPI Sustainability (3174519).
- Malacaria, L.; Parise, D.; Lo Feudo, T.; Avolio, E.; Ammoscato, I.; Gullì, D.; Sinopoli, S.; Cristofanelli, P.; De Pino, M.; D’Amico, F.; Calidonna, C.R. Multiparameter detection of summer open fire emissions: the case study of GAW regional observatory of Lamezia Terme (Southern Italy). Fire 2024, 7(6), 198. [Google Scholar] [CrossRef]
- Calidonna, C.R.; Avolio, E.; Gullì, D.; Ammoscato, I.; De Pino, M.; Donateo, A.; Lo Feudo, T. Five Years of Dust Episodes at the Southern Italy GAW Regional Coastal Mediterranean Observatory: Multisensors and Modeling Analysis. Atmosphere 2020, 11(5), 456. [Google Scholar] [CrossRef]
- Chu, P.M.; Hodges, J.T.; Rhoderick, G.C.; Lisak, D.; Travis, J.C. Methane-in-air standards measured using a 1.65μm frequency-stabilized cavity ring-down spectrometer. Proc. SPIE 6378, Chemical and Biological Sensors for Industrial and Environmental Monitoring II 2006, 63780G. [CrossRef]
- Petzold, A.; Kramer, H.; Schönlinner, M. Continuous Measurement of Atmospheric Black Carbon Using a Multi-angle Absorption Photometer. Environ. Sci. Pollut. Res. 2002, 4, 78–82. [Google Scholar]
- Petzold, A.; Schloesser, H.; Sheridan, P.J.; Arnott, P.; Ogren, J.A.; Virkkula, A. Evaluation of multiangle absorption photometry for measuring aerosol light absorption. Aerosol Sci. Technol. 2005, 39, 40–51. [Google Scholar] [CrossRef]
- Petzold, A.; Schönlinner, M. Multi-angle absorption photometry—a new method for the measurement of aerosol light absorption and atmospheric black carbon. J. Aerosol Sci. 2004, 35(4), 421–441. [Google Scholar] [CrossRef]
- Sander, S.P.; Golden, D.M.; Kurylo, M.J.; Moortgat, G.K.; Wine, P.H.; Ravishankara, A.R.; Kolb, C.E.; Molina, M.J.; Finlayson-Pitts, B.J.; Orkin, V.L. Chemical Kinetics and Photochemical Data for Use in Atmospheric Studies Evaluation Number 15. Jet Propulsion Laboratory, National Aeronautics and Space Administration: Pasadena, CA, USA, 2006. [Google Scholar]
- Friendly, M.; Monette, G.; Fox, J. Elliptical Insights: Understanding Statistical Methods through Elliptical Geometry. Statist. Sci. 2013, 28(1), 1-39. [CrossRef]
- Monks, P.S.; Granier, C.; Fuzzi, S.; Stohl, A.; Williams, M.L.; Akimoto, H.; Amann, M.; Baklanov, A.; Baltensperger, U.; Bey, I.; Blake, N.; Carslaw, K.; Cooper, O.R.; Dentener, F.; Fowler, D.; Fragkou, E.; Frost, G.J.; Generoso, S.; Ginoux, P.; Grewe, V.; Guenther, A.; Hansson, H.C.; Henne, S.; Hjorth, J.; Hofzumahaus, A.; Huntrieser, H.; Isaksen, I.S.A.; Jenkin, M.E.; Kaiser, J.; Kanakidou, M.; Klimont, Z.; Kulmala, M.; Laj, P.; Lawrence, M.G.; Lee, J.D.; Liousse, C.; Maione, M.; McFiggans, G.; Metzger, A.; Mieville, A.; Moussiopoulos, N.; Orlando, J.J.; O’Dowd, C.D.; Palmer, P.I.; Parrish, D.D.; Petzold, A.; Platt, U.; Pöschl, U.; Prévôt, A.S.H.; Reeves, C.E.; Reimann, S.; Rudich, Y.; Sellegri, K.; Steinbrecher, R.; Simpson, D.; ten Brink, H.; Theloke, J.; van der Werf, G.R.; Vautard, R.; Vestreng, V.; Vlachokostas, C.; von Glasow, R. Atmospheric composition change – global and regional air quality. Atmos. Environ. 2009, 43(33), 5268-5350. [CrossRef]
- Lelieveld, J.; Berresheim, H.; Borrmann, S.; Crutzen, P.J.; Dentener, F.J.; Fischer, H.; Feichter, J.; Flatau, P.J.; Heland, J.; Holzinger, R.; Korrmann, R.; Lawrence, M.G.; Levin, Z.; Markowicz, K.M.; Mihalopoulos, N.; Minikin, A.; Ramanathan, V.; De Reus, M.; Roelofs, G.J.; Scheeren, H.A.; Sciare, J.; Schlager, H.; Schultz, M.; Siegmund, P.; Steil, B.; Stephanou, E.G.; Stier, P.; Traub, M.; Warneke, C.; Williams, J.; Ziereis, H. Global Air Pollution Crossroads over the Mediterranean. Science 2002, 298, 794–799. [Google Scholar] [CrossRef]
- Henne, S.; Furger, M.; Nyeki, S.; Steinbacher, M.; Neininger, B.; de Wekker, S.F.J.; Dommen, J.; Spichtinger, N.; Stohl, A.; Prévôt, A.S.H. Quantification of topographic venting of boundary layer air to the free troposphere. Atmos. Chem. Phys. 2004, 4(2), 497-509. [CrossRef]
- Duncan, B.N.; West, J.J.; Yoshida, Y.; Fiore, A.M.; Ziemke, J.R. The influence of European pollution on ozone in the Near East and northern Africa. Atmos. Chem. Phys. 2008, 8(8), 2267-2283. [CrossRef]
- Italian Civil Aviation Authority (ENAC – Ente Nazionale per l’Aviazione Civile). 2020 Air Traffic Data. Report issued on April 20th 2021. https://www.enac.gov.it/news/dati-di-traffico-2020#:~:text=Sono%20stati%2052.759.724%20i,del%20%2D72%2C5%25 (accessed on 15 August 2024).
- Schultz, M.G.; Akimoto, H.; Bottenheim, J.; Buchmann, B.; Galbally, I.E.; Gilge, S.; Helmig, D.; Koide, H.; Lewis, A.C.; Novelli, P.C.; Plass-Dülmer, C.; Ryerson, T.B.; Steinbacher, M.; Steinbrecher, R.; Tarasova, O.; Tørseth, K.; Thouret, V.; Zellweger, C. The Global Atmosphere Watch reactive gases measurement network. Elem. Sci. Anth. 2015, 3, 000067. [CrossRef]
- Cleveland, W.S.; Graedel, T.E.; Kleiner, B.; Warner, J.L. Sunday and Workday Variations in Photochemical Air Pollutants in New Jersey and New York. Science 1974, 186, 1037–1038. [Google Scholar] [CrossRef] [PubMed]
- Elkus, B.; Wilson, K.R. Photochemical air pollution: Weekend-weekday differences. Atmos. Environ. 1977, 11(6), 509-515. [CrossRef]
- Karl, T.R. Day of the week variations of photochemical pollutants in the St. Louis area. Atmos. Environ. 1978, 12(8), 1657-1667. [CrossRef]
- Balthasar, N.; Ohnmacht, T.; Z’Rotz, J.; Hostettler Macias, L.; Rérat, P. The effects of teleworking on CO2 emissions from commuting: baselining key data to investigate transformative change in living labs. Consumption and Society 2024, 20, 1–23. [Google Scholar] [CrossRef]
- Safieddine, S.; Boynard, A.; Coheur, P.-F.; Hurtmans, D.; Pfister, G.; Quennehen, B.; Thomas, J.L.; Raut, J.-C.; Law, K.S.; Klimont, Z.; Hadji-Lazaro, J.; George, M.; Clerbaux, C. Summertime tropospheric ozone assessment over the Mediterranean region using the thermal infrared IASI/MetOp sounder and the WRF-Chem model. Atmos. Chem. Phys. 2014, 14(18), 10119-10131. [CrossRef]
- Spandonidis, C.; Paraskevopoulos, D.; Saravanos, C. Neighborhood-Level Particle Pollution Assessment during the COVID-19 Pandemic via a Novel IoT Solution. Sustainability 2023, 15, 8233. [Google Scholar] [CrossRef]
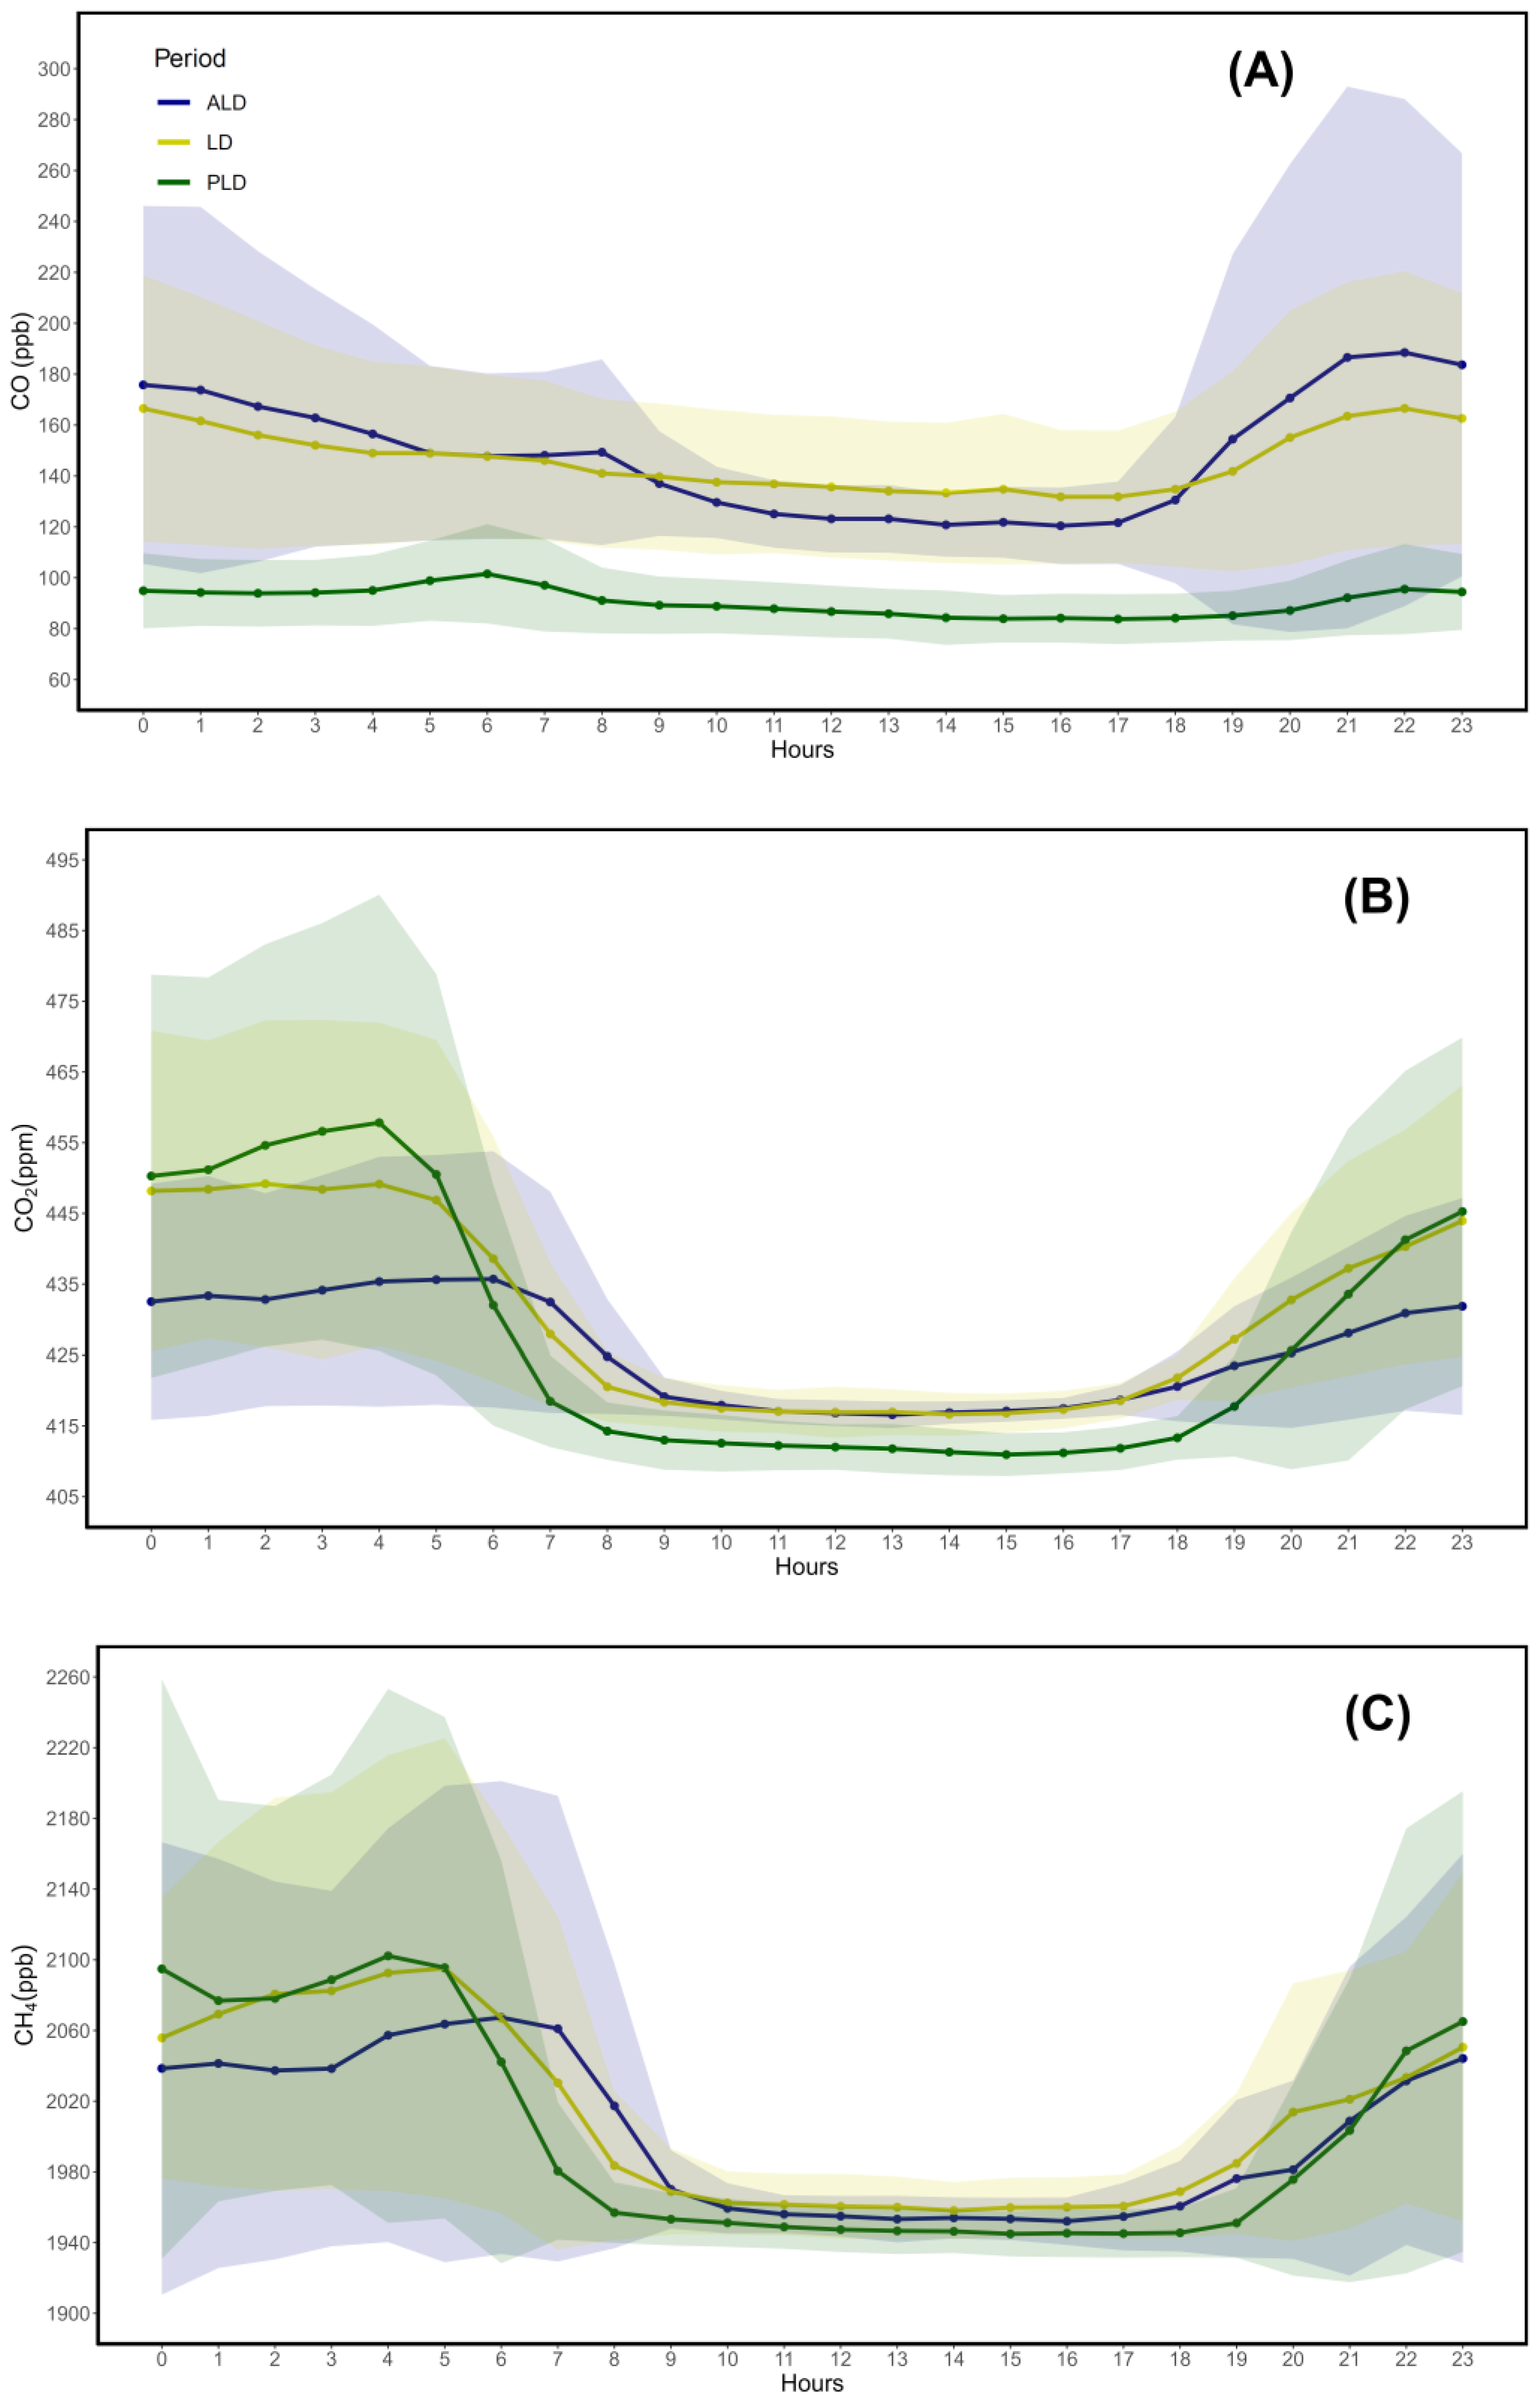
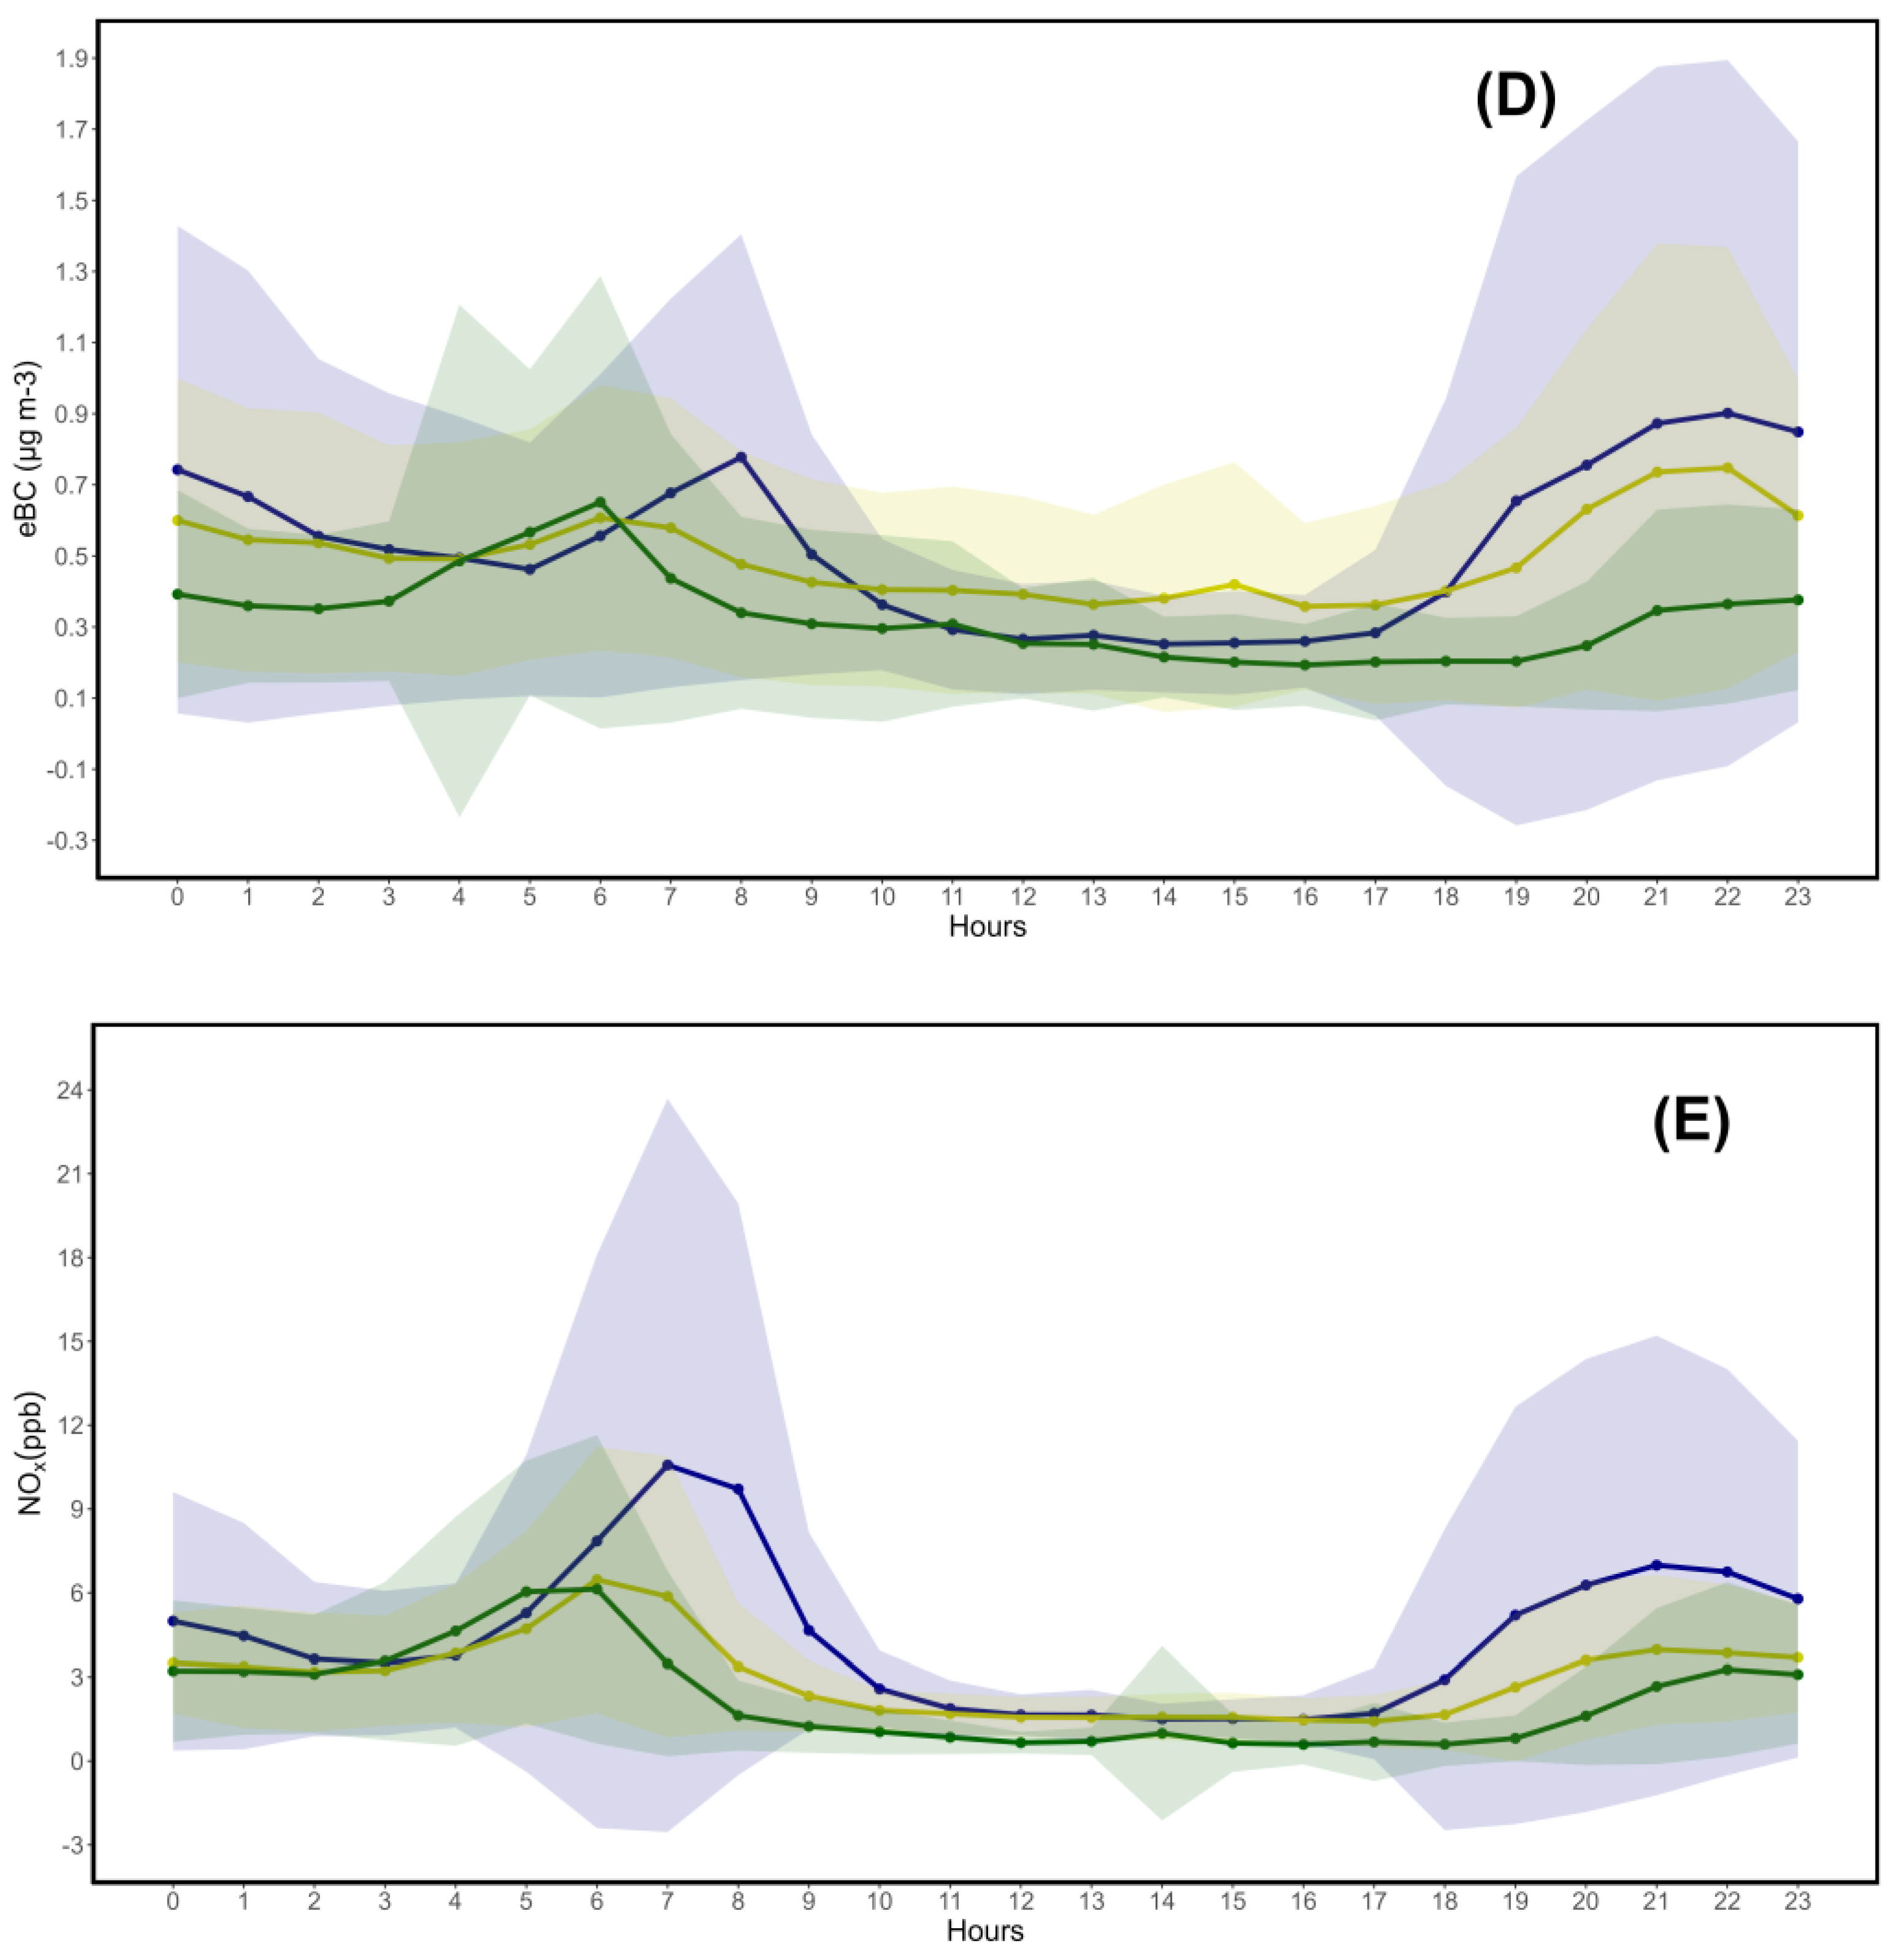
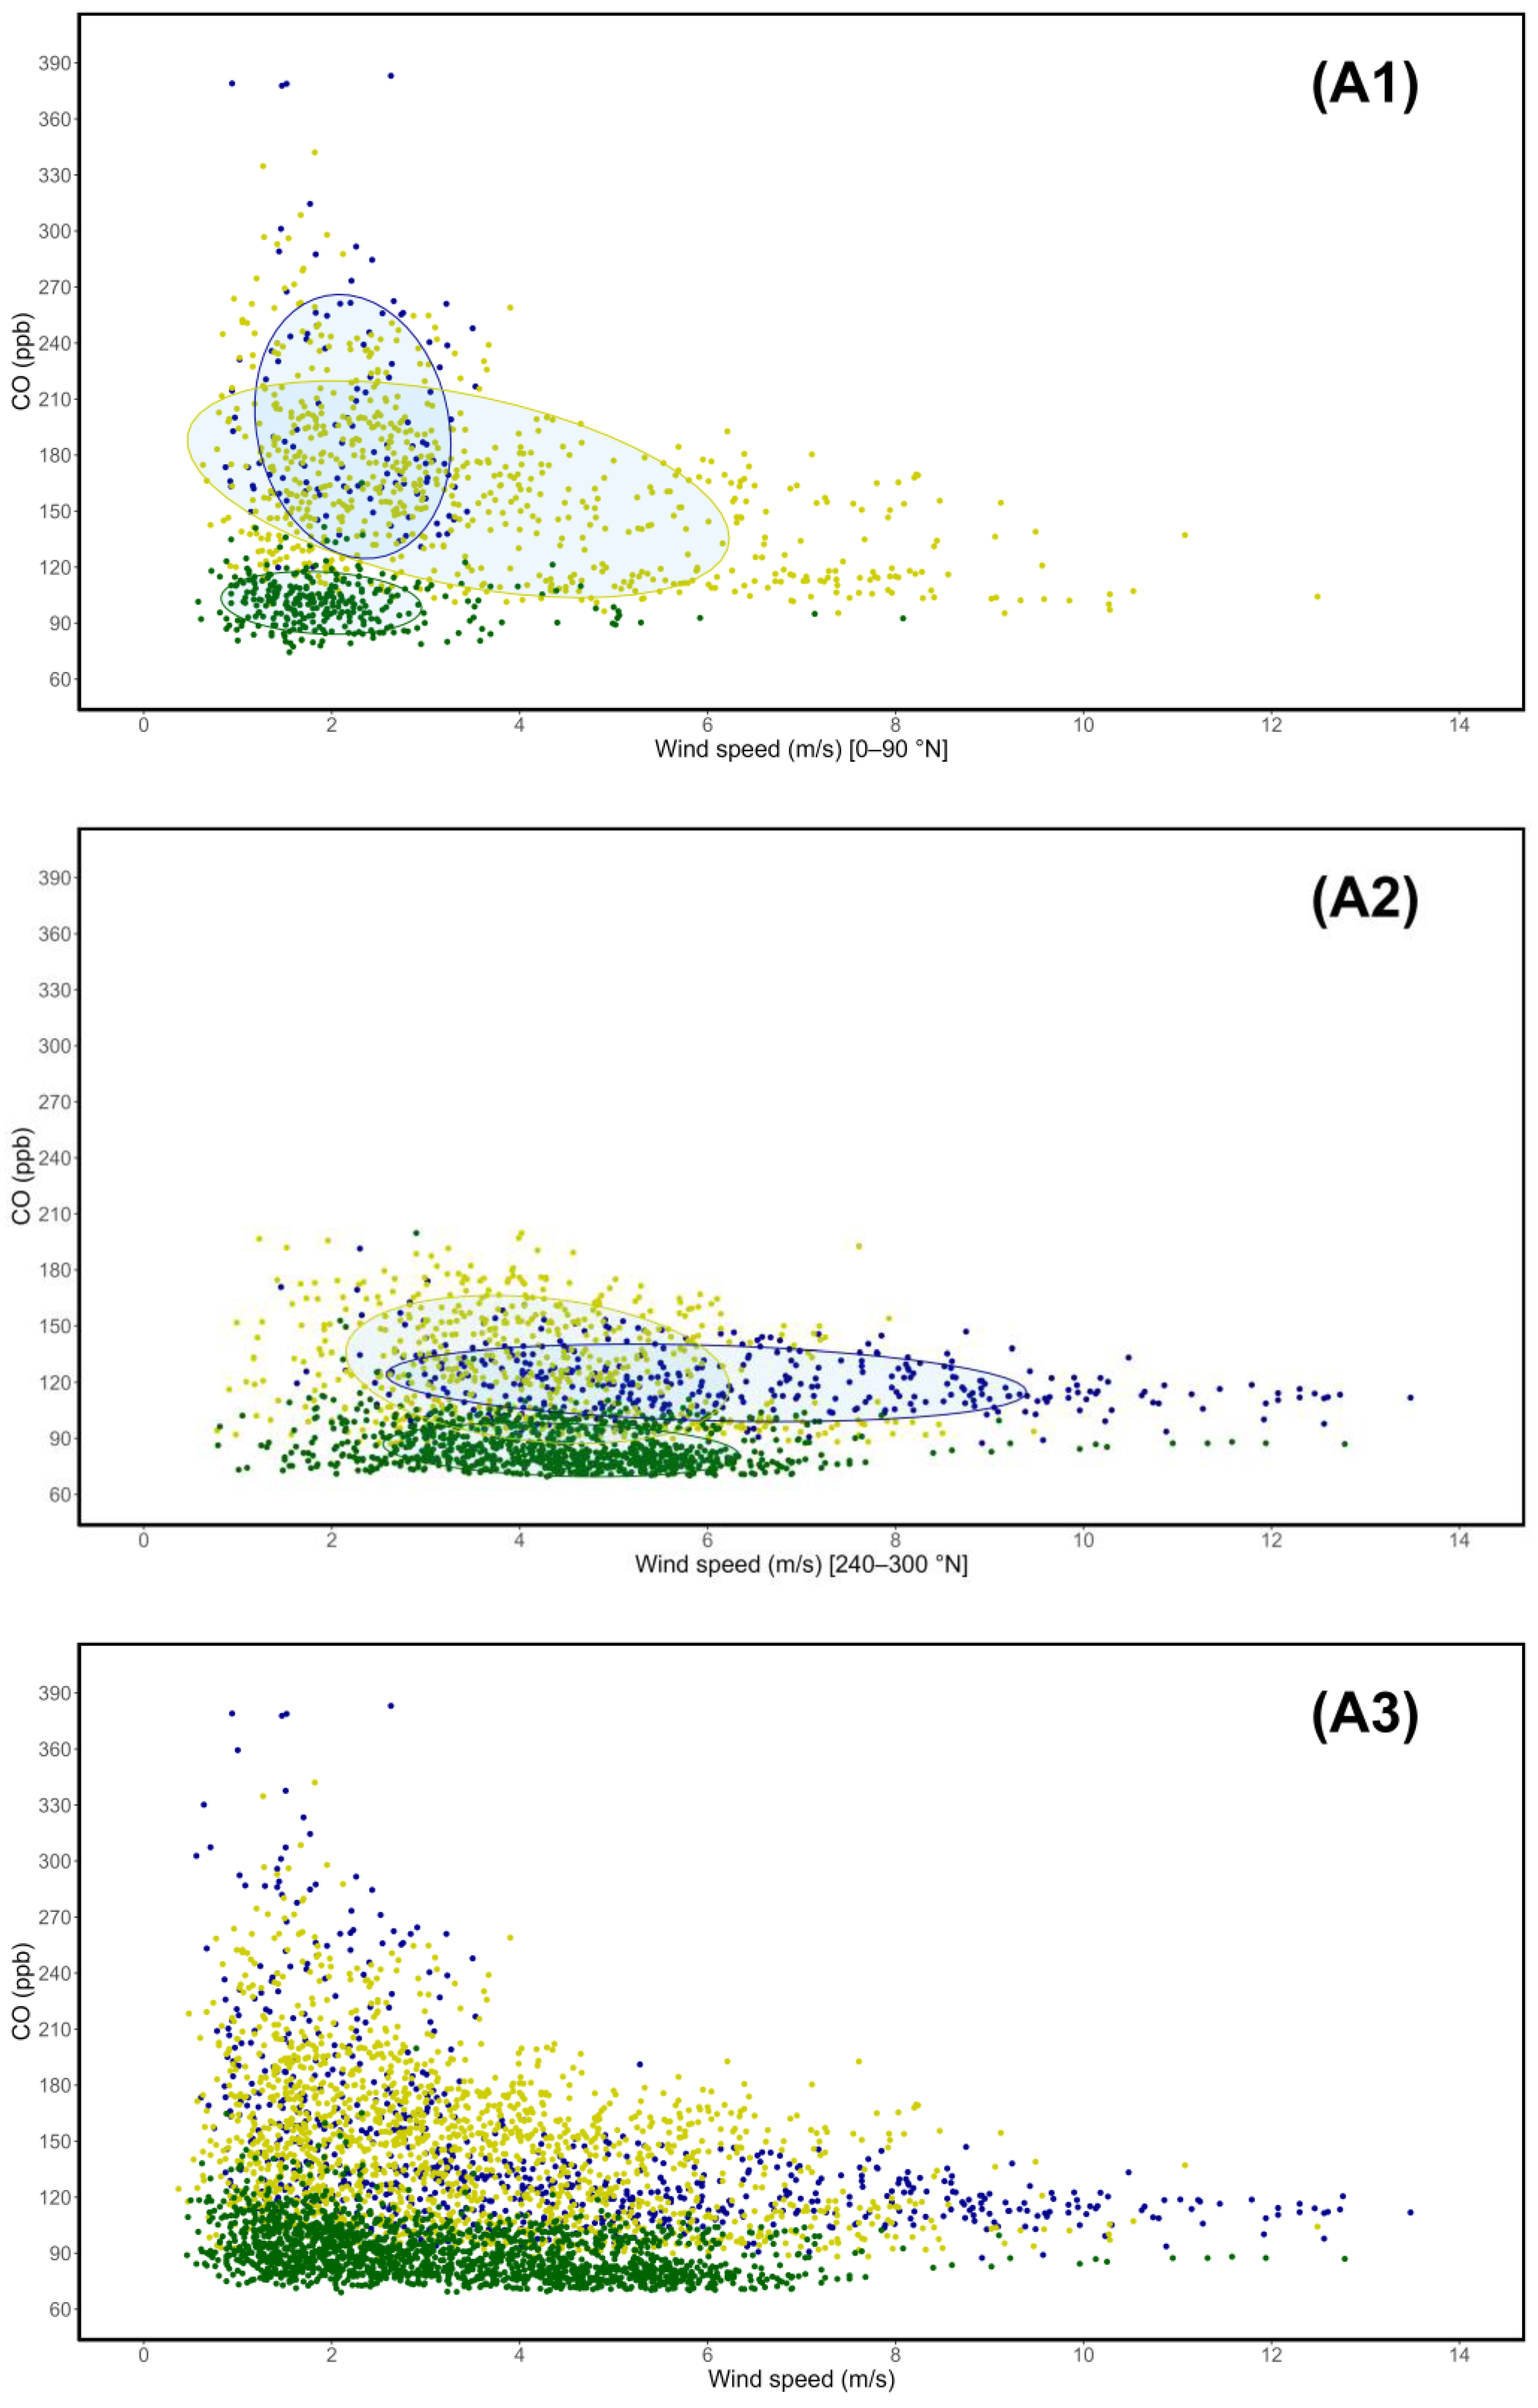
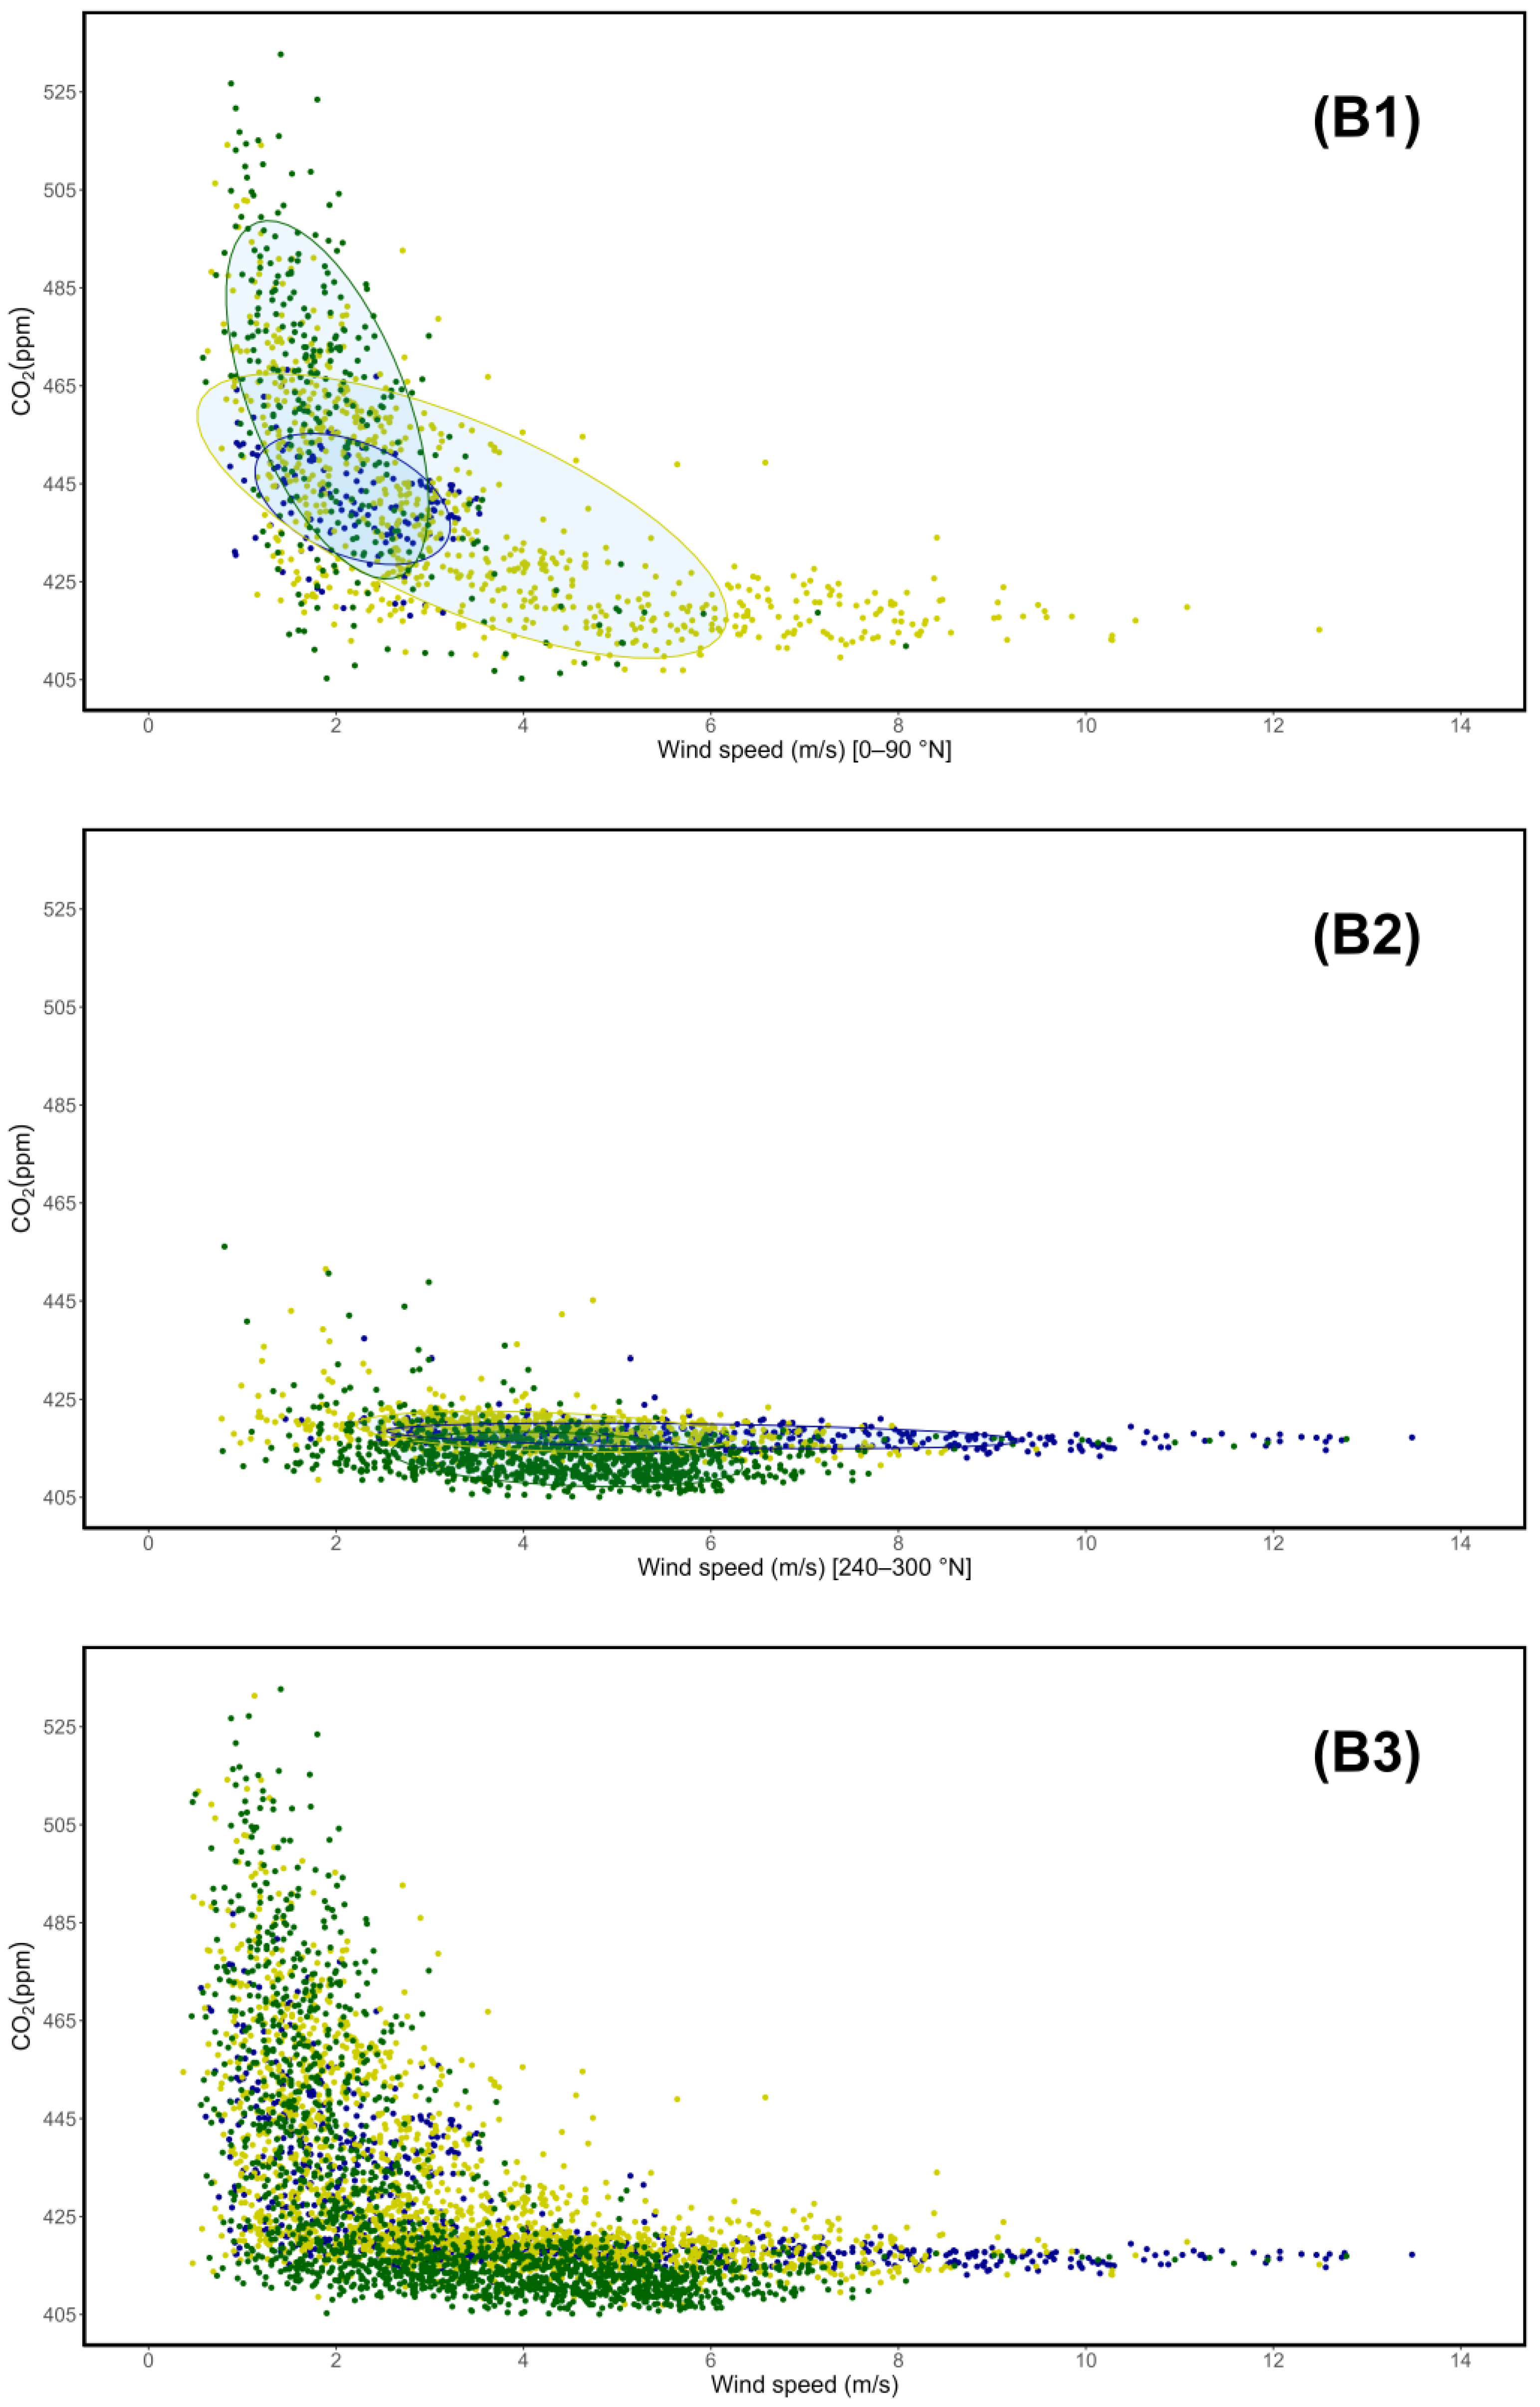
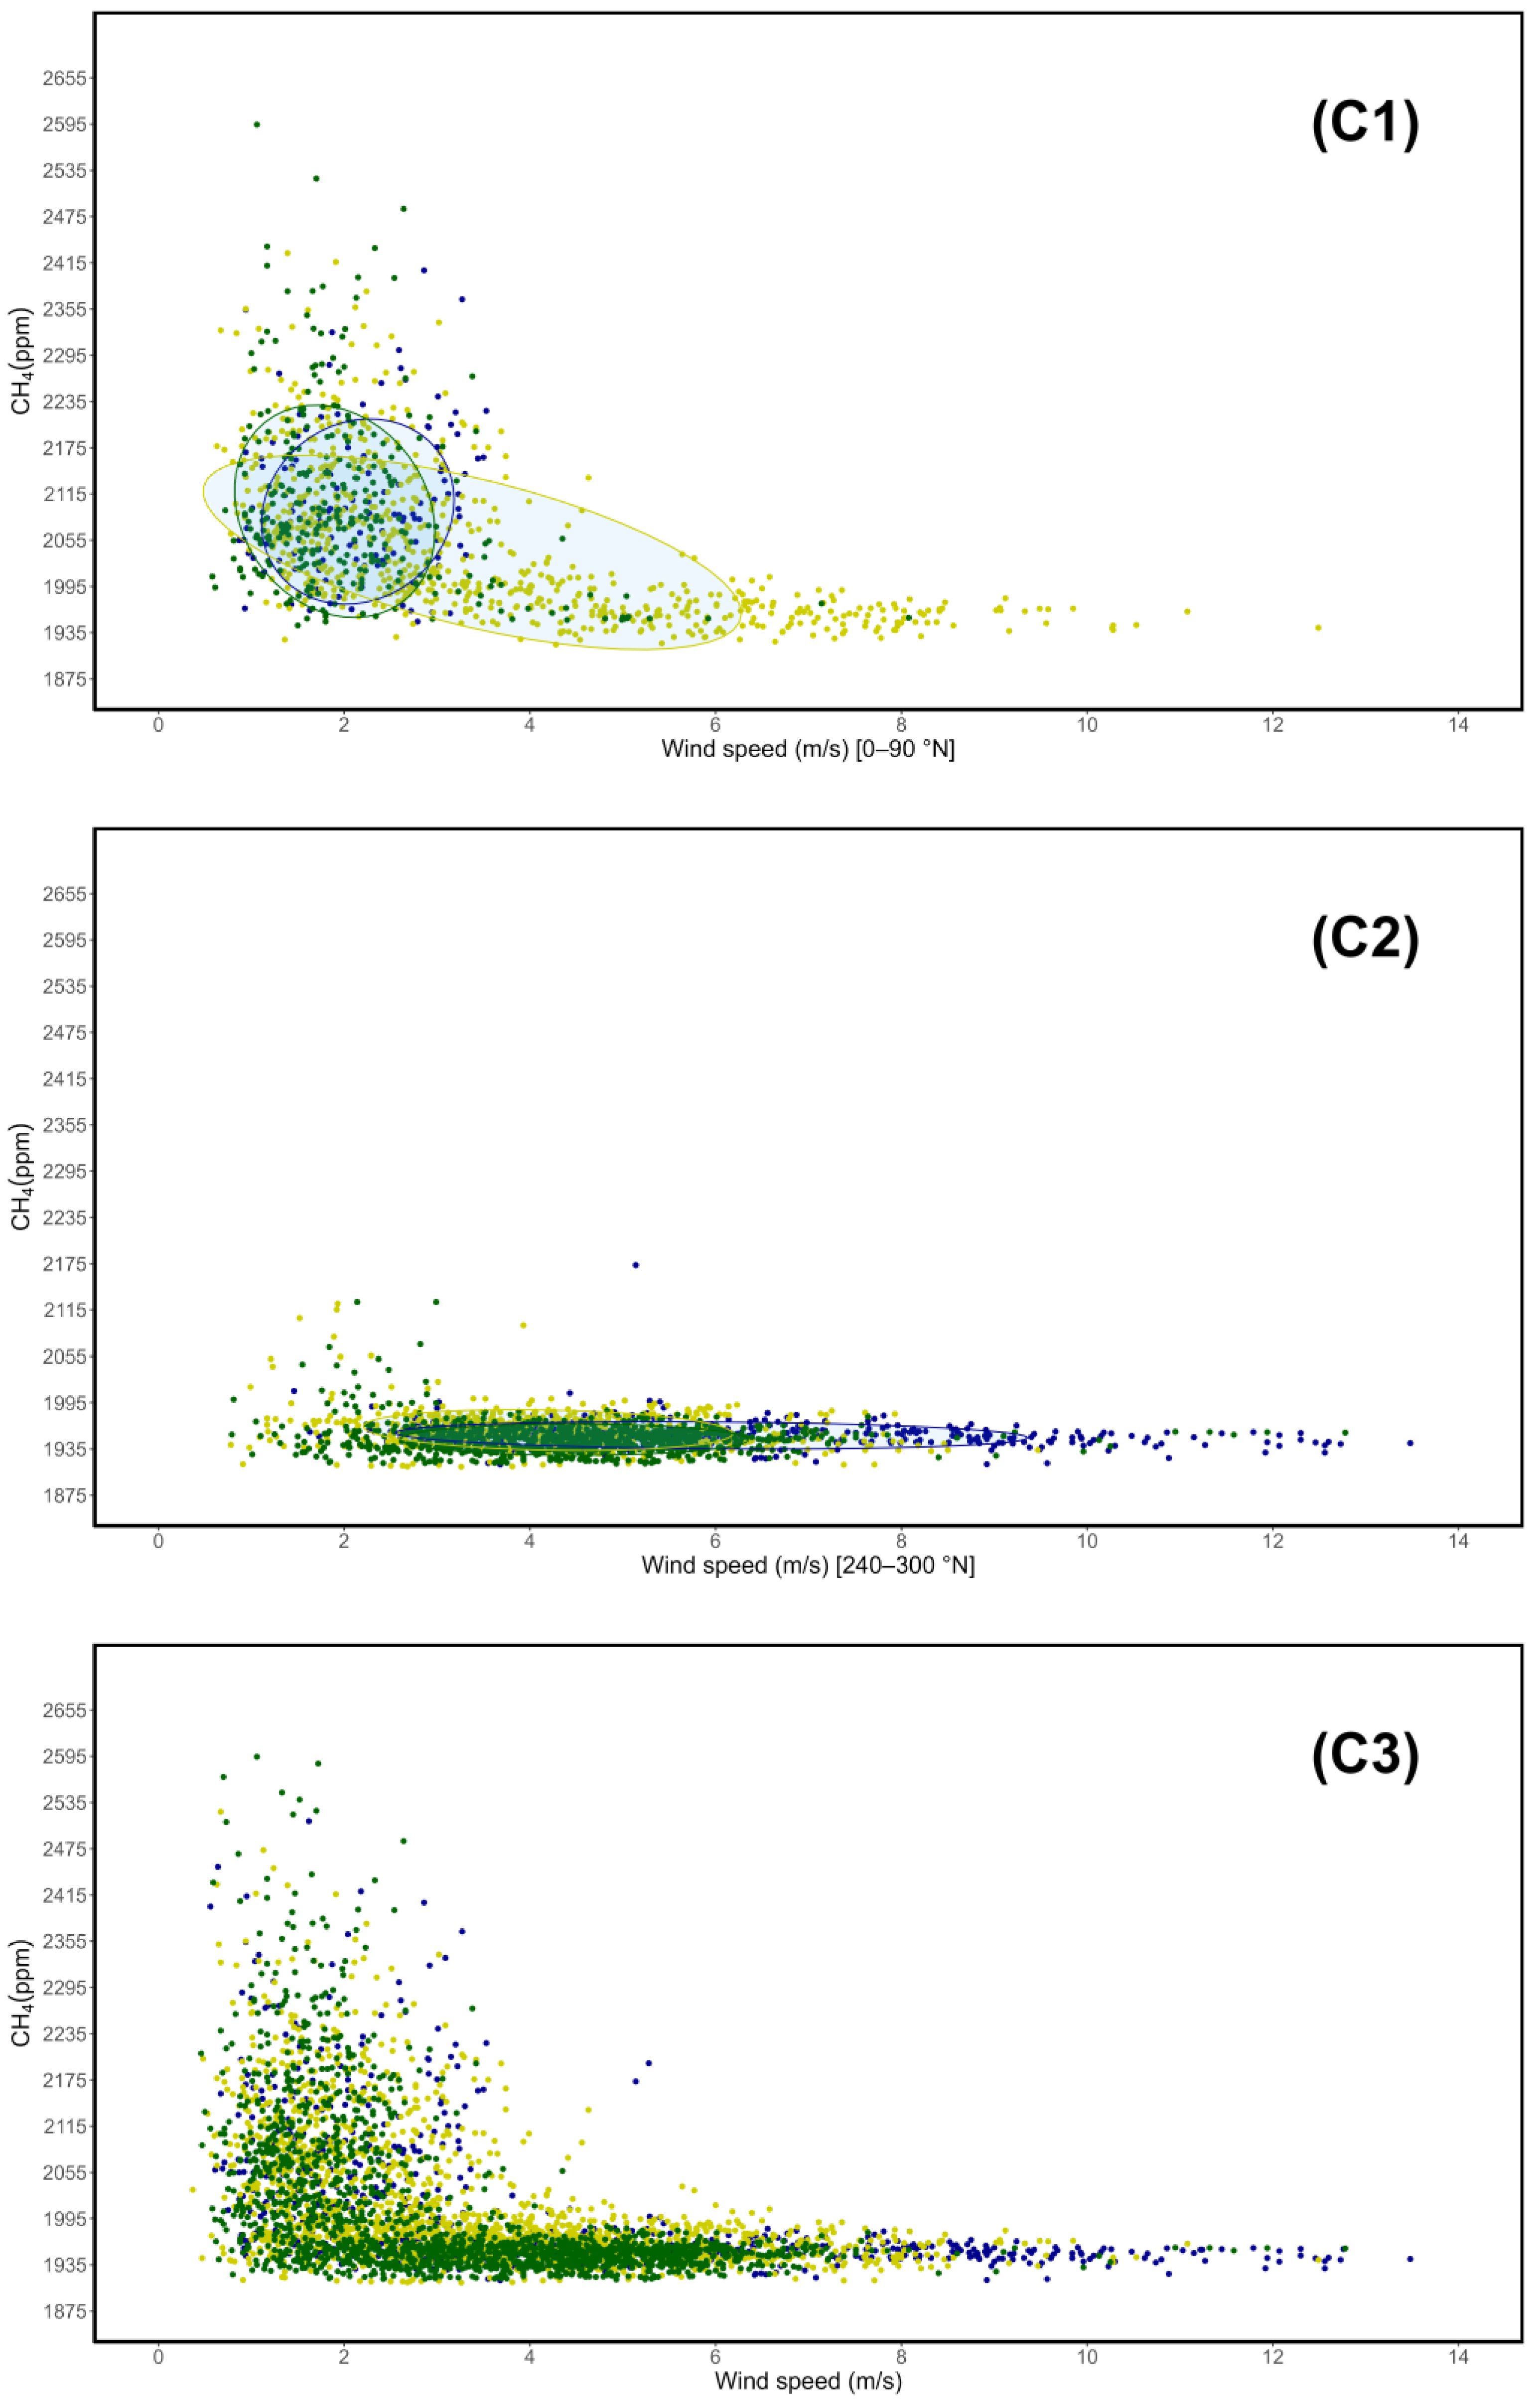
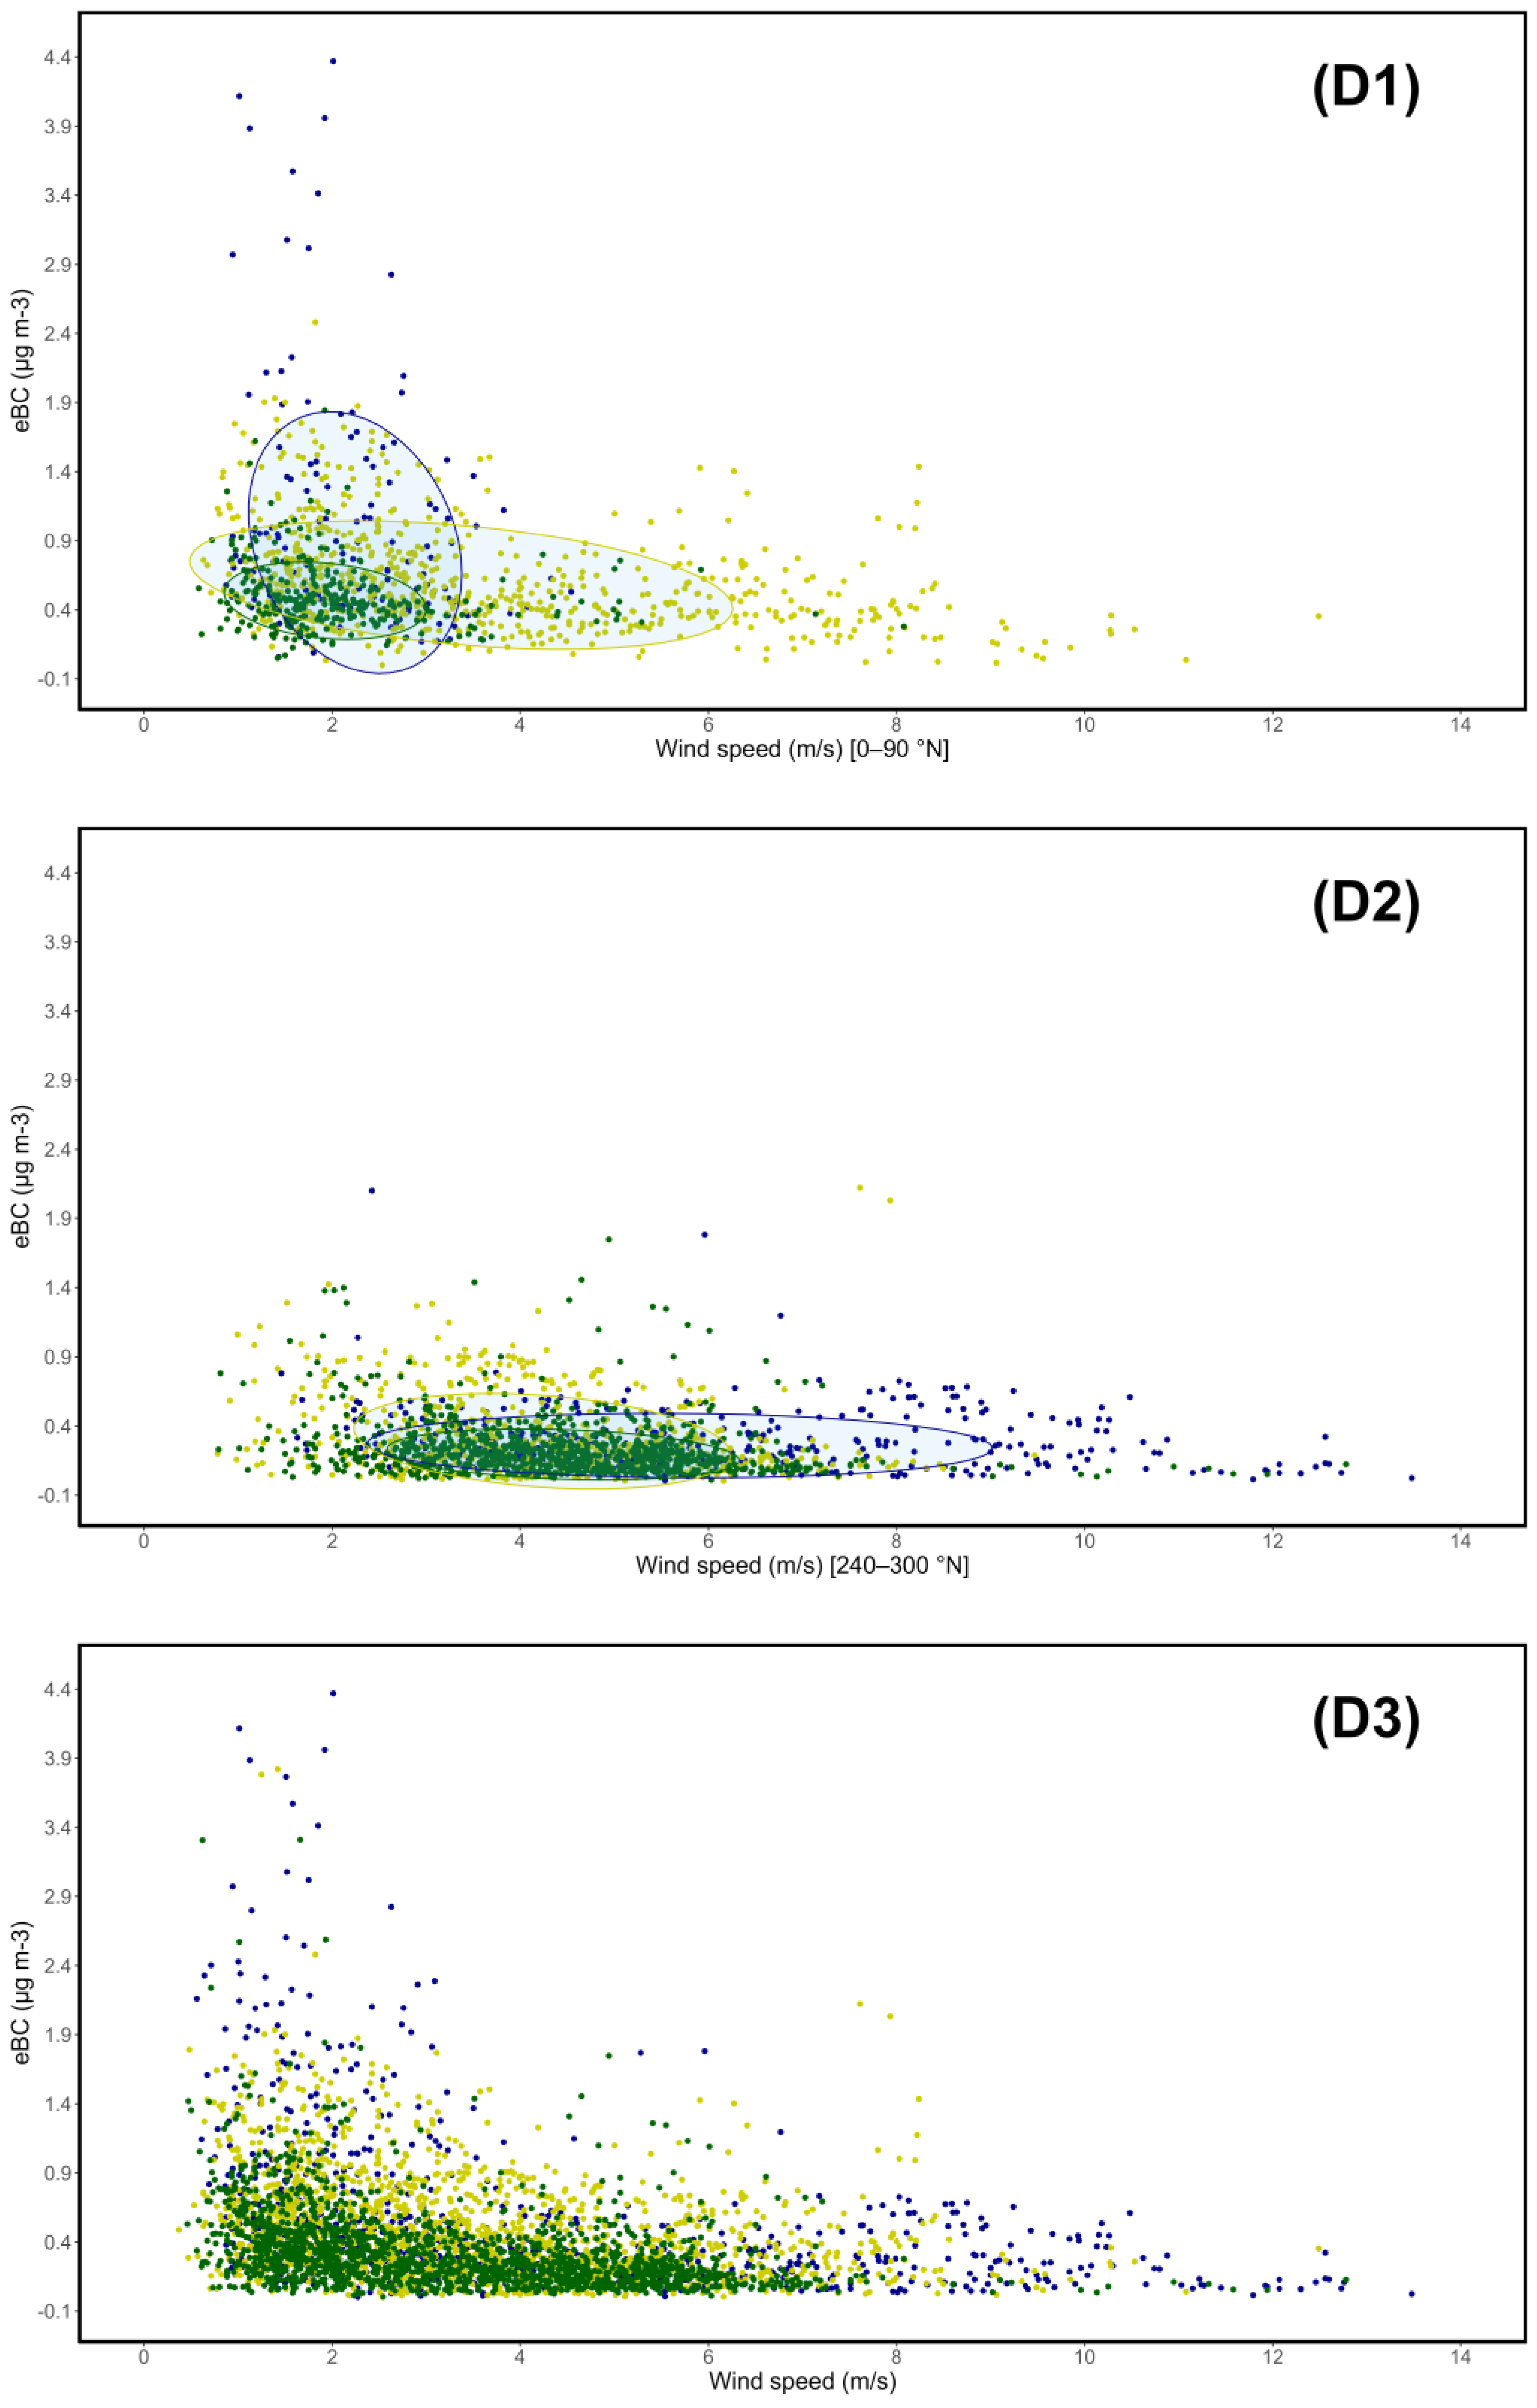
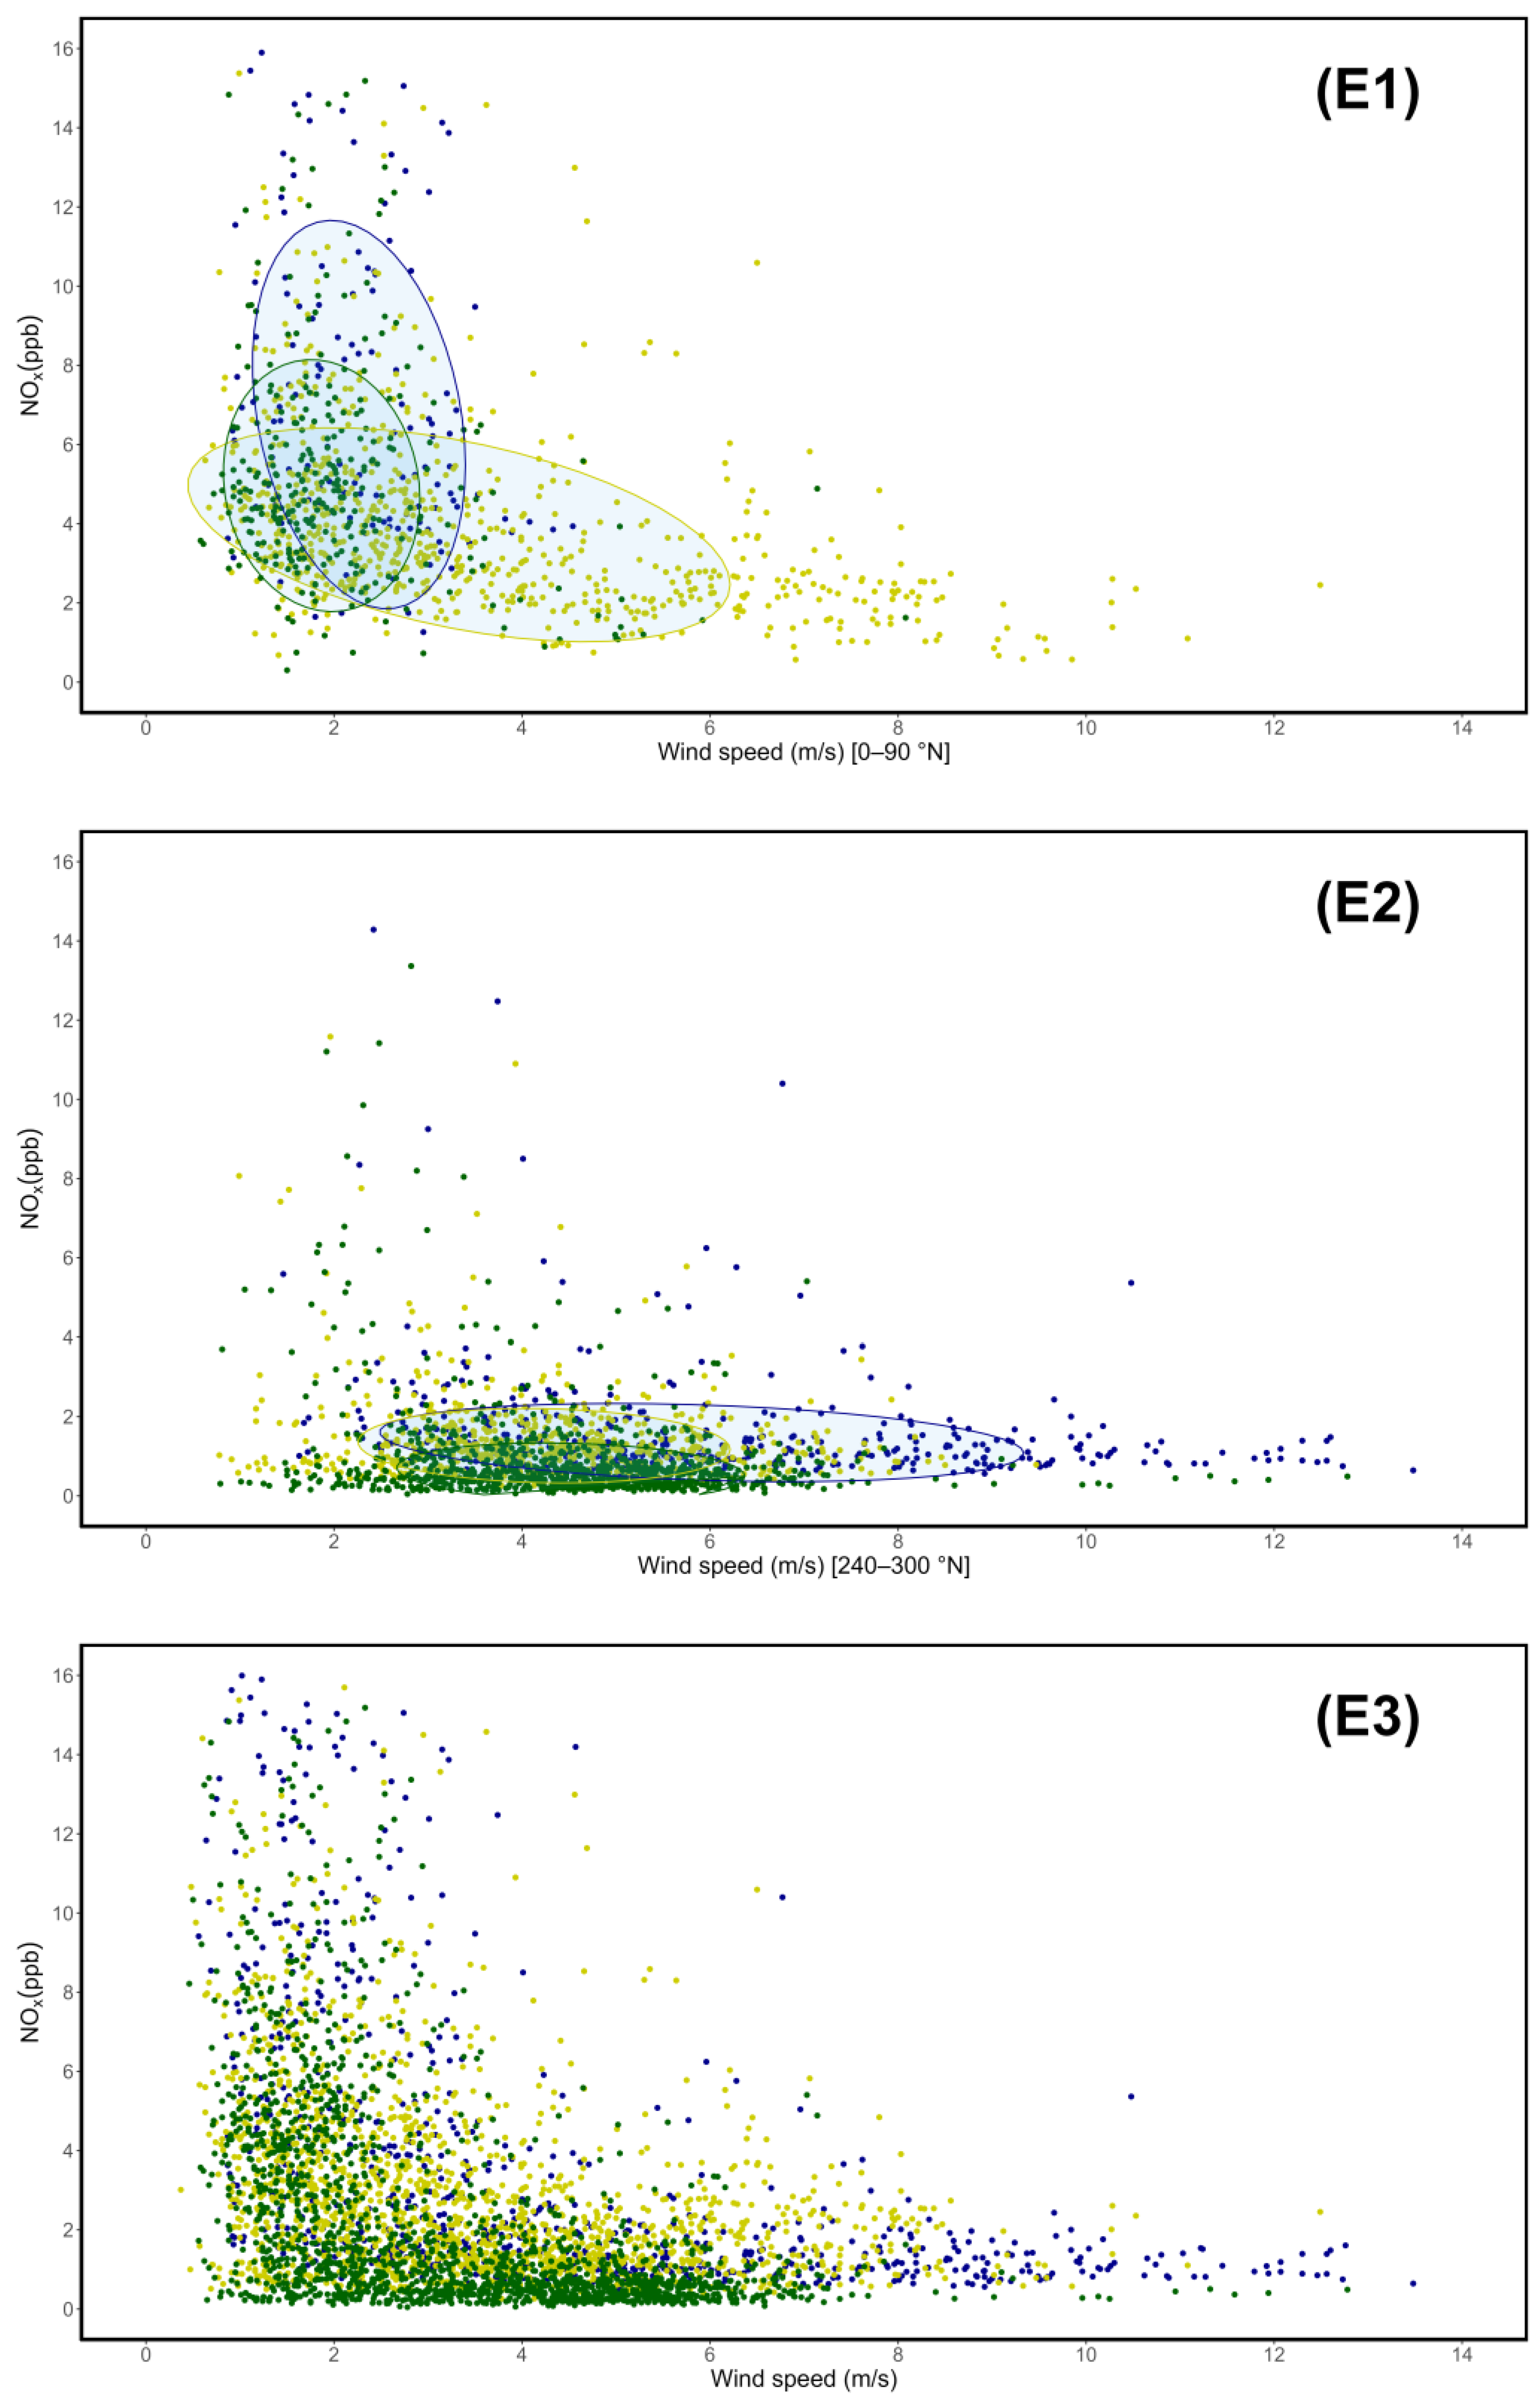
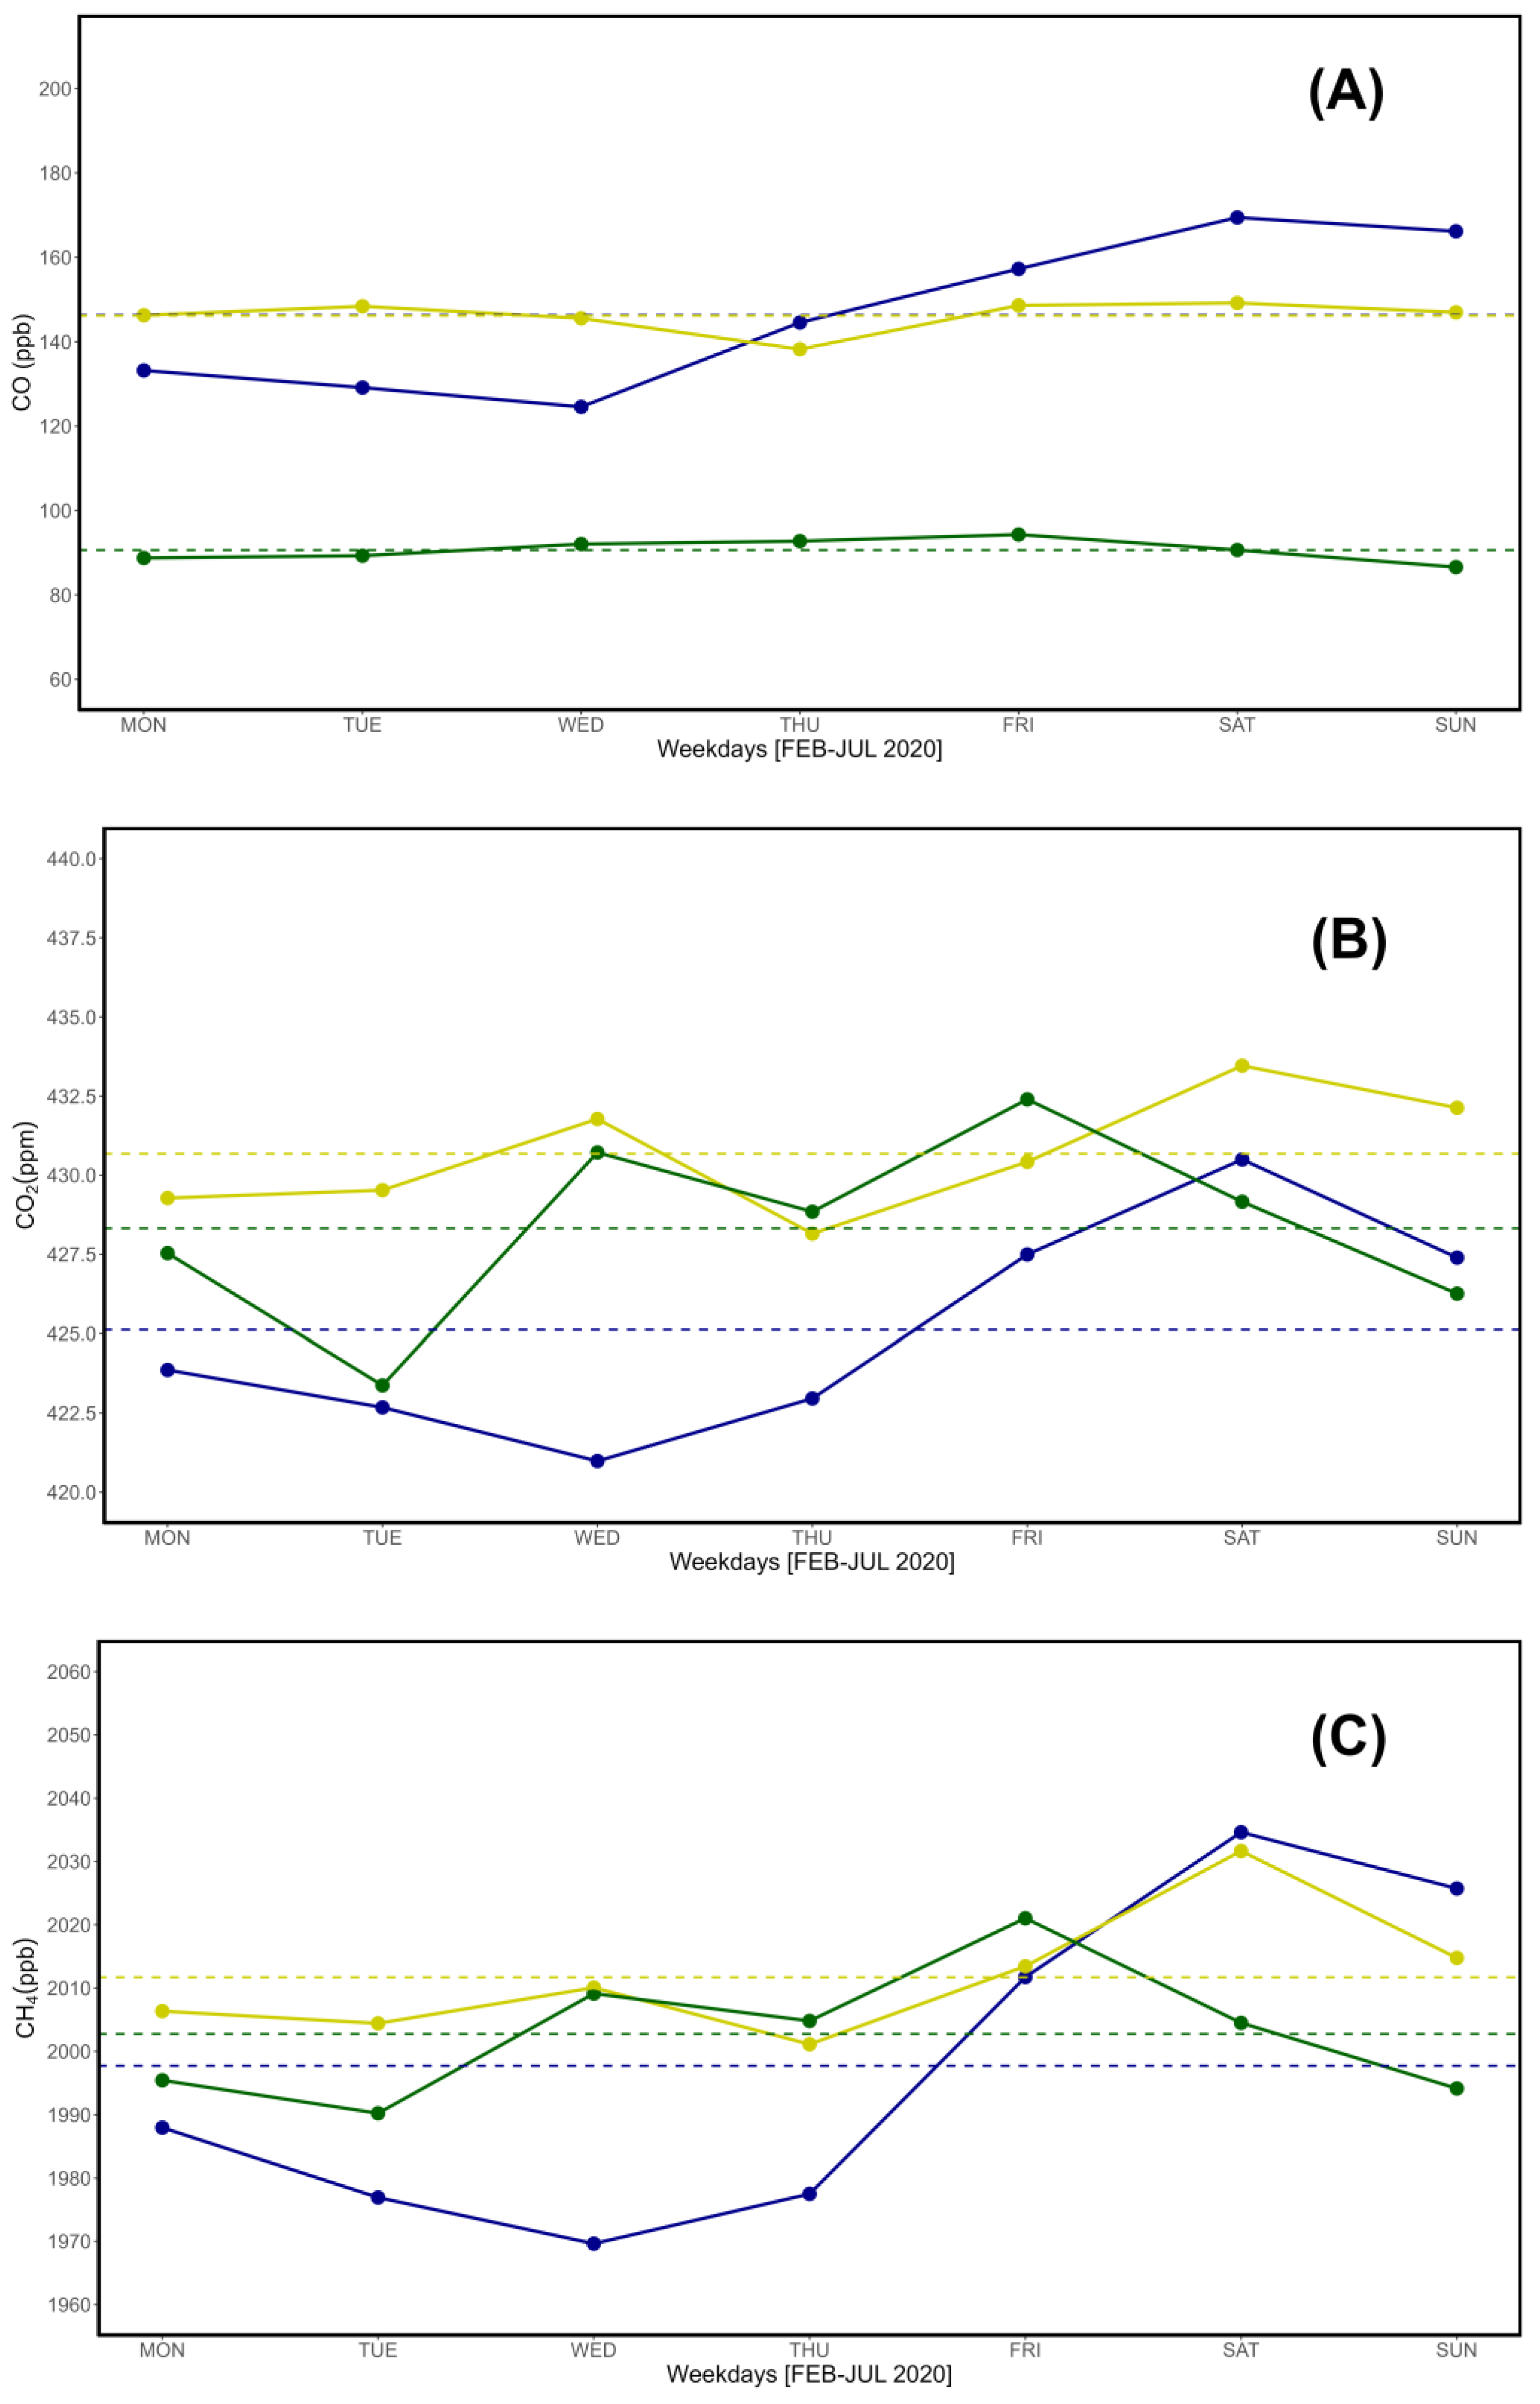
| Type | Count | G2401 (%) | T5012 (%) | T42i (%) | WXT520 (%) |
|---|---|---|---|---|---|
| Hours | 4368 | 97.32 | 96.15 | 97.57 | 100 |
| Days | 182 | 97.8 | 97.8 | 97.8 | 100 |
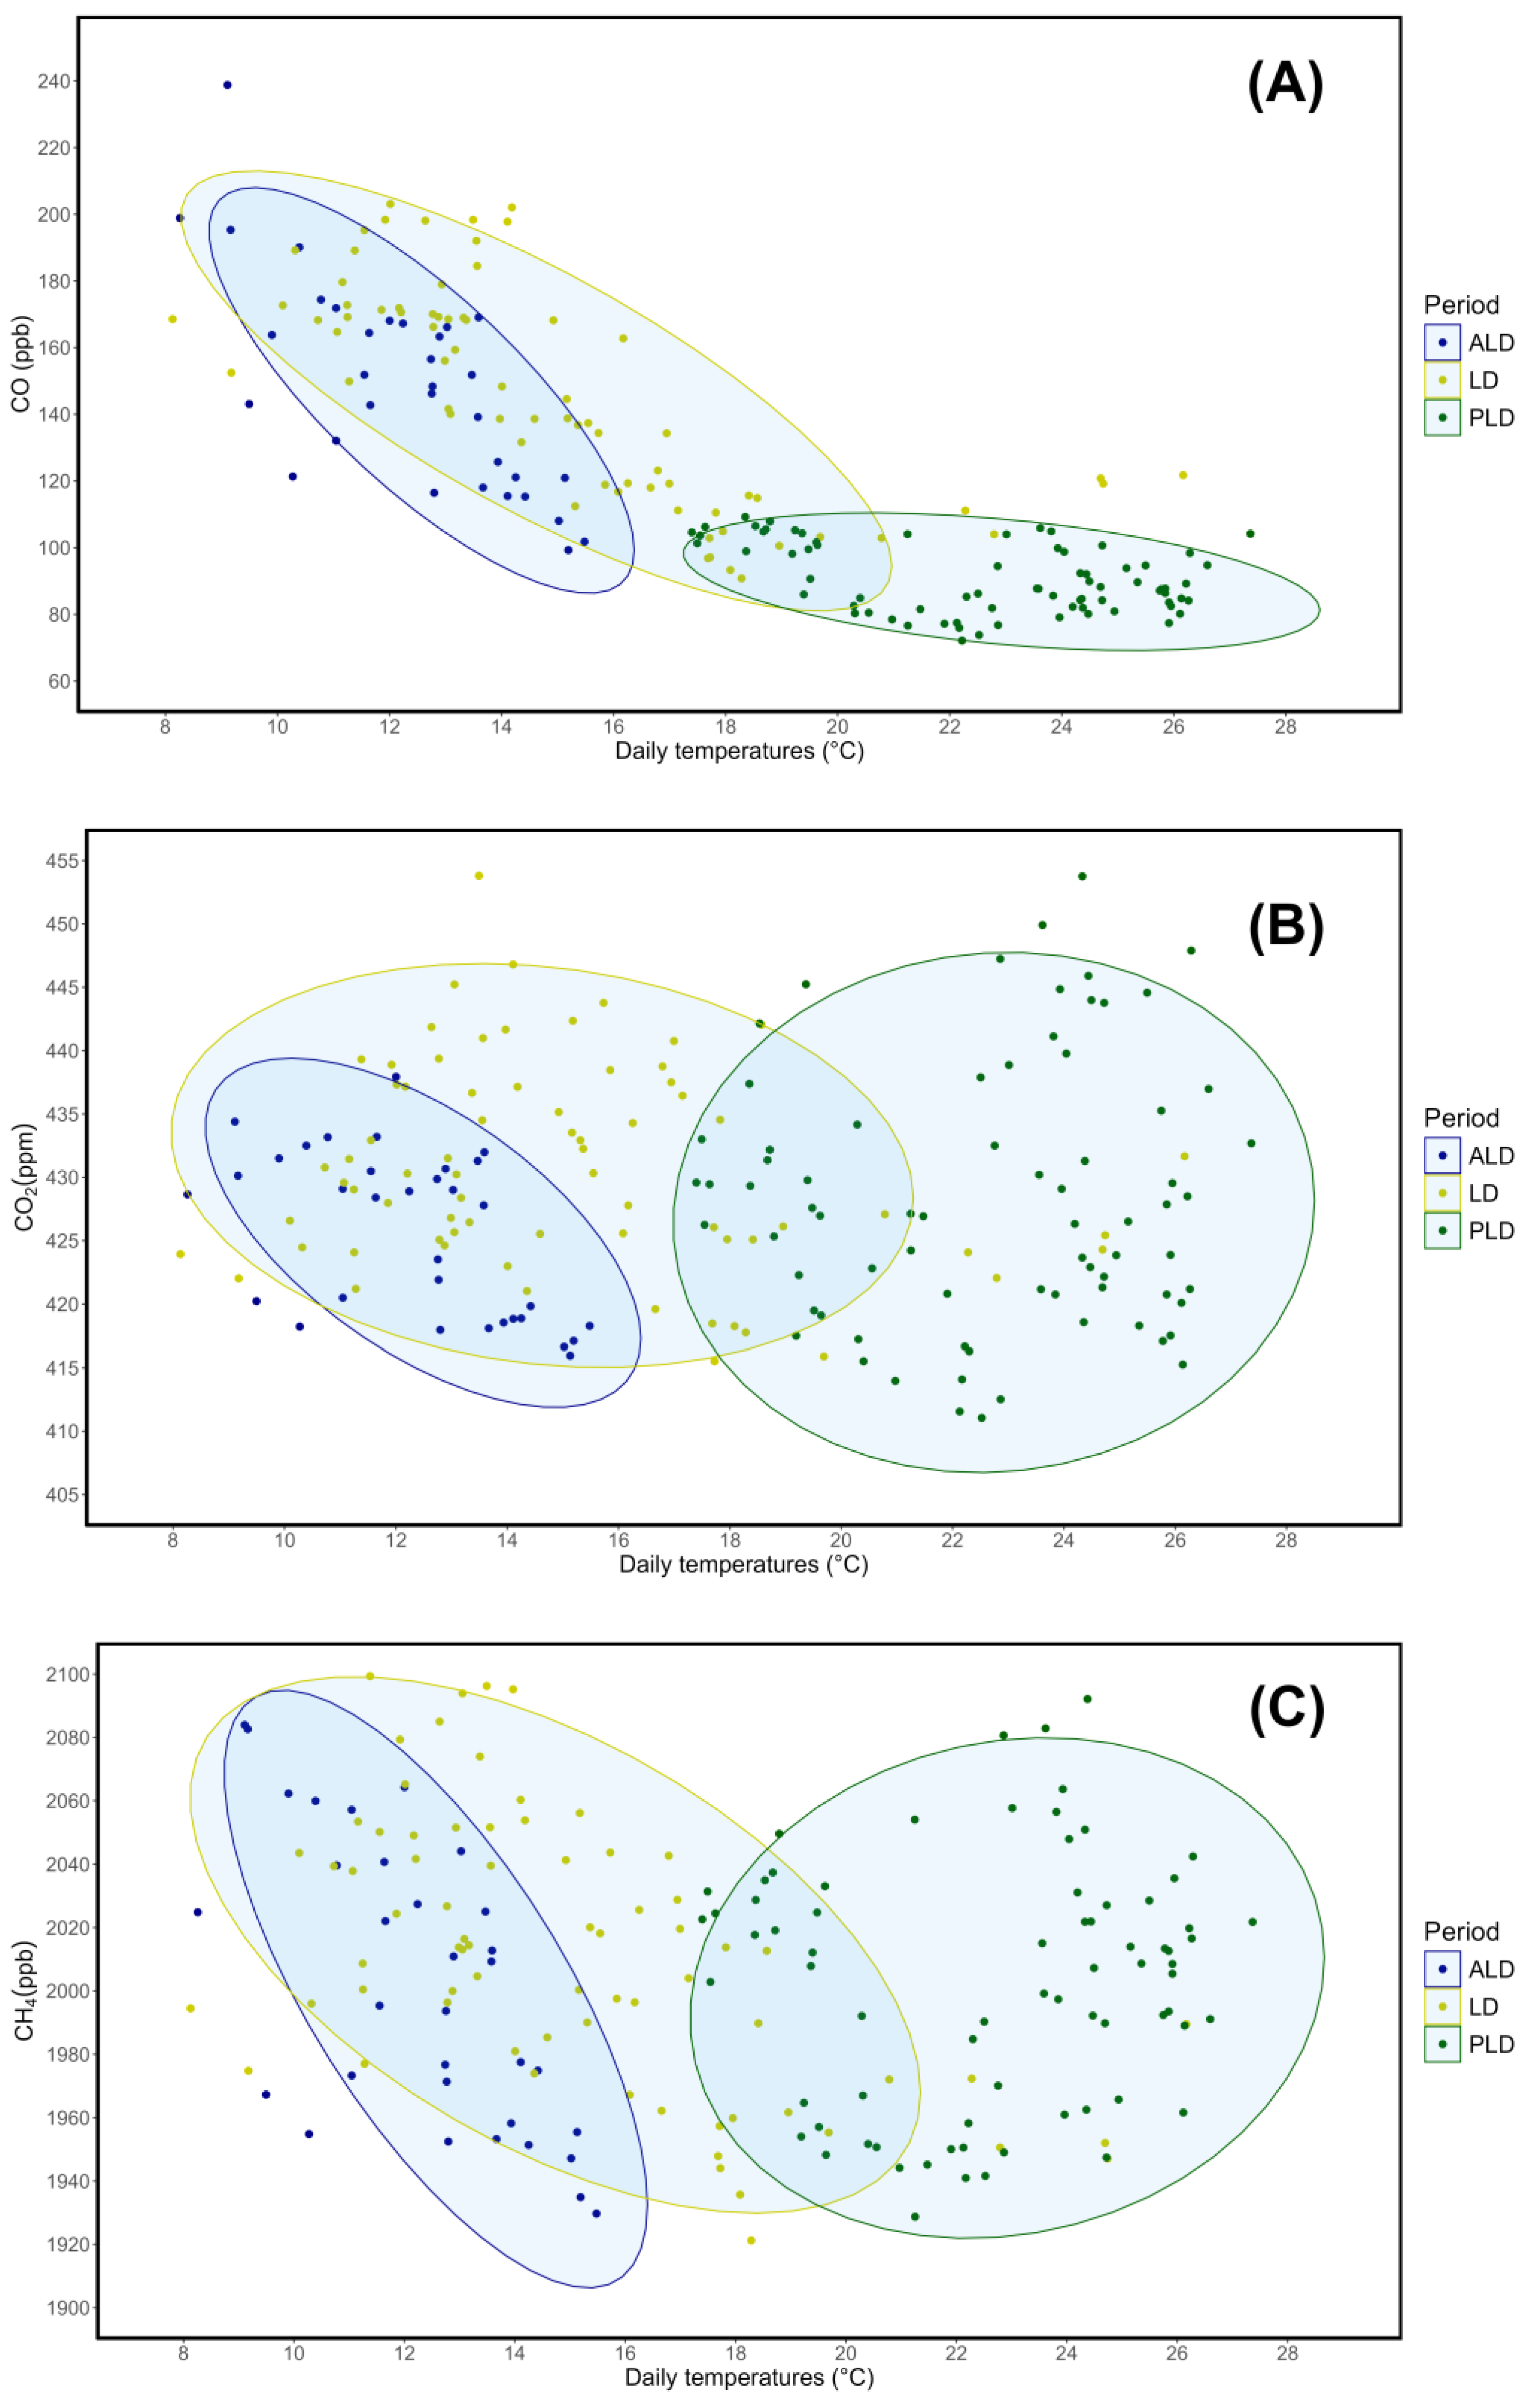
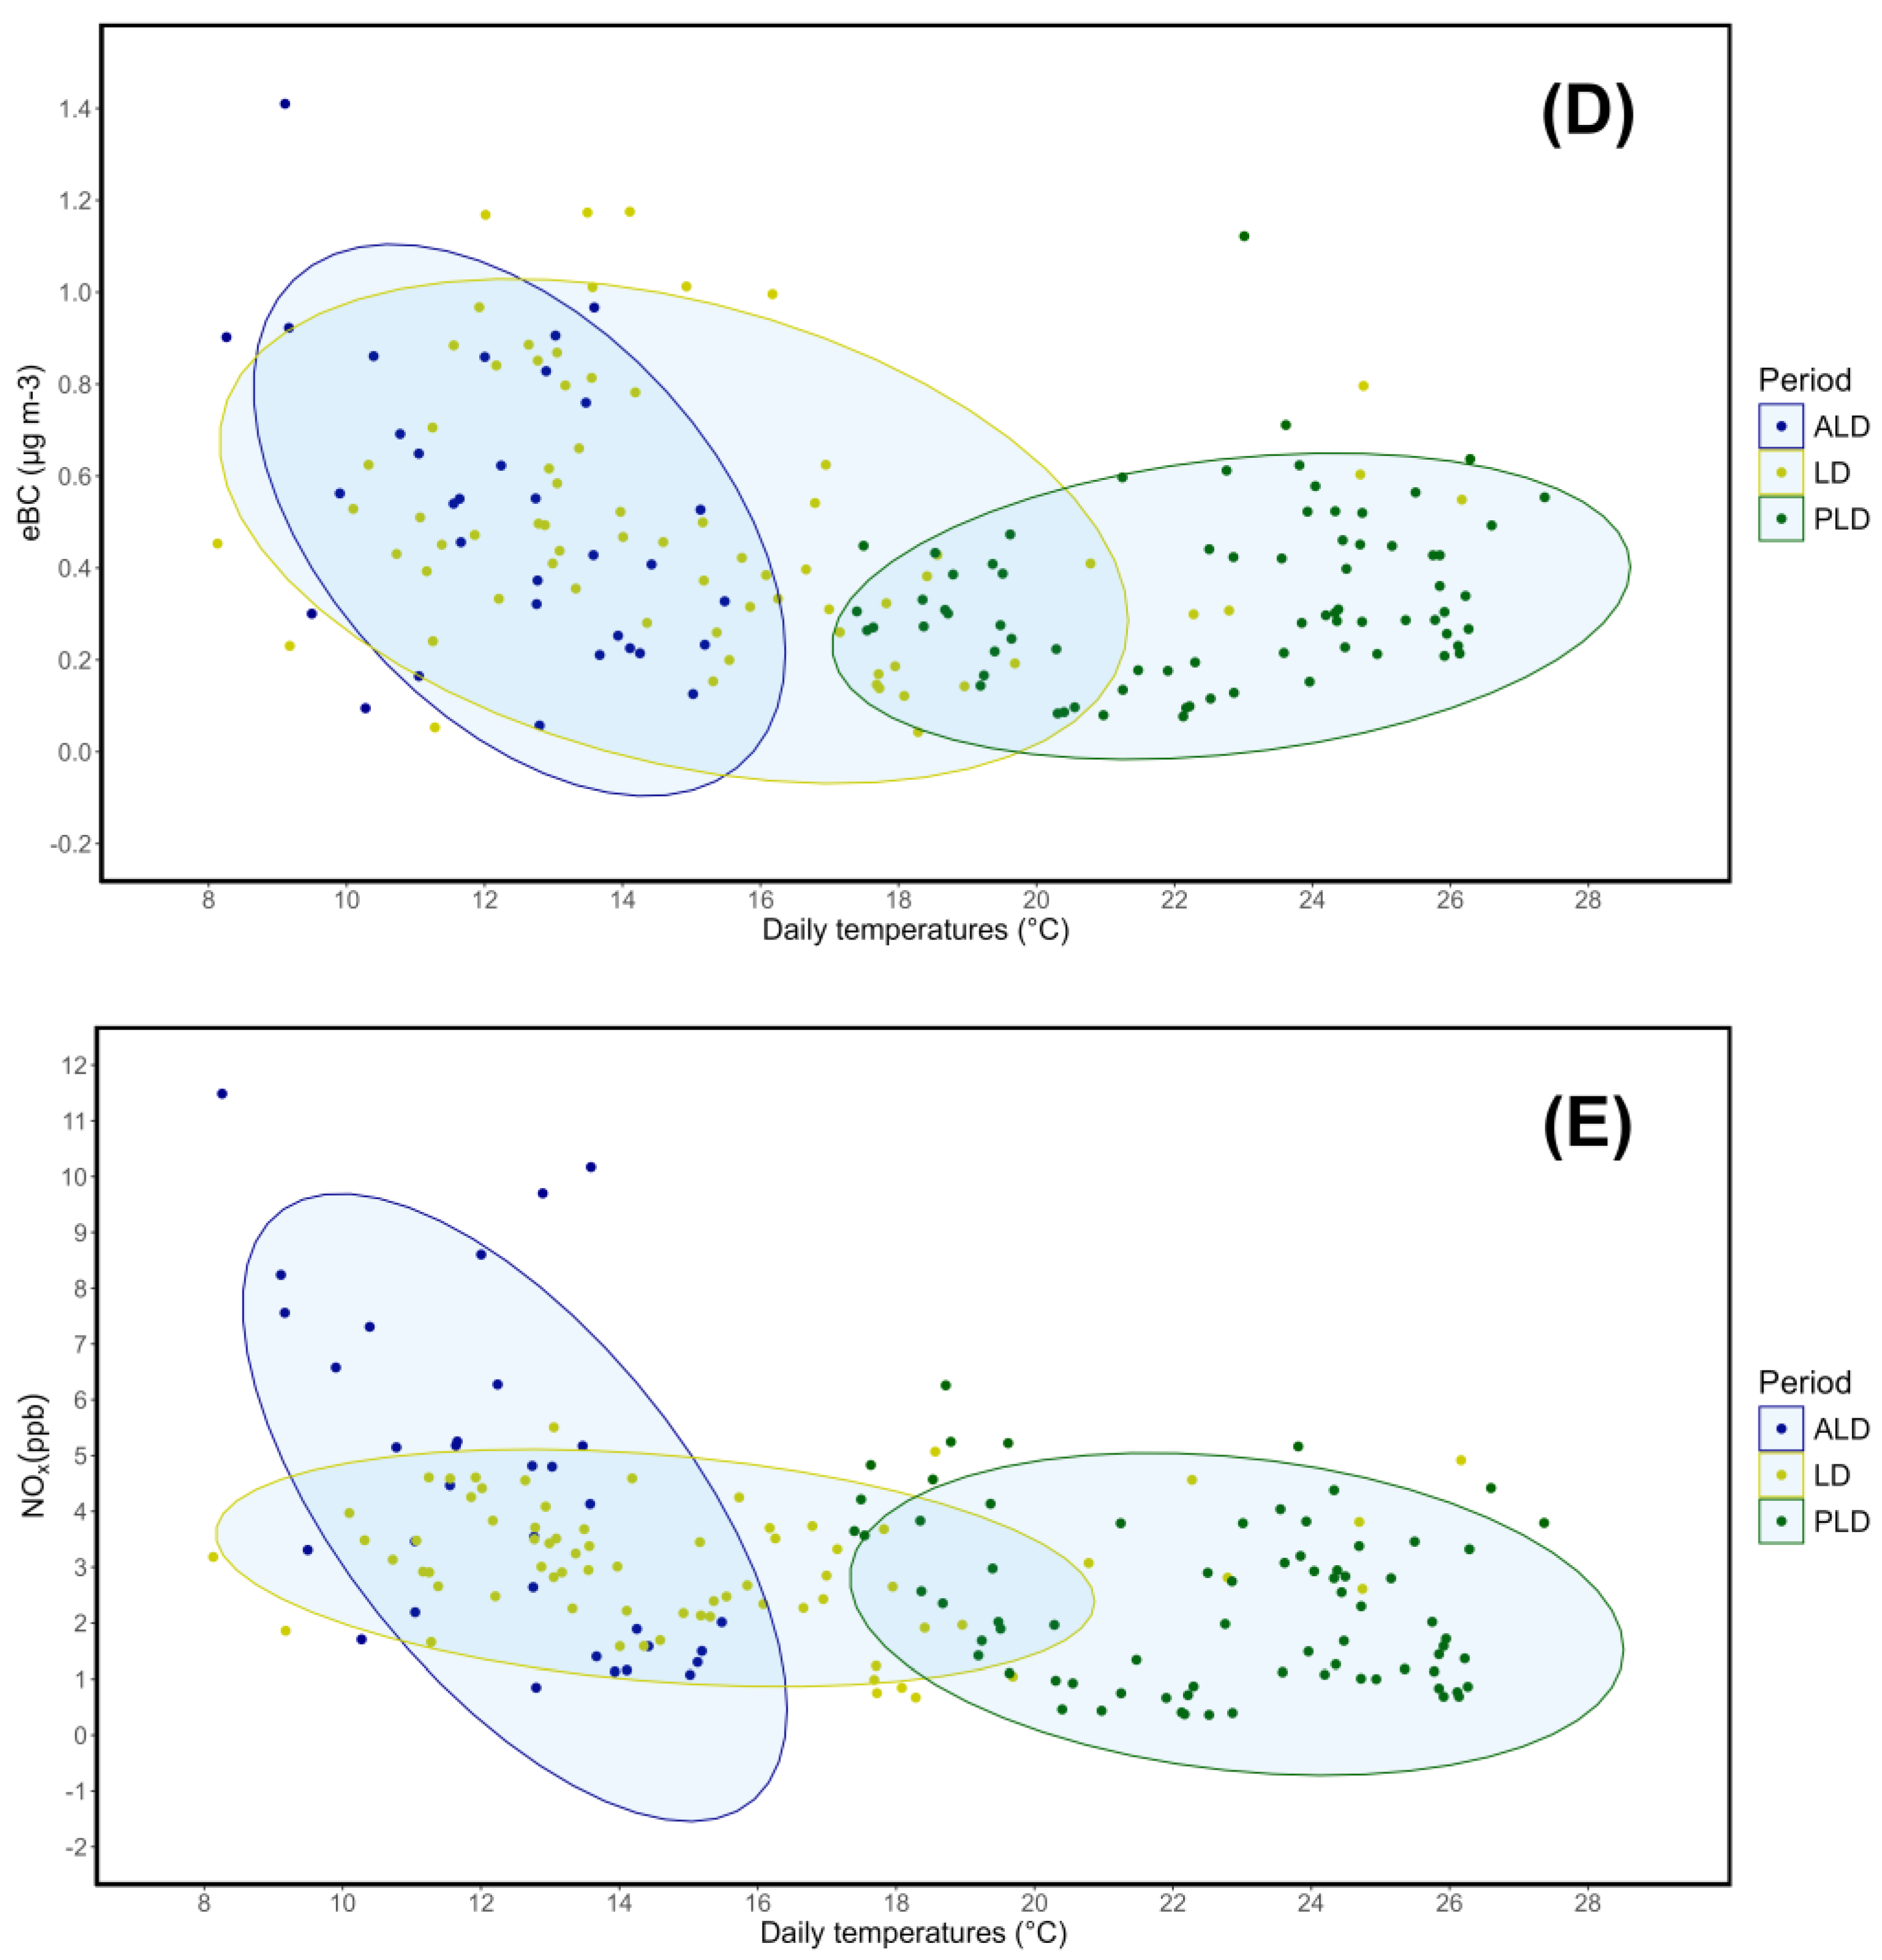
| Parameter | Linear | Quadratic |
|---|---|---|
| CO | 0.69 | 0.75 |
| CO2 | 0.001 | 0.006 |
| CH4 | 0.004 | 0.098 |
| eBC | 0.11 | 0.17 |
| NOx | 0.17 | 0.21 |
| Corridor | WXT520 | G2401 | T5012 | T42i |
|---|---|---|---|---|
| West | 2002 | 1937 | 1927 | 1934 |
| Northeast | 1167 | 1143 | 1123 | 1155 |
| Ratio | 1.71 | 1.69 | 1.71 | 1.67 |
Disclaimer/Publisher’s Note: The statements, opinions and data contained in all publications are solely those of the individual author(s) and contributor(s) and not of MDPI and/or the editor(s). MDPI and/or the editor(s) disclaim responsibility for any injury to people or property resulting from any ideas, methods, instructions or products referred to in the content. |
© 2024 by the authors. Licensee MDPI, Basel, Switzerland. This article is an open access article distributed under the terms and conditions of the Creative Commons Attribution (CC BY) license (http://creativecommons.org/licenses/by/4.0/).


