1. Introduction
Breast cancer is the most prevalent type of disease among women [
1]. It has become the foremost cause of death [
2]. Research shows that about 684,996 breast cancer death incidents were recorded in the year 2020 and about 2.3 million newly diagnosed cases [
3] There has been a 0.5% increase in incident rates annually in recent years [
4]. The diagnosis of breast cancer is based on the classification of tumors. Breast cancer early detection and diagnosis are vital for personalized treatment. Early detection can help health professionals and patients discover new treatment options and ensure higher survival rates with a better quality of life [
5]. There are two major types of cancer tumors namely, Benign and Malignant tumors [
6]. Early detection of breast cancer is anchored via Mammography (MG) [
7]. Mammography can detect early-stage breast cancer even when the lump has yet to fully form to a stage where it can be felt as a lump [
8]. However, there are occurrences of false diagnoses due to the complexities of MGs [
9] which require specialized health professionals. Due to the difficulty in distinguishing the tumors even by experts, there is a need to automate the diagnostic system [
10]. Automated procedures have emerged and been explored to address the limitation of misdiagnosis. Examples of automated diagnostic procedures include image analysis using computer-aided designs (CAD), Biomarker analysis, and Electronic Health Records. Automated procedures aim to assist doctors and health professionals’ diagnostic analysis and pattern recognition decisions [
11]. However, it poses other challenges like data quality, variability, and issues with human breast complexities. More recently, the deep learning approach has been showing a promising solution as it has shown capability in uncovering intricate features from massive amounts of mammographic images. Deep learning can analyze images at the pixel level thus enhancing the possibility of detecting important features that other methods may not detect. This ability to detect and extract meaningful information from images makes it a more viable procedure for improving the accuracy of breast cancer diagnosis.
While the use of mammography has been effective in reducing the mortality rate of breast cancers [
12] there are major drawbacks to this procedure. Interpreting a mammogram accurately is usually a challenge for many radiologists [
13]. Also, analyzing tons of mammogram images is not practicable for radiologists; the task consumes a lot of time and is exhausting, which leads to false positives or false negatives [
14] . According to [
13], errors in diagnosis constituted the most common basis of malpractice suits against radiologists. The bulk of such cases were caused by false diagnoses of breast cancer using mammograms [
13]. Therefore, there is a probe for more accurate techniques used in detecting breast cancer leading to the use of machine learning in the classification of diagnostic images [
14]. Machine learning (ML) algorithms offer promising avenues for enhancing breast cancer detection accuracy and efficiency. Recently deep learning has become a leading tool in various research domains including medical images [
15]. A growing body of research supports the potential of ML in breast cancer detection. Studies have shown that ML algorithms can achieve high accuracy in classifying mammograms and other medical images [
16,
17]. In computer vision, image classification is a critical task with several applications in fields such as autonomous vehicles, surveillance systems, and medical imaging [
18]. Furthermore, research suggests that ML can be used to analyze additional data points beyond images, such as patient demographics and genetic information, potentially leading to more comprehensive risk assessment [
19]. This study aims to explore the use of computer vision through machine learning algorithms to improve upon the limitations of the traditional analysis of mammograms by:
Increasing detection accuracy: Deep learning can analyze large datasets of medical images, potentially identifying subtle patterns missed by human radiologists, leading to higher diagnostic accuracy [
20].
Reducing false positives: ML models can be trained to differentiate between benign and malignant lesions, potentially reducing the number of unnecessary biopsies [
21]
2. Related Works
The patient’s survival rate can be enhanced through early detection and accurate classification of breast cancer [
22]. In recent times deep learning has proven to be a promising method to enhance medical imaging analysis and classification [
23]. [
24] conducted a study on the classification of breast cancer histology images using CNN showing the capacity of CNN to extract important features from medical image data. the study also used the extracted features to train the Support Vector Machine (SVM) classifier, achieving a comparable result with an 83.3% accuracy and 95.6% sensitivity to cancer cases [
24].
[
25] conducted a review of the classification of mammogram images using the convolution neural network classifier with the K-means clustering techniques compared with conventional networks such as the ANN, SVM, LSVM, and DNN. In his study, CNN was used to get intricate features from mammographic images, a wiener filter was introduced to expel noise, and the K-means clustering techniques were utilized for segmentation. The results achieved with CNN were better than others with a training accuracy of 96.947% and testing accuracy of 97.143% proving the capability of CNN to efficiently classify breast cancer images. Another study carried out by [
26] in using deep learning for the classification of breast cancer digital mammography. A transfer learning approach was applied to the Inception v3 pre-trained network achieving an accuracy of 88.2%.
Research conducted by [
27] applied deep learning in mammography image segmentation and classification with an automated CNN approach. The study objective is to explore robust deep learning models that have a good performance in computer vision. The study used Inception V3, DenseNet121, ResNet50, VGG16, and MobileNetV2, and the models were applied to three different mammographic image datasets from MIAS, DDSM, and CBIS-DDSM databases. The study utilized the U-Net-modified segmentation model for the segmentation process. The research achieved the best result on the DDSM database with the InceptionV3 model achieving the best model performance with 98.8% accuracy, 98.88% AUC, 98.79 precision, and an F1-score of 97.99%.
In a recent study, [
28] introduced a multi-class classification of breast cancer from the histopathological image datasets utilizing the ensemble of Swin transformers. They investigated with the ensemble of Swin transformer to classify benign and malignant cases, a two-class classification versus an eight-class classification of four benign and four malignant cases of breast cancer on histopathology images. The study achieved a result of 96.0% on the eight-class classification and 99.6% for the two-class classification. Swin transformer, a variant of vision transformer works on the concept of non-overlapping shifted windows [
29] is a proven method for computer vision tasks. The authors in [
30], classified breast cancer on thermograms using a hybrid model of deep CNN and transformers. The study utilized the TransUNet a variant of the vision transformer for the segmentation process and four CNN model architectures were utilized namely, EfficientNet-B7, ResNet-50, VGG-16, and DenseNet-201 for classification into three categories of healthy, sick, and unknown. ResNet50 achieved the best performance with 97.26% accuracy and 97.26% sensitivity.
A study on the mammography breast cancer classification using vision transformers was conducted by [
31] using a pre-trained vision transformer on a mammography breast image for the classification of benign and malignant cases. The model utilized the DDSM dataset and achieved a result of 99.96% accuracy, 99.95% precision, and 99.96% sensitivity for the breast cancer classification. This study focuses on a comparative analysis of chosen CNN-based architecture, specifically the ResNet50 and the VGG16. This is because they have proven to achieve good performance on the medical image datasets being trained on a large image dataset (ImageNet) and have been previously utilized on deep learning medical imaging tasks with good results. This will be in comparison with the novel vision transformer introduced by [
32]. Vision Transformers has become a preferred model in medical imaging because of its exceptional performance. The study utilized the ViT-base and the Swin-b transformer model. Also, the ViT trained from scratch on the mammogram dataset to show how pre-trained transformer models perform over training from scratch on medical images.
3. Materials and Methods
3.1. Data Collection
The dataset used for the study was obtained from the Mendeley dataset archive [
33] for breast mammography images with masses comprising a total of 24,576 images collected from the INbreast dataset with 7632 images, MIAS dataset with 3816 images, and DDSM dataset with 13128 images. These images were aggregated together to give the 24,576 images used for training the models. The images were all in size 227 x 227 pixels. To prepare the images for training purposes, they were pre-processed, re-sized, augmented, and normalized. The dataset type and its distribution are presented in
Table 1 below:
3.2. Shifted Window (SWIN) Transformer
We propose the use of a SWIN transformer for the classification of breast cancer in this study. The introduction of the SWIN transformer by [
29] attempts to solve the limitations posed by the vision transformer. This limitation is related to how the vision transformer extracts patches using the 16 X 16 patch size to keep the image sequence as introduced by [
32]. This is more efficient with low to medium-sized pixel images. however, many computing vision tasks require detailed information at the pixel level, such as semantic segmentation which is also useful in medical imaging requiring a heavy prediction at the image pixel level. Furthermore, high-resolution images will result in computation inefficiencies [
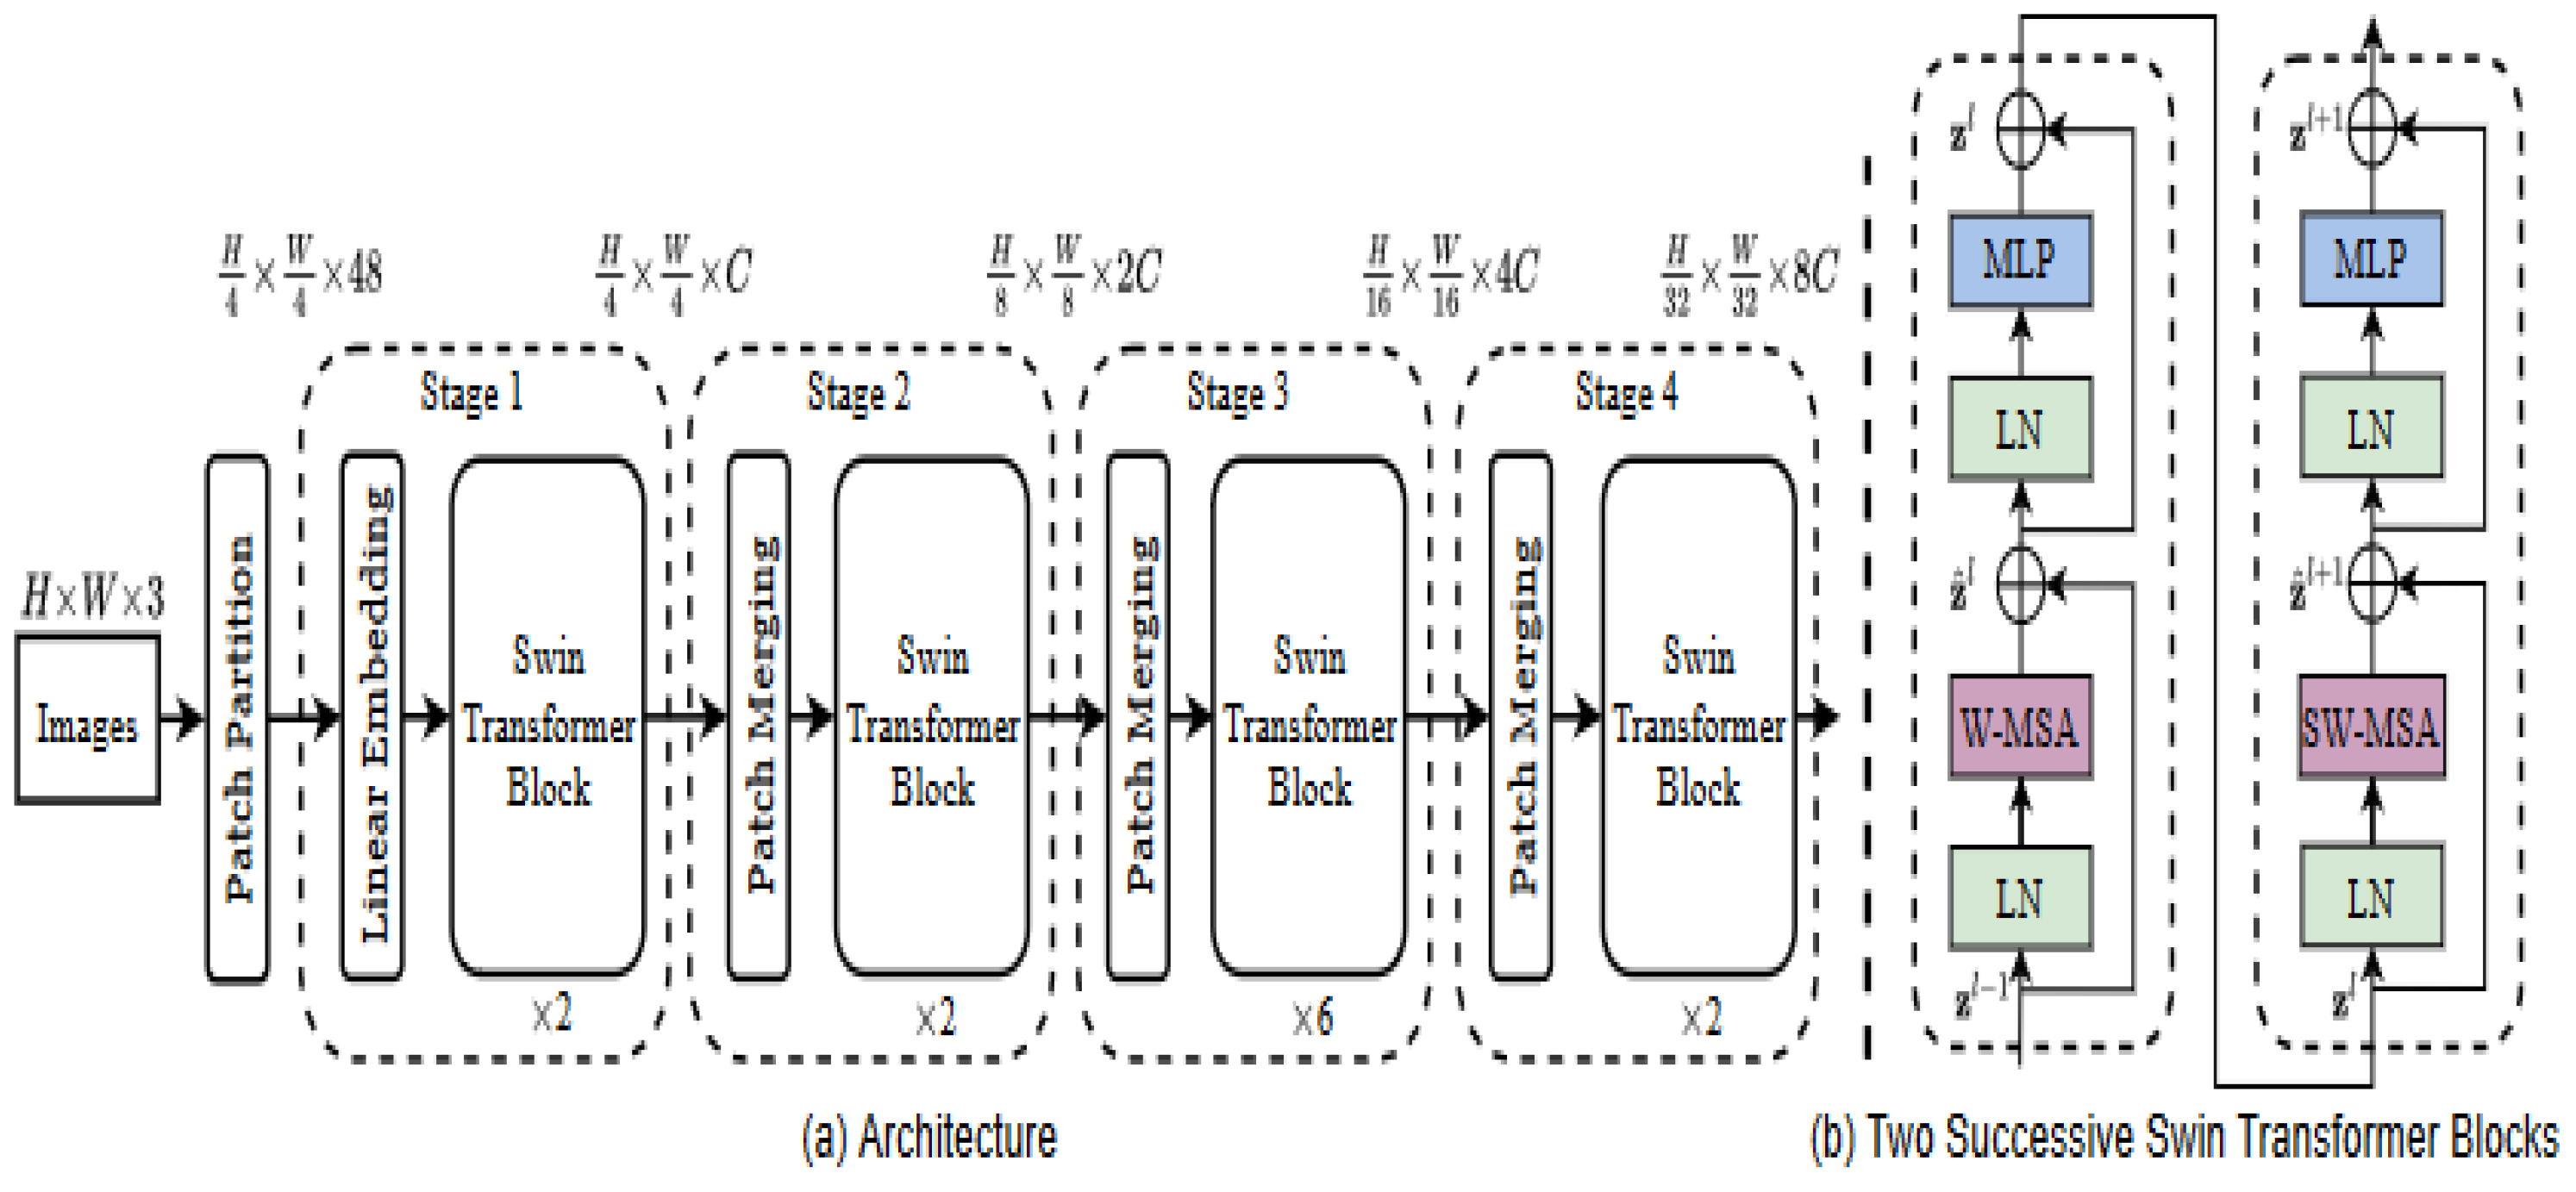
29]. Semantic Swin transformer utilizes the 4 X4 patch size at the initial division where each patch is treated as a token on each dimension of the RGB image giving a total of 4 X 4 X3 equals 48 illustrated by the formula for stage 1.
Then a linear transformation will convert each patch into a C-dimension vector, and this is processed by the transformer blocks. Swin transformer block consists of a shifted window multi-head self-attention module as a replacement for the vision transformer standard multi-head self-attention [
29]
As given in
Figure 1, the hierarchical representation construction begins from small patches and then systemically merges neighbouring patches in subsequent deeper transformer layers [
29]. The computation of the self-attention included a relative position bias procedure to each head in computing similarity, following a similar work from [
29,
34,
35]
The mathematical equation for the attention layer including a relative position bias B ∈ R
M 2×
M 2 is as follows
where Q, K, V ∈ R
M 2×
d are the query, key, and value matrices; d is the query/key dimension, and M
2 is the number of patches in a window [
29]
.
3.3. Model Development
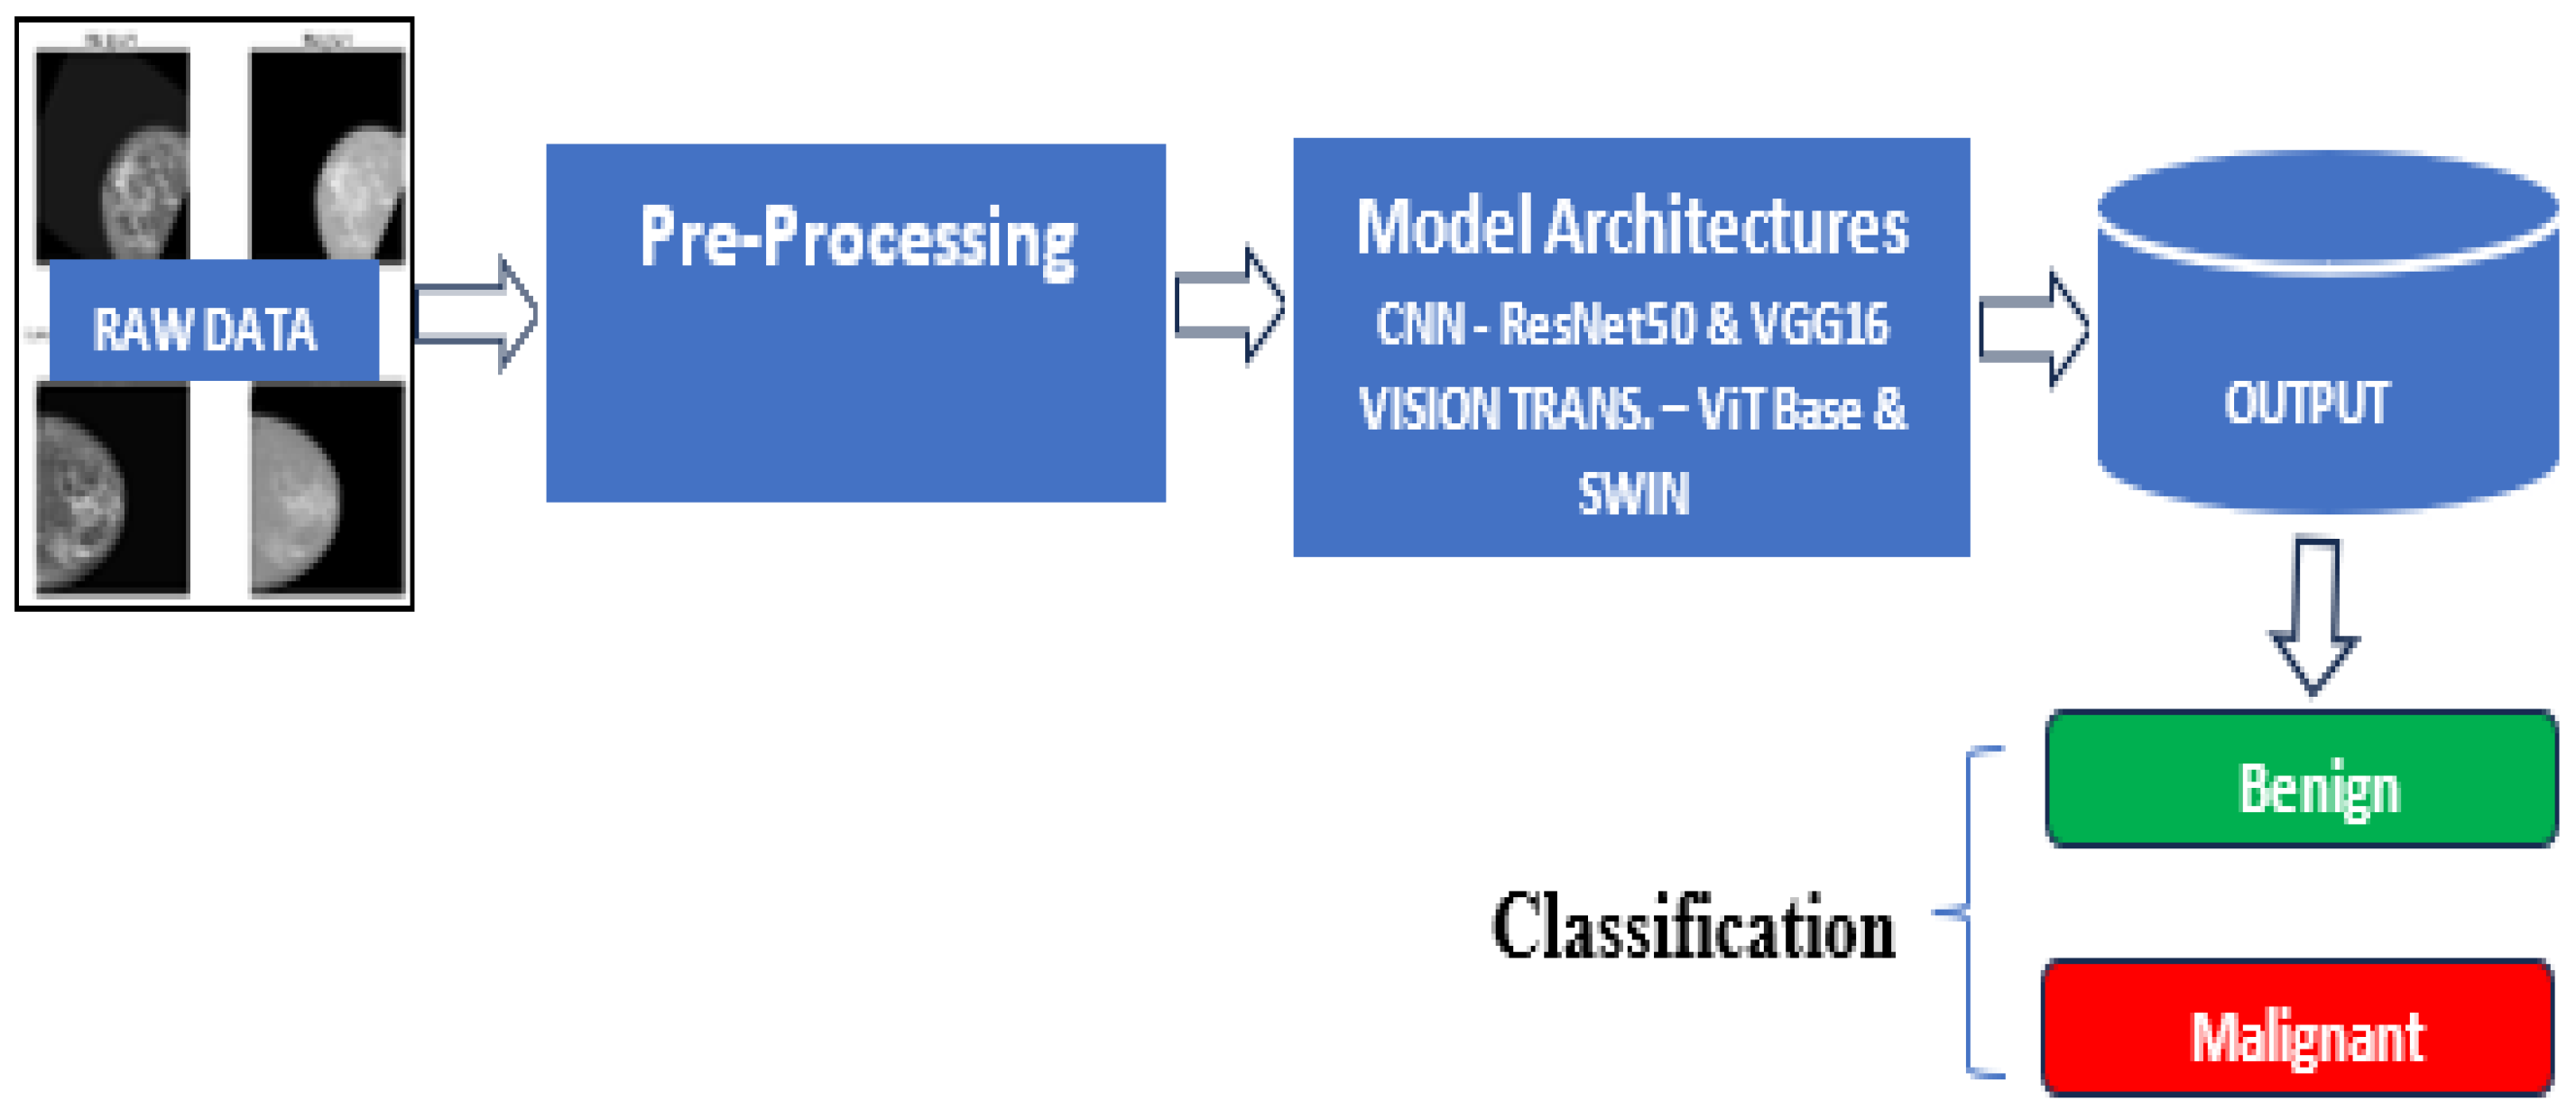
The developmental framework for the experiment is shown in
Figure 2[M1] .
A comparative analysis of the two major frameworks for image classification was carried out in this study. Convolution Neural Network (CNN) and vision transformers were used as a framework for training the models. Specifically, the VGG16 [
36] and ResNet50 [
37] both pre-trained were applied for the CNN models, ViT-base, and SWIN transformers architectures [
32] were utilized for the vision transformer models. Based on the insight derived from a review of the literature, these models have proven to perform excellently in image classification and are suitable for medical image analysis [
37]. These models were fine-tuned on pre-trained architectures with the vast number of parameters making it suitable for learning various patterns in image classification. Python libraries such as TensorFlow, Pytorch, Keras, and OpenCV were leveraged to develop these architectures. Adam and SGD optimizers were used to optimize the model parameters during training. Hyperparameters such as learning rate, batch sizes, and the number of epochs were optimized using grid search and random search.
3.3.1. Data Augmentation and Preprocessing Considerations
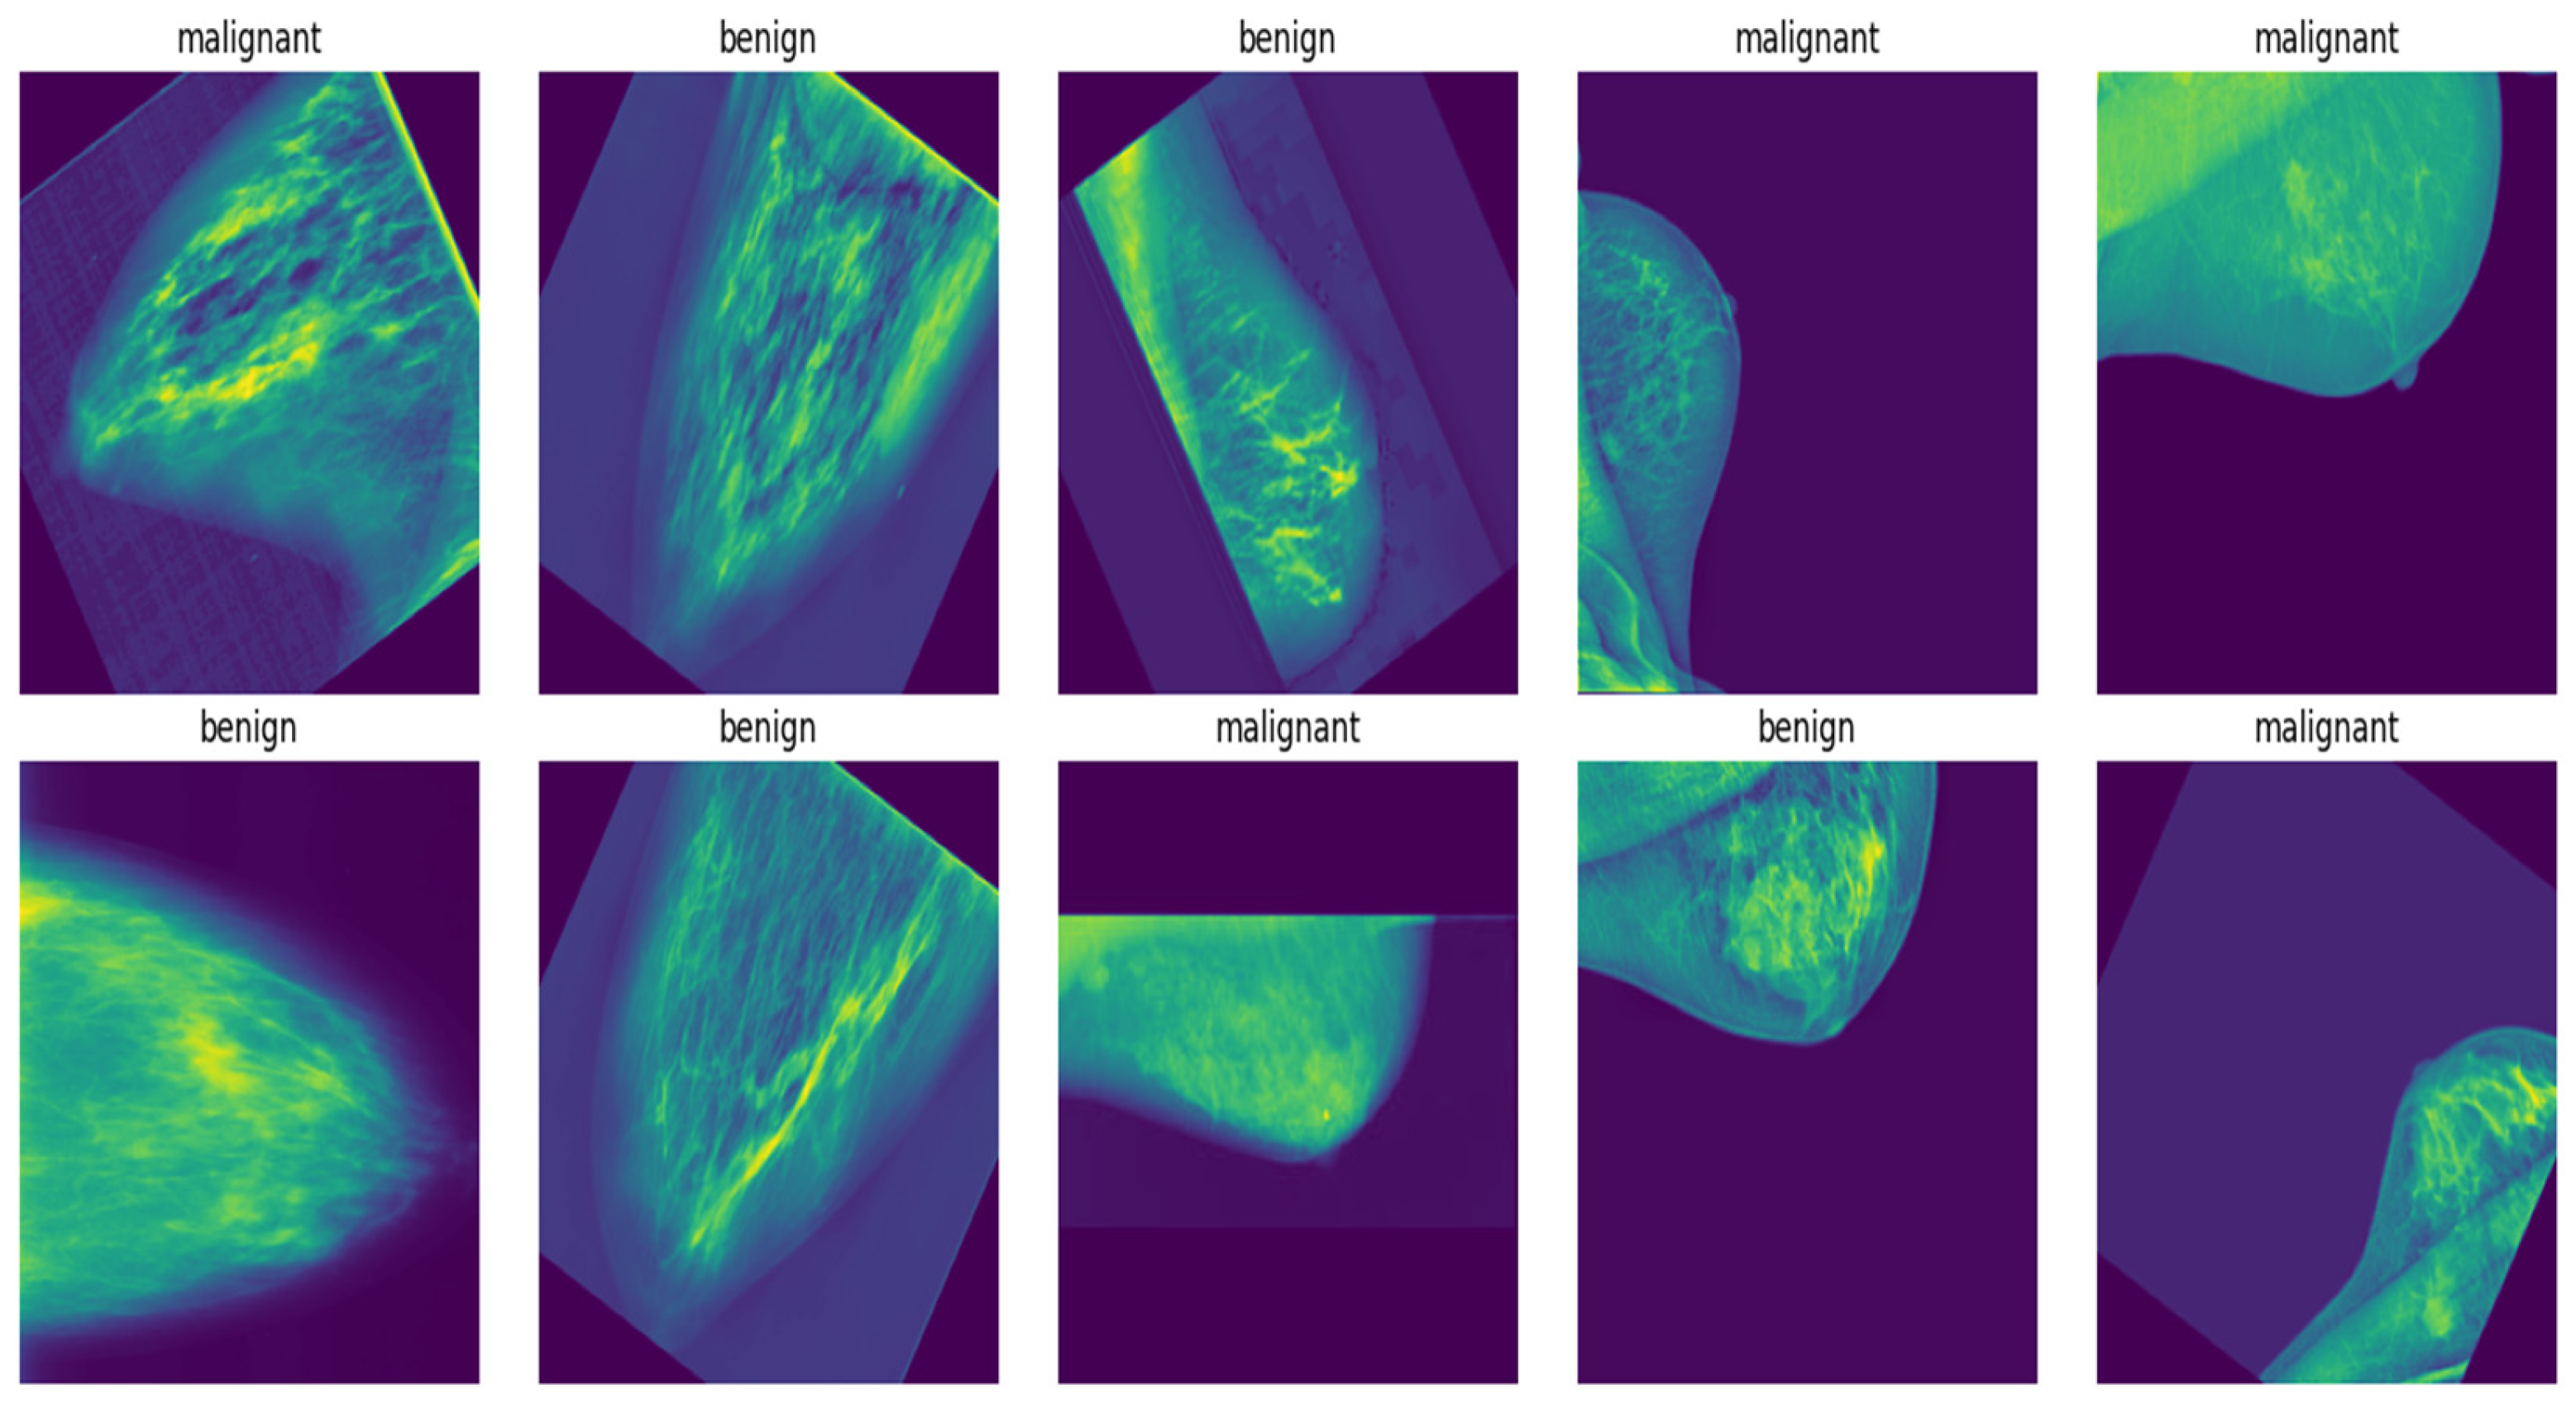
To facilitate consistency and efficient data processing, the mass images have been resized into a standard dimension of 227 by 227 pixels. This initial pre-processing makes the dataset suitable for analysis and training. Data augmentation technique was applied using the following techniques:
Rotation: random rotations were applied to images to introduce variability in a specific range. This will help the model to generalize well and improve efficiency.
Shifting: Additional shifts by n values along the x and y axes were applied to augment the data when the mass was in different positions within the image, which helped the model to detect masses in different locations.
Brightness Adjustment: Another technique used in the approach was to use images of the same or similar objects in different lighting conditions with different levels of brightness.
These chosen augmentation techniques aimed to mimic real environment variation and improve the model’s robustness to variability in imaging conditions.
3.3.2. Class Distribution
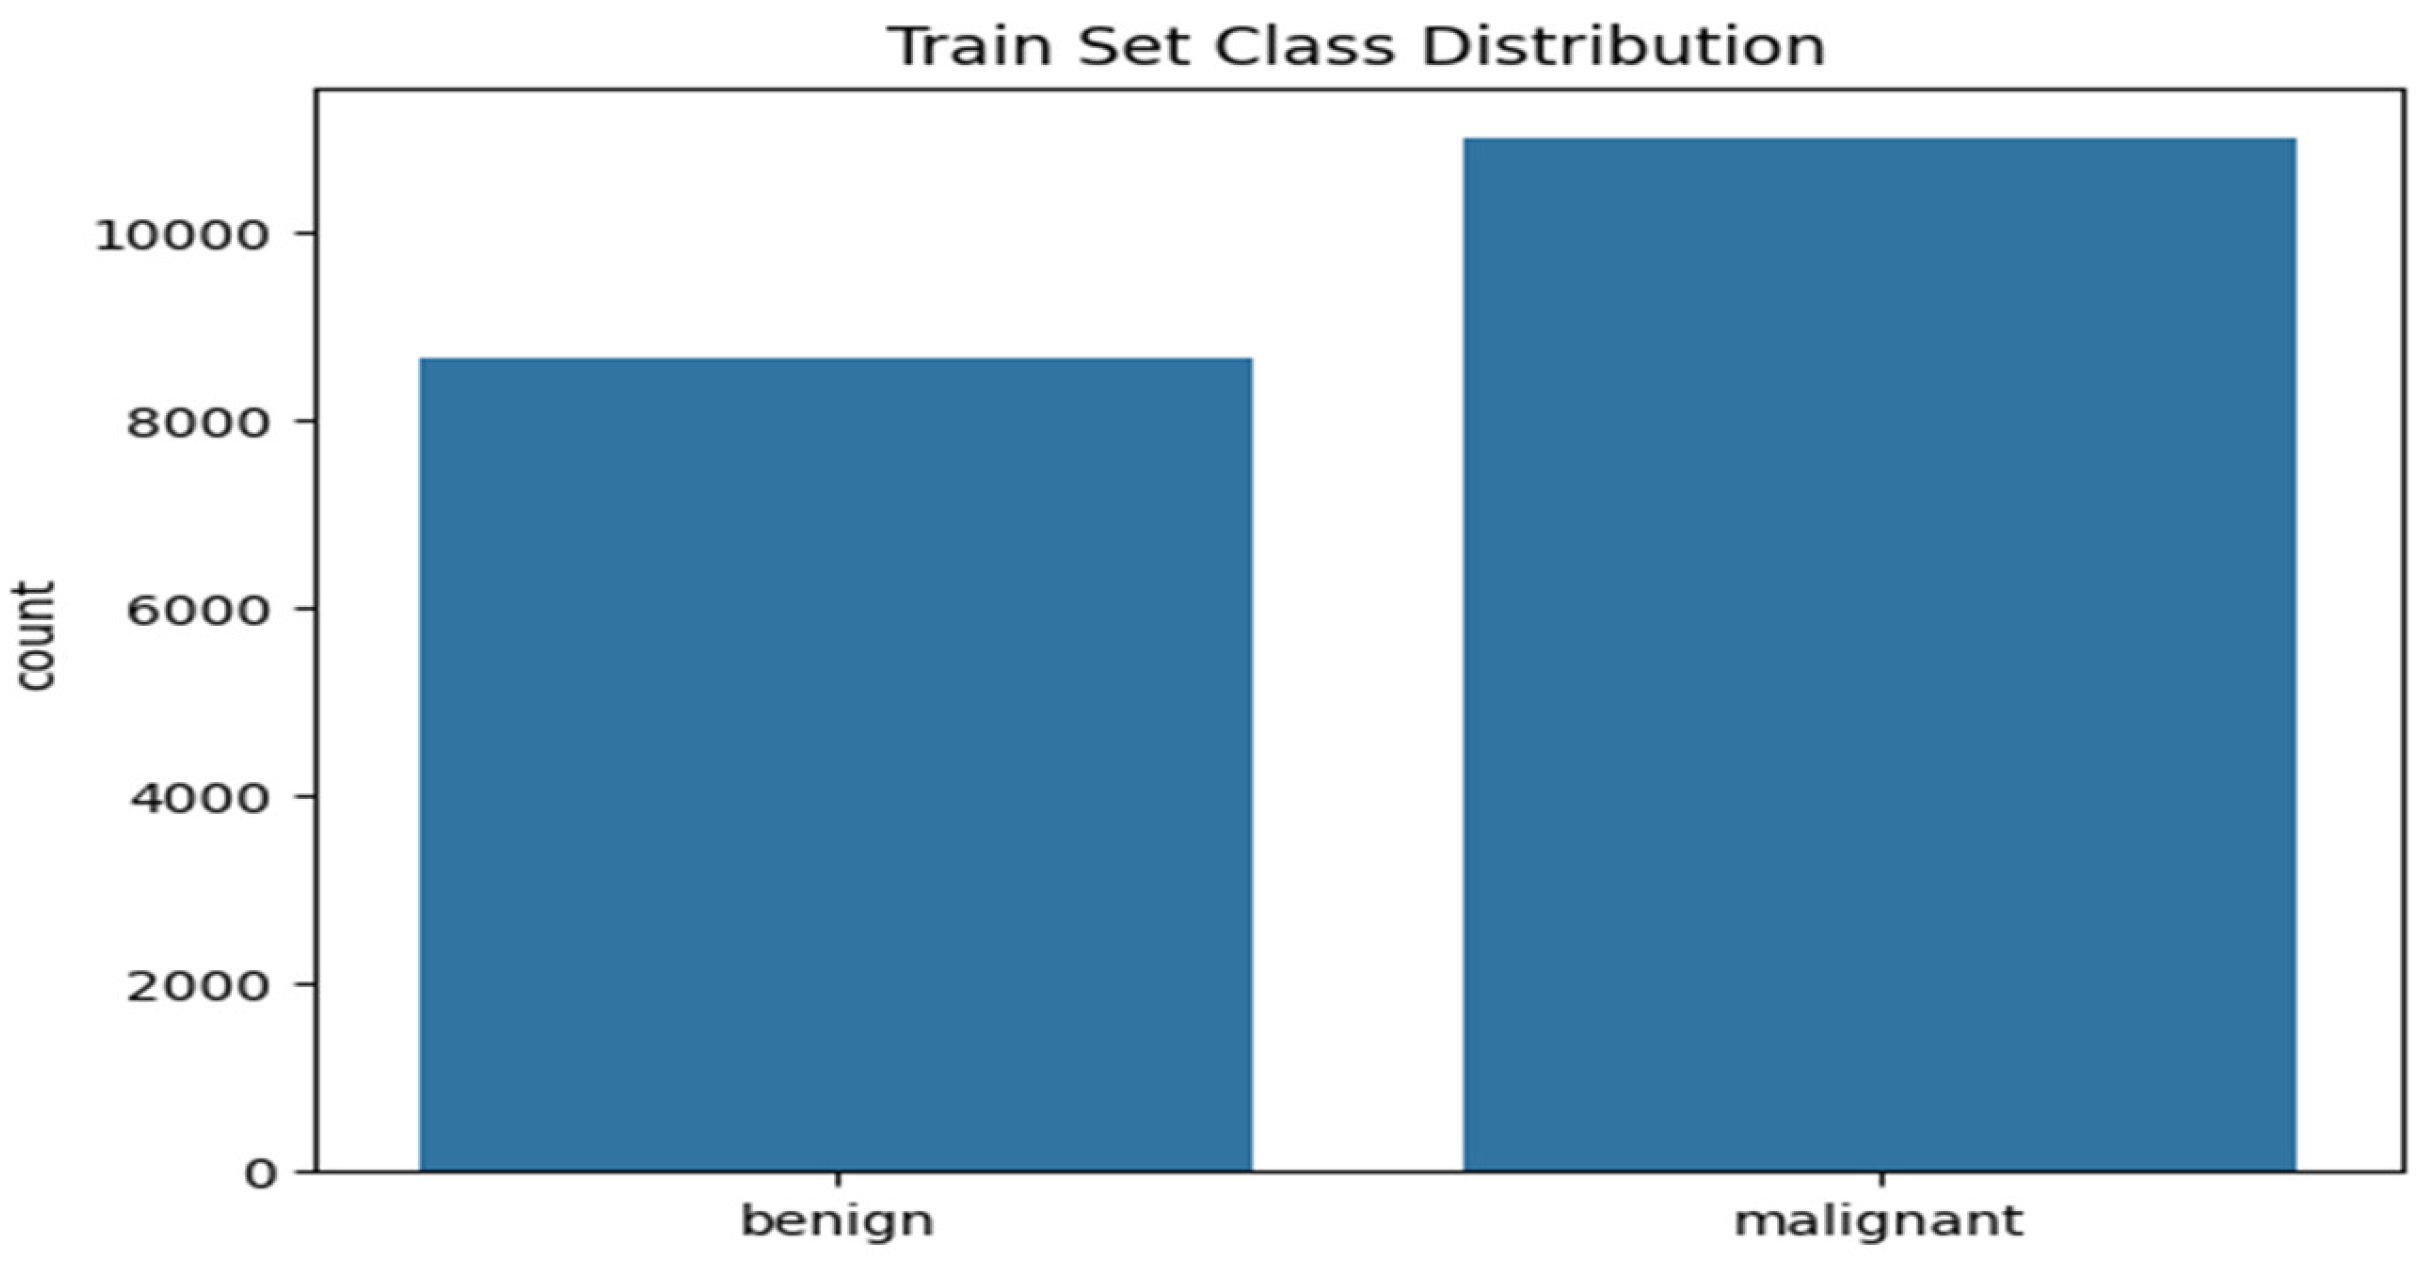
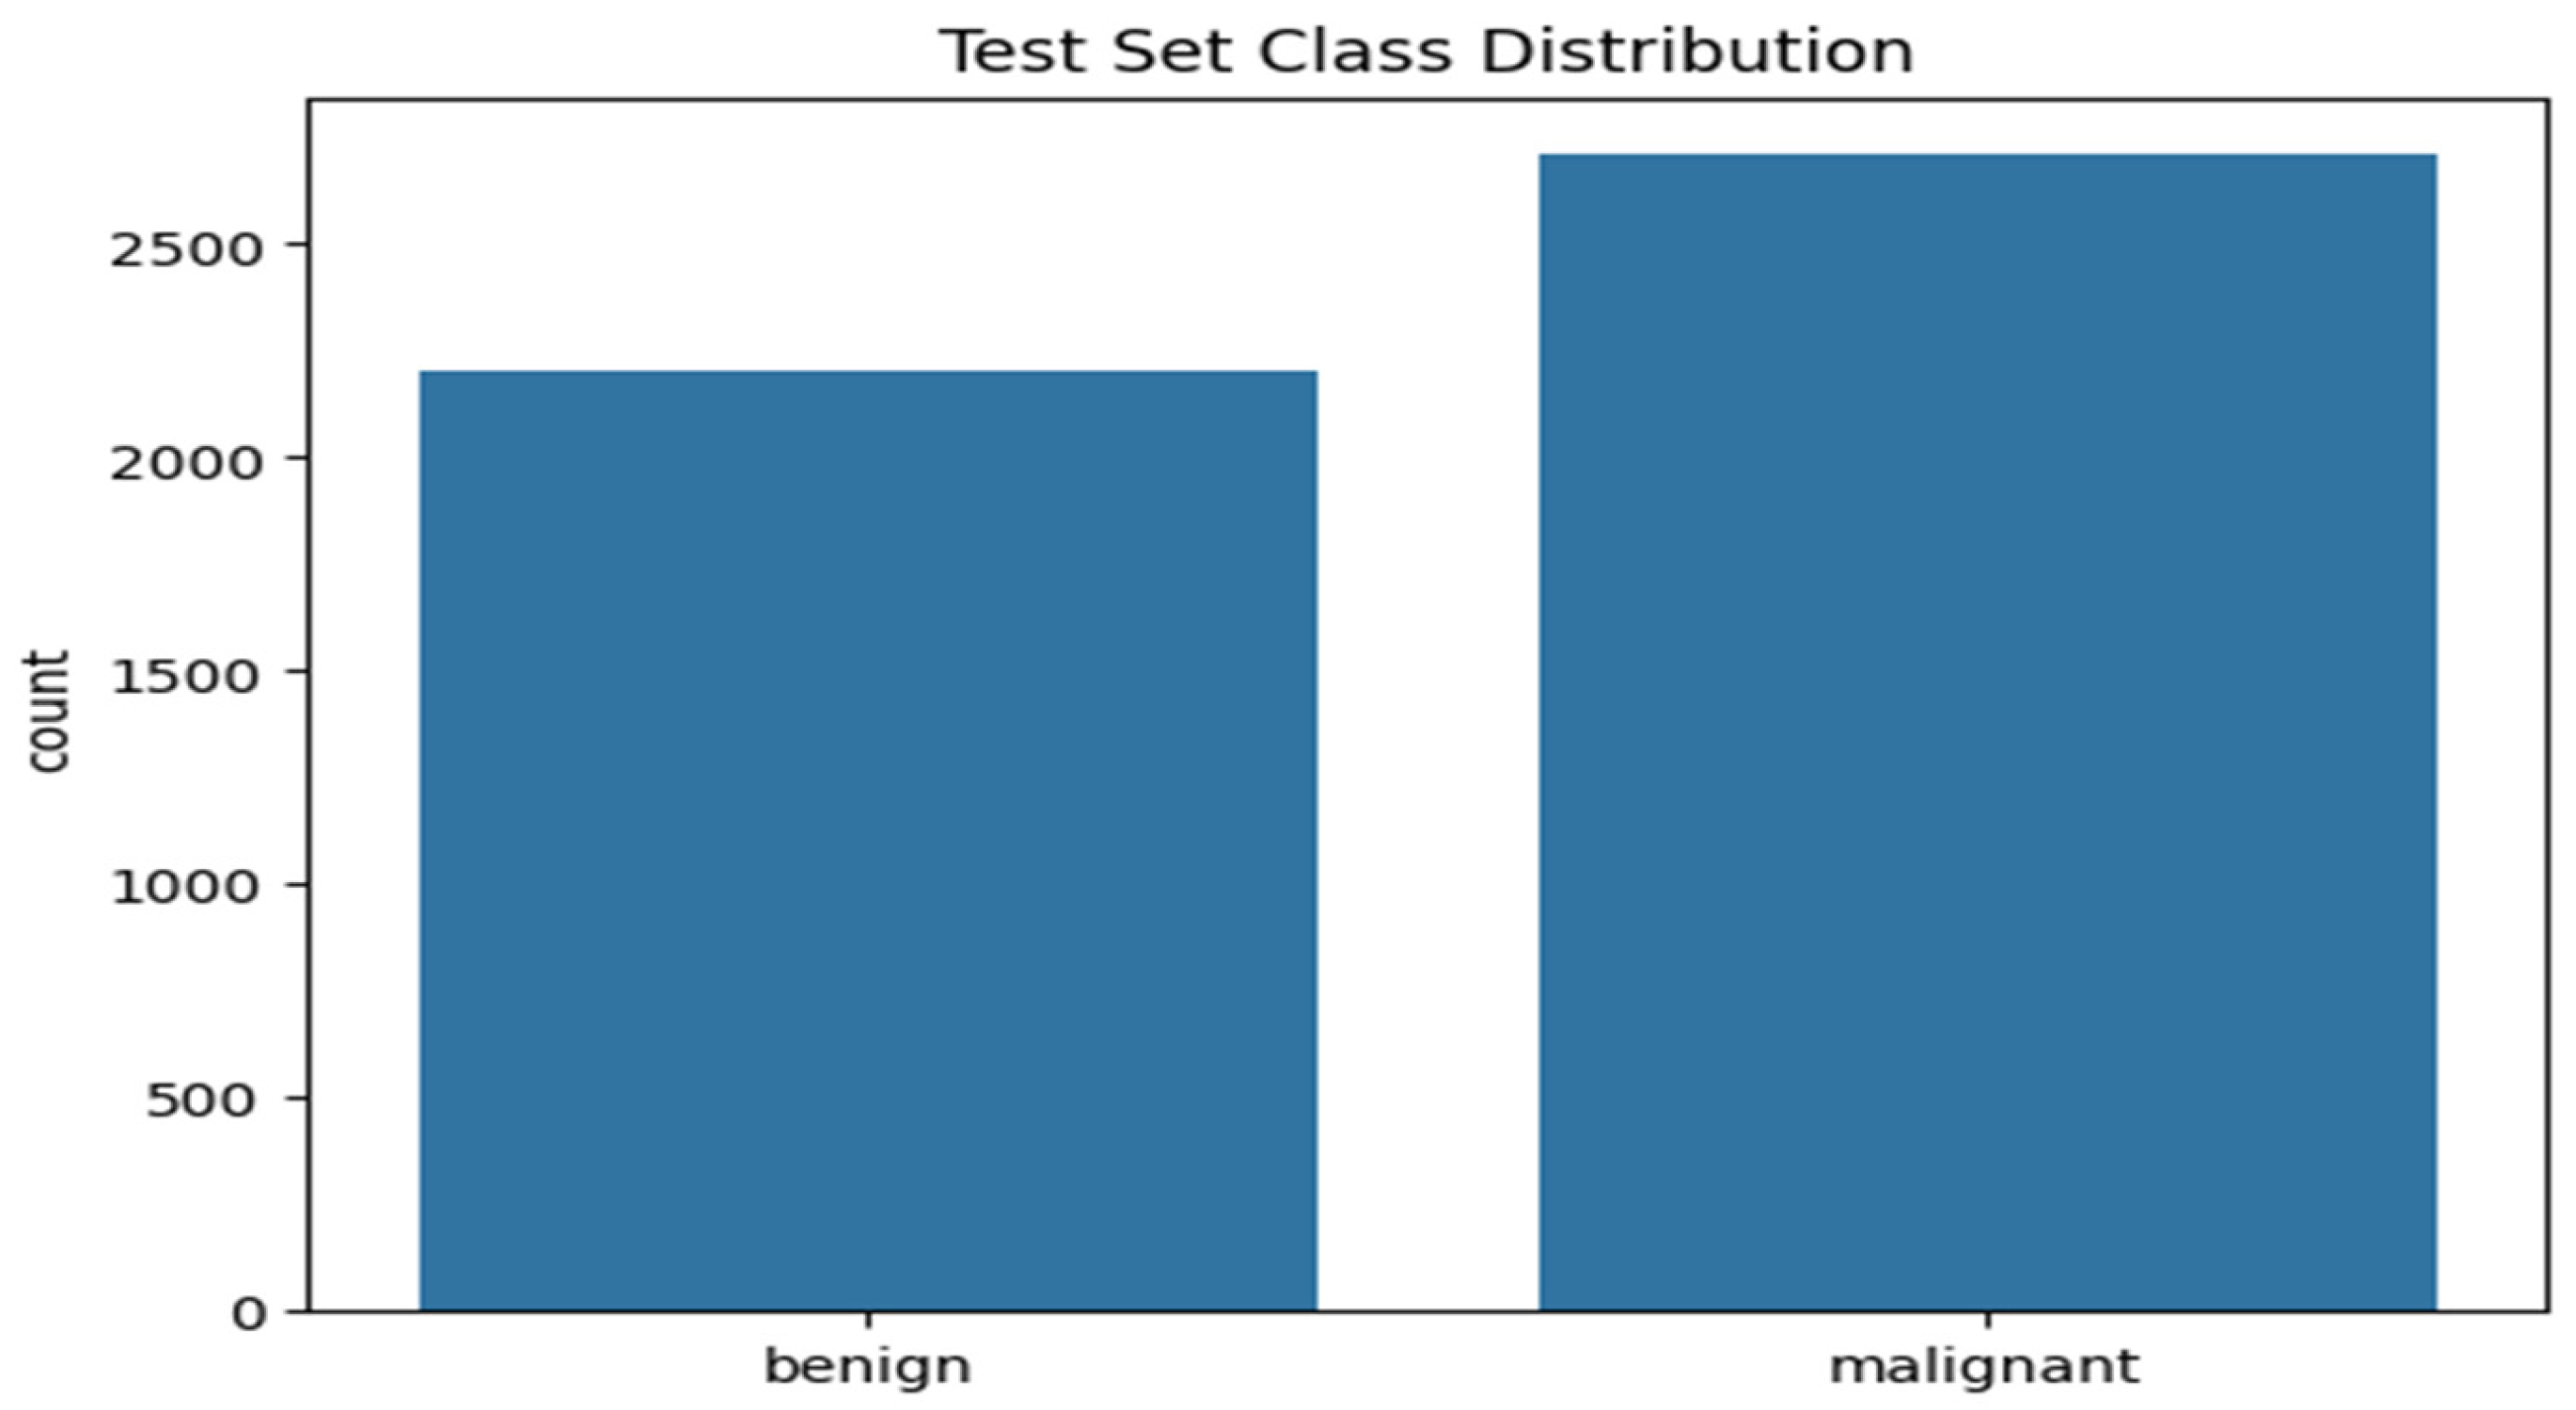
After the preprocessing and augmentation process, the dataset is analyzed for class imbalance. The distribution of classes was performed on both the training and test data after a train-test split ratio of 80:20. The distribution of the classes is shown in
Figure 3 and
Figure 4.
Figure 3 shows the histogram plot of the training set class distribution. The plot shows 11,000 malignant cases and 8660 benign cases that make up the training set, indicating a ratio of 1:1.27 of malignant and benign cases respectively. This implies that, for every 100 benign cases, there are approximately 127 malignant cases.
Figure 4 shows the histogram plot of the testing set class distribution. The plot shows 2206 benign cases and 2709 malignant cases for the testing dataset indicating a ratio of 1:0.813 for malignant and benign cases. Since the difference in class between the two cases is relatively low. It can be considered balanced.
3.4. Experimental Set-Up
Google Collab platform was chosen to deploy the model, due to its enhanced computational efficiencies. The specification of the computational resources utilized to train our model within the Google Collab runtime is an Nvidia L4 GPU with a memory capacity of 23034 MiB. To get the dataset loaded onto the Google Collab platform, there is a need for the organization of the dataset. As highlighted by [
38] in their work on Melanoma classification on dermoscopy images using a neural network ensemble model by organizing the dataset into directories representing classes of images. This procedure simplifies the data loading process and makes accessing the directories straightforward. The method used aligns with the data-loading procedure of [
38]this was adopted because of its simple and compatible approach to dataset loading. The dataset organization into directories was done using Python. The base directory called total masses consists of two sub-directories called the train and test. Within the train and test sub-directories are the classified masses labelled the malignant and the benign which contain respective mass images. Some important embedded functions for loading and pre-processing of images were utilized. These are robust deep learning frameworks such as TensorFlow and PyTorch [
39]. The capabilities of these libraries can handle large datasets and improve computational processes [
40].
4. Results
4.1. Model Training
A comparative analysis study was carried out using pre-trained models of ResNet50 [
41], VGG16 [
42], ViT-Base [
32], and Swin transformer [
29] architectures. These models have been originally trained on ImageNet datasets. They were fine-tuned on the breast cancer image dataset consisting of 24,576 images to classify benign and malignant cases.
The model was trained for 10 epochs while simultaneously validating it on the testing set. A plot of the performance was generated to show the training and testing accuracy during the training process.
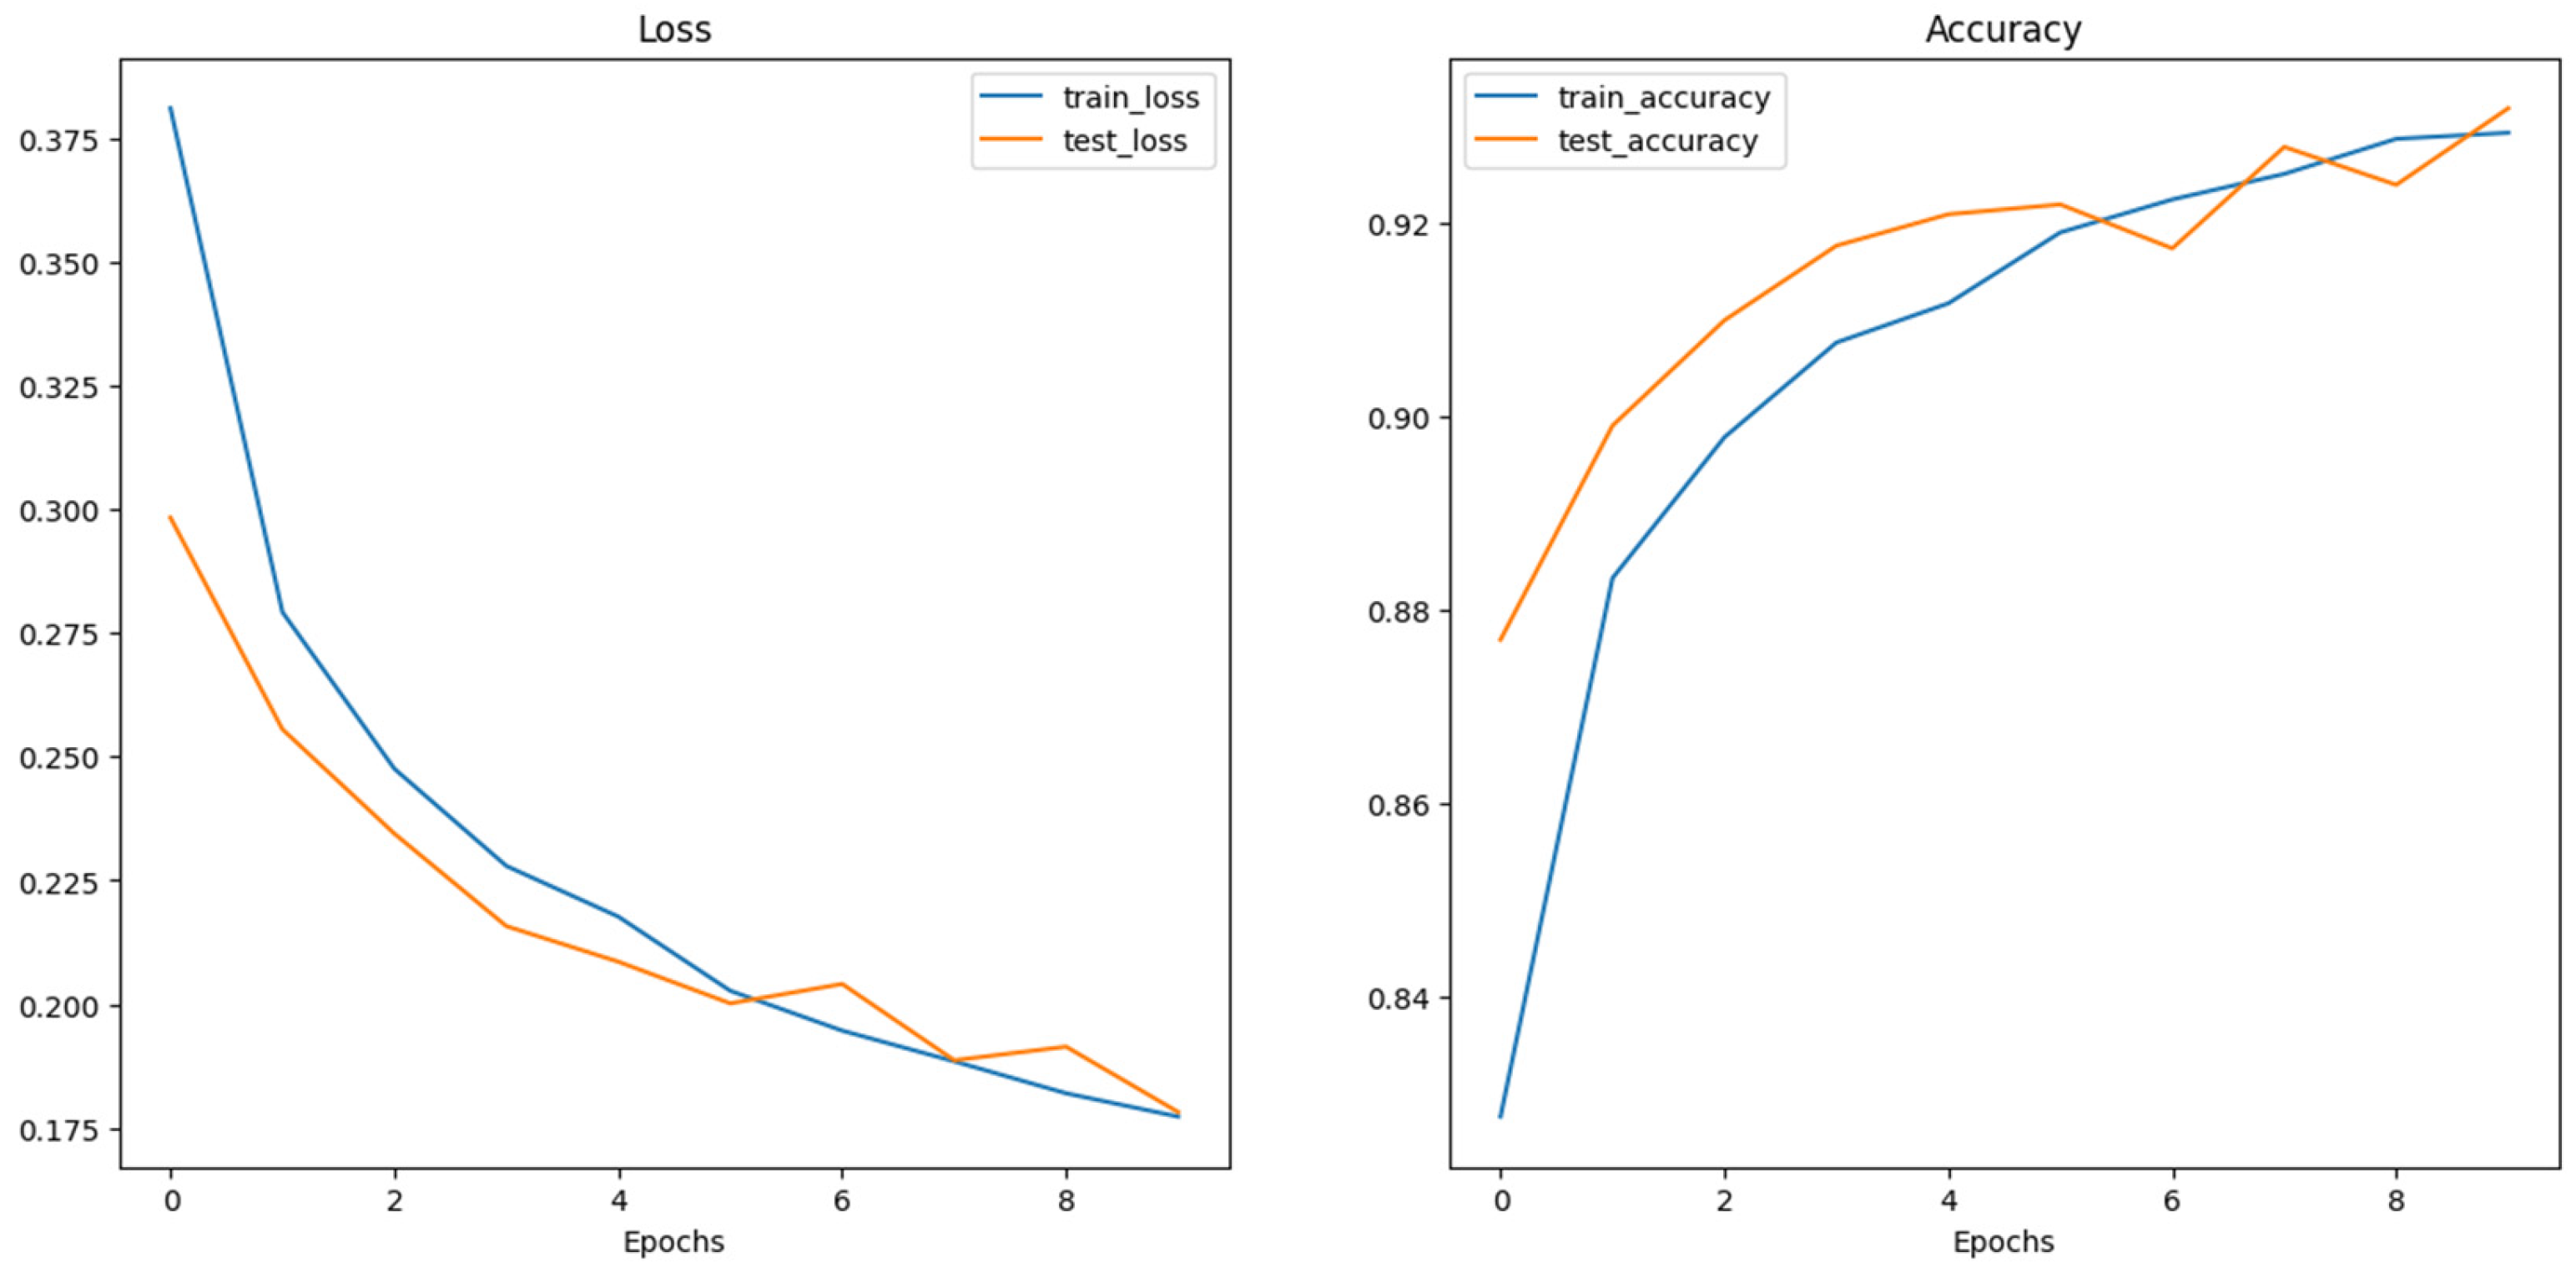
Figure 6 shows the training loss and accuracy performance for the ViT base pre-trained model. As illustrated, the training and test loss steadily declined across the 10 epochs. while the test loss lags the training loss initially until the 6th epoch, it interestingly picks slightly higher than the training loss at the 6th and 8th epochs. Similarly, the training and test accuracies increase steadily across the training epochs as illustrated in
Figure 4.8 above with a slight difference in the training and testing accuracies until the 6th and 8th epochs when the test accuracy slightly decreases below the training accuracy but eventually converges well at the 10th epoch. This shows that the model effectively learns from the training data and appreciably generalizing. However, further investigation may be conducted to ensure no trace of overfitting and improving the model’s generalization performance.
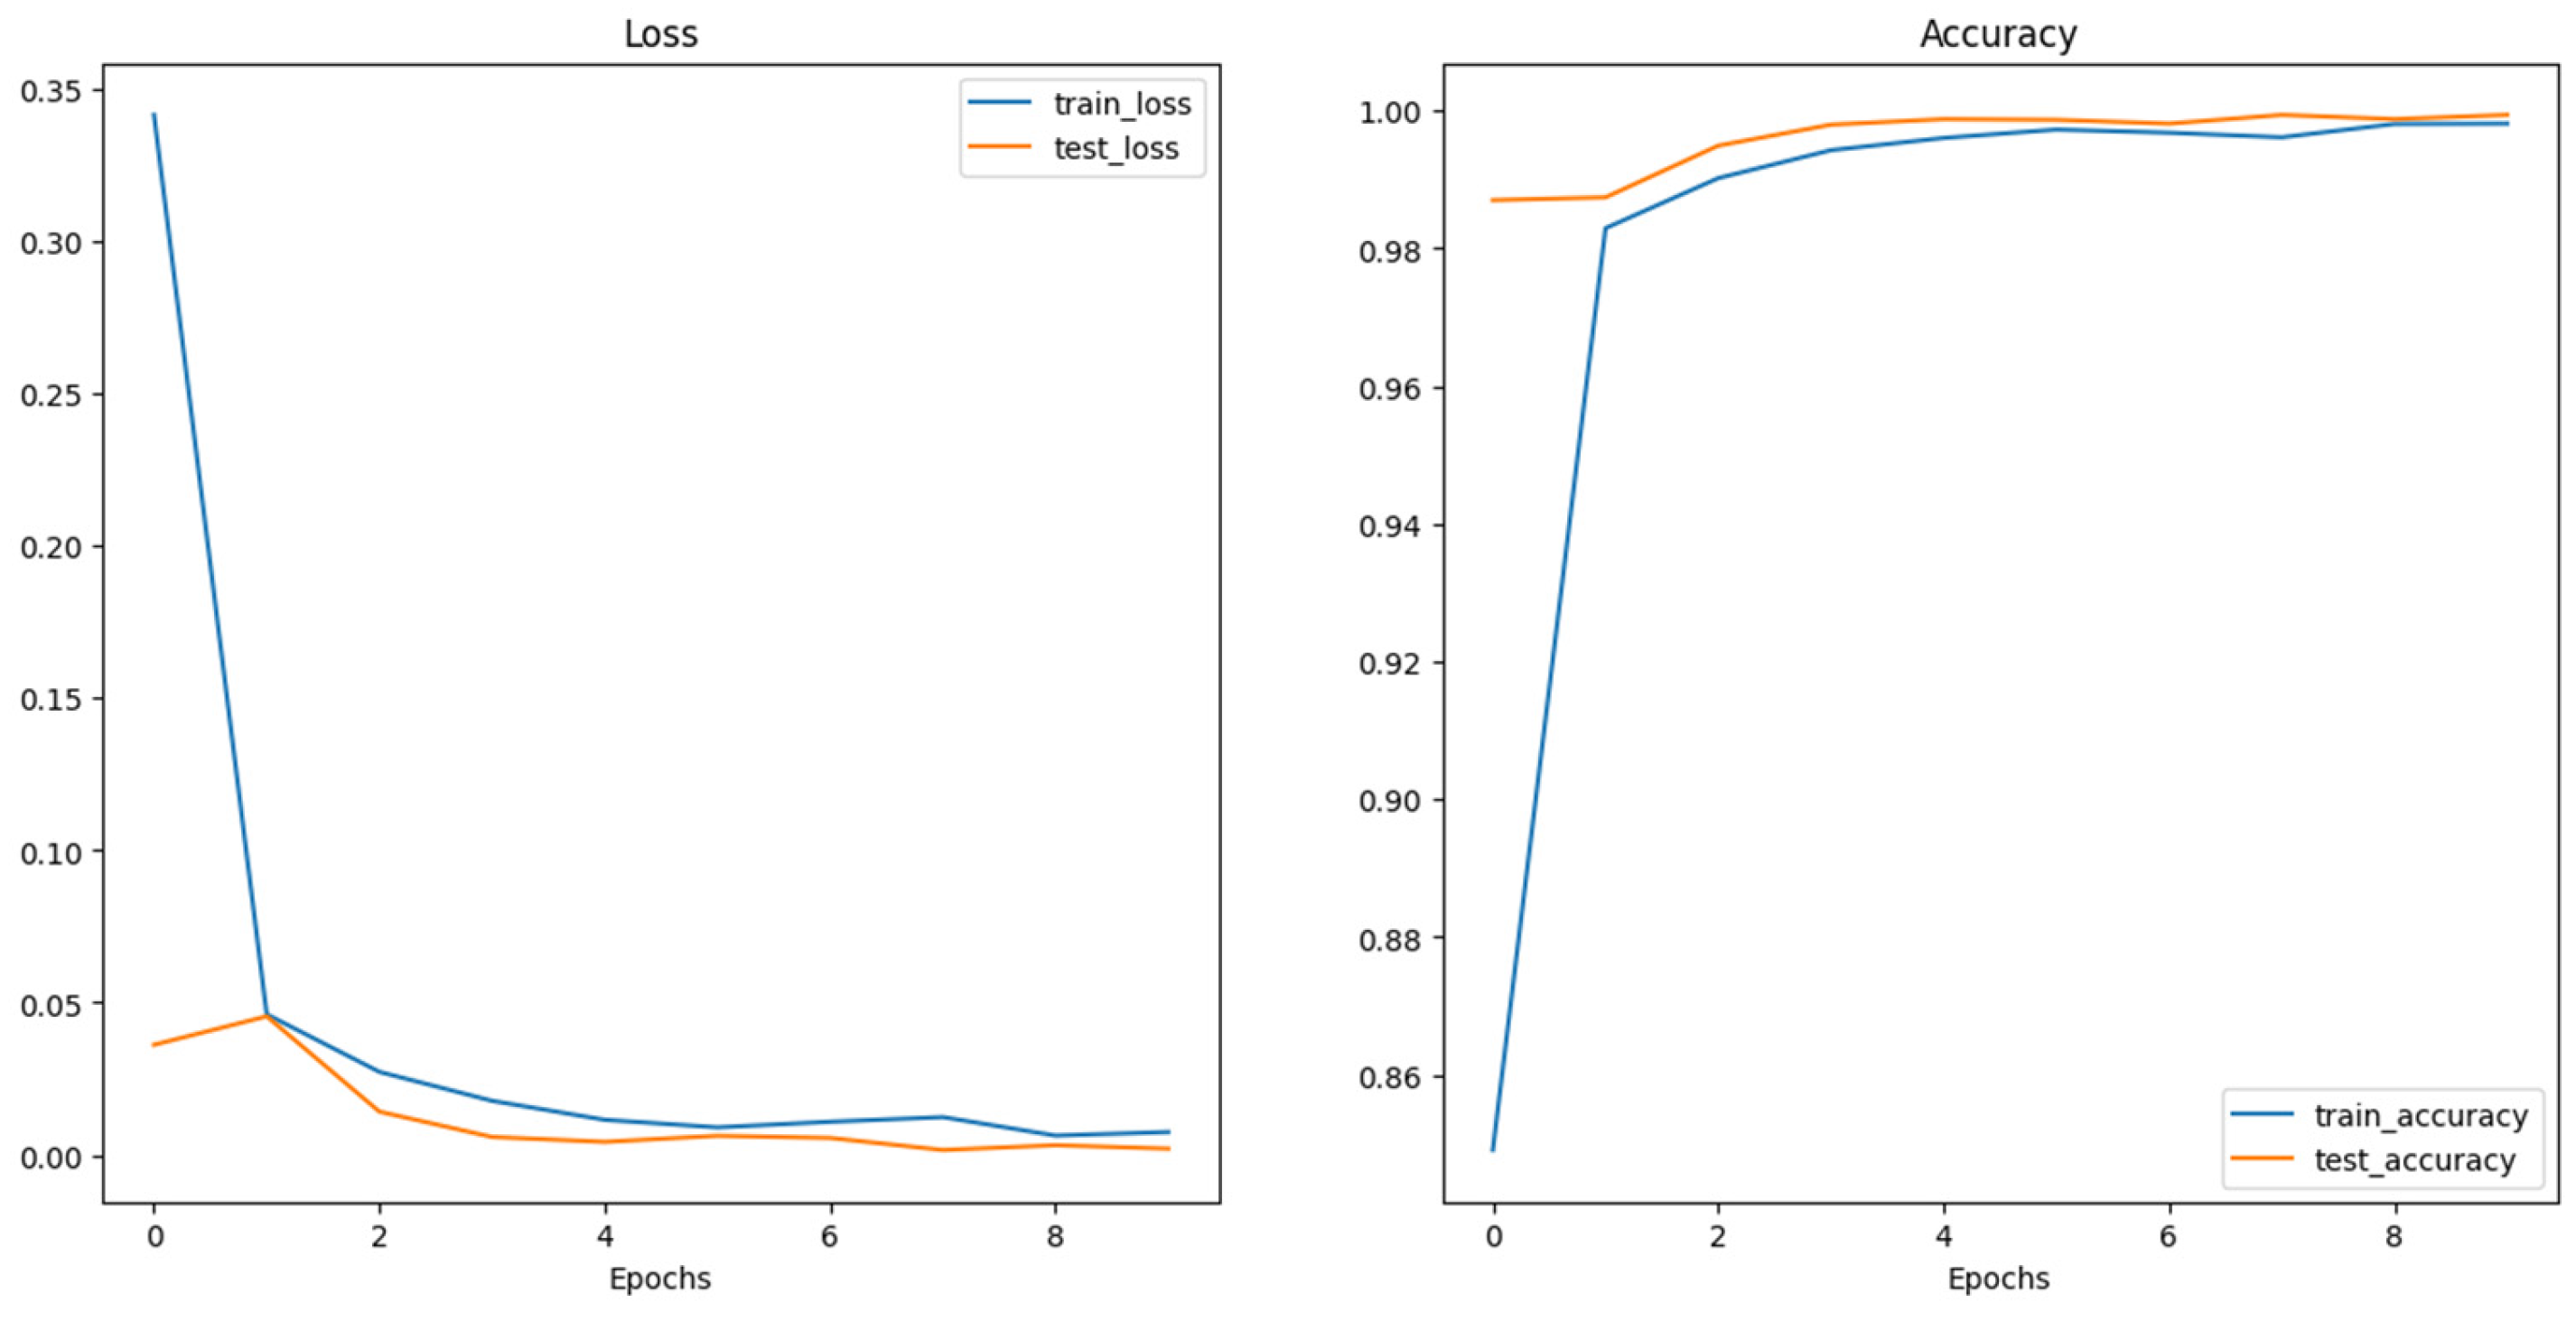
The training and testing loss of the SWIN transformer as shown in
Figure 7 plot above indicates that the training and testing loss declines steadily throughout the training epochs. There is a relatively very small gap between the training and testing curve, indicating that the model is generalizing significantly well with unseen data learning discrete features of the data. Also, the training and testing accuracy increases steadily throughout the training epochs. Also, the gap between them is relatively small, indicating a good generalization of the model with the data. The training and testing accuracy got to a convergence point indicating the model’s optimal performance. Therefore, the SWI transformer architecture shows an exceptional performance on the given data with a very high training and testing accuracy of 0.9981 and 0.994 respectively.
4.2. Confusion Matrix
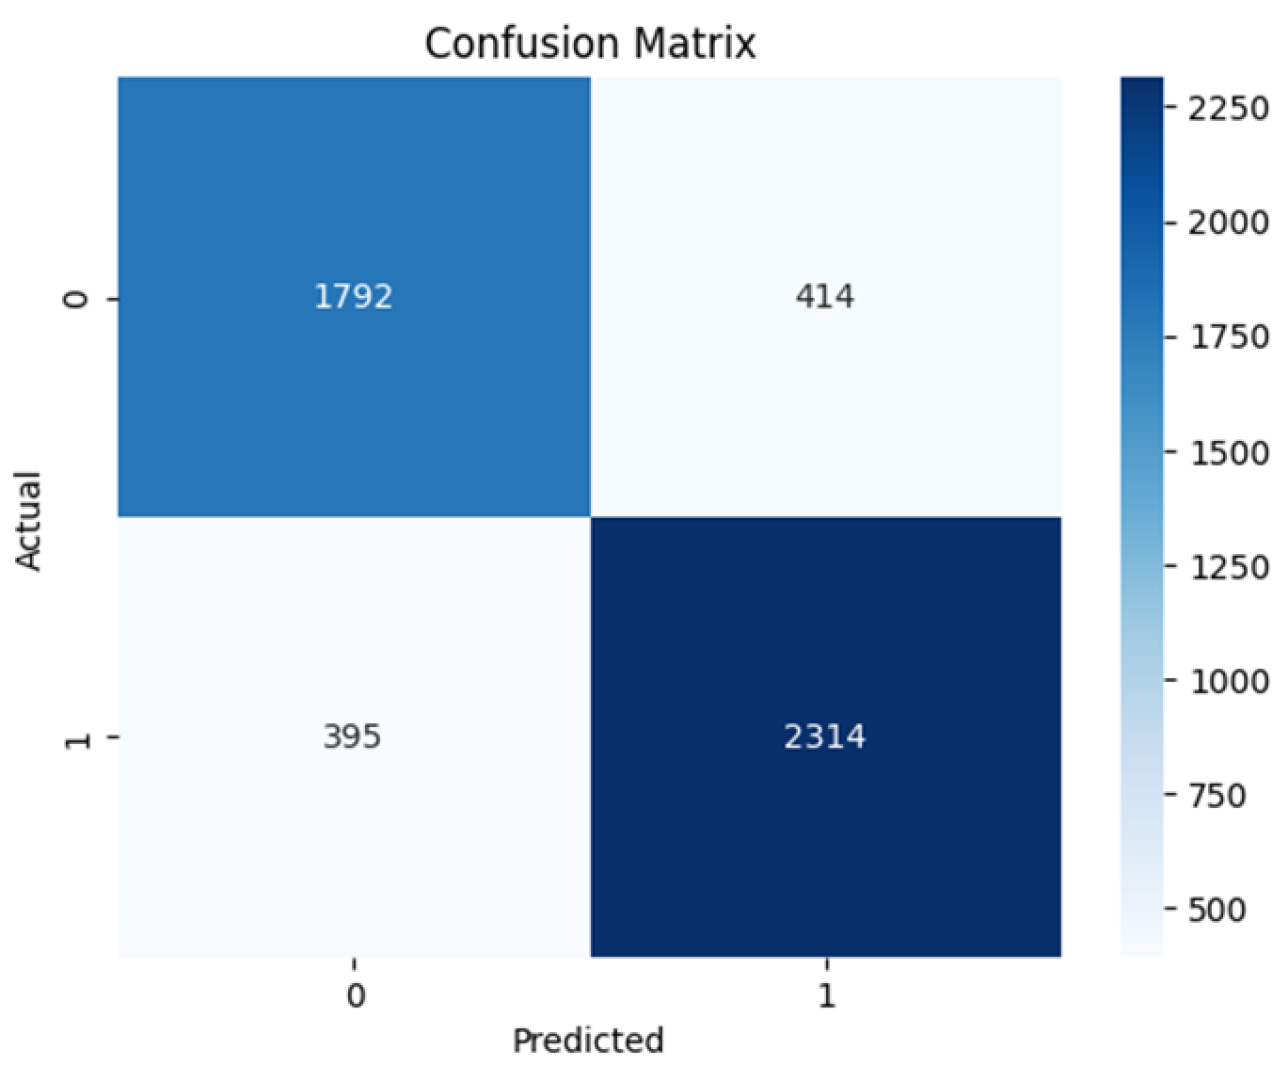
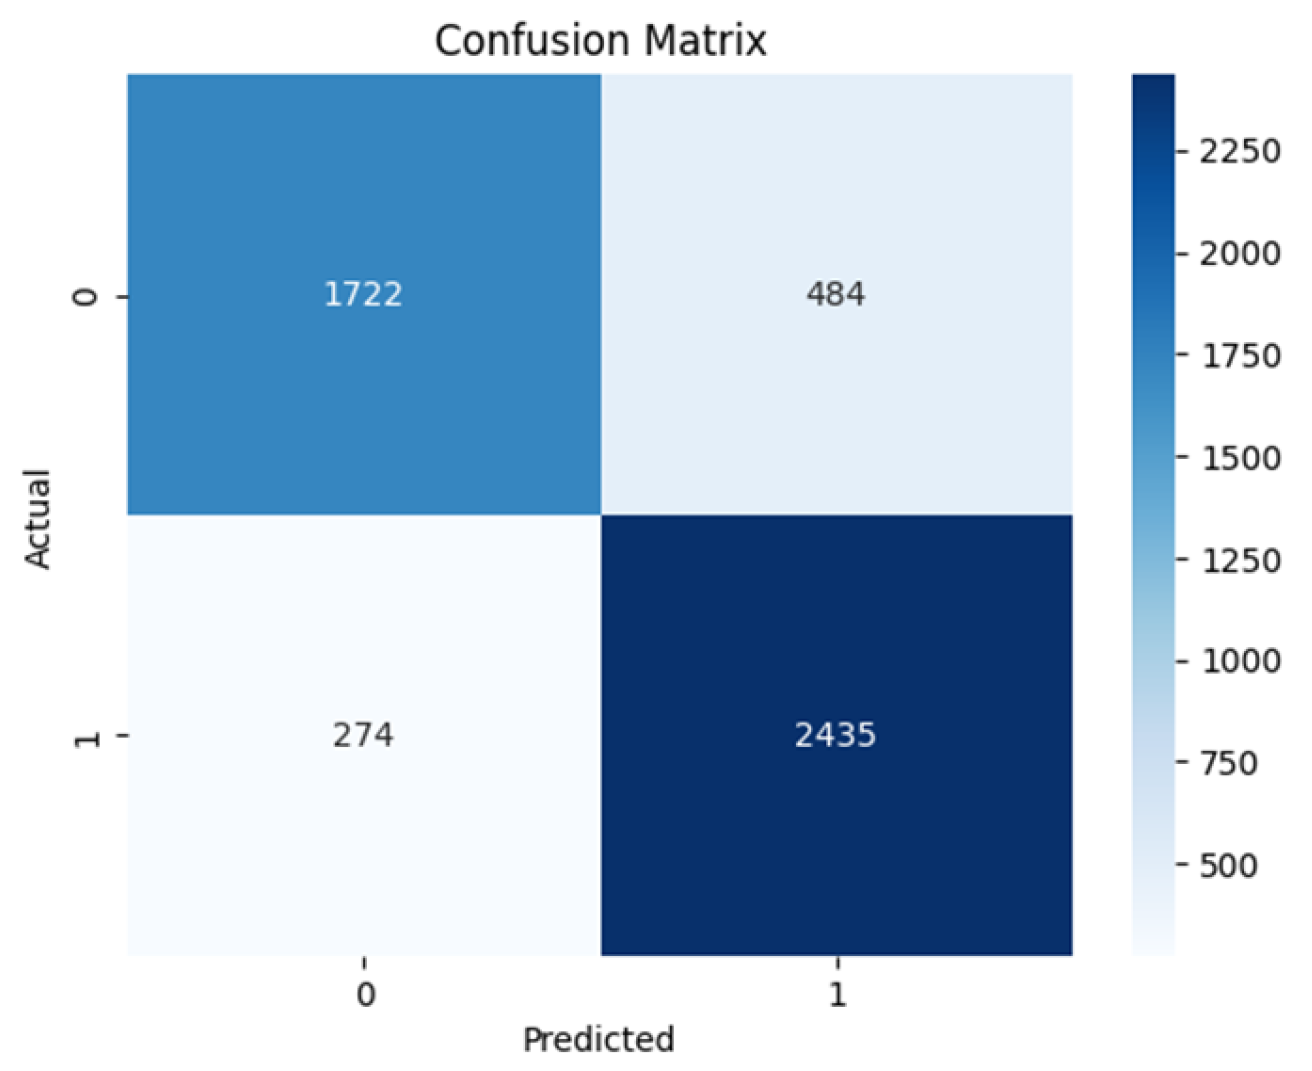
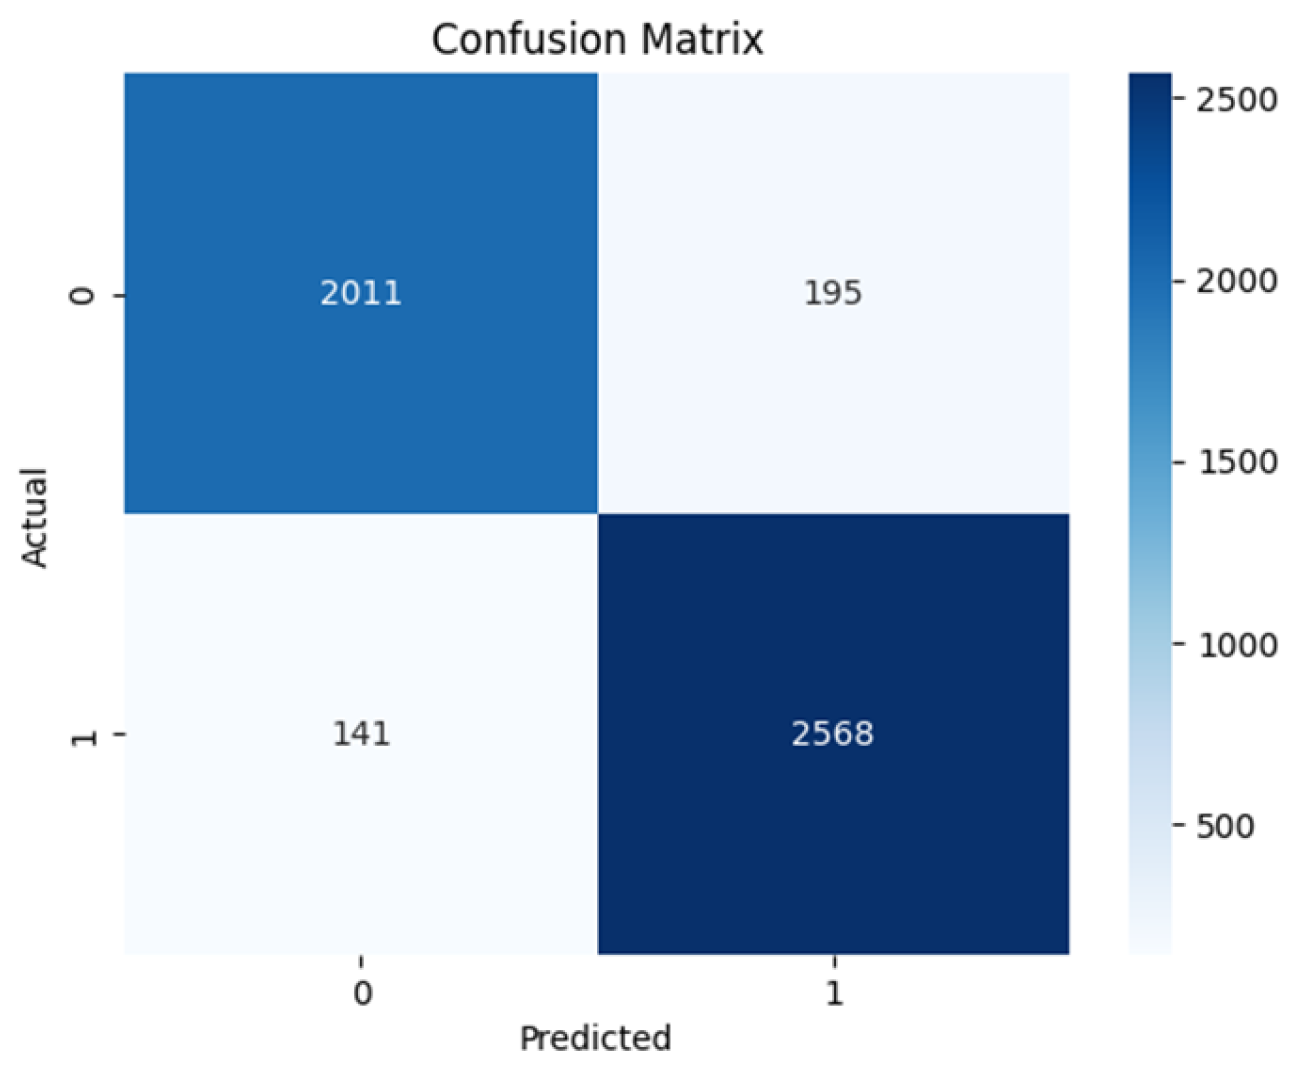
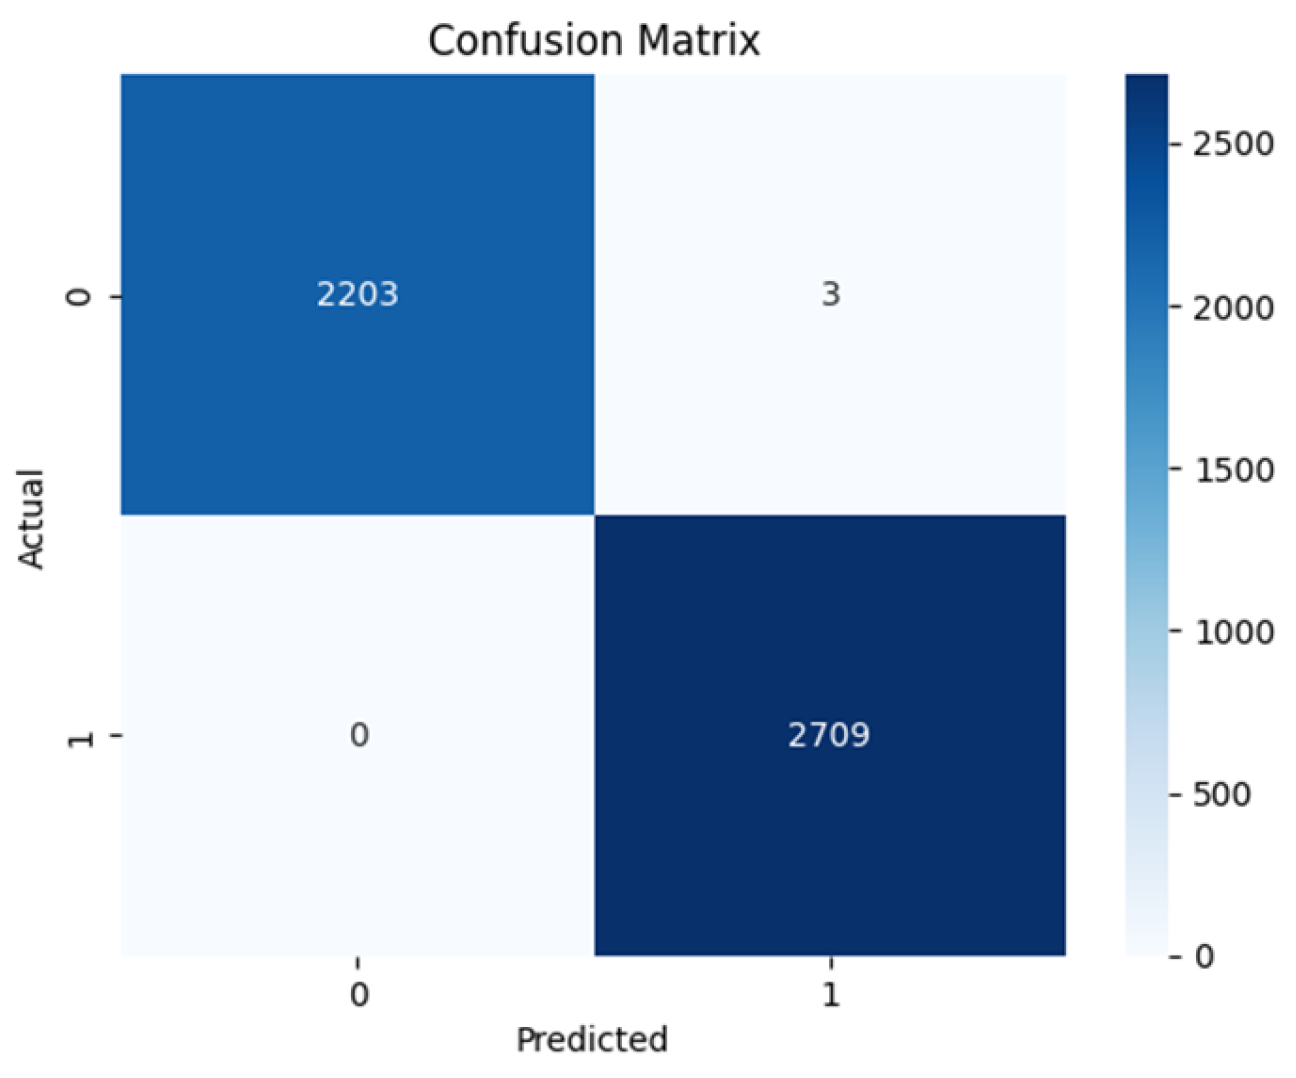
Based on the confusion matrices shown in
Figure 8,
Figure 9,
Figure 10 and
Figure 11. The Swin transformer architecture shows exceptional performance with 2203 True Negatives and 2709 True Positives as shown in
Figure 11. This makes it the best-performing model having zero False Positives and only 3 False Negatives. The ViT-base comes close with 2011 True Negatives and 2568 True Positives and has 141 False Negatives and 195 False Positives as shown in
Figure 10.
The VGG16 architecture has 1792 True Negatives and 2394 True Positives while having 395 False Negatives and 414 False Positives as shown in
Figure 8. The ResNet50 architecture shows 1722 True Negatives and 2435 True Positives while having 274 False Negatives and 484 False Positives as shown in
Figure 9.
Table 2 shows the sensitivity and specificity values of all the model architectures. The sensitivity measures the value of the actual positives that the model predicted correctly, while the specificity refers to the model’s ability to predict actual negatives correctly. The table shows ResNet50 to have 0.858 sensitivity and 0.794 specificity, while VGG16 has 0.854 sensitivity and 0.811 specificity. ViT base has 0.948 sensitivity and 0.913 specificity, Swin transformer has 1.000 sensitivity and 0.9986 specificity. The Negative predicted value (NPV) is the probability of the model truly predicting a negative case for a negative classification. While all the models except the ViT trained from scratch achieve a relatively high value, the Swin transformer achieved the highest score and perfect score of predicting truly negative class as negative, in this case benign. The Positive Predicted Value (PPV) is the probability of the model truly predicting a positive for a given positive classification. Again, the Swin transformer excelled among the models with a score of 0.9989 indicating its ability to predict positive classification as positive, in this case malignant.
The Swin transformer displayed the best performance over all the evaluation metrics with excellent scores. The results imply that the model can identify discriminative features during training and effectively and accurately classify breast cancer as benign and malignant. It achieved a training accuracy of up to 0.9981 and a test accuracy of up to 0.9994. The vision transformer (ViT-base) performs very well with high accuracy, low loss, and fast convergence rate, making the model exhibit good generalization ability. Though the result across all metrics is not as good as the Swin transformer, its performance is excellent, achieving the highest training accuracy of 0.9293 and test accuracy of up to 0.9318. The result from the ResNet50 architecture shows promising performance with good accuracy, precision, and recall measures. The model builds on feature extraction through the pre-trained weights from ResNet50. The resulting training accuracy is up to 0.8194 and the test accuracy of up to 0.8277. The result from the VGG16 arch accuracy shows a promising performance slightly better than the ResNet50 in the accuracy score. With good accuracy, precision, and recall measures, VGG16 can classify medical images accurately. The model builds on feature extraction through the pre-trained weights from VGG16, achieving a training accuracy of up to 0.7972 and a test accuracy of up to 0.8264. The result obtained from the scratch training of the vision transformer lags other four architectures exhibiting relatively low accuracy, precision, recall, and F1 scores in comparison with other architectures. The training accuracy is up to 0.5595 while it achieved a test accuracy is consistently around the value of 0.5524 suggesting a limitation in the model’s learnability of generalizable features. This is largely due to a limited dataset. An effective deep-learning model requires a large amount of data for training with a huge number of parameters [
43]. Hence, the superior performance of the transfer learning on pre-trained models over the trained models from scratch. The model does not appropriately learn and generalize well with such a limited image. This is in comparison with pre-trained models that have been subjected to large and complex image data.
5. Conclusions
In this study, we made a comparison between the CNN-based architectures and Vision transformer-based deep learning models to identify the best-performing model to accurately classify breast cancer mammographic images. SWIN transformer model achieved the best evaluation results in terms of accuracy and precision. This attests to the potential and effectiveness of the transformer architectures in computer vision tasks, which could be influential in the early detection and diagnosis of breast cancer offering a practical application to improve patient outcomes and offer valuable tools for healthcare professionals. The same could be said about the pre-trained ViT model, offering quite impressive valuation results as well. This can be attributed to the long-range dependencies feature retention capability of their architecture. Using pre-trained transformer models will provide better performance due to the vast learnable parameters with weights updated through learning from millions of images, outperforming CNN models which used to be the leader in computer vision tasks. For future research, to gain explainability of the transformer architecture, there is a need to obtain larger mammograms to train the transformer from scratch as results have shown to give better performance with larger datasets. Also, other medical imaging technologies such as ultrasound and MRI alongside mammogram images can be used for training the models for a more robust, effective, and improved classification model. This is particularly beneficial as each imaging procedure offers unique perspectives on breast tissues. Combining these unique features can improve the performance and accuracy of the deep learning model by giving it a better generalization of diverse breast tissues. The classifier can be enhanced to provide features to support patients like medical information, referrals to medical practitioners, and prescriptions as this can provide bespoke treatments for patients that have been diagnosed with the disease.
Author Contributions
Conceptualization, O.T and O.S.; methodology, O.T. and O.S; software, O.T. and O.S.; validation, O.S., O.P., and O.O.; formal analysis, O.T. and O.S.; investigation, O.T. and O.S.; resources, O.S.; data curation, O.T.; writing—original draft preparation, O.T. and O.S.; writing—review and editing, O.S., O.P. and O.O.; supervision, O.S.; project administration, O.P., and O.S.; All authors have read and agreed to the published version of the manuscript
Funding
This research received no external funding.
Institutional Review Board Statement
Not applicable
Informed Consent Statement
Not Applicable.
Data Availability Statement
Conflicts of Interest
The authors declare no conflicts of interest.
References
- Jabeen, K.; Khan, M.A.; Balili, J.; Alhaisoni, M.; Almujally, N.A.; Alrashidi, H.; Tariq, U.; Cha, J.-H. BC2NetRF: Breast Cancer Classification from Mammogram Images Using Enhanced Deep Learning Features and Equilibrium-Jaya Controlled Regula Falsi-Based Features Selection. Diagnostics 2023, 13, 1238. [CrossRef]
- Nasser, M.; Yusof, U.K. Deep Learning Based Methods for Breast Cancer Diagnosis: A Systematic Review and Future Direction. Diagnostics 2023, 13, 161. [CrossRef]
- Sung, H.; Ferlay, J.; Siegel, R.L.; Laversanne, M.; Soerjomataram, I.; Jemal, A.; Bray, F. Global Cancer Statistics 2020: GLOBOCAN Estimates of Incidence and Mortality Worldwide for 36 Cancers in 185 Countries. CA Cancer J. Clin. 2021, 71, 209–249. [CrossRef]
- Ayana, G.; Dese, K.; Dereje, Y.; Kebede, Y.; Barki, H.; Amdissa, D.; Husen, N.; Mulugeta, F.; Habtamu, B.; Choe, S.-W. Vision-Transformer-Based Transfer Learning for Mammogram Classification. Diagnostics 2023, 13, 178, Available online: https://discovery.researcher.life/article/vision-transformer-based-transfer-learning-for-mammogram-classification/db5c10858ce13d26a4c879868650ee40. [CrossRef]
- Mohamed, T.I.A.; Ezugwu, A.E.; Fonou-Dombeu, J.V.; Ikotun, A.M.; Mohammed, M. A bio-inspired convolution neural network architecture for automatic breast cancer detection and classification using RNA-Seq gene expression data. Sci. Rep. 2023, 13, 1–19, Available online: https://discovery.researcher.life/article/a-bio-inspired-convolution-neural-network-architecture-for-automatic-breast-cancer-detection-and-classification-using-rna-seq-gene-expression-data/7921b201d096356d952152f6bf074f41. [CrossRef]
- B.M, G.; C.P, S.; T, S. Breast Cancer Diagnosis Using Machine Learning Algorithms - A Survey. Int. J. Distrib. Parallel Syst. 2013, 4, 105–112, Available online: https://discovery.researcher.life/article/breast-cancer-diagnosis-using-machine-learning-algorithms-a-survey/1472f2bc636d352dabc8e3af31f6a66e. [CrossRef]
- Weedon-Fekjaer, H.; Romundstad, P.R.; Vatten, L.J. Modern mammography screening and breast cancer mortality: population study. BMJ 2014, 348, g3701–g3701, Available online: http://www.bmj.com/content/348/bmj.g3701.abstract. [CrossRef]
- Pashayan, N.; Antoniou, A.C.; Ivanus, U.; Esserman, L.J.; Easton, D.F.; French, D.; Sroczynski, G.; Hall, P.; Cuzick, J.; Evans, D.G. Personalized early detection and prevention of breast cancer: ENVISION consensus statement. Nature reviews Clinical oncology 2020, 17, 687–705.
- Chougrad, H.; Zouaki, H.; Alheyane, O. Multi-label transfer learning for the early diagnosis of breast cancer. Neurocomputing 2020, 392, 168–180. [CrossRef]
- Zhou, Z. Breast Cancer Diagnosis with Machine Learning. Highlights Sci. Eng. Technol. 2022, 9, 73–75, Available online: https://discovery.researcher.life/article/breast-cancer-diagnosis-with-machine-learning/72ee85f4e77c3e7fa543d4bd08261845. [CrossRef]
- beyli, E.D. Implementing automated diagnostic systems for breast cancer detection. Expert Syst. Appl. 2007, 33, 1054–1062.
- Heywang-Köbrunner, S.H.; Hacker, A.; Sedlacek, S. Advantages and Disadvantages of Mammography Screening. Breast Care 2011, 6, 2–2. [CrossRef]
- Whang, J.S.; Baker, S.R.; Patel, R.; Luk, L.; Castro III, A. The causes of medical malpractice suits against radiologists in the United States. Radiology 2013, 266, 548–554.
- Zebari, D.A.; Zeebaree, D.Q.; Abdulazeez, A.M.; Haron, H.; Hamed, H.N.A. Improved Threshold Based and Trainable Fully Automated Segmentation for Breast Cancer Boundary and Pectoral Muscle in Mammogram Images. IEEE Access 2020, 8, 203097–203116. [CrossRef]
- Gheflati, B.; Rivaz, H. VISION TRANSFORMERS FOR CLASSIFICATION OF BREAST ULTRASOUND IMAGES. 2022.
- Esteva, A., Kuprel, B., Novoa, R. A., Ko, J., Swetter, S. M., Blau, H. M., Thrun, S., "Dermatologist-level classification of skin cancer with deep neural networks", Nature, Vol. 542, No. 7639, pp. 115-118, 2017. Epub 2017 Jan 25. Erratum in: Nature. 2017 Jun 28;546(7660):686. PMID: 28117445; PMCID: PMC8382232. [CrossRef]
- Liang, T.; Shen, J.; Wang, J.; Liao, W.; Zhang, Z.; Liu, J.; Feng, Z.; Pei, S.; Liu, K. Ultrasound-based prediction of preoperative core biopsy categories in solid breast tumor using machine learning. Quant. Imaging Med. Surg. 2023, 13, 2634–+. [CrossRef]
- Baroni, G.L.; Rasotto, L.; Roitero, K.; Tulisso, A.; Di Loreto, C.; Della Mea, V. Optimizing Vision Transformers for Histopathology: Pretraining and Normalization in Breast Cancer Classification. J. Imaging 2024, 10, 108. [CrossRef]
- Alakwaa, W.; Nassef, M.; Badr, A. Lung Cancer Detection and Classification with 3D Convolutional Neural Network (3D-CNN). Int. J. Adv. Comput. Sci. Appl. 2017, 8. [CrossRef]
- McKinney, S.M.; Sieniek, M.; Godbole, V.; Godwin, J.; Antropova, N.; Ashrafian, H.; Back, T.; Chesus, M.; Corrado, G.S.; Darzi, A.; et al. International evaluation of an AI system for breast cancer screening. Nature 2020, 577, 89–94. [CrossRef]
- Litjens, G.; Kooi, T.; Bejnordi, B.E.; Setio, A.A.A.; Ciompi, F.; Ghafoorian, M.; van der Laak, J.A.W.M.; van Ginneken, B.; Sánchez, C.I. A survey on deep learning in medical image analysis. Med. Image Anal. 2017, 42, 60–88. Available online: https://www.sciencedirect.com/science/article/pii/S1361841517301135. [CrossRef]
- Cheng, H.; Shan, J.; Ju, W.; Guo, Y.; Zhang, L. Automated breast cancer detection and classification using ultrasound images: A survey. Pattern Recognit 2010, 43, 299–317.
- Mahoro, E.; Akhloufi, M.A. Applying Deep Learning for Breast Cancer Detection in Radiology. Curr. Oncol. 2022, 29, 8767–8793. [CrossRef]
- Araújo, T.; Aresta, G.; Castro, E.; Rouco, J.; Aguiar, P.; Eloy, C.; Polónia, A.; Campilho, A. Classification of breast cancer histology images using Convolutional Neural Networks. PLOS ONE 2017, 12, e0177544. [CrossRef]
- Albalawi, U.; Manimurugan, S.; Varatharajan, R. Classification of breast cancer mammogram images using convolution neural network. Concurr. Comput. Pr. Exp. 2022, 34. [CrossRef]
- López-Cabrera, J.D.; Rodríguez, L.A.L.; Pérez-Díaz, M. Classification of Breast Cancer from Digital Mammography Using Deep Learning. Intel. Artif. 2020, 23, 56–66. [CrossRef]
- Salama, W.M.; Aly, M.H. Deep learning in mammography images segmentation and classification: Automated CNN approach. Alex. Eng. J. 2021, 60, 4701–4709. [CrossRef]
- Tummala, S.; Kim, J.; Kadry, S. BreaST-Net: Multi-Class Classification of Breast Cancer from Histopathological Images Using Ensemble of Swin Transformers. Mathematics 2022, 10, 4109. [CrossRef]
- Liu, Z.; Lin, Y.; Cao, Y.; Hu, H.; Wei, Y.; Zhang, Z.; Lin, S.; Guo, B. In In Swin transformer: Hierarchical vision transformer using shifted windows; Proceedings of the IEEE/CVF international conference on computer vision; 2021; , pp 10012–10022.
- Mahoro, E.; Akhloufi, M.A. Breast cancer classification on thermograms using deep CNN and transformers. Quant. Infrared Thermogr. J. 2024, 21, 30–49. [CrossRef]
- Abimouloud, M.L.; Bensid, K.; Elleuch, M.; Aiadi, O.; Kherallah, M. In In Mammography breast cancer classification using vision transformers; International Conference on Intelligent Systems Design and Applications; Springer: 2023; , pp 452–461.
- Dosovitskiy, A.; Beyer, L.; Kolesnikov, A.; Weissenborn, D.; Zhai, X.; Unterthiner, T.; Dehghani, M.; Minderer, M.; Heigold, G.; Gelly, S. An image is worth 16x16 words: Transformers for image recognition at scale. arXiv preprint arXiv:2010.11929 2020.
- Huang, M.-L.; Lin, T.-Y. Dataset of breast mammography images with masses. Data Brief 2020, 31, 105928. [CrossRef]
- Vaswani, A.; Shazeer, N.; Parmar, N.; Uszkoreit, J.; Jones, L.; Gomez, A.N.; Kaiser, Ł; Polosukhin, I. Attention is all you need. Advances in neural information processing systems 2017, 30.
- Bao, H.; Dong, L.; Wei, F.; Wang, W.; Yang, N.; Liu, X.; Wang, Y.; Gao, J.; Piao, S.; Zhou, M. In In Unilmv2: Pseudo-masked language models for unified language model pre-training; International conference on machine learning; PMLR: 2020; , pp 642–652.
- Simonyan, K.; Zisserman, A. Very deep convolutional networks for large-scale image recognition. arXiv preprint arXiv:1409.1556 2014.
- He, K.; Zhang, X.; Ren, S.; Sun, J. In In Deep residual learning for image recognition; Proceedings of the IEEE conference on computer vision and pattern recognition; 2016; , pp 770–778.
- Xie, F.; Fan, H.; Li, Y.; Jiang, Z.; Meng, R.; Bovik, A. Melanoma Classification on Dermoscopy Images Using a Neural Network Ensemble Model. IEEE Trans. Med Imaging 2016, 36, 849–858. [CrossRef]
- Chollet, F. Deep learning with Python; Simon and Schuster: 2021; .
- Paszke, A.; Gross, S.; Massa, F.; Lerer, A.; Bradbury, J.P.; Chanan, G.; Killeen, T.; Lin, Z.; Gimelshein, N.; Antiga, L. An imperative style, high-performance deep learning library. Adv.Neural Inf.Process.Syst 1912, 32, 8026.
- He, K.; Zhang, X.; Ren, S.; Sun, J. Deep Residual Learning for Image Recognition. CoRR 2015, abs/1512.03385.
- Simonyan, K. Very deep convolutional networks for large-scale image recognition. arXiv preprint arXiv:1409.1556 2014.
- Ayana, G.; Dese, K.; Dereje, Y.; Kebede, Y.; Barki, H.; Amdissa, D.; Husen, N.; Mulugeta, F.; Habtamu, B.; Choe, S.-W. Vision-Transformer-Based Transfer Learning for Mammogram Classification. Diagnostics 2023, 13, 178. [CrossRef]
|
Disclaimer/Publisher’s Note: The statements, opinions and data contained in all publications are solely those of the individual author(s) and contributor(s) and not of MDPI and/or the editor(s). MDPI and/or the editor(s) disclaim responsibility for any injury to people or property resulting from any ideas, methods, instructions or products referred to in the content. |
© 2024 by the authors. Licensee MDPI, Basel, Switzerland. This article is an open access article distributed under the terms and conditions of the Creative Commons Attribution (CC BY) license (http://creativecommons.org/licenses/by/4.0/).
