1. Introduction
Energy plays an important role in the economic and social development of a country. As technology continues to advance, energy needs are increasing. Most of the energy production of developing countries such as Turkey is provided from primary energy sources, i.e., non-renewable energy sources. With the gradual decline in the use of fossil fuels, the environmental pollution caused by these fuels leads countries to search for different energy sources. The European Union (EU) has established targets aligned with various climate and energy objectives, with the aim of reducing the emission of greenhouse gases, enhancing energy efficiency, and increasing the amount of renewable energy used. According to these targets, greenhouse gas emissions were to fall by 20% and renewable energies to account for 20% of energy production by 2020. If the current rate of renewable energy adoption persists, the EU will be able to reach the target of a 27% share of renewable energy in its energy consumption by 2030 [
1]. There are many renewable energy sources that provide reliable, environmentally friendly, and clean energy production. These are such as wind energy, solar energy, and hydraulic energy. By using renewable energy sources, energy that is environmentally friendly, sustainable, and dependable can be produced in the most effective way [
2]. Photovoltaic (PV) systems, which convert the sun's energy into electrical energy, are the most efficient source of renewable energy because they are environmentally friendly, clean and require no maintenance [
3]. Nonetheless, PV systems also have disadvantages, such as high initial installation costs and low efficiency of the panels. In order to overcome this, it is recommended that governments provide incentives for green energy with an increase in panel production [
4]. On the other hand, since it is a modular system for off-grid and remote locations in islanded mode, it can generate electricity at an affordable cost. In recent years, with the installation of large PV systems, grid-connected systems have become the most important source of electrical energy generation.
The maximum power point tracking (MPPT) process is an effective method for optimizing the efficiency of PV systems. MPPT control algorithms are important because of the nonlinear PV panel power-voltage (P-V) characteristic to generate maximum power. MPPT algorithms are employed for the regulation of the duty cycle of a DC-DC boost or buck converter that is connected to the PV system [
5]. The most widespread MPPT algorithms used in the literature are Hill Climbing or perturb and observe (PO), Incremental Conductance (IncCon), Fractional Open-Circuit Voltage (FOCV), Fractional Short-Circuit Current (FSCC), Fuzzy Logic Control (FLC), and Neural Network (NN) [
6]. POand IncCon MPPT algorithms are mostly used due to their simple form and easy applicability. In both of these methods, maximum power is obtained by measuring the PV panel's current and voltage using two sensors. The power tracking POmethod performance is slow, and high oscillations occur around the MPPT [
6] and [
7].
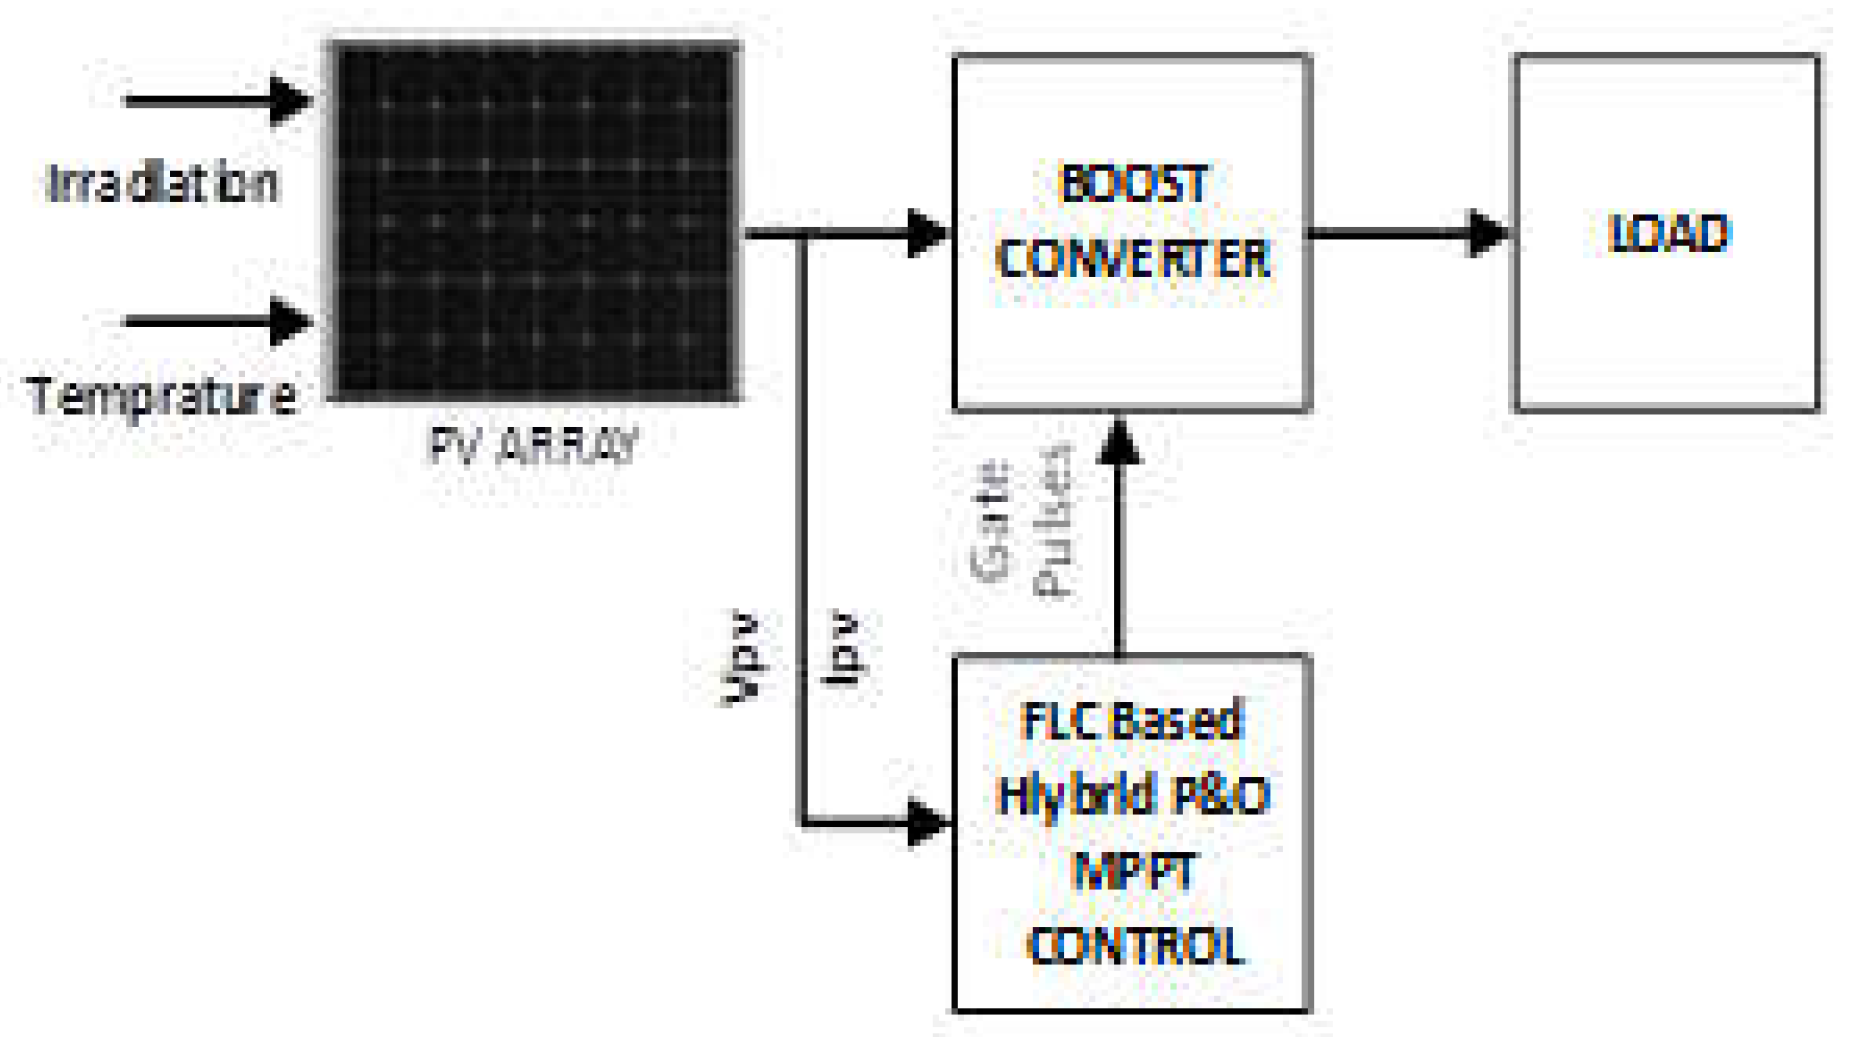
In this paper will be presented in detail a novel, intelligent and hybrid technique for MPPT that makes use of the POalgorithm. This paper presents a FLC design and model for MPPT for PV systems, using fuzzy logic's ability to express a problem using language [
8]. By designing a DC-DC buck-boost converter and comparing the fuzzy logic MPPT method with the classical POMPPT method, it was shown that the new MPPT-based FLC method provides higher efficiency and performance than PO [
9]. An adaptive fuzzy logic algorithm (AFLC) has been proposed to operate the PV using the MPPT method improve its steady-state performance and robustness, and effectively control the sudden load variations connected to a buck-boost converter [
10]. An adaptive PO-fuzzy algorithm is proposed for MPPT control in a DC-DC boost converter by integrating the advantages of both PO and fuzzy logic techniques [
11]. The using a PV panel's mathematical model, emphasizing the main innovation, has been proved by different test scenarios with signals of temperature and solar irradiance variables to evaluate the performance of a fuzzy controller to monitor the maximum power point of the PV system [
12]. Reference [
13] used a hybrid method to partition the entire search space of maximum power point (MPP) into three regions to support the classical PO algorithm to find the global MPP under partial shades, and proposed a FLC to determine the GMPPs region. In this paper, a method that perceives the output circuit voltage and short circuit current for optimal control with a fuzzy controller and uses these two parameters has been introduced [
14]. To prove the effectiveness of MPPT algorithm with FLC, an optimum duty cycle was created by controlling the modeled DC-DC converter connected to the PV array [
15]. For the maximum power generation from the PV system with the SEPIC converter, the effectiveness of the MPPT algorithms using P&O, Incremental Conductivity (IC) and FLC are compared, and the efficiency and MPPT time of FLC is shown to be faster than the other two techniques [
16]. An enhancement has been made to a hybrid FLC MPPT control algorithm by merging the fuzzy-based PO algorithm with the fuzzy-based FSCC algorithm, demonstrating through analysis that said hybrid algorithm generates superior dynamic performance [
17]. For MPPT in PV systems, sliding mode controller (SMC) and FLC techniques have been compared that have been simulated, and it has been mentioned that the FLC algorithm reacts slower than the SMC algorithm and the SMC has a more robust control capability than the FLC algorithm [
18]. In [
19], it is stated that the FLC MPPT method improves efficiency, reduces cost, reduces losses, and also increases battery life by the fact that the boost converter connected to the PV panel responds quickly under variable environmental conditions and is unaffected by any alterations in the circuit parameters [
19].
In this study, FLC and IncCon MPPT methods are simulated and compared in a Matlab/Simulink environment. 4 Sharp ND-F4Q295 PV panels, 2 of which are serial and 2 of which are parallel, were used for simulation. The technical specifications for the SHARP NDQ295 PV panel at standart test conditions (STC) are provided in
Table 1.
The article is structured as follows:
Section 2 describes the detailed operation of the IncCon MPPT algorithm.
Section 3 describes the FLC algorithm in detail. In
Section 4, the proposed FLC algorithm is explained in detail. In Chapter 5, the simulation results of the proposed FLC algorithm and IncCon MPPT algorithms are compared and analyzed. Finally, the results will be presented in section 6.
2. IncCon MPPT Methods
The MPP point in this approach is identified by utilizing the PV panel's P-V characteristic curve. In this algorithm, the current and voltage values of the PV panel are measured continuously. According to the current measurement and voltage values, the power generated by the PV panel is calculated, as shown in Equation 1.
As illustrated in
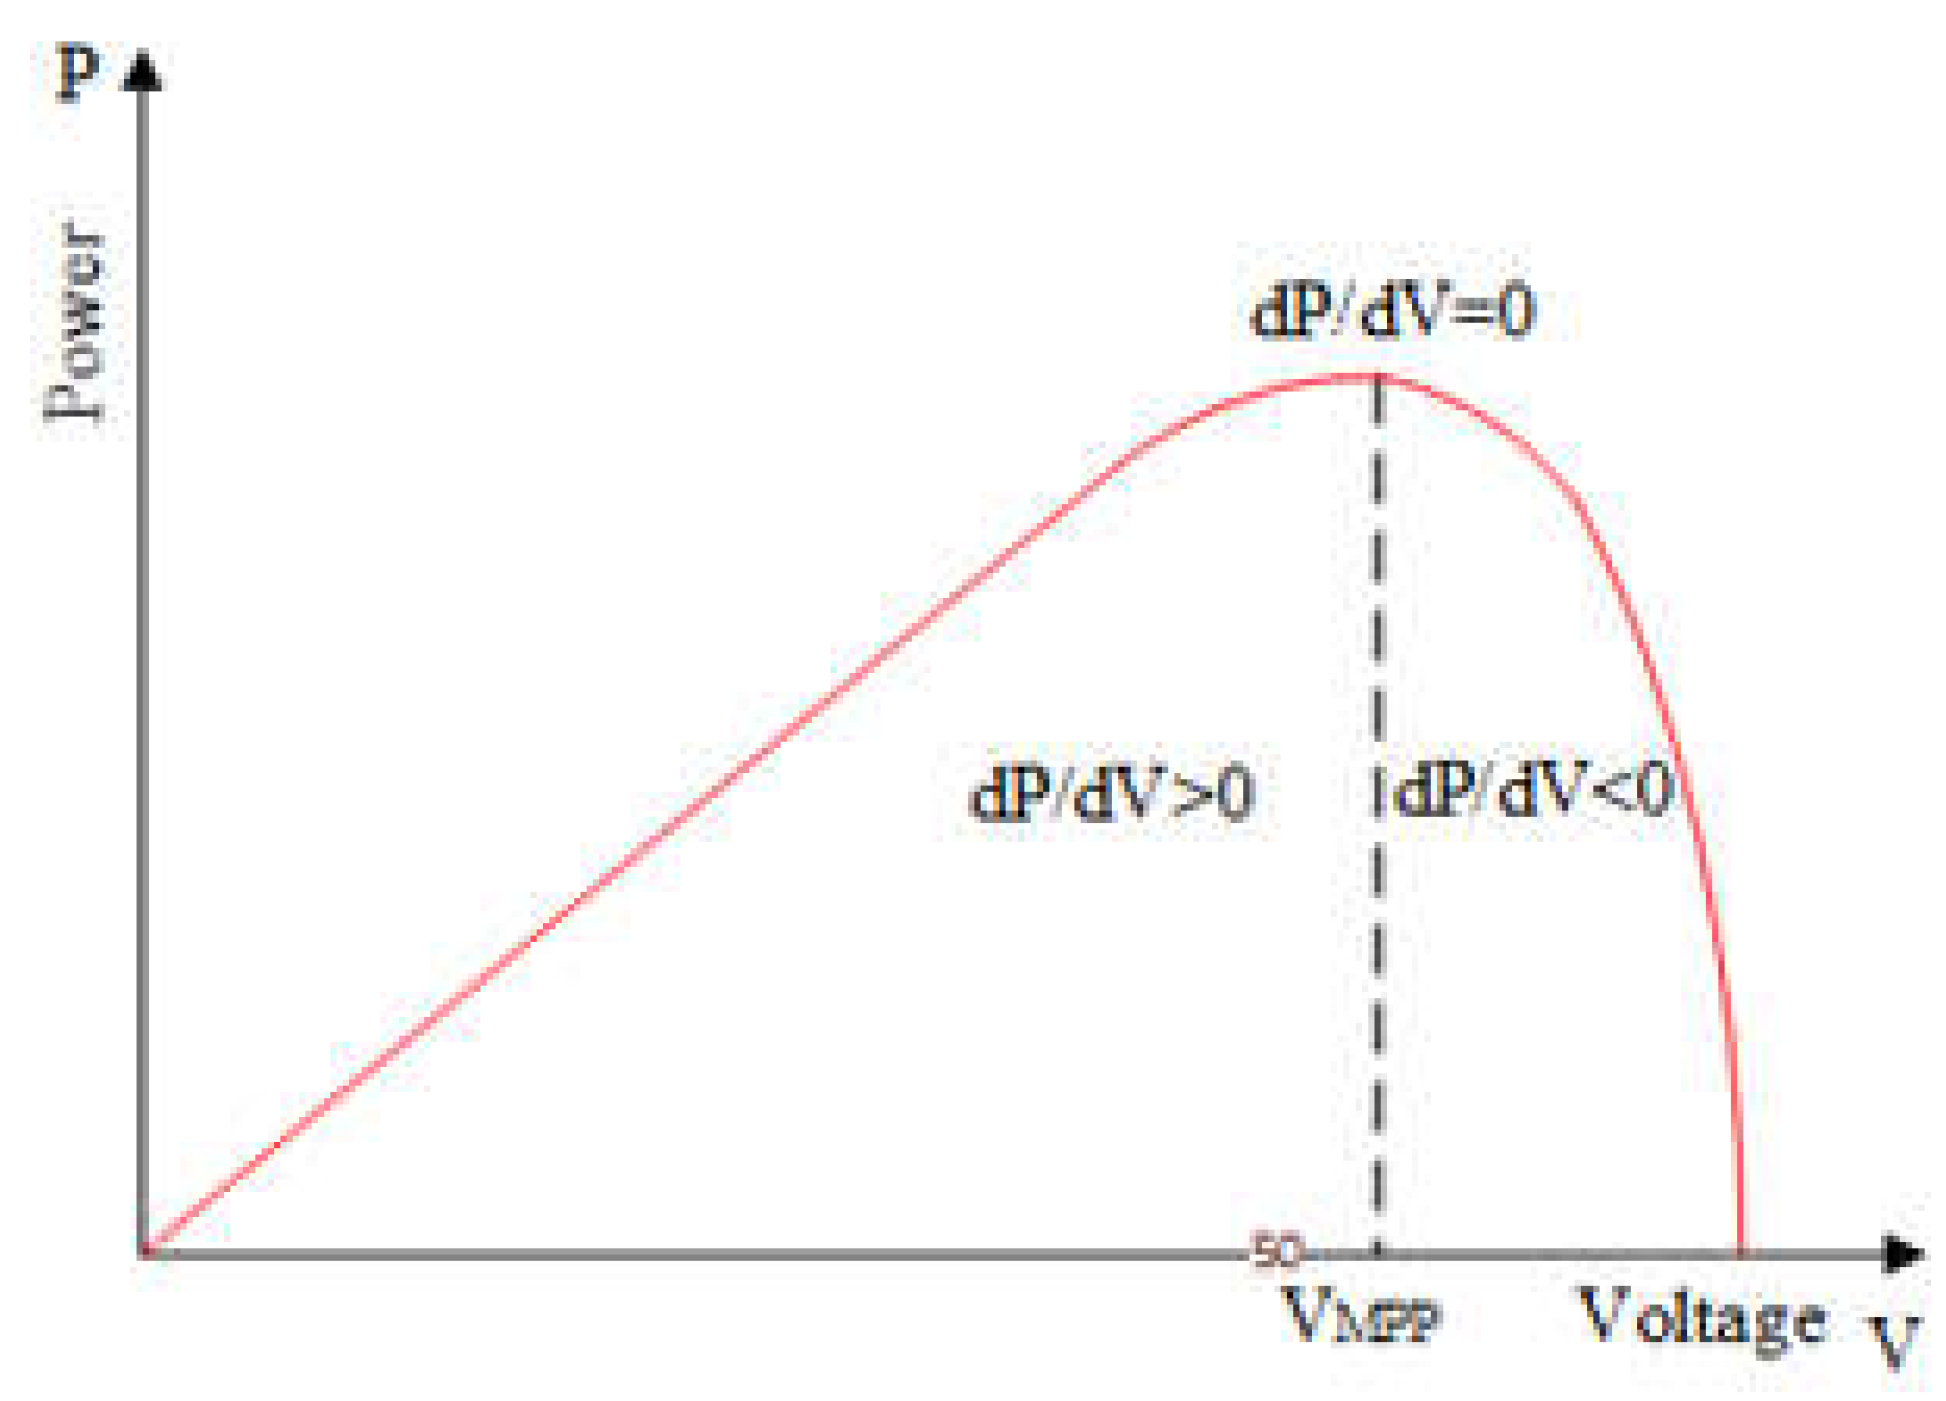
Figure 1, the IncCon MPPT algorithm operates on the principle that the MPP occurs where the ratio of the PV panel's change in power (ΔP) to the change in voltage (ΔV) is zero (MPP) (ΔP / ΔV = 0). In this method, to determine the change in the power generation of the PV panel and the point where this ratio ΔP / ΔV is zero, the conductivity value (
I /
V) is used.
The power produced by the panel is calculated as in equation 1, which provides the formation of this method. If the derivative of the expression in Equation 2 is taken according to the voltage,
If the equation is rewritten due to the fact that at the MPP, the point at which the PV power variation is equal to zero must be dP/dV=0;
Hence, equation 5 is obtained.
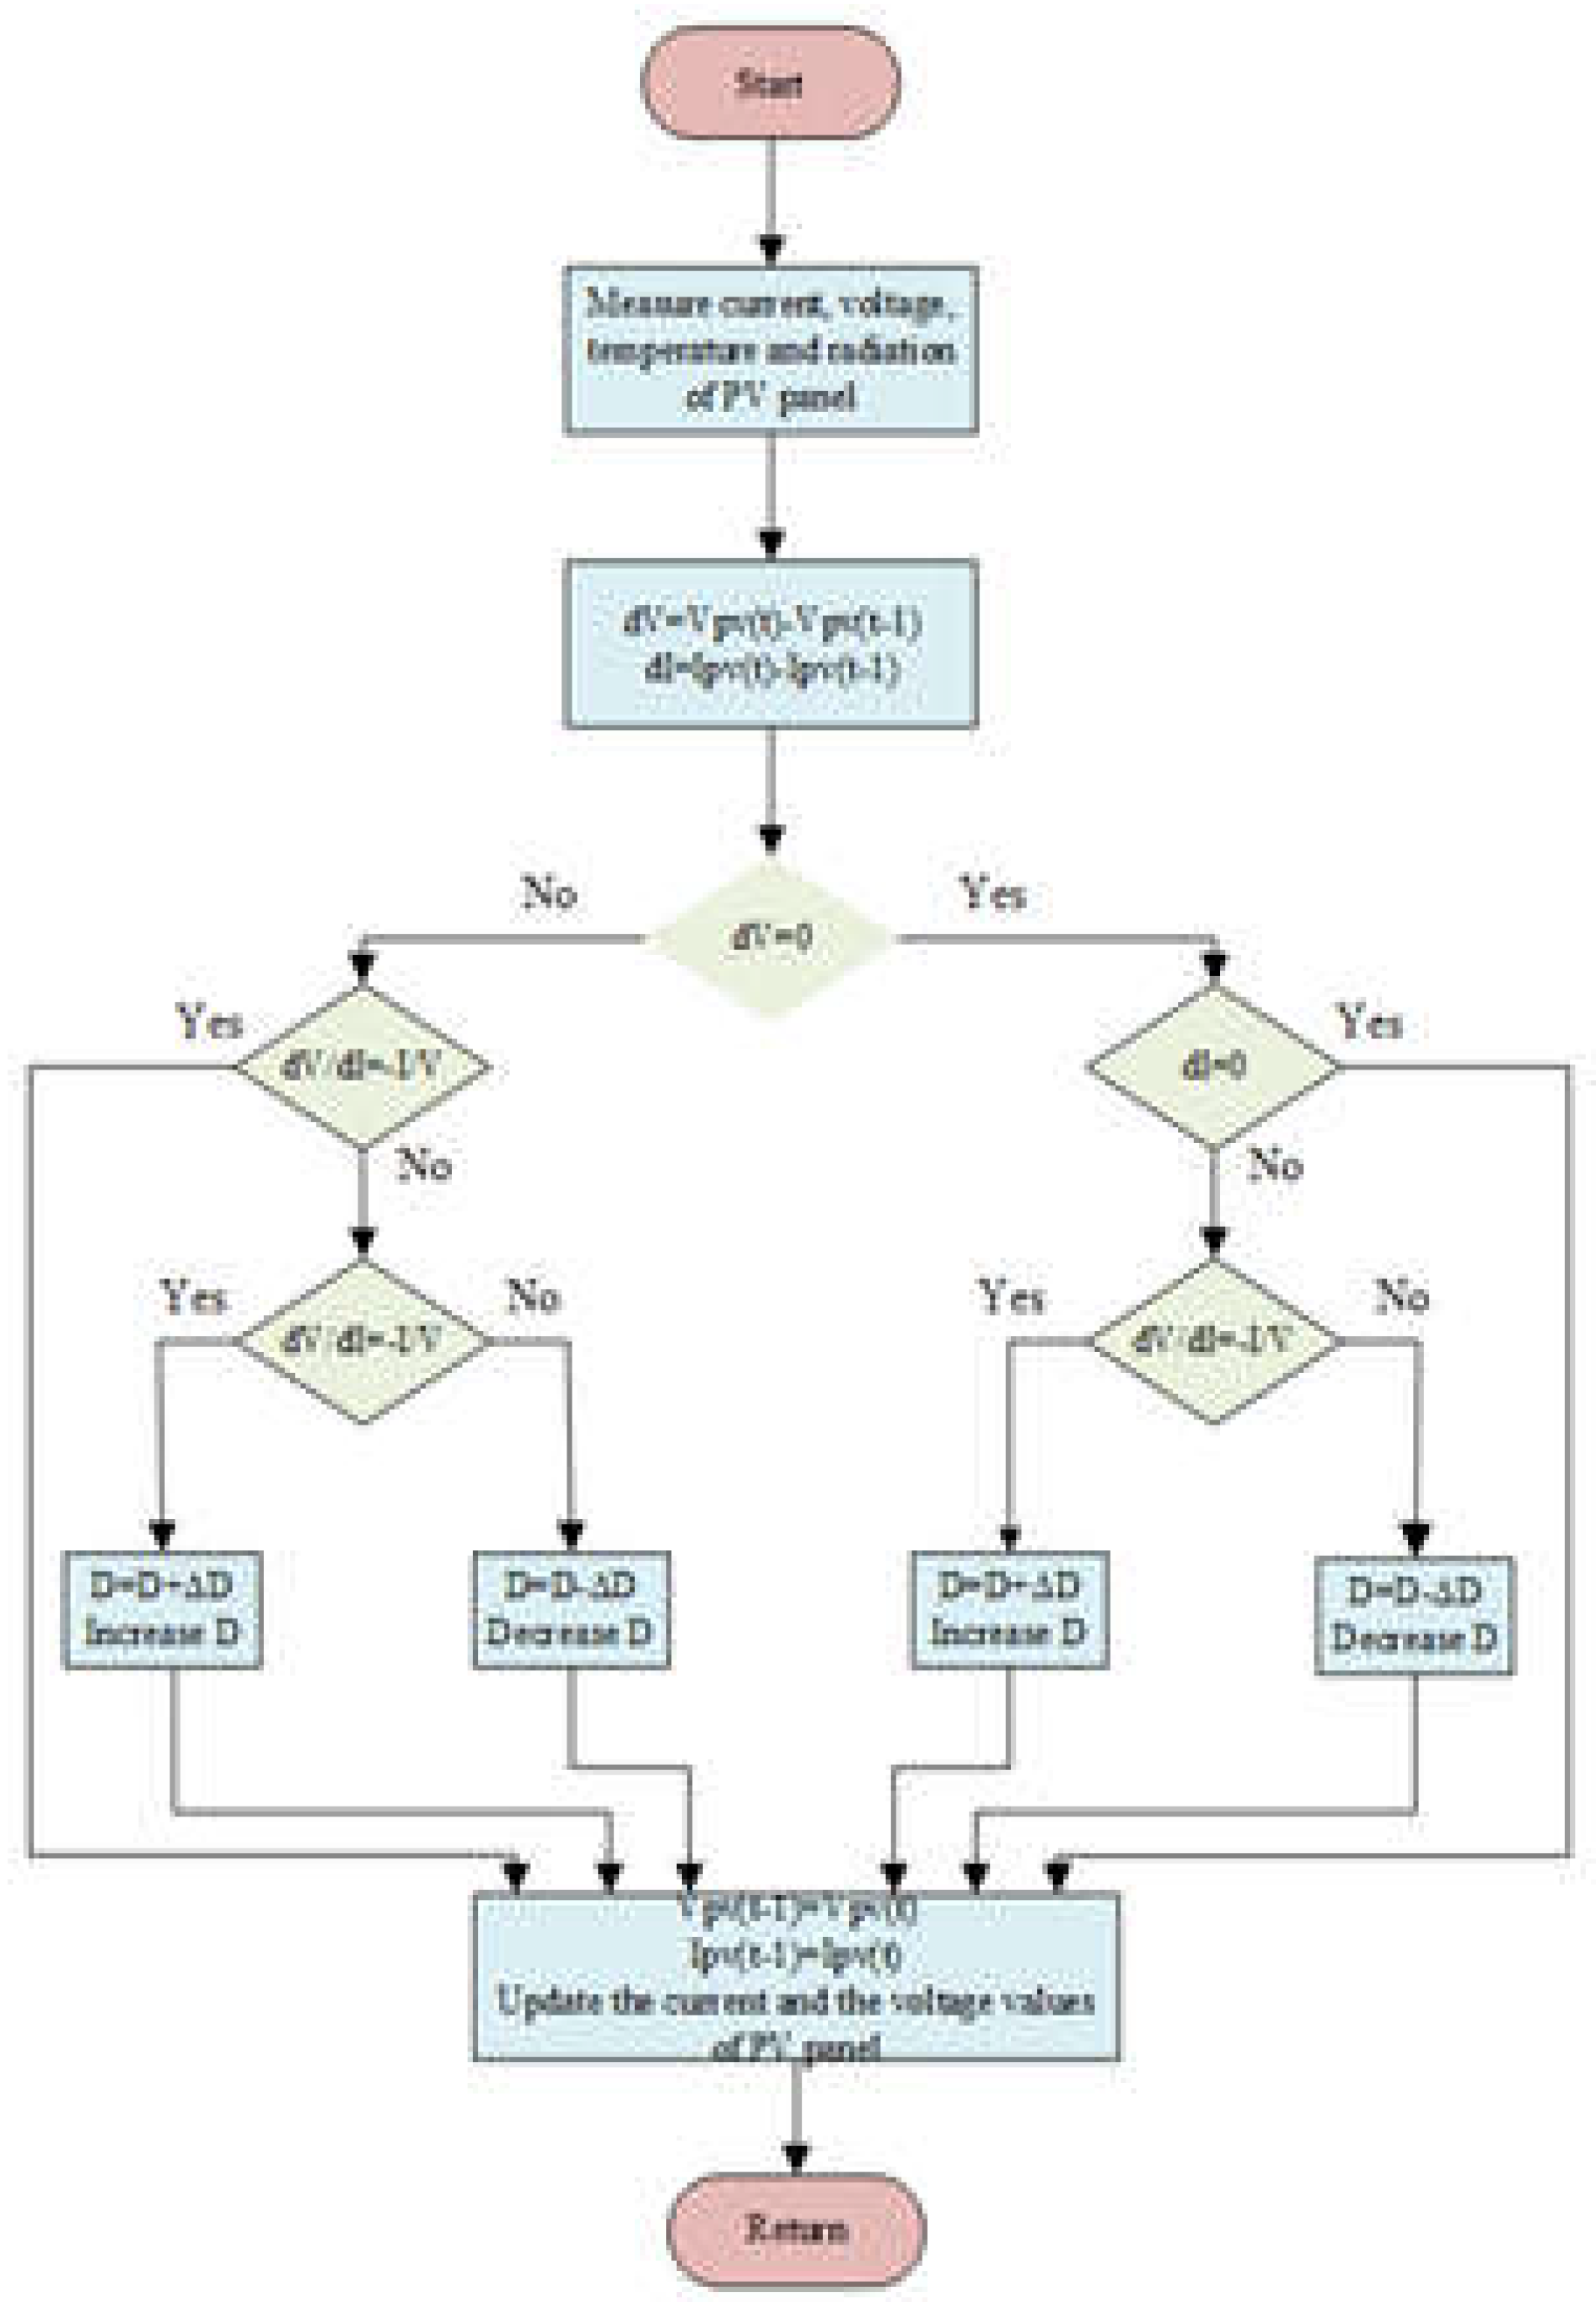
The PV panel voltage can be quickly adjusted by increasing or decreasing the reference voltage, current, or relative conduction time (D) until the MPP voltage is reached by measuring the incremental and the the instantaneous conductance of the array (dI/dV or I/V). The method of Equation 5 is used as an indicator of the process of tracking the maximum power point. When DP/DV is less than zero, decreasing the reference voltage causes DP/DV to tend towards zero; when DP/DV is greater than zero, increasing the reference voltage causes DP/DV to tend towards zero; when DP/DV is equal to zero, no adjustment to the reference voltage is required [
20].
In this case, dP/dV = 0, at MPP,
dP/dV > 0, to the left of the MPP,
dP/dV < 0 is understood to be on the right side of the MPP [
21].
The IncCon algorithm is more complex than the PO algorithm, but it is one of the most widely used methods for variable environmental conditions due to its better tracking of the MPP [
22]. The benefits of this approach are that the ripples that occur at the MPP are reduced, and the power loss is less. In addition, it is faster and more durable than the PO algorithm in detecting MPP points against rapidly changing environmental conditions.
Figure 2 shows the algorithm flow diagram of the IncCon method [
23].
Only in very special cases will the operating point coincide with the MPP if a load is connected to the PV module; for other conditions, the system will not operate at maximum power. When a load is connected to the PV module, the operating point will coincide with the MPP only in very special cases; for other conditions, the system will not operate at maximum power.
4. Fuzzy Logic Control MPPT Method
FLC is a commonly utilized smart method for executing MPPT operation in PV systems under non-linear environmental conditions. Although fuzzy Logic has a complex structure, it provides more accurate results in MPPT processes and is more stable in variable weather conditions. The fuzzy logic method has more advantages than other conventional MPPT methods. With these advantages, there is no requirement for a mathematical model to execute the operations. It has the capability to operate with variable inputs. It can cope with nonlinear situations. FL Controllers have a more robust structure than classical controllers [
27]. It also has several advantages, such as fast time response and good performance compared with conventional methods, robust structure, and simple design [
28].
Fuzzy Logic deals with ambiguous or imprecise situations, unlike the precise Logic of the Boolean theory. A variable in fuzzy logic consists of clusters of values characterised by non-numerical verbal expressions such as SMALL(S), MEDIUM(M), LARGE(L), etc. This linguistic expressions are numerically represented by fuzzy sets (sometimes called fuzzy subsets). In contrast to the 0 and 1 limits of a Boolean set, each fuzzy set is defined by a membership function that varies between 0 and 1 [
29] and [
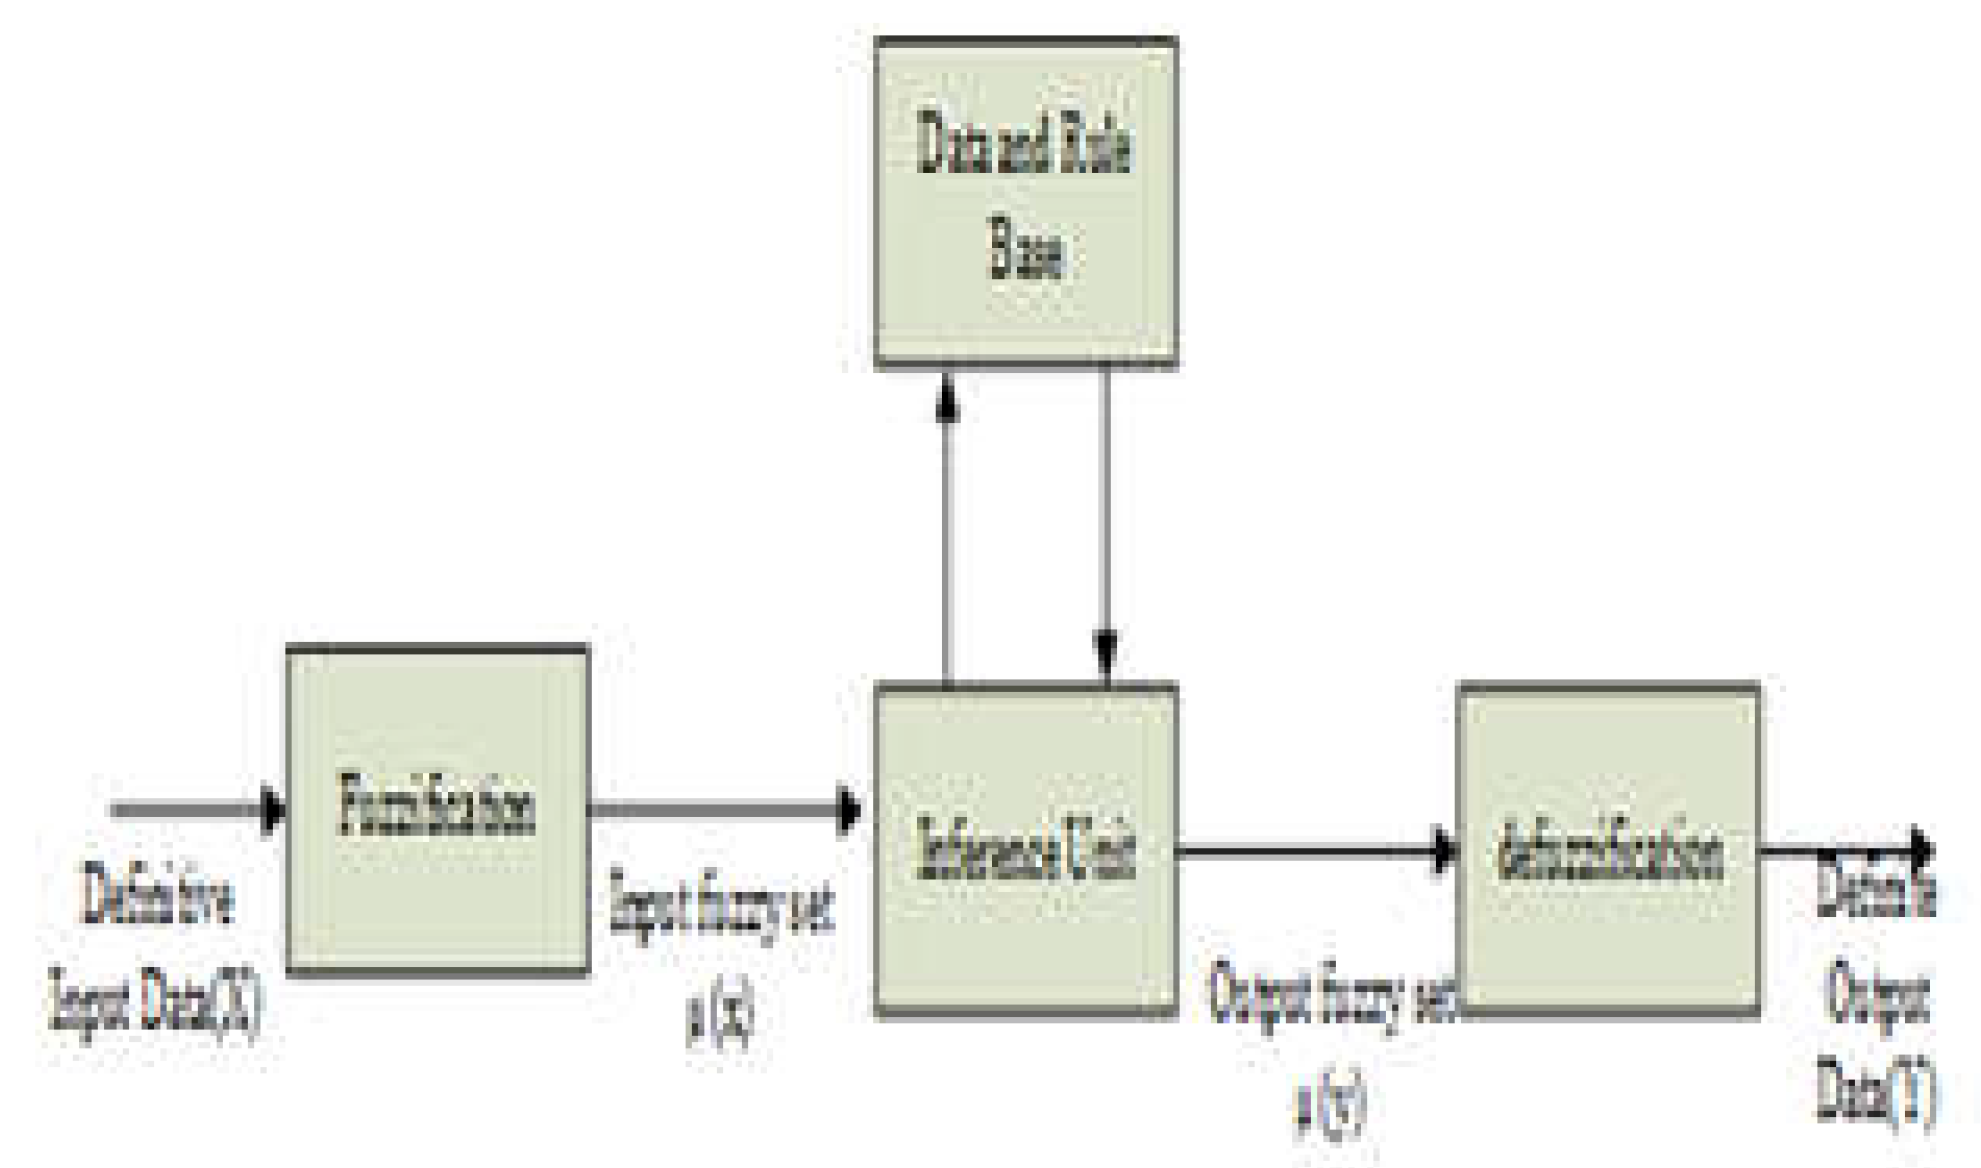
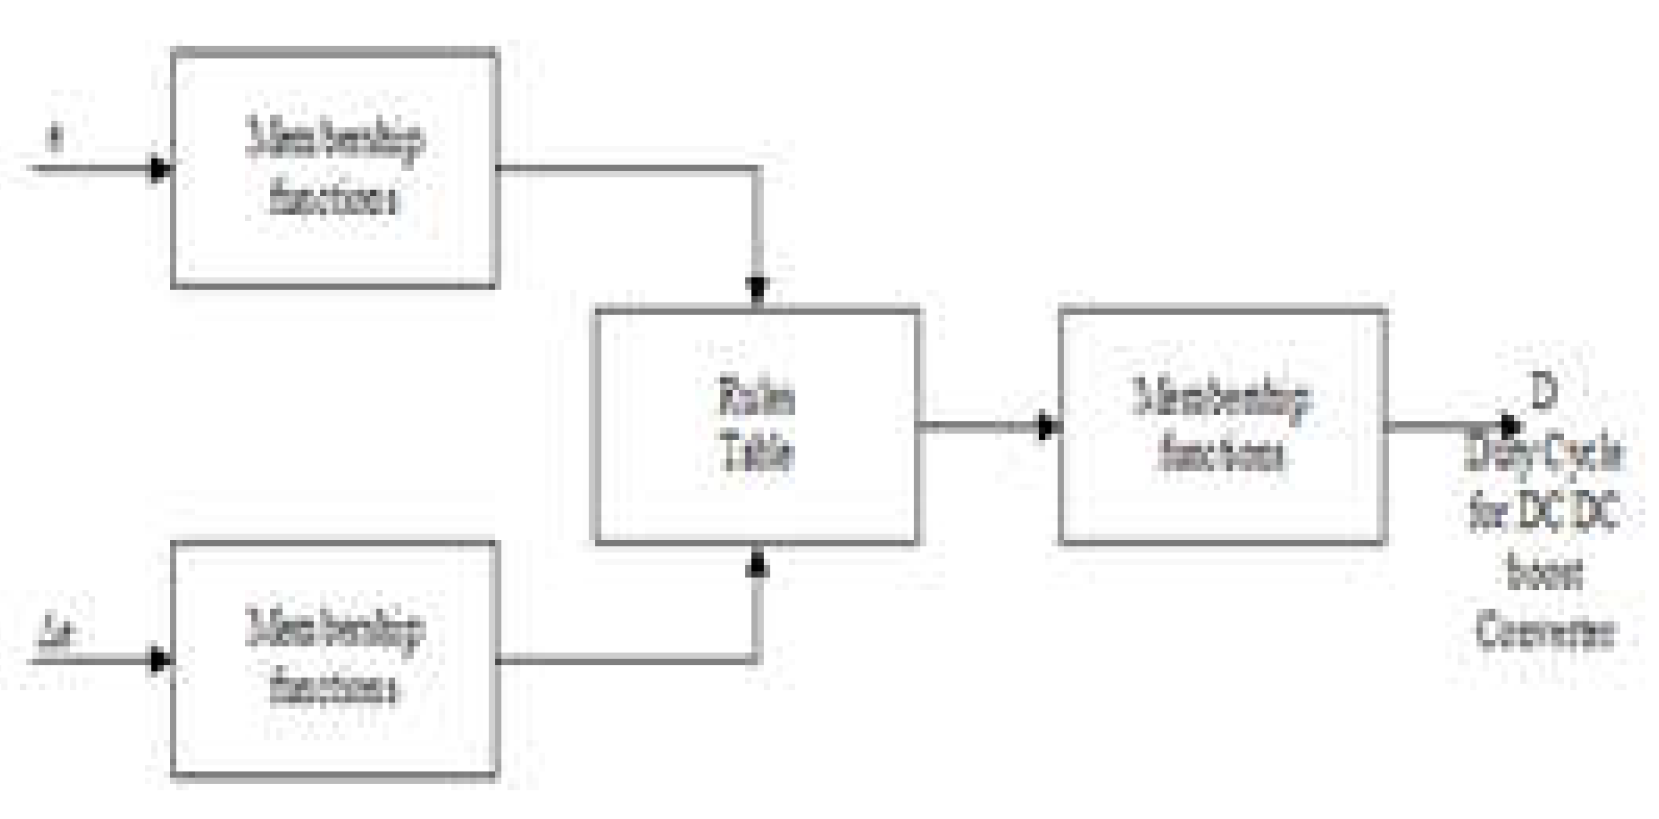
30]. Therefore, in the fuzzy logic method, membership functions created for these verbal values are used instead of mathematical modeling. The fundamental structure of a fuzzy controller is shown in
Figure 4. The fuzzy logiccontroller consists of four main sections. These concepts are described as fuzzification, fuzzy inference engine, rule base, and defuzzification.
4.1. Fuzzification
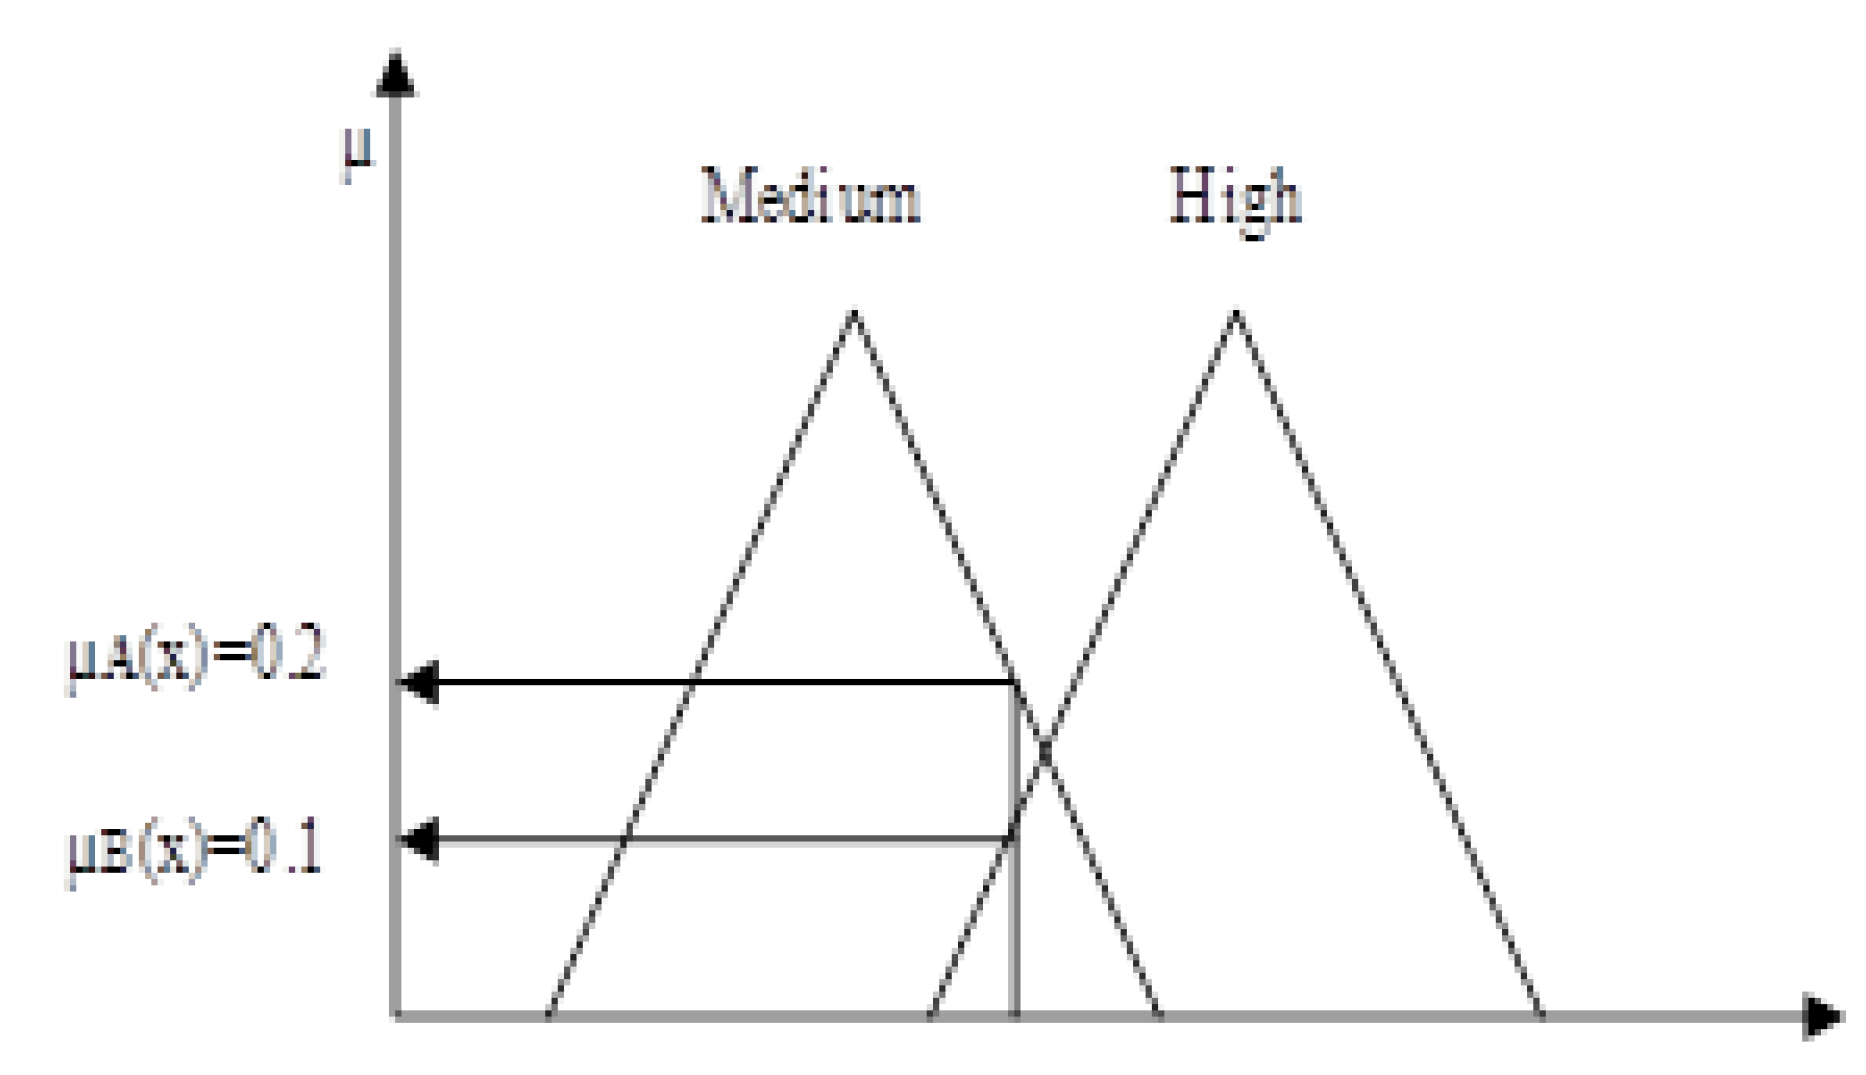
It is a procedure for converting real scalar values (precise values) into non-numeric linguistic values and fuzzy values. Fuzzy values are degree classifications that form sets of membership functions. For this purpose, the measured voltage and current of the PV panels and the calculated variation of the generated power are used as input values for the FLC.
Figure 5 shows the transformation of a real value into a fuzzy value. For each input value, the related membership function returns the value µ. The max-min method was applied to extract µ from the triangular-type membership function.
4.2. Fuzzy Inference Engine
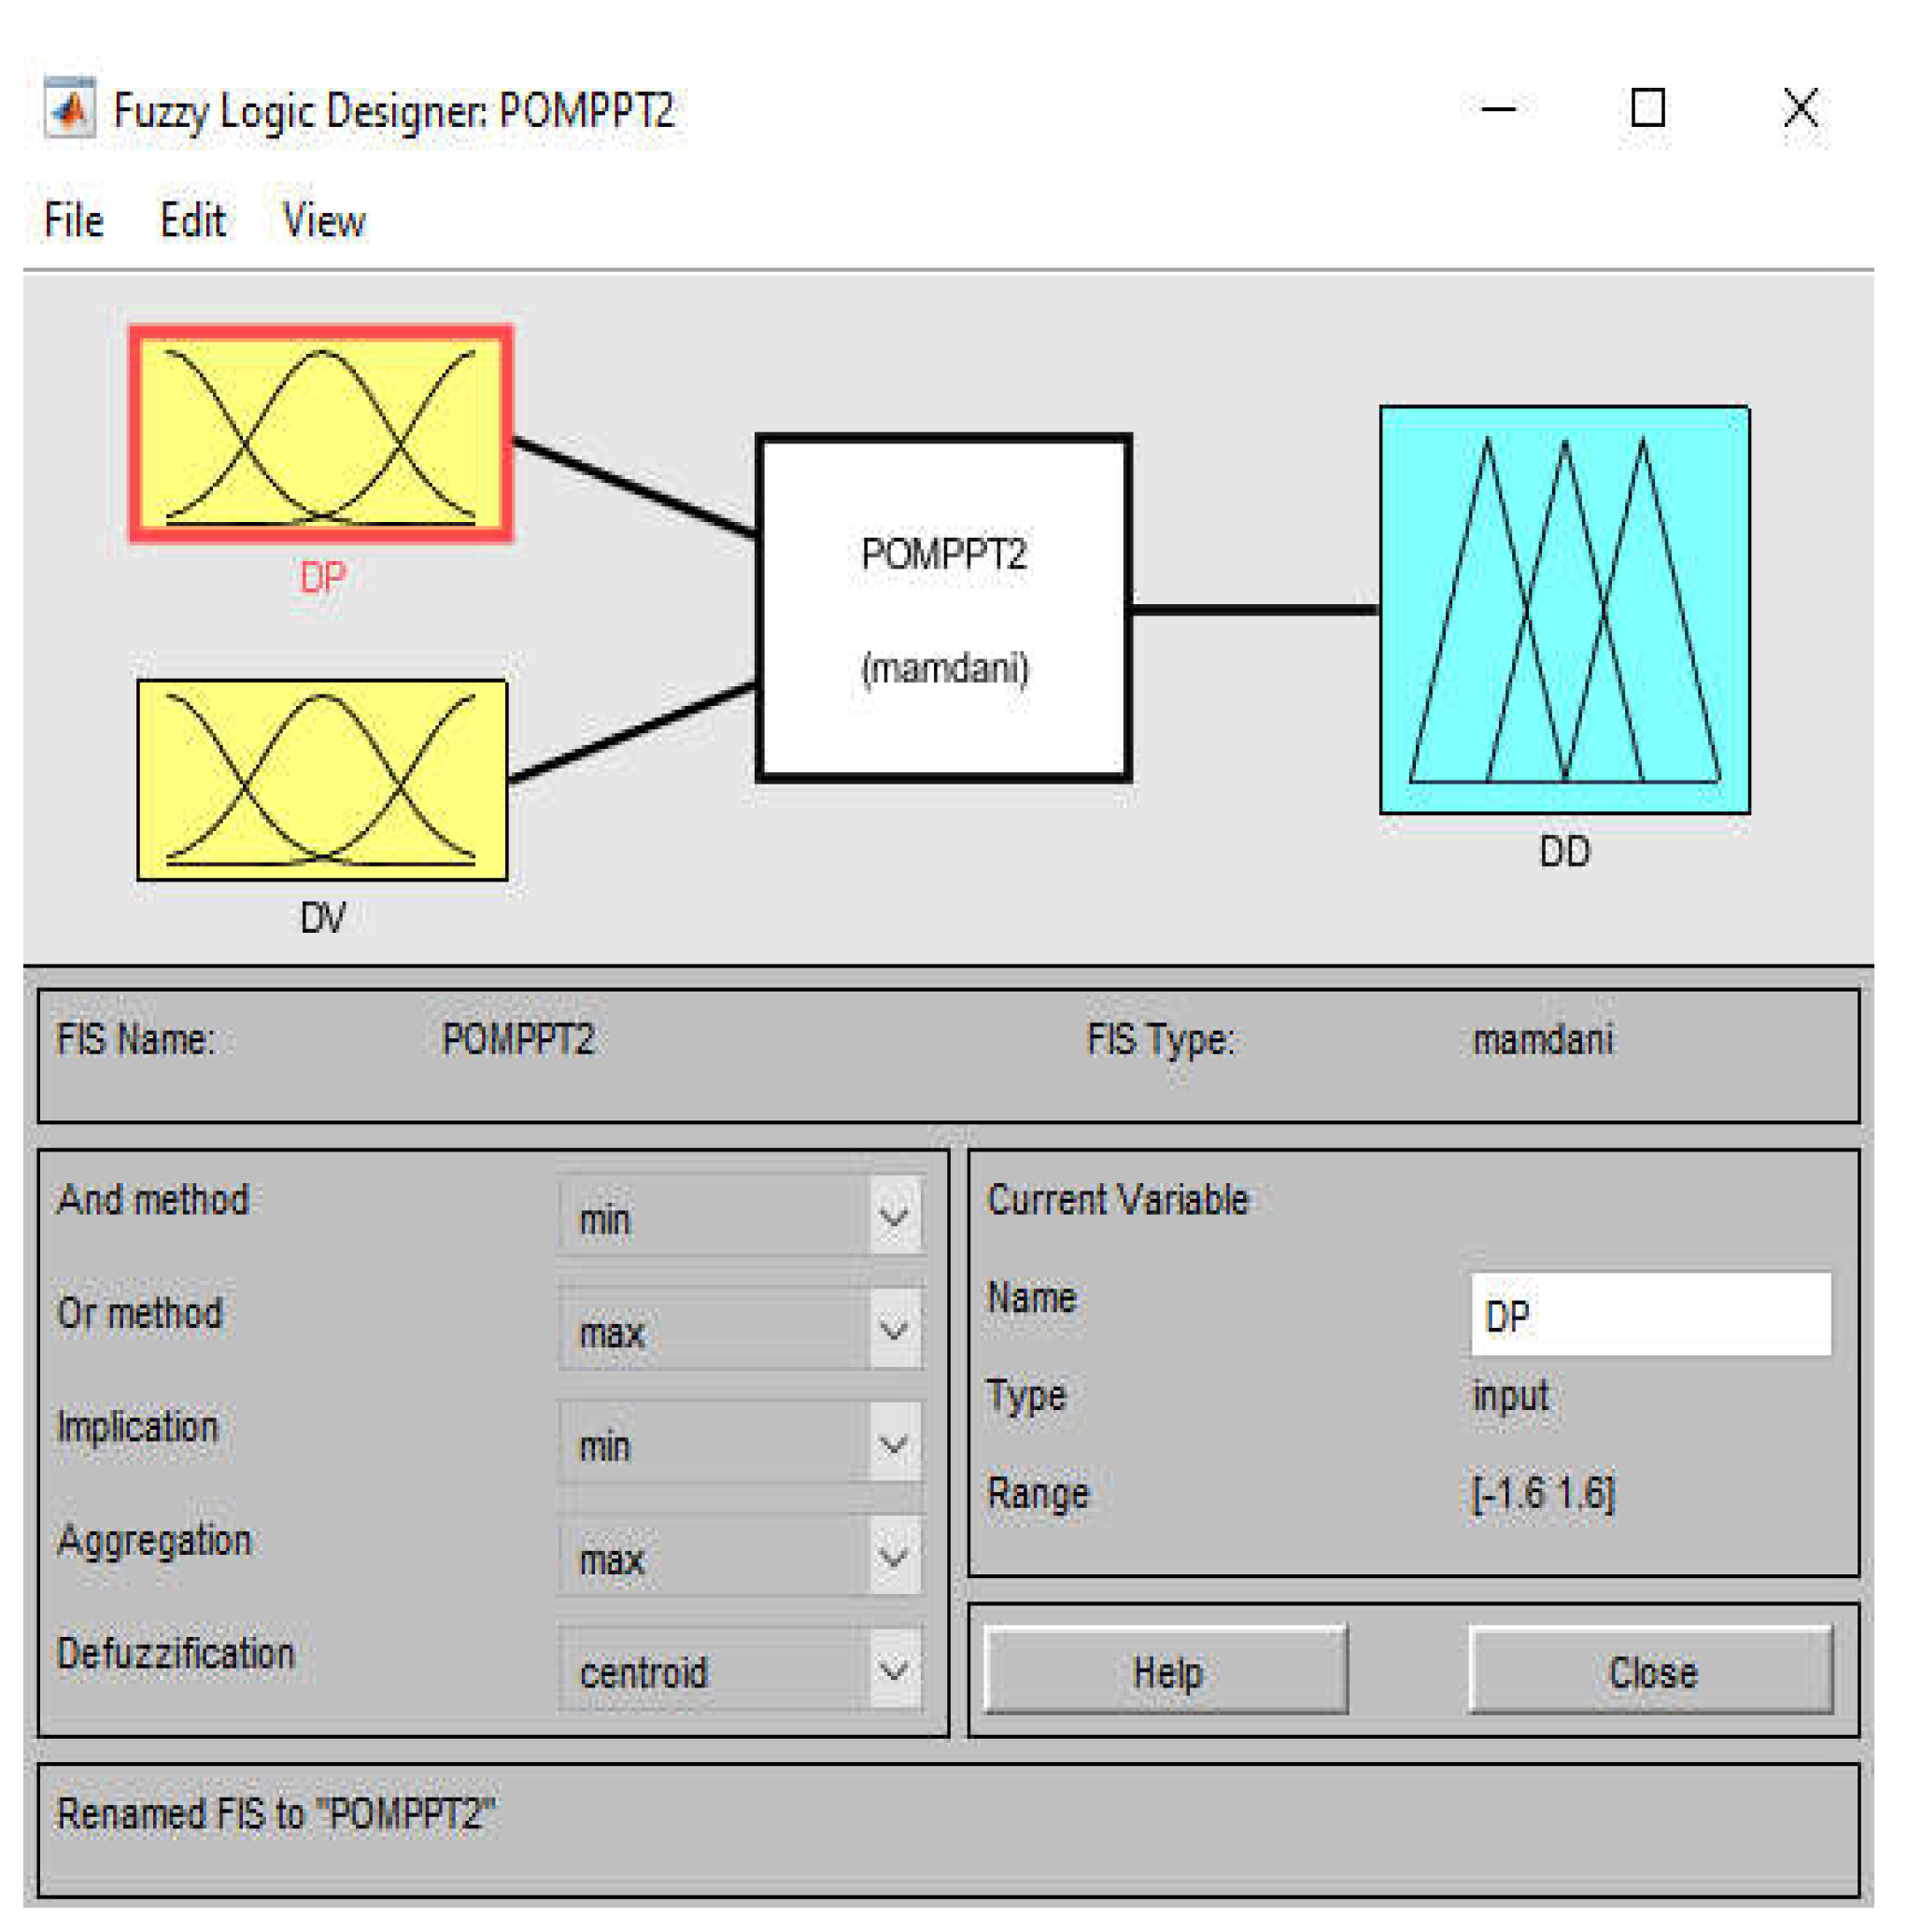
In the rule base, it is the part that includes the operations that enable the fuzzy system to behave generate a single output by collecting all the connections between the input and output fuzzy sets one place. In this section, a rule base is applied to the membership function obtained according to an inference method for the inferences of each rule. Each method basically fulfills the same task, but some methods are preferred over others due to factors such as efficiency and complexity, be subject the parameters of the problem being studied. The most widely used inference methods in fuzzy systems are Mamdani Inference and Sugeno Inference methods. A rule base has been applied to the membership function obtained, according to Mamdani. The rule table has been formed and is shown in
Table 2.
4.3. Fuzzy Rule Table
To define the response of the system, a rule set and rule table are produced from the system behavior information obtained for the corresponding FLC input and output values. In general, the knowledge obtained by expert system designers is applied in if-then forms [
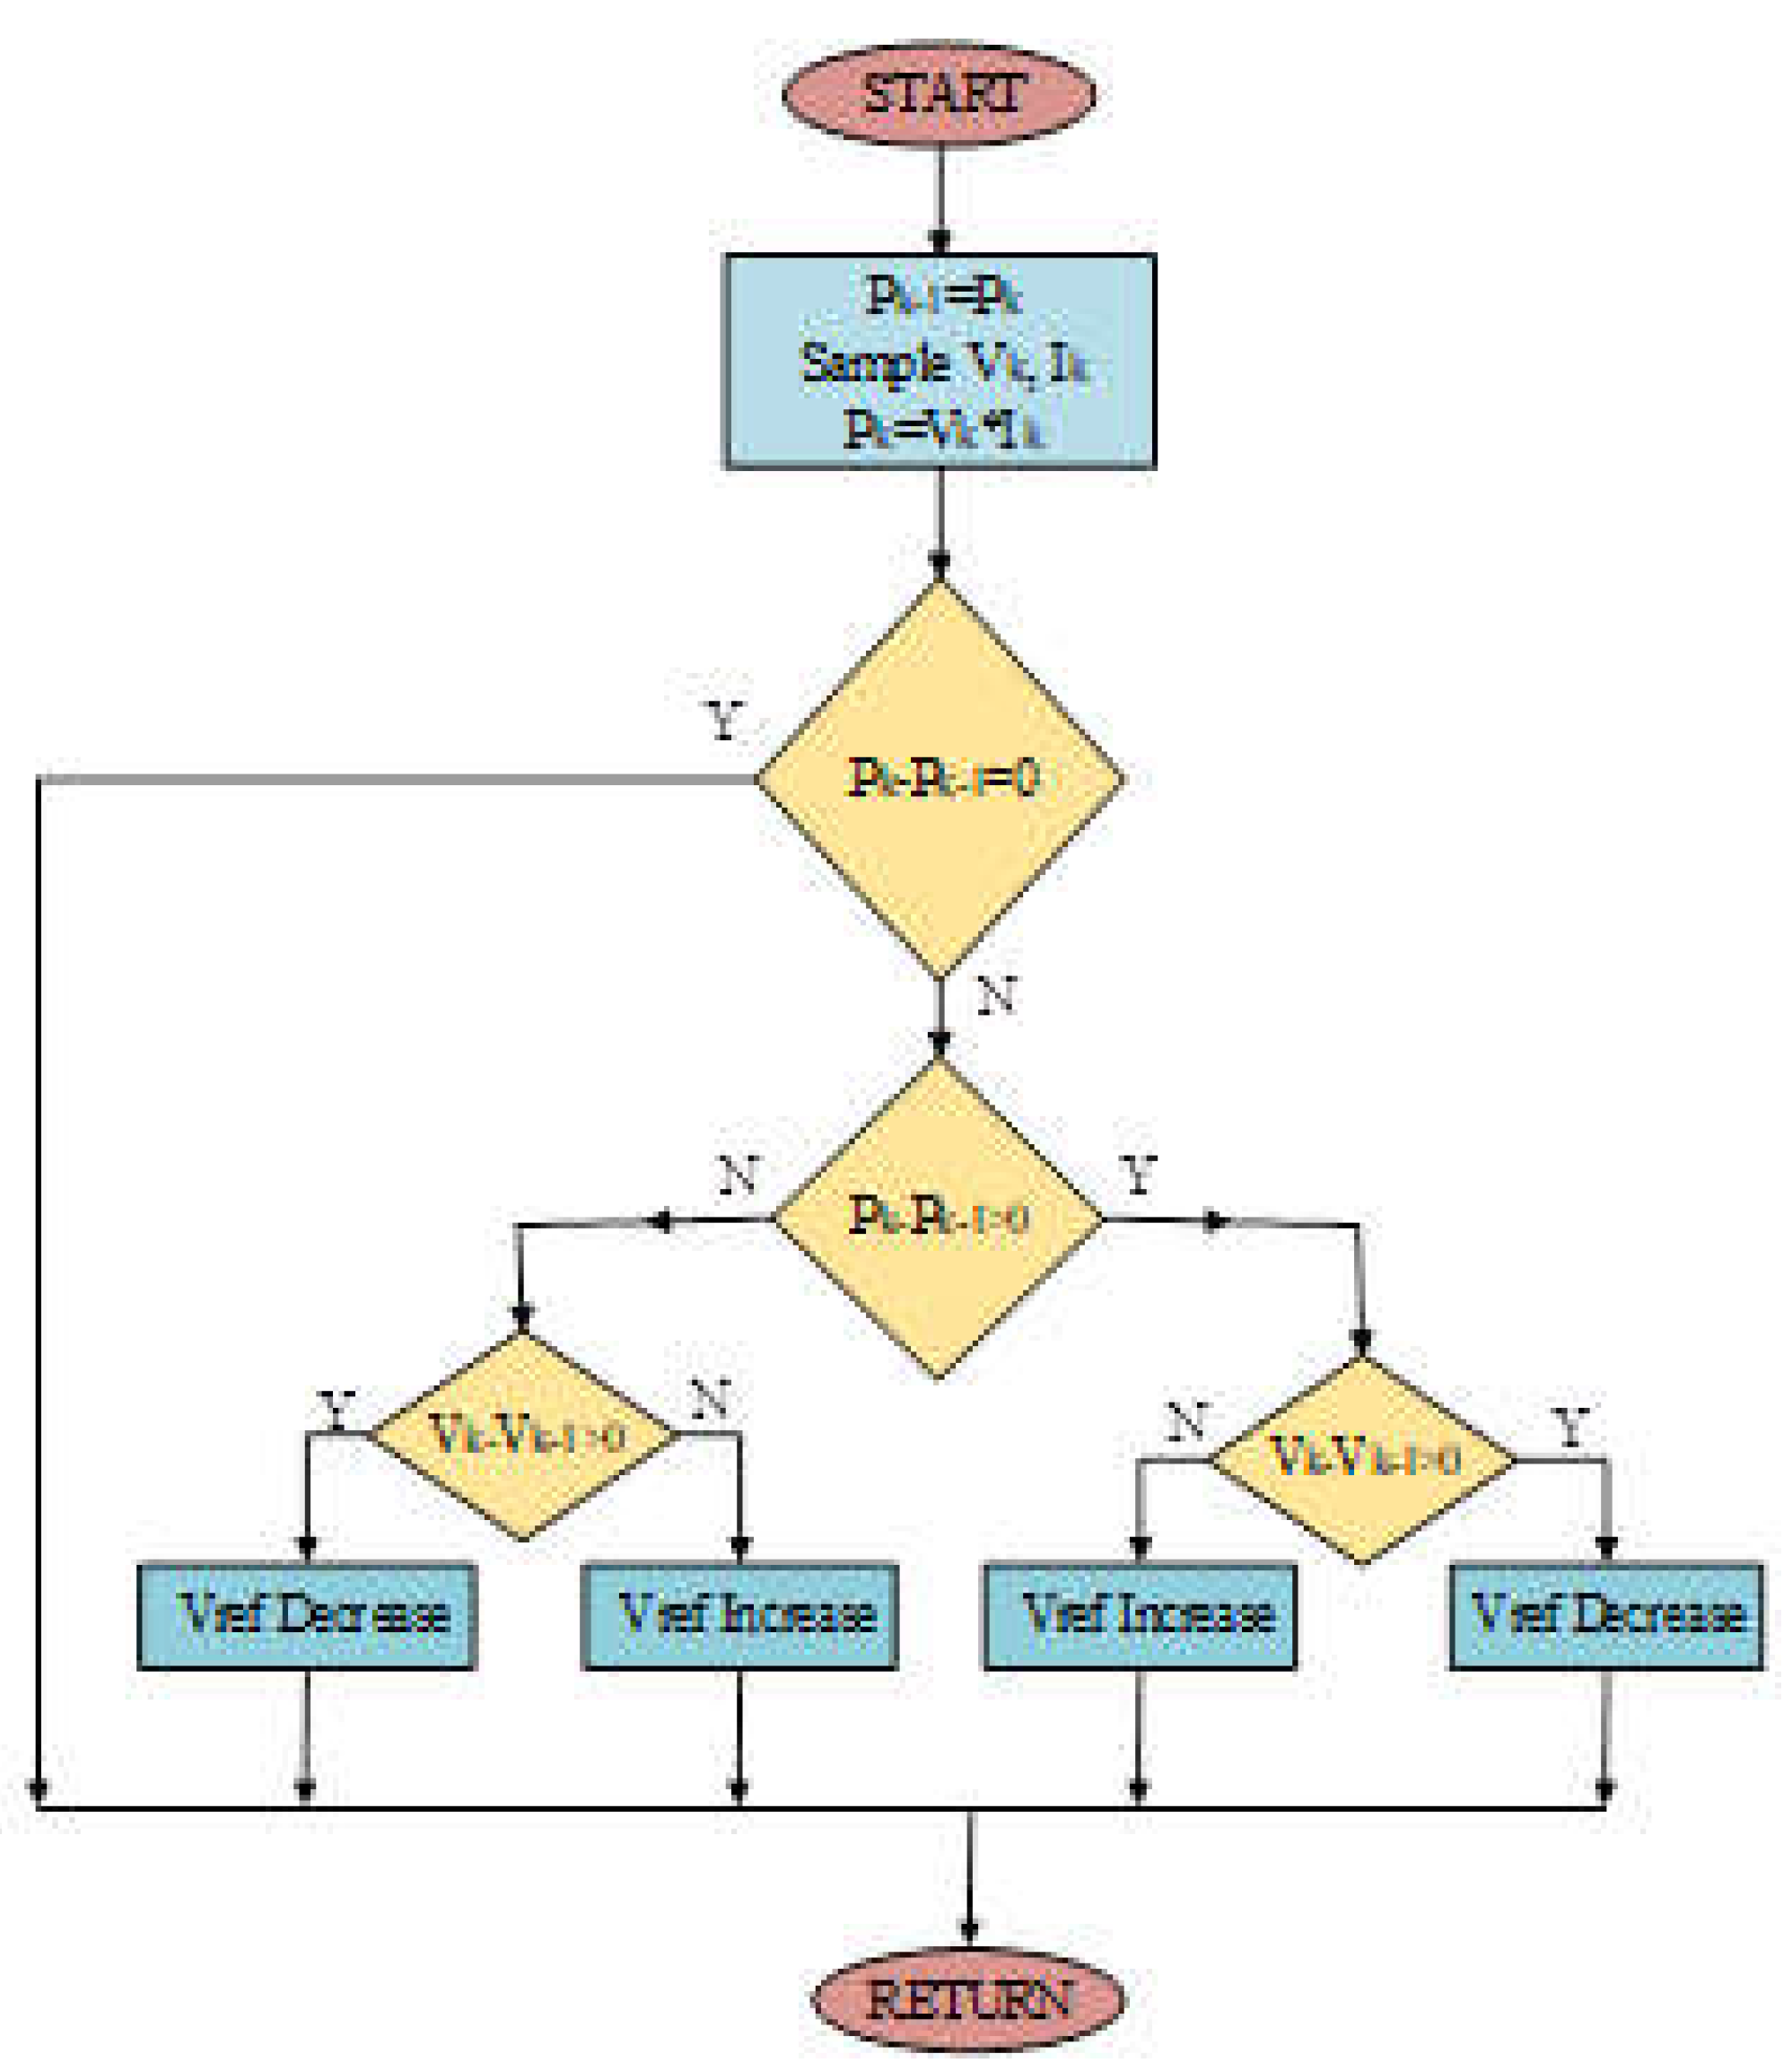
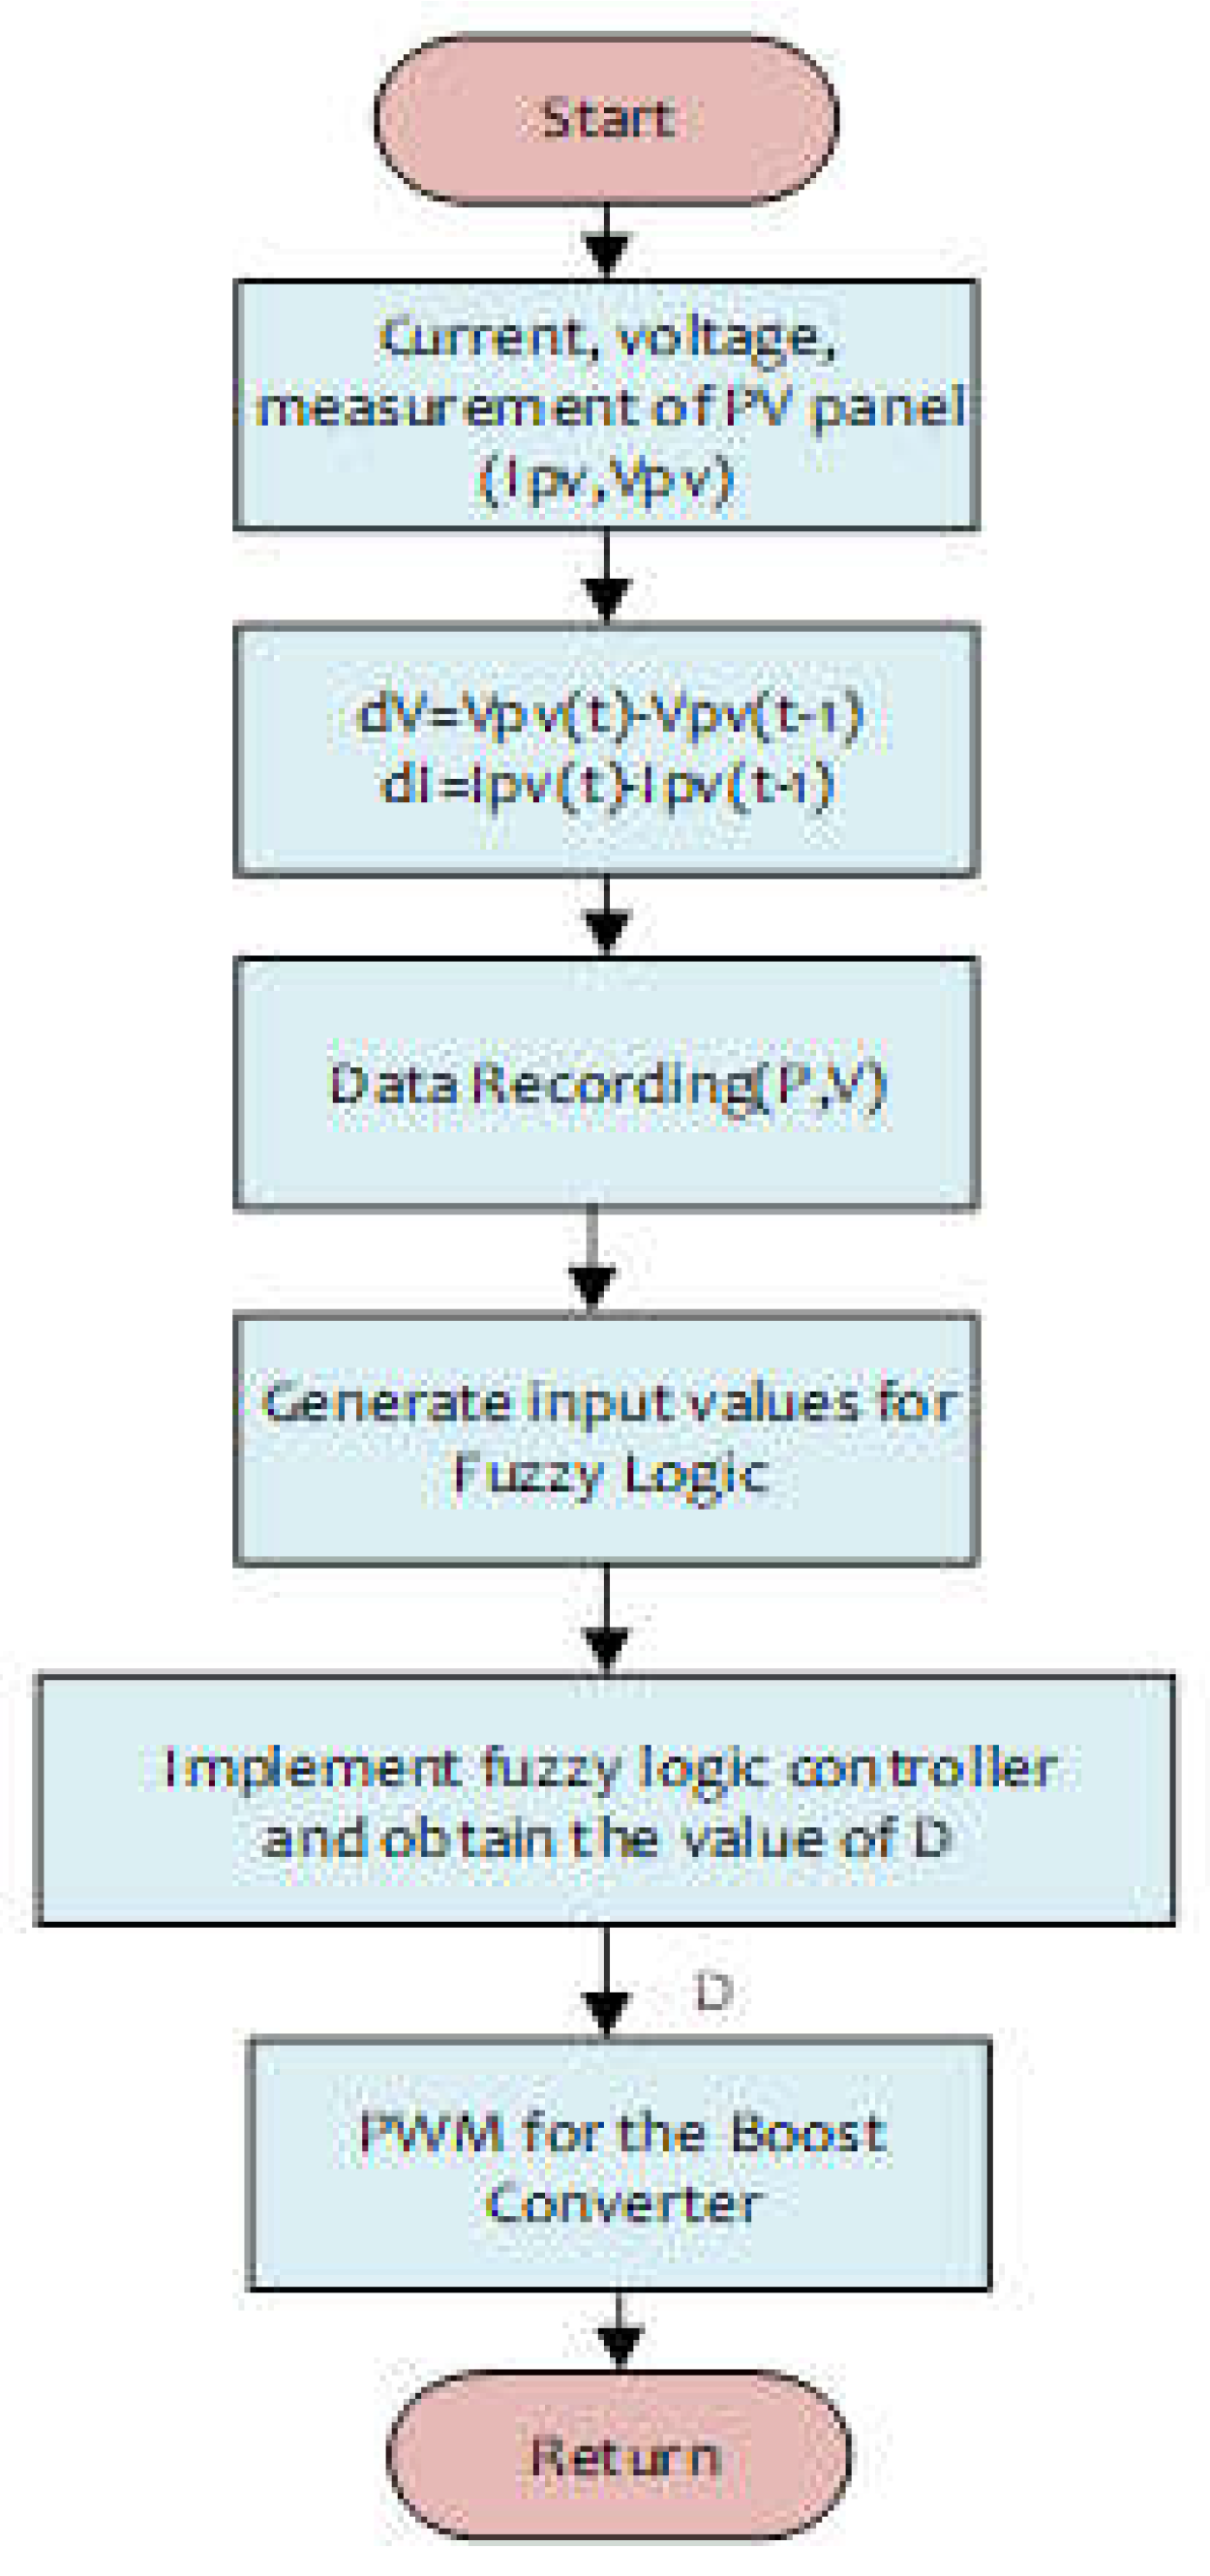
27]. The algorithm steps are delineated in the flowchart depicted in
Figure 6.
In a PV system, the input parameters of the FLC are formed depending on Equations 6 and 7.
Then, the error occurring in the system and the change in error value are calculated and used as real input values for fuzzy Logic, as shown in equations 8 and 9.
Here;
Vk : Panel voltage present measured voltage
Vk-1 : Previous value of the present measured panel voltage
Pk : Present calculated panel power
Pk-1 : Previous value of the present calculated panel power
e(k) : Error value
Δe(k) : Change in error value
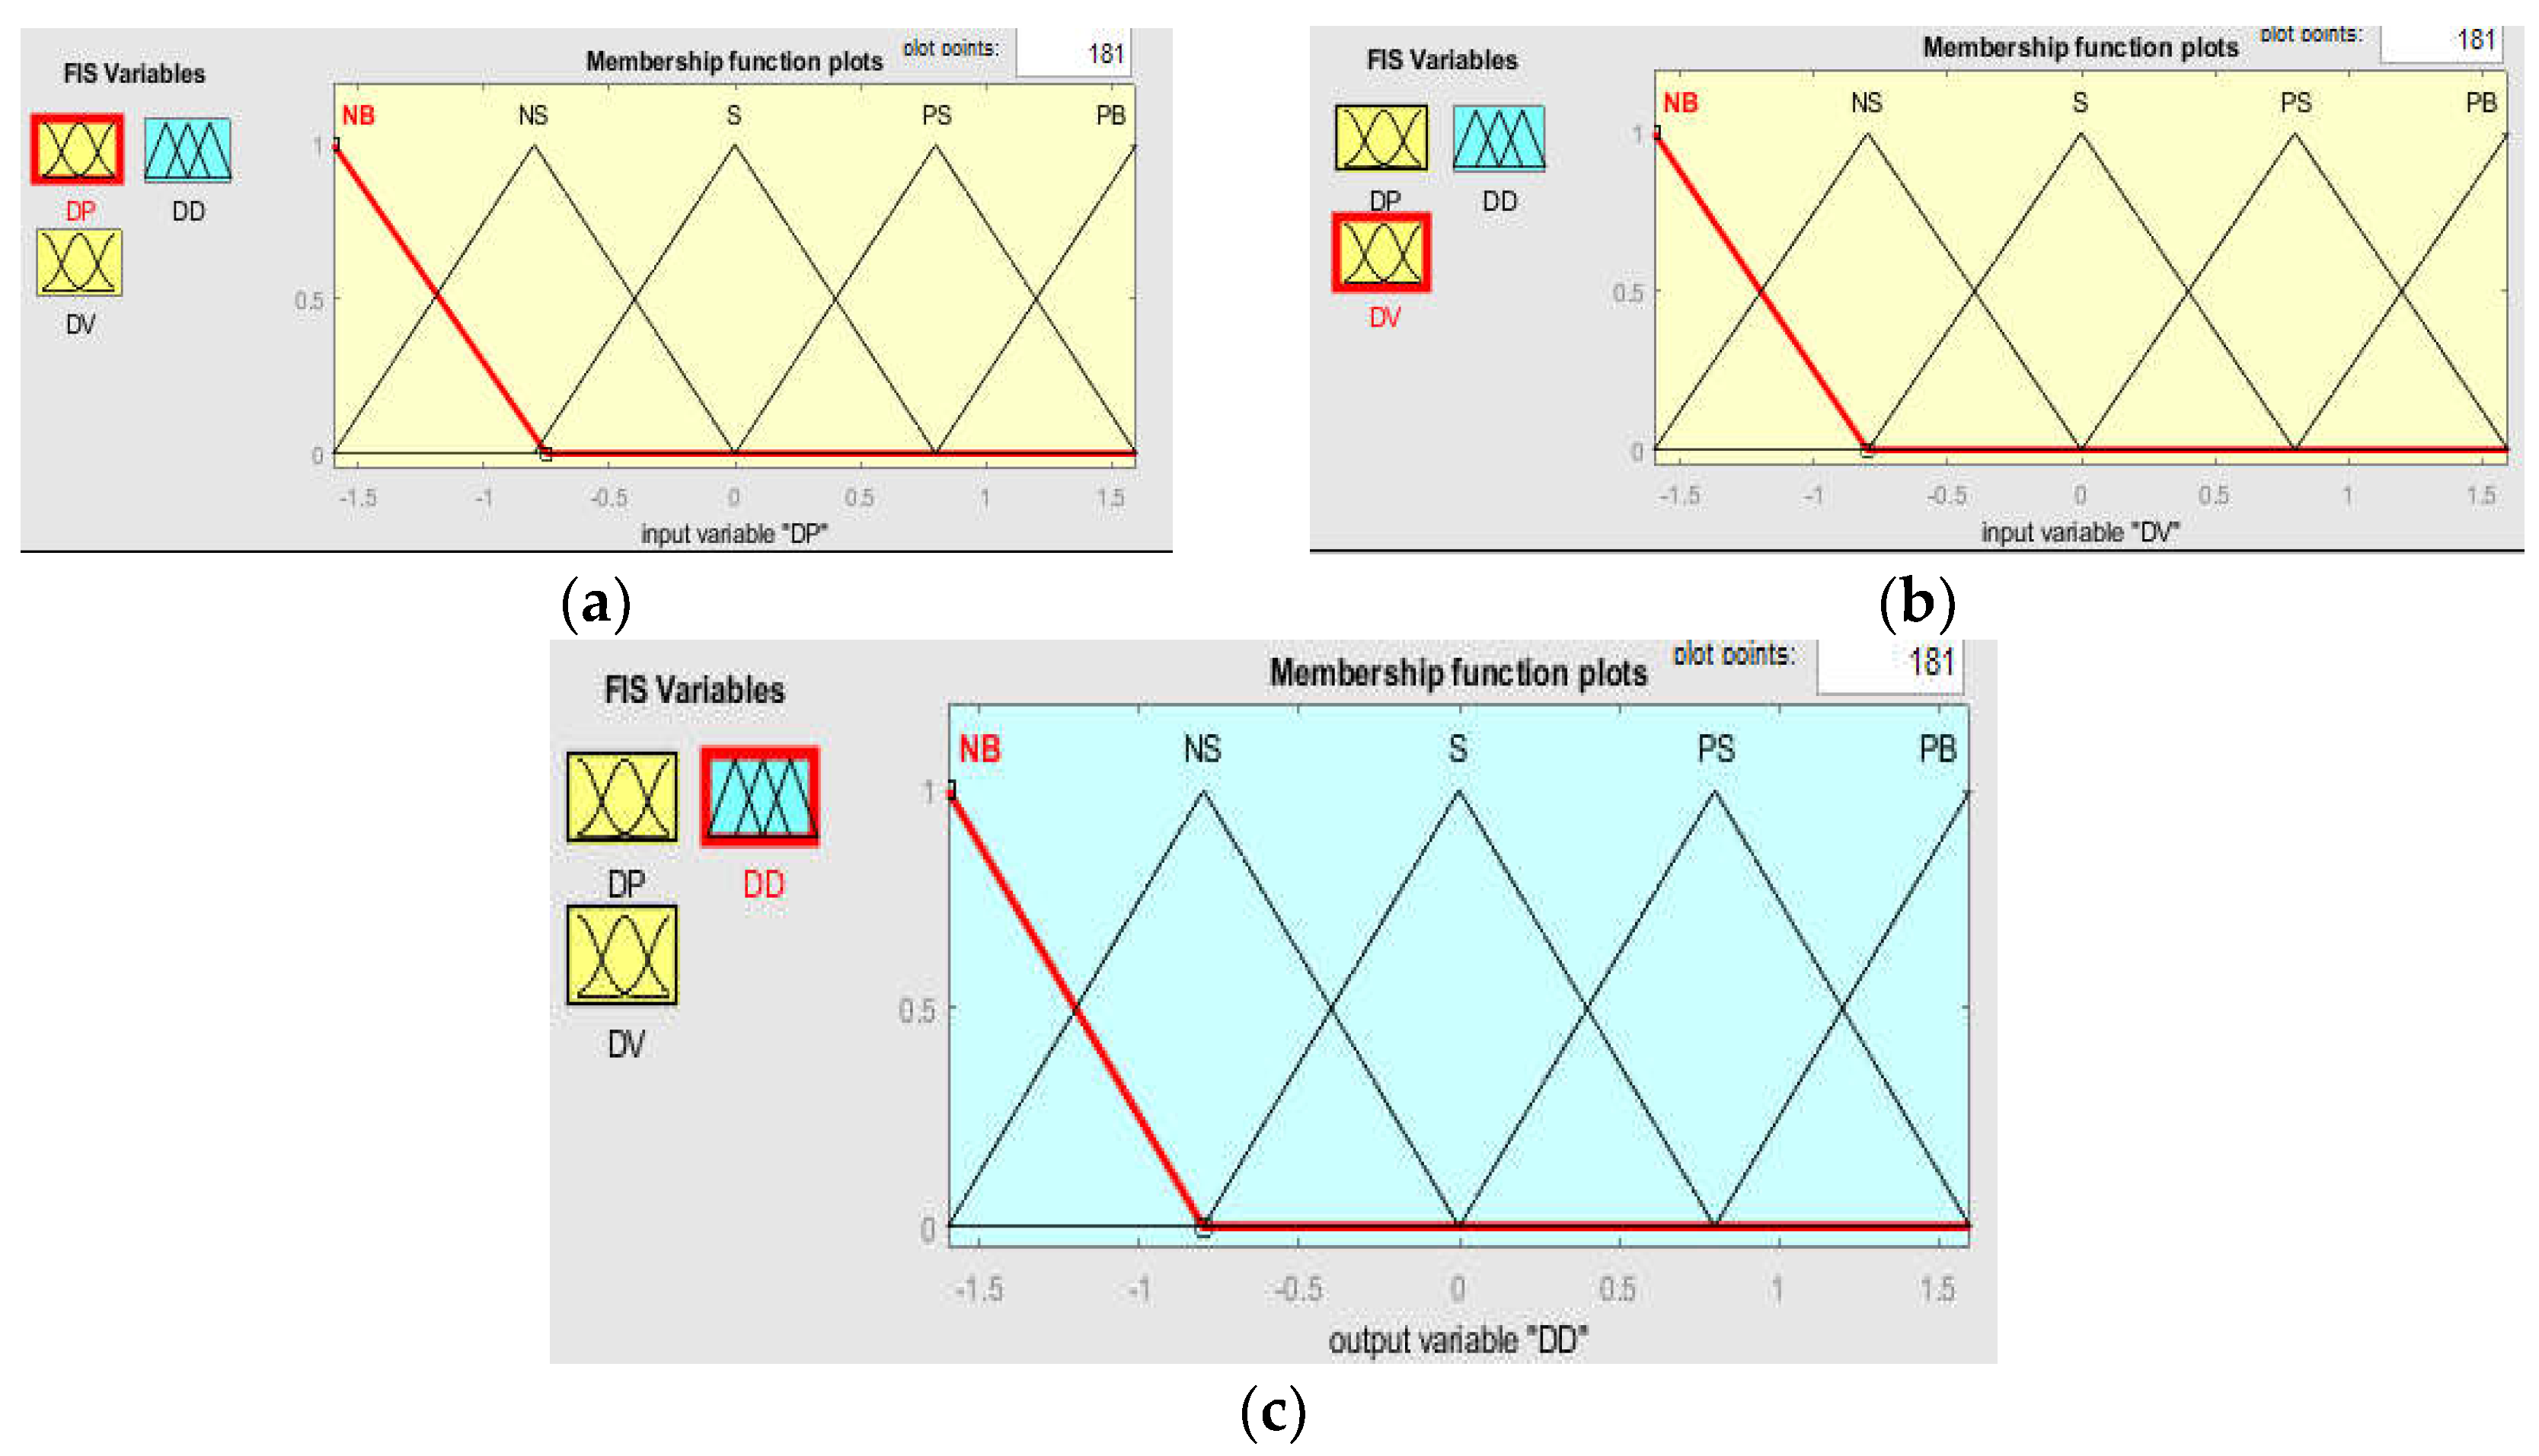
Where Vk is the present measured PV panel output voltage, and Vk-1 is the measured penultimate sampling output voltage. The power variables Pk and Pk-1 are obtained by the formula P=V*I from the present and penultimate sampling of the measured voltages and current signals, respectively. Here, the resulting input signals (ΔV and ΔP ) and the output variable ΔD (duty cycle change of the converter) are categorized into five categories:
4.4. Defuzzification Process
The output variable of the fuzzy controller is a numerical variable. Therefore, a defuzzification method is needed. This is the part where the non-numeric linguistic values obtained from the membership functions determined here are converted back into numerical values as the output of the FLC. For defuzzification, the central weighting method is applied to convert the duty cycle variation (∆D) to an appropriate value [
33]. The fuzzified output value of the FLC has to be added to a duty cycle reference value, which is equal to 0.5 for the present operation. The result is the optimal D value that should be sent to the boost converter as a control signal [
34].
Based on the values obtained from this conversion, a lookup table containing the required control rules is utilized to calculate the output of the controller in
Figure 7 in the form of alternative verbal variables, which are then combined into a numerical value by means of the corresponding membership functions (the defuzzification phase), thus producing the duty cycle of the control signal that drives the power converter so that the MPP is monitored.
5. Simulation Results
In the simulation studies, two MPPT controllers will be compared. The parameters of the boost converter circuit used for both controllers are presented in Table 4. The PV system consists of four SHARP NDQ295 panels, two in series and two in parallel. The parameters of the PV panels are presented in
Table 1. As illustrated in
Figure 11a temperature values of the PV panels and in
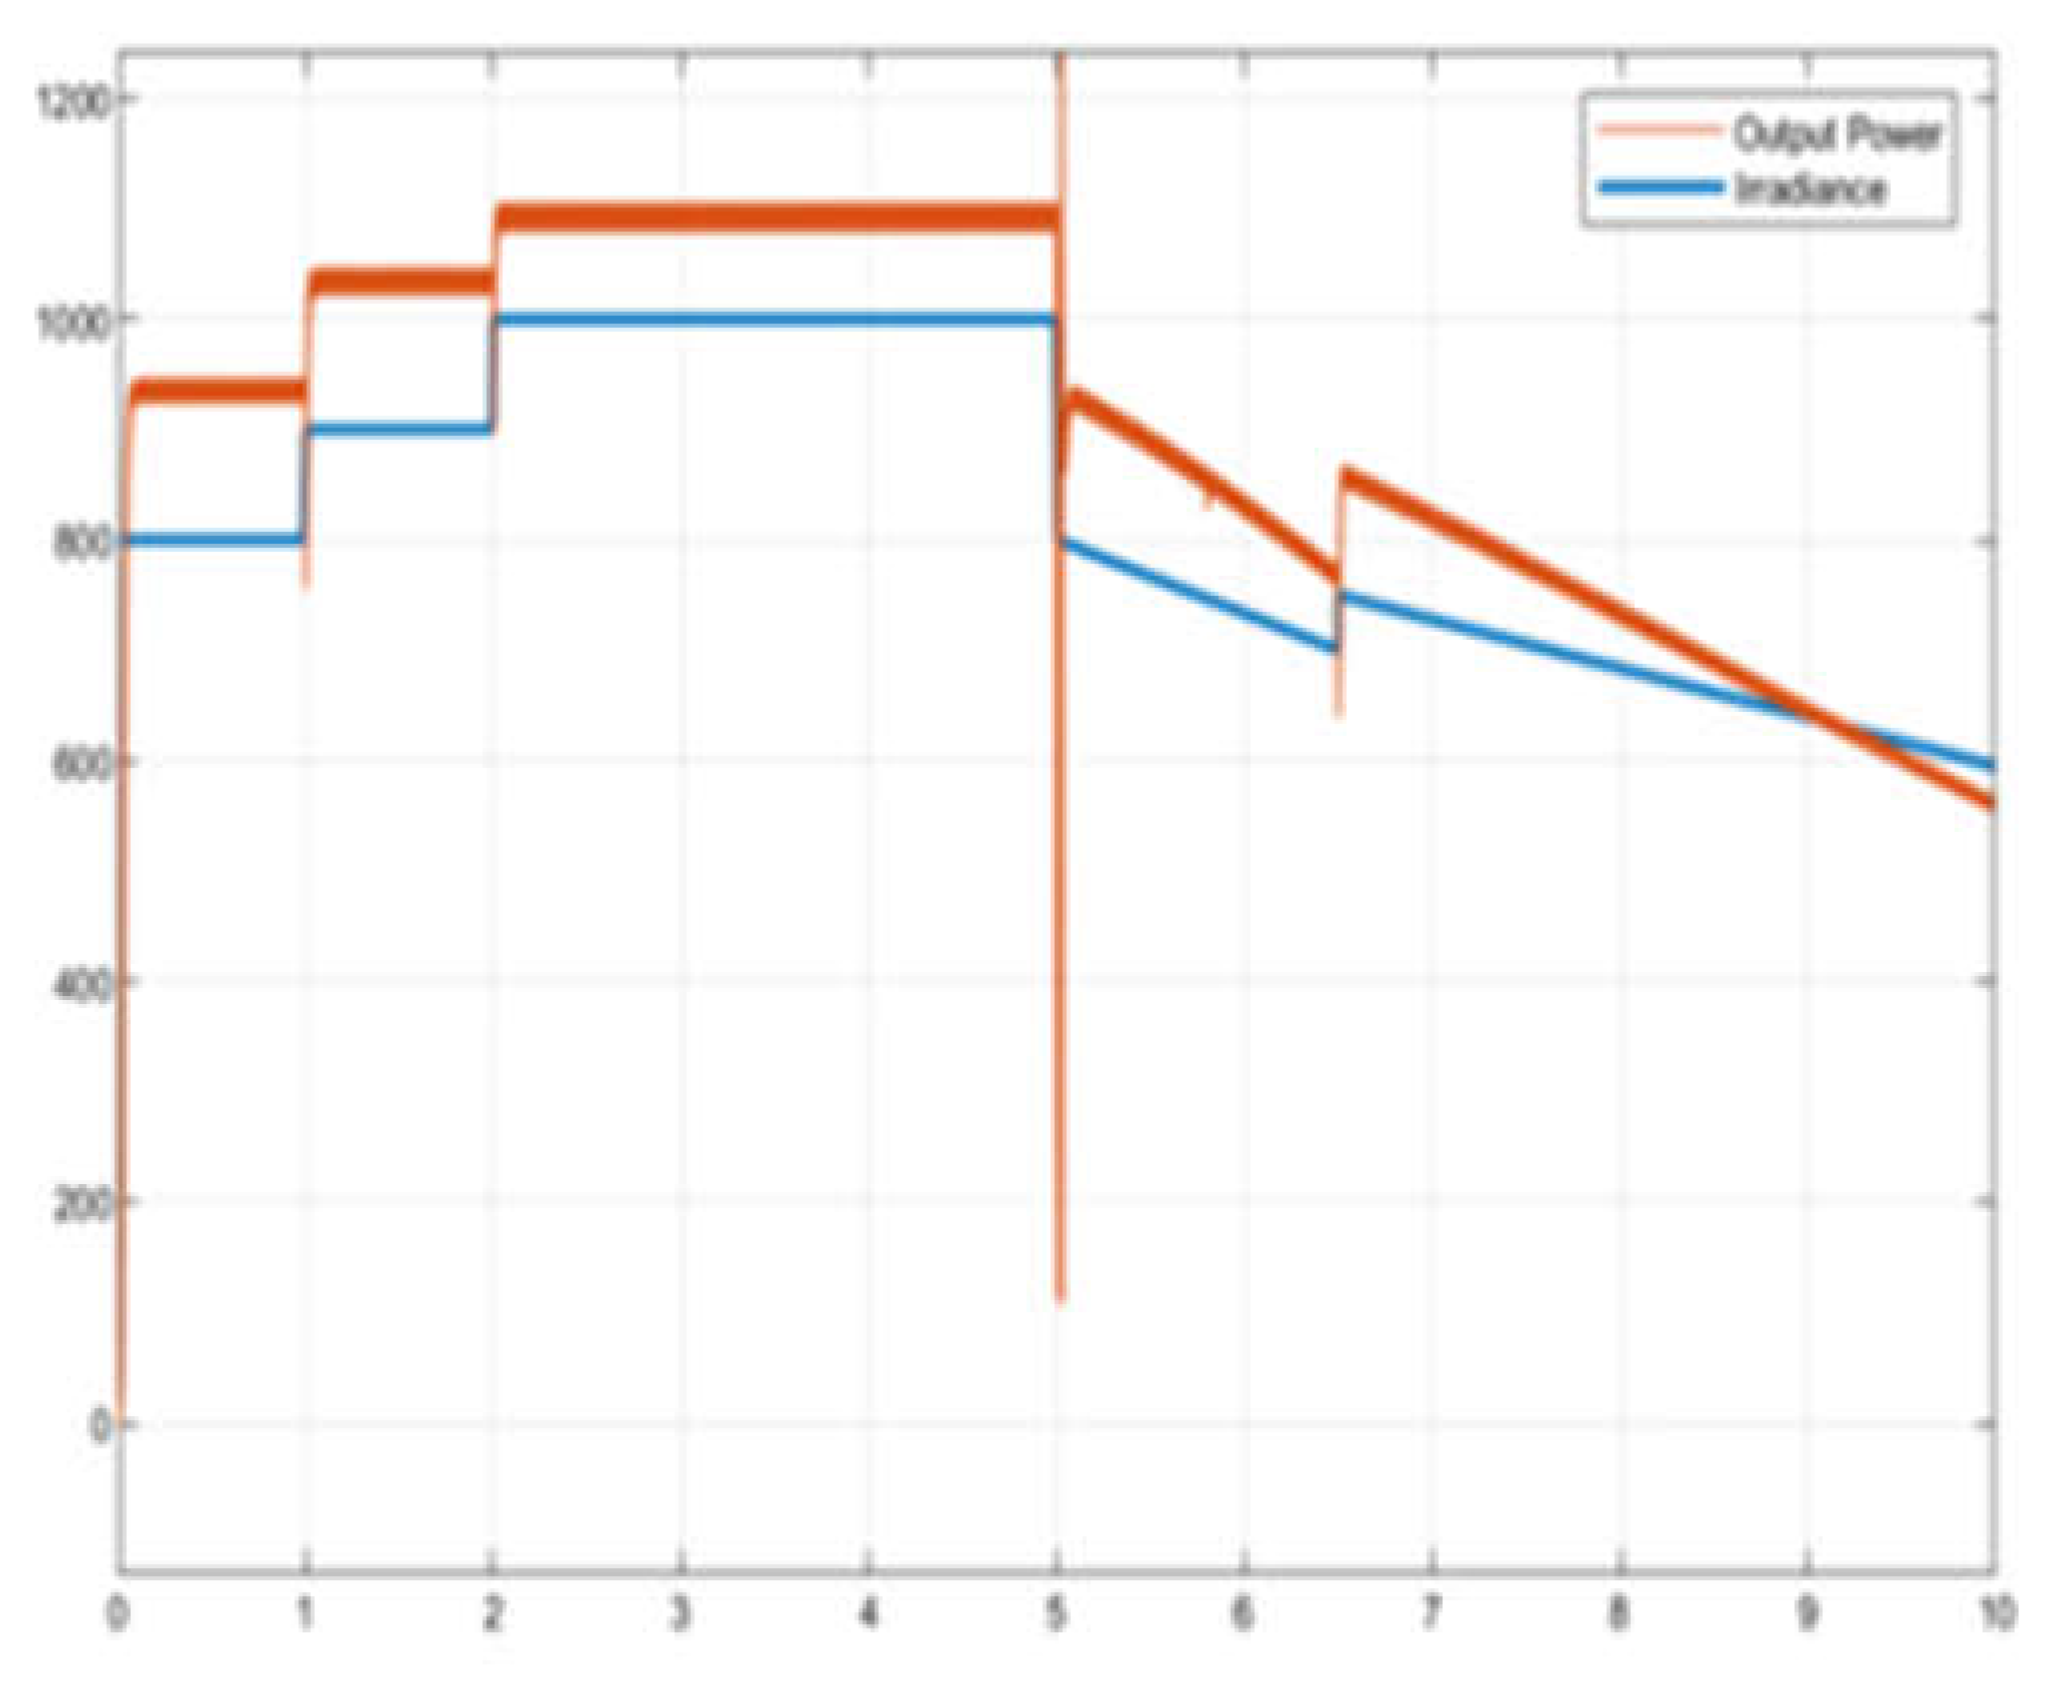
Figure 11b the radiation values of the PV panels. The radiation values are 800 w/m
2 in the 0-1 s interval, 900 w/m
2 in the 1-2 s interval, 1000 w/m
2 in the 2-5 s interval, 5-6.5 s max value of 800 w/m
2 and min value of 700 w/m
2 and then sloping irradiation with a max value of 750 w/m
2 and min value of 595 w/m
2 was applied in the range of 6.5-10 s, according to the weather conditions that change suddenly. In this study, the temperature was applied as constant. As illustrated in
Figure 12, the voltage generated by the PV system (800-900-1000 w/m
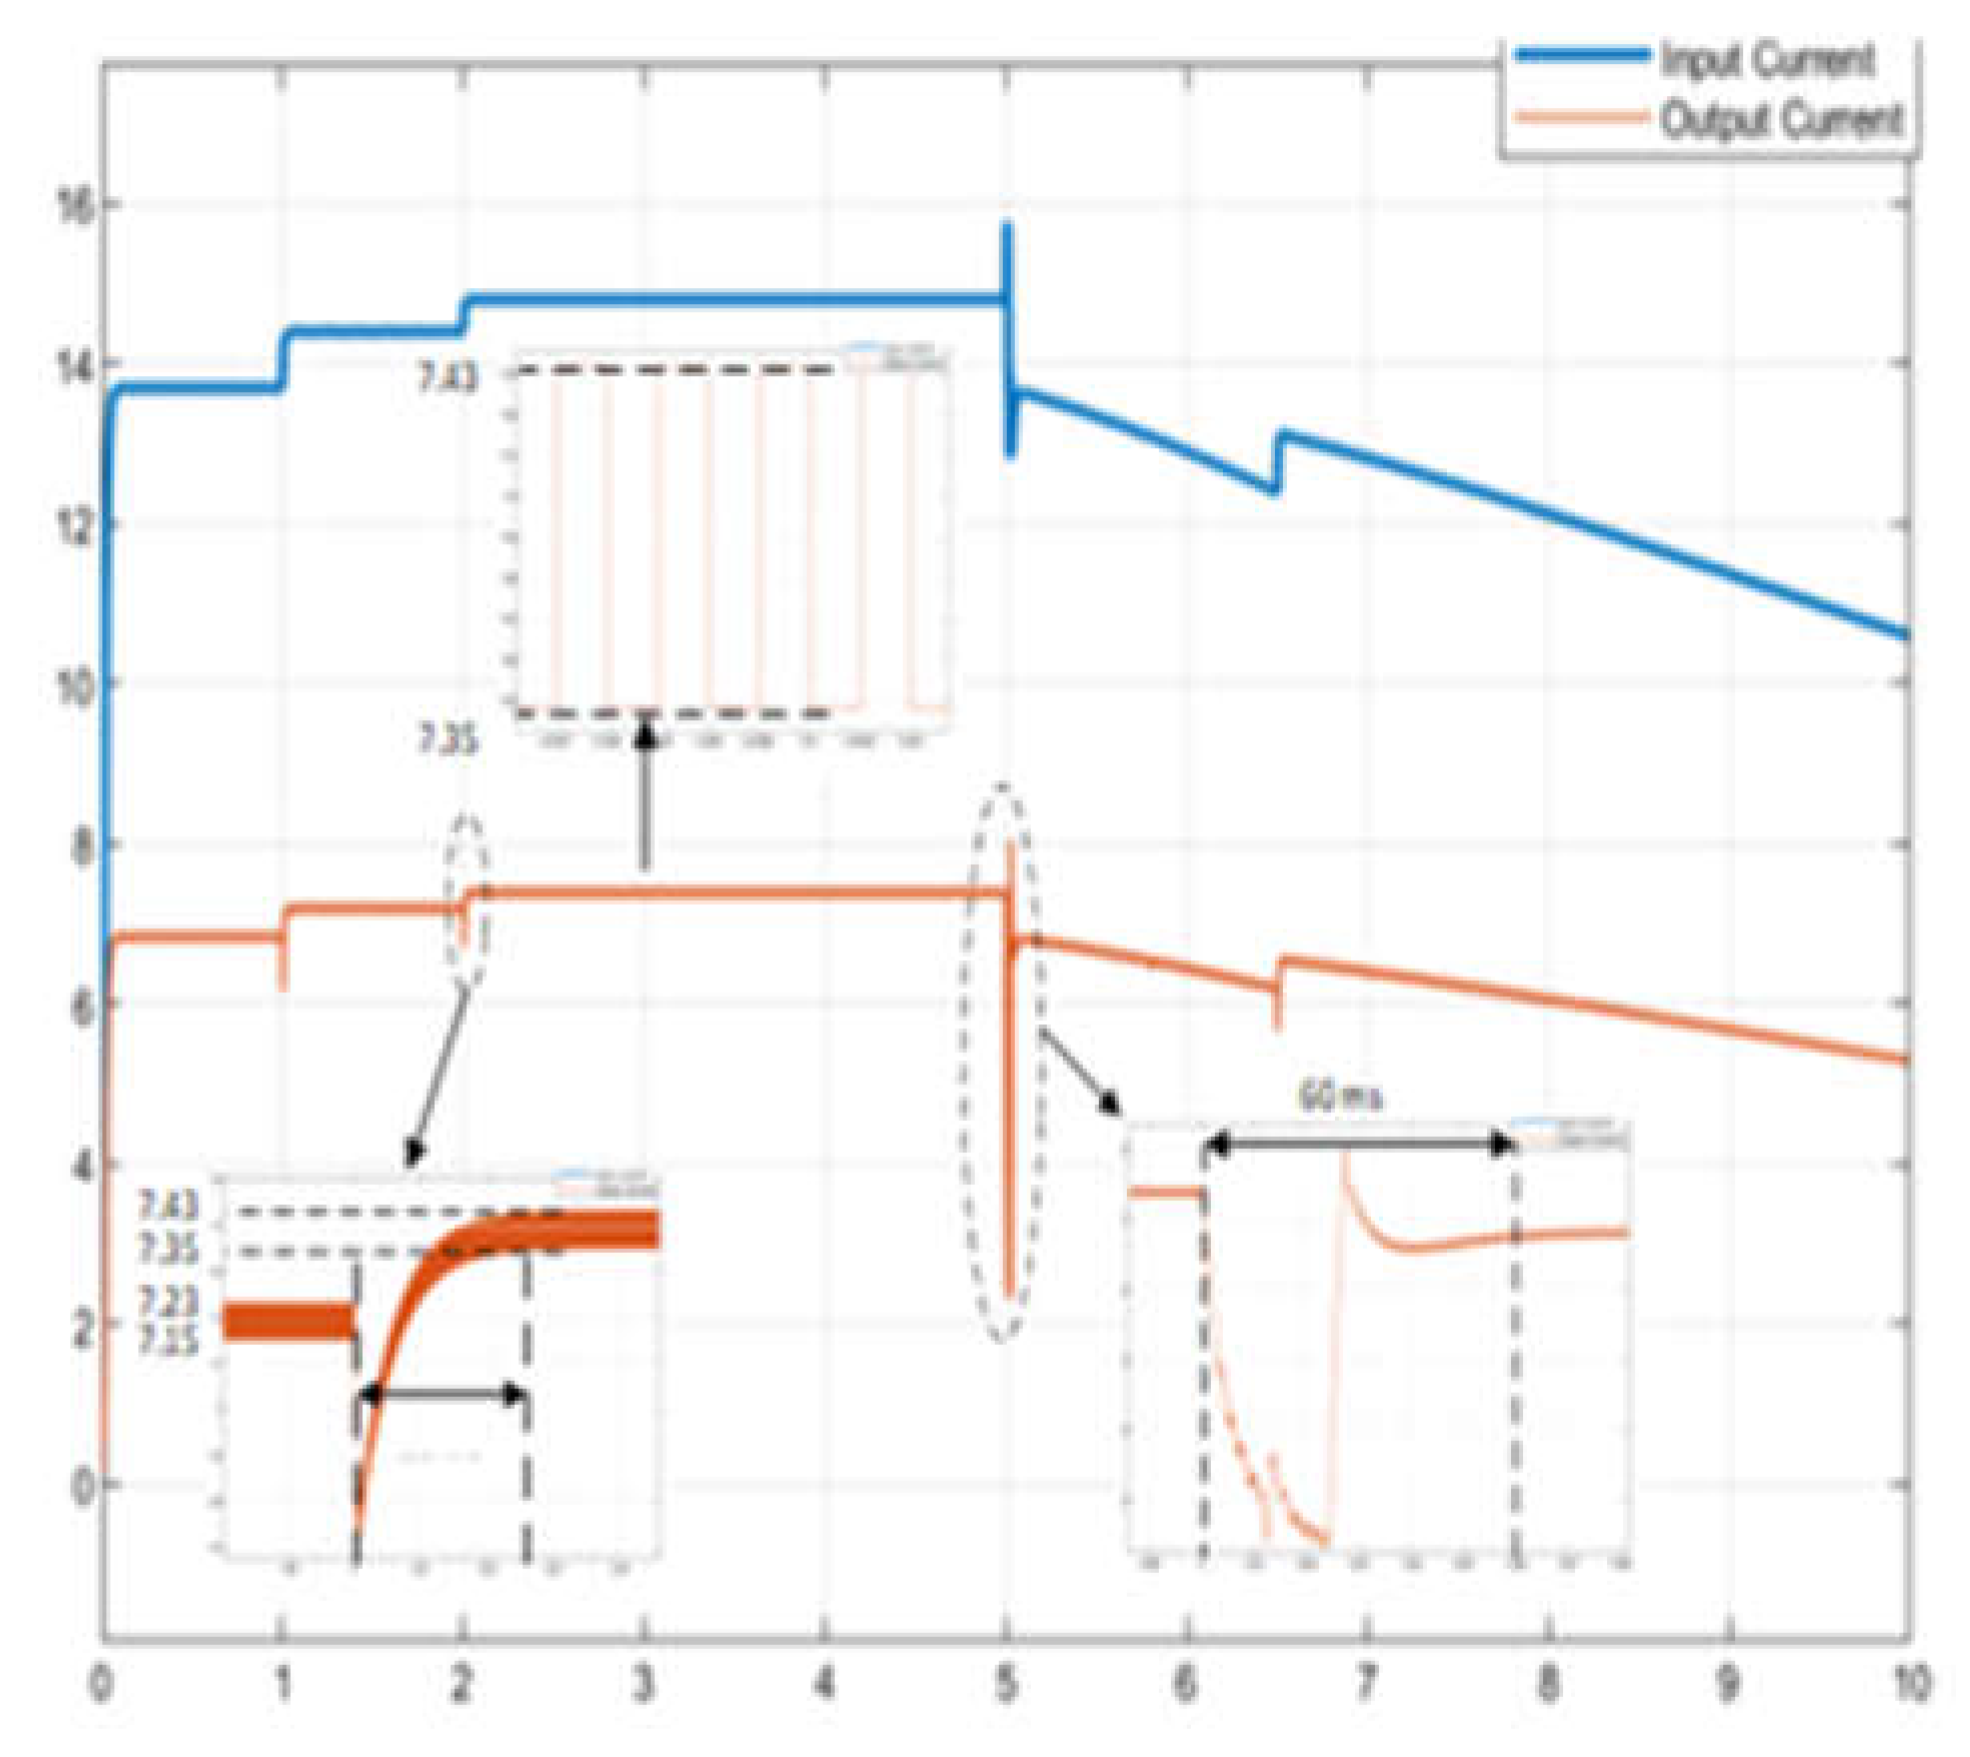
2) is measured as 69.5 V, 72.96 V and 74.96 V, respectively. The current generated by the PV system is measured as 13.696 A 14.4 A and 14.8 A respectively.
Figure 11.
Temperature and irradiation graphs of the PV system.
Figure 11.
Temperature and irradiation graphs of the PV system.
Figure 12.
The voltage and current graphs of the PV system.
Figure 12.
The voltage and current graphs of the PV system.
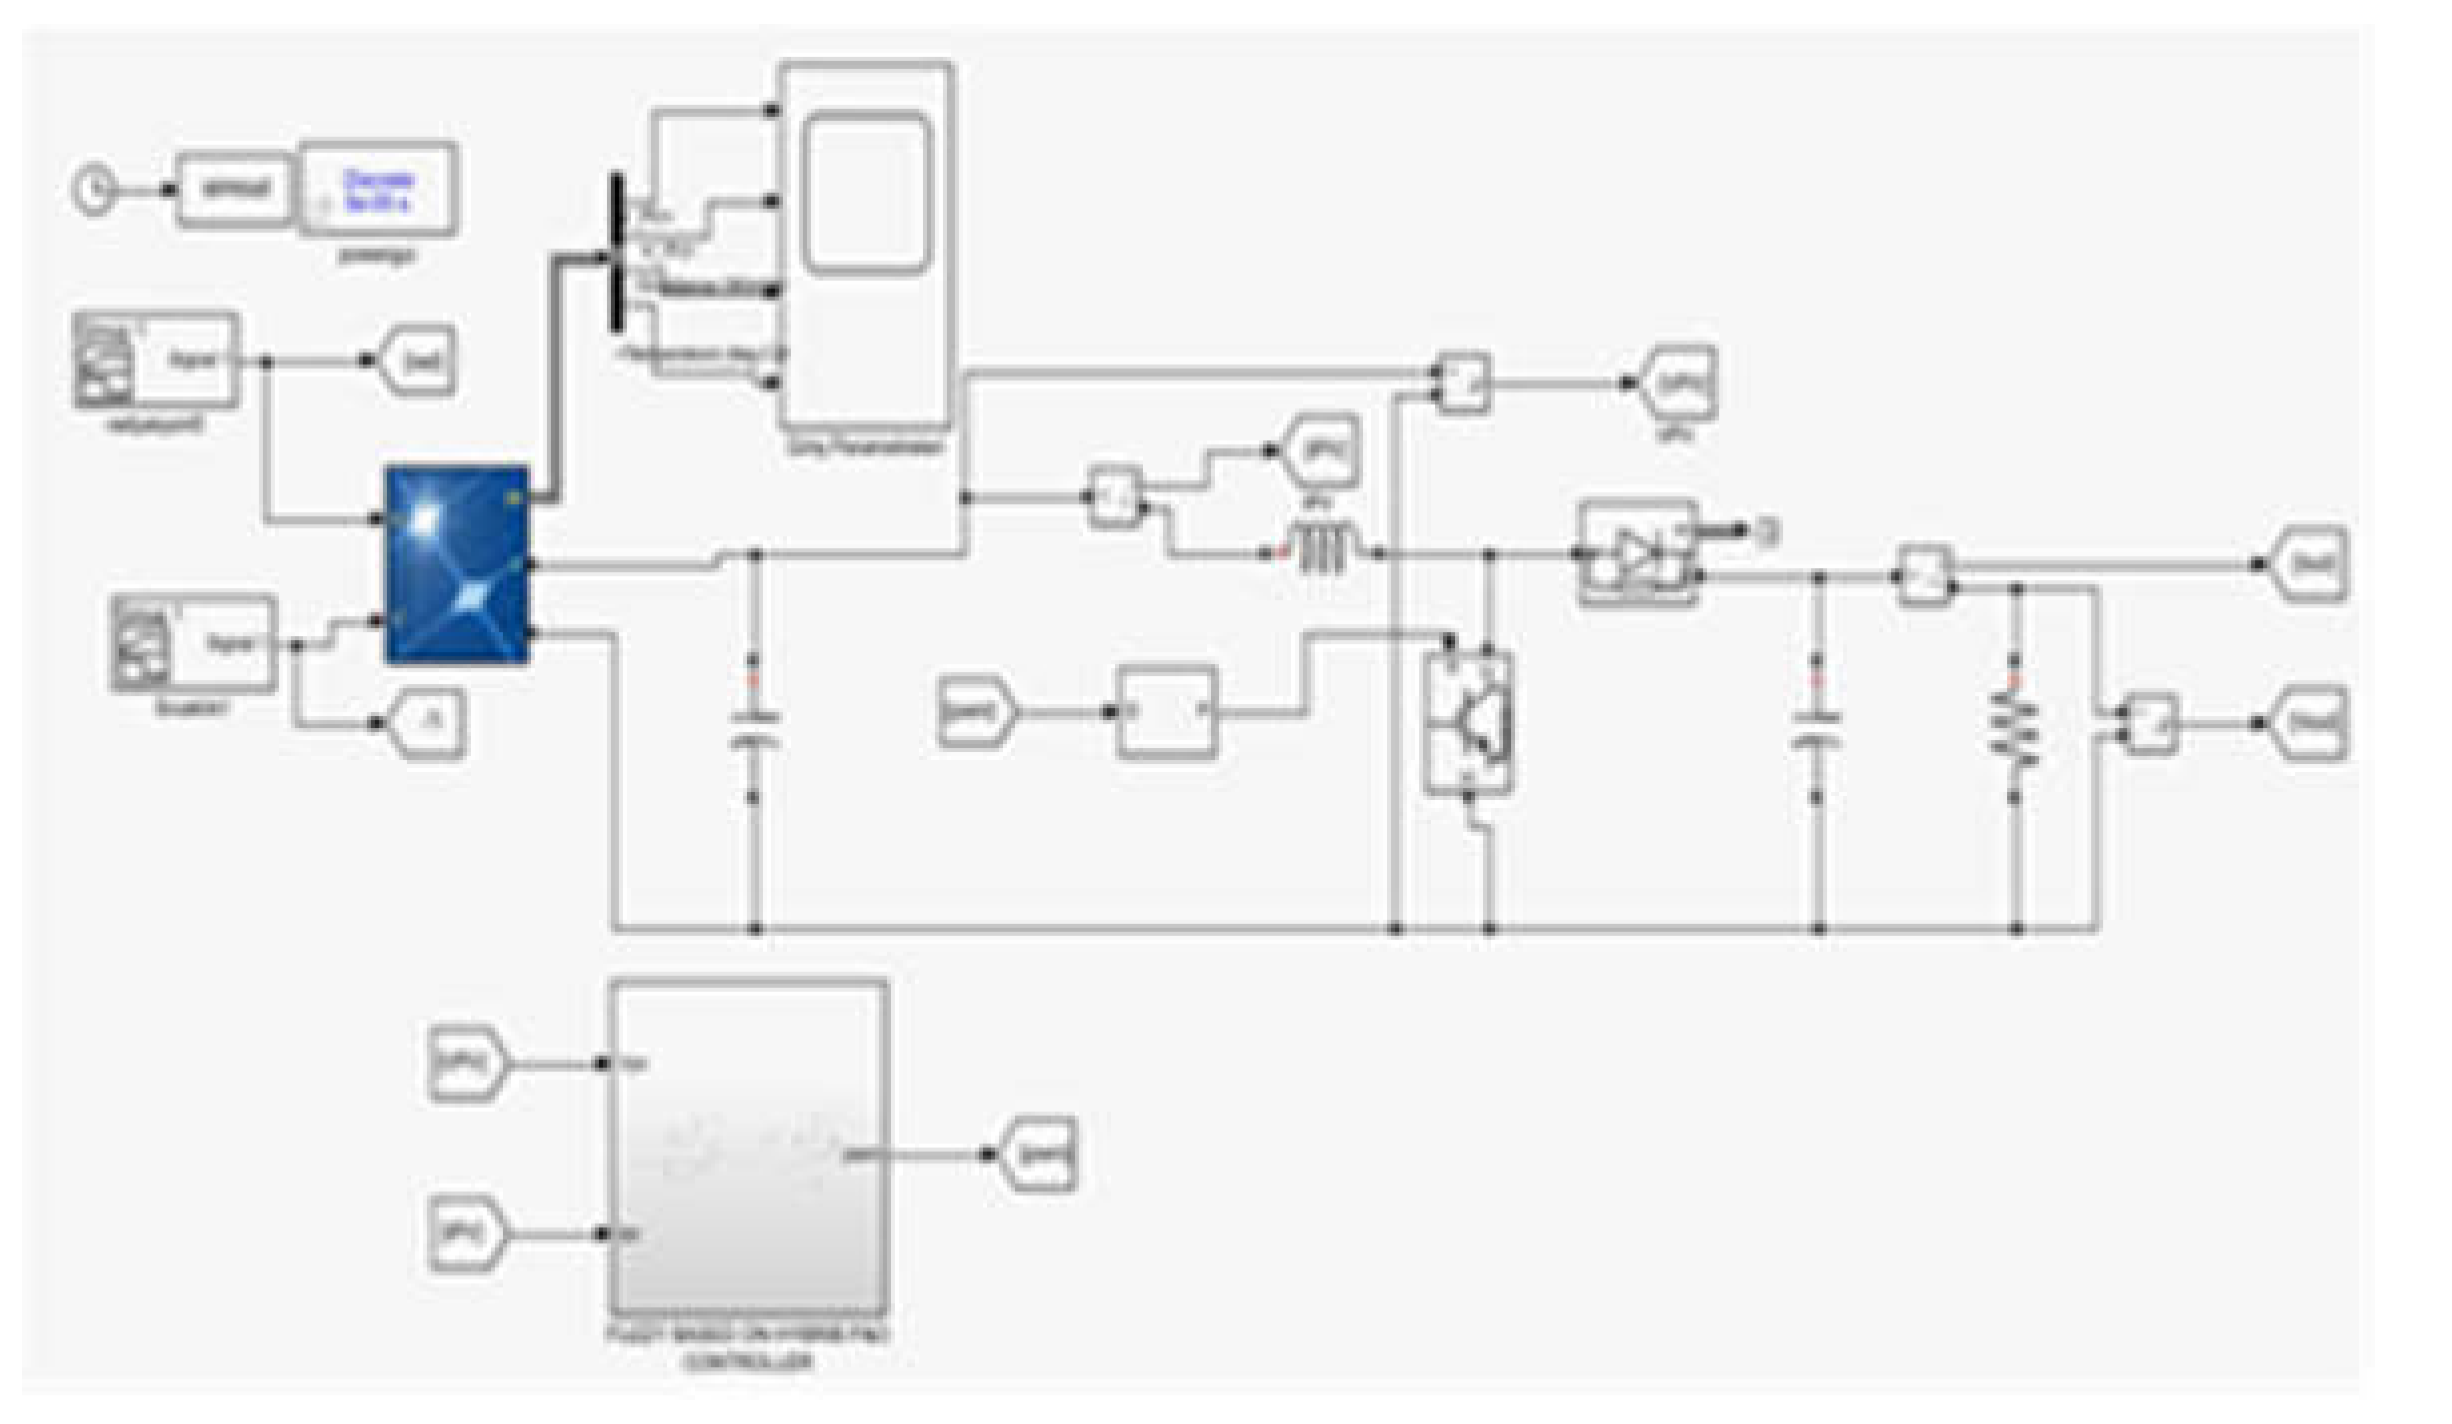
Figure 13.
Matlab/Simulink simulation study of PV system with fuzzy logic controlled MPPT.
Figure 13.
Matlab/Simulink simulation study of PV system with fuzzy logic controlled MPPT.
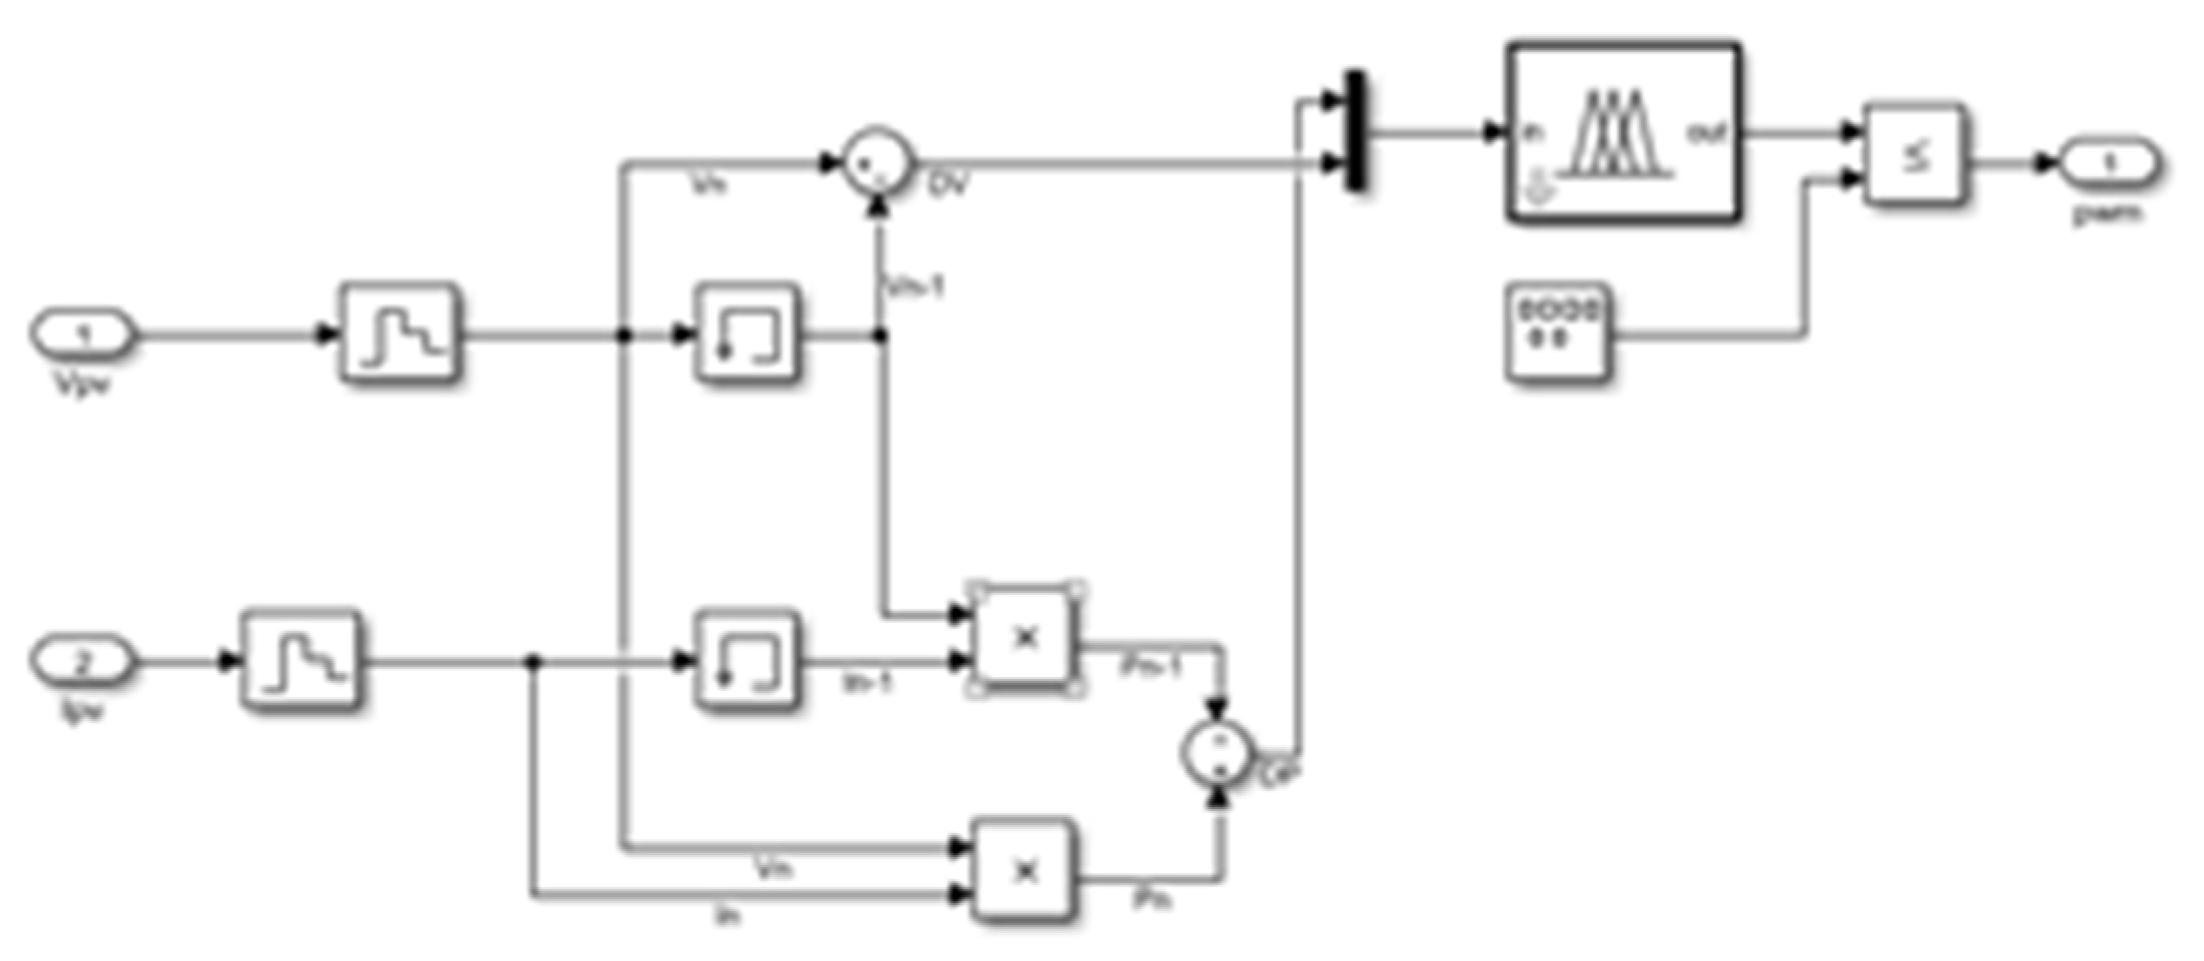
Figure 14.
Matlab / simulink simulation study of FLC.
Figure 14.
Matlab / simulink simulation study of FLC.
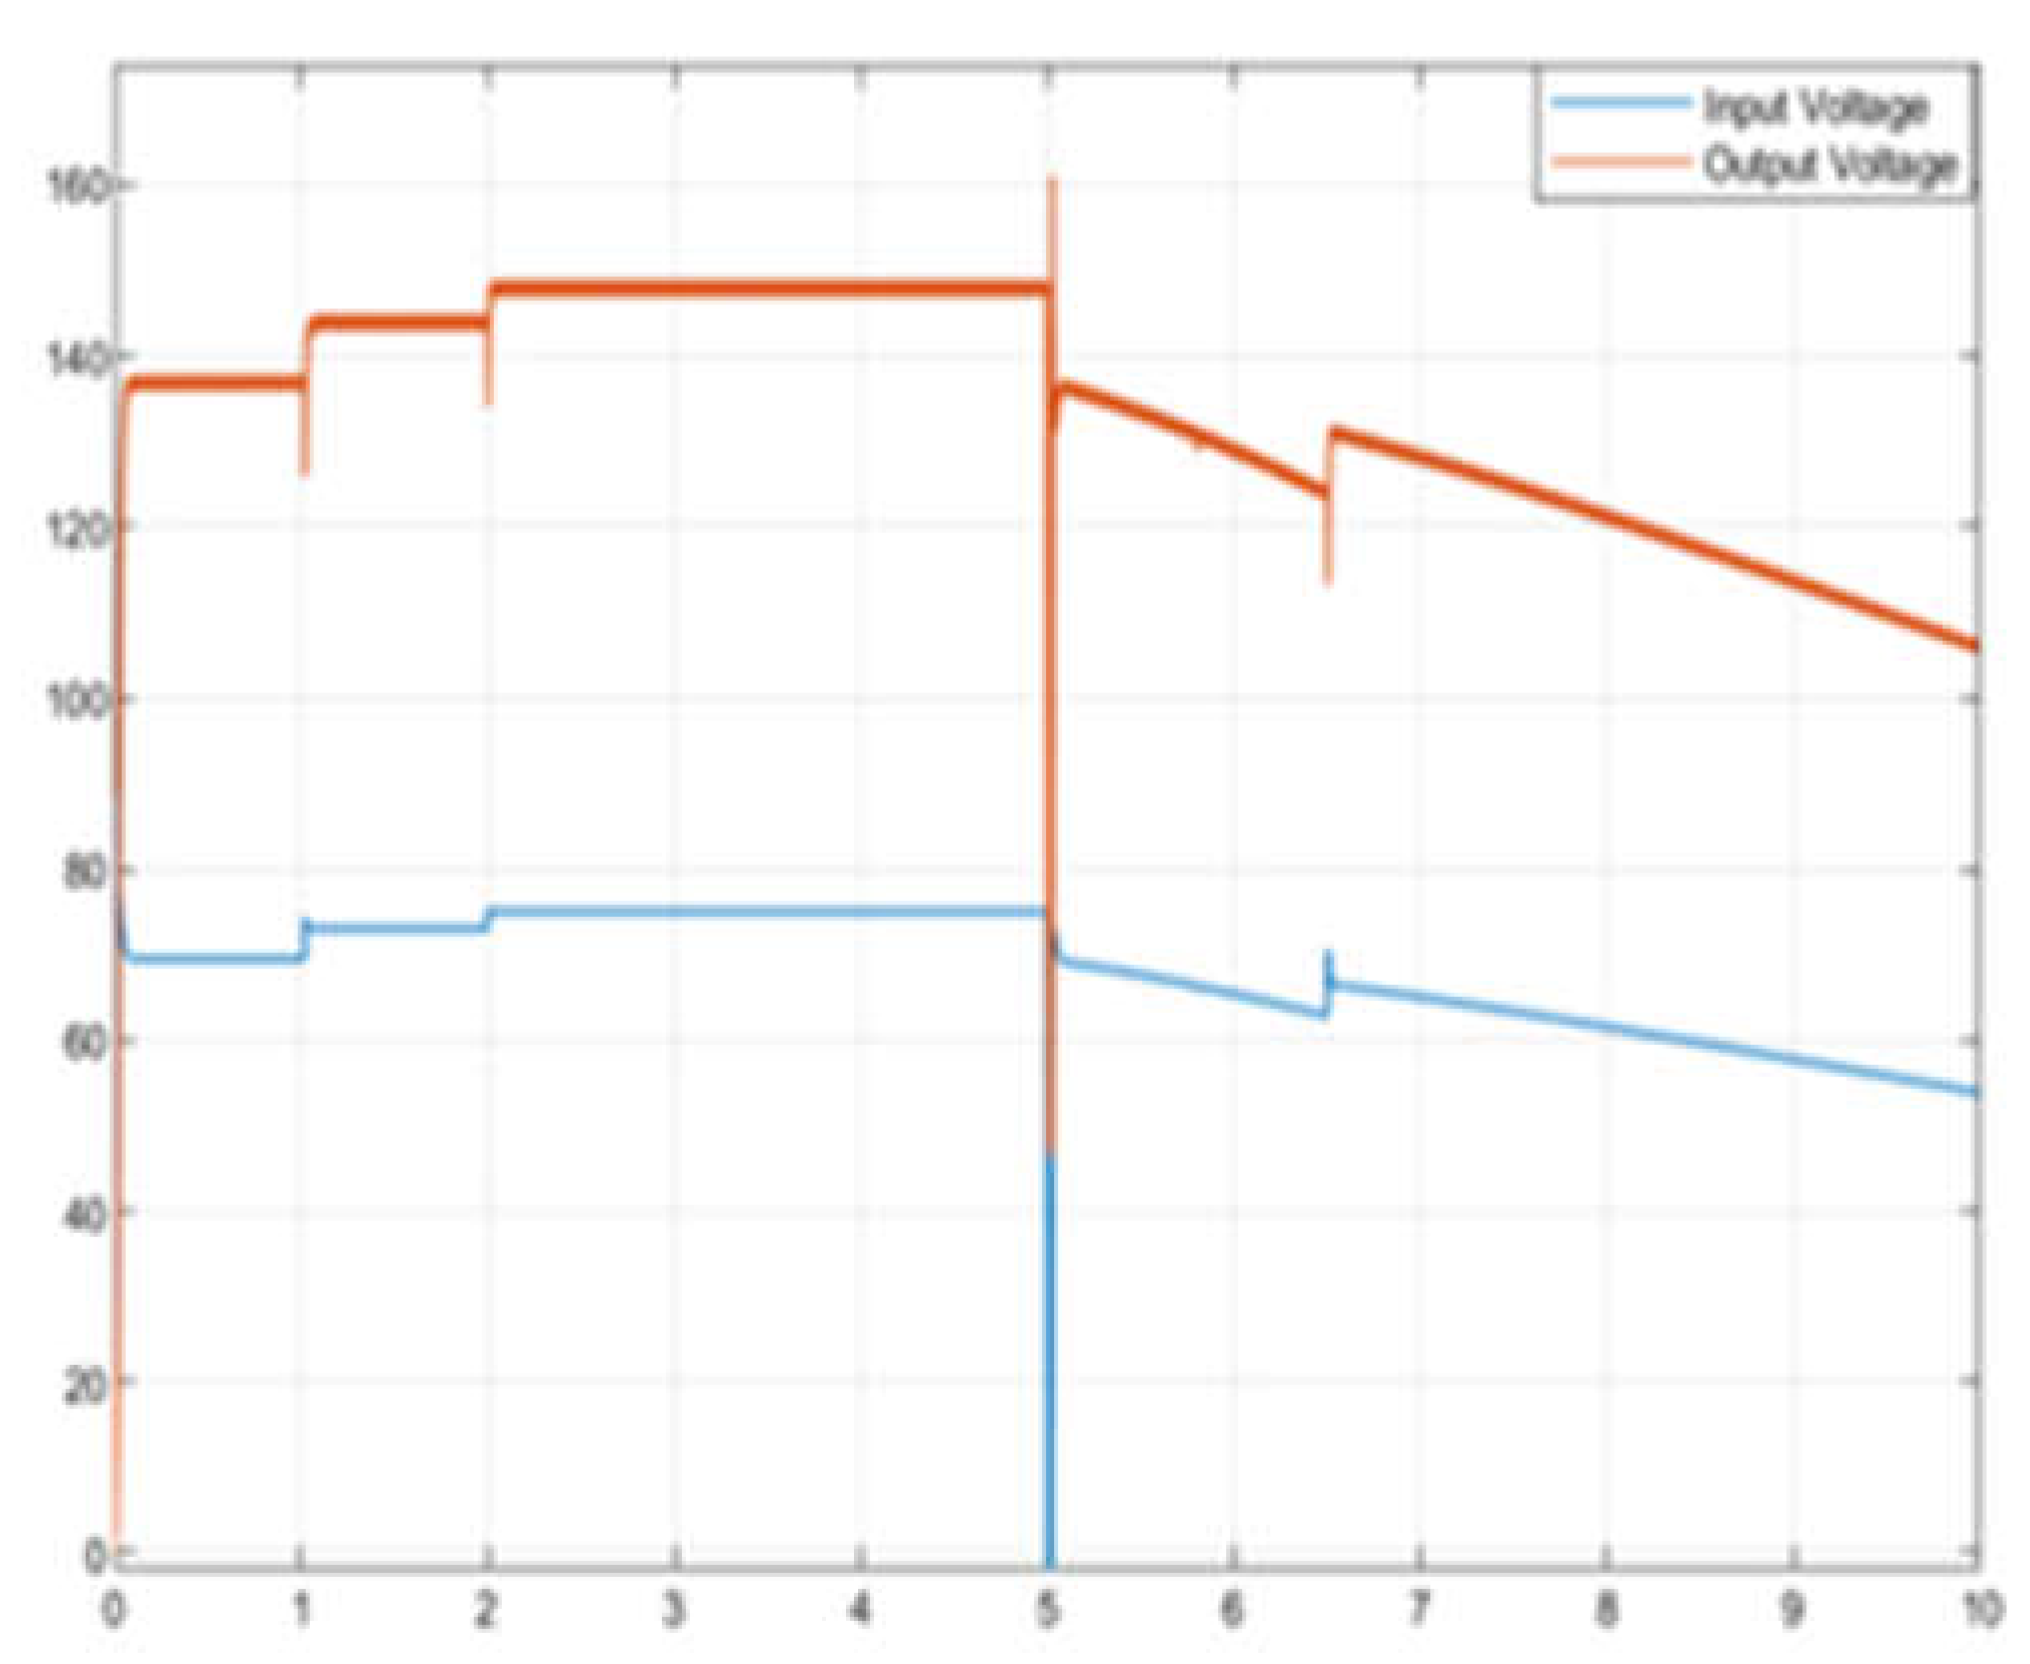
Figure 15.
The voltage of the PV system and FLC controlled boost converter output voltage.
Figure 15.
The voltage of the PV system and FLC controlled boost converter output voltage.
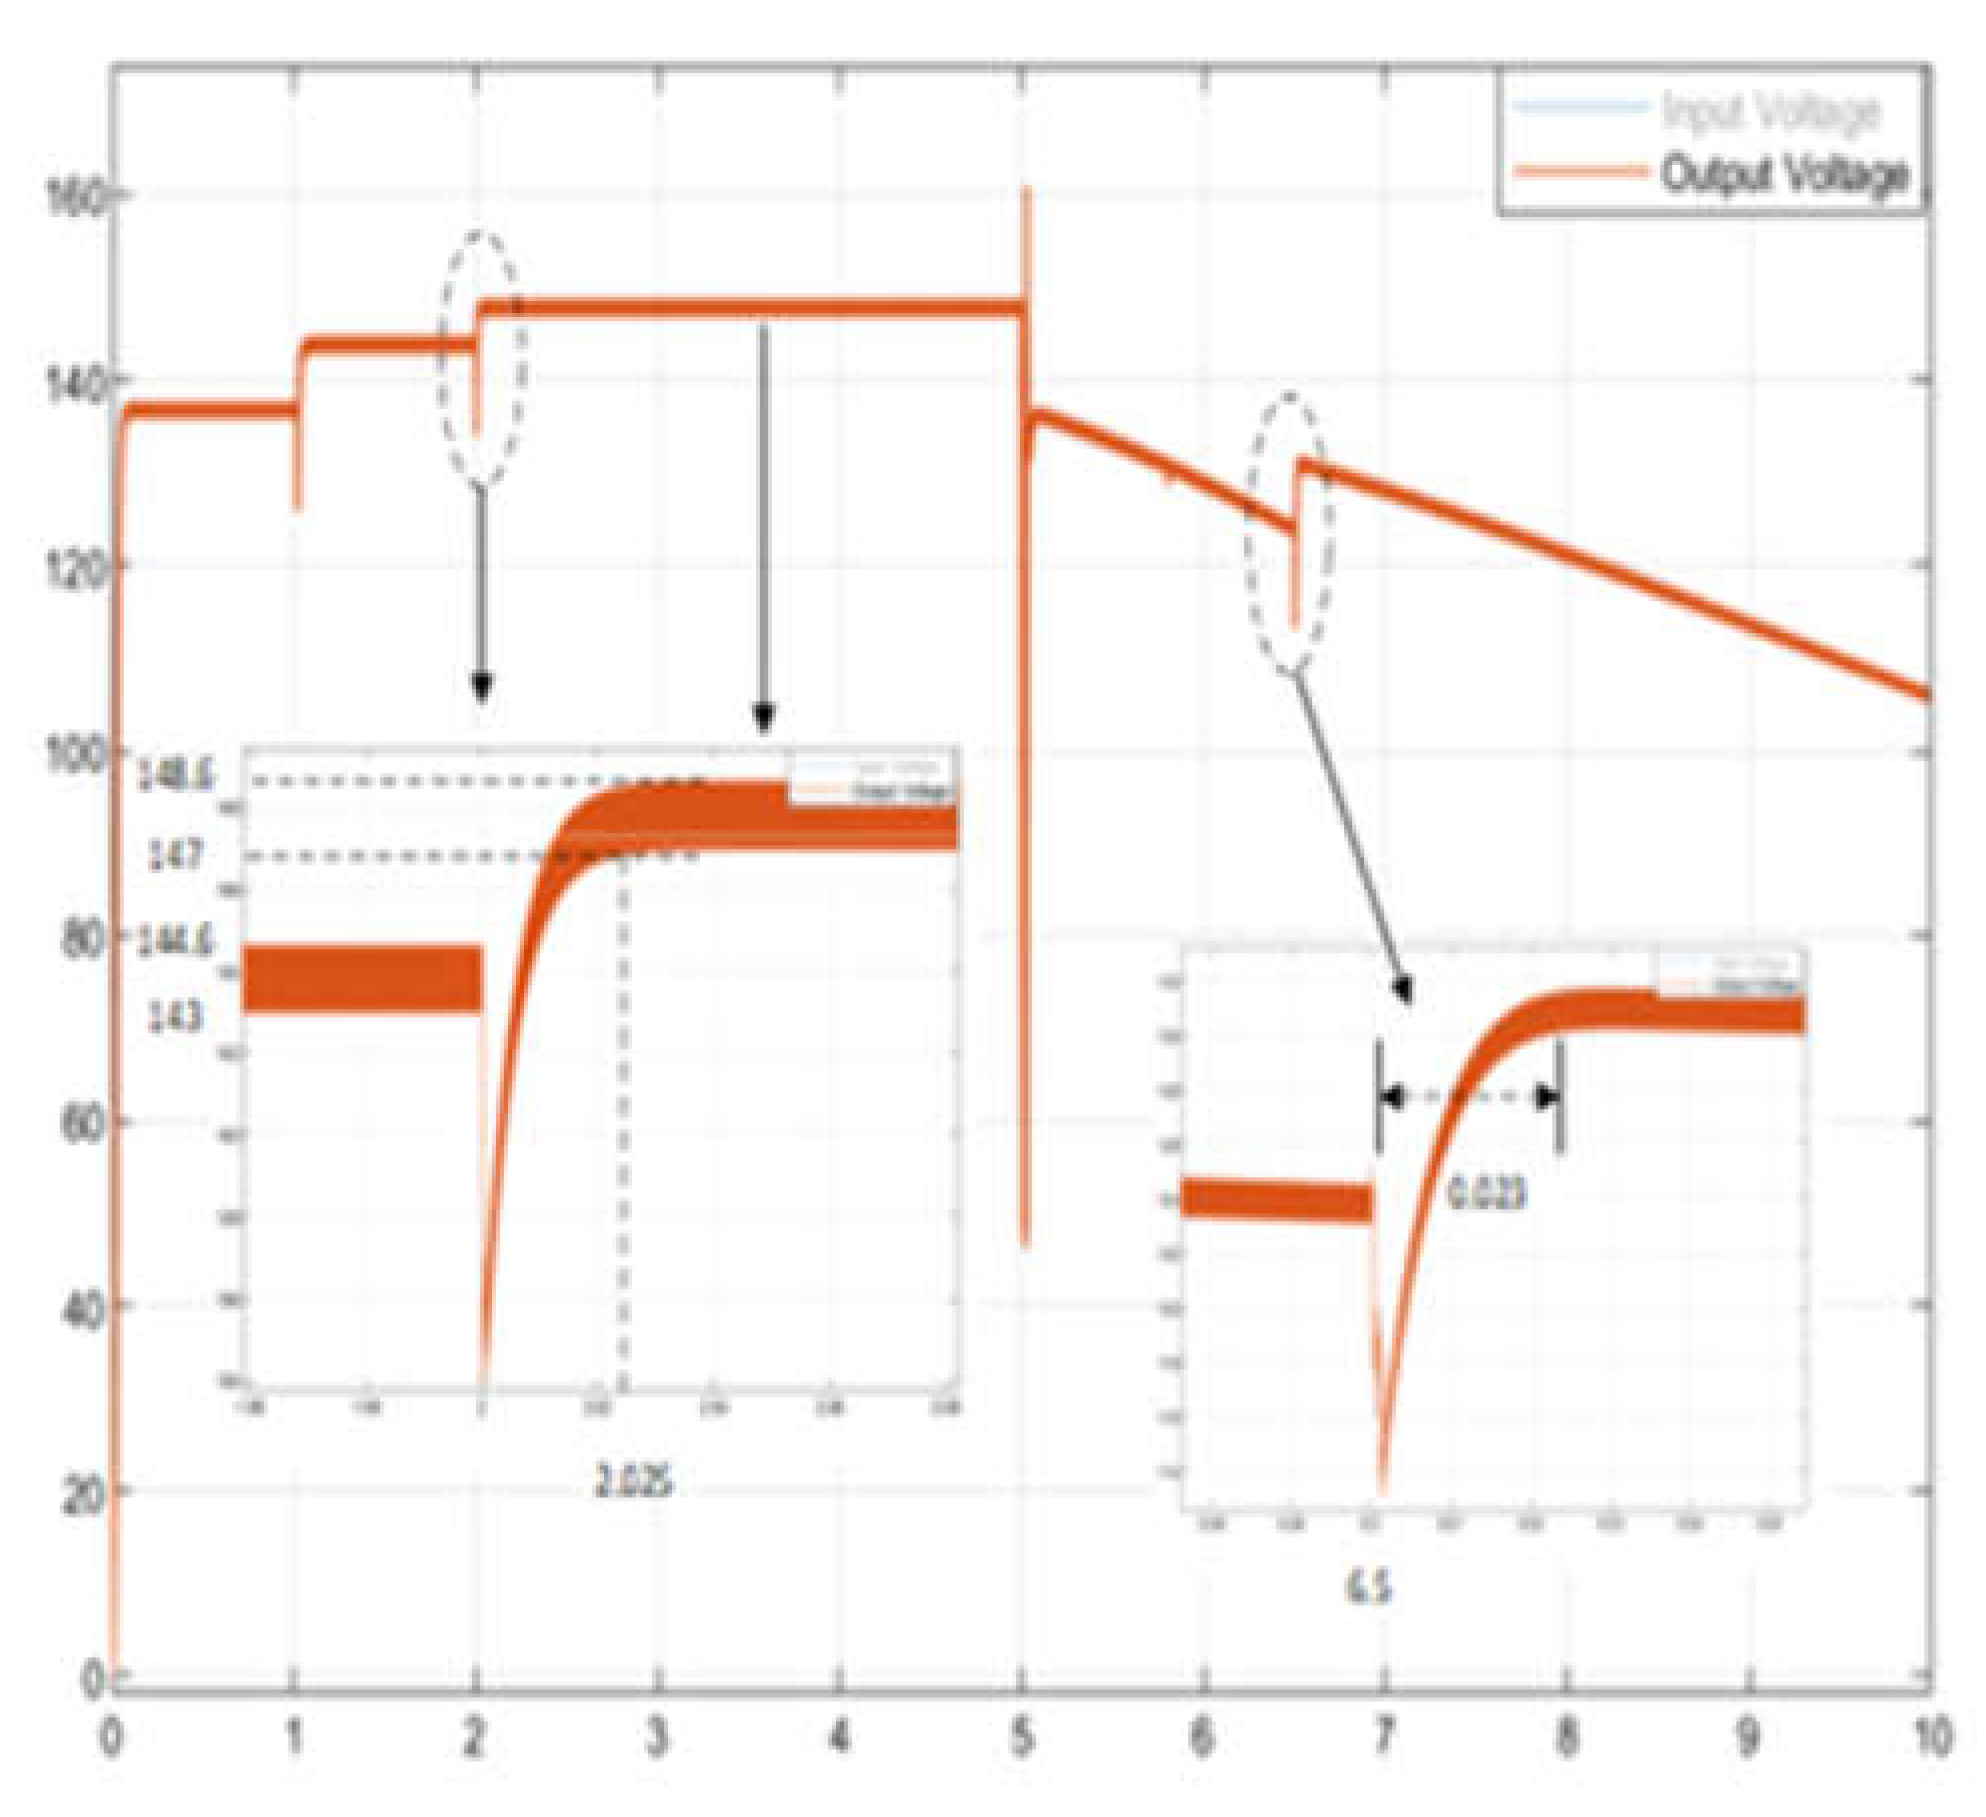
Figure 16.
The FLC controlled boost converter output voltage.
Figure 16.
The FLC controlled boost converter output voltage.
Figure 17.
The current of the PV system and the FLC-controlled boost converter output current.
Figure 17.
The current of the PV system and the FLC-controlled boost converter output current.
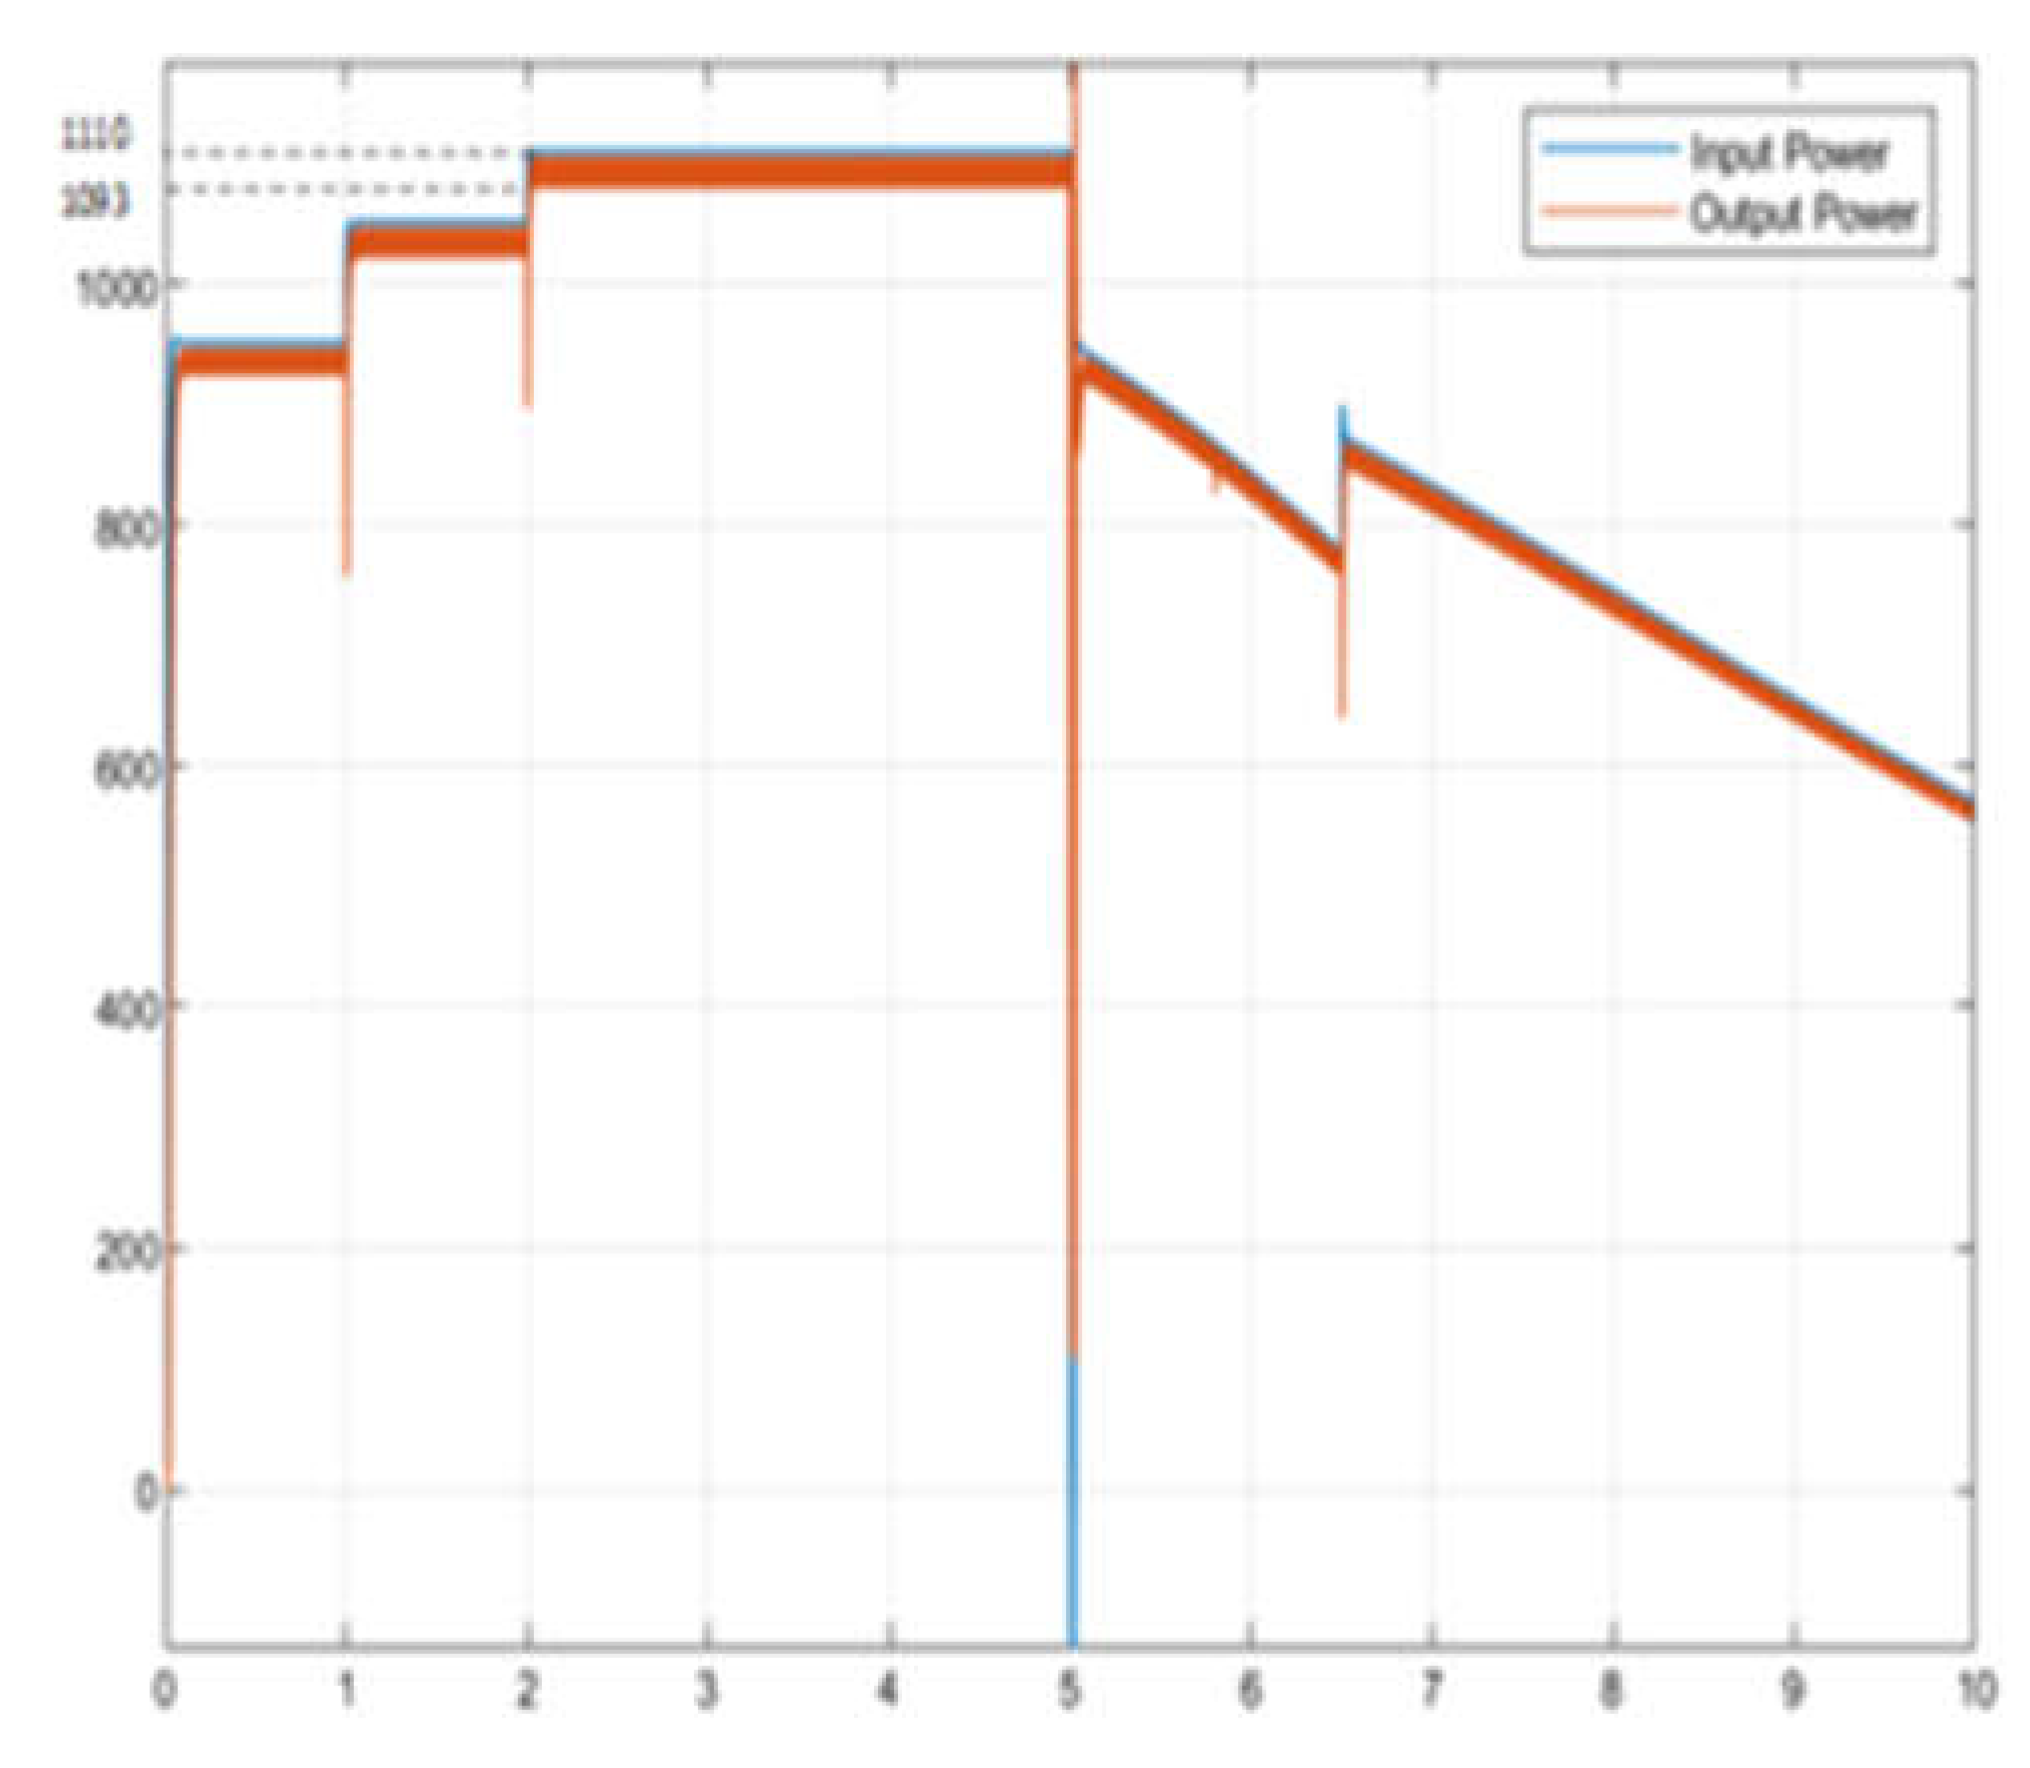
Figure 18.
Power generated from the PV module and fuzzy logic controlled boost output power.
Figure 18.
Power generated from the PV module and fuzzy logic controlled boost output power.
In
Figure 15 and
Figure 16, the FCL-controlled boost circuit increases the voltage to 147.8 V between 2 to 5 sec, and the ripple value of the voltage is measured as 1.6 V. The ripple value of the voltage ΔV=1.08% was calculated. In addition, in instantaneous variations in radiation, the FLC controller stabilizes the voltage as rapidly as 25ms (
Figure 16). In
Figure 16, when the currents of the FLC-controlled boost converter are examined, it is seen that the ripple is 0.08 A. However, at the current, a large ripple occurs in the sudden decrease in radiation (at 6.5 seconds). In
Figure 18, the power generated by the FLC controller follows the power generated by the PV system rapidly and efficiently. It was observed that the oscillations in the power generated with the FLC controller were very low.
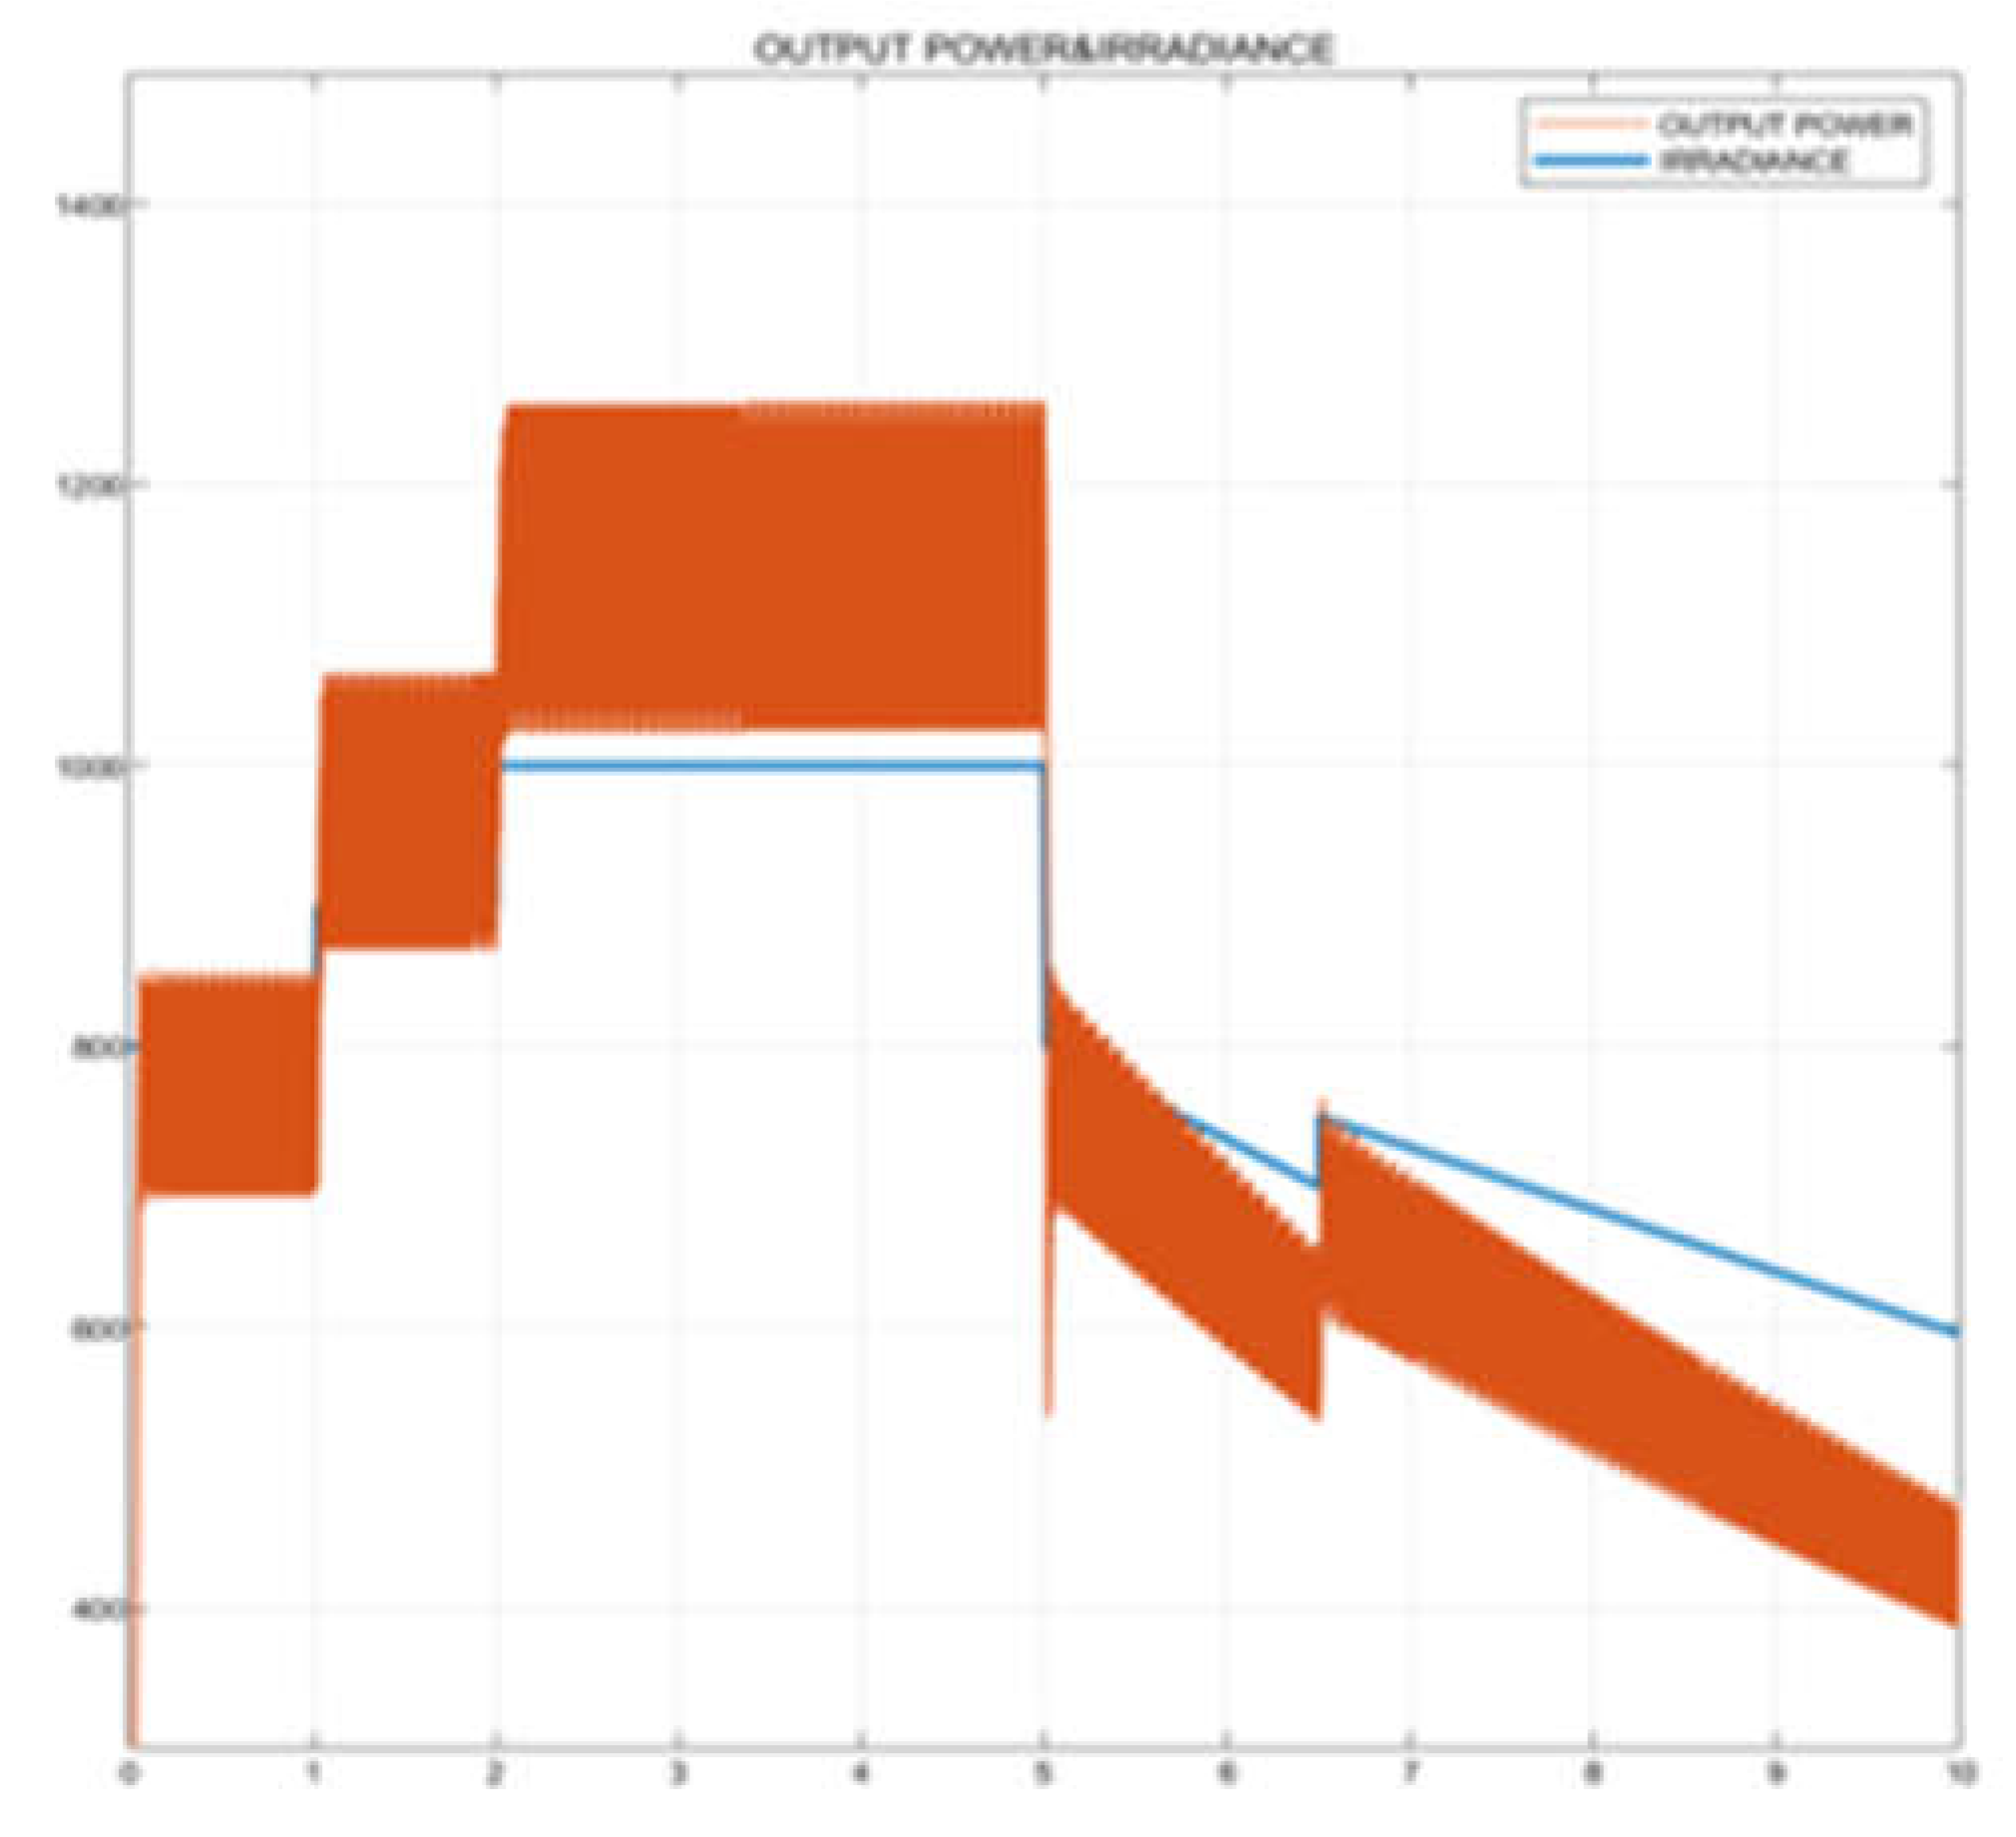
Figure 19 shows that the FLC controller effectively tracks the output power in case of sudden changes in radiation. In
Table 5, the power generated in the PV system and the Boost converter output power values are given according to the radiation values.
Figure 20 shows the voltage of the PV system and the boost converter output voltage using the increasing conductivity algorithm. The average value of the boost output voltage in the 2-5 sec interval is 151 V. The ripple in the voltage(ΔV) is measured as 13 V. ΔV is calculated as 8.6% (ΔV=8.6%). The voltage becomes stable in 40ms according to varying weather conditions. Looking at the output current of the boost converter in
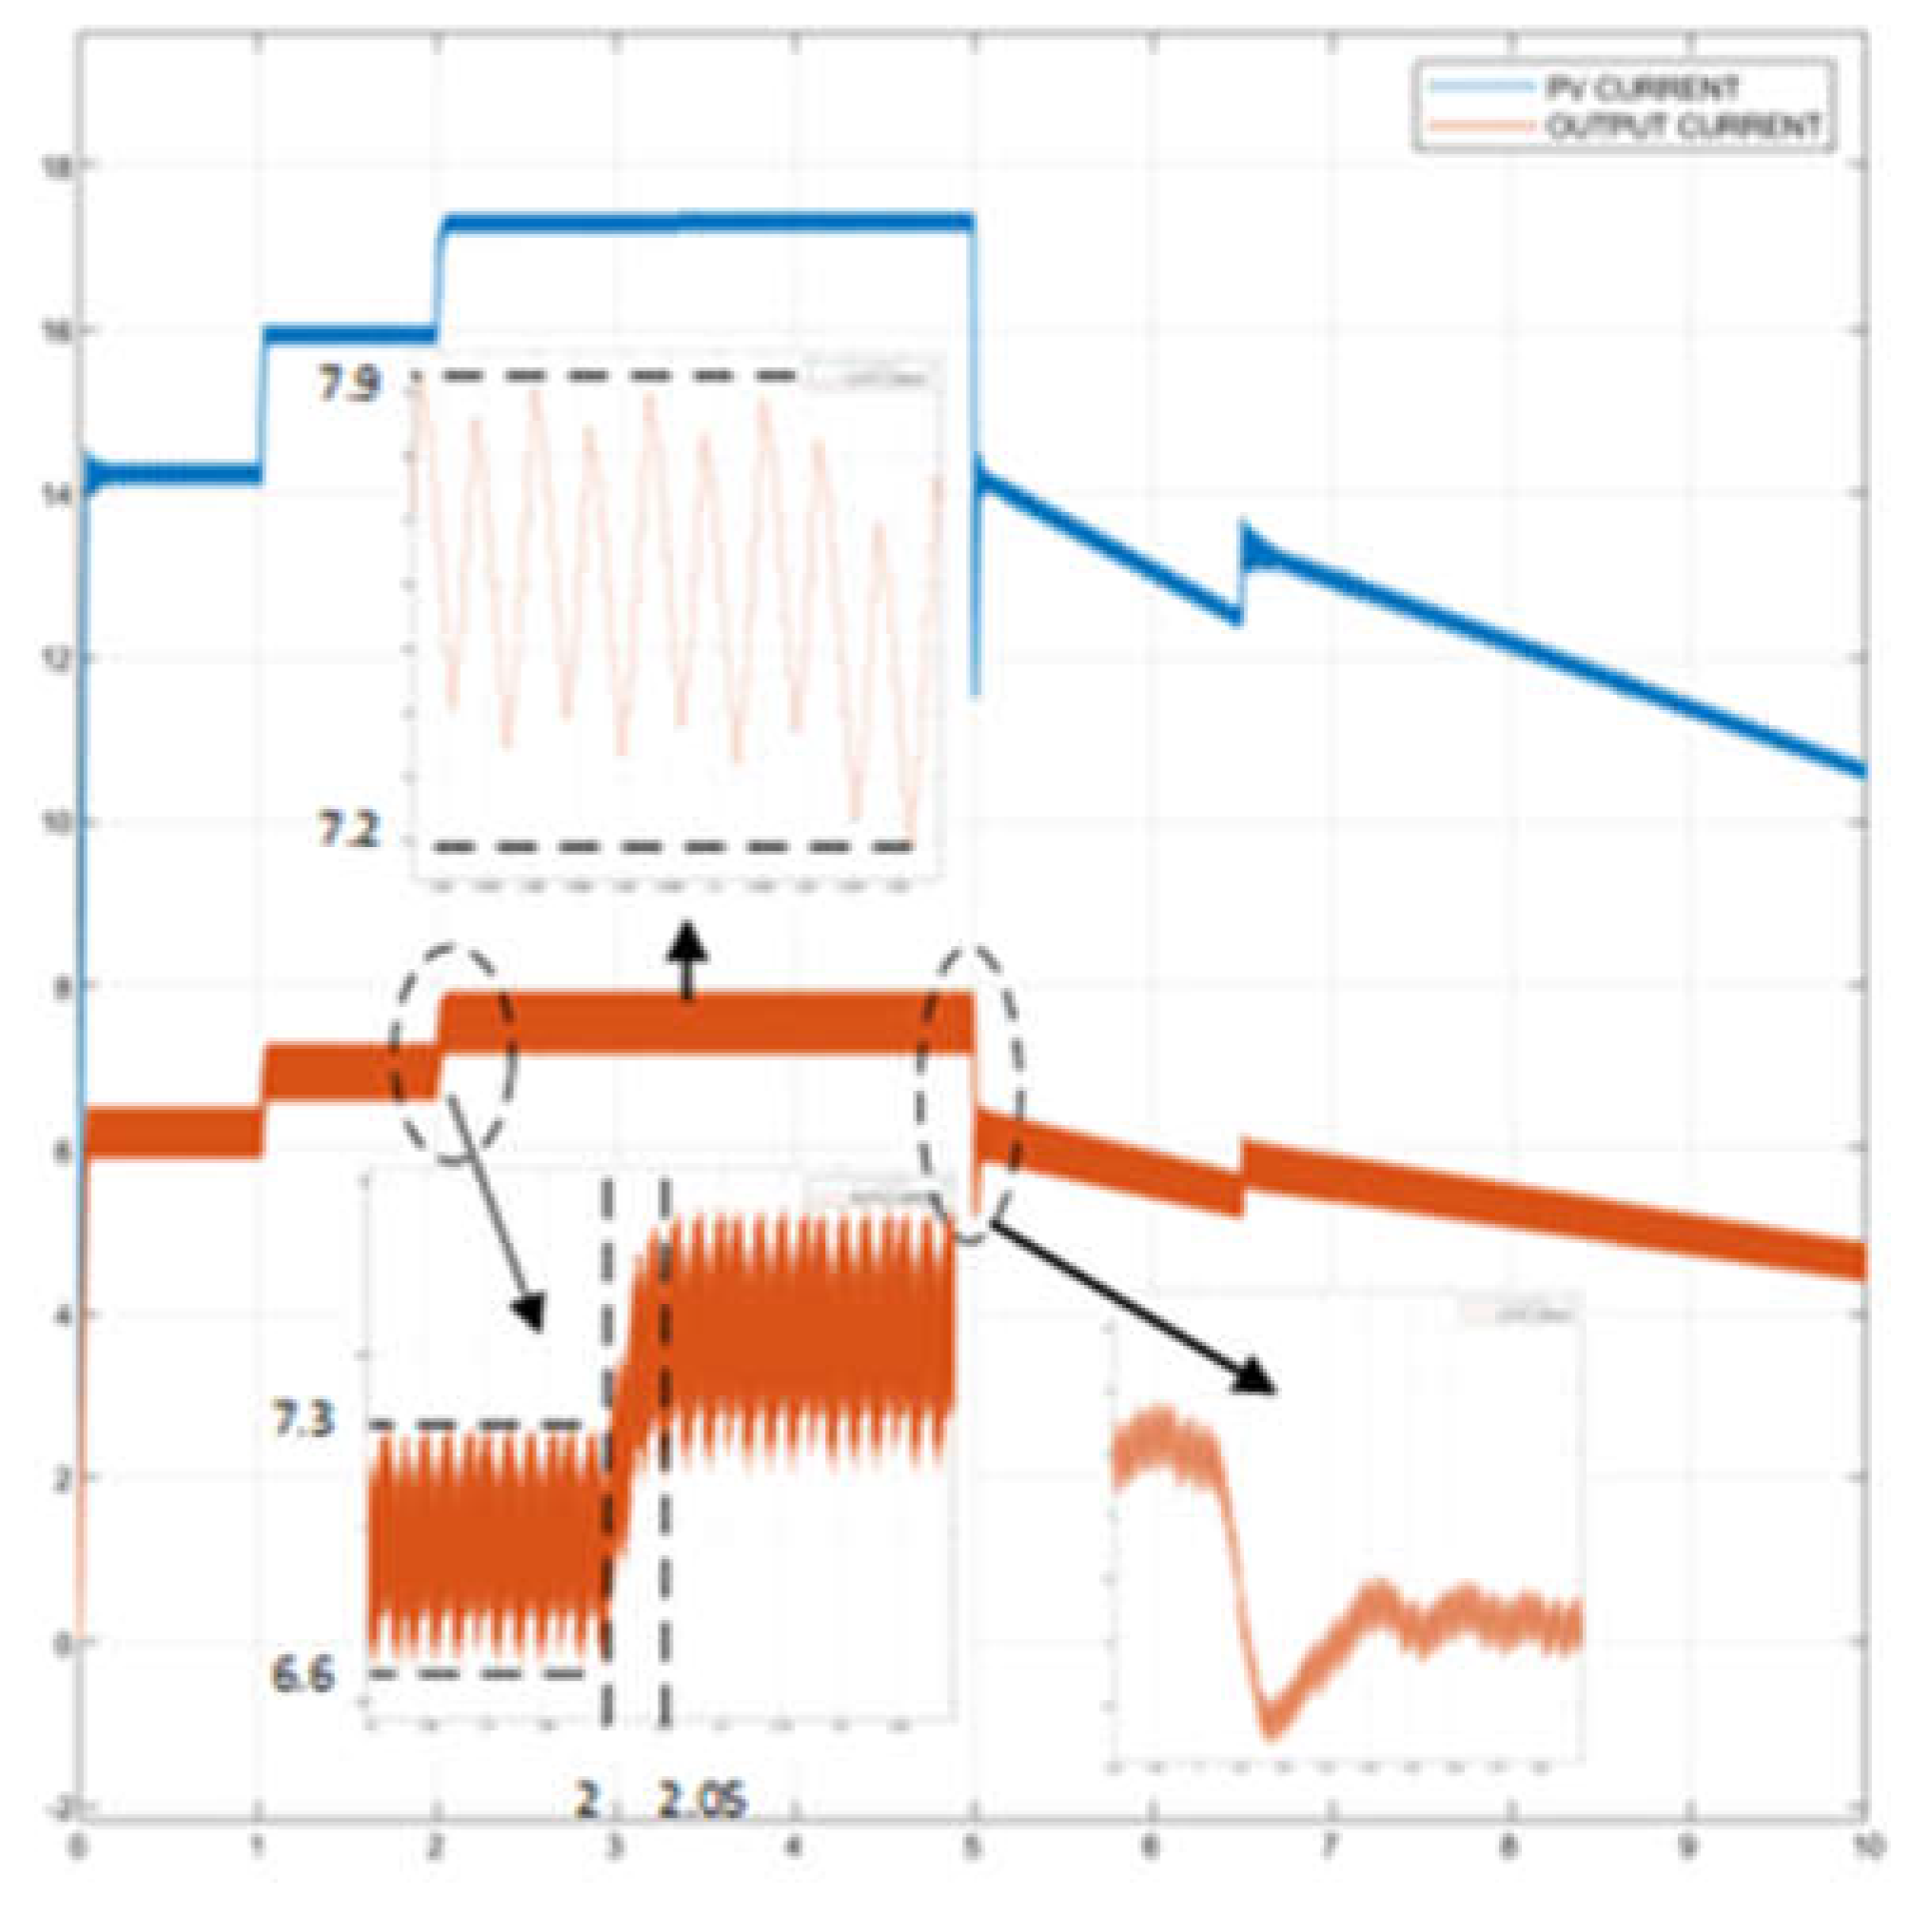
Figure 21, the average value between 2 to 5 sec is measured as 7.55 A, and the ripple in the current(ΔI) is 0.7 A. ΔI was calculated as 9.27%. When the irradiance decreases from 1000 w/m2 to 800 w/m
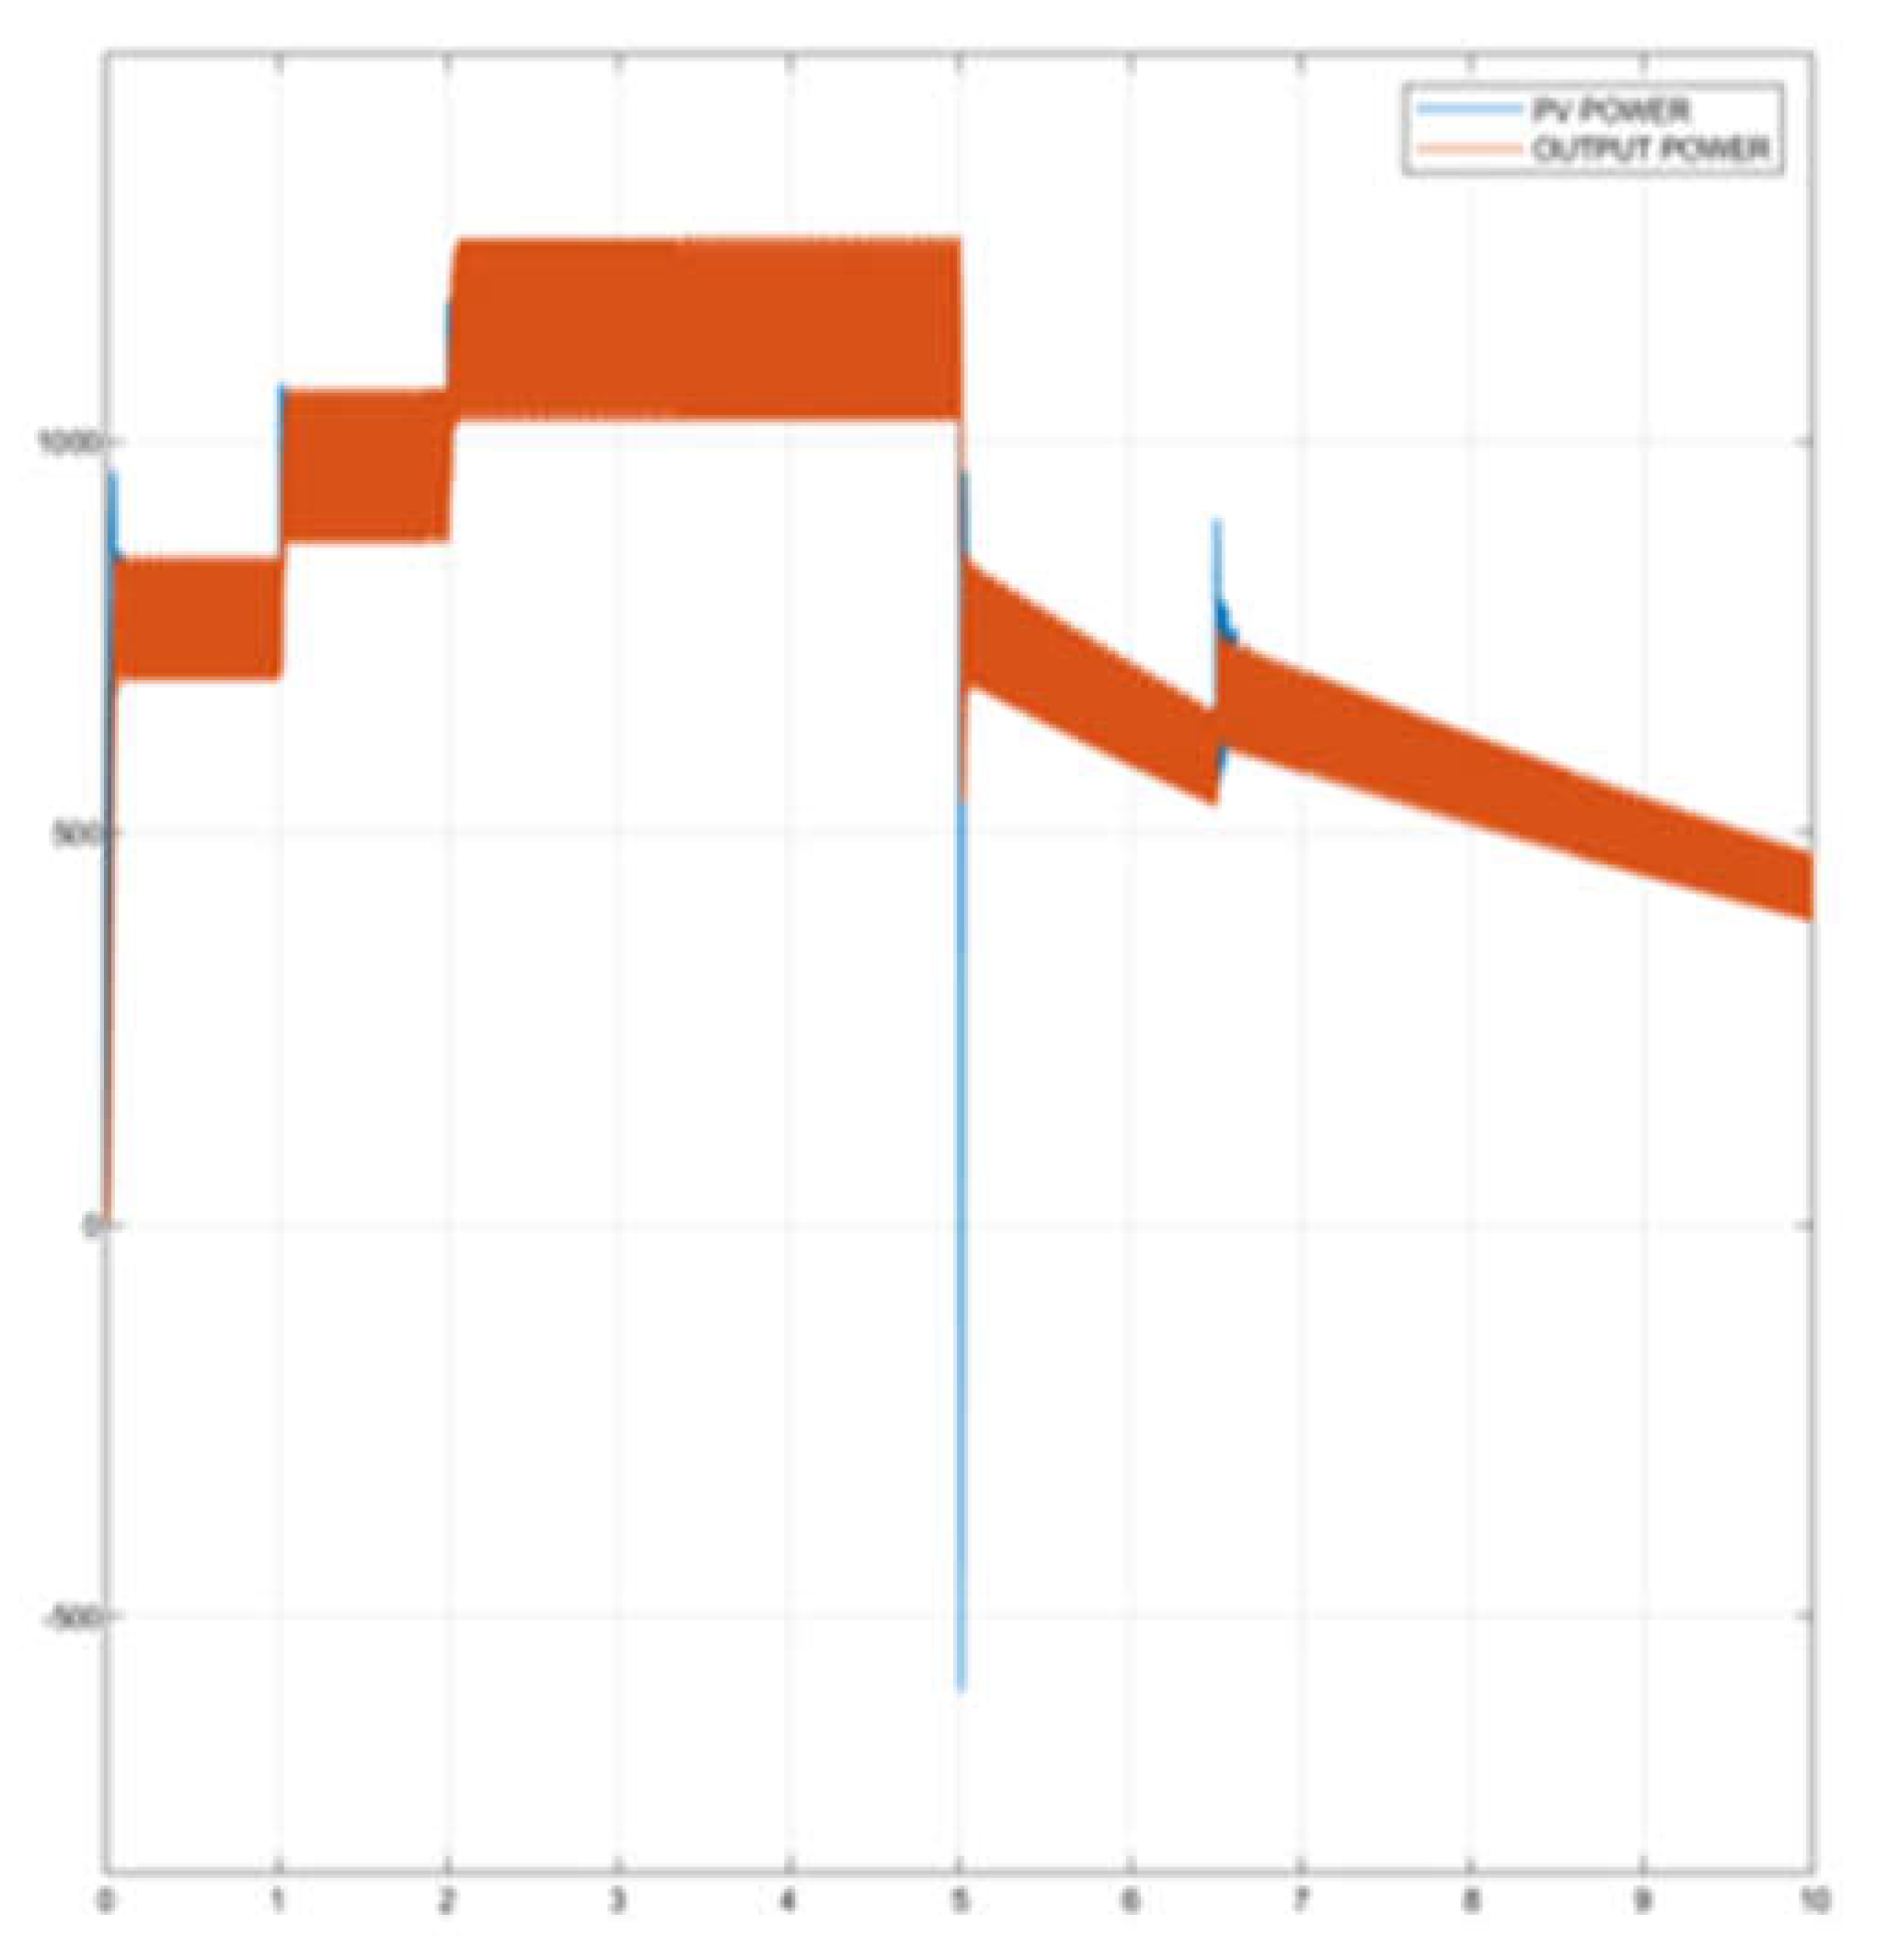
2 at 5th sec, the ripple in the current decreases to 5.5 A. The current becomes stable within 40 ms. It can be seen that the IncCon-controlled boost output power tracks the PV input power in
Figure 21 and
Figure 22.
Table 6 shows each irradiance value, which displays the power generated by the PV system and the output power of the boost converter.
Figure 20.
PV system voltage and IncCon-controlled boost output voltage.
Figure 20.
PV system voltage and IncCon-controlled boost output voltage.
Figure 21.
PV system current and IncCon controlled boost output current.
Figure 21.
PV system current and IncCon controlled boost output current.
Figure 22.
PV system generated power and IncCon controlled boost converter output power.
Figure 22.
PV system generated power and IncCon controlled boost converter output power.
Figure 23.
Incoming PV panel irradiation and the IncCon controlled boost output power.
Figure 23.
Incoming PV panel irradiation and the IncCon controlled boost output power.


