1. Introduction
1.1. Urban Heat Island Effect and Limitations of Conventional Air Source Heat Pumps
The urban heat island effect demonstrates the impact of urbanization on local climate, where dense concentrations of buildings, roads, and heat-absorbing materials significantly increase temperatures in cities compared to their rural surroundings [
1]. This effect is particularly noticeable at night, as surfaces such as asphalt and concrete slowly release the heat accumulated during the day [
2]. These elevated temperatures contribute to discomfort and pose energy management challenges in cities worldwide, directly impacting the sustainability goals of smart cities.
Many urban dwellings rely on conventional air source heat pumps (ASHPs) for cooling, which transfer heat between indoor and outdoor air. However, as outdoor temperatures rise, the efficiency of ASHPs decreases, resulting in higher electricity consumption and energy costs. The decline in efficiency occurs because increased outdoor temperatures reduce the available heat capacity of the air, which decreases the temperature gradient between the heat sink (outdoor air) and the heat source (indoor space) required for effective heat exchange [
3].
Li et al. (2019) reported that under these conditions, ASHPs consume approximately 19% more energy to dissipate the same amount of heat, resulting in lower efficiency and higher operating costs [
4]. These limitations highlight the need for more sustainable and efficient cooling solutions, such as ground-source heat pumps, to support the development of energy-efficient smart cities.
1.2. Ground Source Heat Pump Systems: Applications and Benefits in Southeast Asia
Ground source heat pumps (GSHPs) provide a viable solution to the energy challenges posed by the urban heat island effect, a key issue in smart city development. By taking advantage of stable ground temperatures and efficient heat transfer characteristics, GSHPs can significantly reduce urban heat emissions and improve energy efficiency. The technology, which exploits the temperature difference between the ambient air and the shallow ground, has evolved since its inception in a Swiss patent in 1912 to become a critical tool for sustainable urban energy management [
5].
In Southeast Asia, a significant GSHP application was achieved through collaboration between universities in Thailand and Japan. In 2020, these institutions installed a vertical GSHP system with three 62-meter loops on a building in Bangkok, Thailand, demonstrating energy savings of approximately 40% and confirming the system’s performance, feasibility, and financial viability for urban environments [
6,
7].
Complementary research in 2019 explored the practical application of energy piles, focusing on their thermo-mechanical behavior and impact on surrounding soils. This included studies on the effects of thermal cycling on Bangkok sand and the establishment of 16 energy pile demonstration sites in Bangkok, followed by a feasibility study on their use in residential units [
8,
9]. Further research found that regional variations in clay soil density had minimal effect on the heat transfer efficiency of energy piles, supporting their use in diverse urban environments [
9].
These findings suggest that energy piles integrated with GSHP systems can effectively reduce electricity consumption and support sustainable development in smart cities across Southeast Asia. Continued research and innovation will be critical to improve understanding and encourage wider adoption of these technologies to achieve the energy efficiency goals of smart cities.
1.3. Energy Piles: Geotechnical Aspects and System Components
Conventional pile foundations, such as displacement and non-displacement piles, are traditionally designed to support the weight of structures, with dimensions determined by structural requirements, construction methods, and soil conditions. Their overall bearing capacity is derived from wave friction and tip resistance, which are influenced by soil properties, pile materials, and surface characteristics [
10]. In the context of smart cities, the integration of energy efficiency into the basic infrastructure is becoming increasingly important.
Energy piles represent an innovative approach to urban infrastructure by combining the structural support of conventional piles with the thermal exchange capabilities of a ground source heat pump (GSHP) system. These piles, embedded with heat exchange tubes, serve the dual purpose of providing structural support and facilitating heat transfer between a building’s heating, ventilation, and air conditioning (HVAC) system and the ground. Research has shown that such geothermal systems can significantly reduce electricity consumption for HVAC purposes, lowering operating costs and improving the sustainability of urban environments. However, high initial installation costs remain a barrier to wider adoption. The overall efficiency and cost-effectiveness of ground source heat pumps are influenced by several factors, including local site conditions, design, materials, construction methods, and operating strategies, which need to be carefully considered in smart city planning.
GSHP systems integrated into energy piles use mechanical energy to transfer heat from buildings to the relatively stable temperature of the ground, which acts as a heat sink. This method takes advantage of the ground’s natural ability to store and release heat, improving the energy resilience of urban areas. The concept of “energy geo-structures” extends the benefits of GSHP technology beyond traditional applications by integrating it with various foundation systems, such as deep or shallow pile foundations, mat or pier foundations, retaining structures, and tunnel liners, providing versatile solutions for various smart city infrastructure needs.
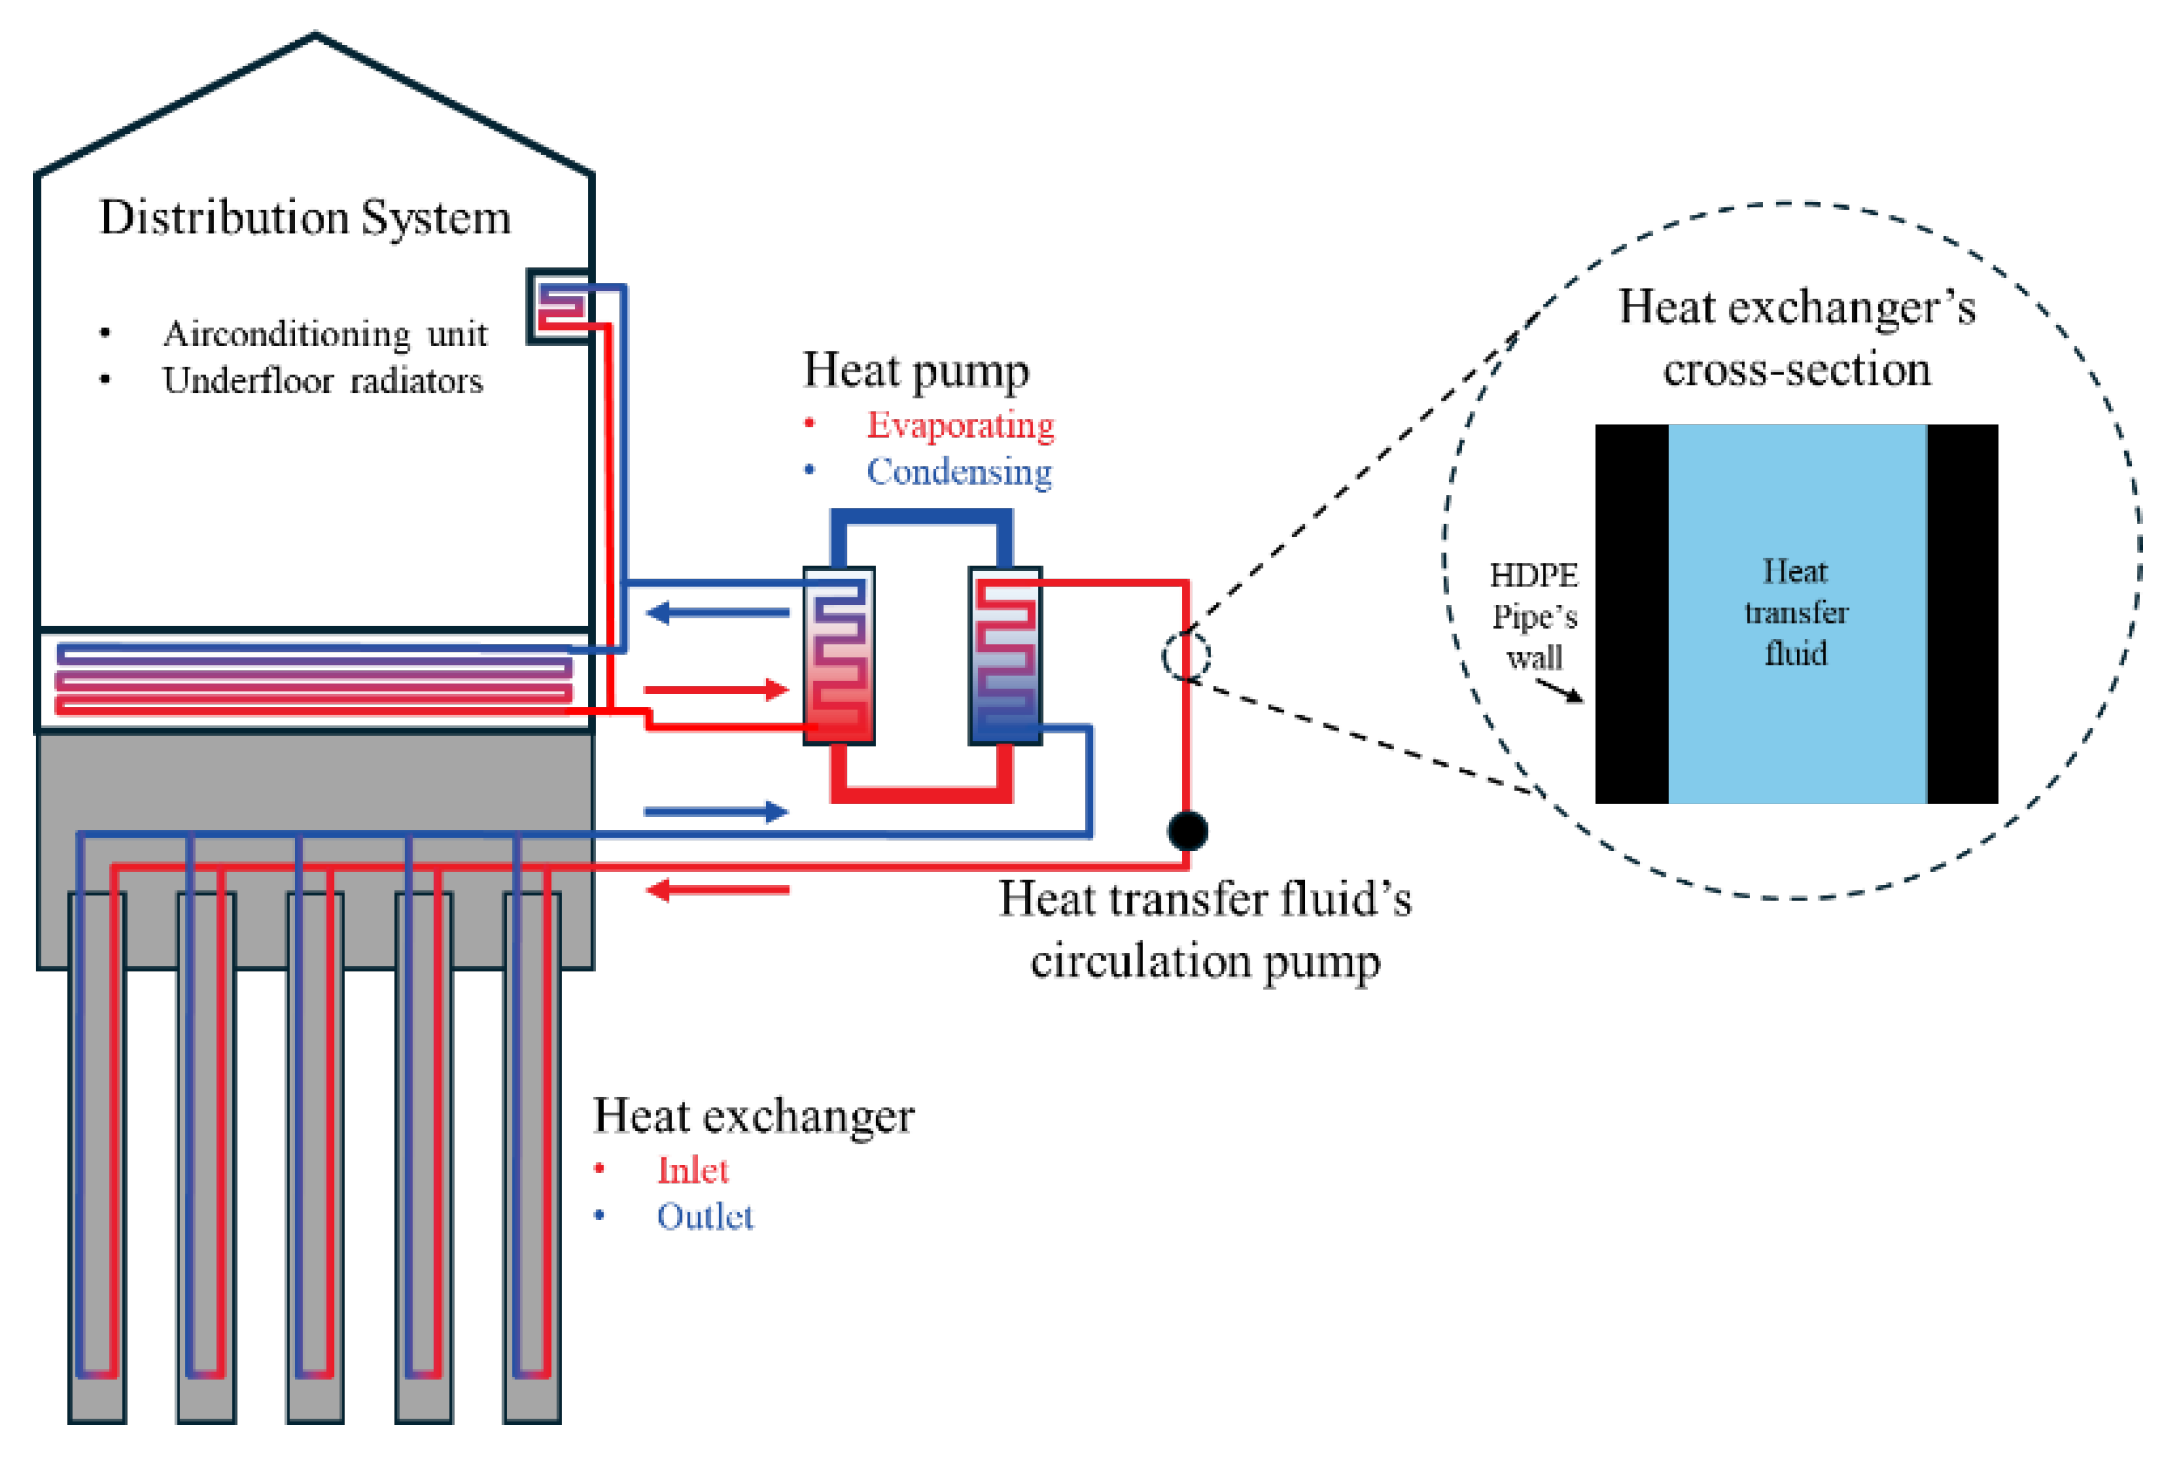
Figure 1 provides a schematic of the components involved in an energy geo-structure and illustrates how these systems can be adapted to optimize performance based on specific urban site conditions.
1.4. Scope and Purpose
This study provides a comprehensive overview of the theoretical and practical considerations necessary for the design of closed-loop energy piles and ground-source heat pump (GSHP) systems in cooling mode, specifically tailored for small to medium-sized residential units within smart cities. It serves as a resource for geotechnical engineers and urban planners who wish to deepen their understanding of energy pile technology and its application in sustainable urban development. While the primary focus is on geotechnical engineering, the study covers a wide range of topics, including soil thermal properties, heat transfer mechanisms, energy pile design processes, efficiency assessments, environmental impacts, and economic feasibility.
By addressing these diverse aspects, this guide aims to facilitate the effective integration of energy pile systems into smart city infrastructure, promoting innovation and sustainability. It supports urban planners and engineers in implementing advanced, energy-efficient cooling solutions that are consistent with the broader goals of reducing carbon emissions, improving energy resilience, and promoting sustainable urban growth.
2. Heat Transfer Mechanisms in Energy Piles
2.1. Volumetric Heat Capacity
GSHP systems are widely recognized for their efficiency and sustainability in heating and cooling space by taking advantage of the relatively stable ground temperatures throughout the year. These systems work by using the ground as a heat source in the winter and a heat sink in the summer, which is achieved by circulating a heat transfer fluid through a network of heat exchangers embedded in the ground [
11,
12].
The ability of geomaterials to store or release heat is determined by their volumetric heat capacity, which is the amount of thermal energy required to raise the temperature of a unit volume of material by one degree Celsius [
13,
14]. Volumetric heat capacity is measured in Joules per cubic meter per degree Celsius (J/m
3·°C). For practical purposes in heat transfer simulations, a simplified volumetric heat capacity can be calculated as the product of the material’s density (
ρ) and its specific heat capacity (
c), as shown in
Table 1 for common geomaterials.
However, for complex, fully saturated, multiphase geomaterials, the total volumetric heat capacity is the sum of the volumetric heat capacities of the fluid and solid components, as described in Equation (1).
where,
and
represent the densities of the fluid and solid components, respectively, while
and
represent their specific heat capacities, and
represents the porosity of the material.
In the design of energy piles for the Southeast Asian region, where pile foundations for small to medium residential units are typically installed in soft clay layers that transition to stiffer clay layers, the volumetric heat capacity will vary depending on soil density and porosity. To account for this in the design process, the total volumetric heat capacity of the multilayer soil must be determined, as shown in Equation (1).
2.2. The Effective Thermal Conductivity and Diffusivity of the Ground
It is important to understand the basic concept of thermal conductivity in geomaterials. Effective thermal conductivity (
) is a property that quantifies a material’s ability to conduct heat, defined as the amount of heat that passes through a unit area per unit time given a temperature gradient. It is measured in watts per meter per degree Celsius (W/m·°C).
Table 2 shows the typical values of effective thermal conductivity for common geomaterials used in heat transfer simulations.
The assumption of homogeneity and isotropy is often made, indicating that the thermal conductivity is independent of direction. For complex, fully saturated, multiphase geomaterials, the effective thermal conductivity can be expressed as the sum of the thermal conductivities of the fluid and solid components, as shown in Equation (2).
where,
and
are the thermal conductivities of the fluid and solid parts, respectively, and
is the porosity of the material.
Another key parameter is thermal diffusivity (
), which is the ratio of thermal conductivity to volumetric heat capacity. A higher thermal diffusivity value indicates more efficient heat transfer capability. It is calculated using Equation (3).
where,
λ is the thermal conductivity of the soil,
is the soil density, and
is the specific heat capacity.
Both effective thermal conductivity and diffusivity are critical to the design of energy piles and vary widely depending on site conditions. For example, high groundwater flow rates can increase the thermal conductivity. These parameters are essential to the computational models used to simulate soil temperature changes in subsequent steps.
2.3. Ambient Ground Temperature
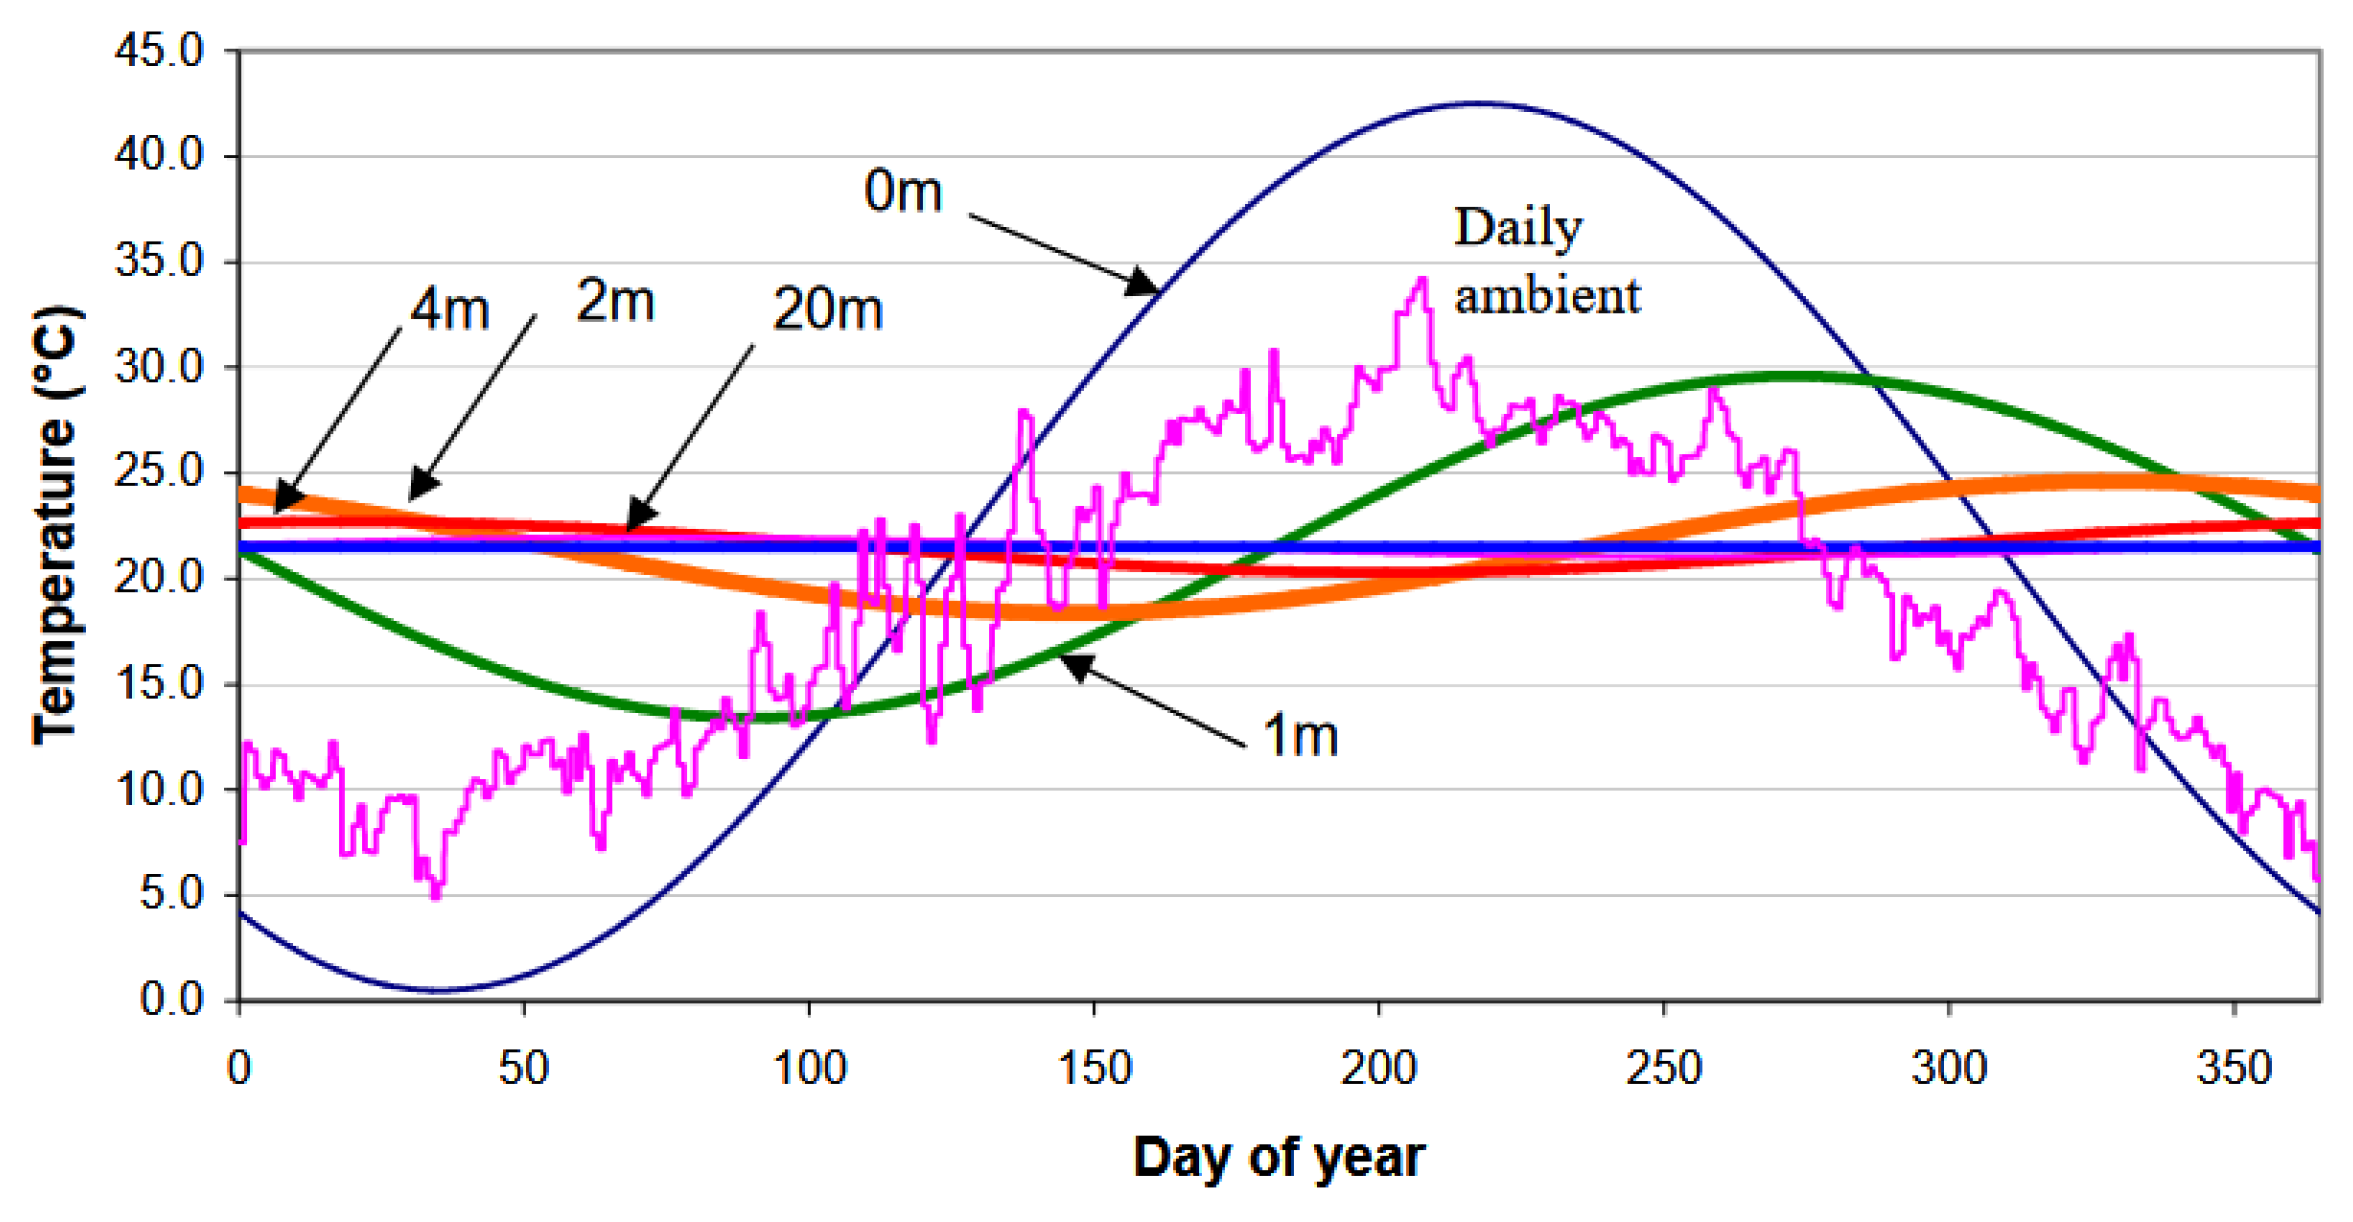
The temperature of the ambient air and the upper 1 to 3 meters of the “vadose zone” fluctuates in a sinusoidal pattern as shown in
Figure 2 [
16], influenced by daily air temperature cycles, solar radiation, and seasonal variations. However, at depths of 9 to 12 meters, the ambient soil temperature remains relatively stable throughout the year [
17]. The highest soil temperatures occur in summer and the lowest in winter, with a slight lag compared to air temperatures due to seasonal passive cooling and heating effects.
Since most energy piles are installed deeper than 3 meters below the surface, the site location has a significant impact on the overall efficiency and performance of the GSHP and energy pile systems.
Heat island effects also influence the ambient temperature of the subsurface. Taniguchi et al. (2009) [
18,
19,
20] investigated subsurface thermal conditions and groundwater in Osaka, Japan and Bangkok, Thailand. Data were collected from 37 boreholes between August and November 2003 in Osaka and from 13 boreholes in June 2006 in Bangkok.
This research helps refine design parameters for energy piles in Southeast Asia by narrowing the range of ambient air and soil temperatures used as inputs in simulation models. Soil temperatures were measured at 1 m intervals. In Osaka, the average annual air temperature is about 16 to 17°C, with soil temperatures gradually increasing from 17°C near the surface to 24°C at a depth of 200 m. In Bangkok, the average annual air temperature is about 28 to 30°C, with soil temperatures rising from 29°C near the surface to 37°C at a depth of 200 m. The estimated increase in ambient air temperature due to urbanization is 2.2°C in Osaka and 1.8°C in Bangkok. Similar studies conducted in other Southeast Asian countries have reported comparable temperature ranges [
6,
21,
22,
23,
24,
25]. Ambient ground temperature follows a sine wave pattern, with peak temperatures in summer and the lowest in winter. The temperature stabilizes at greater depths, showing minimal fluctuation throughout the year [
16].
2.4. Heat Convection and Heat Conduction in Geomaterials
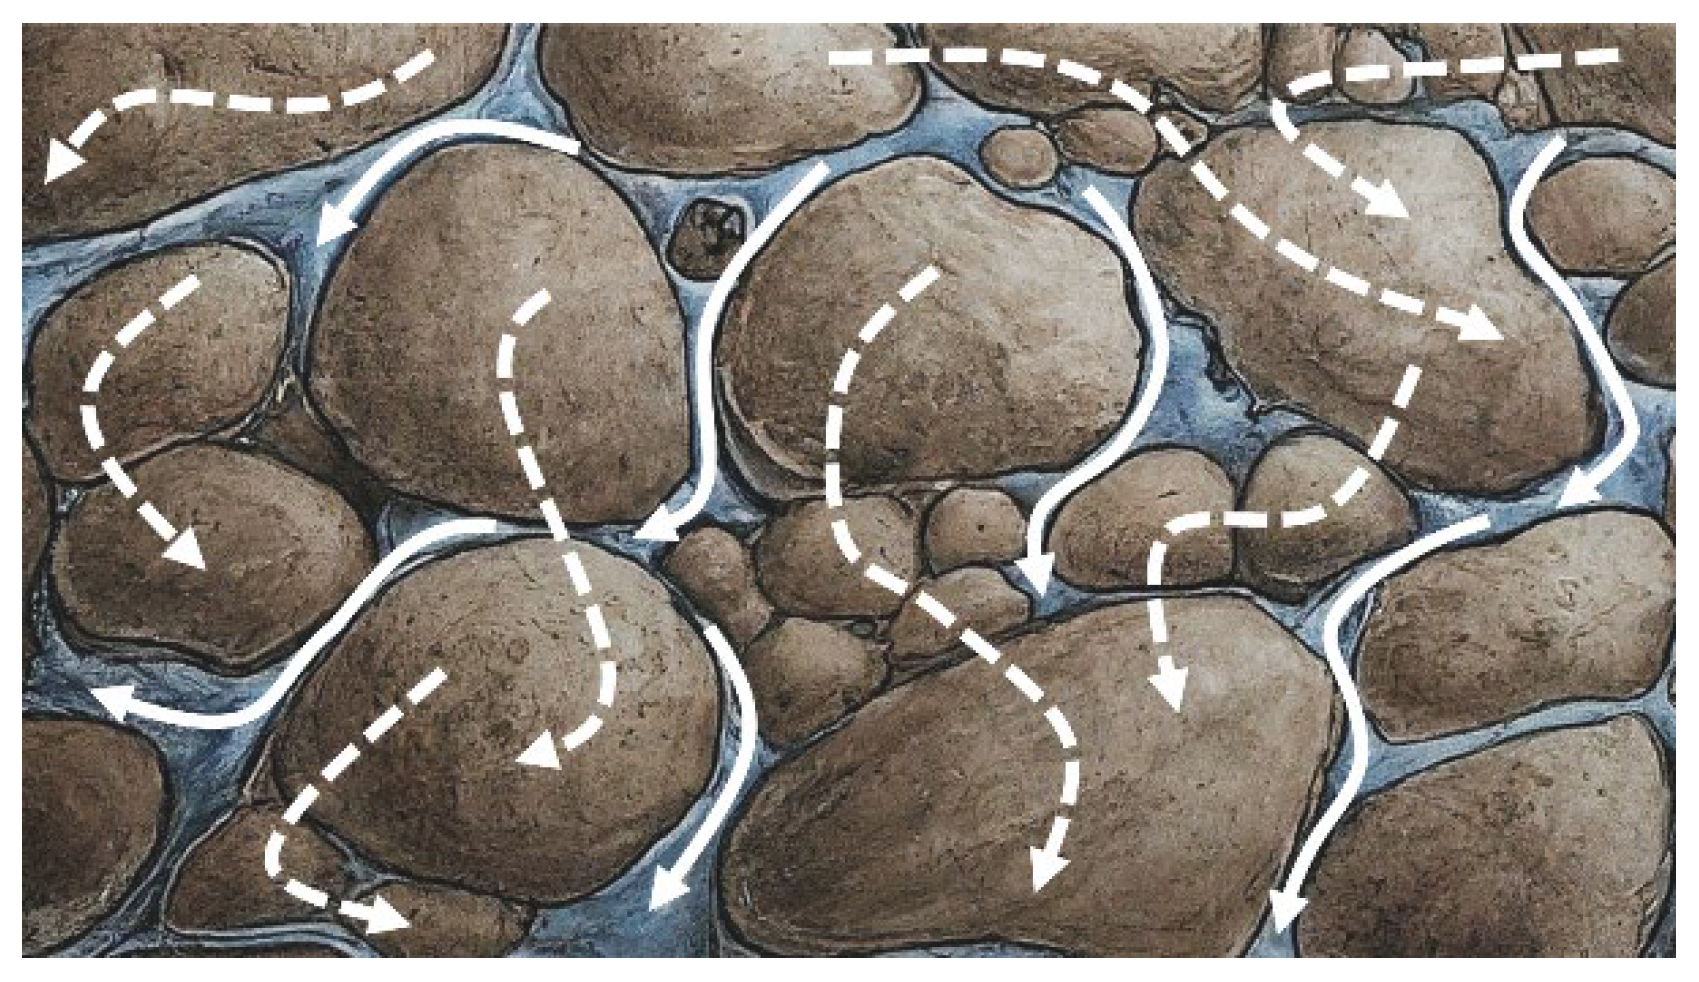
Heat conduction and convection are critical mechanisms governing the thermal behavior of geomaterials composed of solid particles, pore spaces, and fluids. Understanding these heat transfer processes is essential for various geological and engineering applications.
Figure 3 illustrates the pathways of convective and conductive heat transfer in a geomaterial.
Heat conduction in geomaterials occurs primarily through solid particles and is influenced by factors such as mineral composition, porosity, and temperature [
26]. The thermal conductivity of geomaterials can vary significantly as a result of these factors, affecting their heat transfer efficiency. For example, in granular materials, heat conduction is dominated by contact points between individual grains, creating preferential heat paths [
27]. This phenomenon is particularly relevant in applications such as thermal energy storage and geothermal systems.
Conversely, heat convection in geomaterials involves the transfer of heat through the movement of pore water between grains. The unique permeability of each geomaterial plays a key role in determining the extent of convective heat transfer.
When phase transitions are involved, the interplay between conduction and convection in geomaterials becomes more complex. In permafrost regions or during freeze-thaw cycles, the kinetic phase transition of water within geomaterials can significantly affect heat transfer processes [
28]. This has important implications for predicting the stability of rock slopes in cold regions and understanding the behavior of frozen soils.
Recent research has focused on developing comprehensive models to describe heat transfer in geomaterials that include both conductive and convective mechanisms [
29]. These models are critical for accurately predicting thermal behavior in various applications, such as geothermal energy extraction, underground thermal energy storage, and infrastructure design in permafrost regions.
Understanding heat conduction and convection in geomaterials is essential for addressing challenges in geotechnical engineering, energy resource management, and climate change adaptation. As research advances, it will provide valuable insights for optimizing thermal performance in various geological and engineering applications, contributing to more efficient and sustainable use of geomaterials.
2.5. Heat Transfer Model
2.5.1. Thermal Borehole Thermal Resistance and G-Function
The time-dependent total thermal resistance, (
), can be described using Equation (4) by the concept of time-independent thermal resistance [
14].
where,
is the time-dependent total thermal resistance, representing the overall resistance to heat flow in energy piles or a GSHP system,
is the inverse of the thermal conductivity, is the sum of the thermal resistance of the embedded heat exchanger, and
is the G-function which includes both time-independent and time-dependent components.
This approach effectively models heat transfer problems by treating the heat exchanger as a heat source within a larger computational domain over a reference time period (). Under steady-state conditions, this function can be used to calculate the long-term performance of the embedded heat exchanger and the overall GSHP system.
The G-function represents the time-dependent, dimensionless temperature response factor that describes how the soil temperature surrounding the heat exchanger changes over time in response to a constant heat injection rate [
30]. The following section presents several heat transfer models in the form of G-functions suitable for different simulation objectives and time frames.
2.5.2. The Infinite Line Source (ILS) Model
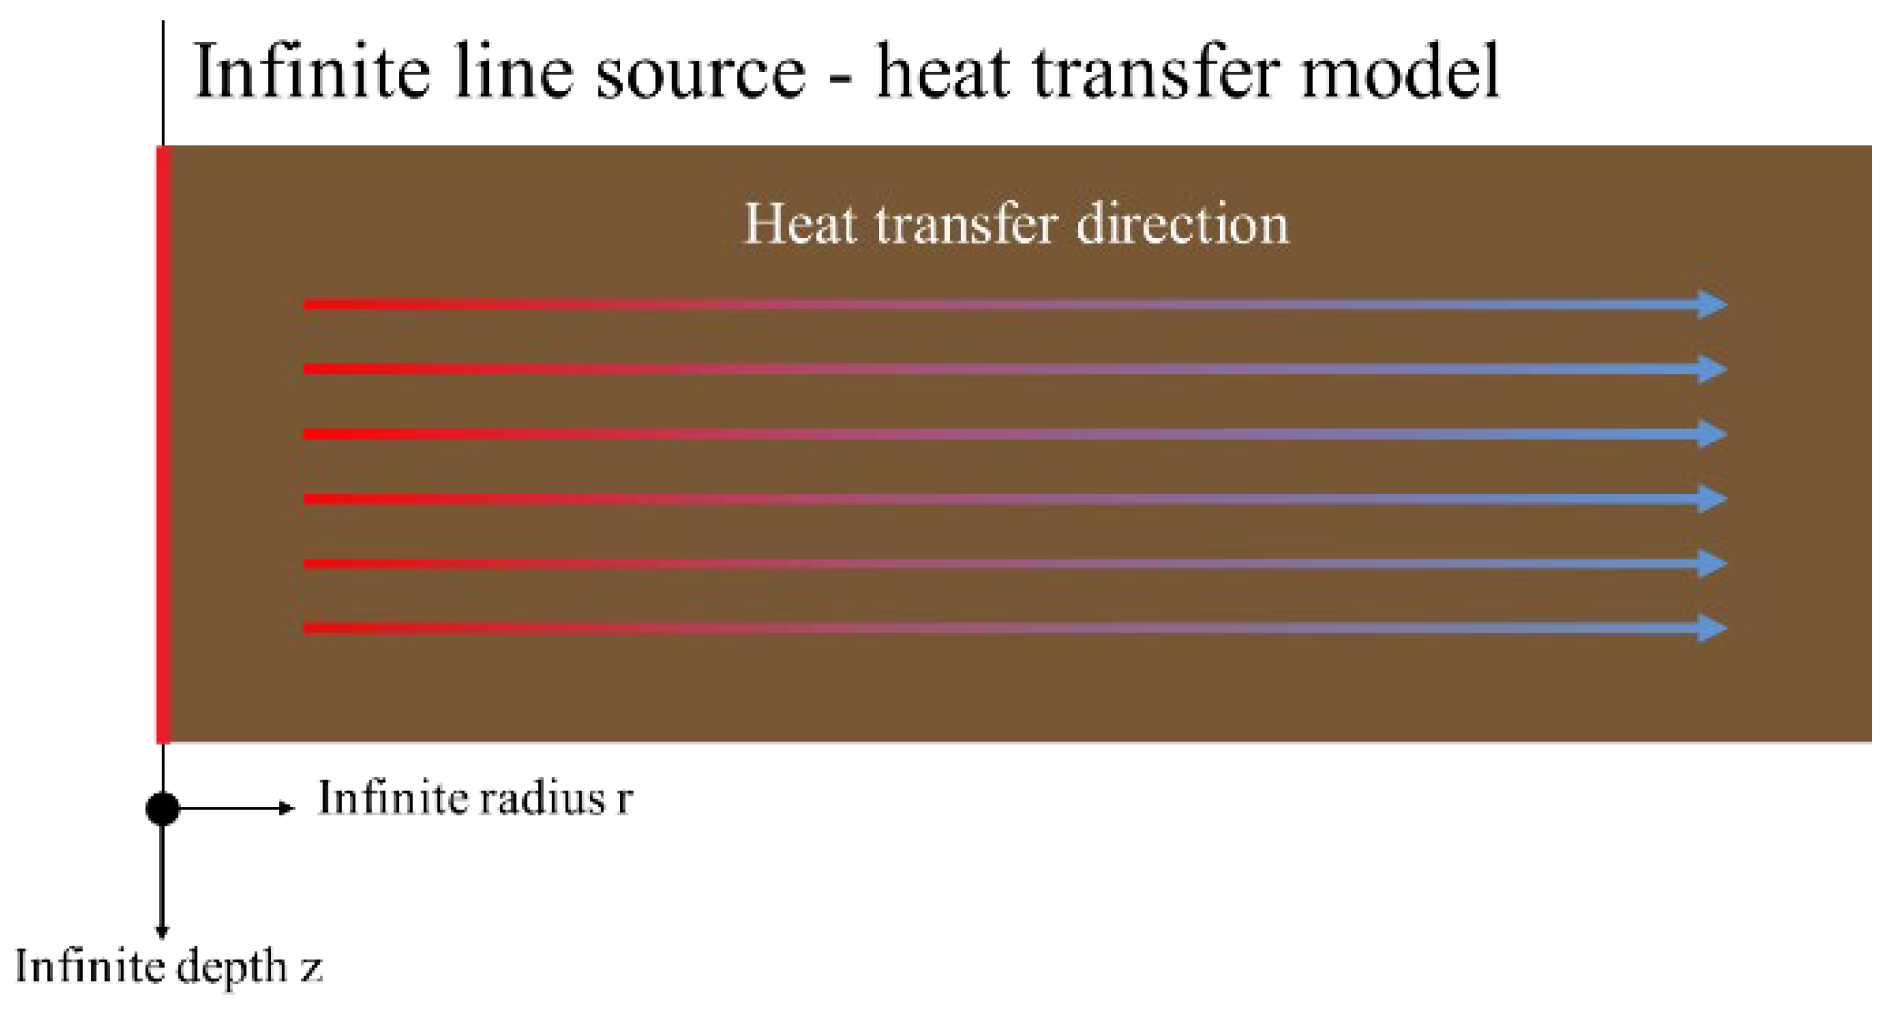
The Infinite Line Source (ILS) model is the simplest model for analyzing heat transfer in the ground, assuming an infinite length, uniform temperature heat source.
Figure 4 illustrates the ILS assumption. This model is suitable for short-term analysis, ranging from hours to days, and for initial design estimates. The model relies on a time-dependent solution based on pure conduction heat transfer, assuming continuous and spontaneous heat generation from time zero. This concept, often referred to as the Kelvin line source theory, is attributed to the work of Lord Kelvin [
31,
32].
Over the years, the ILS model has been further developed and widely applied in academic research [
33,
34,
35]. A significant contribution by Carslaw and Jaeger [
33] is the introduction of a simplified equation for the soil temperature distribution,
, at any radius (
) over time (
). This equation, often referred to as the G-function (
) [
14], is used to predict changes in soil temperature (Equation (5)) and the mean temperature of the heat transfer fluid,
, within a heat exchanger (Equation (6)).
where,
is the ambient ground temperature,
is the heat load (W/m),
is the effective thermal conductivity of the ground (W/(m·K)),
is the thermal diffusivity of the ground (m²/s),
is the radial distance from the line source (m), and
is the Euler constant (0. 5772).
2.5.3. The Cylindrical Source (CS) Model
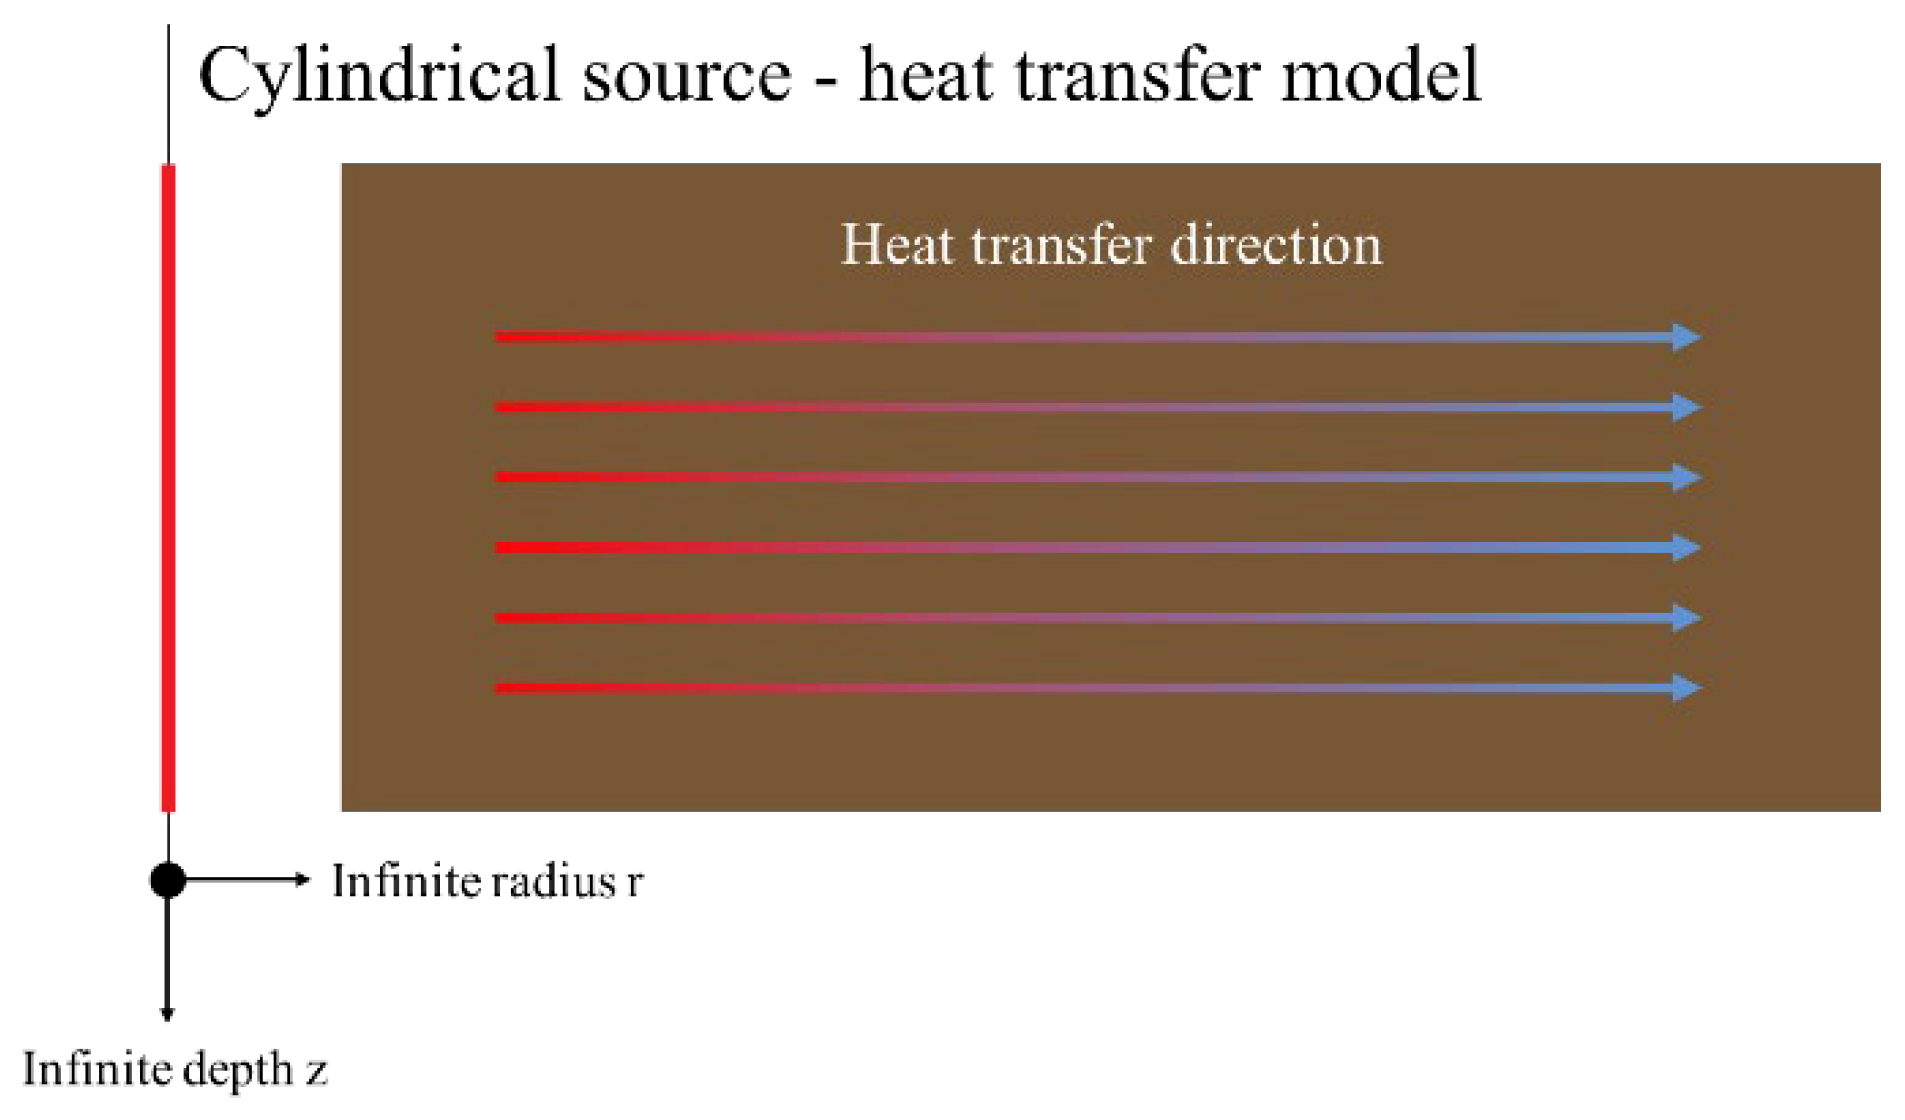
The Cylindrical Source (CS) model is shown in
Figure 5 and represents an infinitely long cylindrical heat source, such as a heat exchanger or energy pile. This model accounts for the thermal capacity of both the energy piles and the surrounding ground, assuming a constant heat flux or temperature along their outer surface. The CS model is suitable for medium-term analysis, spanning weeks to months, to predict changes in ground temperature. The simplified form of the G-function used to calculate the soil temperature is given in Equation (7), while the mean temperature of the heat transfer fluid,
, within the heat exchanger is calculated using Equation (8).
where,
is the ambient ground temperature,
is the heat load (W/m),
is the effective thermal conductivity of the ground (W/(m·K)), α is the thermal diffusivity of the ground (m²/s),
is the radial distance from the source (m), and
is the Euler constant (0.5772).
2.5.4. The Finite Line Source (FLS) Model
The Finite Line Source (FLS) Model addresses the limitations of conventional heat transfer models by incorporating two-dimensional heat transfer effects. Li et al. (2015) [
36] demonstrated the impact of long-term temperature variations on ground surfaces, aiming to more accurately replicate real-world conditions. The FLS model is recommended when a more precise determination of ground heat transfer is required for design periods exceeding one year. It represents the borehole as a finite line source, accounting for axial heat transfer along the borehole’s length, and is suitable for long-term analysis over months to years. The FLS model also captures thermal interactions between multiple boreholes.
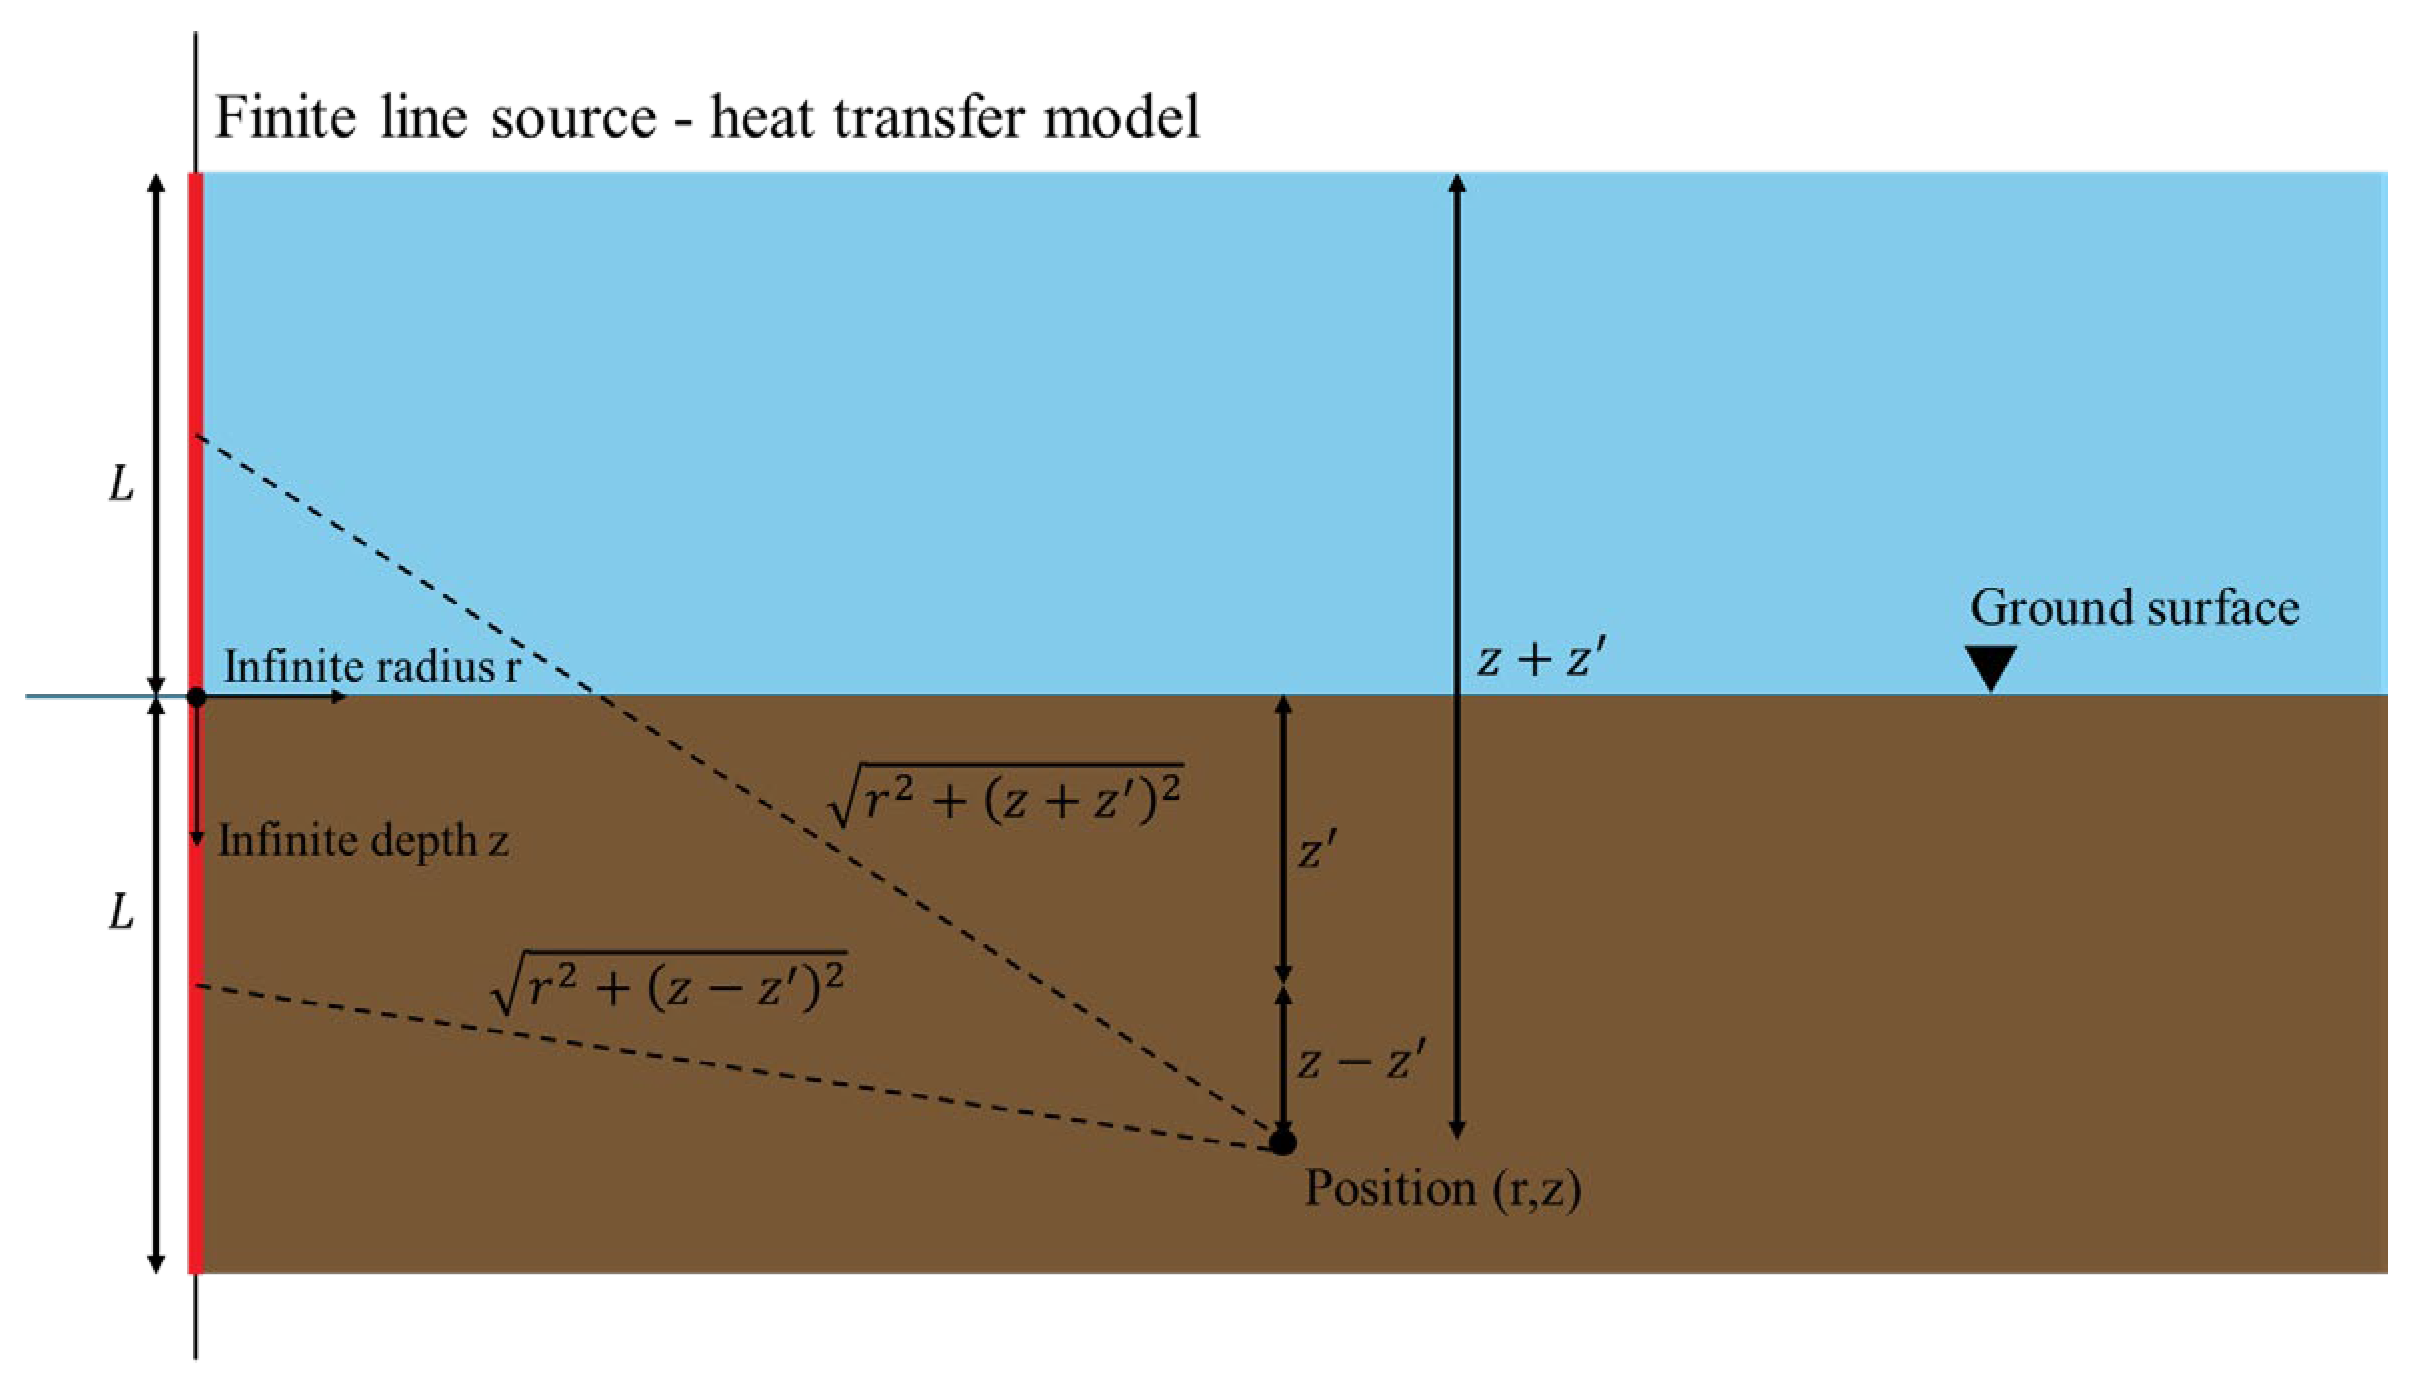
Figure 6 shows the schematic of the finite line source heat transfer model.
In this model, the temperature above the ground surface is treated as a reflection plane of the heat source. Beauchamp et al. (2007) [
37] and Claesson and Javed (2012) [
38] further refined the FLS model, deriving a G-function to compute the ground temperature over time, as defined by Equation (9).
where,
is the radial distance from the line source (m),
and
are depth coordinates (m),
is the effective ground thermal conductivity (W/(m·K)),
is the ground’s thermal diffusivity (m²/s),
is time, and
is the complementary error function, defined by Equation (10).
The heat source of finite length, , dissipates heat into the surrounding ground. The advantage of this model is that it considers the effect of changing air temperatures by assuming the ground surface as a reflection plane.
3. Performance-Based Design of Energy Piles
3.1. Roles and Responsibilities of the Designer
The design of energy piles requires a collaborative approach that integrates geotechnical, structural, and mechanical engineering disciplines to achieve a sustainable combination of structural pile functions with geothermal energy systems. The roles and responsibilities of energy pile designers are comprehensively outlined in the “Thermal Pile Design, Installation & Materials Standards” [
39] and further summarized in
Figure 7.
The first step in the design of energy piles is the design of the HVAC system, which is primarily the responsibility of the mechanical engineer. Cooling requirements are determined based on the building’s thermal load, which takes into account factors such as equipment type, system configuration (e.g., stand-alone or hybrid energy pile systems), and operating schedule. The HVAC design must ensure seamless integration with the GSHP system, with the goal of transferring the calculated thermal load requirements to the GSHP designer.
The design of the GSHP system can be performed by either geotechnical or mechanical engineers. Key considerations include selecting materials for GSHP components with appropriate thermal properties, such as concrete, soil, and heat transfer fluids. Important decisions also involve practical design details, such as the number and length of piles required to meet the HVAC team’s thermal load specifications, the heat exchanger configuration (e.g., U-tube, spiral), the physical size of the heat exchanger, the flow rate of the heat transfer fluid, and the operating temperature limits to prevent thermal saturation of the soil. These parameters are determined based on both short-term and long-term soil temperature and pile-soil interface conditions. In addition, feedback on the GSHP operating schedule may need to be communicated back to the HVAC design team. Integration of the GSHP design with HVAC systems and pile foundations is a critical aspect that requires coordination and agreement among all parties involved.
Pile foundation design is the responsibility of geotechnical and structural engineers. In addition to ensuring that the piles have sufficient skin friction and end bearing capacity to support the structural loads, the design must also account for cyclic, thermally induced stresses and strains that can affect the bearing capacity over time. The choice of pile type (e.g., precast or drilled) should be based on site conditions and the physical and thermal requirements of the GSHP system. Other specifications, such as the space available within the steel reinforcement, must be coordinated with the heat exchanger design to avoid conflicts and ensure smooth integration.
3.2. Design Factors Affecting Energy Pile Thermal Performance
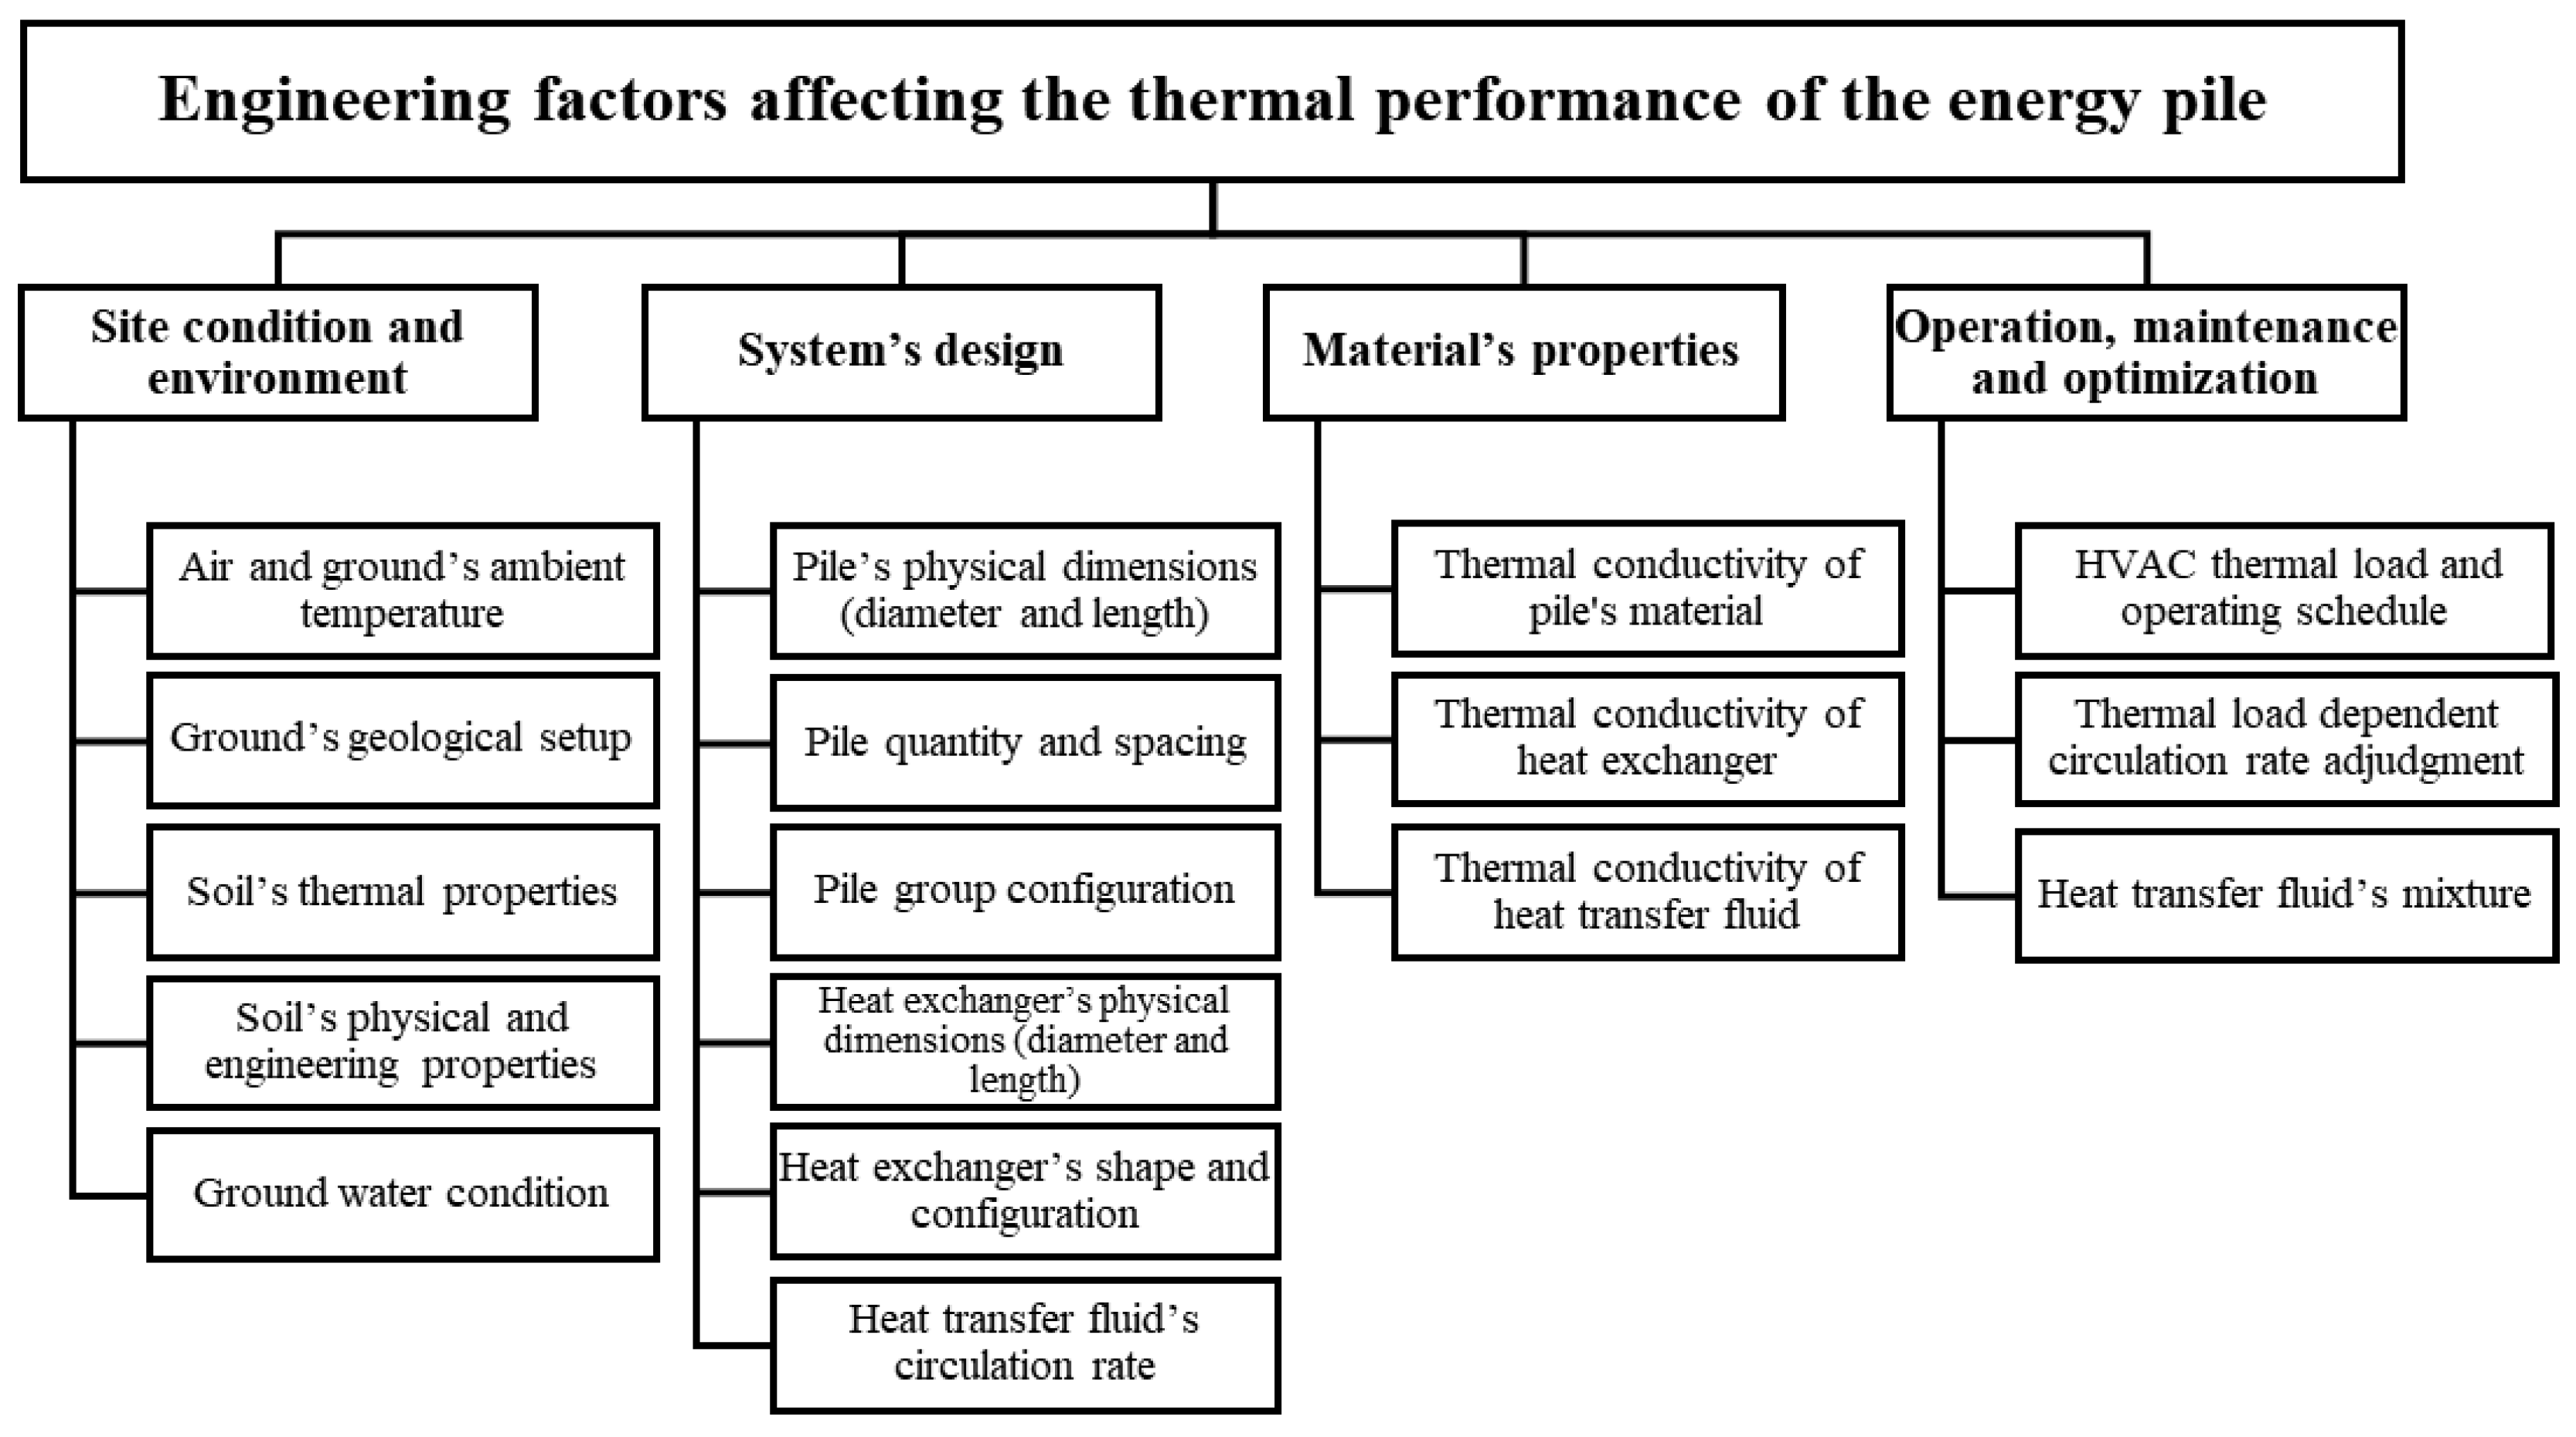
The performance and efficiency of energy piles and the GSHP system are influenced by a combination of physical and engineering factors, which can be broadly categorized into four main areas, as summarized in
Figure 8.
- (1)
Site Conditions: The thermal performance of energy piles is significantly affected by site-specific conditions, including air and ground temperatures, which fluctuate seasonally and set the thermal boundaries for the system. The unique geological characteristics of a site, such as soil layering and hydrogeological properties, play a crucial role. For example, sandy soils typically have higher thermal conductivity than clayey soils, enhancing heat transfer efficiency. Groundwater flow, depending on its rate and direction, can either enhance or impede heat exchange. A thorough understanding of these conditions is essential for accurate thermal response testing and optimizing energy pile design to match site-specific characteristics.
- (2)
Energy Pile Design: The structural design of energy piles, including the shape, size, and dimensions of the pile and the heat exchanger, affects the heat transfer process. Longer piles interact with a larger volume of soil, improving heat exchange capacity, while the pile diameter determines the available surface area for heat transfer. The quantity and configuration of heat exchange pipes within the pile (e.g., U-tube, double U-tube, or helical coil) also influence thermal efficiency. Simulation models are used to determine optimal pile dimensions and heat exchanger layouts, balancing thermal performance with structural requirements and cost.
- (3)
Materials Used in Energy Piles: The thermal performance of energy piles depends on the materials used, particularly the concrete and the embedded heat exchanger pipes. Concrete with high thermal conductivity improves heat transfer between the pile and the surrounding soil. Heat exchanger pipes are typically made of high-density polyethylene (HDPE) due to its flexibility, durability, and resistance to thermal and mechanical stress.
- (4)
Operation, Maintenance, and Optimization: Routine monitoring and maintenance of the system are crucial for detecting potential issues early, such as thermal imbalances or reduced heat transfer rates. Maintenance practices, such as flushing pipe circuits and ensuring proper functioning of heat pumps, help prevent efficiency losses. Optimization involves adjusting operational parameters like flow rates, temperature setpoints, and load balancing to ensure the system operates efficiently. Effective operational strategies can predict demand patterns and dynamically adjust system settings to maximize efficiency.
3.3. Heat Transfer Fluid Circulation Velocity
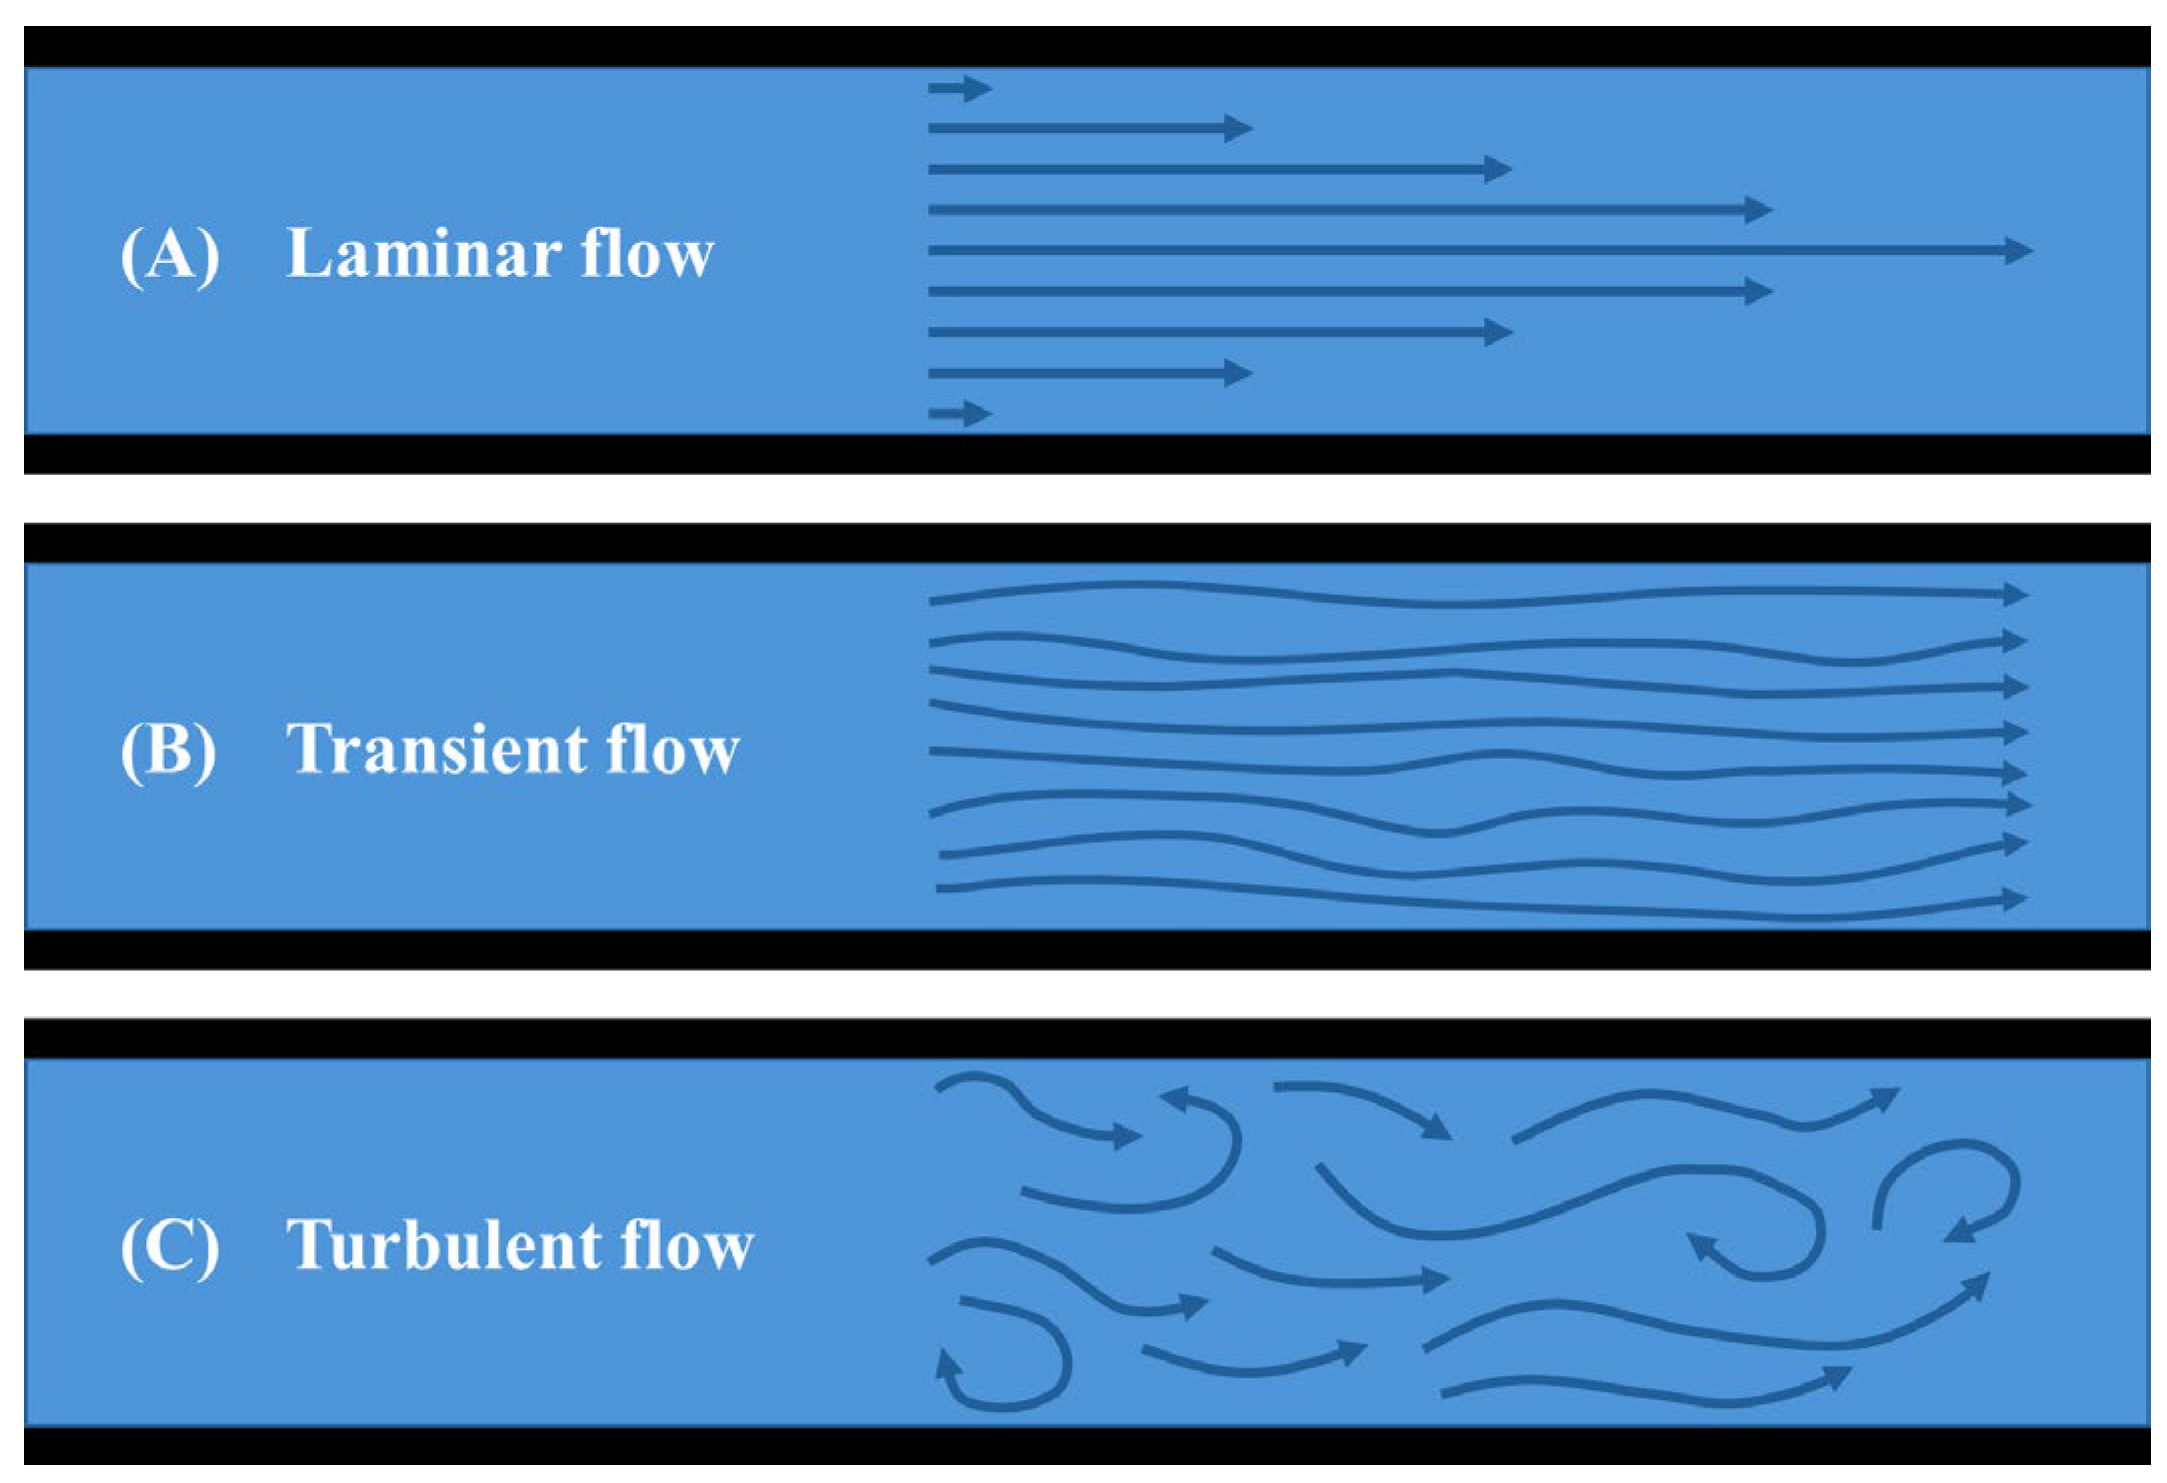
The flow characteristics of the heat transfer fluid in a heat exchanger tube can be classified as laminar, transitional, or turbulent, depending on the Reynolds number (
).
Figure 9 illustrates the flow path of the heat transfer fluid: Laminar flow is smooth and streamlined with parallel layers and typically occurs when
is less than 2300. Transitional flow, which has both laminar and turbulent characteristics, occurs when
is between 2300 and 3500. Turbulent flow, characterized by chaotic and irregular motion with eddies and vortices, occurs when
exceeds 3500.
It is well known that turbulent flow improves heat transfer more effectively than transitional or laminar flow. Turbulent flow increases mixing and induces significant fluctuations in fluid direction and velocity, which improves heat transfer between the fluid and the pipe walls, reduces the risk of particle deposition and fouling, and maintains system longevity. Laminar flow, on the other hand, is less effective for heat transfer, especially near the heat exchanger tube surface where the flow velocity is reduced to zero due to frictional resistance as described by the Moody (or Darcy) friction factor along the tube surface.
In energy pile design, the circulation rate of the heat transfer fluid is often referred to as the mean fluid velocity,
[
14], which can be calculated using Equation (11). This equation defines the mass flow rate,
, through the constant volume of the heat exchanger,
. During the design process, this value may be refined in the detailed design phase based on feedback from computer simulations or operational optimization processes.
where,
is the design Reynolds number (greater than 3500),
is the inside diameter of the heat exchanger,
is the dynamic viscosity of the heat transfer fluid,
is the density of the heat transfer fluid, and
is the cross-sectional area of the tube.
3.4. Heat Exchanger Shape Configuration
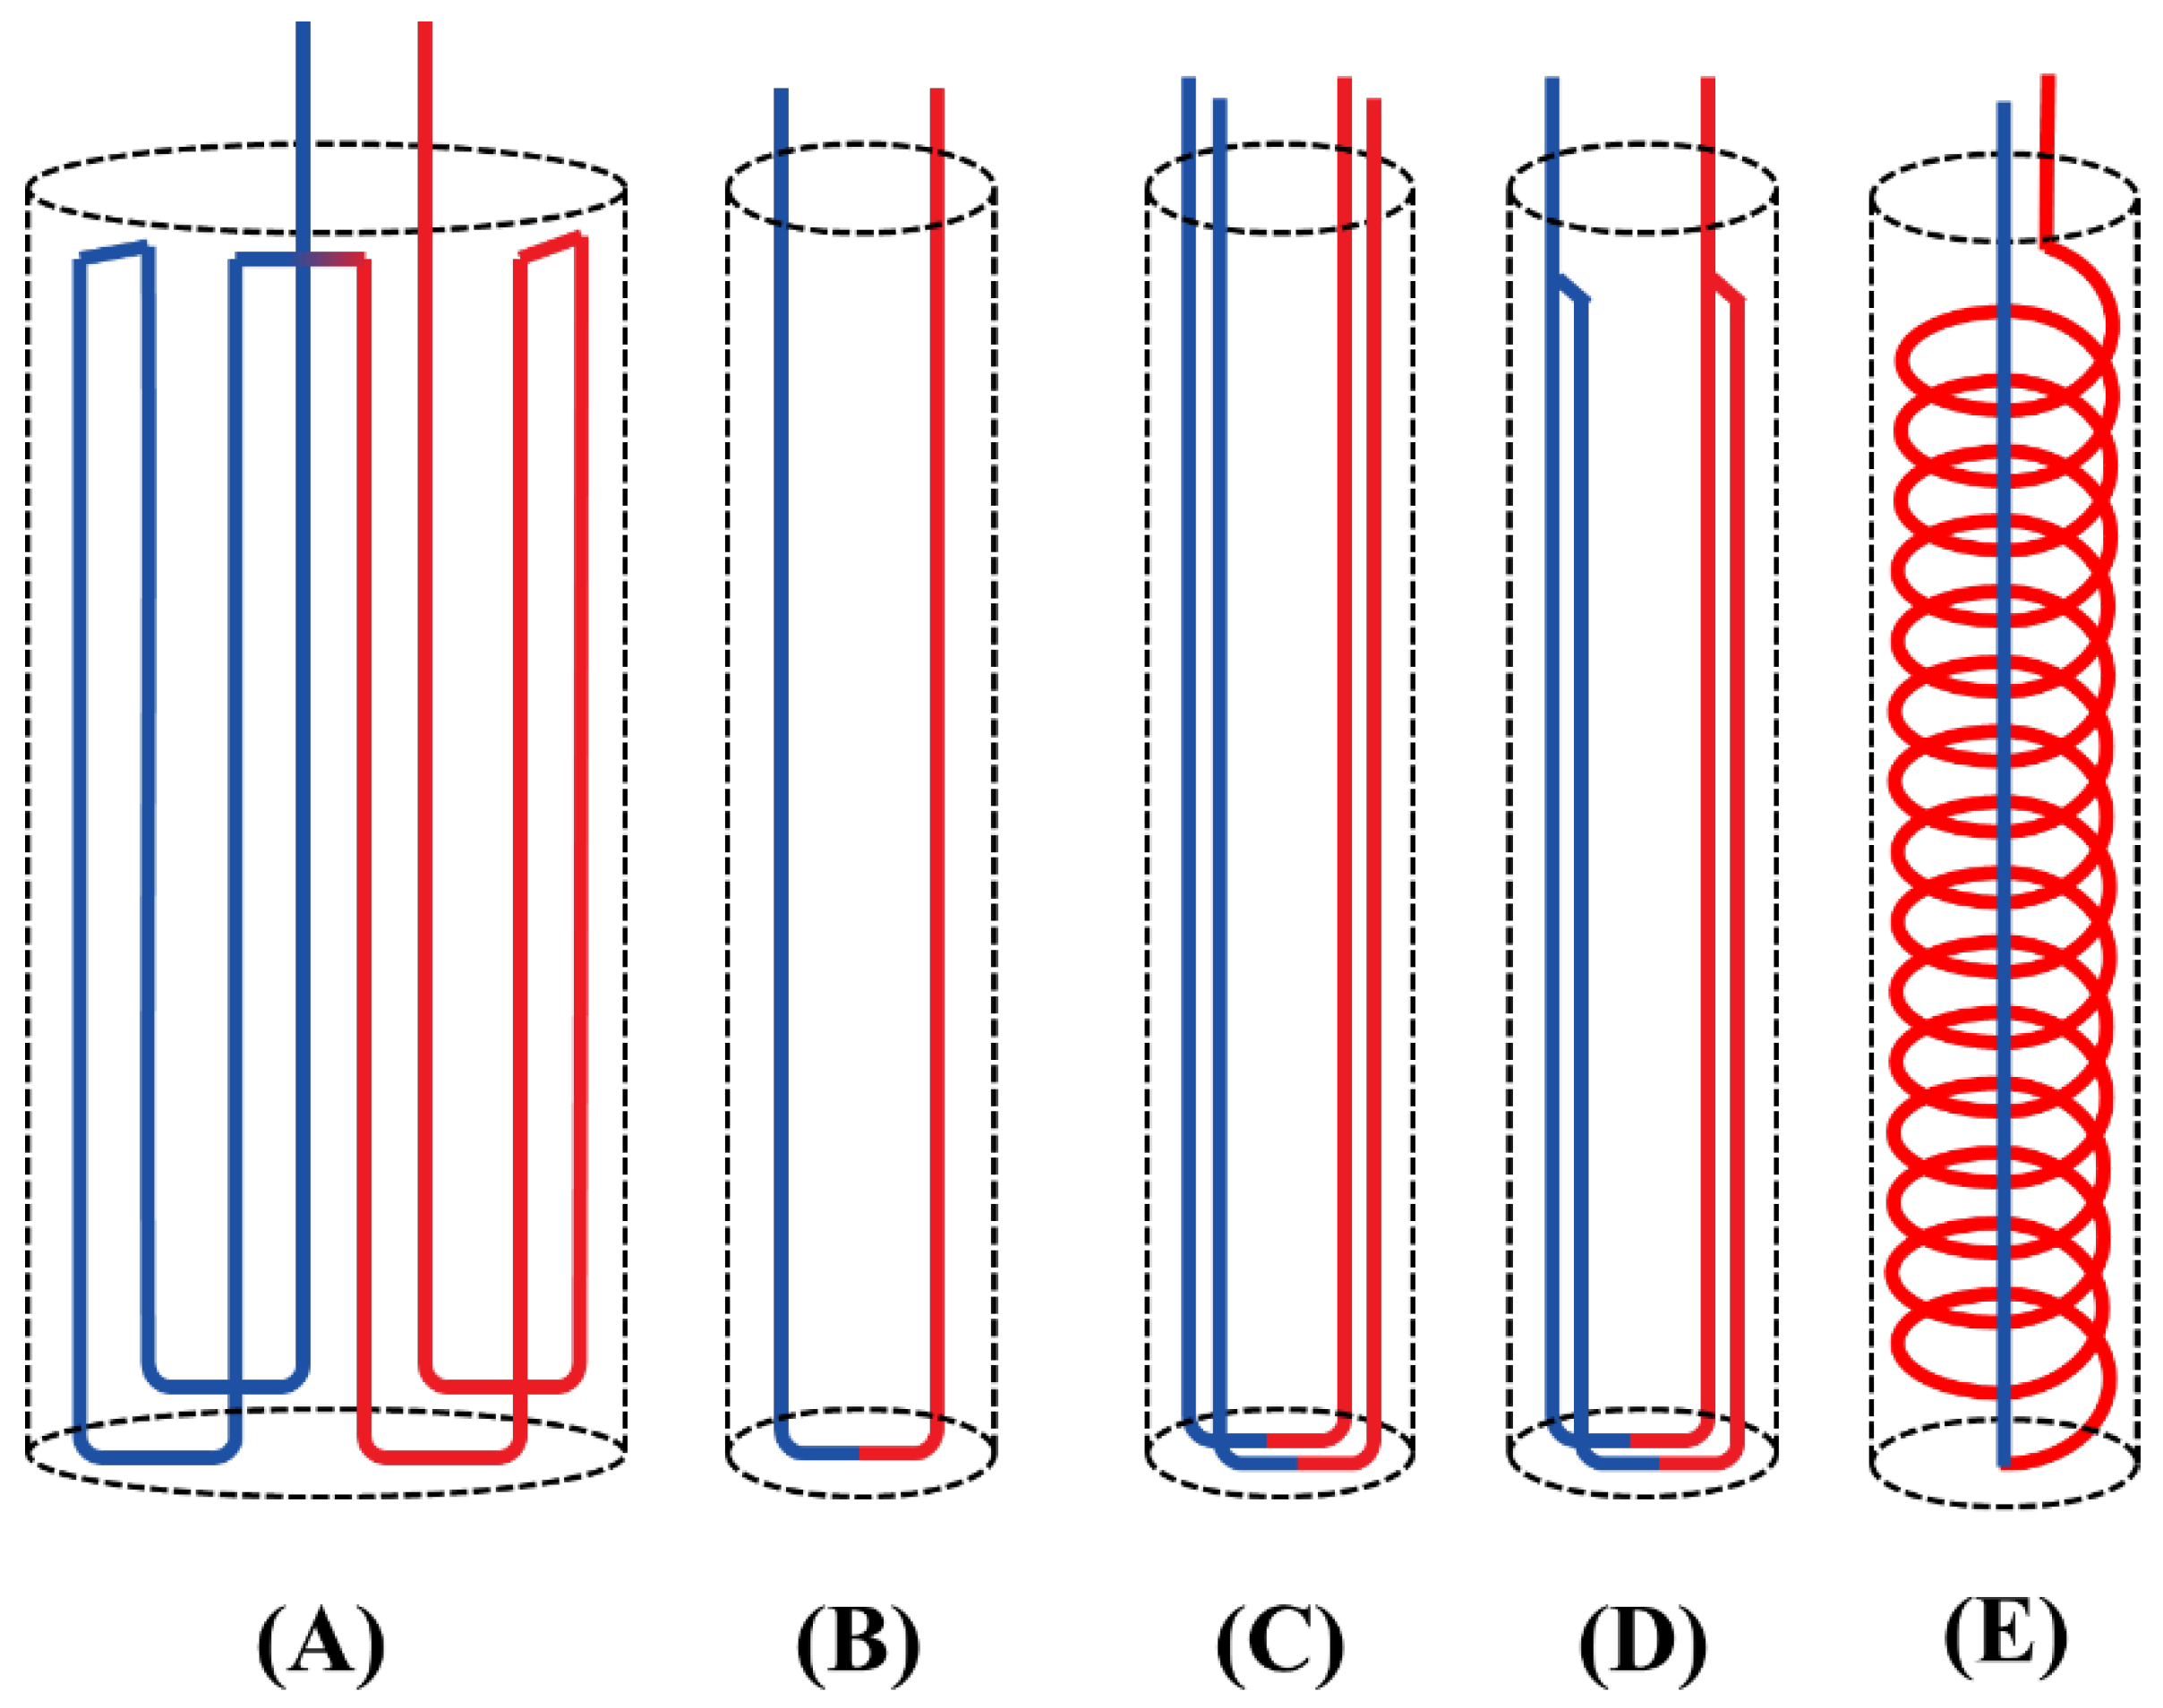
Various heat exchanger configurations are used in energy geo-structures, particularly energy piles, including multiple bends for large bore piles, single U-tube, double U-tube, parallel double U-tube, and spiral heat exchanger configurations, as shown in
Figure 10. The selection of a heat exchanger arrangement in design and construction is influenced by several factors:
- (1)
Performance Efficiency: The configuration should provide sufficient surface area and an optimal flow arrangement for the heat transfer fluid to maximize the temperature difference and overall efficiency of the energy piles.
- (2)
Construction and Engineering Constraints: Practical considerations, such as space limitations within the piles, often dictate the final design. For example, single U-tube heat exchangers may be chosen over spiral configurations, despite their higher heat transfer potential, due to installation difficulties, especially in small diameter piles. Multi-U configurations are typically used for large diameter piles.
- (3)
Operation and maintenance requirements: The design should consider the temperature ranges, pressure levels, and flow rates required for effective operation and maintenance. For example, shell-and-tube heat exchangers are preferred for high-pressure applications because of their rugged construction, while plate heat exchangers are preferred because of their ease of disassembly and cleaning.
These factors also affect the material and labor costs associated with installation, operation, and maintenance.
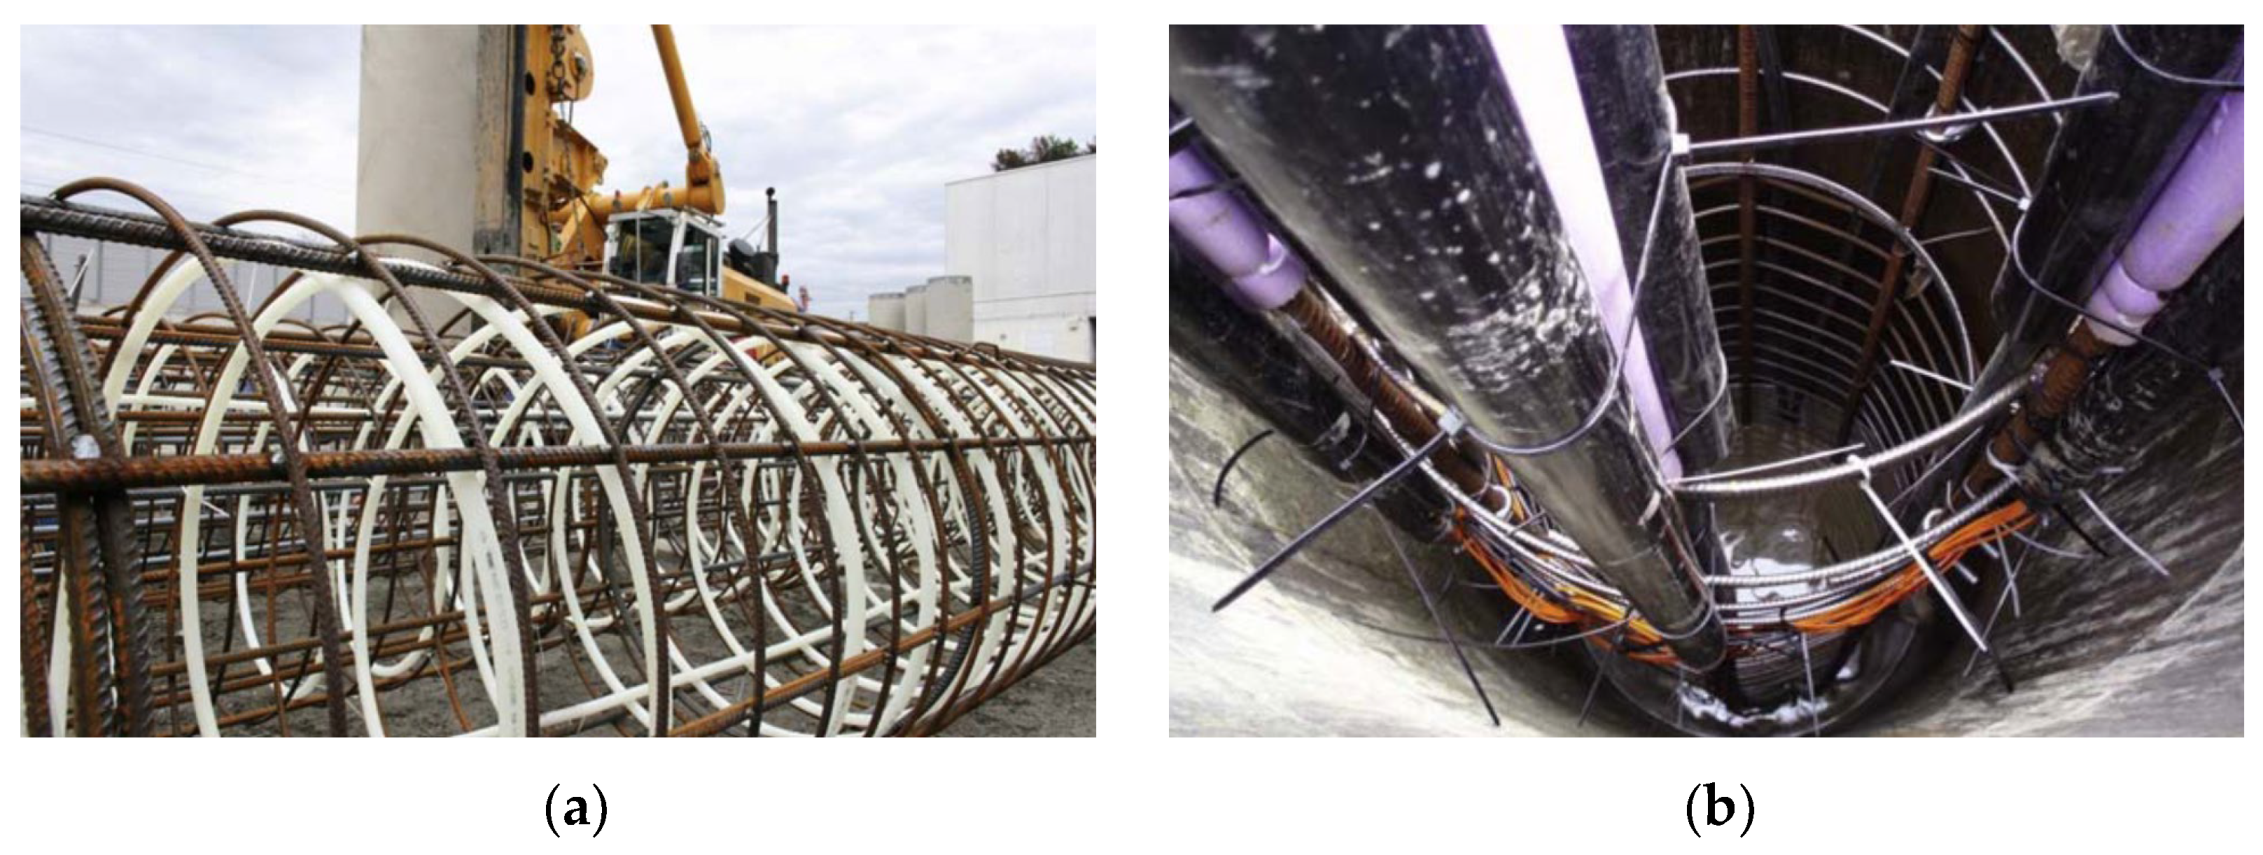
Figure 11 illustrates the practical implementation of cylindrical (a) and multiple U-tube (b) assemblies integrated with rebar within an energy bore pile at a construction site. This visual illustration highlights the arrangement of heat exchanger tubes and the space constraints and engineering considerations that influence the design.
3.5. Interconnection of Individual Energy Piles
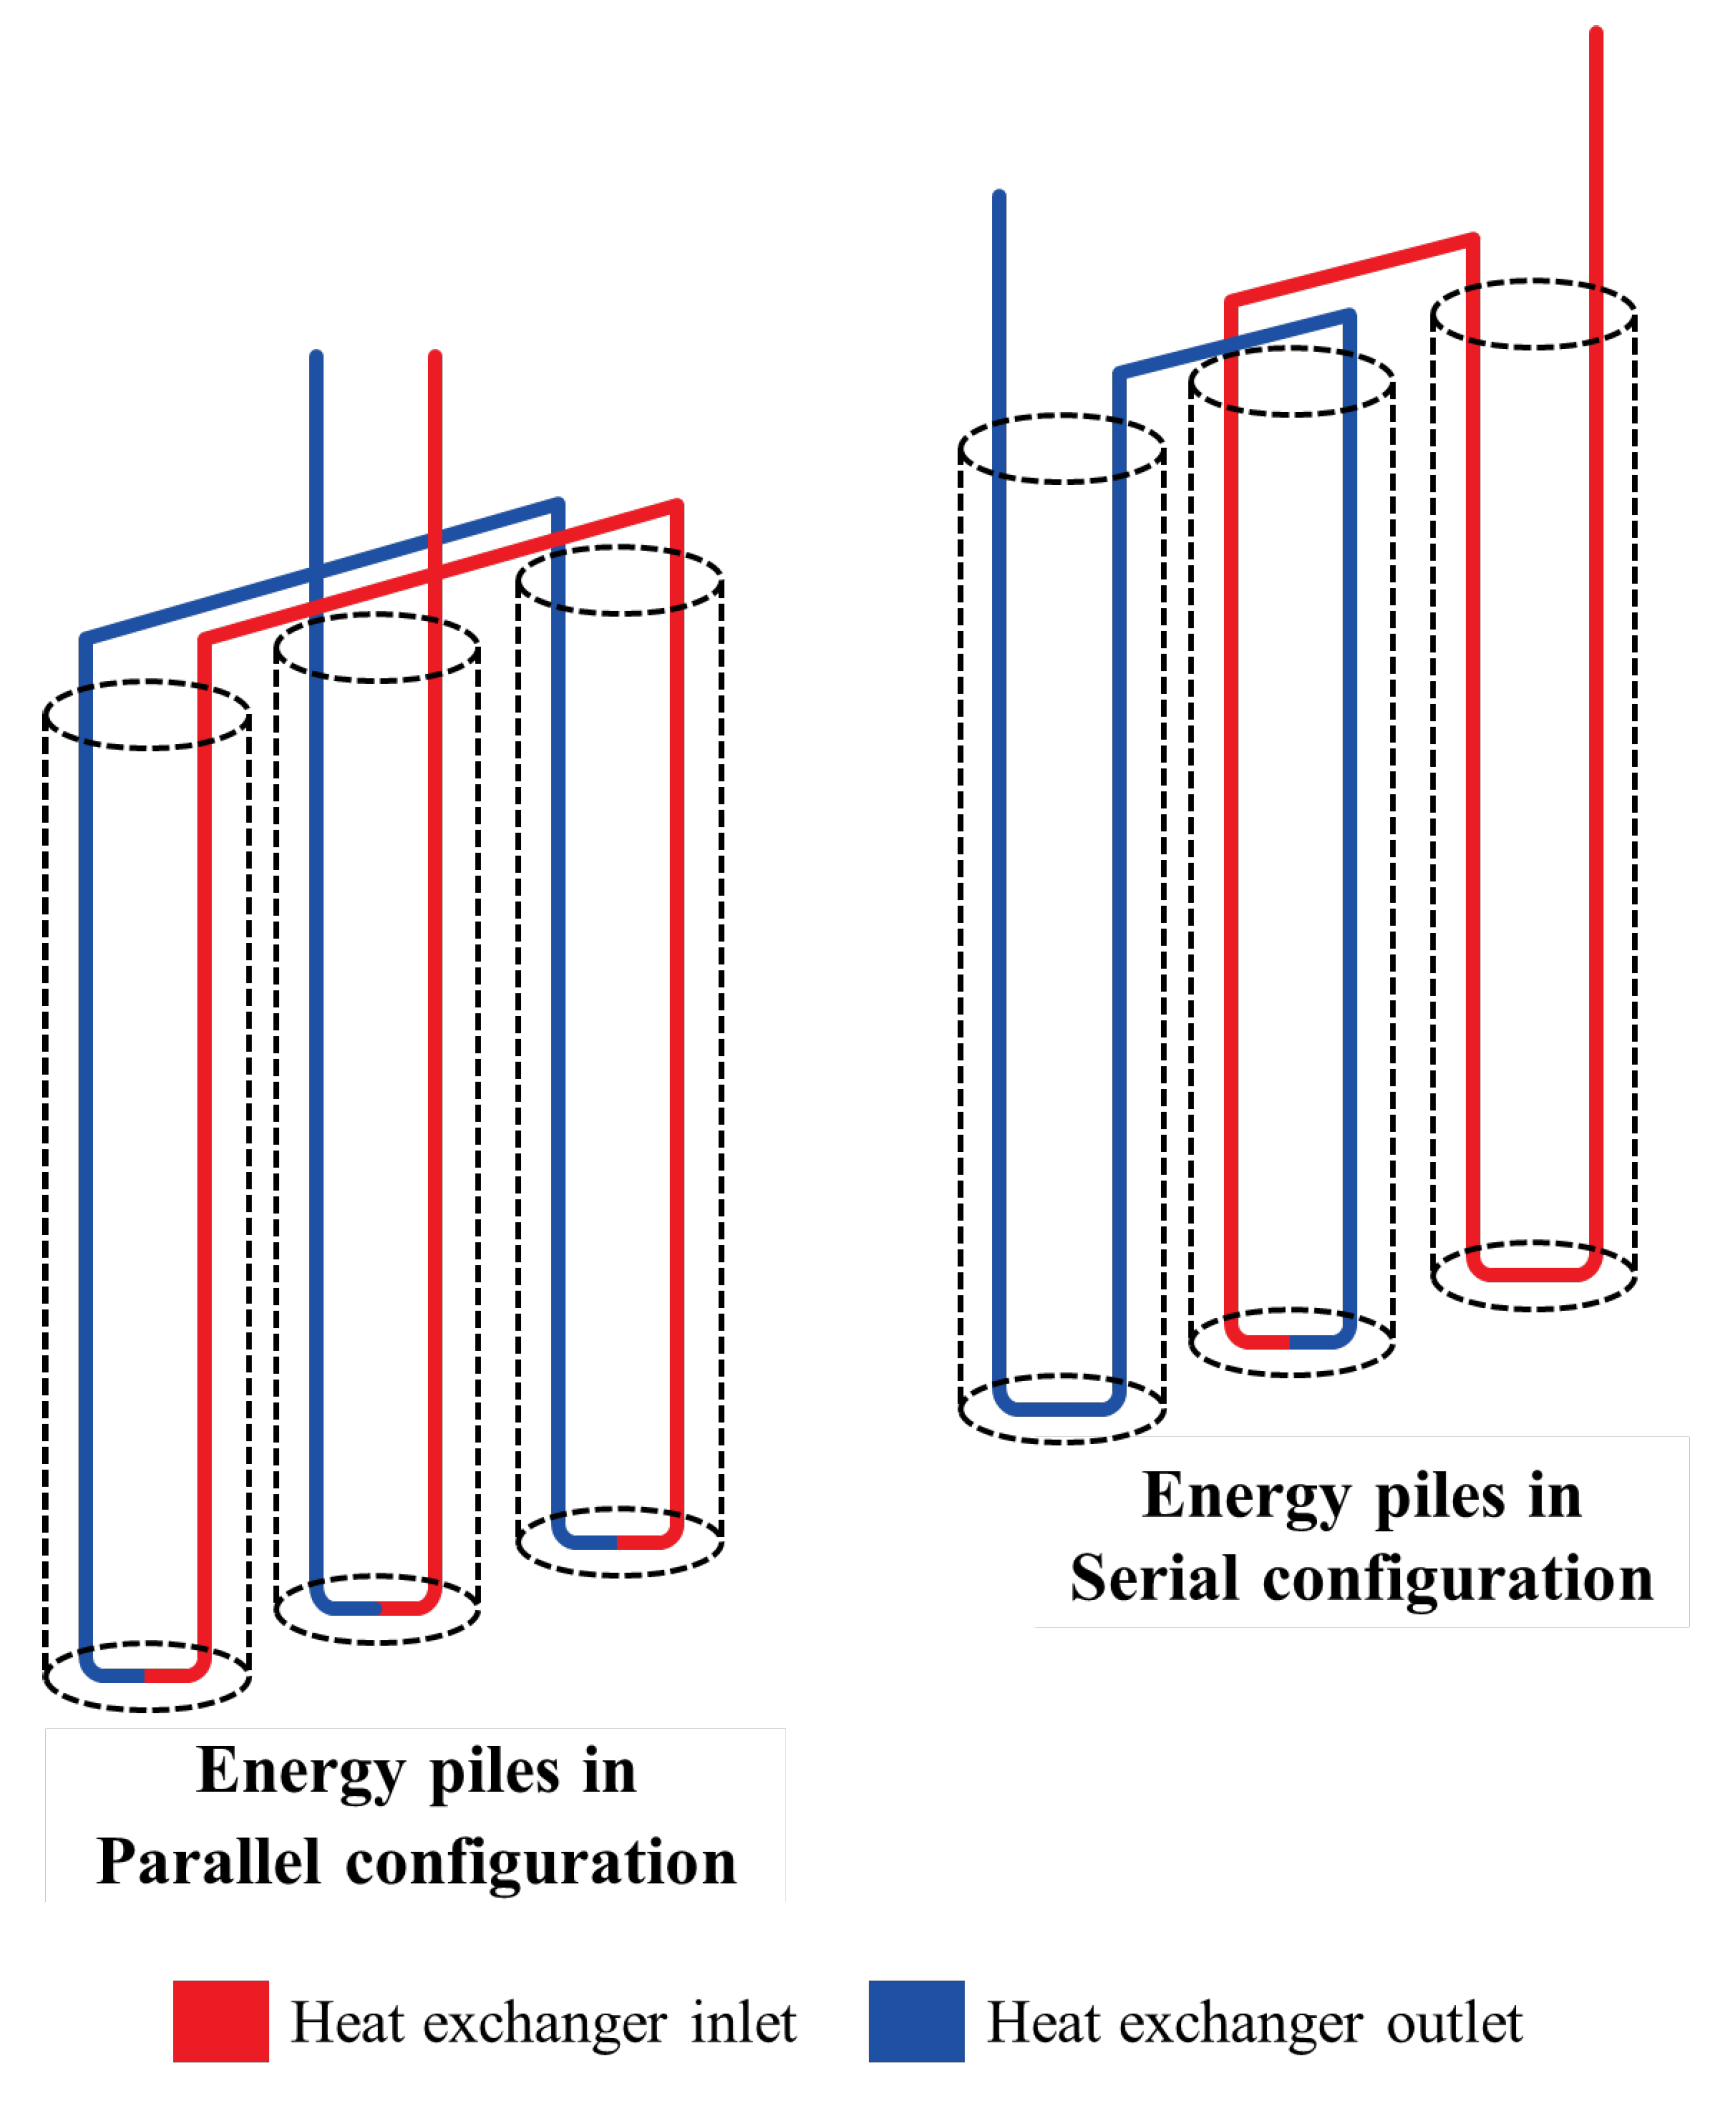
Energy piles, which act as structural foundations and ground heat exchangers, can be connected in series or parallel configurations as shown in
Figure 12.
In a “series configuration”, the energy piles are connected sequentially, with the heat transfer fluid flowing through one pile before entering the next. This configuration generally provides higher power and efficiency than parallel connections [
40]. The primary advantage of a series configuration is the greater temperature difference between the inlet and outlet, which improves heat transfer rates. However, this configuration can also result in a higher pressure drop across the system, requiring increased pumping capacity [
41].
In contrast, a “parallel configuration” distributes the heat transfer fluid evenly across multiple energy piles, typically resulting in lower pressure drops and reduced pumping energy requirements. This configuration also simplifies system expansion and maintenance because individual piles can be isolated without affecting the entire system. However, parallel connections can result in uneven flow distribution and potentially lower overall heat transfer efficiency compared to series configurations [
40].
The choice between series and parallel configurations depends on project-specific criteria such as the number of energy piles, design temperature differentials, and circulating pump power and capacity. A “hybrid approach” is sometimes recommended to optimize system performance [
41]. Ultimately, it is advisable to use thermal performance simulations to determine the final configuration-whether series, parallel, or hybrid-based on achieving optimal heat exchanger performance. In addition, site conditions, cooling capacity requirements, and construction and operating costs should be considered to ensure an effective and efficient energy pile system design.
3.6. Shank Space Configuration
The term “shank space” [
14,
15] refers to the center-to-center distance between two vertical heat exchangers embedded in a geothermal structure, such as a pile, foundation, or retaining wall. This fundamental design parameter can significantly affect the thermal performance of the system.
Figure 13 illustrates the phenomenon known as “thermal short-circuiting” [
42], which occurs when there is insufficient spacing in the design or implementation of GSHP heat exchangers. In such cases, thermal energy is transferred between the higher-temperature inlet of the heat exchanger and the medium-temperature outlet. This results in a smaller temperature difference between the inlet and outlet, which leads to less effective heat transfer due to a reduced heat flux driven by temperature differences. According to Newton’s Law of Cooling and the second law of thermodynamics, heat always flows from higher to lower temperatures, and the magnitude of this heat flow (heat flux) is directly proportional to the temperature difference.
Vella et al. (2020) [
43] investigated the effect of shank spacing on the performance of shallow U-tube ground heat exchangers using computational fluid dynamics (CFD) simulations in ANSYS FLUENT 16.2. They modeled two vertical U-tube heat exchangers at depths of 20 and 40 m, with the internal diameter of the heat exchanger set at 0.036 m. The initial temperature of the heat transfer fluid was set at 40 °C and circulated at a rate of 10 l/min. The shaft distance was varied at 40, 95, 150, 205, and 260 mm for both scenarios. The simulation results showed a non-linear relationship between increasing shank spacing and improved heat transfer and dissipation performance. Specifically, increasing the shank spacing from 40 mm to 95 mm resulted in significant performance improvements of 7.90% and 4.20% for the 20 m and 40 m U-tube heat exchangers, respectively.
The key takeaway from this study for energy pile design is that increasing the shank spacing beyond 150 mm results in only marginal improvements in performance. In addition, the results indicate that the length of the heat exchanger has a more significant effect on the temperature differential than the shank spacing in several scenarios.
3.7. Materials for Piles and Grout
Concrete has long been a fundamental material in conventional pile foundations due to its exceptional strength, durability, and versatility, serving as the primary structural component for stability and load-bearing capacity. More recently, the use of energy piles has emerged, integrating geothermal technology with conventional pile systems. Energy piles, whether cast-in-place drilled piles (shallow or deep) or precast spun concrete or steel pipe piles, require fresh concrete or grout to fill voids and increase the effective thermal conductivity between the embedded heat exchanger, the concrete or steel pile shell, and the surrounding soil. The density of the concrete and grout affects the overall thermal conductivity of the energy pile system.
The American Concrete Institute (ACI) Committee 213 R-03 report [
44] provides data on the thermal conductivity of concrete with densities ranging from 320 to 3200 kg/m3. Thermal conductivity values are typically obtained from specimens tested in the oven-dry state using the guarded hot plate method according to ASTM C 177-19 [
45]. The results indicate that the thermal conductivity of concrete (
) in (W/m·°C) increases exponentially with density (
), as described by Equation (12).
Similarly, Asadi et al. (2018) [
46] reviewed more than 185 experimental datasets and established a relationship between concrete density and thermal conductivity. Their fitted equation, with a
R2 value of 0.81, predicts the thermal conductivity of concrete (
) in (W/m·°C) for densities between 150 and 2350 kg/m³, as shown in Equation (13).
In the context of design, there are no specific guidelines for dealing with thermal conductivity mismatches between piles and soil, but such mismatches can affect heat transfer efficiency. A significant difference in thermal conductivity between the pile or grout material and the surrounding soil can affect system performance. Heat transfer models and thermal resistance theory suggest that the thermal resistance of the soil should be less than that of the pile or grout. Therefore, the thermal conductivity of the pile or grout material should be higher than that of the soil to ensure efficient heat exchange [
47].
From a structural perspective, significant differences in concrete compressive strength, often associated with variations in concrete density, can lead to problems due to varying internal stresses and strains under mechanical and thermal loads. According to ACI 318-19 [
48], it is critical to ensure that the compressive strengths of connected concrete structures do not differ by more than 40% to mitigate these potential problems.
3.8. Thermomechanical Behavior of Energy Piles
Under ideal conditions, the theories of elasticity and thermoelasticity assume reversible mechanical behavior of materials. When a mechanical load, such as a building load, is applied to a pile foundation, stresses and strains are generated within the structure. In addition, thermal loads from heating or cooling during GSHP operation cause the energy piles and surrounding soil to expand or contract.
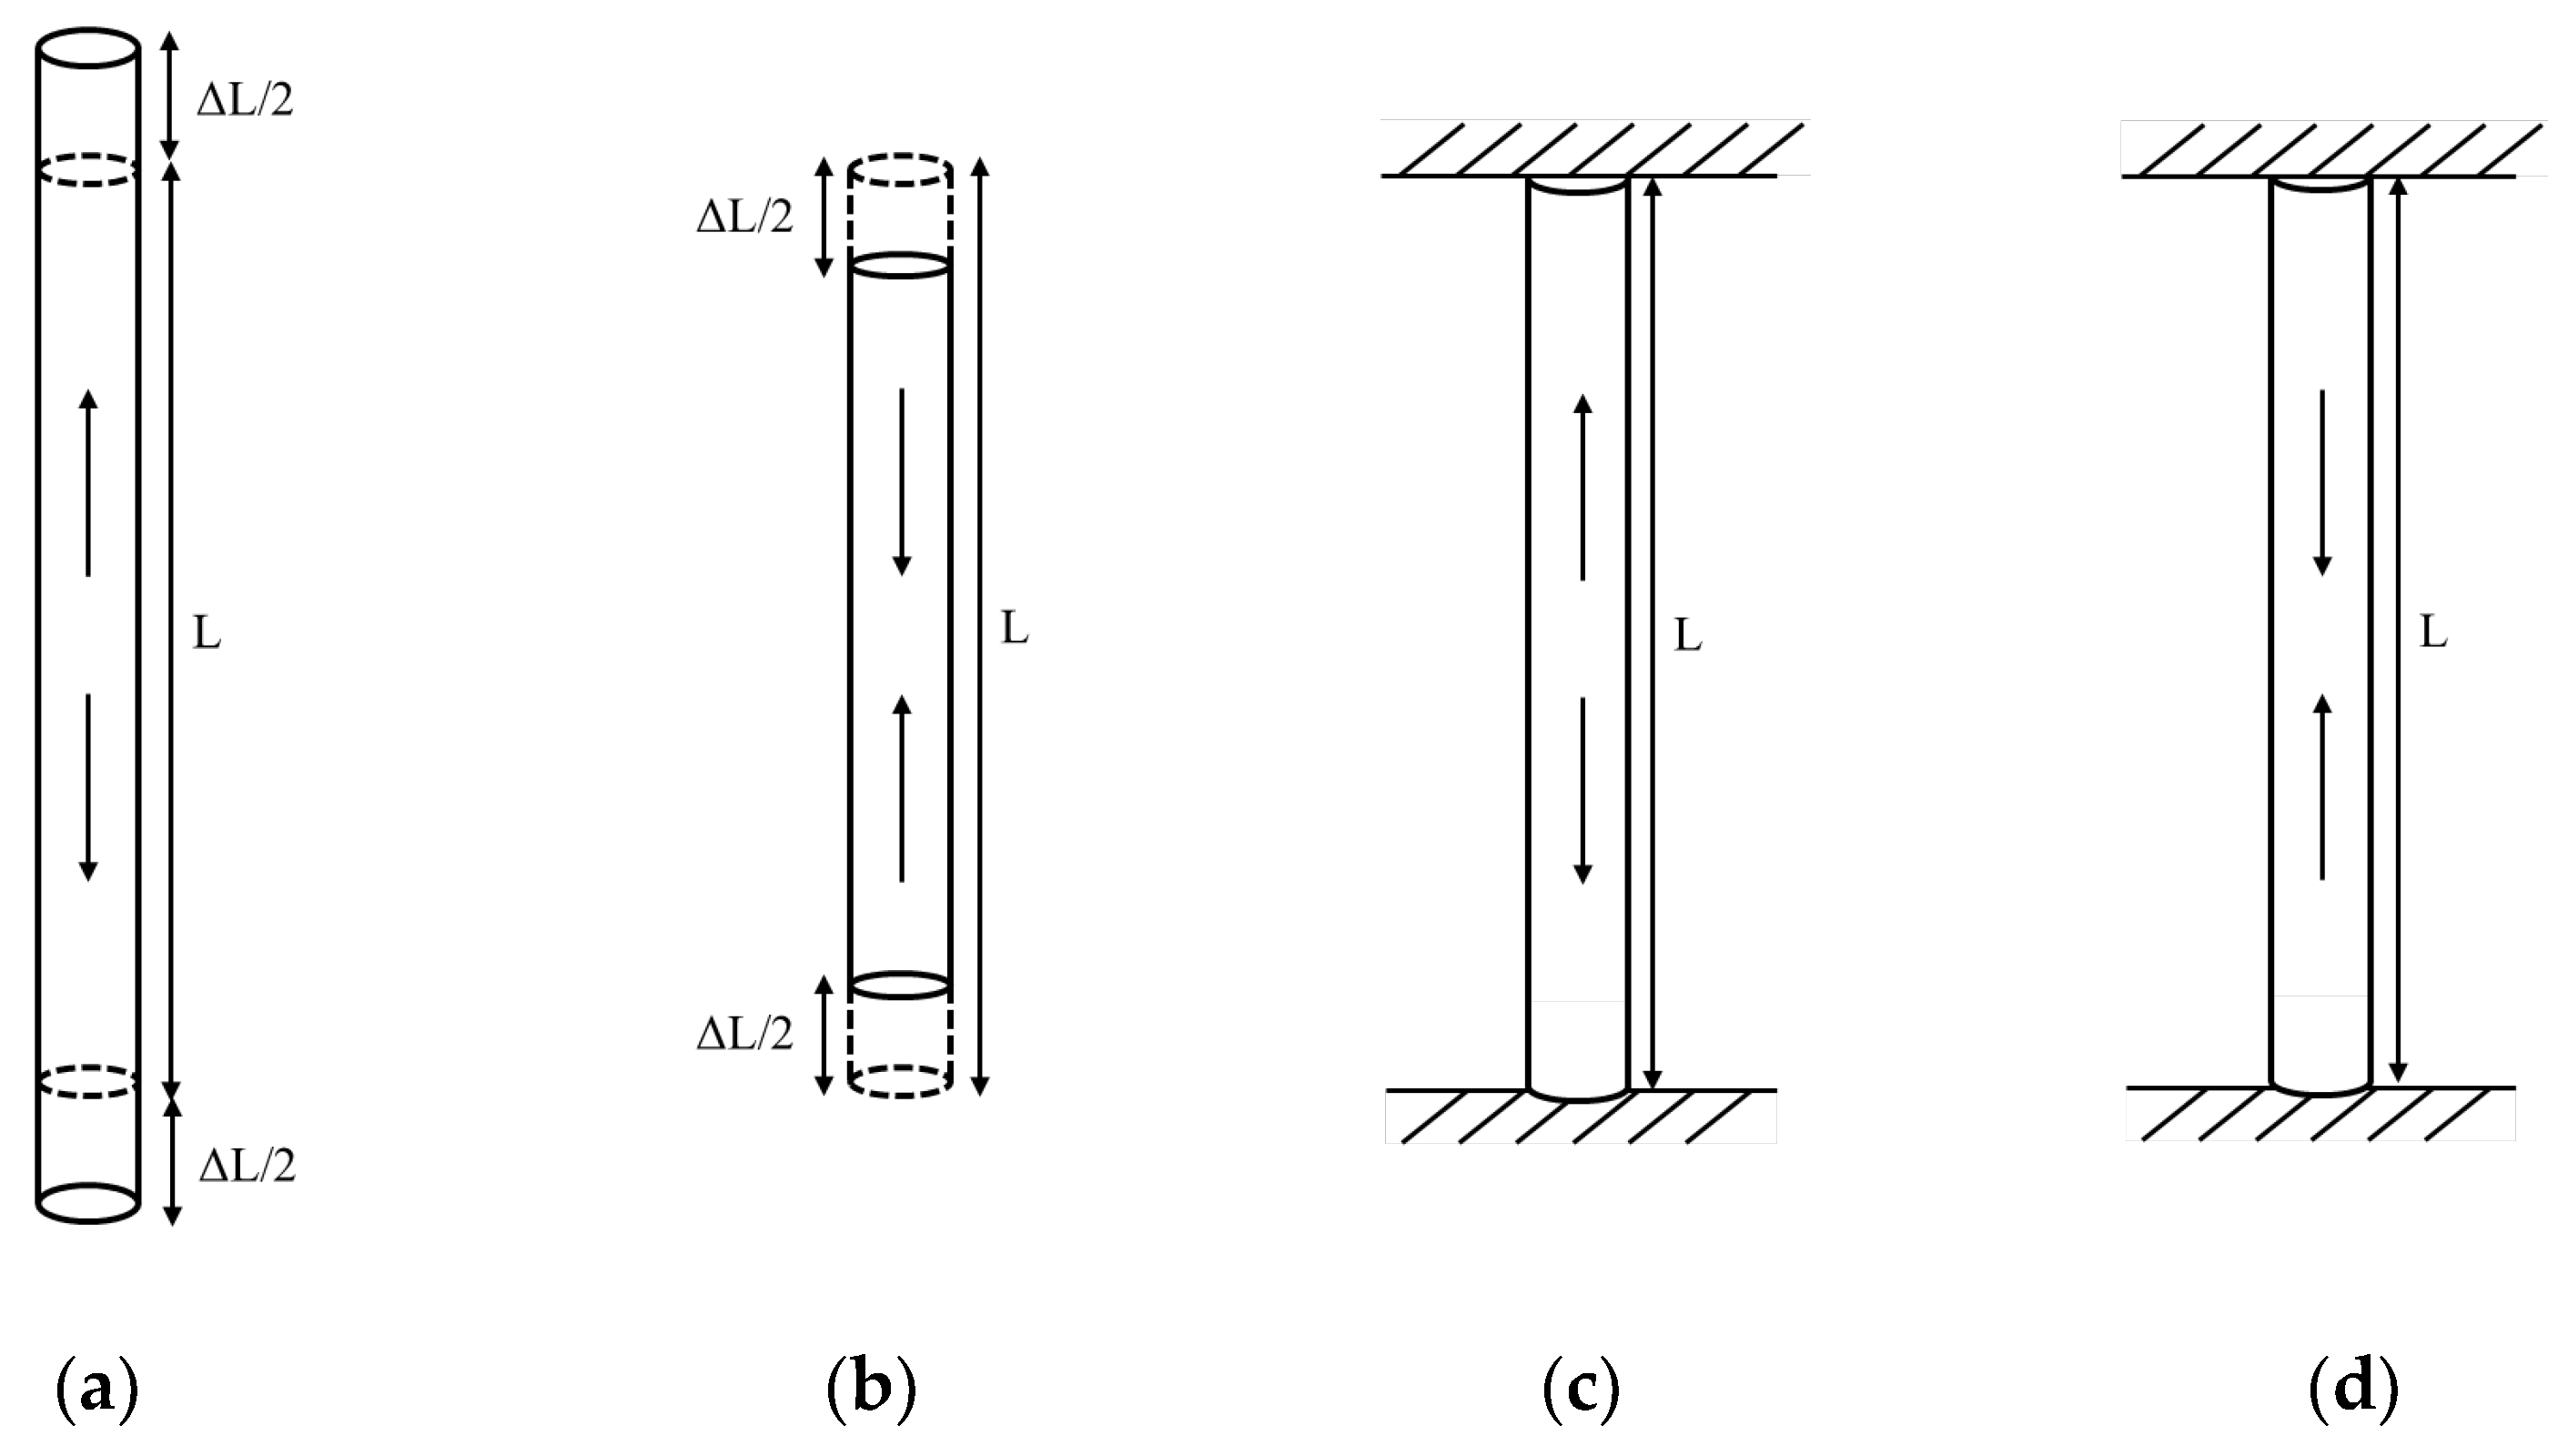
The thermo-mechanical behavior of energy piles can be categorized into two scenarios: “free expansion” and “completely restrained conditions”, as shown in
Figure 14.
- (1)
Free expansion conditions: In this scenario, the energy pile is allowed to expand (positive sign) or contract (negative sign) from its original length L by an amount ΔL both vertically and radially without any soil resistance. Under these conditions, the thermally induced strain (εthermal) is generated by temperature changes (ΔT), while the thermally induced stress is zero. The thermally induced strain is given by Equation (14).
where, α is the coefficient of linear thermal expansion of the material. The key design consideration is to ensure that the maximum additional thermal induced settlement (
), as described by Equation (15), does not exceed the allowable limits set by the building code:
- (2)
Totally Restrained Conditions: In this scenario, the energy pile is restrained from movement when exposed to temperature changes, such as when the pile tip is embedded in a hard soil layer and the supported structure above is very stiff. Here, the thermally induced strain or motion becomes zero, but a thermally induced stress (σthermal) is generated within the pile. This stress is defined by Equation (16).
where, E is the modulus of elasticity of the pile material. The design must ensure that the maximum thermally induced stress (
) given by Equation (17) does not exceed the compressive or tensile strength of the pile material:
3.9. Thermal Penalty of Energy Pile Groups
Energy pile foundations typically consist of multiple piles, rather than a single pile, that serve as both structural supports and geothermal heat exchangers. The placement and orientation of the piles within a foundation are critical design aspects regulated by building codes. Ideally, if piles are spaced far enough apart within a group, their thermal and mechanical influences will not overlap, allowing each pile to be considered as a single isolated unit. In practice, however, this is more complex. Heat dissipated from closely spaced energy piles can cause thermal overlap between adjacent piles, resulting in a “thermal penalty” that reduces overall heat transfer efficiency.
Lou and Taborda (2024) [
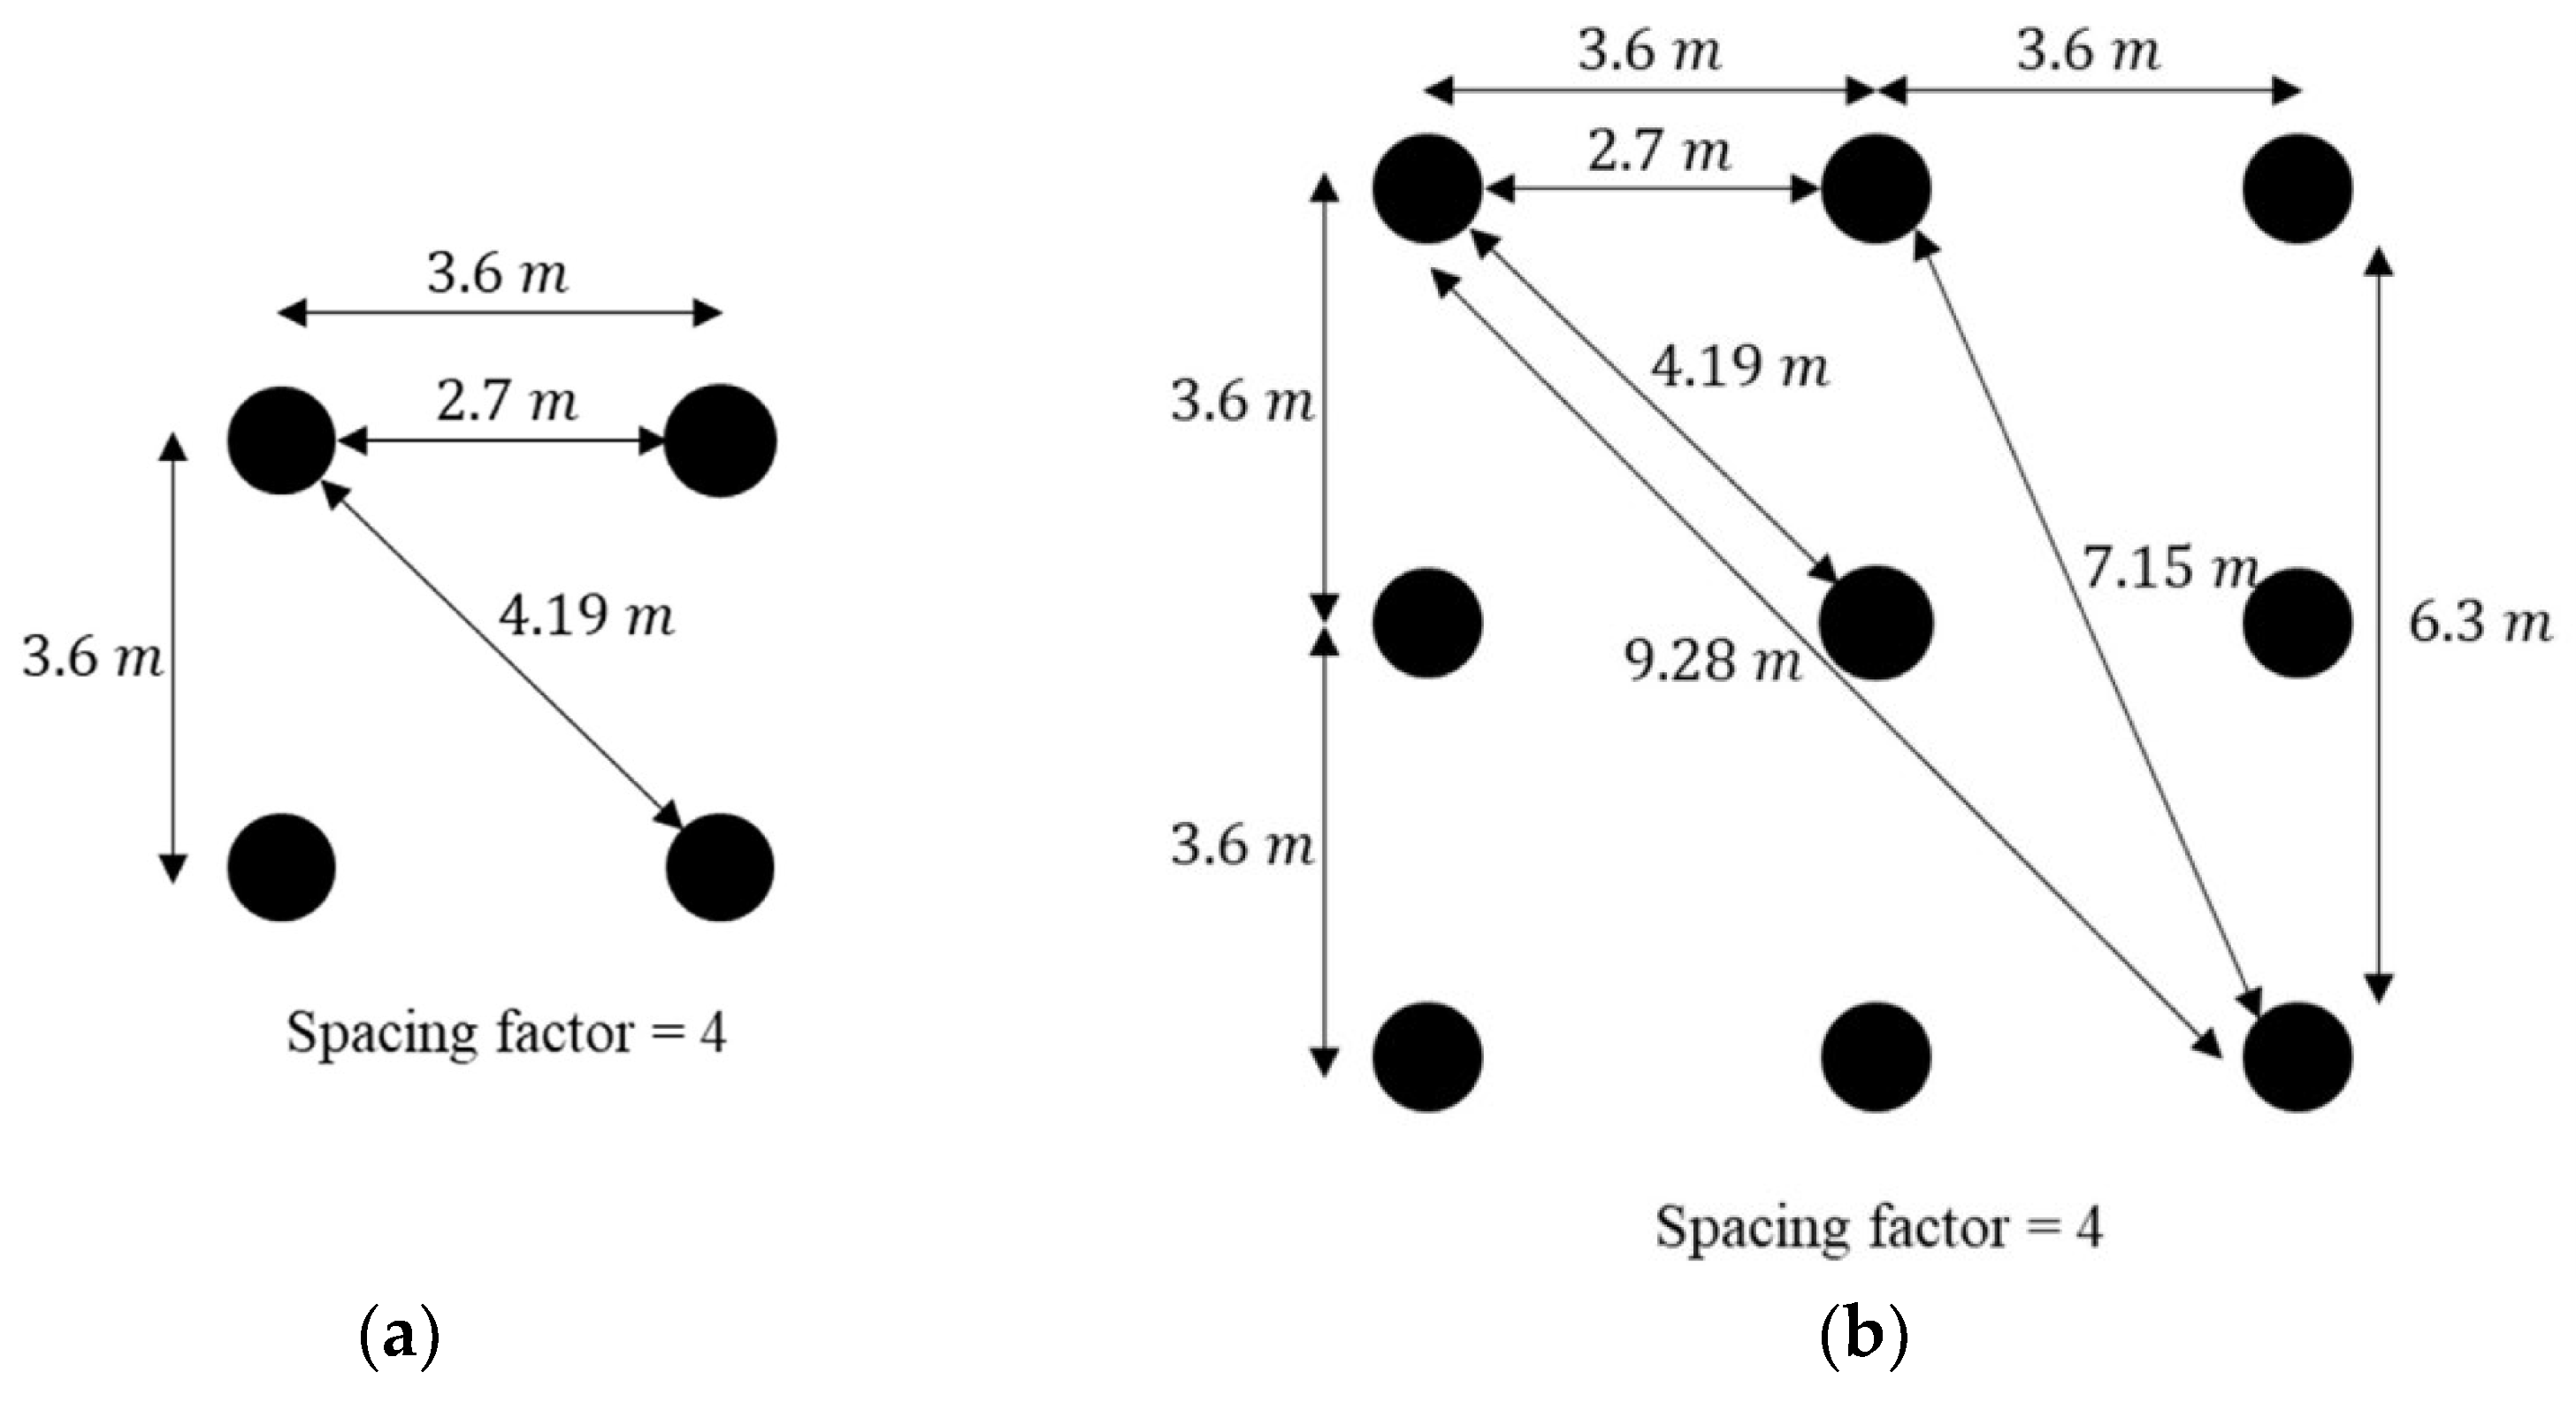
49] proposed a simplified method for estimating the thermal penalty in groups of energy piles. They performed simulations using groups of 4 and 9 piles with diameters of 0.6, 0.9, and 1.8 m, as shown in
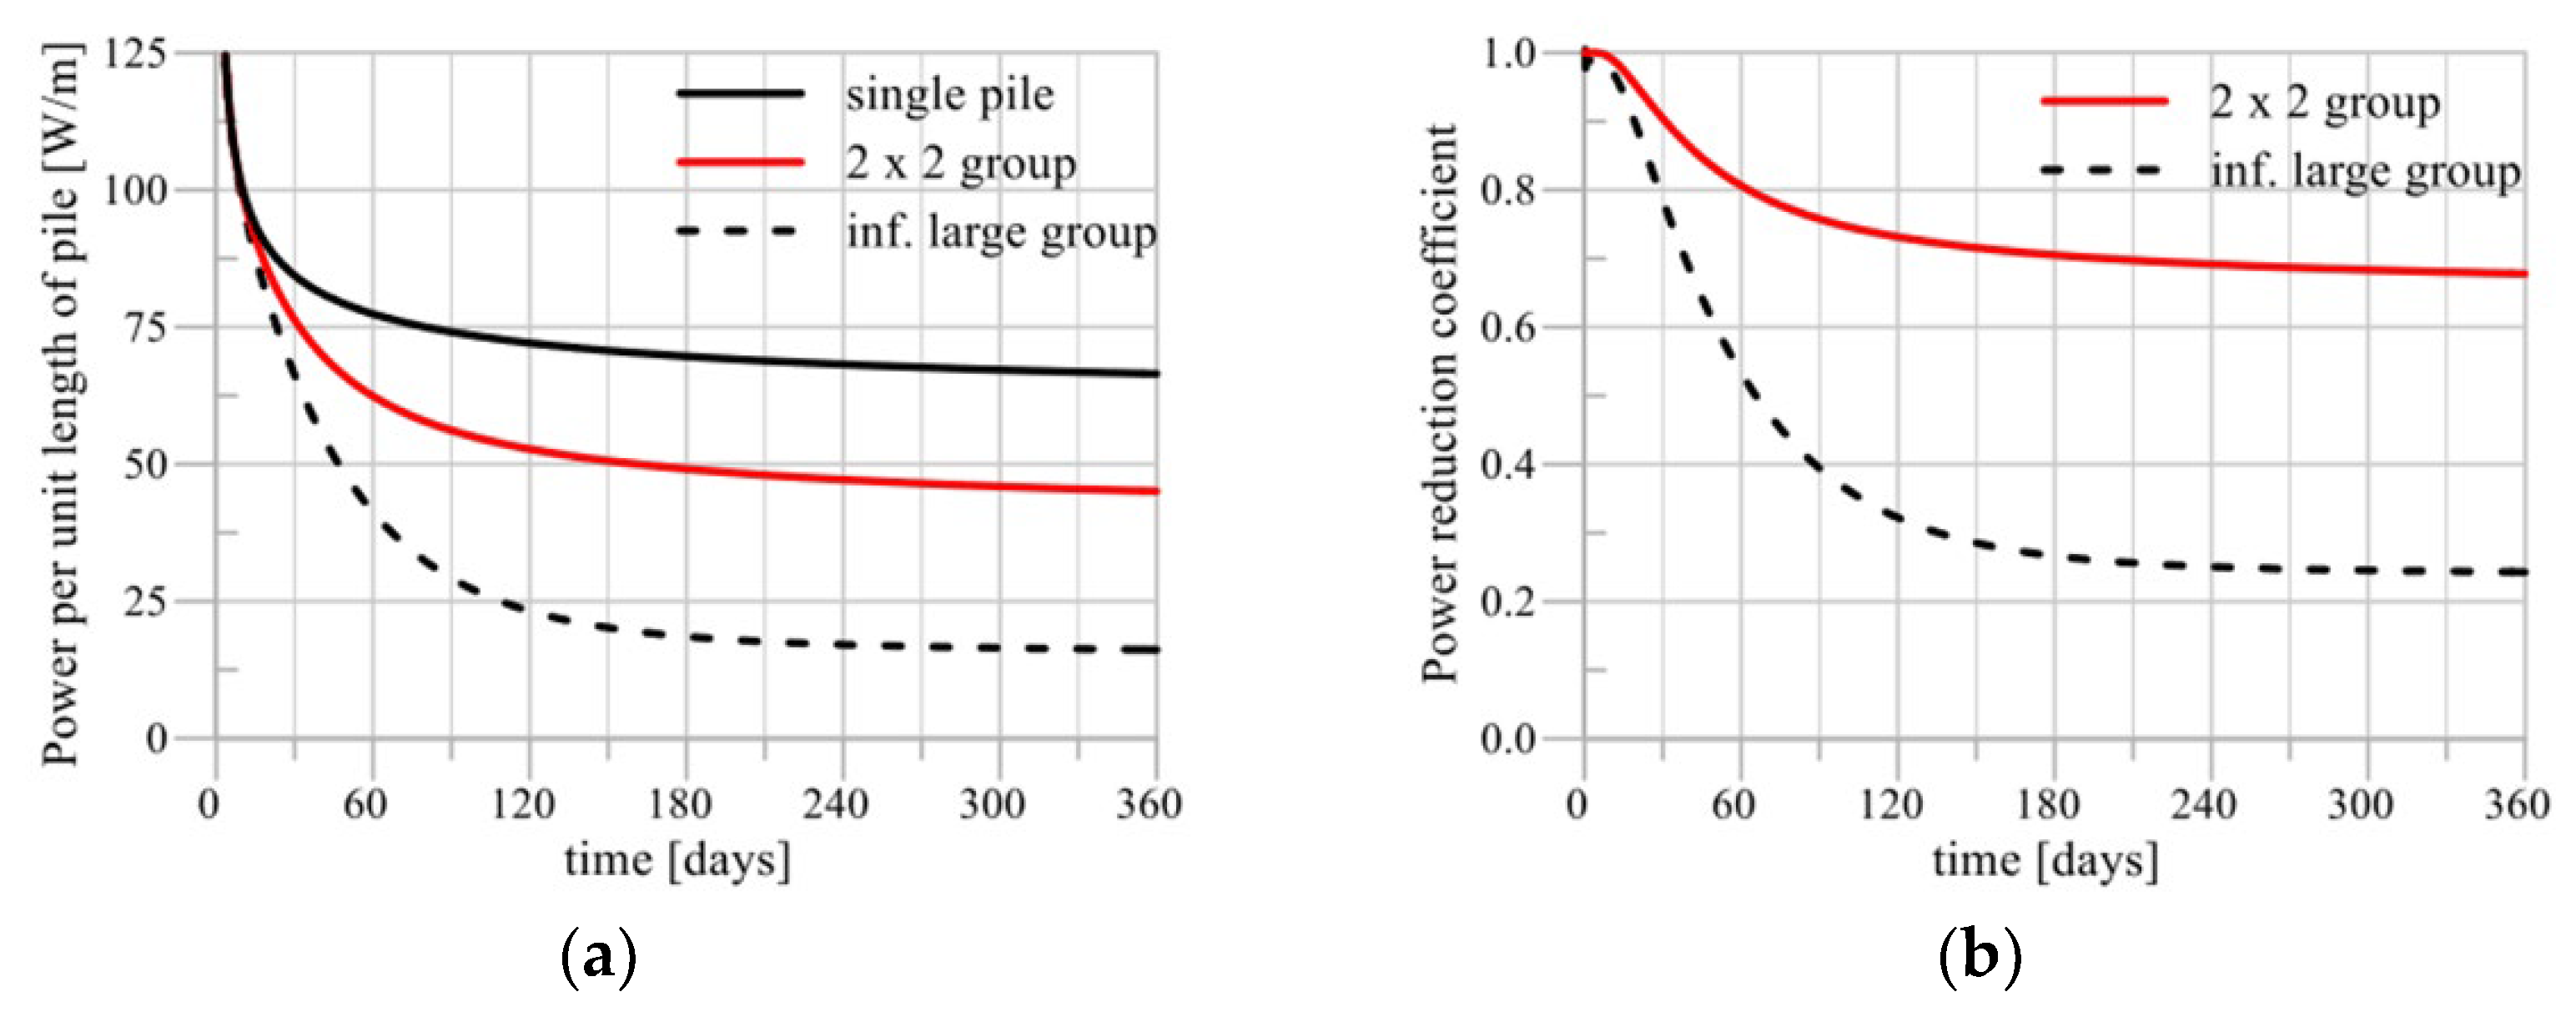
Figure 15. The upper limit of efficiency was set by the performance of a single energy pile operating without interference, while the lower limit was represented by an infinitely large group of energy piles. The edge-to-edge spacing method was chosen to compare the performance of groups of piles and yielded moderate results. The edge-to-edge spacing values ranged from 1.8 to 4.5 m.
For the 2 × 2 pile group configuration, the performance per unit length remained between the upper and lower limits for 365 days of operation. As shown in
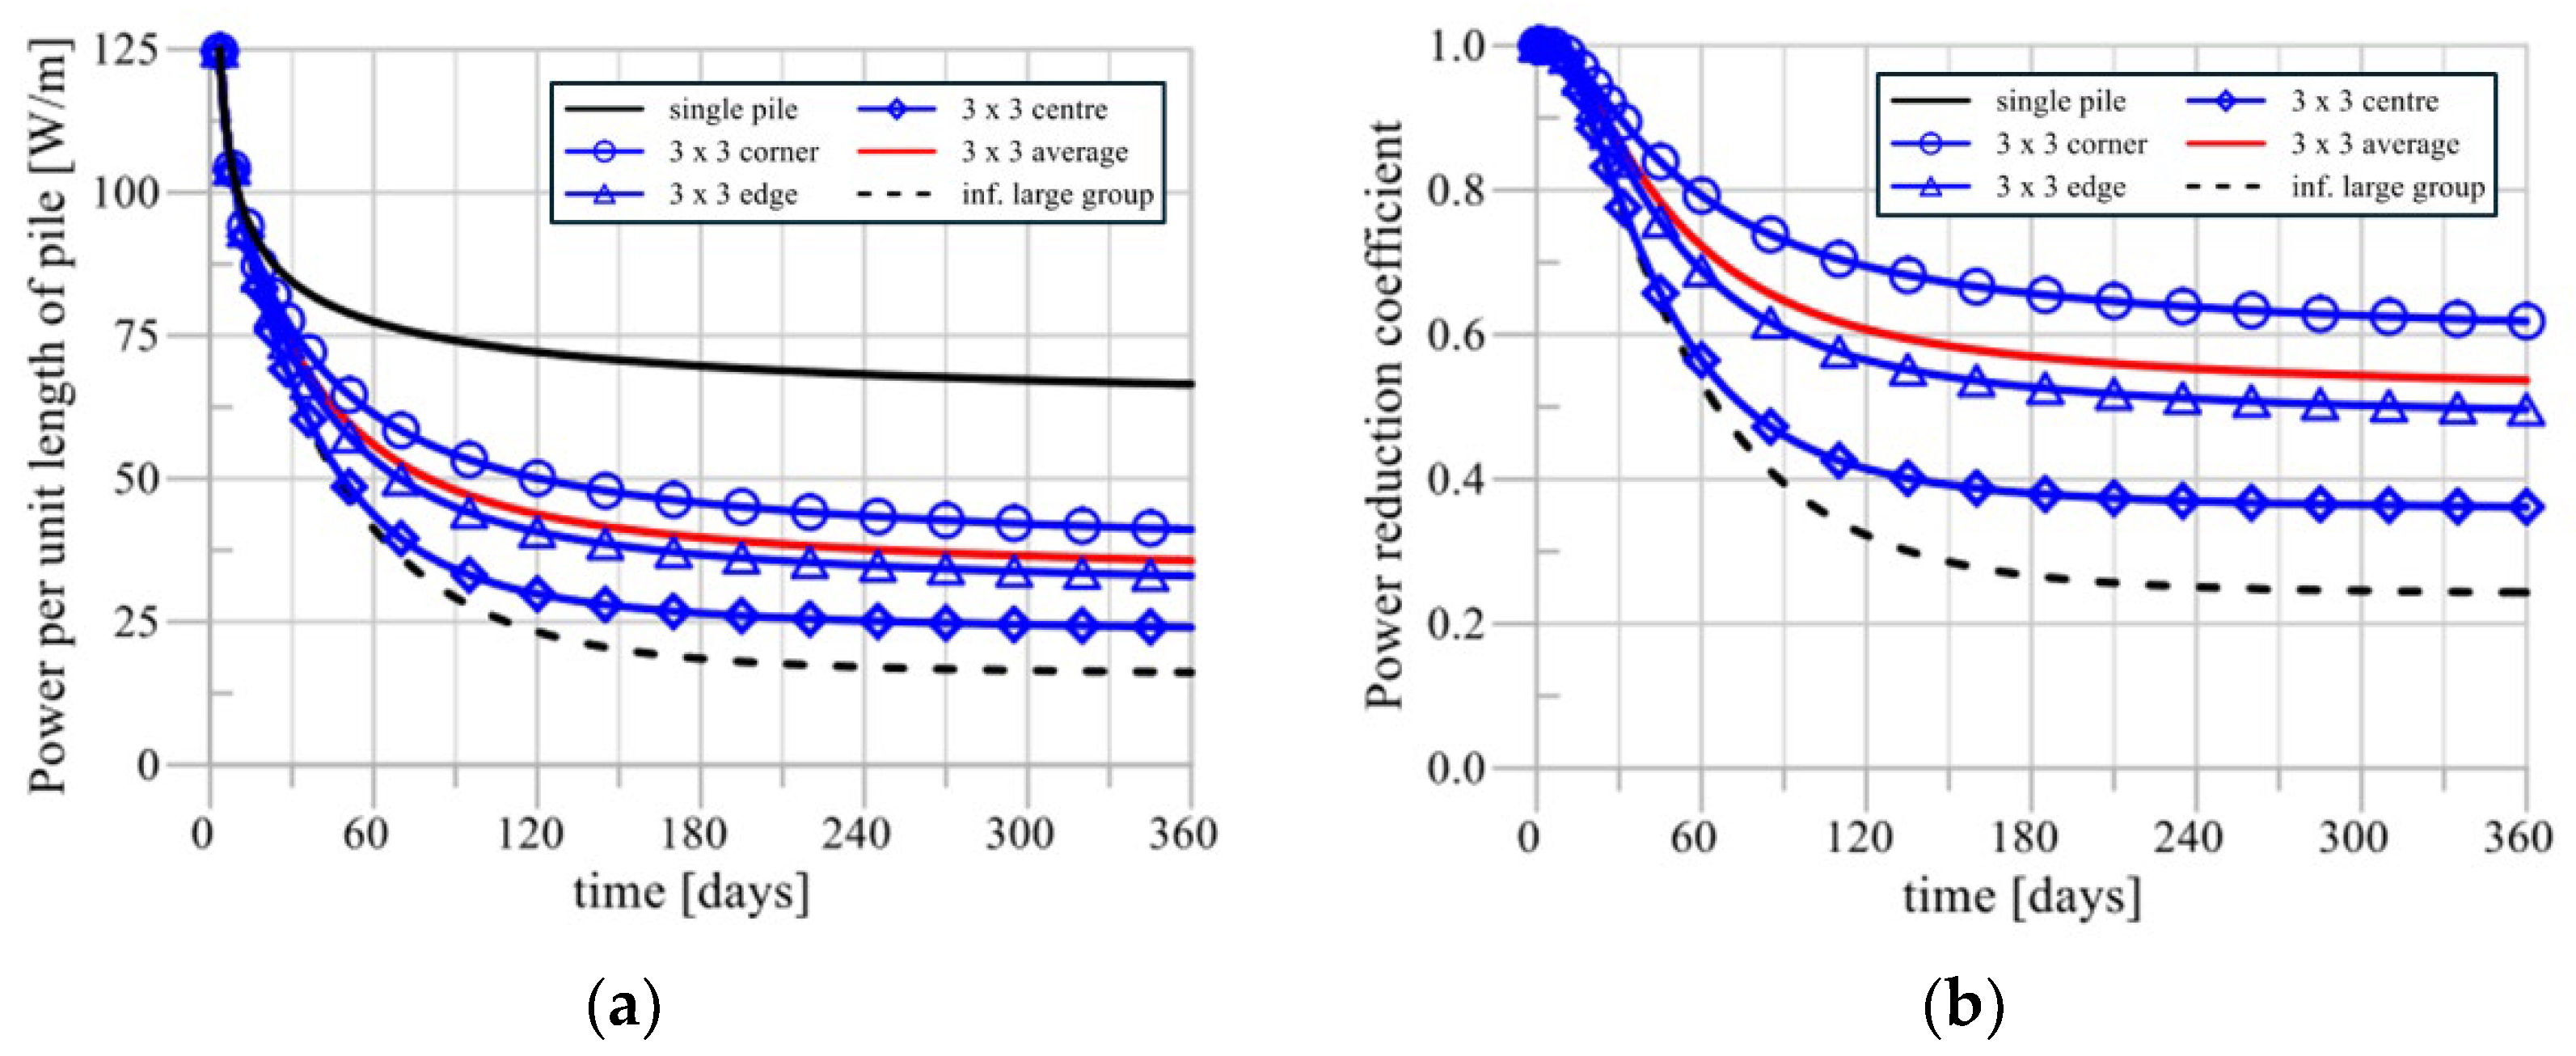
Figure 16, after one year of operation, the thermal performance of the piles in the 2 × 2 group decreased, achieving only 68% of the efficiency of a single pile due to the thermal penalty. Similarly, the thermal performance of the piles in the 3 × 3 group remained within the upper and lower limits, but shifted toward the lower limit, as observed in
Figure 17.
The thermal performance of the 3 × 3 group of energy piles, as shown in
Figure 17(b), indicates that the central piles experience the most significant thermal penalty, with a power reduction coefficient of less than 40% compared to individual piles. In contrast, piles located at the edges and corners of the group show less severe penalties, with reductions of approximately 50% and 60%, respectively. Despite these variations, the average thermal performance of a group of 3 × 3 piles remains about 54% of that of a single pile after one year of operation.
An important consideration is that the configuration of energy piles is often constrained by structural stability requirements that limit the flexibility of design adjustments. The data suggest that peak heat transfer efficiency is not achieved when all energy piles in a group are operated simultaneously. To mitigate this problem, an operational strategy of alternating active piles can effectively improve heat transfer efficiency.
4. Field Experience from the Construction of Energy Piles
The authors gained direct experience in assessing the feasibility of energy piles in the Bangkok area through the construction of small-scale energy piles in a residential setting [
50]. The main activities undertaken and key lessons learned from this experience are summarized below:
- (1)
Double Pressurization of HDPE Pipes Before Pouring Concrete:
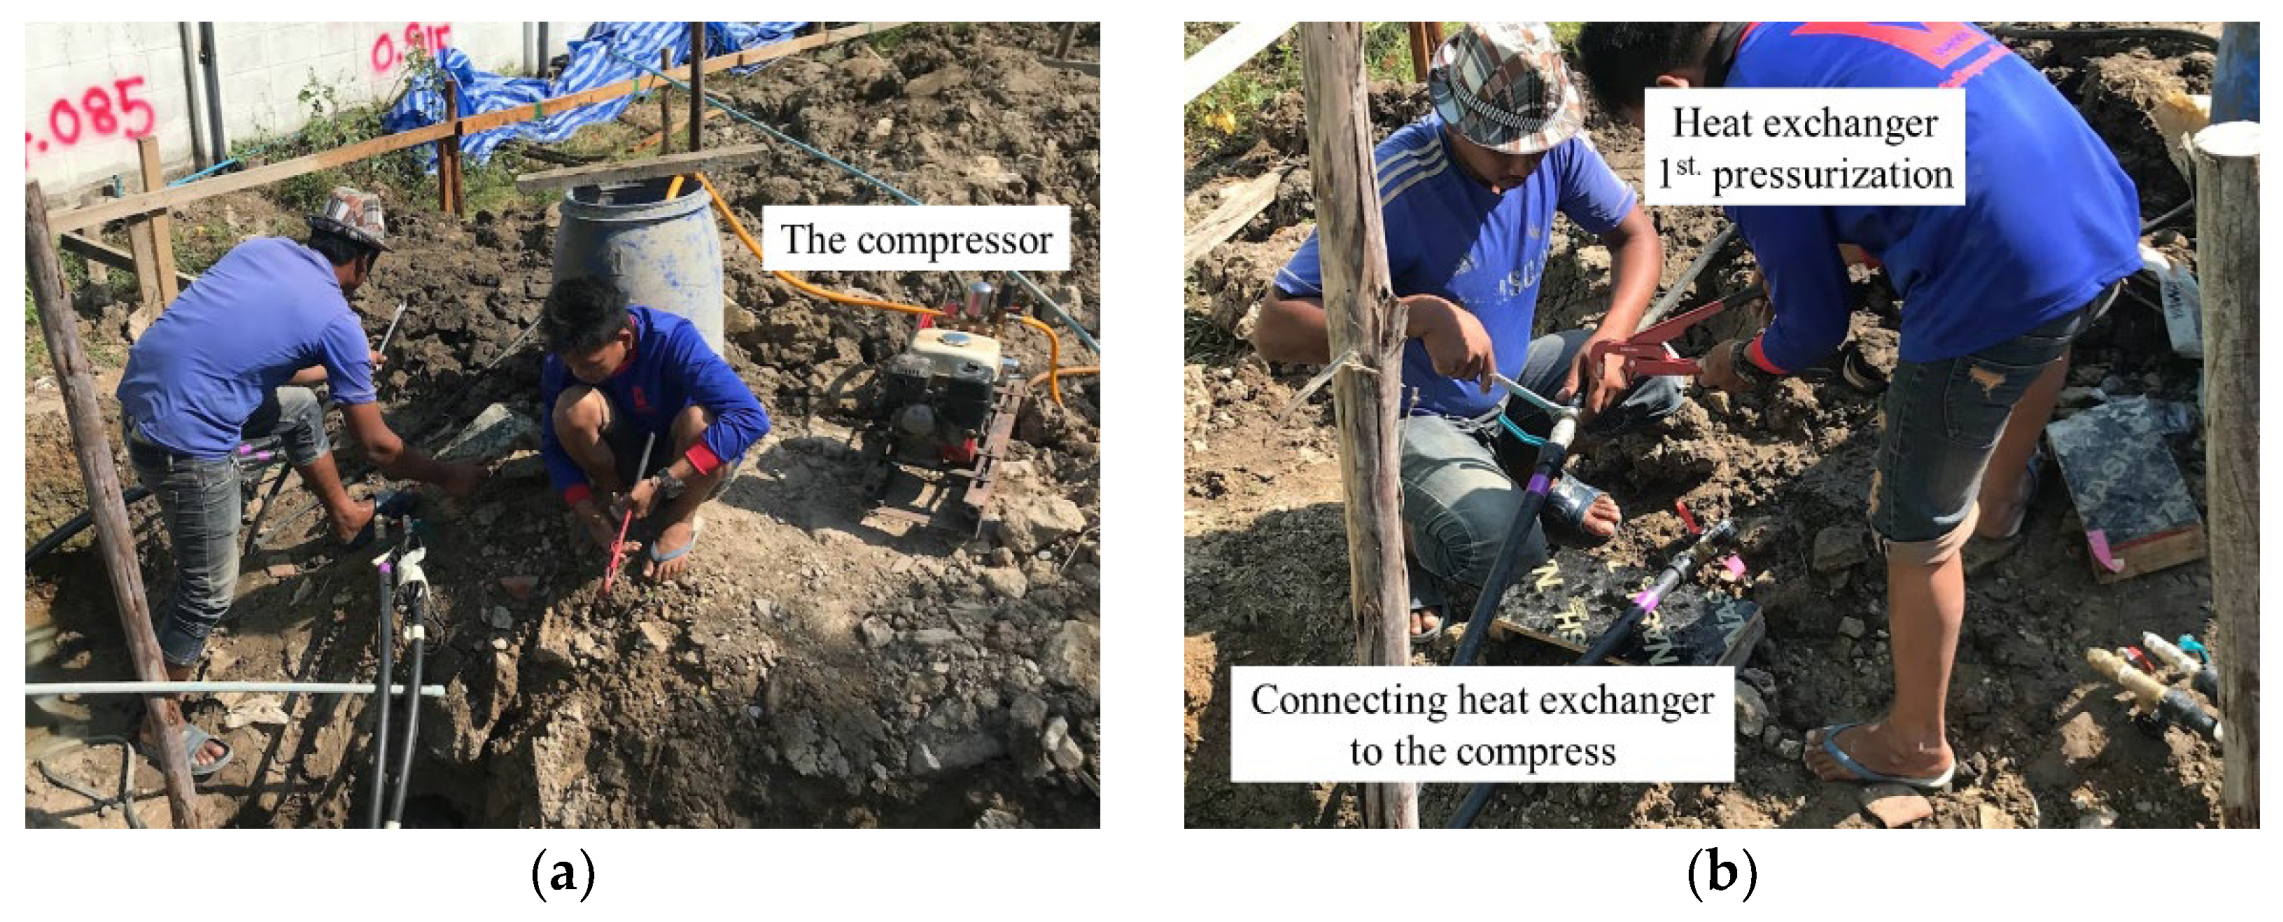
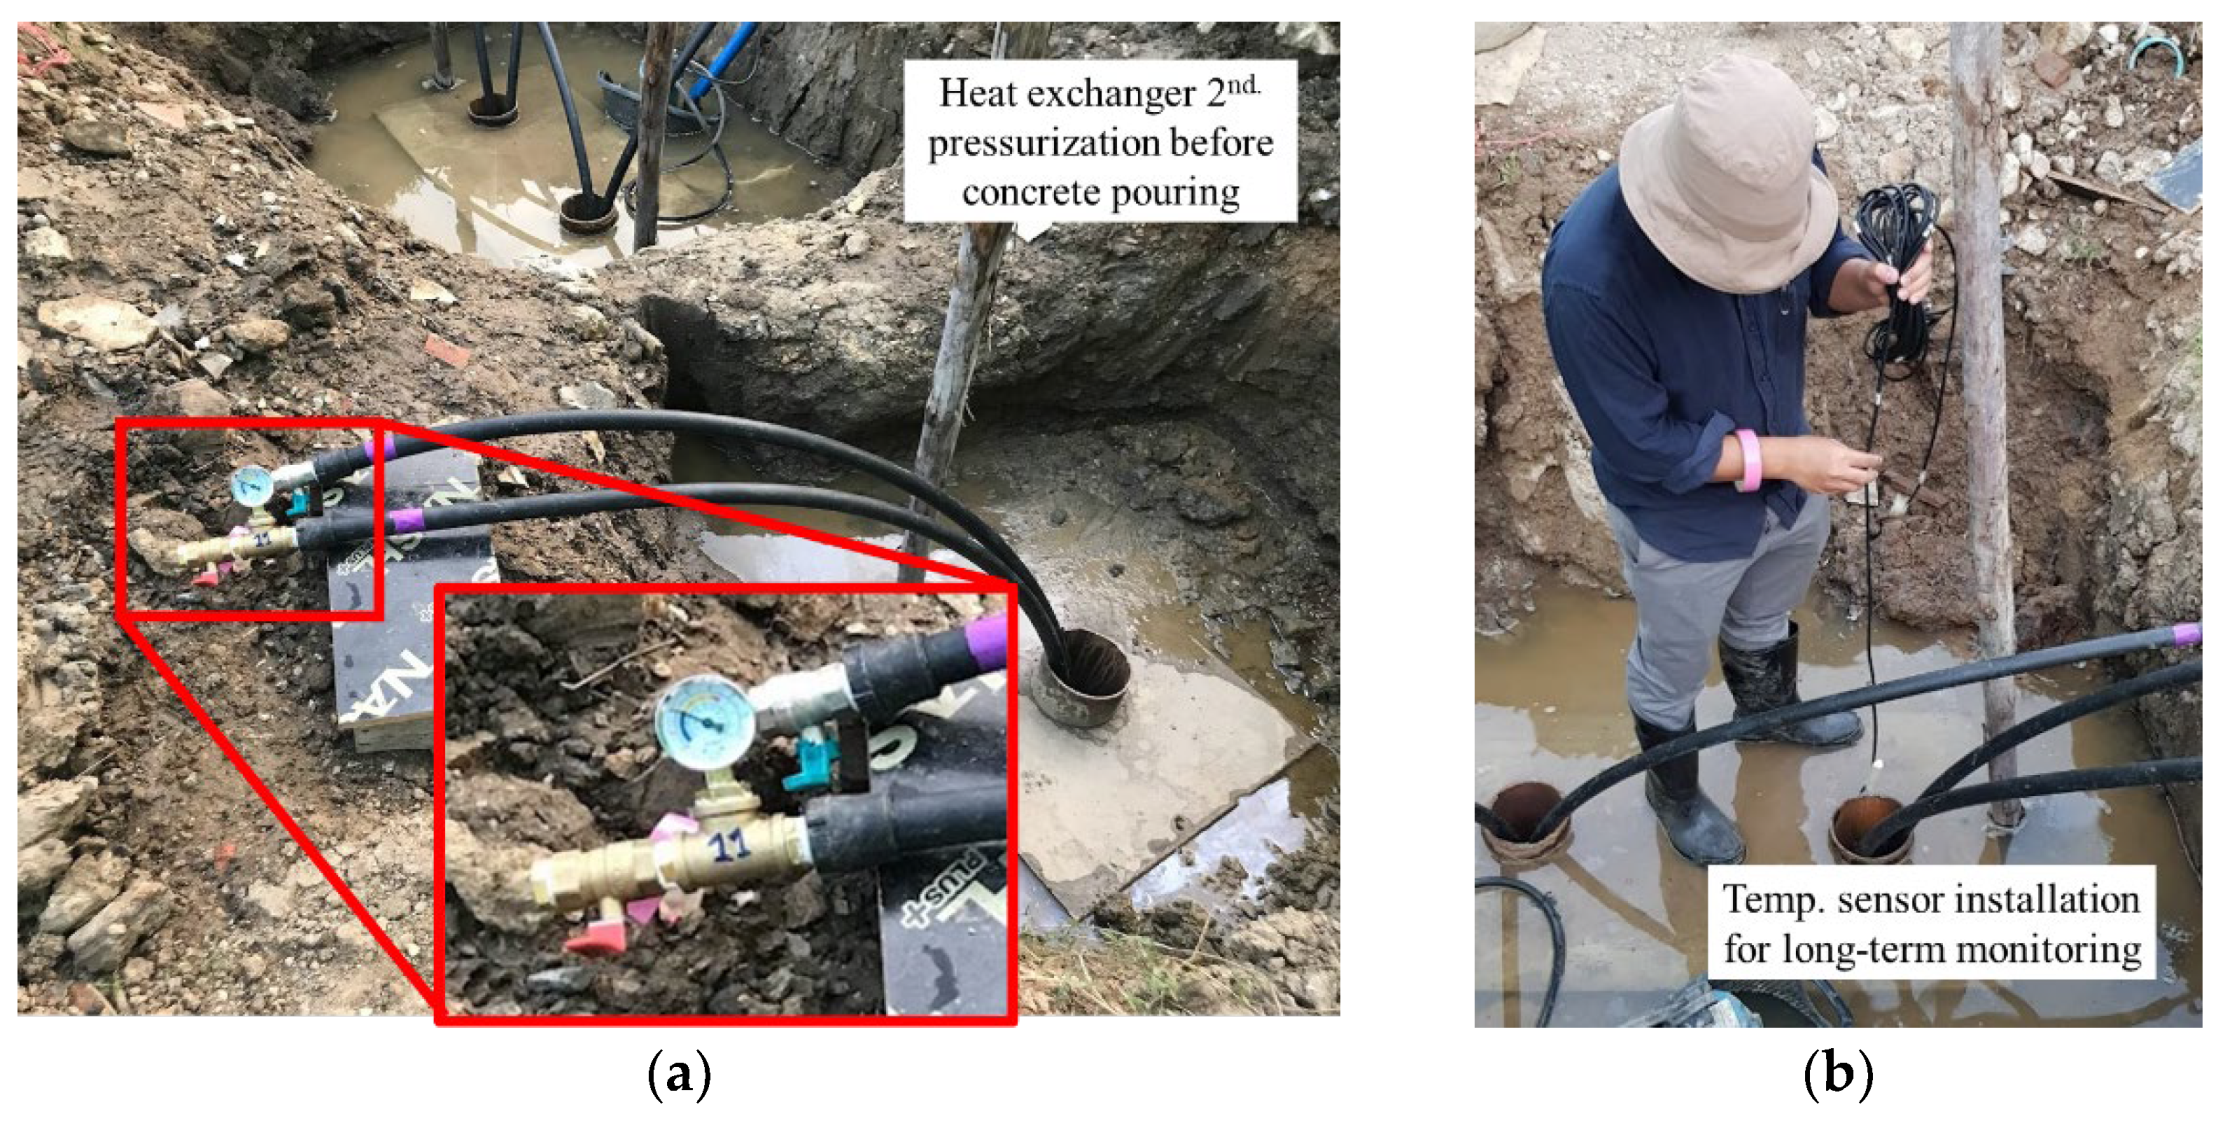
Ensuring the structural integrity of embedded heat exchangers in energy piles requires double pressurization of HDPE pipes prior to concrete pouring. A temporary pressure gauge should be installed on each heat exchanger to monitor pressure levels every 10 minutes or until stabilized, as shown in
Figure 18.
This procedure is based on the expected pressure of fresh concrete or grout at the top of the pile or the deepest point of the heat exchanger, allowing a margin of safety but not exceeding the pressure rating of the HDPE pipe. A double pressurization method using water is recommended. First, pressurize the HDPE pipe and allow it to stabilize for approximately one hour, closely monitoring the pressure to detect any potential leaks or weaknesses. After stabilization, a second pressurization is performed (
Figure 19(a)), increasing the pressure to the calculated level corresponding to the concrete pressure at its maximum depth. The heat exchangers are then allowed to stabilize for 6-12 hours to ensure that the pipes can withstand the stress and pressure exerted by the fresh concrete, thus preventing potential failures that could compromise the integrity of the energy piles or the heat exchanger of the GSHP system.
- (2)
Installing Temperature Sensors and Auxiliary Equipment:
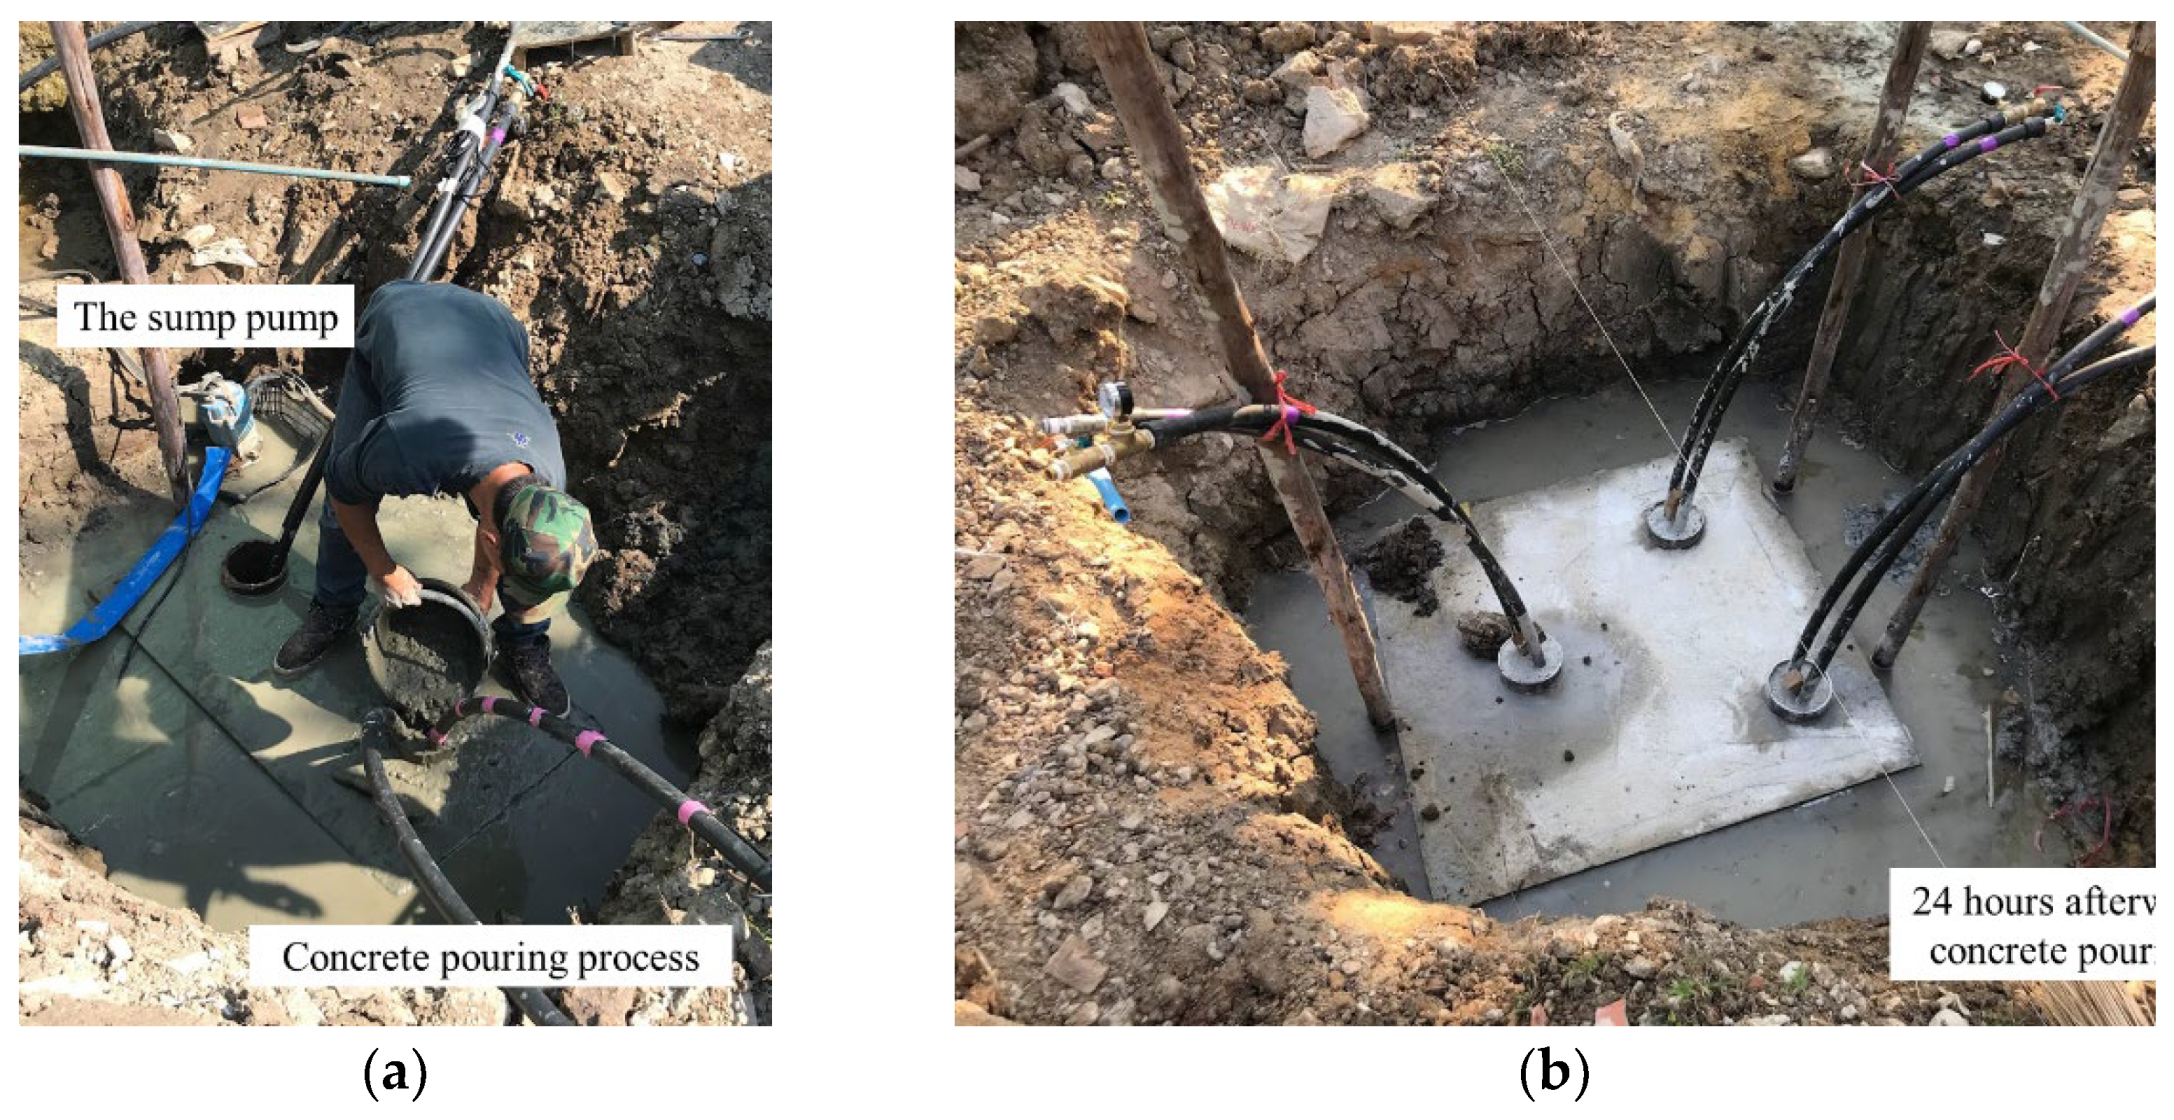
Prior to pouring concrete, temperature sensors and other auxiliary equipment should be installed and checked (
Figure 19(b)). When pouring concrete (
Figure 20(a)), it is recommended to use a concrete vibrator or long stick to prevent clogging and to ensure that there are no air voids in the energy pile concrete. This practice helps to achieve a uniform and dense concrete mix, which is essential for maintaining the structural integrity and thermal performance of the energy pile.
- (3)
Managing Groundwater Seepage and Curing Time:
Groundwater seepage can significantly affect the quality of freshly poured concrete. To mitigate this problem, the installation of a sump pump is recommended. A minimum of 3-7 days is required for the concrete to cure. During this time, the pressure levels in the heat exchanger should be monitored to detect any punctures that may have occurred during construction (
Figure 20(b)). If a significant pressure drop is observed, the affected heat exchanger loop should be excluded from subsequent construction steps.
- (4)
Pump design and flow management:
The capacity of the pump is a critical factor in the design of the energy pile heat exchanger. The pump must be capable of providing and maintaining adequate flow rates to ensure that the heat transfer fluid has turbulent flow characteristics. It must overcome all head losses due to pipe friction, bends, and fittings. Proper pump sizing and flow management can significantly improve GSHP performance, reduce energy consumption, and improve the overall thermal efficiency of the energy pile system.
5. Measuring the Performance and Efficiency of Energy Piles
5.1. Coefficient of Performance and Seasonal Coefficient of Performance (COP/SCOP)
The Coefficient of Performance (COP) is a measure of the efficiency of a heat pump, calculated as the ratio of energy output (in watts) to energy input (in watts). A higher COP indicates that the heat pump or air conditioner is providing more heating or cooling while using less energy under ideal conditions, resulting in lower electricity consumption and lower energy costs.
The Seasonal Coefficient of Performance (SCOP) is a more comprehensive measure of a heat pump’s efficiency over an entire cooling or heating season, taking into account varying temperatures and weather conditions. A higher SCOP indicates better overall efficiency throughout the year, which helps reduce greenhouse gas emissions and minimize environmental impact.
According to classical thermodynamics, the maximum theoretical value of COP (Carnot efficiency) is limited by the absolute temperatures of the heat exchanger inlet and the ground. The maximum possible COP (
) is given by the ratio of the ambient ground temperature to the temperature difference between the ground and the heat exchanger inlet, as shown in Equation (18).
The COP and SCOP can be calculated using Equation (19).
5.2. Energy Efficiency Ratio and Seasonal Energy Efficiency Ratio (EER/SEER)
The Energy Efficiency Ratio (
), as defined in the AHRI 210/240-2024 (I-P) manual [
51], is a metric commonly used to measure the cooling efficiency of a heat pump or GSHP at a given point in time. It is calculated as the ratio of cooling output (in BTUs) to energy input (in watts), as shown in Equation (20). A higher EER indicates that the air conditioner or heat pump is providing more cooling while using less energy.
The Seasonal Energy Efficiency Ratio () is similar to the Seasonal Coefficient of Performance (SCOP) and evaluates the overall efficiency of a heat pump or air conditioner over the entire annual cooling season. It is calculated by dividing the total heat removed from the conditioned space (in BTUs) during the cooling season by the total electrical energy consumed (in watt-hours) by the system during the same period.
5.3. The Seasonal Performance Factor (SPF)
The Seasonal Performance Factor (SPF) is defined as the ratio of the total energy output for heating or cooling to the total electrical energy input over the same period [
52]. This metric provides a more accurate representation of a system’s real-world performance than other instantaneous efficiency metrics. Unlike other metrics, the SPF also accounts for ancillary energy use associated with the heat pump system that may not be directly part of the heat pump itself. The SPF is most commonly used in conjunction with measured field performance data [
15]. It accounts for various factors such as climate variations, part-load operation, and external energy input, making it suitable for evaluating the efficiency of complex systems such as hybrid energy piles and GSHP configurations or other renewable energy technologies [
52].
COP/SCOP and EER/SEER are often compared between conventional ASHPs and GSHPs. As shown in
Table 3, GSHPs generally achieve higher values for all COP, SCOP, EER, and SEER indices because the ground maintains a more stable temperature than the air, resulting in more efficient heat exchange. However, GSHPs typically have higher installation costs due to the need for ground loop systems, while their operating costs are lower compared to ASHPs. In contrast, ASHPs are generally less expensive to install, but can have higher operating costs. For economic viability, it is recommended that the COP/SCOP value be set at 4 or above and the EER/SEER value at 15 or above for the GSHP system to provide a financially beneficial return [
53,
54,
55].
6. Environmental Impact of Energy Piles
6.1. Thermal Cyclic Effect on Pile Capacity
Wang et al. [
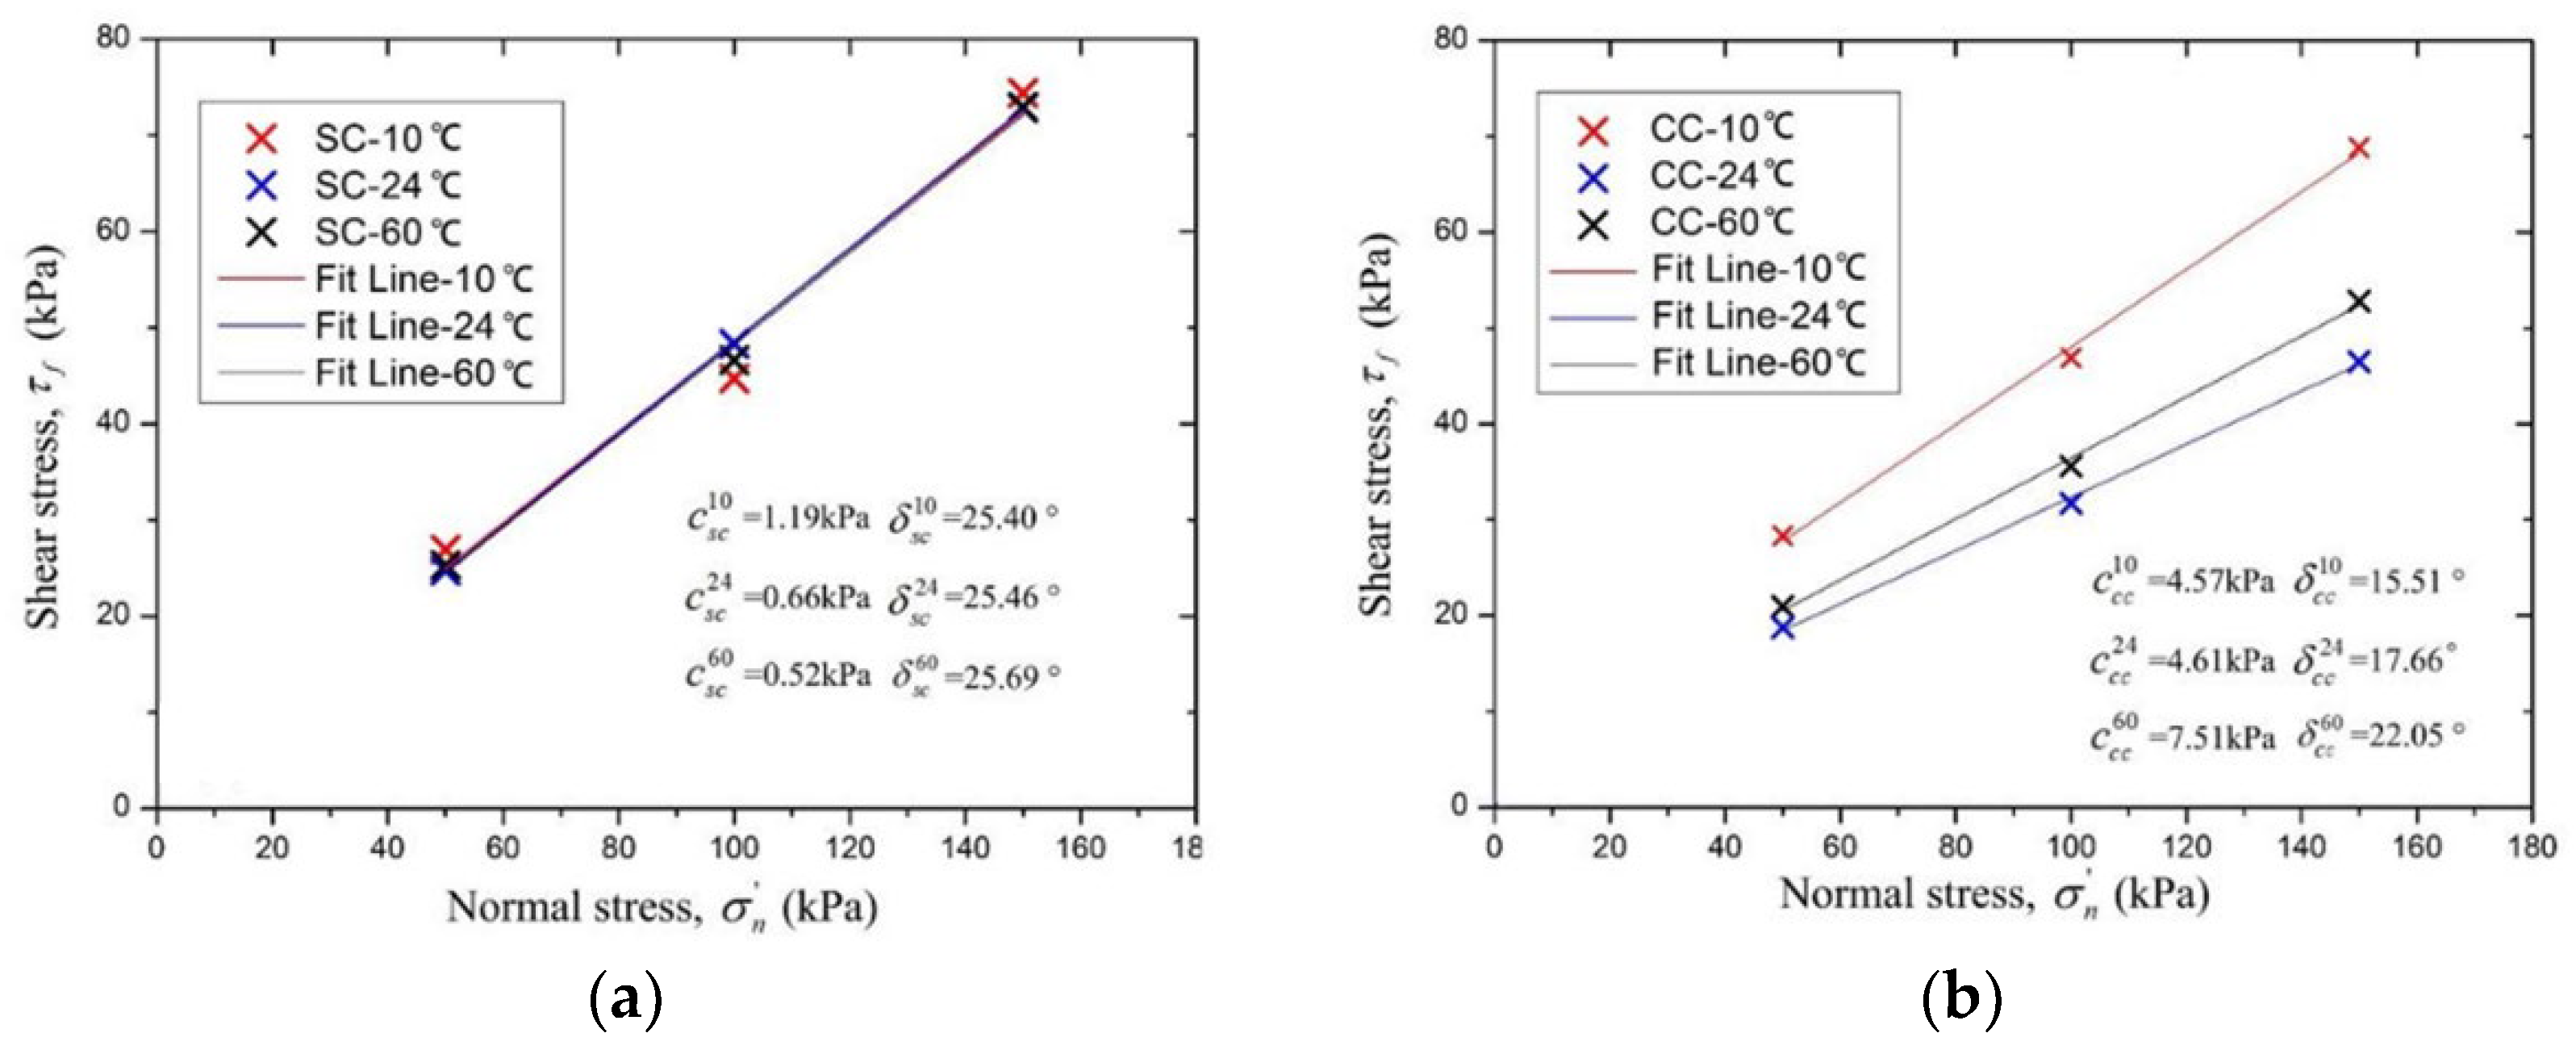
56] conducted simulations to evaluate the effects of thermal cycling on pile skin friction using “sand-concrete” and “clay-concrete” interface tests. These tests were performed using a modified temperature-controlled direct shear apparatus equipped with heating and cooling systems. Soil samples, including dry silica sand and clay, were held at 60°C or 8°C for 24 hours to stabilize temperatures. The resulting laboratory data were used in ABAQUS CAE software to create numerical models and generate mesh simulations, as shown in
Figure 21.
The results provide valuable insights for energy pile design. For the sand-concrete interface, thermal changes had minimal effect on skin friction (average 0.79 kPa) and friction angle (average 25.52°). In contrast, the clay-concrete interface showed a significant increase in skin friction during cooling, with a 63% increase from 4.61 kPa to 7.5 kPa and a 24% increase in friction angle from 17.66° to 22.05° compared to room temperature (25°C). However, when heated, the skin friction decreased slightly by 0.9% (from 4.61 kPa to 4.57 kPa) and the friction angle decreased by 13.86% (from 17.66° to 15.51°).
When designing energy piles based on skin friction capacity, it is critical to consider the future operating mode of the GSHP system to ensure adequate bearing capacity and safety. Although the study indicates an increase in skin friction and friction angle during cooling and a slight decrease during heating, these results were obtained under controlled laboratory conditions. Full-scale tests may show similar trends, but with potentially lower values. Therefore, it is prudent to include an additional safety factor in the design until further studies provide more comprehensive data.
6.2. Thermal Cyclic Effect on Soil Shear Strength
Abuel-Naga [
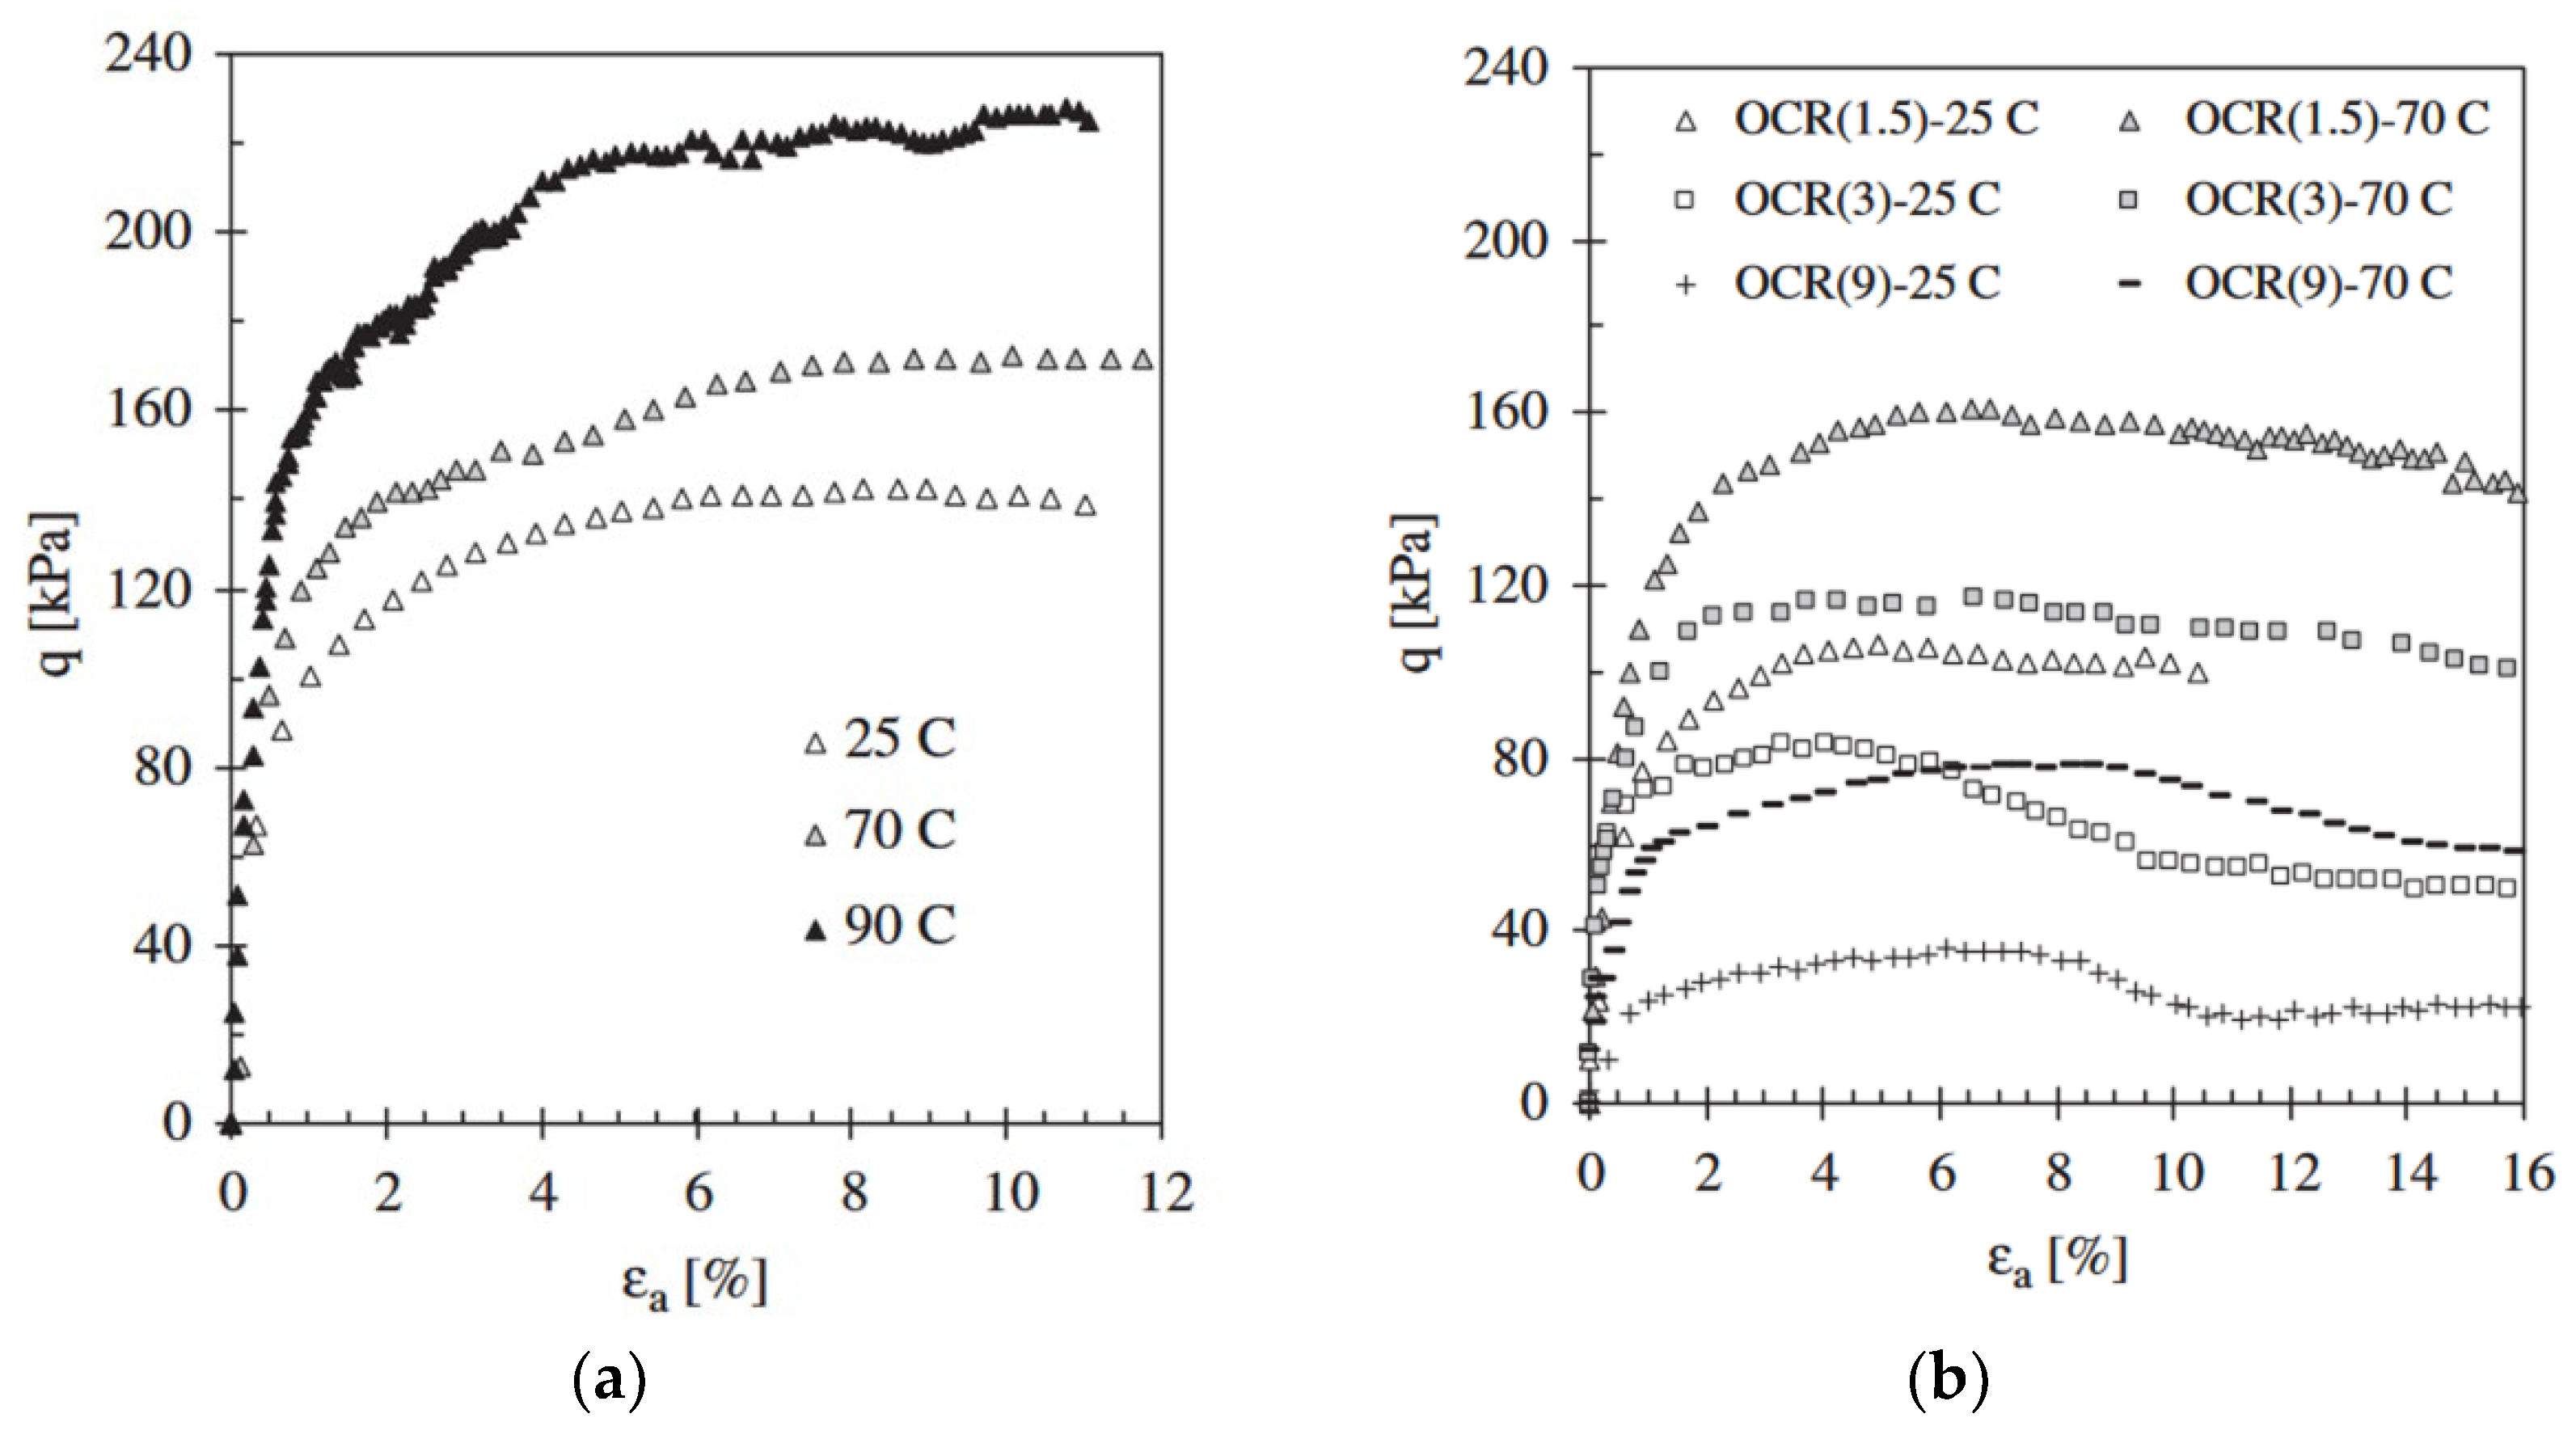
57] conducted experiments to evaluate the effect of thermal cycling on the shear strength of isotropic clay specimens. The temperature cycles for the test programs were set from 25°C to 90°C and back to 25°C, and from 25°C to 70°C and back to 25°C for both normally consolidated and over-consolidated specimens (with over-consolidation ratios (OCR) of 1.5, 3.0, and 9.0). The pre-consolidation pressure (
) for these specimens was set at 300 kPa. In addition, static high temperature tests were performed to determine the effect on shear strength.
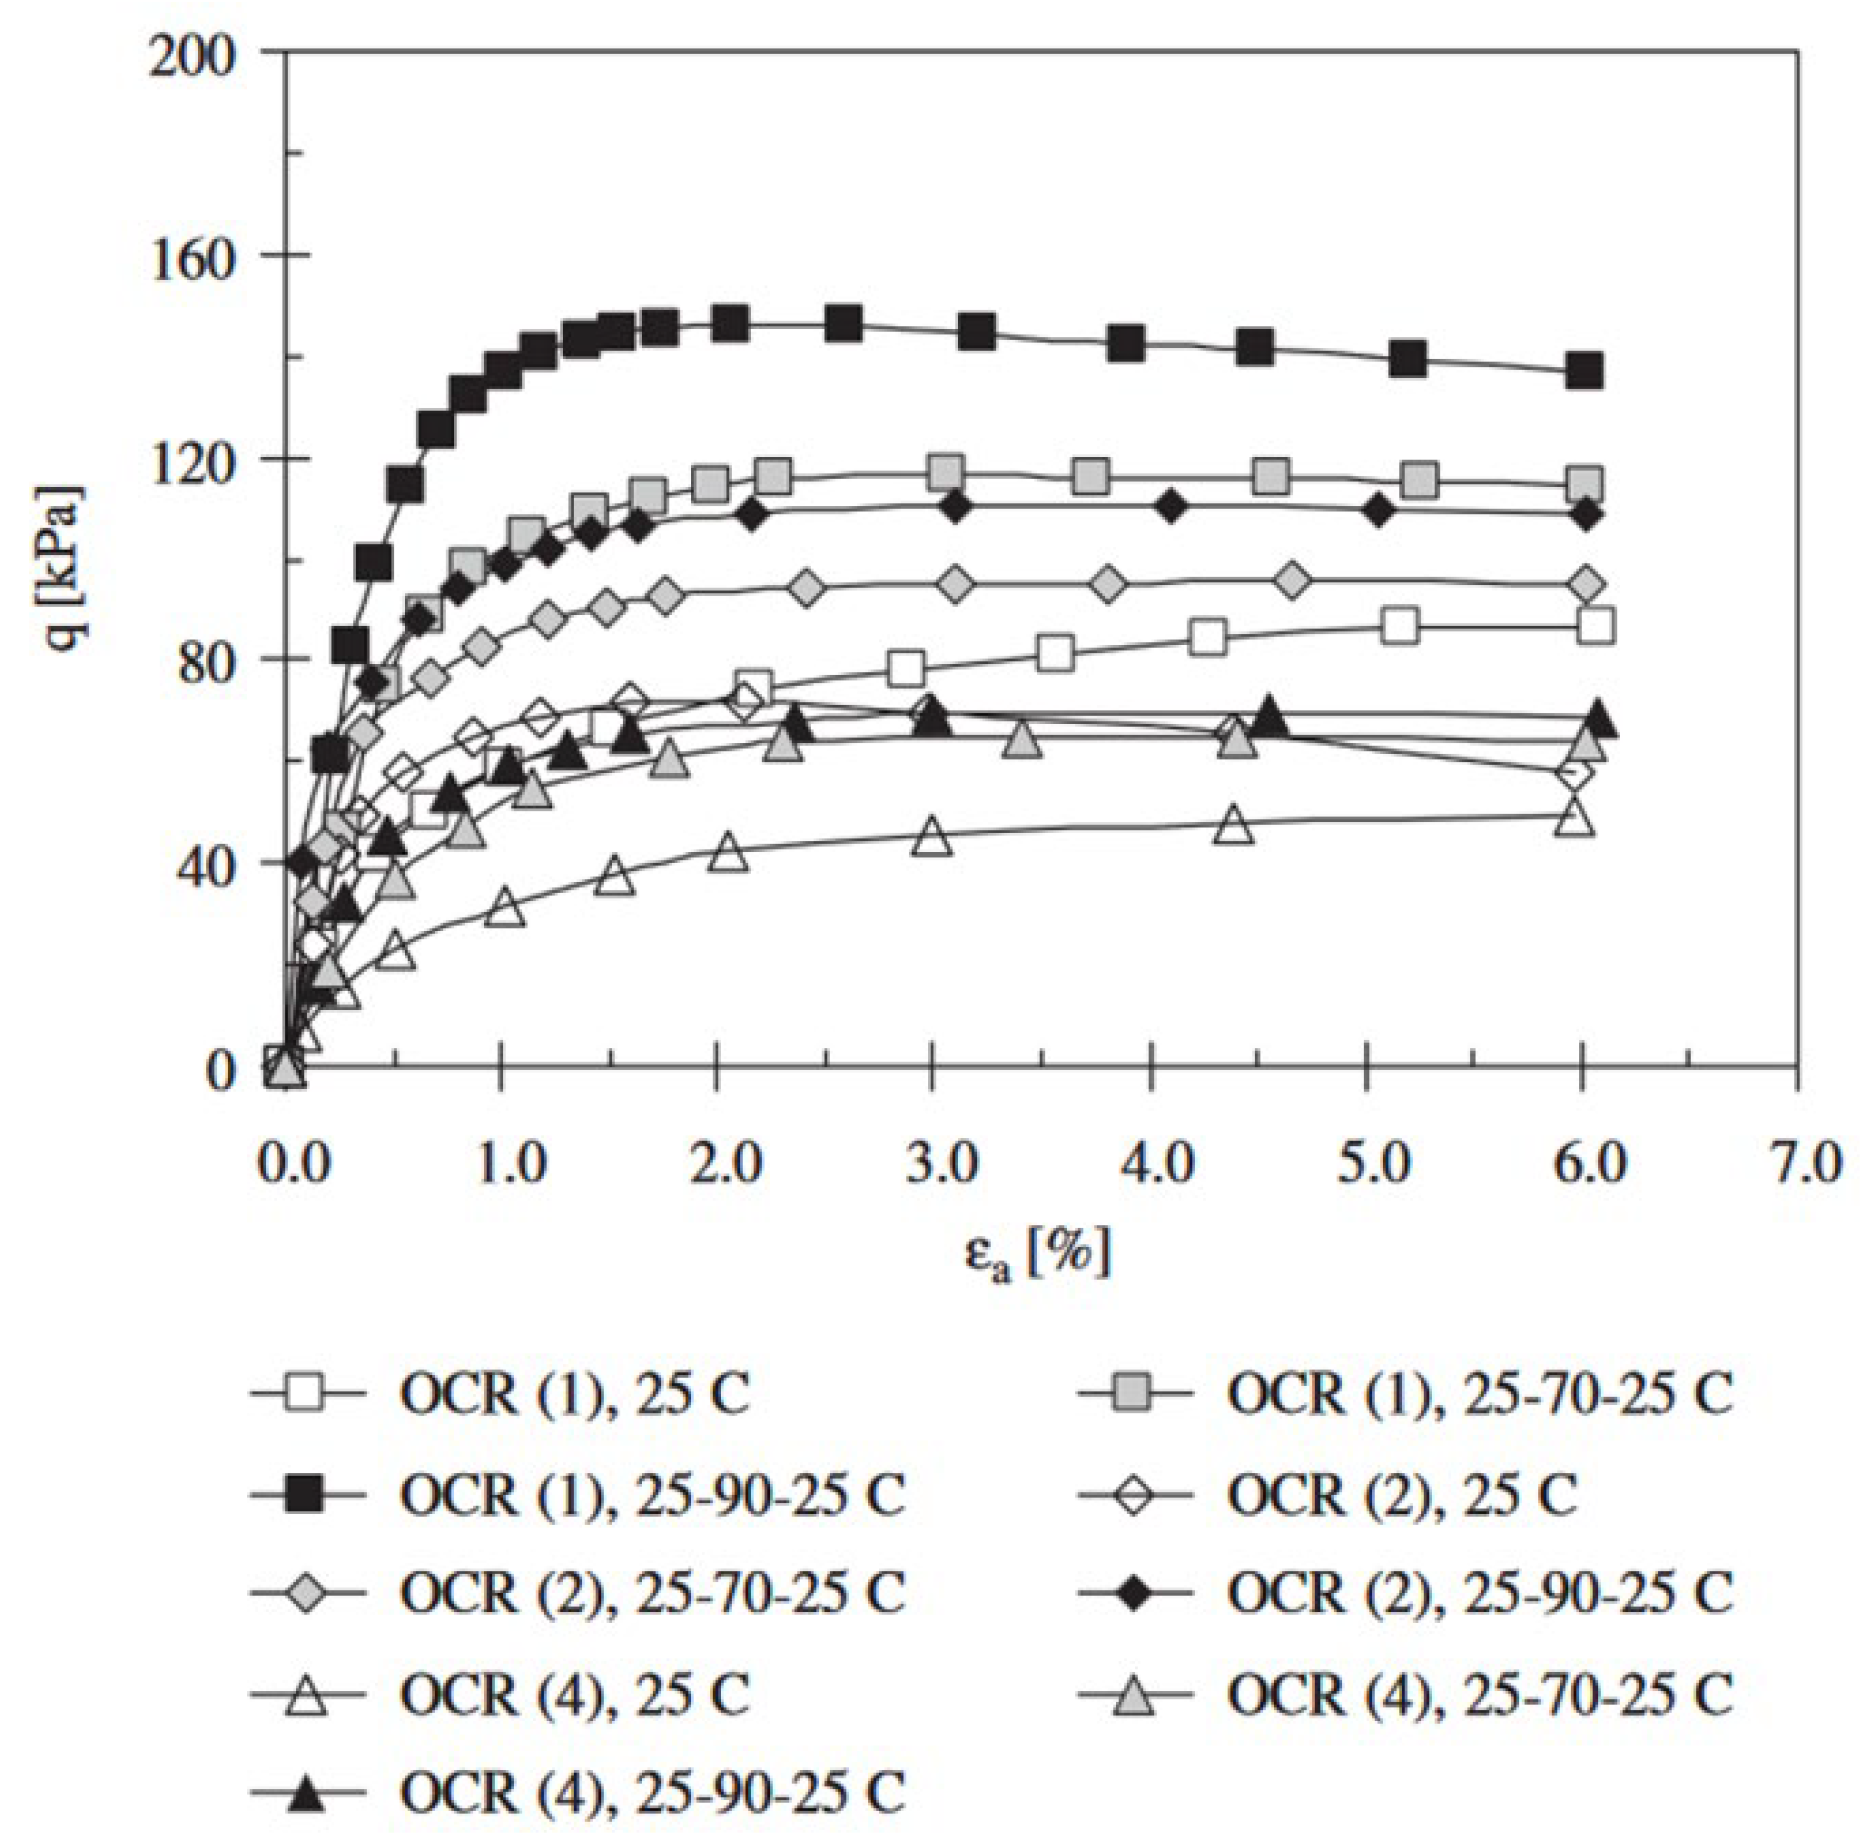
Figure 22 shows the correlation between undrained shear strength (
), in kPa and axial strain (
), in %. The results indicate that the undrained shear strength increases with temperature regardless of the OCR value. For normally consolidated specimens, an increase in temperature from 25°C to 90°C resulted in a 150% increase in undrained shear strength (from 140 kPa to 220 kPa). For over-consolidated specimens (OCR = 1.5), a temperature change from 25°C to 70°C resulted in a 160% increase in undrained shear strength (from 100 kPa to 160 kPa). As the OCR increased, the percentage increase in undrained shear strength decreased from 160% (OCR = 1.5) to 100% (OCR = 9).
= 300
\) kPa) at different temperatures [
57].
In a separate experiment with a pre-consolidation pressure (
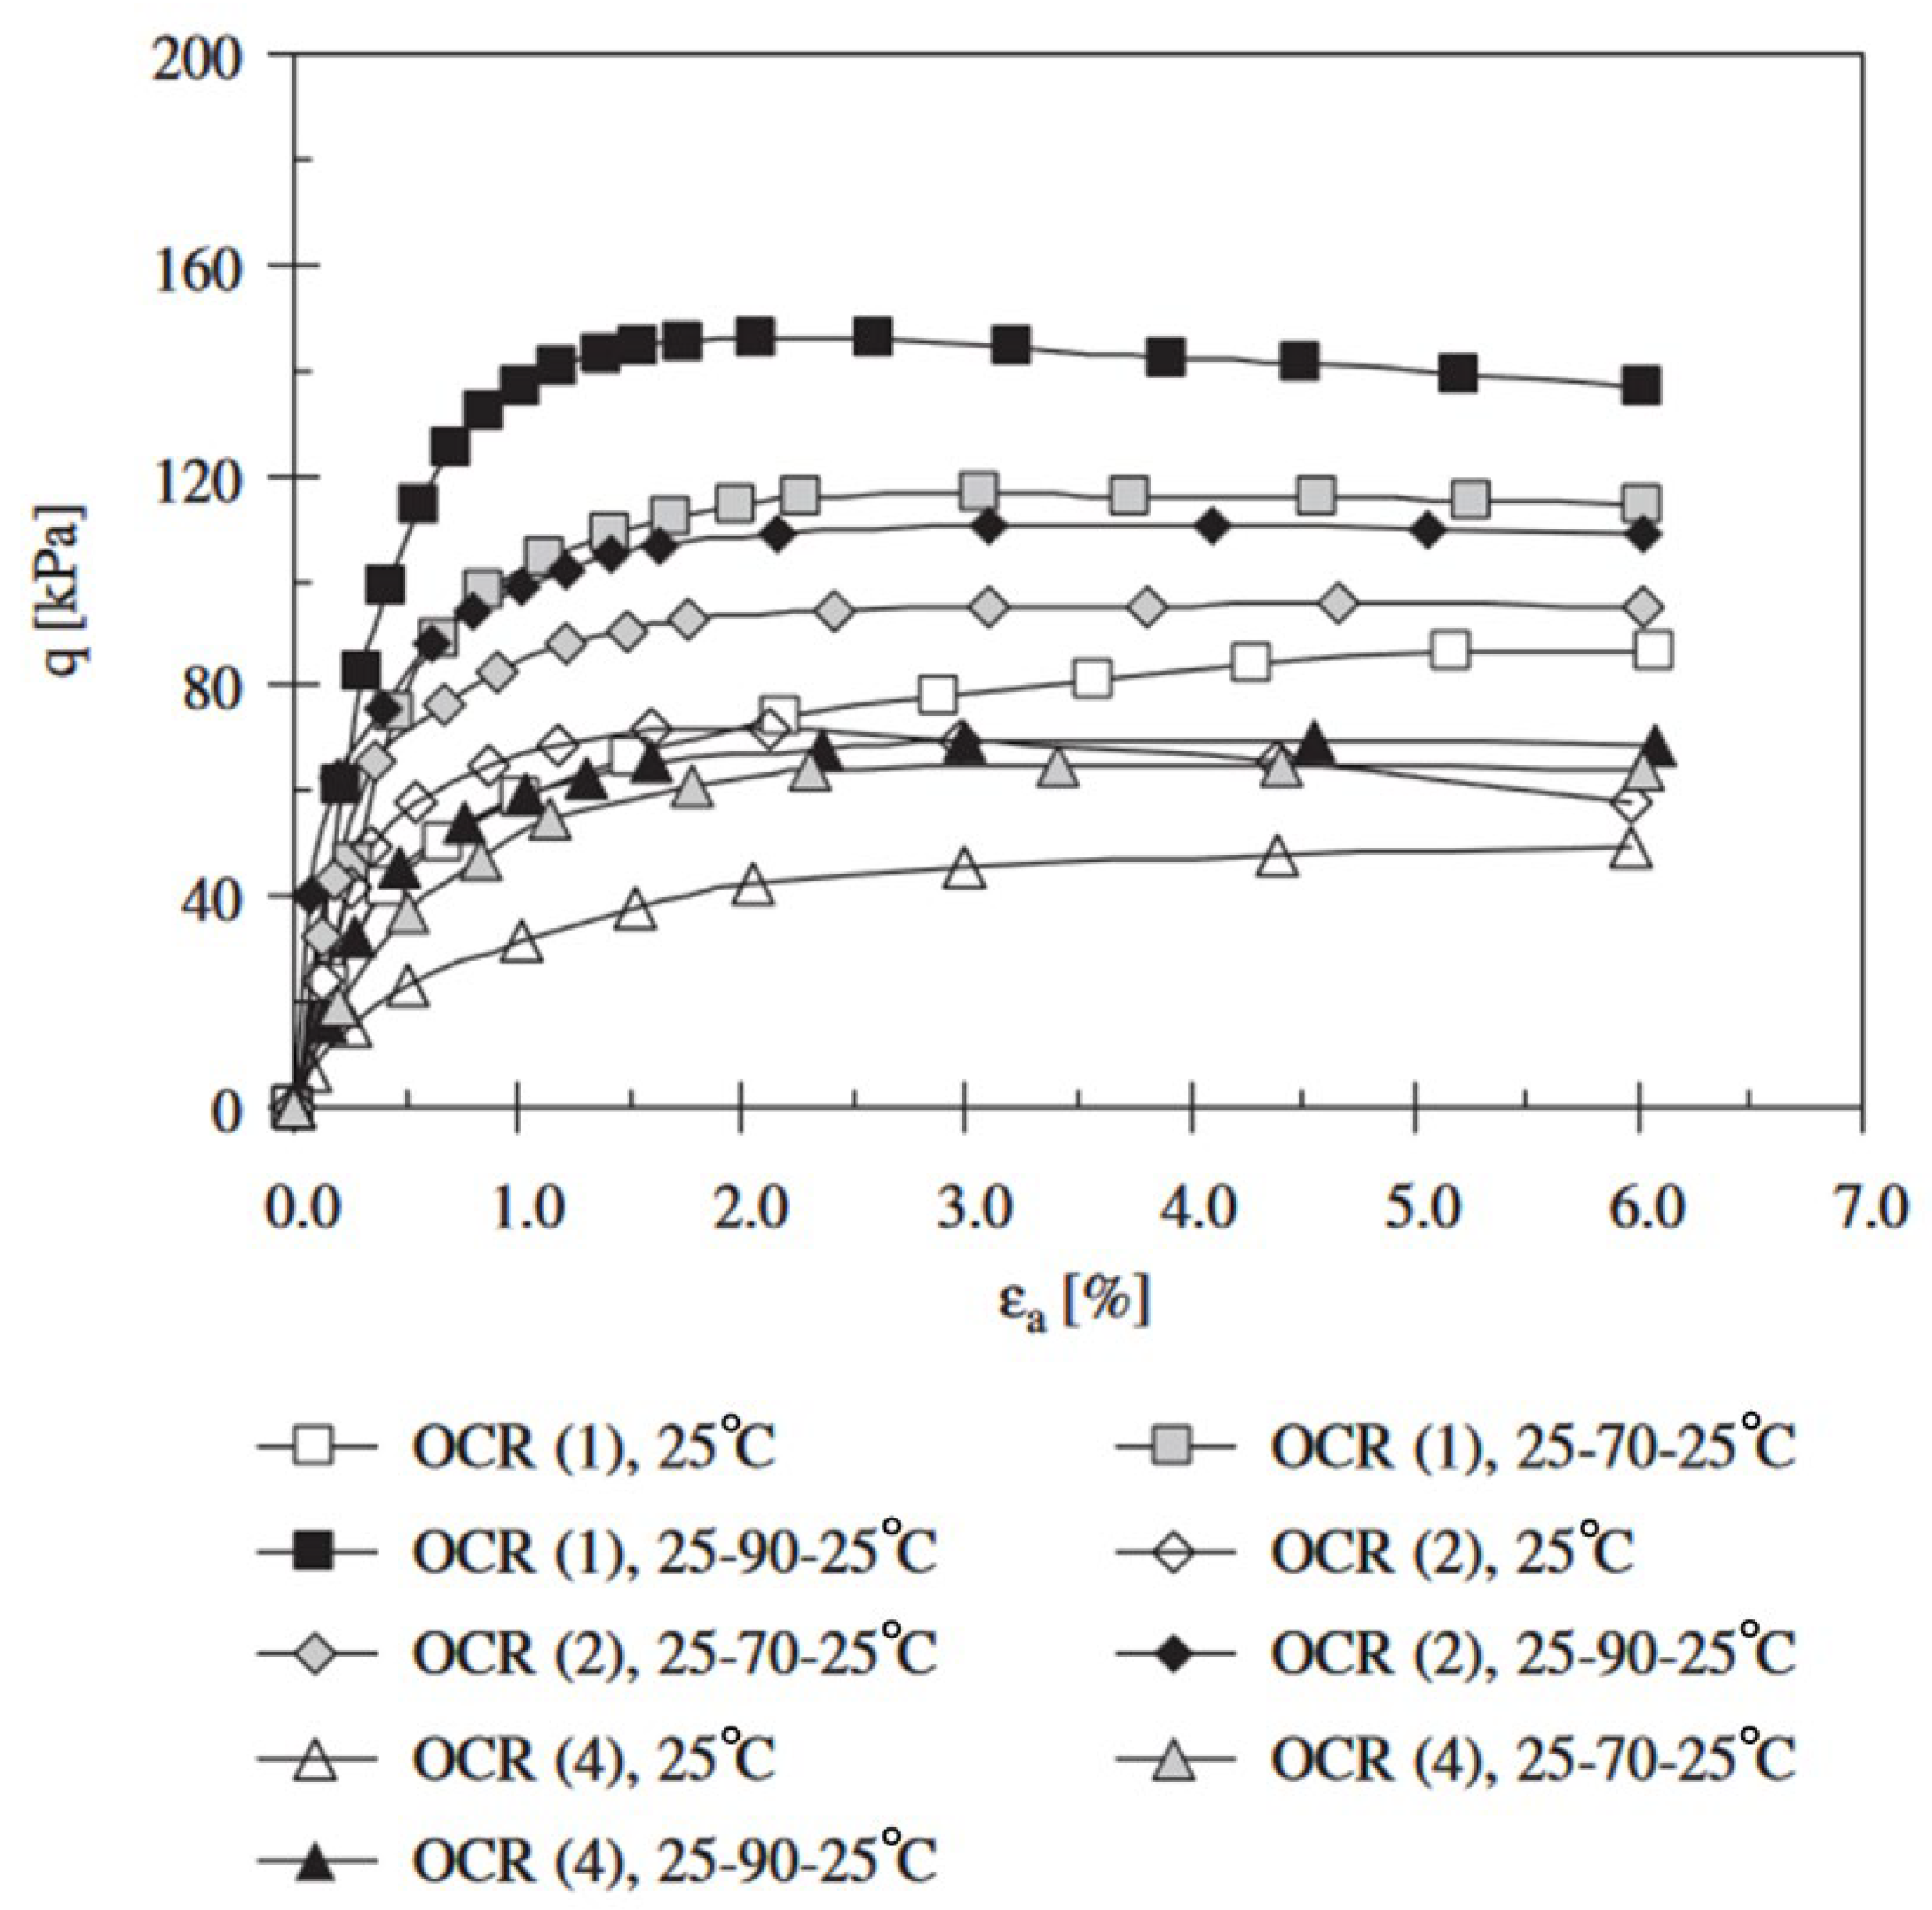
) of 200 kPa under thermal cycling conditions, similar results were observed (
Figure 23), with shear strength increasing with increasing temperature, regardless of OCR.
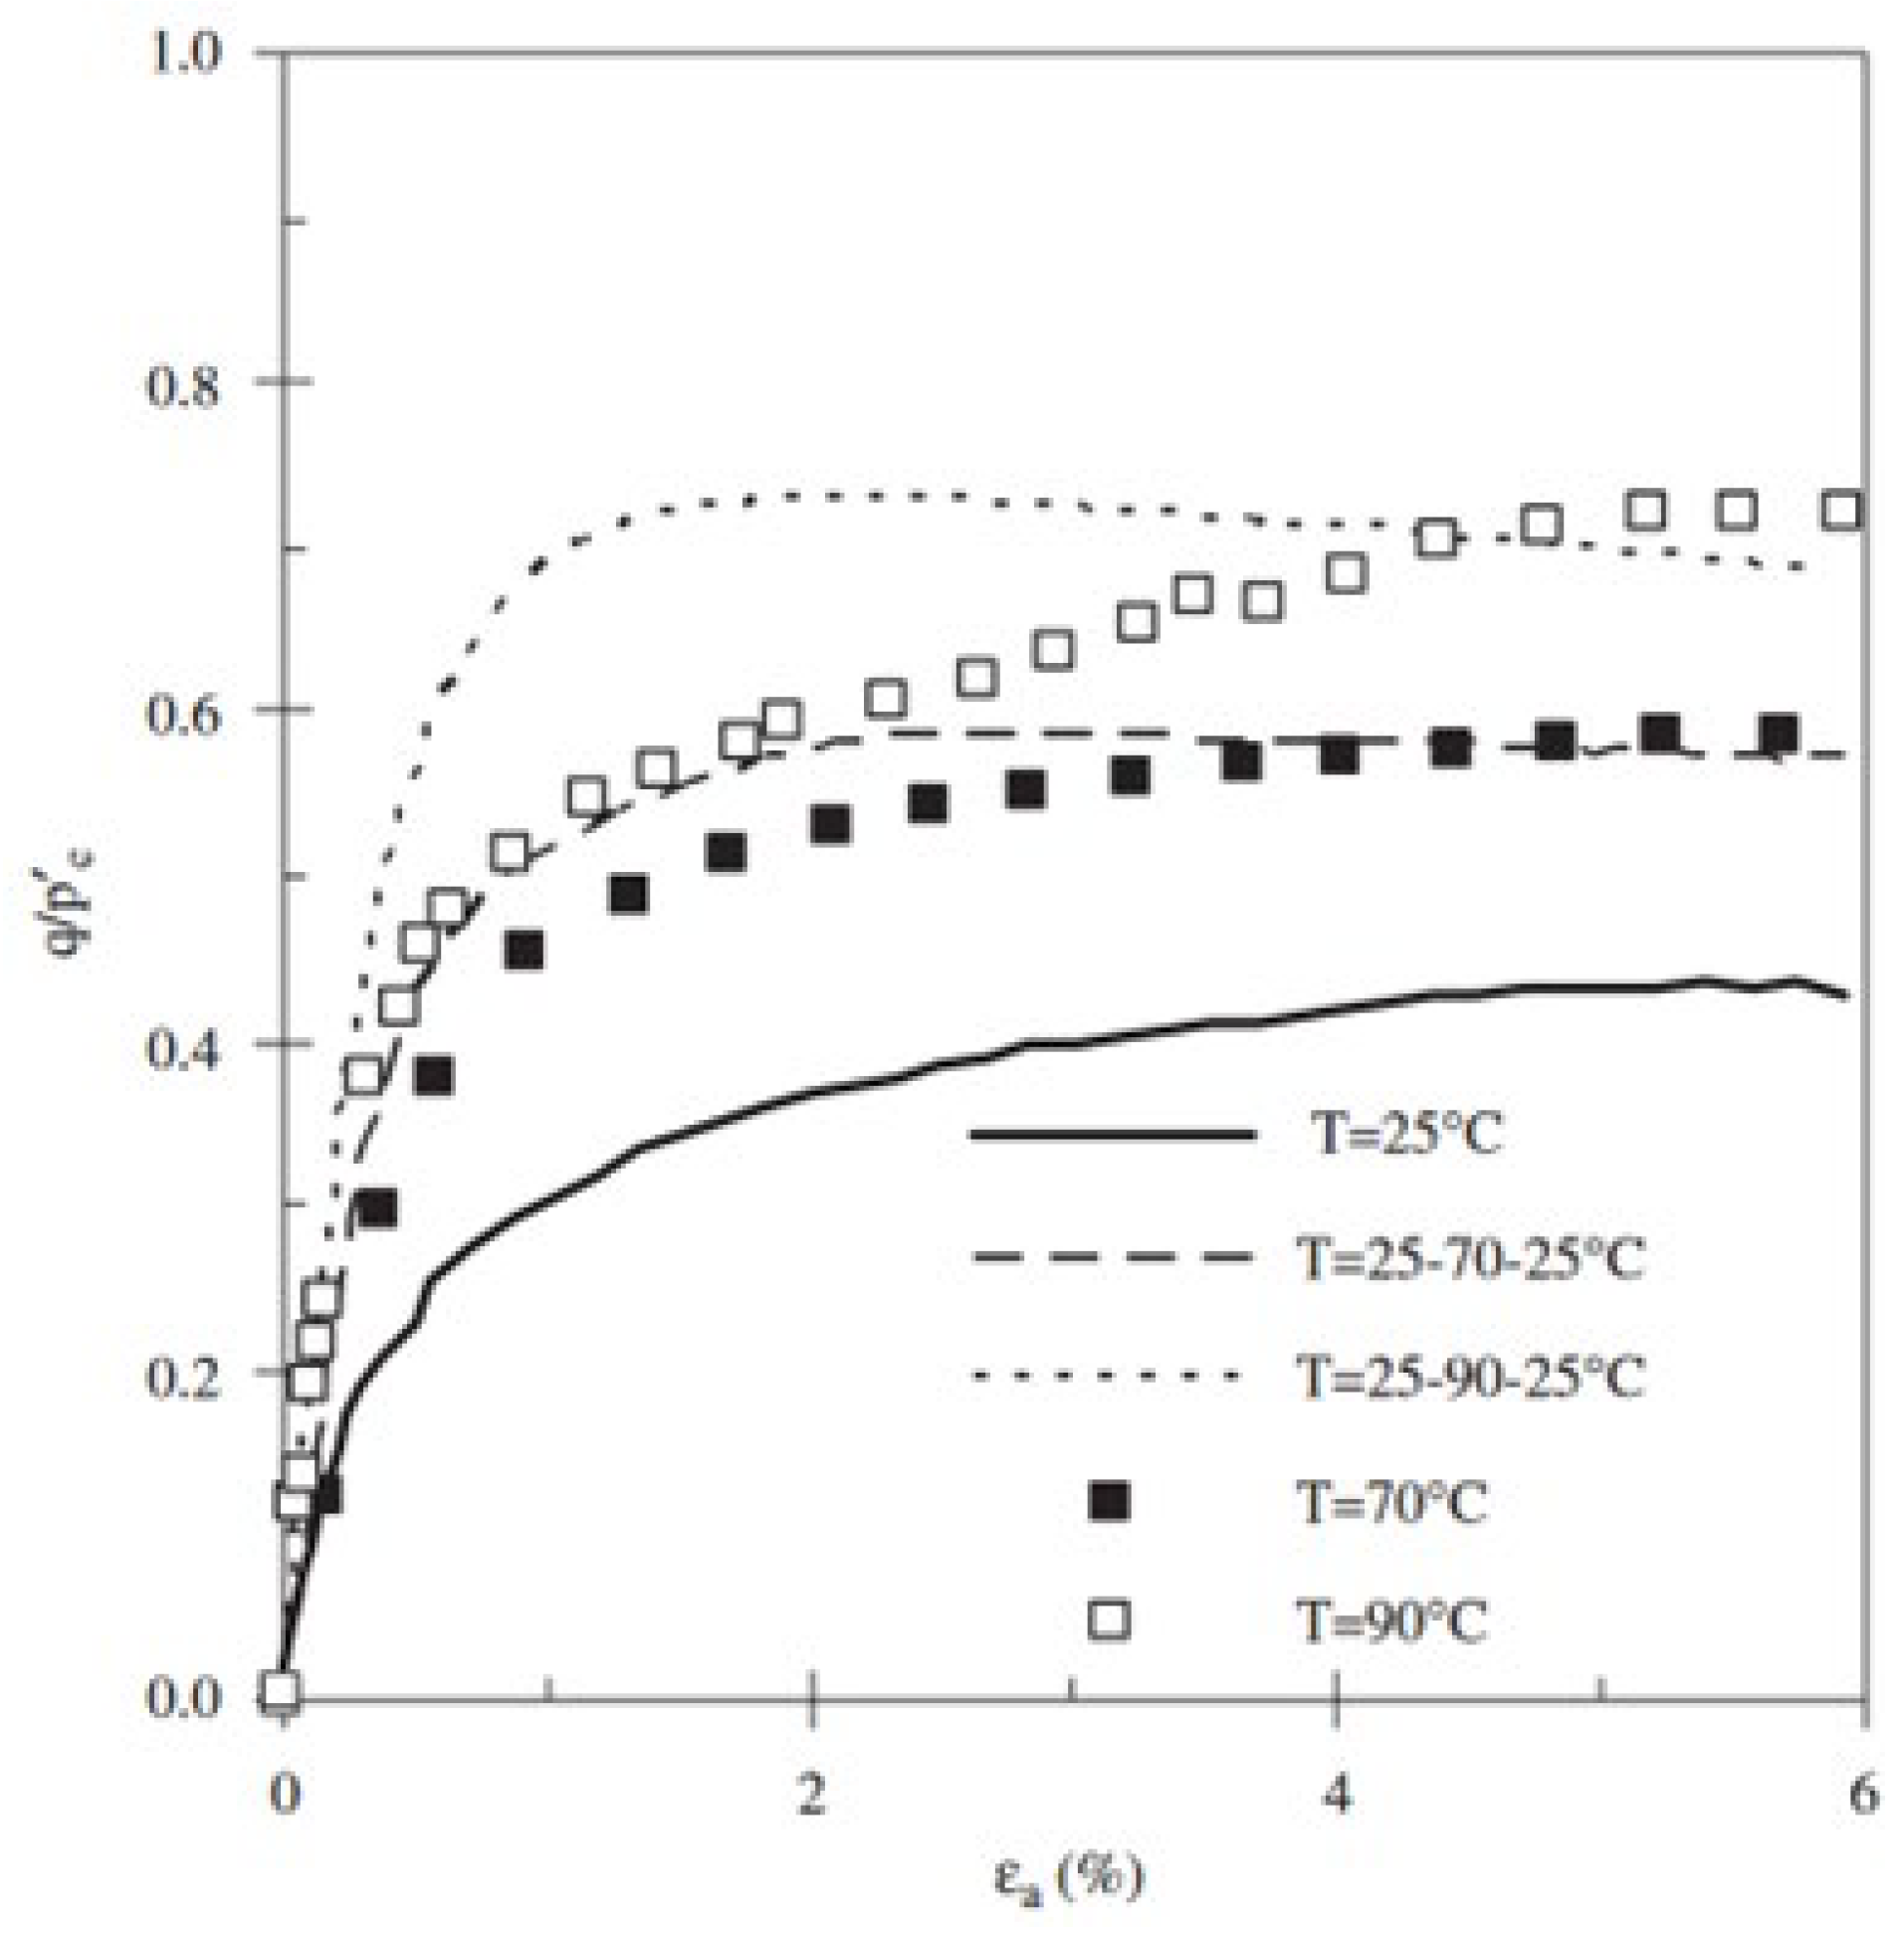
Figure 24 compares the results of normally consolidated specimens under static high temperature and thermal cycling conditions. While the peak deviatoric stress values were similar, the thermal cycling specimens reached peak stress at a lower axial strain compared to those exposed to static high temperature.
These results suggest a potential for significant strength gains; however, they should be interpreted with caution. The observed strength increase was demonstrated under controlled laboratory conditions, and its applicability to real-world scenarios requires further validation.
6.3. Thermal Cyclic Effect on Volume Changes and Consolidation
Abuel-Naga et al. [
57] conducted a series of experiments using temperature-controlled triaxial and oedometer tests to investigate the effects of thermal cycling on Bangkok clay specimens. The temperature was varied between 25°C and 90°C. The specimens included both normally consolidated and over-consolidated clays, with over-consolidation ratios (OCR) ranging from 1 (normally consolidated) to 2, 3, 4, and 9 (highly over-consolidated), representing the maximum stress the soil had previously experienced.
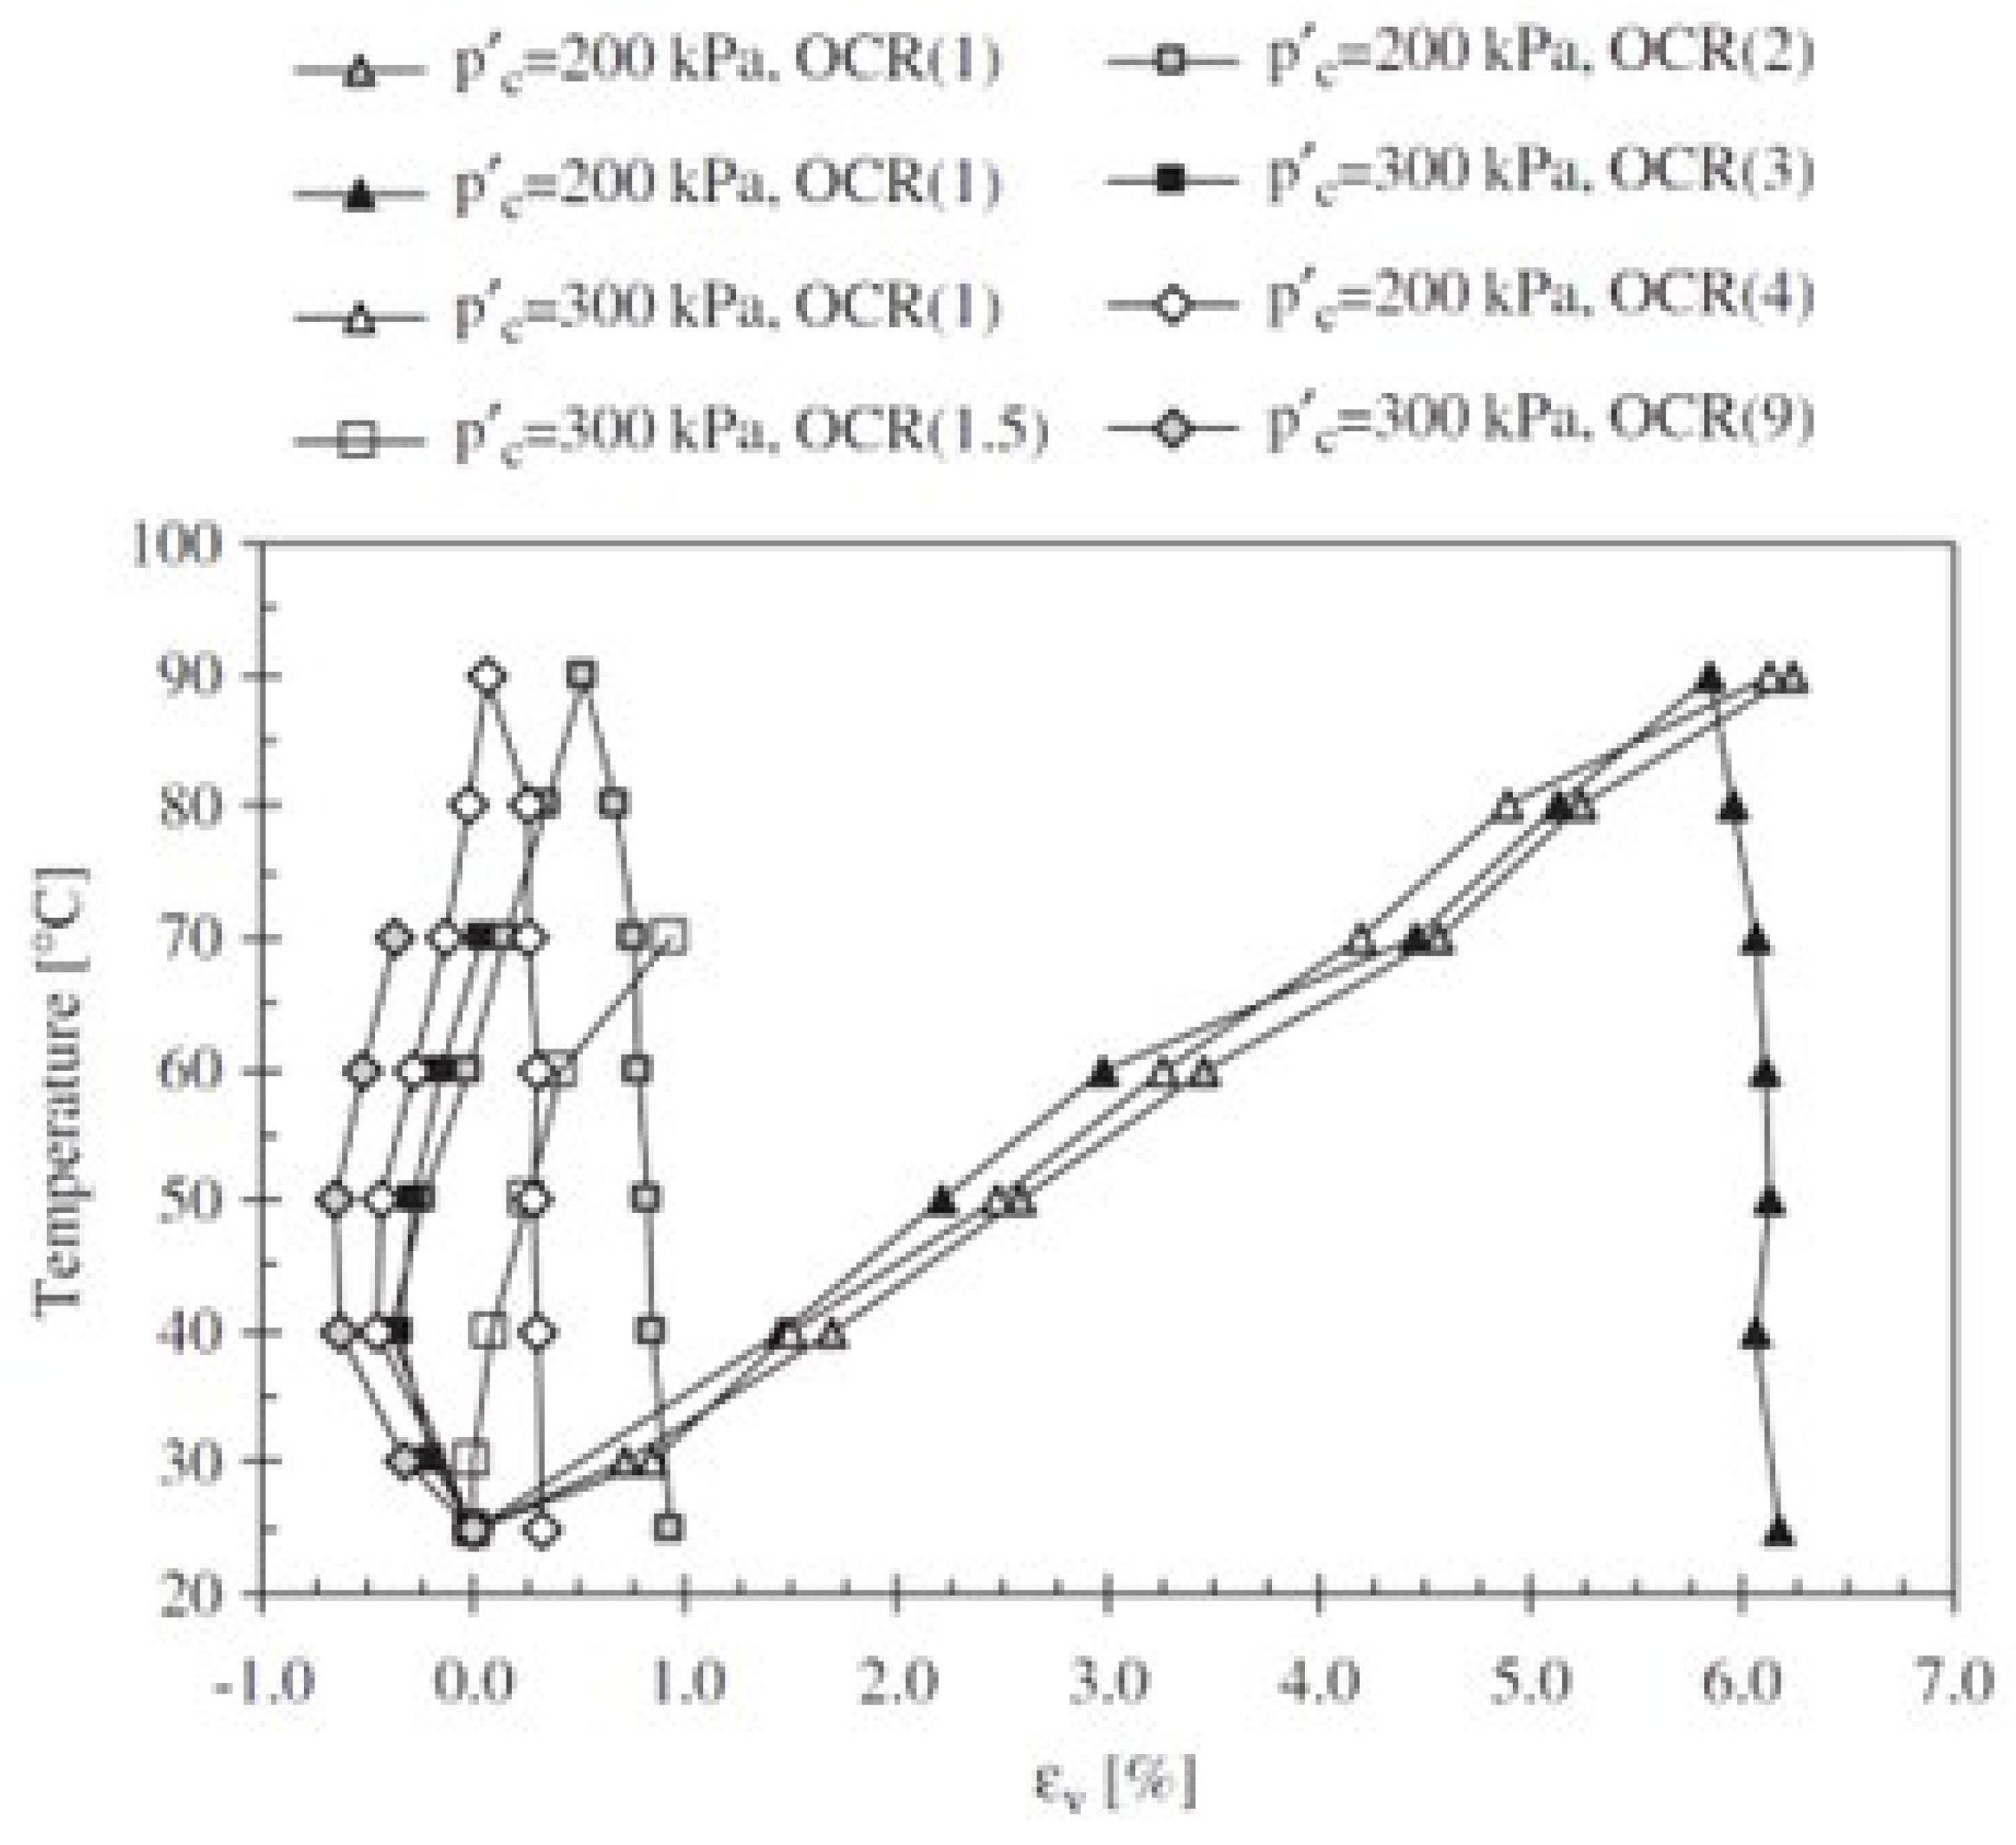
Figure 25 illustrates that normally consolidated soft Bangkok clay with an OCR of 1 to 1.5 exhibited shrinkage behavior, as indicated by a 6% increase in volumetric strain (
), which correlated directly with the increase in temperature. This volume change behavior was not significantly affected by the applied stress (200 and 300 kPa), as the recorded strain paths were nearly identical. However, irreversible contraction was observed with decreasing temperature.
For highly over-consolidated clay specimens (OCR 2 to 9), the results showed swelling behavior, indicated by a negative volumetric strain with a maximum value of -0.75% at the initial temperature increase. As the temperature continued to increase, a small contraction occurred, reaching up to 0.5%, but less pronounced than in lightly consolidated specimens. Similar behavior has been observed in other fine-grained clays from different locations, as reported in studies by Hoseinimighani and Szendefy (2022), Burghignoli et al. (2000), Cekerevac et al. (2010, 2004), and Laloui et al. (2003) [
58,
59,
60,
61,
62].
Exposure to high temperatures can cause irreversible contraction in normally consolidated clays, with the extent of contraction increasing with the amplitude of the temperature cycle. In contrast, over-consolidated clays tend to expand reversibly. These volumetric changes must be considered in the design of energy piles as they can affect the stability and positioning of the pile. Exposure to high temperatures can significantly alter the volume and other physical properties of different soil types, depending on initial conditions, thermal treatment, and specific temperature ranges. Understanding these effects is essential for applications in geotechnical engineering and environmental remediation.
6.4. Thermal Cyclic Effect on Permeability and Pore-Water Pressure
Higher temperatures reduce water viscosity, allowing it to flow more easily through the pores of multiphase materials, such as soil. The overall permeability of cohesionless soils, like sand, is generally higher than that of fine-grained cohesive soils. Thermal expansion can also alter the soil structure, creating additional pathways for water movement. However, the effects of increased temperature on the permeability of fine-grained soils are less explored.
Abuel-Naga et al. (2008) [
63] and Bergado and Soralump (2005) [
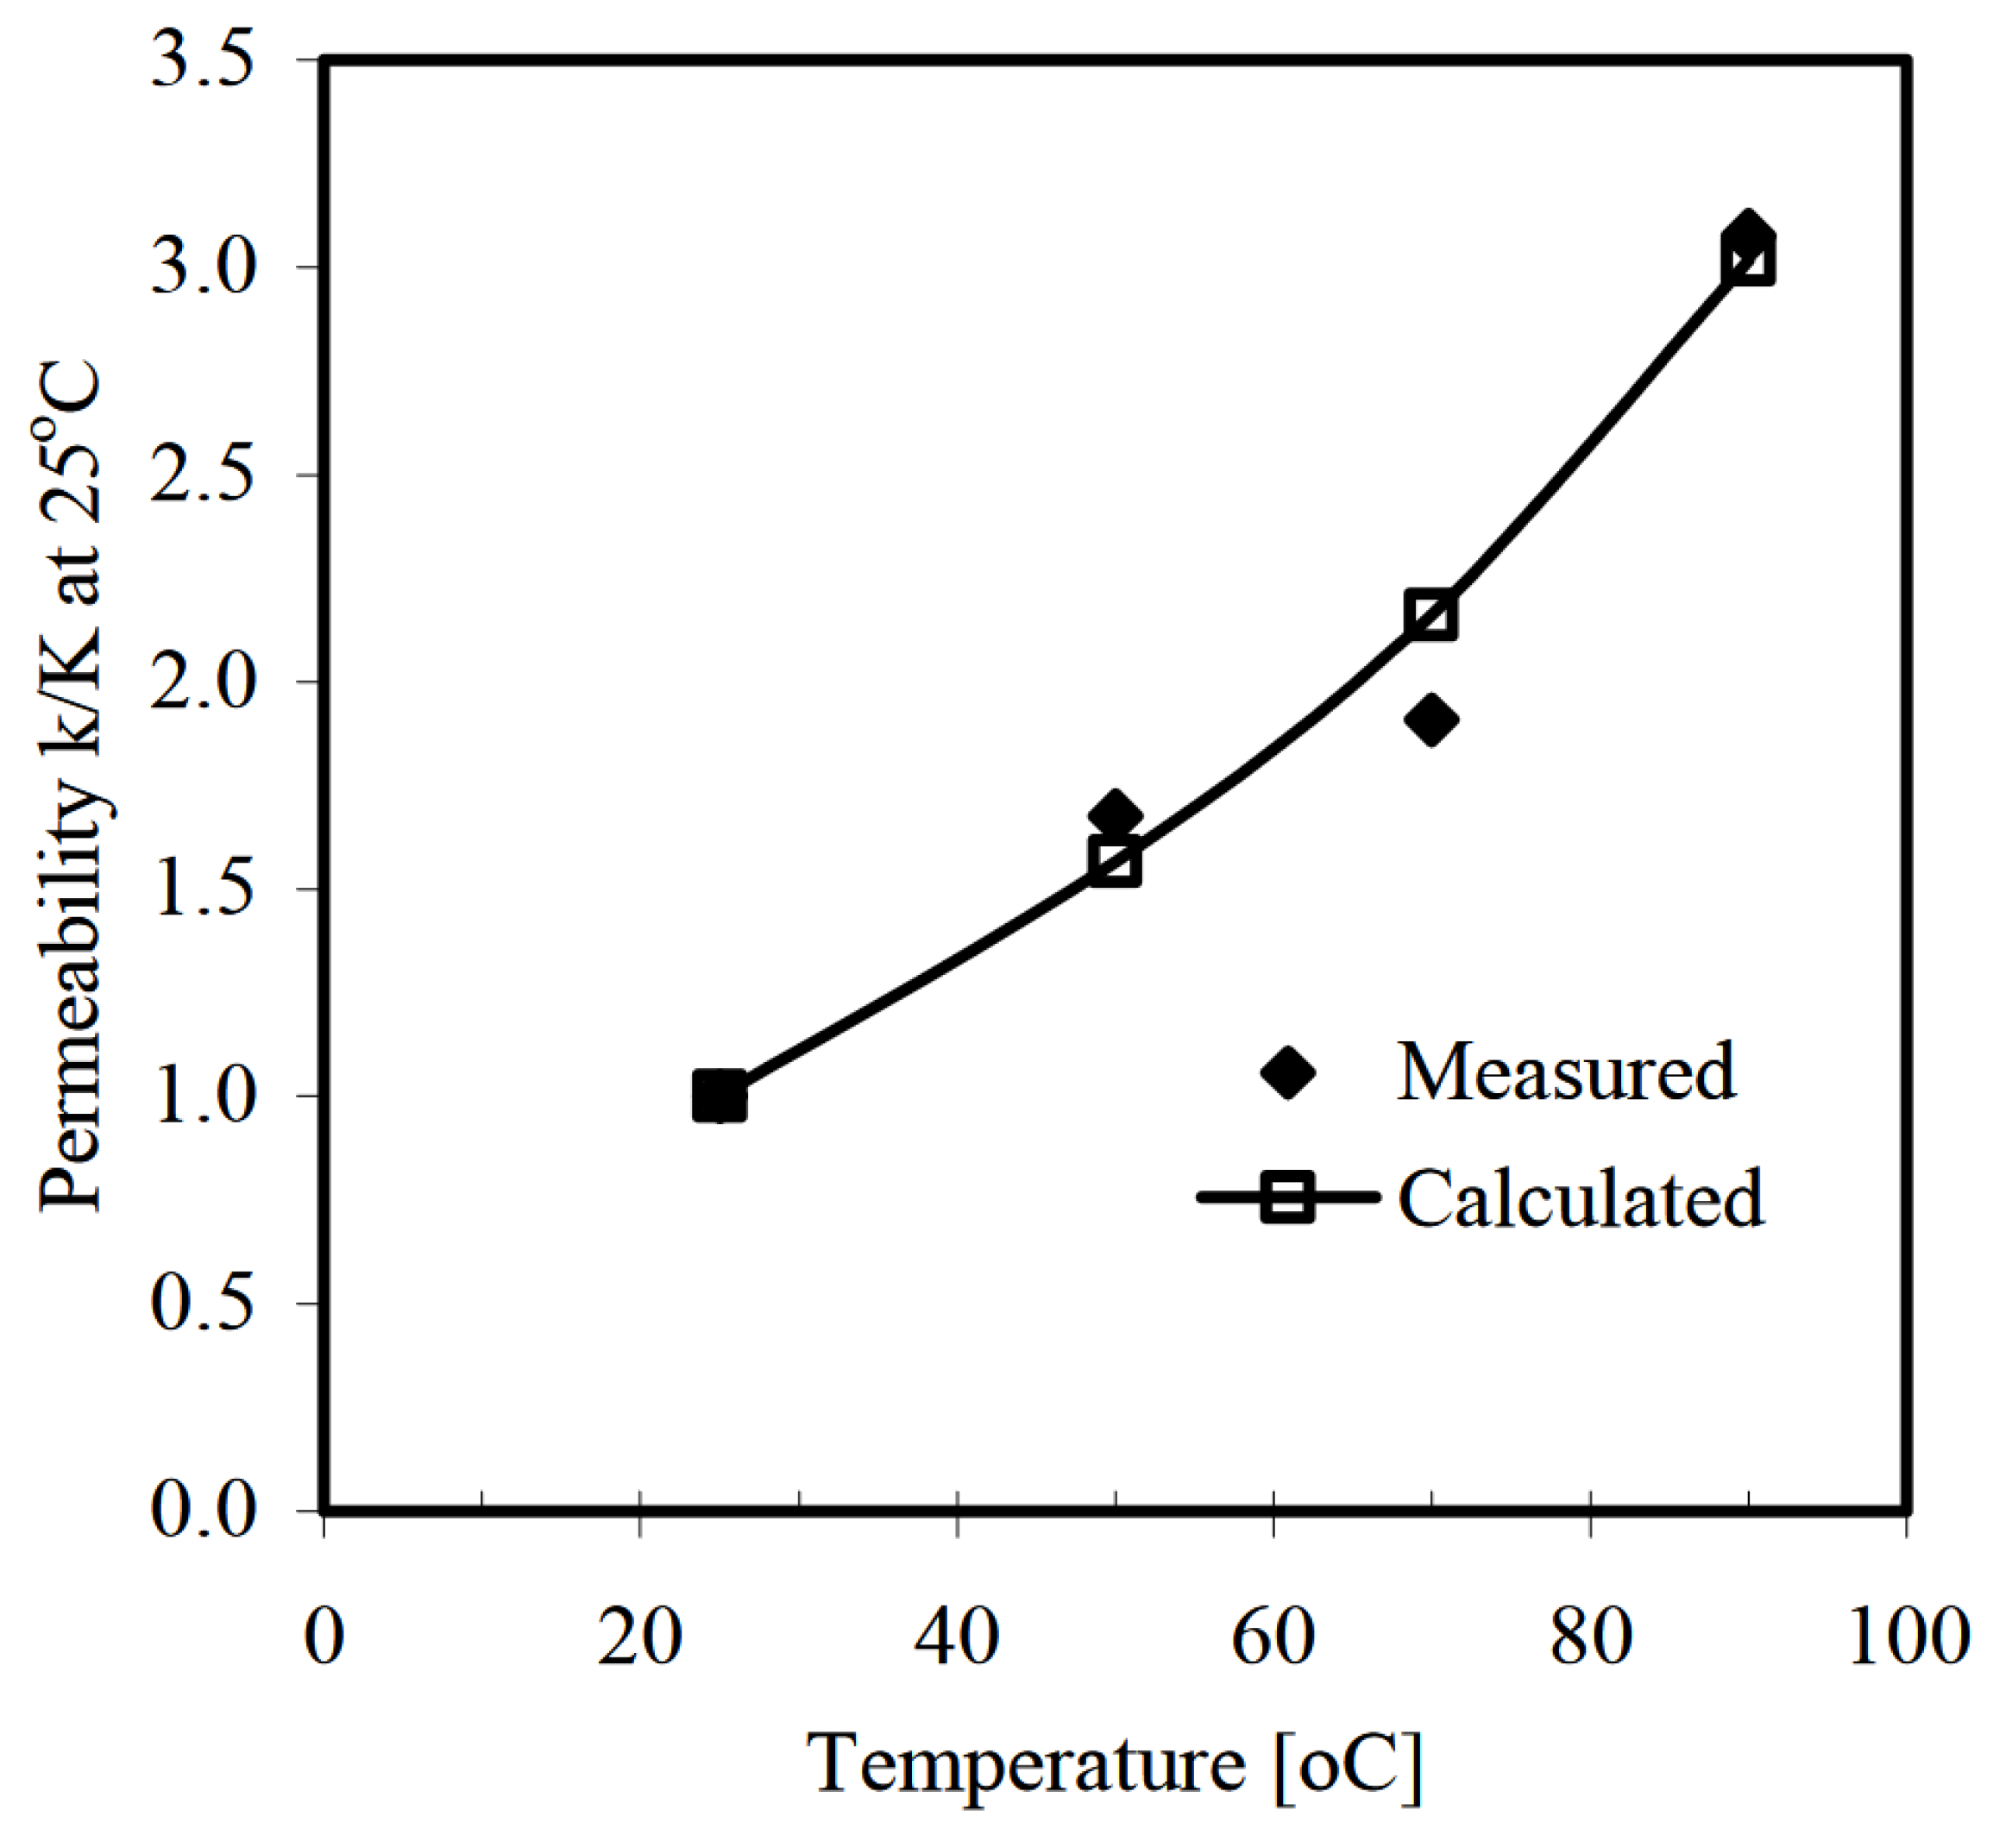
64] conducted experiments on Bangkok clay samples using temperature-controlled oedometers, raising temperatures up to 90°C to observe thermal responses. Their results indicated a positive correlation between soil temperature and normalized hydraulic permeability. As shown in
Figure 26, the permeability of soft Bangkok clay increased nearly threefold at 90°C compared to the permeability at an ambient ground temperature of around 30°C. However, in practical applications, such as energy piles and GSHP systems, the heat transfer fluid temperatures are unlikely to reach near-boiling points, so these laboratory results may not directly reflect real-world conditions.
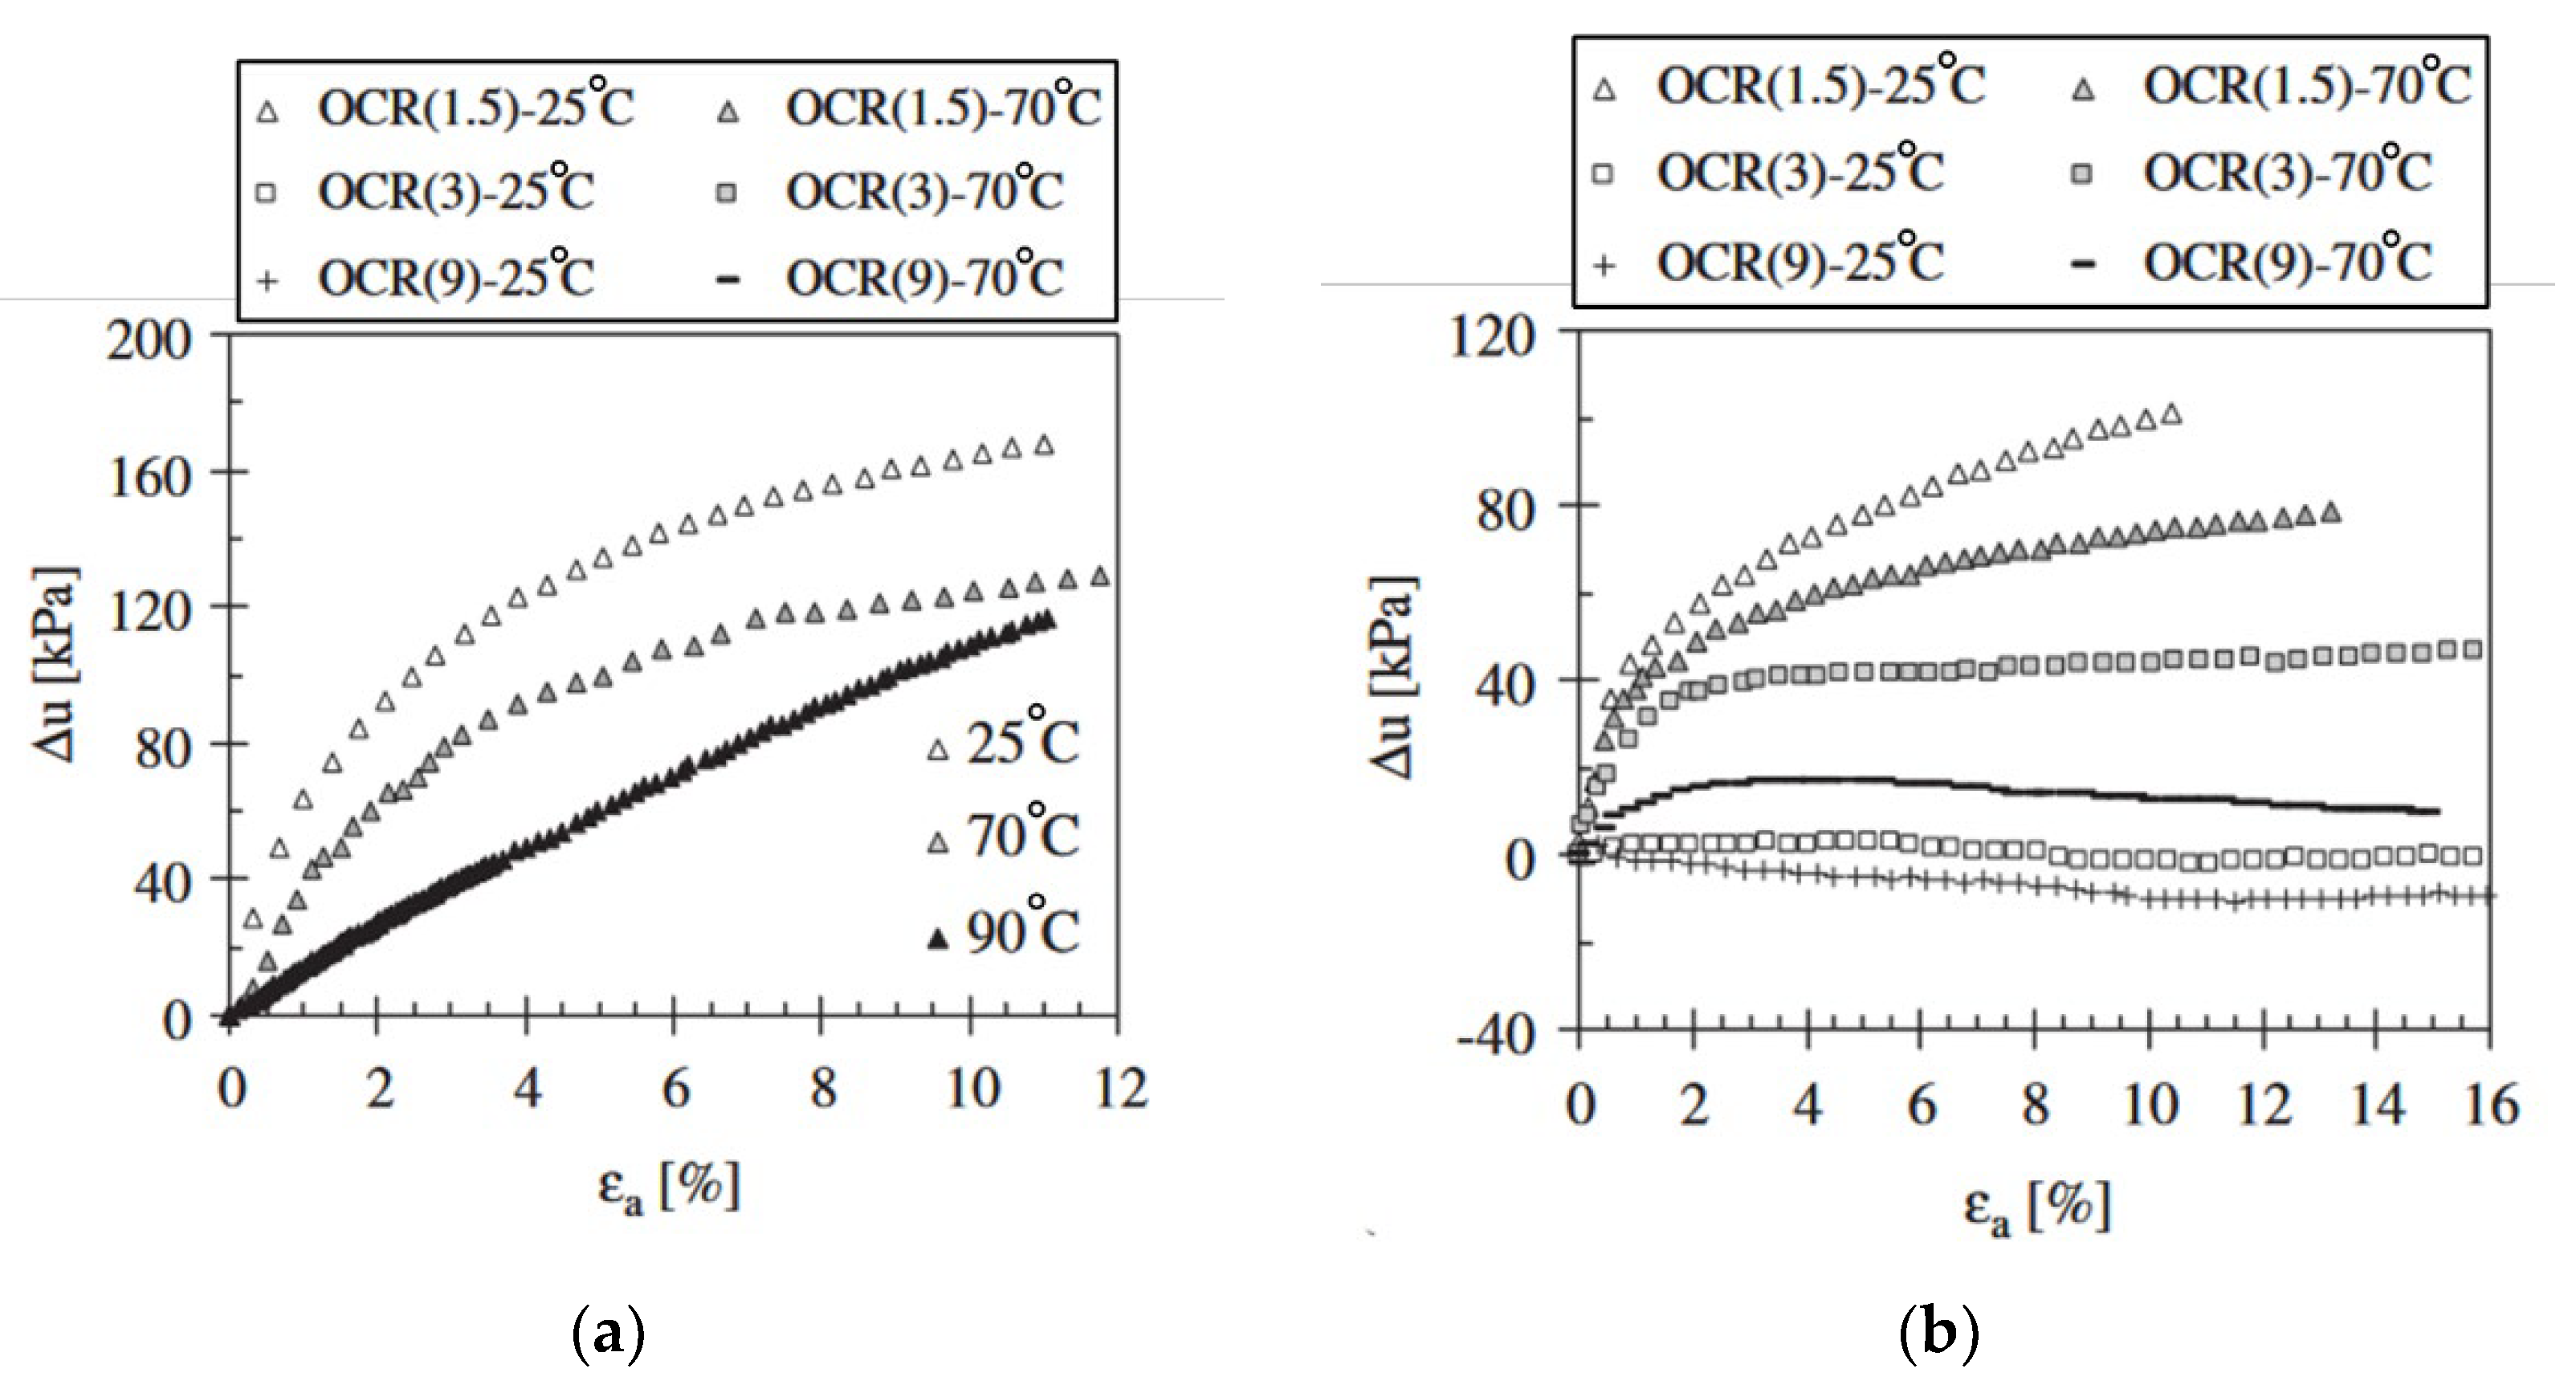
Regarding the pore water pressure (∆u) shown in
Figure 27, Abuel-Naga et al. (2006) [
57] found that at fixed elevated temperatures (70°C and 90°C) in normally and slightly overconsolidated clay samples, the pore water pressure decreased by about 25% (from 160 kPa to 120 kPa) with increasing soil temperature. In contrast, for highly over-consolidated specimens, excess pore-water pressure increased with rising temperature. Under thermal cyclic loading (temperature cycles of 25°C - 70°C - 25°C and 25°C - 90°C - 25°C), excess pore-water pressure decreased in both normally, lightly over-consolidated, and over-consolidated specimens, as shown in
Figure 28.
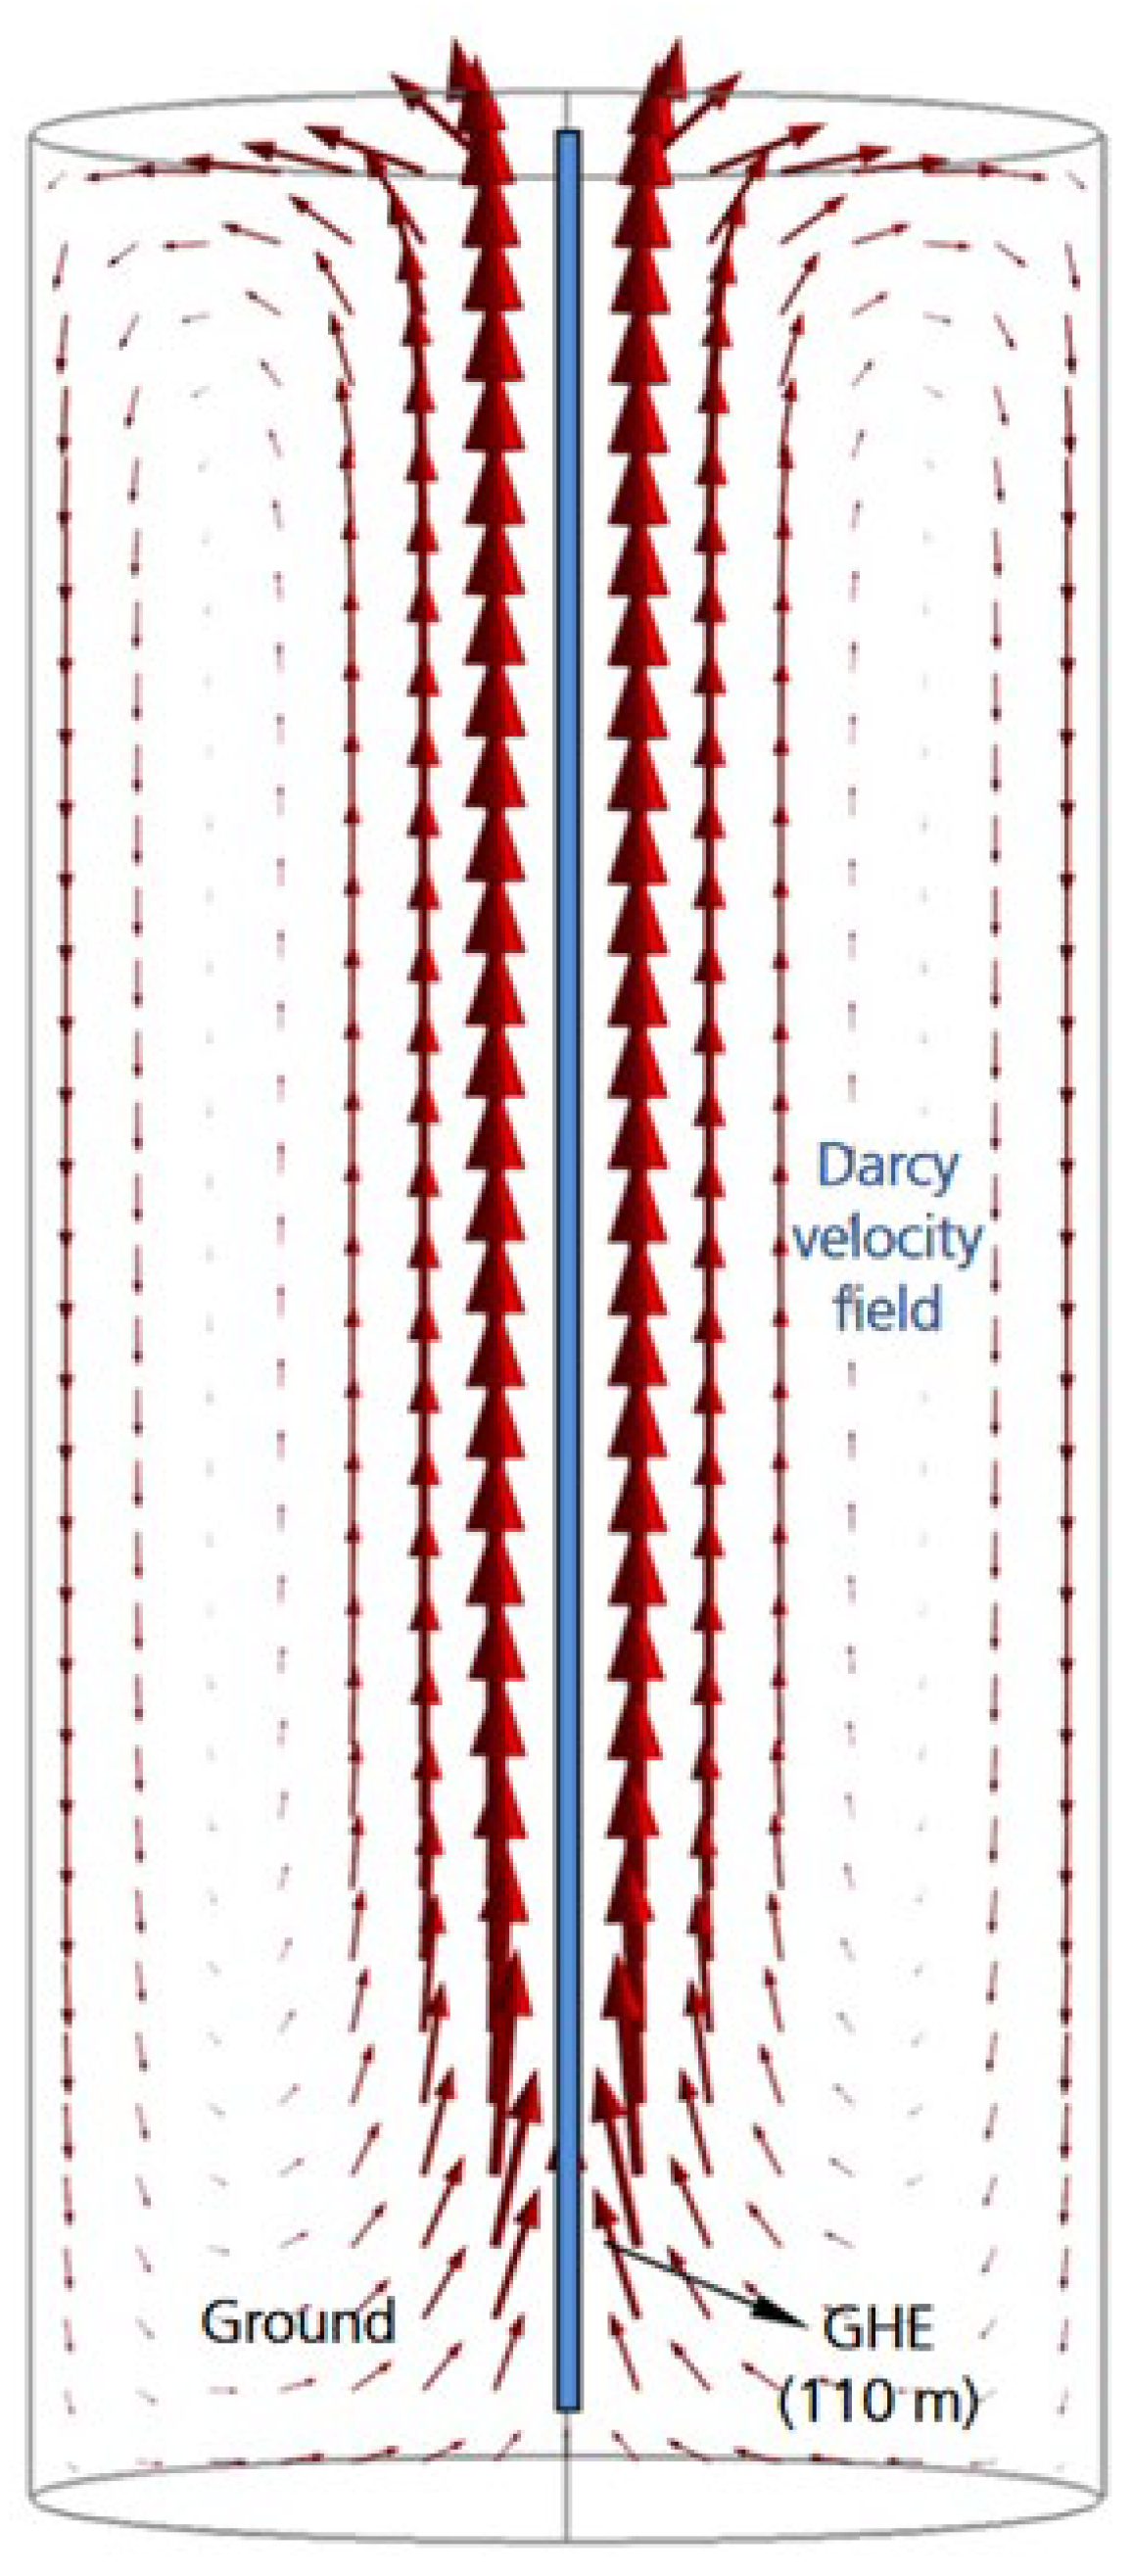
An additional finding is that heat released from energy piles or ground-embedded heat exchangers affects groundwater flow paths. Bidarmaghz et al. (2016) [
65], using data from Lee et al. (2008) [
66], conducted a computational simulation of a 30 m-long single U-loop ground heat exchanger in a saturated soil stratum. The results, shown in
Figure 29, indicate that thermally induced groundwater circulation occurs in a vertical cyclic pattern, with more distinct Darcy velocities near the heat exchanger’s surface. The temperature gradient around the heat exchanger, influenced by variations in heat exchanger fluid circulation, enhances groundwater density changes, increasing Darcy velocity and promoting natural convection.
7. Economic Evaluation for Energy Piles
7.1. Life Cycle Cost Analysis (LCCA) Method
Evaluating the economic feasibility of energy piles is essential because even well-designed and engineered systems may not be adopted if they do not provide a return on investment. An investment that is not financially viable will deter owners or investors due to potential financial losses.
A key element of any business model is understanding the initial budget and operating costs. For energy piles and GSHP projects, these costs are primarily related to construction materials and labor. Life cycle cost analysis (LCCA) is a method used to assess the total economic value of a project by analyzing its initial, operating, maintenance, and disposal costs over its entire life. This approach is particularly useful for estimating all necessary expenditures in a business model.
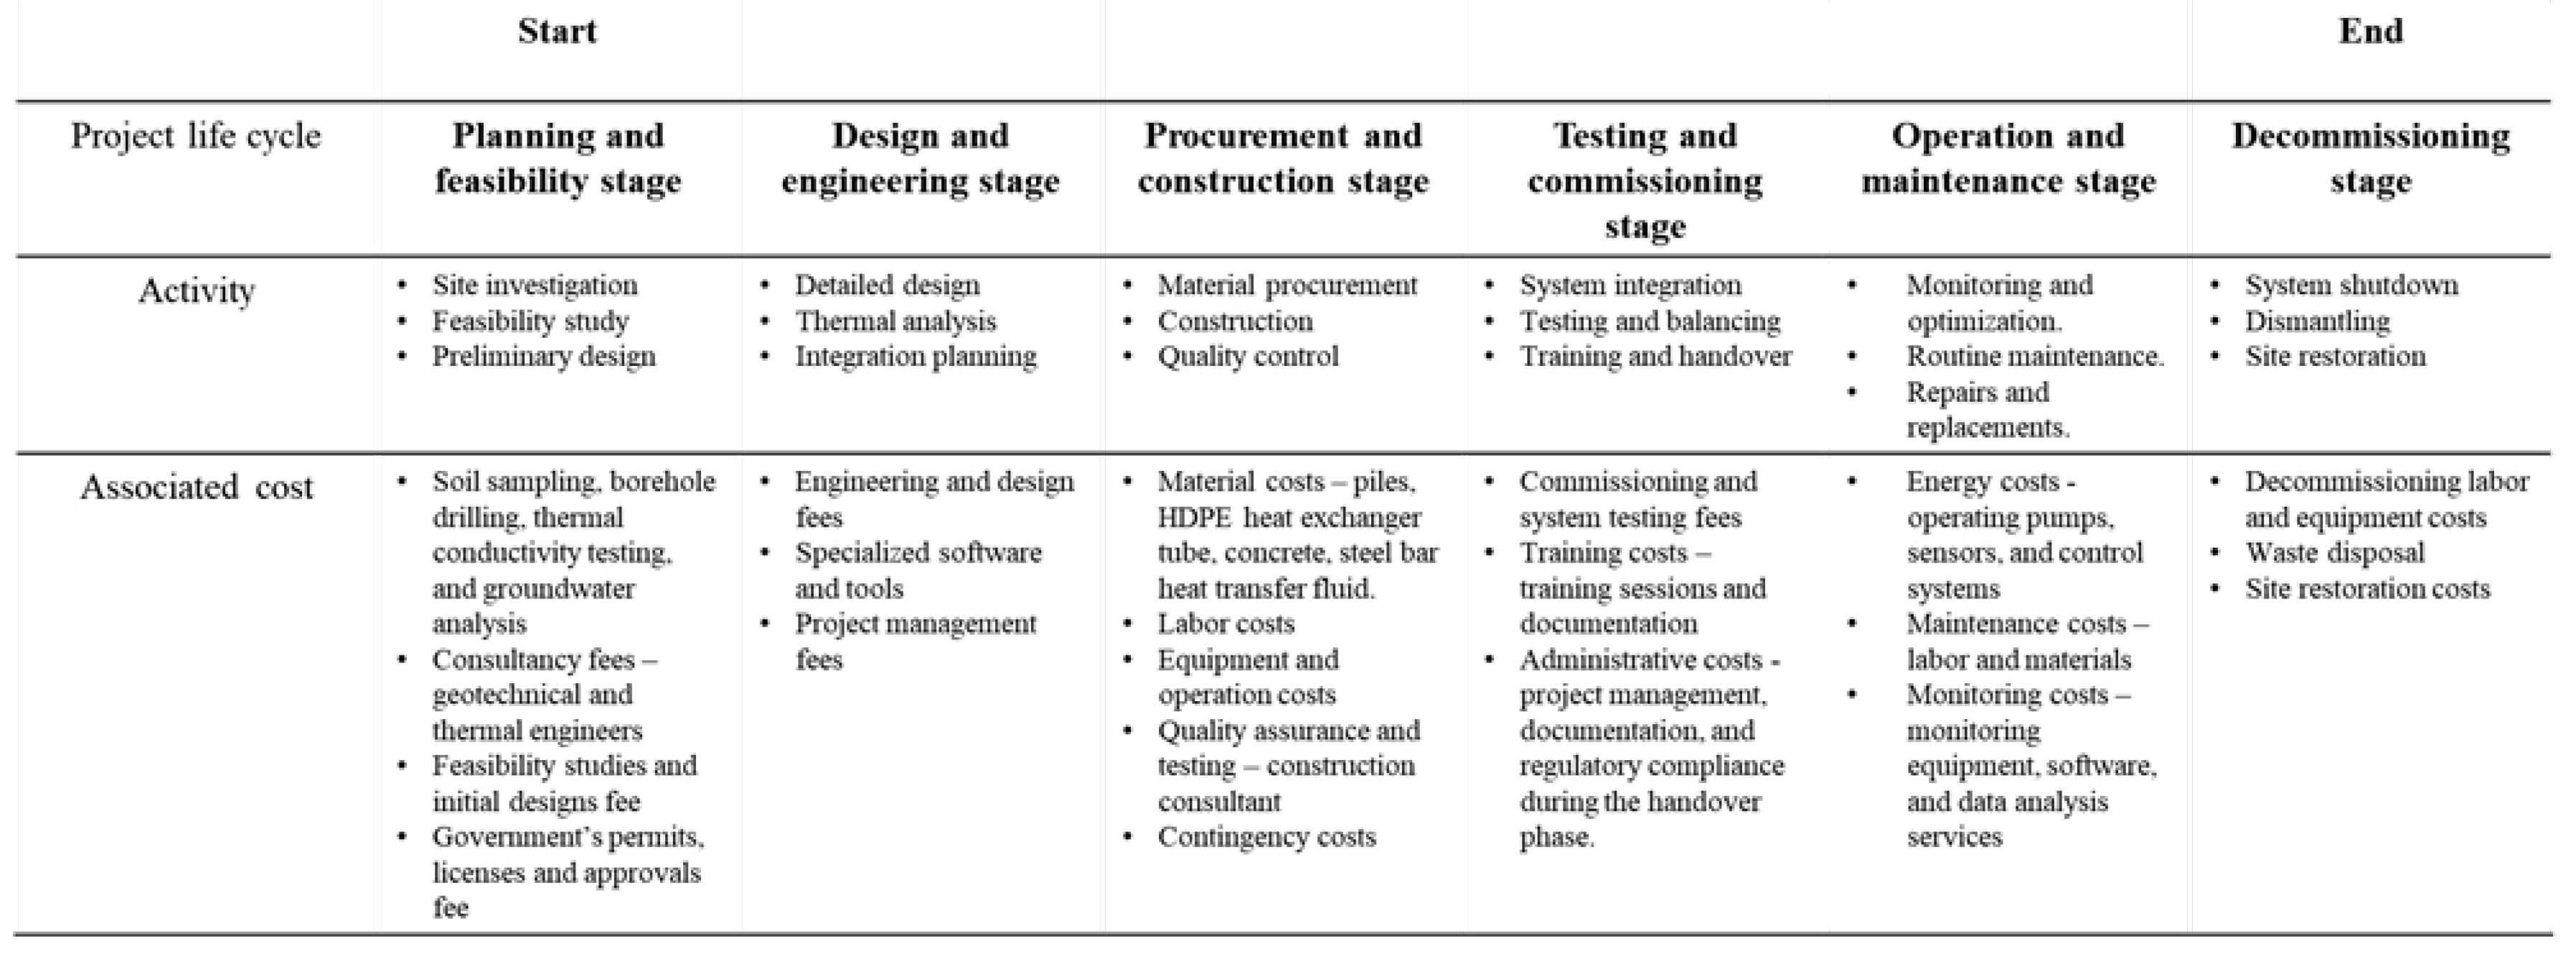
LCCA considers costs in six different phases of the project life cycle, as shown in
Figure 30: planning and feasibility, design and engineering, procurement and construction, commissioning, operation and maintenance, and decommissioning.
In the **pre-construction phase**, which includes the planning, feasibility, design, and engineering phases, costs are primarily focused on assessing site conditions and determining design parameters. Activities in this phase include soil sampling, borehole drilling, thermal conductivity testing and groundwater analysis. Additional expenses include costs for specialized software and tools, consulting fees for geotechnical and thermal engineers, time and costs to obtain permits, licenses and approvals from governmental agencies, and project management fees.
The **Construction Phase** includes procurement, construction, testing, and commissioning and typically represents the largest portion of the total budget. Costs in this phase are primarily associated with construction materials (such as piles, HDPE heat exchanger tubing, concrete, rebar, and heat transfer fluids), equipment purchase or rental, and labor. Once construction is complete, training is required to ensure that facility personnel or users can operate the energy pile or GSHP system as designed. Therefore, documentation and training costs are also included in this phase.
The **Post Construction Phase**, which includes operations and maintenance, and occasionally decommissioning, is when the project begins to generate revenue. To offset O&M costs, it is critical to ensure a steady flow of revenue to calculate the rate of return in the business model. Costs in this phase include electricity for circulating pumps, sensors, and control systems; maintenance costs; labor costs; and costs for monitoring equipment, software, and data analysis services.
Once the costs for each phase have been assessed using the LCCA, the next step is to evaluate the financial feasibility using a financial model. The following section presents a basic financial model to help determine whether to proceed with the project.
7.2. Simple Payback Period (SPBP) Method
The Simple Payback Period (SPBP) shown in Equation (21) is a preliminary financial risk assessment tool that calculates the time required for annual cash inflows from energy savings to offset the initial construction costs. This method is useful for initial screening to eliminate projects that take too long to recoup their initial investment, even for stakeholders without strong financial backgrounds. However, because of its simplicity, the SPBP focuses only on liquidity and does not take into account the time value of money-the concept that a dollar today is worth more than a dollar in the future due to inflation and the potential to earn interest.
7.3. Required Rate of Return (RRR), Net Present Value (NPV), and Internal Rate of Return (IRR) Methods
The Required Rate of Return (RRR) is a technical economic metric, often set by the project owner or investors, that indicates the minimum percentage of return expected from an investment to compensate for its risk. The RRR reflects the opportunity cost of capital, taking into account project risk, inflation, and other factors.
For construction projects, the RRR is typically 7-10% in the private sector and 10-15% or higher for government projects. However, this rate can be affected by various factors, such as the source of the initial funding. For example, if the budget is financed through a loan, the RRR will need to be higher to cover interest costs. Conversely, if the project generates additional revenue streams, such as additional cash flow, tax rebates, carbon credits, or government incentives, this can increase the overall return and the likelihood of achieving the required RRR.
To evaluate the financial viability of an energy pile or GSHP project, RRR serves as a benchmark against which other metrics, such as Internal Rate of Return (IRR) and Net Present Value (NPV), are compared.
The Net Present Value (NPV) method, also known as the Benefit-Cost Ratio (BCR), assesses whether an investment meets the required return thresholds and determines the project’s viability. NPV takes into account the time value of money by comparing initial costs with future energy savings. According to Equation (22), a positive NPV (exceeding the RRR) indicates that the cumulative cash flow (
) discounted at the rate of return (
) over the lifetime of the project (
) exceeds the initial cost, making the project financially profitable and viable. Conversely, if the NPV is less than the RRR, the project is not considered financially viable.
The Internal Rate of Return (IRR) is another key metric for evaluating the attractiveness of a project. It represents the discount rate that makes the NPV of an investment zero. To determine the IRR, set the NPV to zero and solve for the rate that satisfies the criteria in Equation (23). This calculation helps determine the minimum rate of return at which the project breaks even on the initial construction costs.
7.4. Levelized Cost of Energy (LCOE) Method
The Levelized Cost of Energy (LCOE) method provides a comprehensive assessment of the long-term costs associated with all phases of energy pile construction, including pre-construction, construction, operation and maintenance (O&M), and decommissioning. It calculates the cost per unit of energy output (heat removed or cooling provided) over the life of the system, as shown in Equation (24). This method builds on the LCCA and Net Present Value (NPV) methods to facilitate further analysis.
7.5. Government Support and Policy Initiatives
Several studies on energy piles and GSHP systems [
6,
7,
8,
24,
50] have been conducted by a leading engineering university in Thailand in collaboration with a Japanese academic. A notable pilot study by Shimada et al. (2019) demonstrated the practical application of energy piles and GSHP integrated into the HVAC system of a small government building in Thailand. The cooling capacity of the system was 4 kW using 4, 8, and 50 m deep heat exchangers, compared to a 3.6 kW rated ASHP system. Data collected during the rainy season (September to October 2018) and the summer season (February to April 2019) showed a 40% reduction in energy consumption [
7].
A follow-up study by Shimada et al. (2024) [
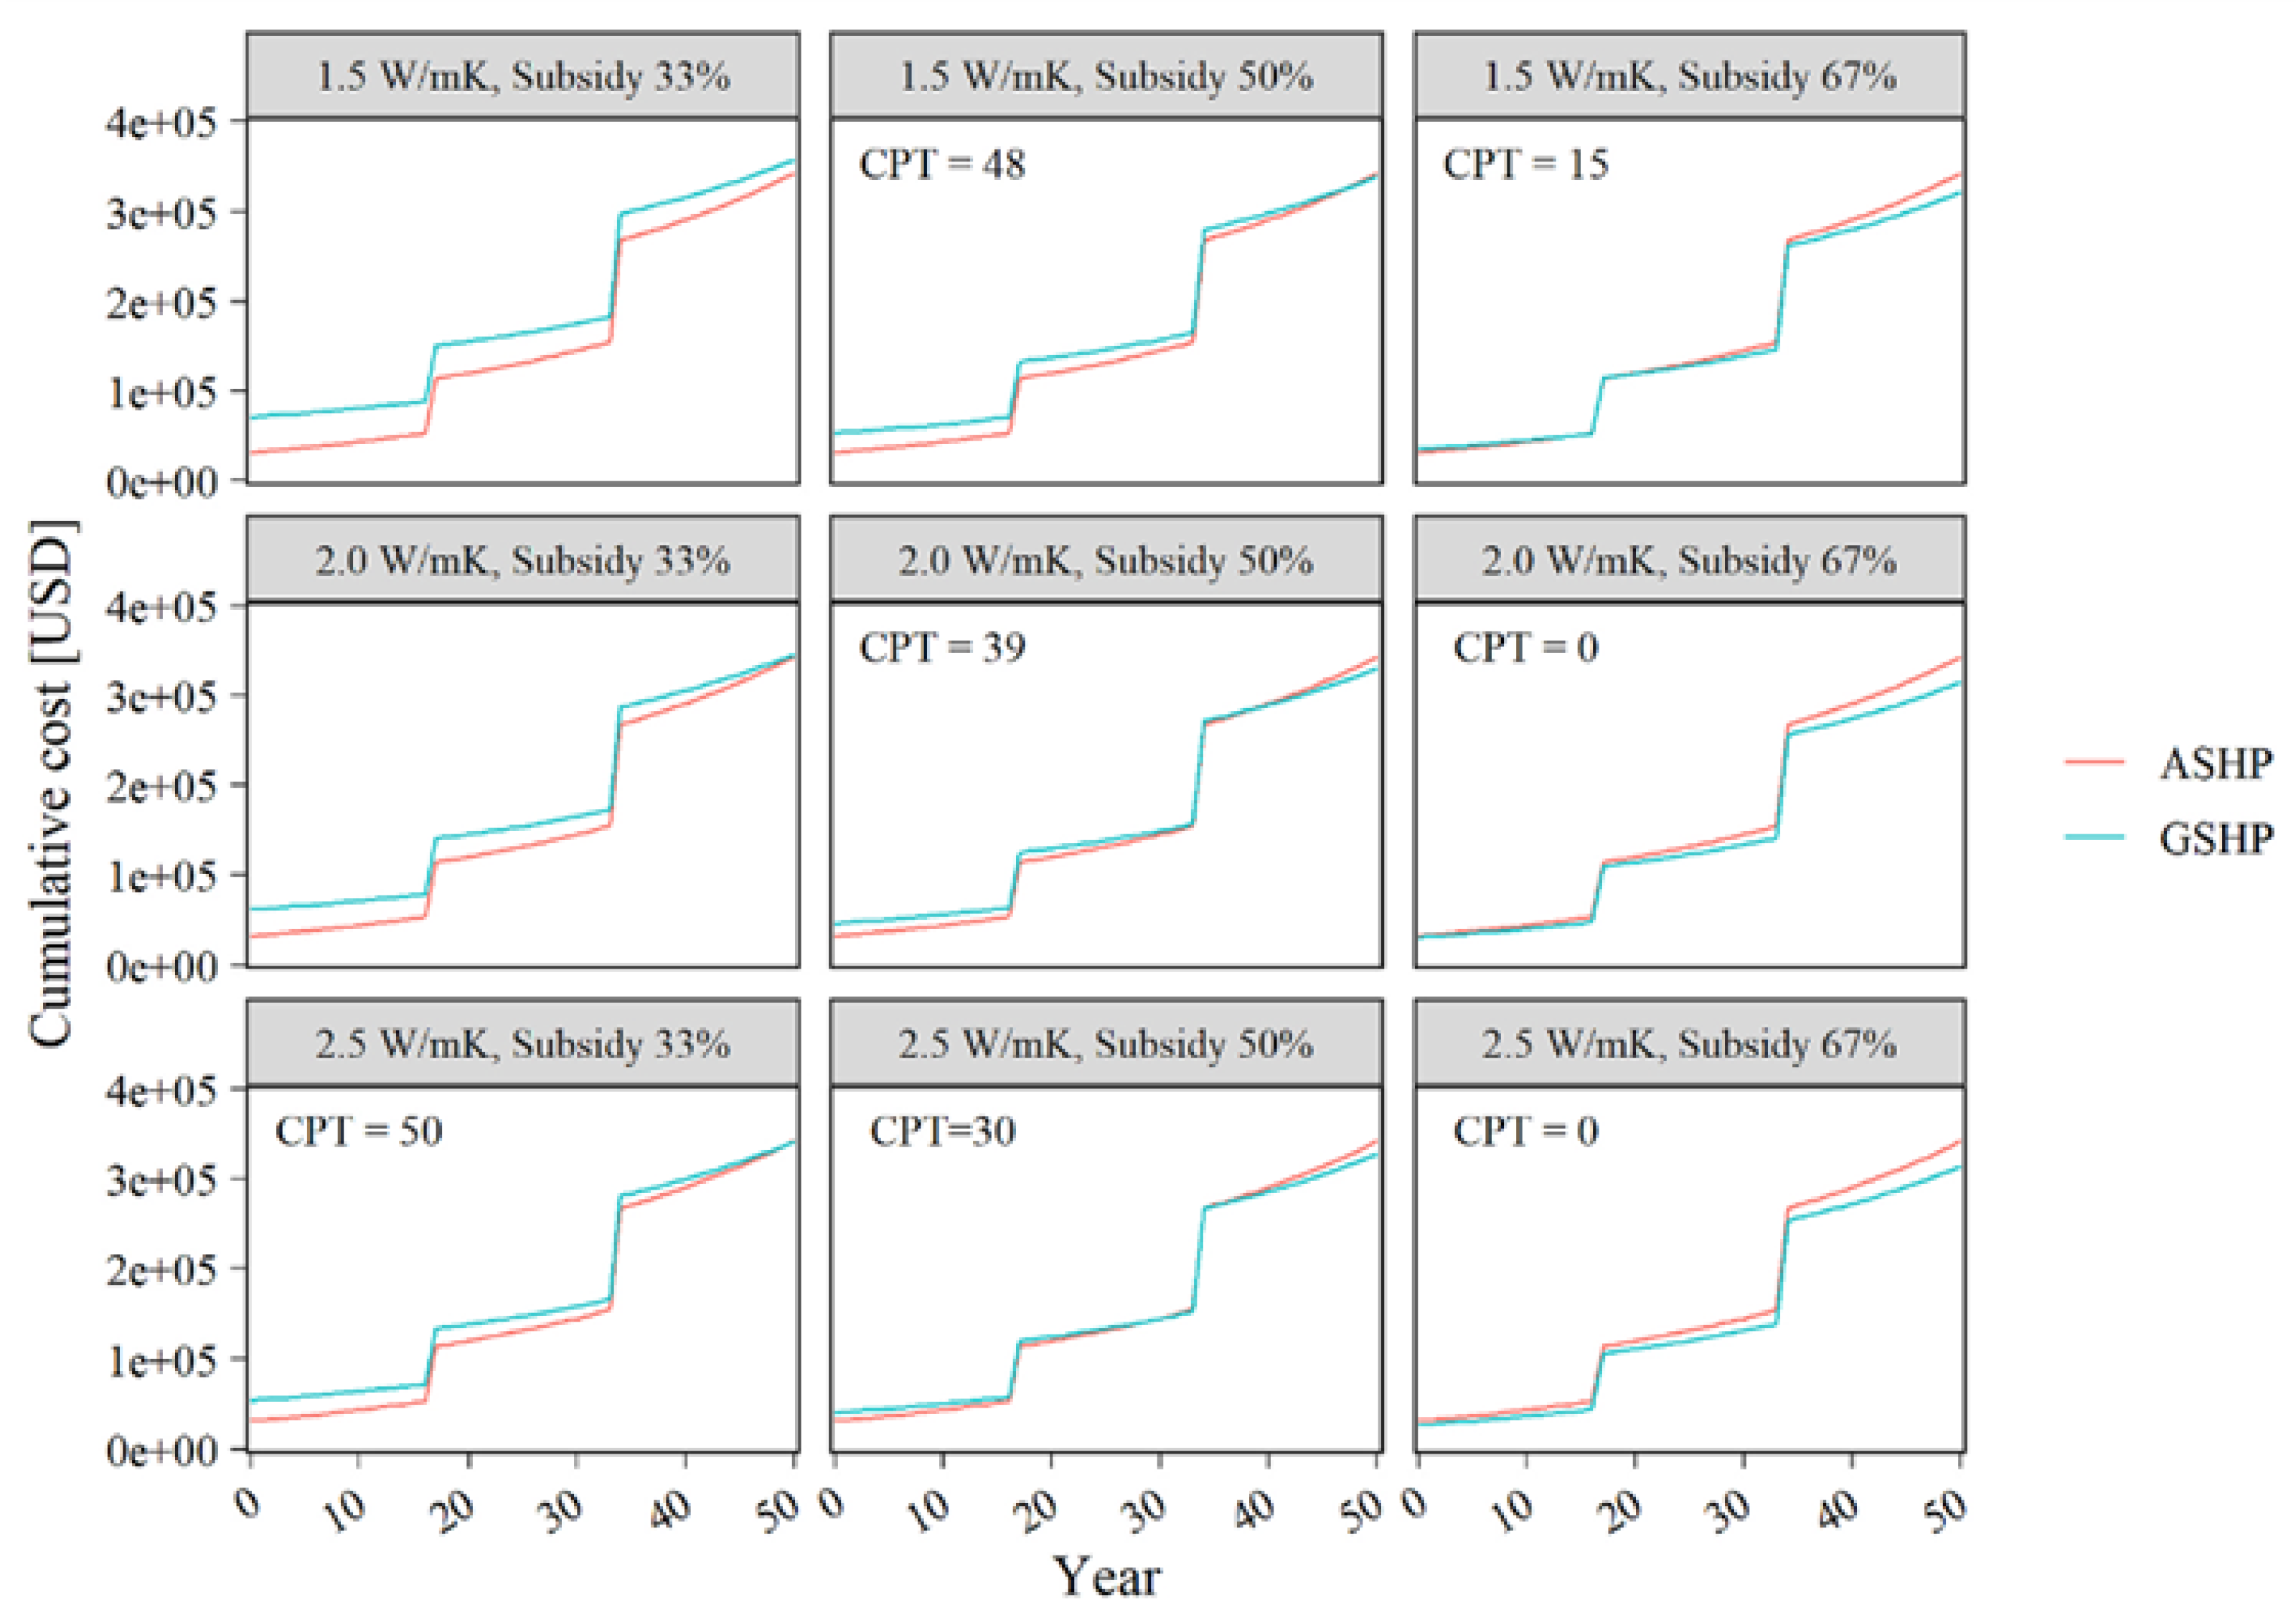
67] evaluated the payback period for an energy pile and GSHP system in Bangkok, Thailand. The system, consisting of 50 m deep, 1.5 m diameter borehole heat exchangers, provided a cooling capacity of 22.4 kW. The study used the LCCA method to compare the GSHP and ASHP systems, based on a target indoor temperature of 25°C, operating 9 hours a day, 5 days a week, over a 50-year period in a 140 m
2 air-conditioned area of a two-story office building. The results showed that GSHP systems in tropical regions require about twice the size of ground heat exchangers compared to those in mid- to high-latitude regions to mitigate efficiency losses due to heat buildup over time. Although the GSHP system consumed 23.2% less electricity than the ASHP system over 50 years, the initial capital investment could not be recovered in that time period under current conditions.
Figure 31 illustrates that an initial cost subsidy of 50-67% is required to make the financial payback of GSHP systems more competitive with ASHP systems.
Government policies play a critical role in promoting green energy technologies such as energy piles and GSHP systems. Similar policies that have successfully promoted solar panels and electric vehicles could be adapted to encourage the adoption of these technologies. This requires government to act as a market facilitator by setting clear targets, providing subsidies, financial incentives, and regulatory frameworks, and mandating the use of energy piles and GSHP systems in new developments. These measures would reduce costs and barriers to entry, thereby encouraging wider acceptance and use of these sustainable solutions.
A study by Geng et al. (2013) [
68] describes how the local government in Shenyang, China, implemented a policy to reduce the cost of constructing GSHP systems. Small-scale GSHP projects were eligible for grants ranging from RMB 100,000 to RMB 250,000 to cover the purchase of equipment and installation services. The government also issued guidelines for private organizations seeking to become qualified GSHP providers, and introduced special incentives to encourage further implementation.
Liu et al. (2015) [
69] highlighted additional policies by China’s central and local governments to accelerate GSHP demand. For example, the Hebei provincial government mandated that at least 45% of new government and large public buildings use GSHPs. The policy also required that the cost of GSHPs in schools, hospitals, and government buildings be included in government budgets. In addition, some city governments worked with local banks to offer low-interest loans for GSHP projects, with interest rates up to 60% below standard rates. As a result of this strong government support, GSHP applications in China have grown rapidly since 2006, with an average annual growth rate of more than 50%.
Governments can also implement carbon pricing policies, such as a carbon tax or cap-and-trade systems, to make fossil fuels more expensive and renewable energy more competitive. These mechanisms can increase the return on investment for energy piles and GSHP projects, which produce fewer greenhouse gas emissions than conventional ASHP systems. Carbon credits generated by these projects can be sold in voluntary or compliance markets, providing additional revenue streams for developers [
70]. As carbon pricing mechanisms become more widespread, the potential for selling carbon credits from GSHP and energy pile projects is likely to increase.
With strong government support and sufficient demand from both the public and private sectors, economies of scale could significantly reduce the upfront costs of energy piles and GSHP systems. As production scales up and the supply chain matures, the cost of materials, installation, and maintenance will decrease, making these technologies more accessible and attractive to a broader range of users and fostering a more sustainable and energy-efficient built environment.
8. Conclusions
Energy pile technology has strong potential as a mainstream solution for residential heating and cooling in smart cities, but further development is needed for widespread adoption. Key areas for development include optimizing integration with sustainable urban energy systems, increasing public acceptance through clear demonstration of benefits, and ensuring financial viability through cost-effective design and operation. Achieving these goals is critical to establishing energy piles as a central element of sustainable building practices within the smart city infrastructure. Continued research, technological innovation, and supportive policies are essential to overcome these challenges and enable wider implementation.
This paper provides a comprehensive guide for engineers and researchers on energy piles and GSHP technology, offering insights into basic principles, design approaches, and challenges that affect design efficiency and cost. Performance-based design tailored to specific site conditions is critical to optimizing system performance and cost-effectiveness. Properly balancing heat injection with ground absorption capacity is essential to avoid thermal saturation and requires careful consideration of factors such as heat exchanger configuration, material properties, pile placement, and operational strategies.
Mathematical models and simulations are essential for managing these complexities, enabling real-time adjustments, improving design accuracy, and minimizing risk. By simulating different scenarios, they help prevent excessive heat dissipation that could impact the urban environment, thus supporting the integration of geothermal systems into smart city planning.
Proactive government policies are essential to promote the adoption of energy piles, especially in rapidly urbanizing regions such as Southeast Asia. Measures such as subsidies, low-interest loans, tax incentives, and environmental regulations are needed to foster stakeholder and public acceptance. The advancement of energy pile technology is consistent with environmental sustainability and social responsibility, contributing to a greener, more resilient urban future.
Future research will focus on advanced simulations of energy piles in various soil conditions and configurations to refine design strategies, improve stakeholder understanding, and support the broader adoption of energy piles as a key component of smart city infrastructure.
Author Contributions
Conceptualization, S.I. and A.J.; methodology, A.J.; software, T.C. and S.C.; validation, A.J. and S.I.; formal analysis, T.C. and S.C.; investigation, T.C. and S.C.; resources, A.J. and S.I.; data curation, T.C. and A.J.; writing—original draft preparation, T.C.; writing—review and editing, S.I.; visualization, S.I.; supervision, A.J., S.C. and S.I.; project administration, S.I.; funding acquisition, S.I. All authors have read and agreed to the published version of the manuscript.
Funding
This research received no external funding.
Data Availability Statement
The data that support the findings of this study are available from the corresponding author, Shinya Inazumi, upon reasonable request.
Conflicts of Interest
The authors declare no conflicts of interest.
References
- Oke, T. The Energetic Basis of Urban Heat Island. Quarterly Journal of the Royal Meteorological Society 1982, 108, 1–24. [CrossRef]
- Arnfield, A. Two Decades of Urban Climate Research: A Review of Turbulence, Exchanges of Energy and Water, and the Urban Heat Island. International Journal of Climatology 2003, 23, 1–26. [CrossRef]
- Sun, Y.; Augenbroe, G. Urban Heat Island Effect on Energy Application Studies of Office Buildings. Energy and Buildings 2014, 77, 171–179. [CrossRef]
- Li, X.; Zhou, Y.; Yu, S.; Jia, G.; Li, H.; Li, W. Urban Heat Island Impacts on Building Energy Consumption: A Review of Approaches and Findings. Energy 2019, 174, 407–419. [CrossRef]
- Zoelly, H. Patent number CH59350A. Heating Method 1913. Switzerland. https://patents.google.com/patent/CH59350A/en (accessed on 21-07-2024).
- Widiatmojo, A.; Chokchai, S.; Takashima, I.; Uchida, Y.; Yasukawa, K.; Chotpantarat, S.; Charusiri, P. Ground-Source Heat Pumps with Horizontal Heat Exchangers for Space Cooling in the Hot Tropical Climate of Thailand. Energies 2019, 12, 1274. [CrossRef]
- Shimada, Y.; Uchida, Y.; Takashima, I.; Chotpantarat, s; Widiatmojo, A.; Chokchai, S.; Charusiri, P.; Kurishima, H.; Tokimatsu, K. A Study on the Operational Condition of a Ground Source Heat Pump in Bangkok Based on a Field Experiment and Simulation. Energies 2020, 13, 274. [CrossRef]
- Sittidumrong, J.; Jotisankasa, A.; Chantawarangul, K. Effect of Thermal Cycles on Volumetric Behaviour of Bangkok Sand. Geomechanics for Energy and the Environment 2019, 20, 100127. [CrossRef]
- Chanchayanon, T.; Chaiprakaikeow, S.; Jotisankasa, A.; Inazumi, S. Optimization of geothermal heat pump systems for sustainable urban development in Southeast Asia. Smart Cities 2024, 7(3), 1390-1413. [CrossRef]
- Fleming, K.; Weltman, A.; Randolph, M.; Elson, K. Piling Engineering, Third Edition; Taylor & Francis: Milton, United Kingdom. 2008; ISBN 978-0-203-93764-8.
- Carotenuto, A.; Marotta, P.; Massarotti, N.; Mauro, A.; Normino, G. Energy Piles for Ground Source Heat Pump Applications: Comparison of Heat Transfer Performance for Different Design and Operating Parameters. Applied Thermal Engineering 2017, 124. [CrossRef]
- Hu, Z.; Geng, S.; Huang, Y.; Ge, F.; Wang, Y. Heat Storage Characteristics and Application Analysis of Heat Source Tower in Soil Thermal Balance of Ground Source Heat Pump. Energy and Buildings 2021, 235, 110752. [CrossRef]
- Laloui, L.; Donna, A.D. Energy Geostructures: Innovation in Underground Engineering; John Wiley & Sons, 2013; ISBN 978-1-118-76176-2.
- Laloui, L.; Loria, A.F.R. Analysis and Design of Energy Geostructures: Theoretical Essentials and Practical Application; Academic Press, 2019; ISBN 978-0-12-816598-0.
- Advances in Ground-Source Heat Pump Systems; Rees, S.J., Ed.; Woodhead Publishing, 2016; ISBN 978-0-08-100311-4.
- Florides, G.A.; Kalogirou, S.A. Annual Ground Temperature Measurements at Various Depths, In Proceedings of the Proceedings of CLIMA 2005, Lausanne, Switzerland. 9 - 12 October 2005.
- Kalogirou, S.; Florides, G. Measurements of Ground Temperature at Various Depths. In Proceedings of the 3rd International Conference on Sustainable Energy Technologies; Nottingham, United Kingdom, December 2003.
- Taniguchi, M.; Shimada, J.; Fukuda, Y.; Yamano, M.; Onodera, S.; Kaneko, S.; Yoshikoshi, A. Anthropogenic Effects on the Subsurface Thermal and Groundwater Environments in Osaka, Japan and Bangkok, Thailand. Science of The Total Environment 2009, 407, 3153–3164. [CrossRef]
- Taniguchi, M.; Uemura, T. Effects of Urbanization and Groundwater Flow on the Subsurface Temperature in Osaka, Japan. Physics of the Earth and Planetary Interiors 2005, 152, 305–313. [CrossRef]
- Taniguchi, M.; Uemura, T.; Jago-on, K.A. Combined Effects of Urbanization and Global Warming on Subsurface Temperature in Four Asian Cities. Vadose Zone Journal - VADOSE ZONE J 2007, 6. https://doi.org/10.2136/vzj2006.0094.
- Sato, Y.; Kumagai, T.; Saitoh, T.M.; Suzuki, M. Characteristics of Soil Temperature and Heat Flux within a Tropical Rainforest, Lambir Hills National Park, Sarawak, Malaysia. Bulletin of the Institute of Tropical Agriculture, Kyushu University 2004, 27, 55–63, https://doi.org/10.11189/bita.27.55.
- Howard, E.; Thomas, S.; Frame, T.H.A.; Gonzalez, P.L.M.; Methven, J.; Martínez-Alvarado, O.; Woolnough, S.J. Weather Patterns in Southeast Asia: Relationship with Tropical Variability and Heavy Precipitation. Quarterly Journal of the Royal Meteorological Society 2022, 148, 747–769. [CrossRef]
- Endo, N.; Matsumoto, J.; Lwin, T. Trends in Precipitation Extremes over Southeast Asia. Sola 2009, 5, 168–171. [CrossRef]
- Ratchawang, S.; Chotpantarat, S.; Chokchai, S.; Takashima, I.; Uchida, Y.; Charusiri, P. A Review of Ground Source Heat Pump Application for Space Cooling in Southeast Asia. Energies 2022, 15, 4992. [CrossRef]
- Chokchai, S.; Chotpantarat, S.; Takashima, I.; Uchida, Y.; Widiatmojo, A.; Yasukawa, K.; Charusiri, P. A Pilot Study on Geothermal Heat Pump (GHP) Use for Cooling Operations, and on GHP Site Selection in Tropical Regions Based on a Case Study in Thailand. Energies 2018, 11, 2356. [CrossRef]
- Yang, Y.-L.; Zhang, T.; Liu, S.-Y. Influence Factor Analysis and Calculation Model for Thermal/Electrical Resistivity of Geomaterials. Measurement 2020, 152, 107373. [CrossRef]
- Rizvi, Z.; Shoarian Sattari, A.; Wuttke, F. Numerical Analysis of Heat Conduction in Granular Geo-Material Using Lattice Element Method. In; 2016; pp. 367–371 ISBN 978-1-138-03299-6.
- Liu, Z.; Gong, D.; Wang, L. Heat Transfer with Kinetic Phase Transition in Geomaterials. International Journal of Heat and Mass Transfer 2021, 167, 120826. [CrossRef]
- Tomac, I.; Gutierrez, M. Formulation and Implementation of Coupled Forced Heat Convection and Heat Conduction in DEM. Acta Geotech. 2015, 10, 421–433, https://doi.org/10.1007/s11440-015-0400-1.
- Lamarche, L. Analytical g-Function for Inclined Boreholes in Ground-Source Heat Pump Systems. Geothermics 2011, 40, 241–249, https://doi.org/10.1016/j.geothermics.2011.07.006.
- Thomson, W. Heat. In Encyclopaedia Britannica.; Adam and Charles Black: Edinburgh., 1880.
- Thomson, W. Compendium of the Fourier Mathematics for the Conduction of Heat in Solids, and the Mathematically Allied Physical Subjects of Diffusion of Fluids, and Transmission of Electric Signals Through Submarine Cables. In Mathematical and Physical Papers; University Press: Cambridge, 1884; Vol. 2, p. Article 72. Page 41-60.
- Carslaw, H.S.; Jaeger, J.C. Conduction of Heat in Solids; 2nd ed.; Clarendon Press: Oxford, United Kingdom.
- Ingersoll, L.R.; Plass, H.J. Theory of Ground Pipe Heat Source for the Heat Pump. Heating Piping and Air Conditioning 1948, 20, 119–122.
- Whitehead, S. Determining Temperature Distribution e a Contribution to the Evaluation of the Flow of Heat in Isotropic Media. The Electrician 1927, 225–226.
- Li, M.; Lai, A.C.K. Review of Analytical Models for Heat Transfer by Vertical Ground Heat Exchangers (GHEs): A Perspective of Time and Space Scales. Applied Energy 2015, 151, 178–191. [CrossRef]
- Lamarche, L.; Beauchamp, B. A New Contribution to the Finite Line-Source Model for Geothermal Boreholes. Energy and Buildings 2007, 39, 188–198. [CrossRef]
- Claesson, J.; Javed, S. A Load-Aggregation Method to Calculate Extraction Temperatures of Borehole Heat Exchangers. ASHRAE Winter Conference, Chicago, Il, USA. 2012, Vol. 118, pp. 530–539. 2012.
- Ground Source Heat Pump Association National Energy Centre. Thermal Pile Design, Installation & Materials Standards; Davy Avenue, Knowlhill, Milton Keynes MK5 8NG, United Kingdom, 2012.
- Mehrizi, A.A.; Porkhial, S.; Bezyan, B.; Lotfizadeh, H. Energy Pile Foundation Simulation for Different Configurations of Ground Source Heat Exchanger. International Communications in Heat and Mass Transfer 2016, 70, 105–114. [CrossRef]
- Tian, W.; Cheng, X.; Liu, Z.; Wei, Q.; Wang, T.; Guo, H. Heat Exchange Performance of an Energy-Pile Group in a Hybrid GSHP System and Effects of Pile Spacing. Energy and Buildings 2024, 316, 114347. [CrossRef]
- 2011 ASHRAE Handbook: Heating, Ventilating, and Air-Conditioning Applications; American Society of Heating, Refrigerating and Air-Conditioning Engineers, 2011.
- Vella, C.; Borg, S.P.; Micallef, D. The Effect of Shank-Space on the Thermal Performance of Shallow Vertical U-Tube Ground Heat Exchangers. Energies 2020, 13, 602, https://doi.org/10.3390/en13030602.
- ACI Committee 213, 213R-03: Guide for Structural Lightweight-Aggregate Concrete Report, American Concrete Institute, 2003.
- ASTM C0177-19 Standard Test Method for Steady-State Heat Flux Measurements and Thermal Transmission Properties by Means of the Guarded-Hot-Plate Apparatus 2023.
- Asadi, I.; Shafigh, P.; Abu Hassan, Z.F.B.; Mahyuddin, N.B. Thermal Conductivity of Concrete – A Review. Journal of Building Engineering 2018, 20, 81–93, https://doi.org/10.1016/j.jobe.2018.07.002.
- Wang, H.; Zhao, P.; Li, X.; Wang, X.; Bian, X. A Study on the Softening Shear Model of the Energy Pile–Soil Contact Surface. Applied Sciences 2024, 14, 1072, https://doi.org/10.3390/app14031072.
- Concrete Reinforcing Steel Institute; Fanella, D. Design Guide on the ACI 318 Building Code Requirements for Structural Concrete: A Comprehensive Guide Based on ACI 318-19 to Assist Design Professionals on the Design and Detailing of Reinforced Concrete Buildings; Concrete Reinforcing Steel Institute, 2020; ISBN 978-1-943961-51-1.
- Liu, R.Y.W.; Taborda, D.M.G. The Effects of Thermal Interference on the Thermal Performance of Thermo-Active Pile Groups. Renewable Energy 2024, 225, 120357. [CrossRef]
- Jotisankasa, A.; Chantawarangul, K.; Sittidumrong, J.; Thangkhumwong, K.; Aowphitak, P.; Laohasrisakul, P.; Chanchayanon, T.; Aonkam, S.; Satayanan, S. Investigation of the Feasibility of Energy Piles in Bangkok and Their Impacts on Pile Behavior. E3S Web of Conferences 2020, 205, 05018. [CrossRef]
- Air-Conditioning, Heating, and Refrigeration Institute. AHRI 210/240-2024 (I-P) Performance Rating of Unitary Air-Conditioning and Air-Source Heat Pump Equipment; Arlington, VA, USA, 2024.
- Kang, E.; Riederer, P.; Yoo, S.-Y.; Lee, E. New Approach to Evaluate the Seasonal Performance of Building Integrated Geothermal Heat Pump System. Renewable Energy 2013, 54, 51–54. [CrossRef]
- Brandl, H. Energy Foundations and Other Thermo-Active Ground Structures. Geotechnique 2006, 56, 81–122. [CrossRef]
- Luo, J.; Rohn, J.; Bayer, M.; Priess, A.; Wilkmann, L.; Xiang, W. Heating and Cooling Performance Analysis of a Ground Source Heat Pump System in Southern Germany. Geothermics 2015, 53, 57–66. [CrossRef]
- Qiao, Z.; Long, T.; Li, W.; Zeng, L.; Li, Y.; Lu, J.; Cheng, Y.; Xie, L.; Yang, L. Performance Assessment of Ground-Source Heat Pumps (GSHPs) in the Southwestern and Northwestern China: In Situ Measurement. Renewable Energy 2020, 153, 214–227. [CrossRef]
- Wang, D.; Lu, L.; Cui, P. Numerical Simulation of Pile Geothermal Heat Exchanger with Spiral Tube Considering Its Thermo-Mechanical Behavior. In Proceedings of the Proceedings of the IGSHPA Technical/Research Conference and Expo 2017; International Ground Source Heat Pump Association: Denver, USA, March 14 2017.
- Abuel-Naga, H.M.; Bergado, D.T.; Chaiprakaikeow, S. Innovative Thermal Technique for Enhancing the Performance of Prefabricated Vertical Drain during the Preloading Process. Geotextiles and Geomembranes 2006, 24, 359–370. [CrossRef]
- Hoseinimighani, H.; Szendefy, J. A Review on Mechanisms of Thermally Induced Volume Changes in Fine Soil. Minerals 2022, 12, 572. [CrossRef]
- Burghignoli, A.; Desideri, A.; Miliziano, S. A Laboratory Study on the Thermomechanical Behaviour of Clayey Soils. Can. Geotech. J. 2000, 37, 764–780. [CrossRef]
- Cekerevac, C.; Laloui, L. Experimental Analysis of the Cyclic Behaviour of Kaolin at High Temperature. Géotechnique 2010, 60, 651–655. [CrossRef]
- Cekerevac, C.; Laloui, L. Experimental Study of Thermal Effects on the Mechanical Behaviour of a Clay. Num Anal Meth Geomechanics 2004, 28, 209–228. [CrossRef]
- Laloui, L.; Cekerevac, C. Thermo-Plasticity of Clays: An Isotropic Yield Mechanism. Computers and Geotechnics 2003, 30, 649–660. [CrossRef]
- Abuel-Naga, H.M.; Bergado, D.T.; Bouazza, A. Thermal Conductivity of Soft Bangkok Clay. In Proceedings of the GeoCongress 2008; American Society of Civil Engineers: New Orleans, Louisiana, United States, March 7 2008; pp. 1061–1068.
- Bergado, D.T.; Soralump, S. Thermal Consolidation of Soft Bangkok Clay. Lowland Technology International 2005, 7.
- Bidarmaghz, A.; Narsilio, G.A. Shallow Geothermal Energy: Emerging Convective Phenomena in Permeable Saturated Soils. Géotechnique Letters 2016, 6, 119–123. [CrossRef]
- Lee, C.K.; Lam, H.N. Computer Simulation of Borehole Ground Heat Exchangers for Geothermal Heat Pump Systems. Renewable Energy 2008, 33, 1286–1296. [CrossRef]
- Shimada, Y.; Tokimatsu, K.; Uchida, Y.; Kurishima, H. Environmental Compatibility and Economic Feasibility of Ground Source Heat Pumps in Tropical Asia Regarding Lifecycle Aspects: A Case Study in Bangkok, Thailand. Renewable Energy 2024, 223, 119896. [CrossRef]
- Geng, Y.; Sarkis, J.; Wang, X.; Zhao, H.; Zhong, Y. Regional Application of Ground Source Heat Pump in China: A Case of Shenyang. Renewable and Sustainable Energy Reviews 2013, 18, 95–102. [CrossRef]
- Liu, X.; Lu, S.; Hughes, P.; Cai, Z. A Comparative Study of the Status of GSHP Applications in the United States and China. Renewable and Sustainable Energy Reviews 2015, 48, 558–570. [CrossRef]
- Cui, Y.; Zhu, J.; Twaha, S.; Chu, J.; Bai, H.; Huang, K.; Chen, X.; Zoras, S.; Soleimani, Z. Techno-Economic Assessment of the Horizontal Geothermal Heat Pump Systems: A Comprehensive Review. Energy Conversion and Management 2019, 191, 208–236. [CrossRef]
Figure 1.
Schematic of the components of an energy pile for small-to-medium residential units, consisting of four main elements: the geo-structure, the embedded heat exchanger, the heat pump unit, and the distribution system.
Figure 1.
Schematic of the components of an energy pile for small-to-medium residential units, consisting of four main elements: the geo-structure, the embedded heat exchanger, the heat pump unit, and the distribution system.
Figure 2.
Sinusoidal pattern of ambient soil temperature, peaking in summer and bottoming out in winter [
16].
Figure 2.
Sinusoidal pattern of ambient soil temperature, peaking in summer and bottoming out in winter [
16].
Figure 3.
Heat transfer pathways in geomaterials, showing two primary mechanisms: heat convection (solid white arrows) through pore water movement and heat conduction (dashed white arrows) through solid soil particles.
Figure 3.
Heat transfer pathways in geomaterials, showing two primary mechanisms: heat convection (solid white arrows) through pore water movement and heat conduction (dashed white arrows) through solid soil particles.
Figure 4.
Schematic of the Infinite Line Source (ILS) heat transfer model. The infinite line heat source dissipates heat into the surrounding soil mass.
Figure 4.
Schematic of the Infinite Line Source (ILS) heat transfer model. The infinite line heat source dissipates heat into the surrounding soil mass.
Figure 5.
Schematic of the Cylindrical Source (CS) heat transfer model. The infinitely long cylindrical heat source transfers heat to the surrounding soil mass.
Figure 5.
Schematic of the Cylindrical Source (CS) heat transfer model. The infinitely long cylindrical heat source transfers heat to the surrounding soil mass.
Figure 6.
Schematic of the finite line source (FLS) heat transfer model.
Figure 6.
Schematic of the finite line source (FLS) heat transfer model.
Figure 7.
Summary of roles, responsibilities, and key considerations for HVAC, GSHP, and foundation designers in energy pile projects.
Figure 7.
Summary of roles, responsibilities, and key considerations for HVAC, GSHP, and foundation designers in energy pile projects.
Figure 8.
Summary of engineering factors affecting the thermal performance of energy piles.
Figure 8.
Summary of engineering factors affecting the thermal performance of energy piles.
Figure 9.
Illustration of flow characteristics in heat exchangers: (A) Laminar flow, characterized by smooth, orderly flow with parallel layers, (B) Transitional flow, showing a combination of laminar and turbulent patterns with moderate fluctuations, and (C) Turbulent flow, characterized by chaotic, irregular motion with eddies and swirls. These flow regimes are distinguished by their Reynolds numbers, which affect the heat transfer efficiency of the system.
Figure 10.
Schematic representation of commonly used heat exchanger configurations in energy piles: (A) multiple bends for large bore piles, (B) single U-tube, (C) double U-tube, (D) parallel double U-tube, and (E) spiral heat exchanger. Each configuration provides different heat transfer characteristics and efficiencies to suit different soil conditions and thermal requirements in geothermal heat pump systems.
Figure 11.
Photographs of cylindrical (a) and multiple U-tube (b) assemblies integrated with rebar of an energy bore pile at a construction site. The images show the practical implementation of these configurations, highlighting the arrangement of the heat exchanger tubes within the rebar cage [
15].
Figure 12.
Illustration of energy pile interconnection configurations: a series configuration allows heat transfer fluid to flow from one pile to the next, accommodating a wide range of temperature differences, while a parallel configuration interconnects multiple energy piles, allowing simultaneous higher fluid flow through each pile.
Figure 13.
Illustration of shank spacing between heat exchanger tubes embedded in energy piles, showing thermal short-circuiting as the direct transfer of heat between closely spaced tubes that reduces the effectiveness of heat dissipation into the ground. Adequate spacing is essential to prevent thermal shorts.
Figure 14.
Thermally induced strain of energy piles under free expansion: (a) expansion due to heating, (b) contraction due to cooling; and thermally induced stress of fully restrained energy piles: (c) stress due to heating, (d) stress due to cooling.
Figure 14.
Thermally induced strain of energy piles under free expansion: (a) expansion due to heating, (b) contraction due to cooling; and thermally induced stress of fully restrained energy piles: (c) stress due to heating, (d) stress due to cooling.
Figure 15.
Energy pile arrangements: (a) 4-pile configuration and (b) 9-pile group with a spacing factor of 4, used in the simulation to study the thermal penalty effect [
49].
Figure 15.
Energy pile arrangements: (a) 4-pile configuration and (b) 9-pile group with a spacing factor of 4, used in the simulation to study the thermal penalty effect [
49].
Figure 16.
Time evolution of (a) power per unit pile length and (b) power reduction coefficient for 0.9 m diameter piles in a 2 × 2 group configuration [
49].
Figure 16.
Time evolution of (a) power per unit pile length and (b) power reduction coefficient for 0.9 m diameter piles in a 2 × 2 group configuration [
49].
Figure 17.
Time evolution of (a) power per unit pile length and (b) power reduction coefficient for 0.9 m diameter piles in a 3 × 3 group configuration [
49].
Figure 17.
Time evolution of (a) power per unit pile length and (b) power reduction coefficient for 0.9 m diameter piles in a 3 × 3 group configuration [
49].
Figure 18.
Photographs showing the installation process of energy pile heat exchangers: (a) preparing to install the pressure gauge for initial pressurization and (b) connecting the compressor to the HDPE pipe. These images capture critical steps to ensure proper setup and functionality of the heat exchanger system prior to full operational testing.
Figure 19.
Photographs showing (a) the stable pressure achieved after the second pressurization prior to concreting and (b) the installation of a temperature sensor for long-term monitoring of the energy pile. These images illustrate critical steps in ensuring accurate temperature measurements and verifying the integrity of the heat exchange system prior to pouring concrete.
Figure 20.
Photographs of (a) the energy pile concrete pour and (b) the solidified concrete 24 hours after pouring.
Figure 20.
Photographs of (a) the energy pile concrete pour and (b) the solidified concrete 24 hours after pouring.
Figure 21.
Relationship between shear strength and normal stress under thermal loads of 10°C, 24°C, and 60 °C for (a) sand-concrete interface, showing minimal effect of thermal change on skin friction and friction angle, and (b) clay-concrete interface, showing a 63% increase in skin friction strength [
56].
Figure 22.
Results of the undrained compression triaxial test on (a) normally consolidated and (b) over-consolidated soft Bangkok clay specimens (
Figure 22.
Results of the undrained compression triaxial test on (a) normally consolidated and (b) over-consolidated soft Bangkok clay specimens (
Figure 23.
Results of undrained compression triaxial tests on soft clay specimens subjected to different cyclic temperature levels [
57].
Figure 23.
Results of undrained compression triaxial tests on soft clay specimens subjected to different cyclic temperature levels [
57].
Figure 24.
Results of undrained compression triaxial tests on normally consolidated soil tested under static temperatures and thermal heating/cooling cycles [
57].
Figure 24.
Results of undrained compression triaxial tests on normally consolidated soil tested under static temperatures and thermal heating/cooling cycles [
57].
Figure 25.
Thermally induced volume changes at different stress levels and OCR, showing the irreversible contraction of normally consolidated clay and the reversible expansion of over-consolidated clay [
57].
Figure 25.
Thermally induced volume changes at different stress levels and OCR, showing the irreversible contraction of normally consolidated clay and the reversible expansion of over-consolidated clay [
57].
Figure 26.
Trends in measured and calculated hydraulic permeability of Bangkok clay specimens at different temperatures [
64].
Figure 26.
Trends in measured and calculated hydraulic permeability of Bangkok clay specimens at different temperatures [
64].
Figure 27.
Excess pore-water pressure from undrained compression triaxial tests on (a) normally consolidated and (b) over-consolidated soft Bangkok clay specimens (\(p’_c = 300\) kPa) at different temperatures [
57].
Figure 27.
Excess pore-water pressure from undrained compression triaxial tests on (a) normally consolidated and (b) over-consolidated soft Bangkok clay specimens (\(p’_c = 300\) kPa) at different temperatures [
57].
Figure 28.
Excess pore-water pressure from undrained compression triaxial tests under thermal cyclic loading [
57].
Figure 28.
Excess pore-water pressure from undrained compression triaxial tests under thermal cyclic loading [
57].
Figure 29.
Thermally induced groundwater circulation pattern around a single ground heat exchanger [
65,
66].
Figure 29.
Thermally induced groundwater circulation pattern around a single ground heat exchanger [
65,
66].
Figure 30.
The life cycle stages of the project and the costs associated with each stage.
Figure 30.
The life cycle stages of the project and the costs associated with each stage.
Figure 31.
Cumulative cost and cost payback time (CPT) for each scenario [
67].
Figure 31.
Cumulative cost and cost payback time (CPT) for each scenario [
67].
Table 1.
Comparative overview of volumetric heat capacity values for various geomaterials, including clay, silt, sand, and gravel, under saturated and unsaturated conditions [
14,
15].
Table 1.
Comparative overview of volumetric heat capacity values for various geomaterials, including clay, silt, sand, and gravel, under saturated and unsaturated conditions [
14,
15].
| Materials |
Volumetric heat capacity, ρcp (MJ/m3·°C) |
| Dry |
Saturated |
| Clay |
1.5 to 1.6 |
1.6 to 3.4 |
| Silt |
1.5 to 1.6 |
1.6 to 3.4 |
| Sand |
1.3 to 1.6 |
2.2 to 2.9 |
| Gravel |
1.4 to 1.6 |
2.4 |
Table 2.
The thermal conductivity values of various common geomaterials, including clay, silt, sand, and gravel, under both saturated and unsaturated conditions [
14,
15].
Table 2.
The thermal conductivity values of various common geomaterials, including clay, silt, sand, and gravel, under both saturated and unsaturated conditions [
14,
15].
| Materials |
Effective thermal conductivity, λeff (W/m·°C) |
| Dry |
Saturated |
| Clay |
0.2 to 0.3 |
1.1 to 1.6 |
| Silt |
0.2 to 0.3 |
1.2 to 2.5 |
| Sand |
0.3 to 0.4 |
1.7 to 3.2 |
| Gravel |
0.3 to 0.4 |
1.8 to 3.3 |
Table 3.
Performance index comparisons between ASHP and GSHP.
Table 3.
Performance index comparisons between ASHP and GSHP.
| Index |
ASHP |
GSHP |
| COP |
2.5 to 4.0 |
3.1 to 5.0 |
| SCOP |
2.5 to 3.5 |
3.5 to 4.5 |
| EER |
8.0 to 12.0 |
14.0 to 20.0 |
| SEER |
13.0 to 20.0 |
to 30.0 |
|
Disclaimer/Publisher’s Note: The statements, opinions and data contained in all publications are solely those of the individual author(s) and contributor(s) and not of MDPI and/or the editor(s). MDPI and/or the editor(s) disclaim responsibility for any injury to people or property resulting from any ideas, methods, instructions or products referred to in the content. |
© 2024 by the authors. Licensee MDPI, Basel, Switzerland. This article is an open access article distributed under the terms and conditions of the Creative Commons Attribution (CC BY) license (http://creativecommons.org/licenses/by/4.0/).
