1. Introduction
In recent years, various research conducted in different areas of the world have been concerned with assessing the impact of ongoing climate change on viticulture and winemaking [
1,
2,
3,
4,
5,
6,
7,
8,
9,
10,
11].
With its millennial history and its current 408 DOP (Protected Designation of Origin) and 118 IGP (Protected Geographical Indication) [
12], Italy continues to be one of the leading countries in the wine sector [
13]. However, particularly on the territories of some DOP facing the coastal areas of the Italian Mediterranean, more or less severe effects of the ongoing global climate change are occurring with continuity [
14]. On several of these viticultural areas, the effects of climate change, and in particular temperatures, are severely affecting the resilience of crop quality and sustainability [
15] to the point that, some of these areas, in the medium term, will be destined to become marginal for quality wine production [
14,
16,
17]. After all, the impact of temperatures on phenological stages also affects and determines the quantity of production [
17,
18]. Therefore, it is important to study the temperature trends of viticultural zones (DOP) in order to predict the evolution of potential changes that these zones might undergo in the near future. In fact, there is evidence that temperature plays a predominant role in crop development [
19,
20] especially with significant trends, as it affects in a general shortening of the length of phenological stages [
21,
22,
23]. Consequently, rising temperatures are undermining the viticultural suitability of many historical areas (DOP) as a result of the emergence of technical issues in vineyard management [
24,
25].
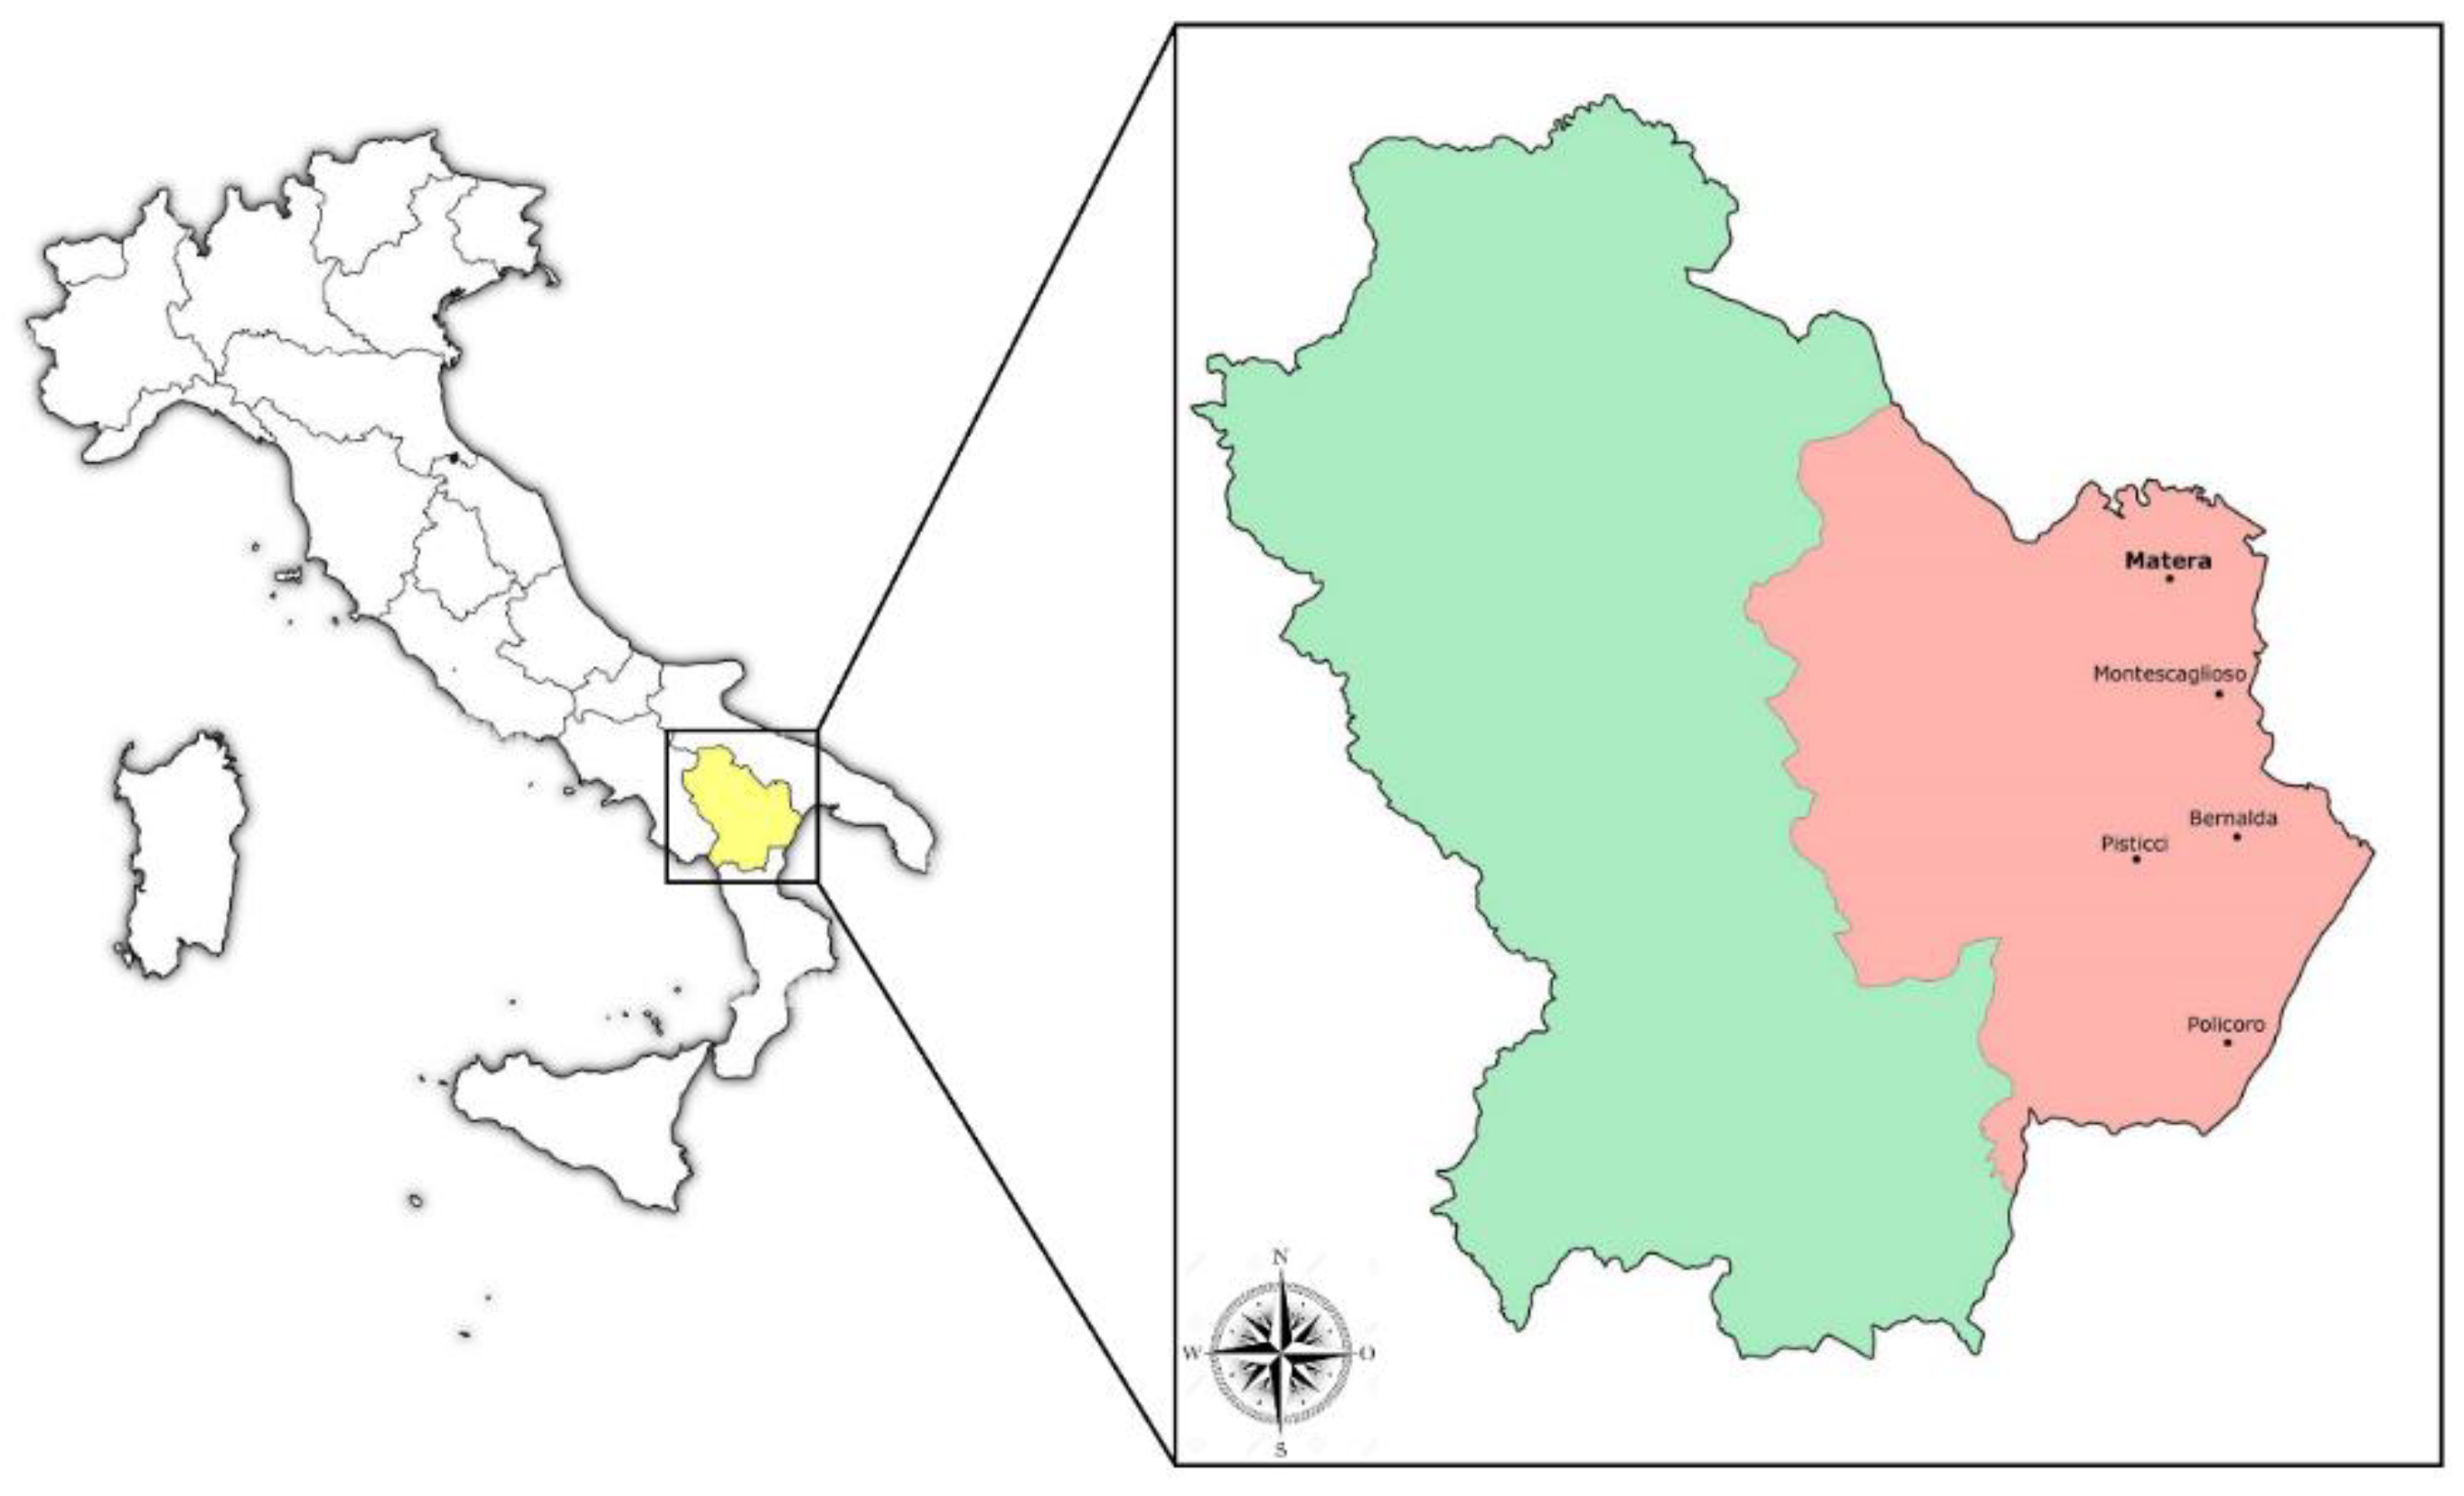
In this paper, an analysis of temperatures over the territory of one of the 4 DOP areas in Basilicata is carried out (
Figure 1), “Matera DOP”, already considered by several studies to be the most at risk as a result of the severe effects of climate change in the Mediterranean context [
26,
27]. Piccarreta, Lazzari and Pasini [
28] have evidenced an increasing temperature trend involving the entire Basilicata region in the 1981–2010-time window. In addition, Panagiotopoulos [
29] identified, for this area, a drastic decrease in the Siberian High index between 1978 and 2000, an index that influences atmospheric circulation and temperature patterns in the entire Northern Hemisphere.
In relation to the warming trend observed at the global level [
30,
31] and in order to evaluate these effects at the territorial scale of the Matera DOP, the objectives of this study were, first, to define the trend of air temperatures (1981-2022) in the production area and, second, to evaluate significant changes with regard to the agrometeorological indices most commonly used in viticulture.
The first approach aimed at this analysis was to take into consideration the changes in temperatures according to elevation bands (
Figure 1S); assuming that at the higher elevations of the DOP area the rise in temperatures over the given period was less than at the lower elevations. However, this assumption was later refuted by the results from the analysis of ERA5-Land data.
In fact, the overall climate analysis of the study area was carried out using the ERA5-Land dataset from the C3S Climate Data Store - Copernicus Climate Change Service [
32]. That is, a re-analysis combining climate model data with observations taken on the ground via meteorological stations. This approach permits to create a globally complete and consistent dataset, and useful in providing an accurate description of the climate of the period analyzed.
In particular, an analysis of temperature trends was carried out considering both the interval related to the vine growing season, which in this context runs from March 15 to October 15, and the entire annual period. The period of analysis was limited to the 1981-2022 time series because there is evidence that, in the Northern Hemisphere, the breaking point in temperature regimes occurred in the early 1980s [
33].
In addition, for the purpose of a more circumscribed investigation of the climate evolution of the last twenty years in the study area, the daily temperature series from 2000 to 2023 of five active meteorological stations in the area where the “Matera DOP” wine farms are concentrated were considered.
Discussion
The purpose of this work was to assess the impact of ongoing climate change on viticulture in the Matera PDO area, carried out through a temperature trend analysis. The analysis was developed through the use of spatialized data from ERA5 Land for the historical period 1981-2022; and point data from five meteorological stations falling within the Matera PDO production area for the period 2000-2023. The historical period 1981-2022 was chosen because, as recorded in the literature [
33], the early 1980s was identified as the period when the ongoing climate change began, which preliminarily resulted in a substantial increase in temperatures and shortening of phenological phases [
48].
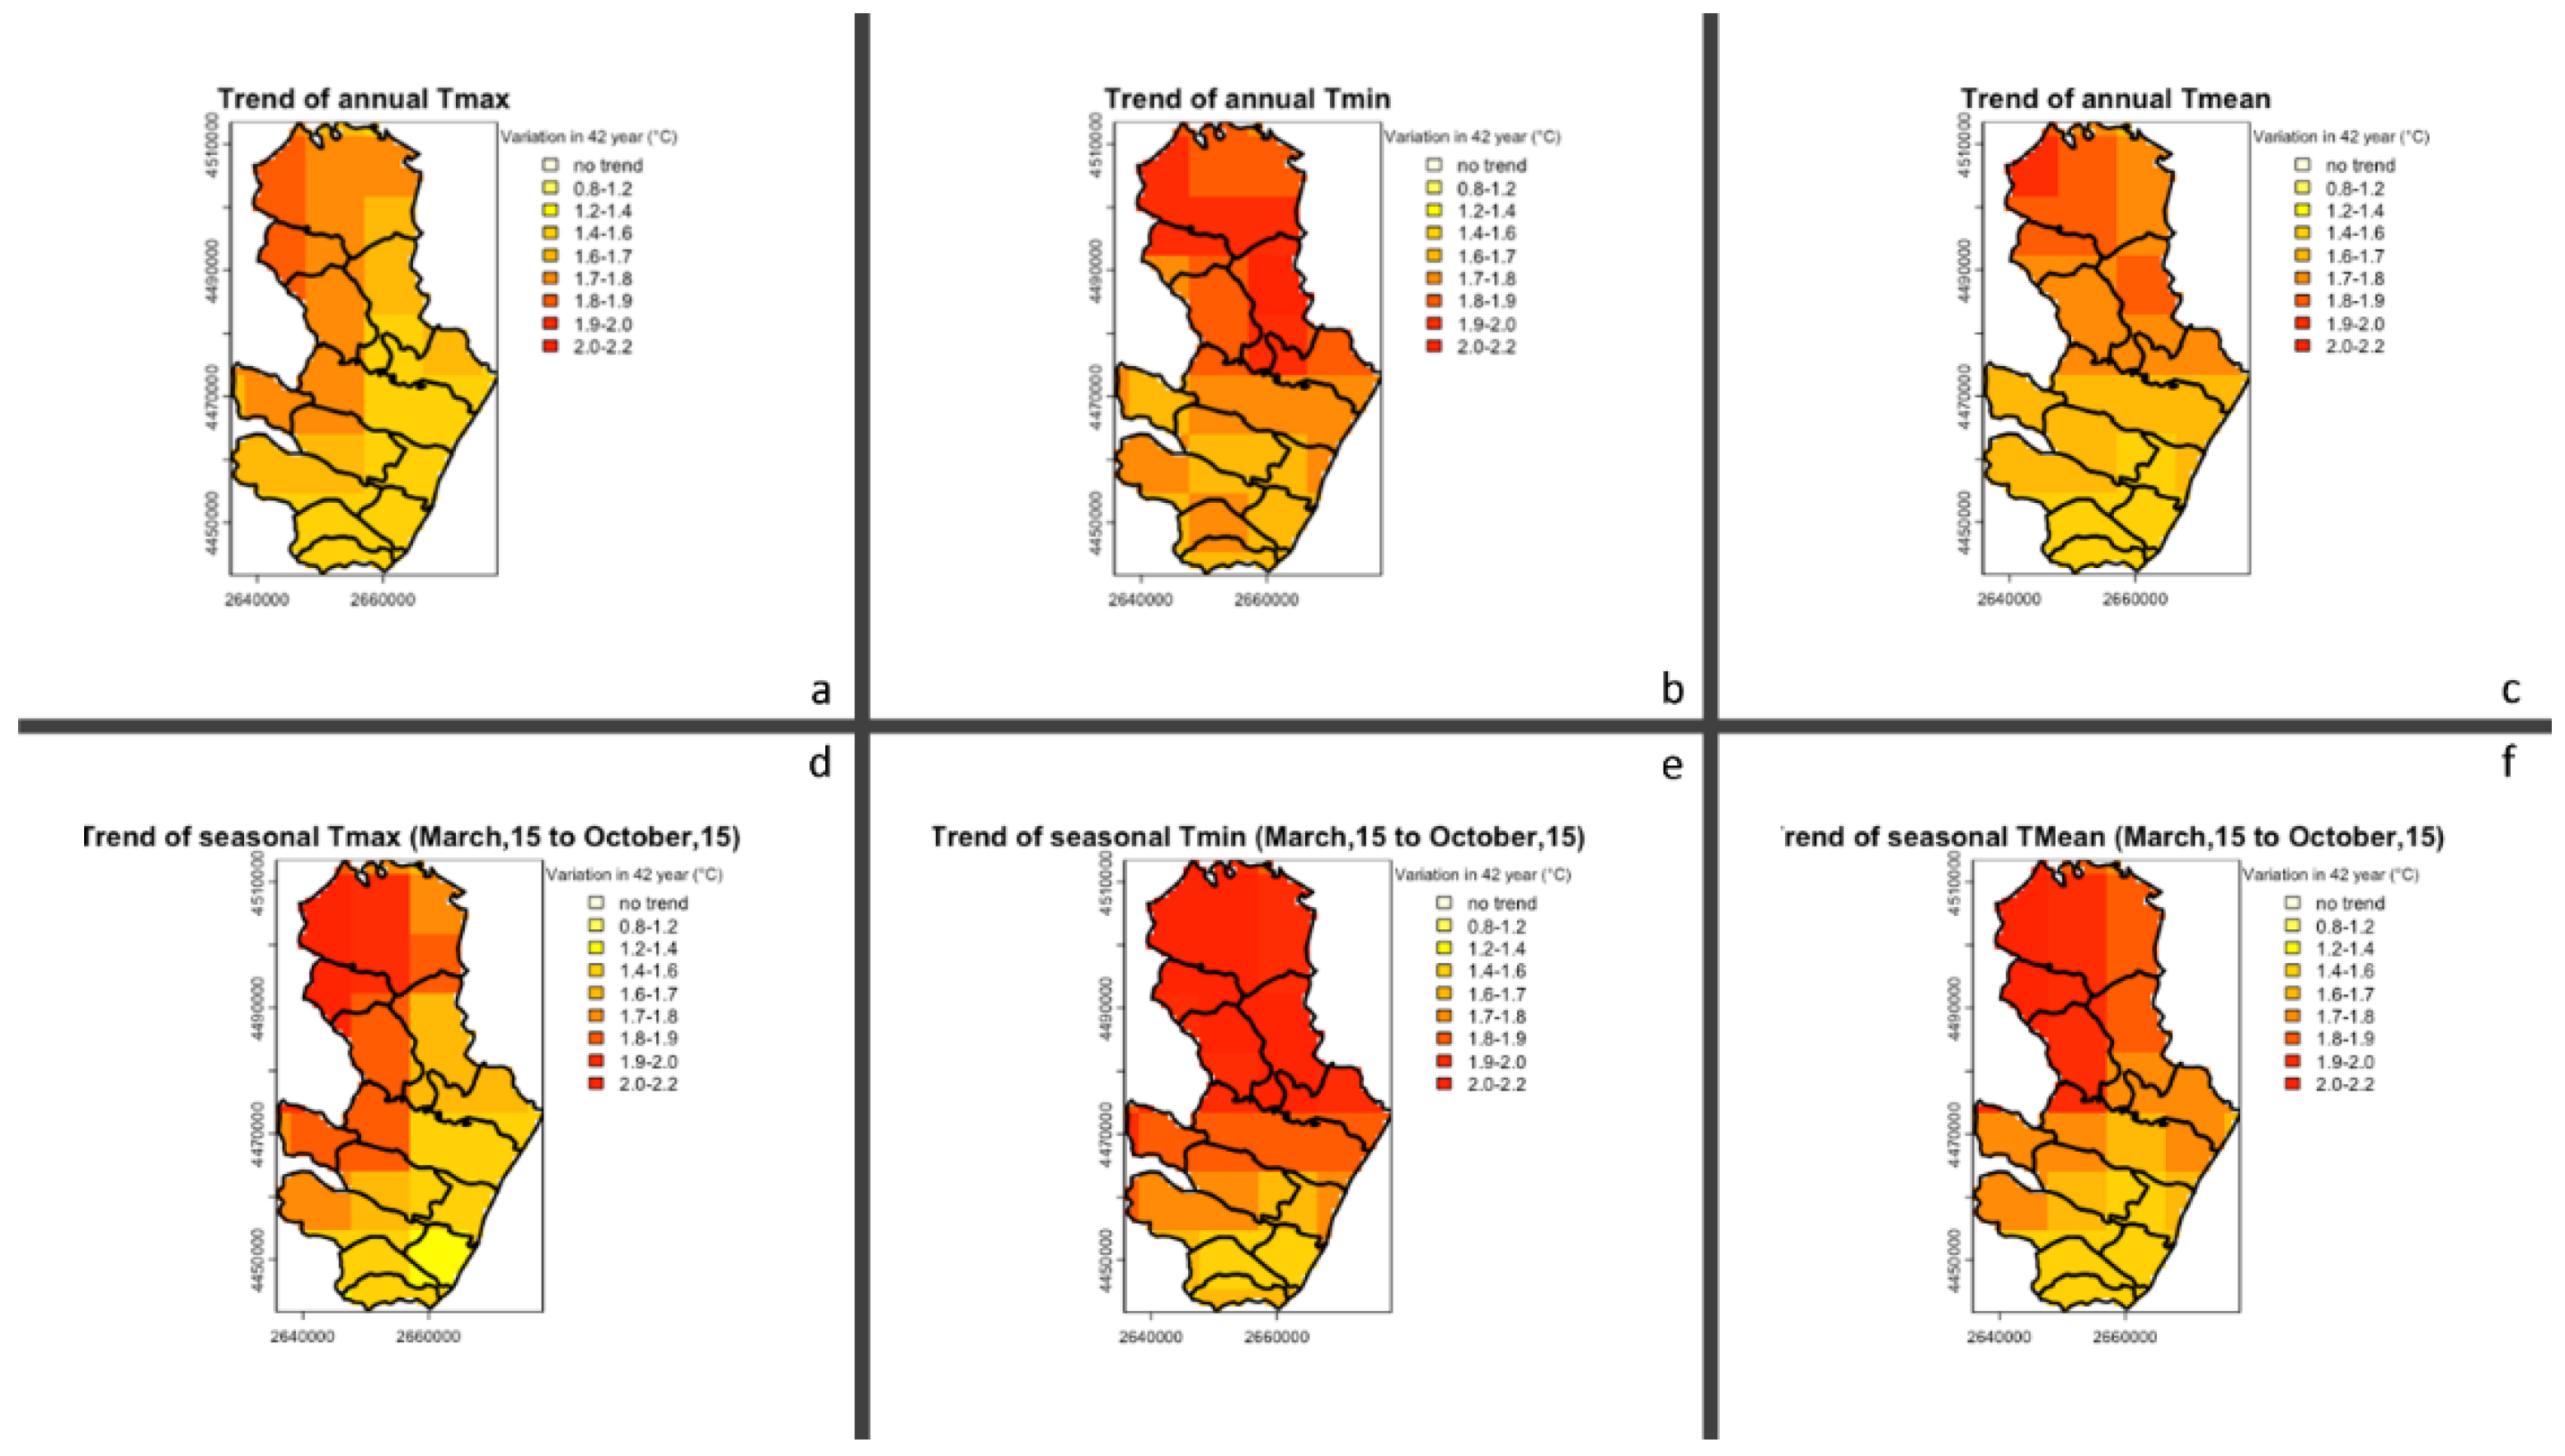
Considering the results derived from the ERA5 Land data, as far as temperatures are concerned there is a general increase over the period 1981-2022, which is particularly evident in the vine vegetative-productive cycle typical of these areas [
49,
50] - March 15/October 15. The maximum temperature shows a clear sign of growth over time, and the maximum increase mainly concerns the municipalities of Matera, Miglionico, Pomarico, Craco and the western areas of the municipalities of Pisticci, Montalbano Jonico and Tursi. Here there are increases ranging from 1.7°C up to 2.2°C (
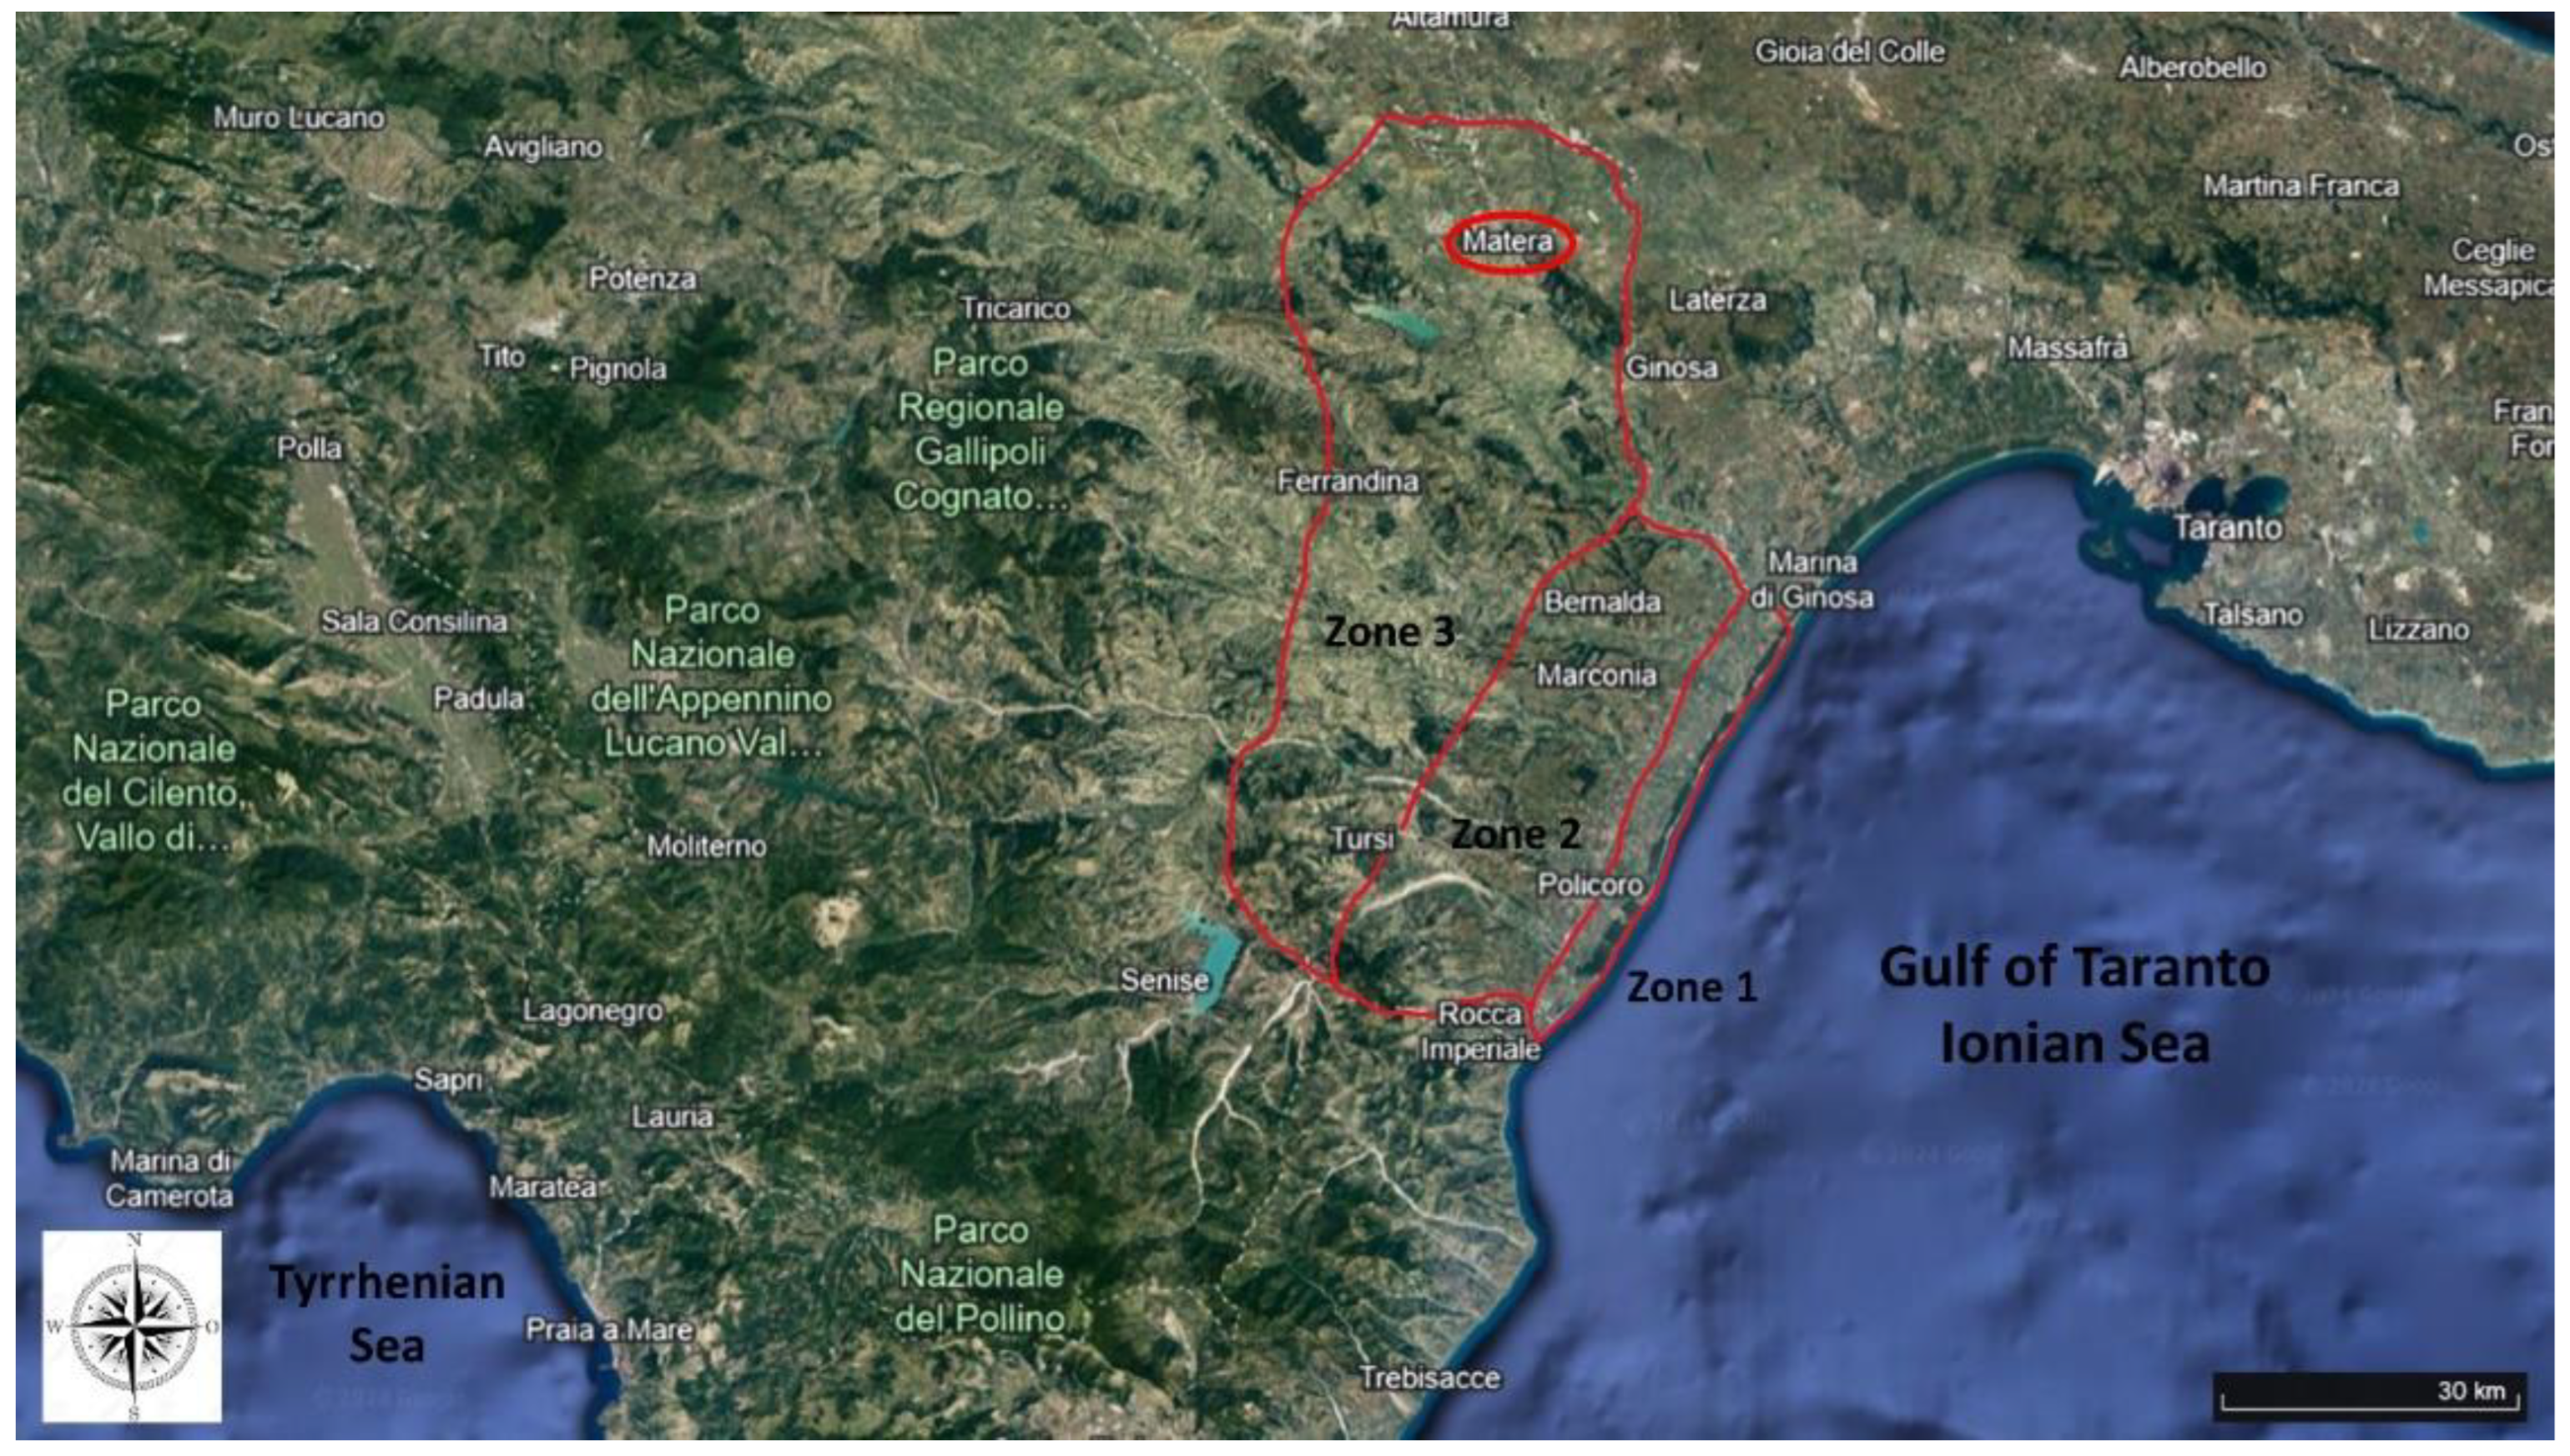
Figure 6A and 6D); while the remaining areas still show variations of no less than 1.2-1.6°C. This distribution of temperature variations also shows a spatial trend running from southeast to northwest, which, in the case of the Matera PDO study area, also corresponds to a distancing from the sea (
Figure 2 coastal belt - zone 1) in the direction of the hilly surfaces (
Figure 2, marine terraces - zone 2 and Matera hill - zone 3). With regard to the minimum temperature trend, the results of the statistical test show a much more spatially widespread variation than for maximum temperature; and with higher average growth values (
Figure 6B and 6E). In fact, relative to the growing season, for the northern half of the study area (zone 3), comprising the territories of the municipalities of Matera, Miglionico, Pomarico, Montescaglioso and the northern area of Bernalda and Pisticci, variations in minima, occurring between 1981 and 2022, are shown to range between 2 and 2.2 °C. The remaining areas, however, show marked variations in minimum temperatures ranging from 1.7 to 1.9 °C for the central area of the Matera DOP (Pisticci, Craco, Montalbano Jonico, Scanzano Jonico and Tursi); and still not falling below 1.2 -1.6 °C for the southern area of the study area (Nova Siri, Rotondella, Policoro). Finally, as for mean temperature, the results of the statistical test confirm the maximum and minimum temperature results, with increases more concentrated in the northwest area (
Figure 6C and 6F). In addition, taking into consideration the spatial trend, related to the distribution of growth variations that goes from southeast to northwest; and considering that in the case of the Matera DOP area this spatial trend corresponds to both a move away from the sea (zone 1) and a rise in elevations (zones 2 and 3), it was decided to also carry out a study on the trends of temperatures aggregated by elevation classes. For this purpose, ERA5 Land data were aggregated according to 4 elevation bands: 0-100, 100-300, 300-500 and 500-800 meters. As can be seen from
Table 5, the variation of maximum temperature, in relation to the vine production season, over 42 years is very similar in the first 3 high-metric bands (1.82-1.86 °C); on the contrary, as far as minimum temperature is concerned, a slightly lower trend is observed for the 100-300 band (1.87 °C) than for the 0-100 class (2.02 °C). In particular, it can be seen that the 300-500 range (2.10 °C) shows the greatest value of minimum temperature increase. As for the average temperature, it can be seen that the lowest temperature increment values are in the 0-100 and 500-800 ranges; while the largest increments are observed in the 100-300 range and, particularly, in the 300-500 range. These results ultimately indicate a smaller increase in temperature in the 0-100 range (zone 1) than in the 100-300 (zone 2) and 300-500 (zone 3). These trends occur contrary to what is known in the literature, namely that with increasing elevation there is also a decrease in temperatures [
51]. This counter-trend phenomenon can be explained by referring to the thermoregulatory action of the (neighboring) sea, which tends to absorb quantities of heat [
52] and lower the higher temperatures that would otherwise occur on the coastal belts. This phenomenon of “sequestration” of heat shares, which is linked to the ongoing warming of the Mediterranean Sea, explains why the above spatial trend leading to a greater increase in temperatures as you move away from the sea.
To confirm this hypothesis, we also carried out a study of aggregate temperature trends by municipal areas, also using
Table 1 in which the distribution of the territories of the municipalities by altitude band is shown in percentages. Considering the period of vine production, we note that for the maximum temperature, the municipality in which the greatest increase was recorded is Miglionico; followed by Matera, Craco and Pomarico. On the other hand, as far as minimum temperature is concerned, the municipality in which the greatest increase is confirmed to be Miglionico; followed by Matera, Montescaglioso and Bernalda. On average, therefore, the municipal territories on which the greatest increase in temperature was recorded were Miglionico, Matera and Pomarico. On the contrary, the territories of municipalities that recorded the lowest temperature increases are Policoro, Nova Siri and Rotondella. Looking at
Table 1, we see that the territories of the municipalities most affected by the increase in temperatures are mainly concentrated in the elevation ranges from 100 to 500 meters (zones 2 and 3); which also represent the 3 municipal territories furthest northwest and furthest from the sea in the entire study area. In contrast, the municipal areas least affected by the increase in temperatures are largely concentrated on the elevation bands closest to sea level (zone 1). In particular, Policoro, which has an area exclusively at sea level, is the municipality least affected by the average temperature increase (<C° increases). This indepth analysis leads us to confirm our hypothesis of thermoregulatory action of the sea.
In addition to the spatialized data study, a climate analysis was performed using point data from the 5 weather stations surveyed for the period 2000-2023. As can be seen in
Table 7, despite the fact that the average temperatures of the higher-lying municipalities (
Table 2), such as Matera, are on average lower (16 °C) than the municipalities closer to sea level, such as Nova Siri (18.1 °C) and Bernalda (17.1 °C), we can see that the same municipality of Matera has the average number of cool nights among the lowest, and the average number of warm days among the highest. In addition, Matera has one of the highest average temperatures for the month of July (
Table 7). Next, with regard to bioclimatic indices, both Huglin's and Winkler's indexes were examined. The latter placed the territories of the 5 analyzed municipalities in Region V (
Table 1S), which translates to “Typically only suitable for extremely high production, fair quality table wine or table grape varieties destined for early season consumption are grown,” as confirmed in the bibliography [
37,
53].
Table 8 shows the value of Huglin's Index: four municipal territories fall into class HI+1, i.e. “warm”; while only Bernalda falls into class HI+2, i.e. “temperate-warm.” The HI+2 class still meets the heliothermic requirements for the growth of almost all grape varieties, including late varieties [
42]. Regarding the Cool Nights CI index (
Table 9), there are some differences between the values of the five municipal areas. Matera, Montescaglioso and Bernalda are part of the same CI+1 class, i.e. “temperate nights”; Montalbano Jonico falls in the “very cool nights” class characterized by rather low night temperatures. Nova Siri, on the other hand, is part of climate class CI-2, “warm nights.” Finally, the meteorological data and bioclimatic indices of the five stations were used to identify possible trends over the period 2000-2023 (
Table 10). Montalbano Jonico was the only location where no statistically significant changes occurred over the 20-year period. This may be explained by the fact that the Montalbano Jonico station is located at an average high altitude, and at an average distance from the sea compared to the other 4 stations. Nova Siri records significant changes in five out of six cases (
Table 10), and significant trends for maximum temperature are shown in four stations (exclusion of Montalbano Jonico) followed by significance for hot days (Tmax > 35 °C) in Nova Siri, Matera and Montescaglioso. For Huglin's bioclimatic index, changes are recorded in Nova Siri, Matera and Bernalda.
5. Conclusions
This study, for the historical period analyzed, shows how the Matera DOP area showed a clear trend of increasing temperatures, and was predominantly classified as “Warm” based on the value of HI. This phenomenon of considerable temperature increase, which was initially assumed to be lower at higher elevations (zone 3) than at lower elevations close to the sea (zones 1 and 2), is strongly “buffered” by the thermoregulatory effect of the bordering Ionian Sea.
In fact, the rise in minimum and average temperatures was mainly observed in the northwest area of the study area (zone 3 of the “Matera Hills”), which is characterized by higher altitudes and also the most distant from the sea. The municipalities of Matera, Miglionico and Pomarico, which are the areas furthest northwest and furthest from the sea, recorded increases of up to 2.0-2.2 °C; on the contrary, the areas closer to the sea and at lower altitudes, for example, the municipalities of Nova Siri, Rotondella and Policoro, were more slightly affected by the increase in temperatures, recording 1.2-1.4 °C. Based on the analyses performed, therefore, the hypothesis on the differences found between the temperature regimes of coastal and inland areas is related to the mitigating function (with respect to temperatures) of the sea, which has a greater influence on coastal areas that are located in its vicinity. That is, the sea [
52] acts with thermoregulatory action on neighboring and bordering areas by going to “sequester” part of the heat that accumulates on them. This action is not carried out and does not affect the mitigation of temperatures in the areas of zones 2 and 3 that are more distant and at higher altitudes (municipalities of Matera, Miglionico and Pomarico).
It follows that these viticultural areas (zones 2 and 3), in particular, will already have to adapt to severe climatic conditions that may affect the quality and typicality of Matera DOP wines.
We can draw some general inferences from the results of this study. The first is that moving vine breeding to higher altitudes (as per the trend) is not always sufficient to preserve it and counteract the effects of ongoing climate change. The second is that the sea plays, to date, its “thermoregulating effect” only along coastal areas. Third and final consideration is that we must, in any case, resort, as of now, to a radical rethinking of the positioning of viticulture on a given DOP territory, and the most appropriate adaptation strategies for the purpose of preserving the cultivation and typicality of the different DOPs.
Author Contributions
Conceptualization, P.C. and A.C.; methodology, P.C., A.C., E.S. and E.G.; software, E.S. and E.G.; validation, E.S. and E.G.; formal analysis, E.S. and E.G.; investigation, P.C., A.C., E.S. and E.G.; resources, P.C.; data curation, P.C., A.C., E.S. and E.G.; writing—original draft preparation, P.C., A.C.; writing—review and editing, X.X.; visualization, P.C., A.C.; supervision, P.C.; project administration, P.C.; funding acquisition, P.C. All authors have read and agreed to the published version of the manuscript.
Figure 1.
Basilicata Region in Southern Italy (yellow) include the Matera DOP (in red) winegrape-growing area.
Figure 1.
Basilicata Region in Southern Italy (yellow) include the Matera DOP (in red) winegrape-growing area.
Figure 2.
Subdivision of the study area (part of the Matera DOP) into 3 zones: 1) Coastal Plain, 2) Terrazzi Marini, 3) Inner Matera Hills; surrounded in red highlights the city of Matera.
Figure 2.
Subdivision of the study area (part of the Matera DOP) into 3 zones: 1) Coastal Plain, 2) Terrazzi Marini, 3) Inner Matera Hills; surrounded in red highlights the city of Matera.
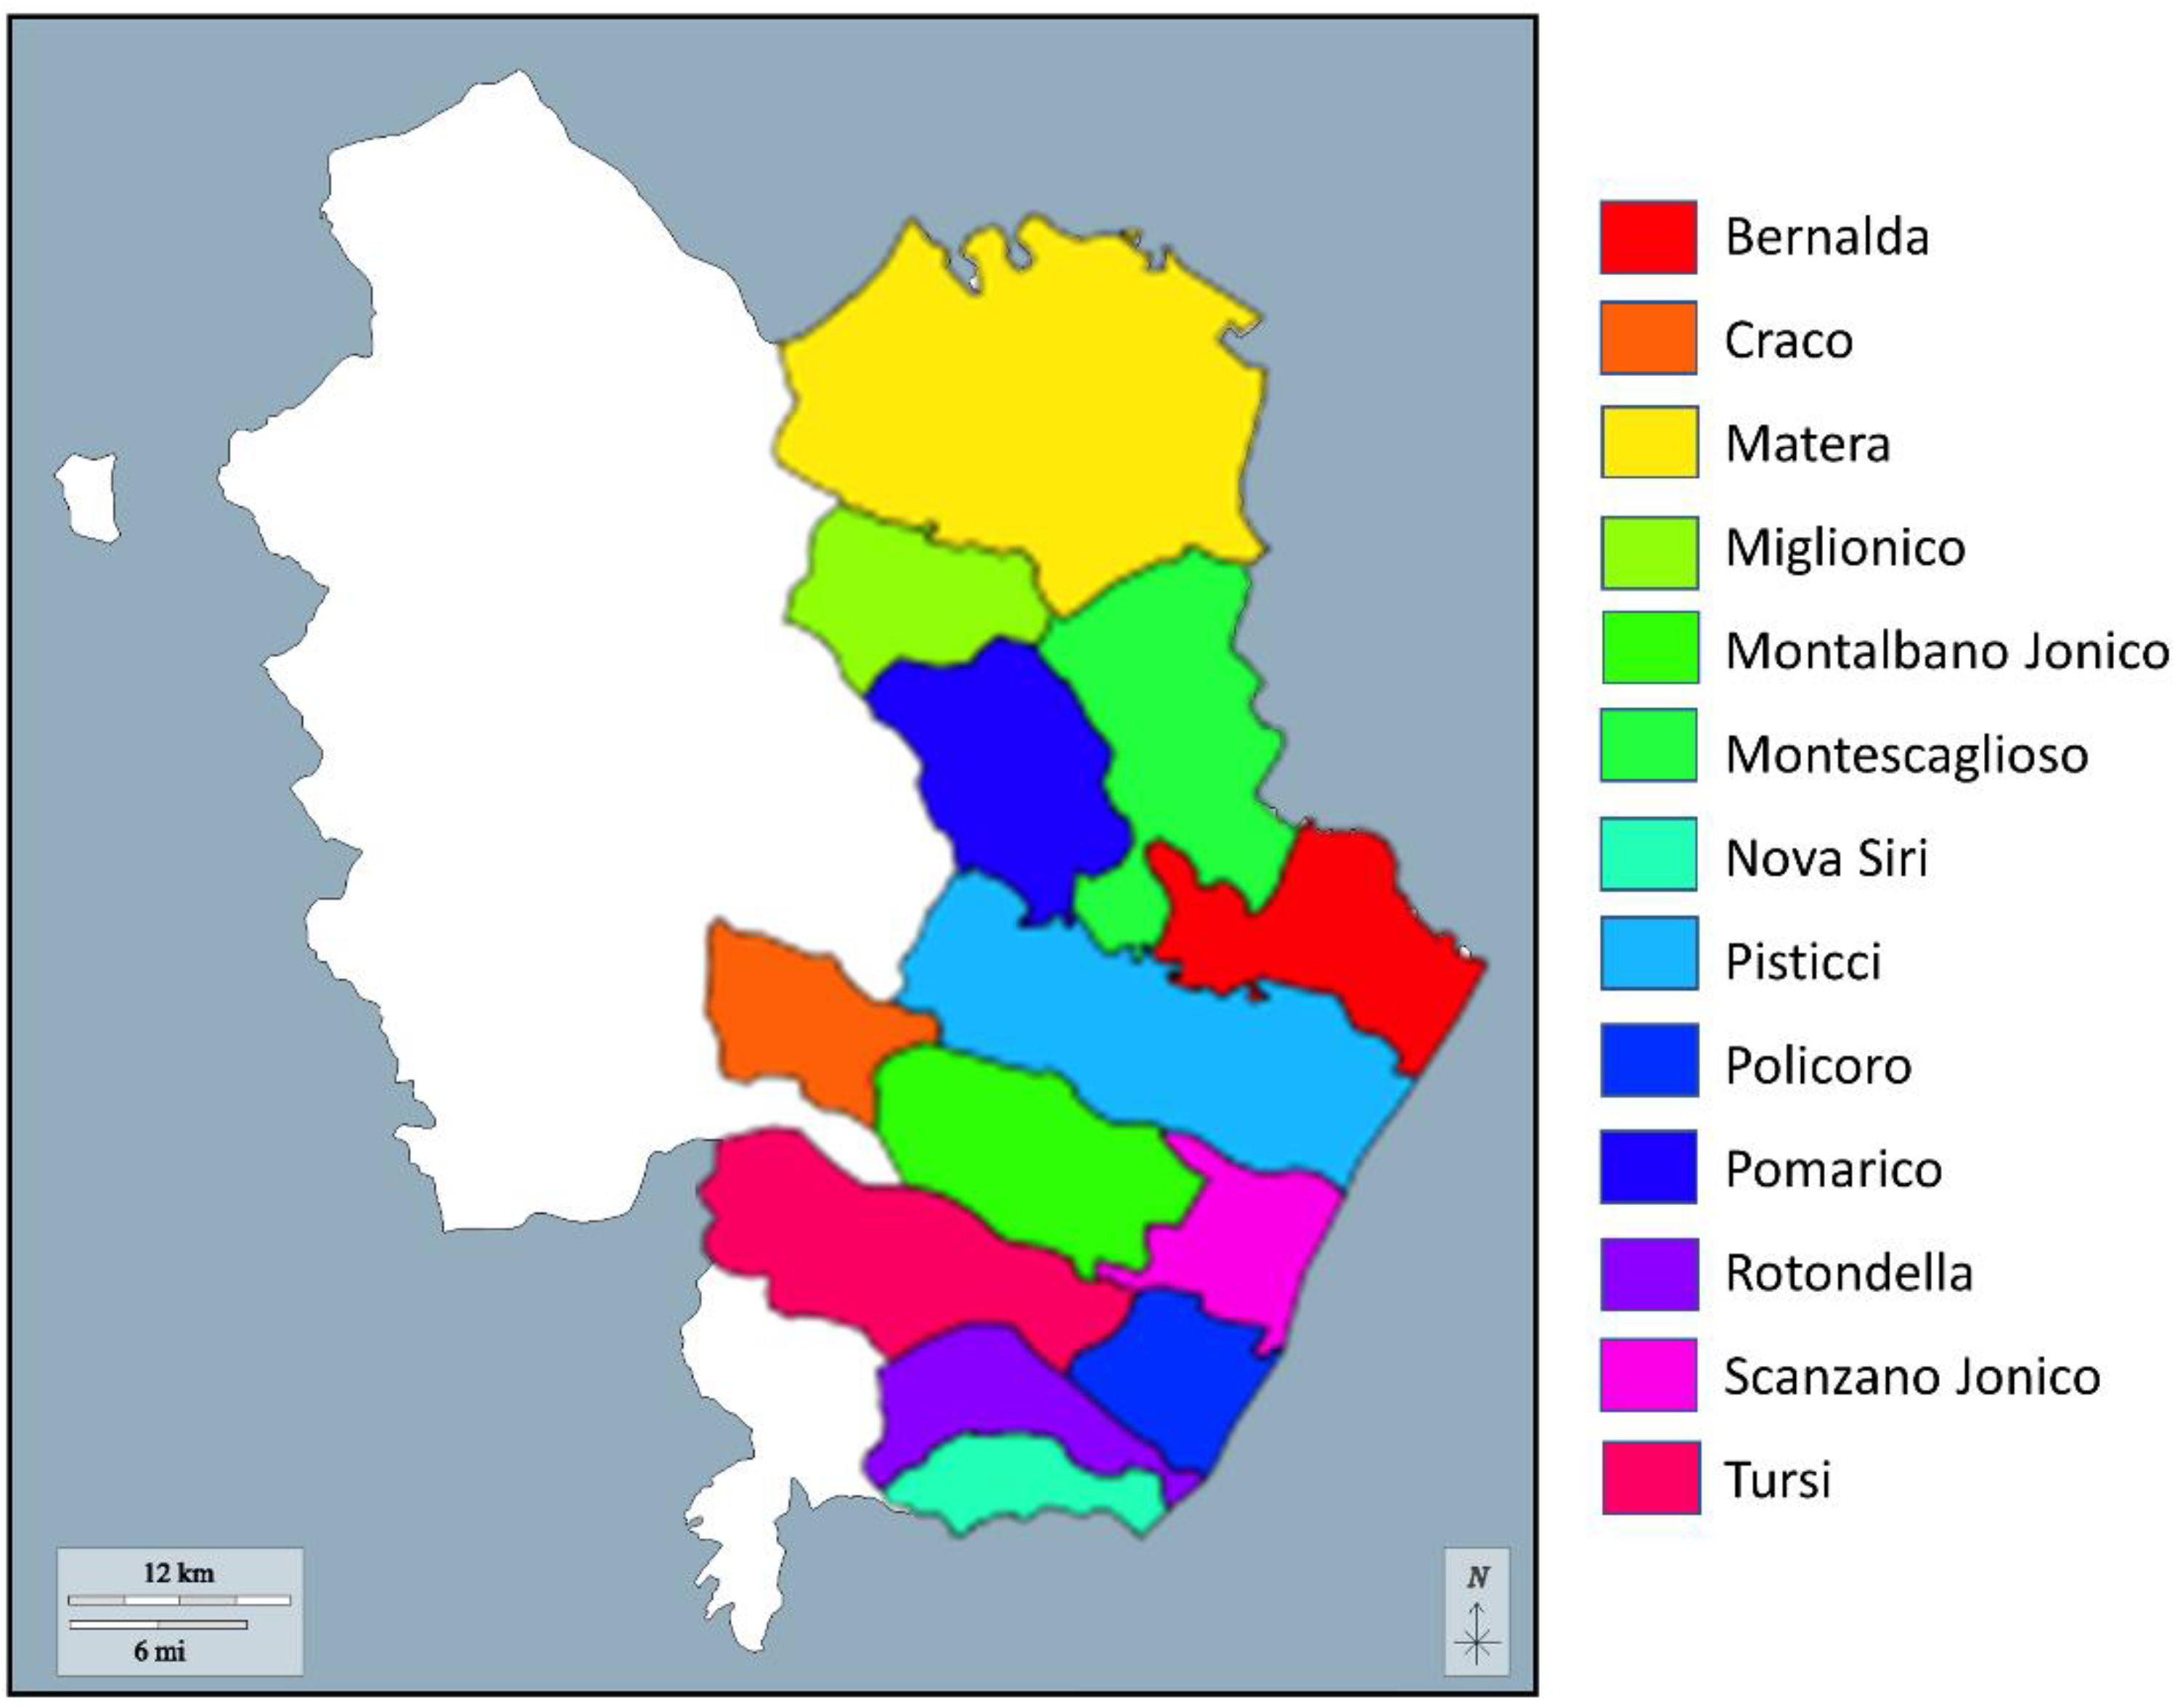
Figure 3.
Total area of the province of Matera with the 13 municipalities considered in this study.
Figure 3.
Total area of the province of Matera with the 13 municipalities considered in this study.
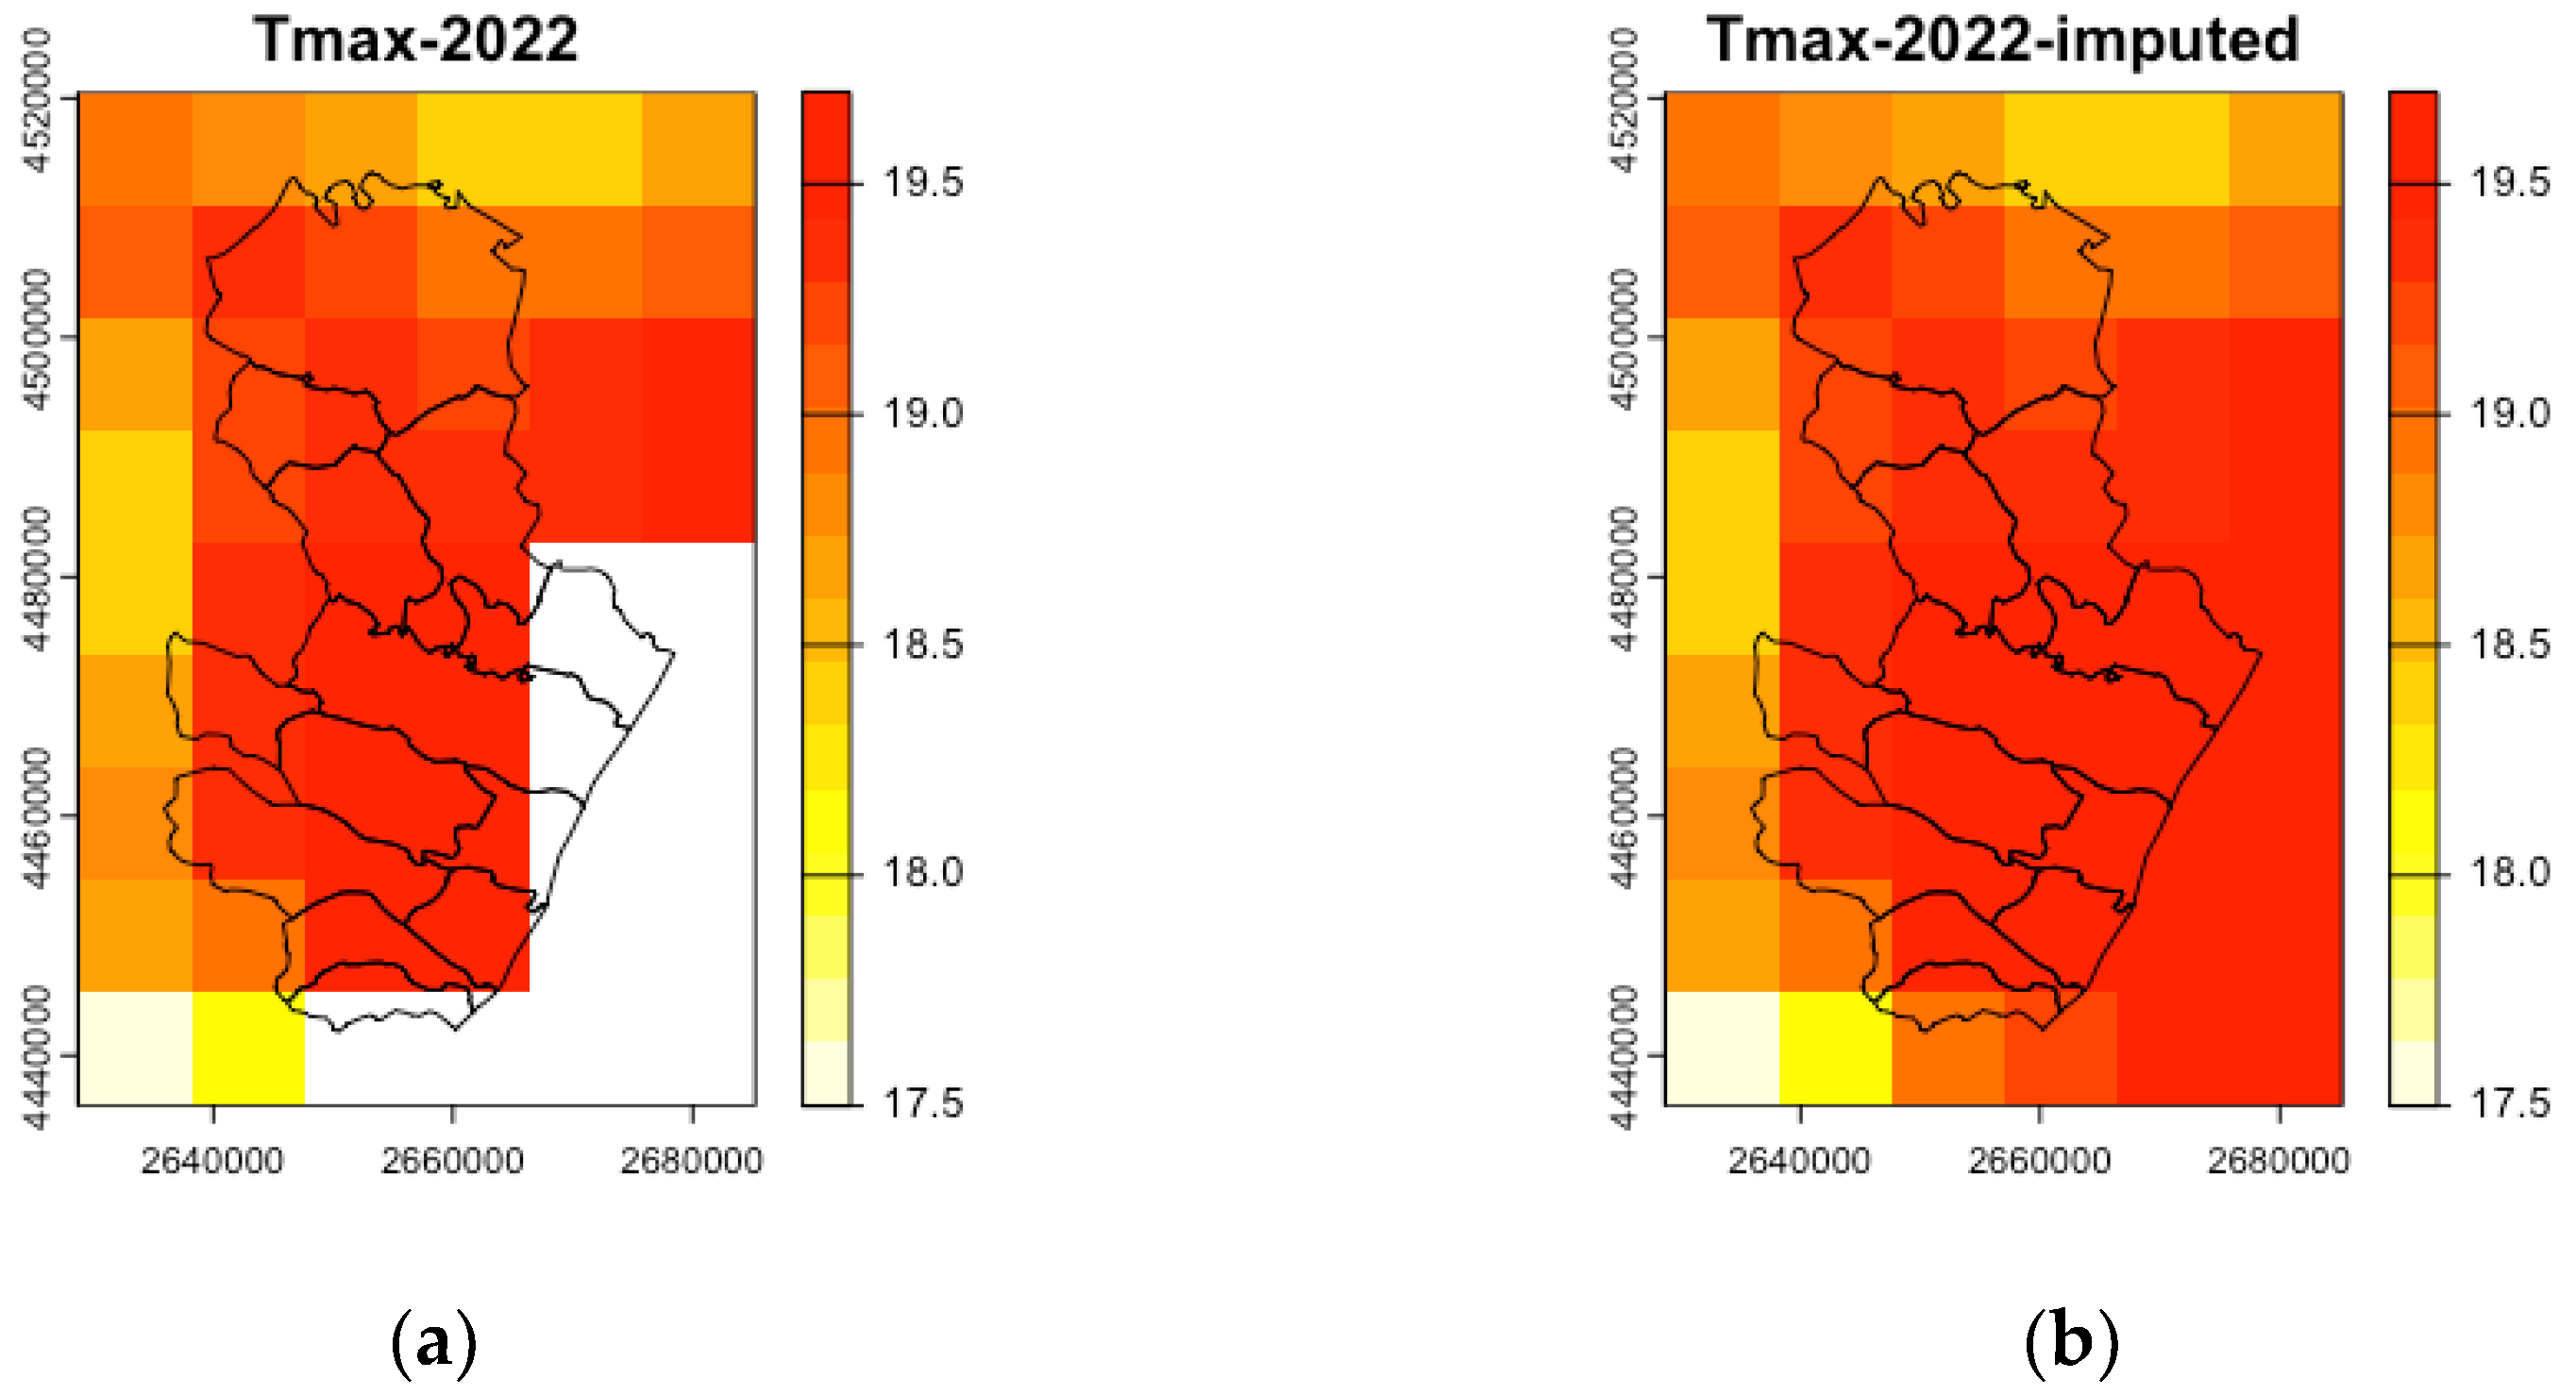
Figure 4.
(A) Example of the Tmax for 2022 where 12 cells in the study area are not covered by ERA5 Land climate data; (B) reconstruction of the complete time series for each missing cell using, for each year, the average of the data from the 5 nearest cells.
Figure 4.
(A) Example of the Tmax for 2022 where 12 cells in the study area are not covered by ERA5 Land climate data; (B) reconstruction of the complete time series for each missing cell using, for each year, the average of the data from the 5 nearest cells.
Figure 5.
Location of the five agrometeorological stations falling within the production area of the Matera DOC.
Figure 5.
Location of the five agrometeorological stations falling within the production area of the Matera DOC.
Figure 6.
Trend of temperatures calculated by β-Sen method on ERA5 Land data; (A) maximum temperature for the whole year; (B) minimum temperature for the whole year; (C) average temperature for the whole year; (D) maximum temperature for the vine growing season; (E) minimal temperature for the vine growing season; (F) average temperature for the vine growing season.
Table 1.
Percentage distribution by elevation bands of the areas of the 13 municipalities.
Table 1.
Percentage distribution by elevation bands of the areas of the 13 municipalities.
| Municipalities |
Areas (% of total municipal area) |
| 0-100 |
100-200 |
200-300 |
300-400 |
400-500 |
500-600 |
600-700 |
700-800 |
800-900 |
| Craco |
11% |
58% |
28% |
2% |
0% |
0% |
0% |
0% |
0% |
| Bernalda |
86% |
14% |
1% |
0% |
0% |
0% |
0% |
0% |
0% |
| Policoro |
99% |
1% |
0% |
0% |
0% |
0% |
0% |
0% |
0% |
| Scanzano Jonico |
99% |
1% |
0% |
0% |
0% |
0% |
0% |
0% |
0% |
| Pisticci |
71% |
22% |
6% |
1% |
0% |
0% |
0% |
0% |
0% |
| Montalbano Jonico |
30% |
60% |
9% |
0% |
0% |
0% |
0% |
0% |
0% |
| Pomarico |
18% |
29% |
28% |
17% |
8% |
0% |
0% |
0% |
0% |
| Rotondella |
38% |
32% |
13% |
8% |
5% |
3% |
1% |
0% |
0% |
| Nova Siri |
31% |
24% |
20% |
13% |
7% |
3% |
1% |
1% |
0% |
| Miglionico |
9% |
49% |
21% |
15% |
7% |
0% |
0% |
0% |
0% |
| Tursi |
26% |
36% |
14% |
10% |
8% |
5% |
0% |
0% |
0% |
| Matera |
4% |
25% |
23% |
36% |
12% |
1% |
0% |
0% |
0% |
| Montescaglioso |
40% |
43% |
16% |
1% |
0% |
0% |
0% |
0% |
0% |
Table 2.
List of stations of the Lucanian Agrometeorological Service of the Lucanian Agency for Development and Innovation in Agriculture (SAL-ALSIA).
Table 2.
List of stations of the Lucanian Agrometeorological Service of the Lucanian Agency for Development and Innovation in Agriculture (SAL-ALSIA).
| Code |
Station name |
Istitution |
Coordinates |
| Lat |
Lon |
Masl |
| MTP 21 |
Matera – C. da Matinelle |
SAL-ALSIA |
40,69393 |
16,51744 |
224 |
| PAN 39 |
Metaponto 1 (Bernalda) – AASD Pantanello |
SAL-ALSIA |
40,389966 |
16,786328 |
9 |
| MO4 10 |
Montalbano J. – (MT) Cozzo del Fico |
SAL-ALSIA |
40,281331 |
16,614422 |
151 |
| MTS 26 |
Montescaglioso (MT) – Fiumicello Cozzo del Presepe |
SAL-ALSIA |
40,480373 |
16,720097 |
32 |
| NS3 16 |
Nova Siri Sc. (MT) – Agriturism "La Collinetta" |
SAL-ALSIA |
40,147778 |
16,589166 |
136 |
Table 3.
List of climate parameters and bioclimatic indices used in this study.
Table 3.
List of climate parameters and bioclimatic indices used in this study.
| Variable |
Description |
References |
| Tmin |
Annual minimum air temperature (Annual minimum air temperature) |
|
| Tmin 4-10 |
Growing season minimum air temperature April 1-October 31 (Growing season minimum air temperature) |
[36] |
| Tmax |
Maximum air temperature (Annual maximum air temperature) |
|
| Tmax 4-10 |
Growing season maximum air temperature April 1-October 31 (Growing season maximum air temperature) |
[36] |
| WI |
Winkler index (Growing Degree Day or Winkler Thermal Index), |
[37] |
| HI |
Huglin index (Heliothermal Index or Huglin Index 1 April−30 September) |
[38] |
| CNI |
Cool night index (Cool Night Index (average of minimum temperatures 1−30 September) |
[39] |
| ND ≤ 0 °C |
Number of days with frost (Number of days with air minimum temperature ≤ 0 °C) |
|
| ND > 35 °C |
Number of hot days with Tmax > 35 °C (Number of days with air maximum temperature > 35 °) |
[40] |
Table 4.
Classification system of Winkler's Index (WI), Heliothermic or Huglin's Index (HI) and Fresh Nights Index (CI) with their calculation formulas;
a [
41];
b [
42].
Table 4.
Classification system of Winkler's Index (WI), Heliothermic or Huglin's Index (HI) and Fresh Nights Index (CI) with their calculation formulas;
a [
41];
b [
42].
| Bioclimatic index |
Class/Region of viticultural climate |
Acronym |
Interval |
|
a Winkler index |
Too cold |
|
≤ 850 |
| Region I |
|
> 851 < 1390 |
| Region II |
|
≥ 1390 < 1668 |
| Region III |
|
≥ 1668 < 1945 |
| Region IV |
|
≥ 1945 < 2223 |
| Region V |
|
≥ 2223 < 2700 |
| Too hot |
|
≥ 2701 |
|
b Huglin index |
Very cool |
HI-3 |
≤ 1500 |
| Cool |
HI-2 |
> 1500 ≤ 1800 |
| Temperate |
HI-1 |
> 1800 ≤ 2100 |
| Temperate warm |
HI+1 |
> 2100 ≤ 2400 |
| Warm |
HI+2 |
> 2400 ≤ 3000 |
| Very warm |
HI+3 |
> 3000 |
|
b Cool night index |
Very cool nights |
CI+2 |
≤ 12 |
| Cool nights |
CI+1 |
> 12 ≤ 14 |
| Temperate nights |
CI-1 |
> 14 ≤ 18 |
| Warm nights |
CI-2 |
> 18 |
Table 5.
Temperature change over 42 years calculated by the β-Sen method relative to the period March 15-October 15, for 4 elevation bands.
Table 5.
Temperature change over 42 years calculated by the β-Sen method relative to the period March 15-October 15, for 4 elevation bands.
| Growing season (March, 15 – October, 15) |
|---|
| Elevation |
Tmax (°C) |
Tmin (°C) |
Tavg (°C) |
| [0-100] |
1.86 |
2.02 |
1.77 |
| (100-300] |
1.82 |
1.87 |
1.86 |
| (300-500] |
1.82 |
2.10 |
1.91 |
| (500-800] |
1.57 |
1.49 |
1.61 |
Table 6.
Temperature changes over 42 years calculated by the β-Sen method relative to the period March 15-October 15 and annual, for municipalities.
Table 6.
Temperature changes over 42 years calculated by the β-Sen method relative to the period March 15-October 15 and annual, for municipalities.
| |
Annual |
Growing season (March, 15 – October, 15) |
| Municipalities |
Tmax |
Tmin |
Tavg |
Tmax |
Tmin |
Tavg |
| Bernalda |
1.04 |
1.45 |
1.18 |
0.92 |
1.53 |
1.23 |
| Craco |
1.22 |
1.20 |
1.18 |
1.05 |
1.38 |
1.23 |
| Matera |
1.09 |
1.42 |
1.30 |
1.07 |
1.60 |
1.29 |
| Miglionico |
1.16 |
1.47 |
1.30 |
1.16 |
1.64 |
1.41 |
| Montalbano Jonico |
1.10 |
1.23 |
1.10 |
0.85 |
1.29 |
1.08 |
| Montescaglioso |
1.04 |
1.46 |
1.27 |
0.88 |
1.63 |
1.26 |
| Nova Siri |
1.00 |
1.22 |
1.09 |
0.82 |
1.19 |
1.01 |
| Pisticci |
1.03 |
1.35 |
1.13 |
0.91 |
1.42 |
1.18 |
| Policoro |
1.00 |
1.24 |
1.06 |
0.72 |
1.17 |
0.95 |
| Pomarico |
1.13 |
1.39 |
1.21 |
1.05 |
1.49 |
1.34 |
| Rotondella |
1.03 |
1.25 |
1.11 |
0.81 |
1.17 |
1.05 |
| Tursi |
1.13 |
1.28 |
1.11 |
0.99 |
1.33 |
1.16 |
| Scanzano Jonico |
1.04 |
1.29 |
1.11 |
0.88 |
1.30 |
1.09 |
Table 7.
Climate values calculated over the 2000-2023 period of the five stations.
Table 7.
Climate values calculated over the 2000-2023 period of the five stations.
| Station |
Tmed (°C) |
Coldest month |
Tmed coldest month |
Total frosts 2000-2023 |
Average cool nights 2000-2023 |
Hottest month |
Tmed hottest month |
Average hot days 2000-2023 |
| Montalbano J.co |
16.4 |
January |
3.7 |
173 |
11.1 |
July |
33.6 |
23 |
| Nova Siri |
18.1 |
January |
6.4 |
45 |
18.9 |
July |
33.1 |
19 |
| Matera |
16.0 |
January |
2.5 |
576 |
15.2 |
July |
34.4 |
35 |
| Montescaglioso |
16.6 |
January |
2.2 |
535 |
15.3 |
July |
34.9 |
38 |
| Bernalda |
17.1 |
January |
3.8 |
211 |
16.7 |
July |
33.7 |
24 |
Table 8.
Huglin bioclimatic index calculated over the period 2000-2023 for the five stations.
Table 8.
Huglin bioclimatic index calculated over the period 2000-2023 for the five stations.
| Station |
Huglin index |
| Value |
Class of viticultural climate |
Acronym |
Class Interval |
| Montalbano Jonico |
2798 |
Warm |
HI + 2 |
2400<HI≤3000 |
| Nova Siri |
2903 |
Warm |
HI + 2 |
2400<HI≤3000 |
| Matera |
2806 |
Warm |
HI + 2 |
2400<HI≤3000 |
| Montescaglioso |
2937 |
Warm |
HI + 2 |
2400<HI≤3000 |
| Bernalda |
2326 |
Warm temperate |
HI + 1 |
2100<HI≤2400 |
Table 9.
Bioclimatic index Fresh nights calculated over the period 2000-2023 for the five stations.
Table 9.
Bioclimatic index Fresh nights calculated over the period 2000-2023 for the five stations.
| Station |
Cool Night Index |
| Value |
Class of viticultural climate |
Acronym |
Class Interval |
| Montalbano Jonico |
11,1 |
Very cool nights |
CI+2 |
Tmin < 12 °C |
| Nova Siri |
18,9 |
Warm nights |
CI-2 |
Tmin > 18 °C |
| Matera |
15,2 |
Temperate nights |
CI-1 |
14 °C<Tmin≤18 °C |
| Montescaglioso |
15,3 |
Temperate nights |
CI-1 |
14 °C<Tmin≤18 °C |
| Bernalda |
16,7 |
Temperate nights |
CI-1 |
14 °C<Tmin≤18 °C |
Table 10.
Trend of bioclimatic indices calculated over the period 2000-2023 of the five stations falling within the Matera PDO production area; p-value is considered significant if <0.1.
Table 10.
Trend of bioclimatic indices calculated over the period 2000-2023 of the five stations falling within the Matera PDO production area; p-value is considered significant if <0.1.
| Station |
p-value |
| Tmin |
Tmax |
Tmin ≤ 0 °C |
Notti fresche |
Tmax>35 °C |
HI |
| Montalbano Jonico |
0,56122 |
0,38531 |
0.50864 |
0.47194 |
0.70927 |
0,86216 |
| Nova Siri |
0,00088 |
0,00004 |
0.31399 |
0.00072 |
0.06944 |
0,01224 |
| Matera |
0,39804 |
0,00602 |
0.32831 |
0.33336 |
0.0645 |
0,05614 |
| Montescaglioso |
0,7513 |
0,01746 |
0.39804 |
0.18029 |
0.01746 |
0,44193 |
| Bernalda |
0,13026 |
0,00106 |
0.23077 |
0.05614 |
0.11156 |
0,00001 |
