1. Introduction
In a flow conveyance system, transient flow embodies the process of transition from one stable state of flow to another. The phenomenon is often fomented by disturbances in flow dynamics and takes place in both confined and unconfined fluid systems. Sudden changes in flow that result in audible pressure oscillations in a confined system, such as a water pipeline, are called “water hammer.” The origin of this term was because the surge, when it occurs, is sometimes accompanied by a pounding noise (Kumar Patel, 2016).
The term water hammer is sometimes flogged as transients or pressure surges. It occurs when the balance of continuous flow in a system is disrupted because of sudden shut downs of pumps or rapid closure of valves with large changes in flow in a very small period. Hydraulic transients sometimes referred to as water hammer—may bring about extremely large pressures and sudden fluid accelerations in a water transmission system, subsequently leading to pipe ruptures, failures of equipment or pumps, structural fatigue, or contaminated-water back-flow (Huo et al., 2010).
Italian engineer Lorenzo Allievi conducted pioneering research on the water hammer problem. There are two approaches to the analysis of water hammer: one rigorously including all those factors and another, the rigid column theory, assuming that the elasticity of the pipe walls and the compressibility of the fluid can be ignored (Choon et al., 2012). The unsteady fluid flows have long been studied ever since people started adjusting the water’s flow for different reasons. In the past century, this phenomenon has been the focus of several theoretical investigations and real-world applications (Nikodijevic et al., 2019).
In view of water hammer intrinsic hazards, pipelines must be designed, managed, operated, and planned with proper sizing and control methods. The process of computer modeling events of water hammer is very effective at simulating and explaining transient pressure wave behavior. A pressure shock wave, created once the water flow is suddenly halted, travels through the plumbing producing pipe expansion and vibration more often than not attended by loud noises. On account of pipe expansion and friction losses in the pipes, the energy of the shock wave decreases with time, and currently, elasticity in pipes allows them to absorb the pressure shock (Rayan et al., 2008).
Addressing this, water hammer becomes one important aspect of pipeline engineering. The hydraulic transients may lead to pipeline failures, and therefore, the analysis of maximum and minimum transient pressures resulting on account of flow control operations becomes very important. Design criteria must be established for system equipment and devices to prevent failures like pipe collapses or rupture (Boulos et al., 2005). Furthermore, researchers like Ramos et al., (2004) have conducted simulations and experimental tests on pipelines with varying characteristics, highlighting the significance of accounting for viscoelastic effects in model calibration and operational predictions, especially for plastic pipes. Choon et al., (2012) explored prevention methods for water hammer, including bypass pipes with non-return valves, demonstrating their effectiveness in reducing water hammer. Kim & Asce, (2008) developed surge protection device models, which align well with simulation results. Abozaid et al., (2012) investigated the effects of changing demands in pipe networks, emphasizing their influence on flow rates and piezometric head fluctuations. Understanding and mitigating water hammer effects are vital for maintaining a robust water supply system.
Multi-Village Water Supply Schemes, including the Su’ula-Manda-Daba Multi-Village Water Supply Schemes, refer to water supply schemes that are initiated and installed to provide the community with a fairly sufficient and regular water supply in and into Manda Town and other surrounding villages. Mostly, these water supply systems face frequent pipe collapse, burst links, pump failure, and valve failures. At present, there is no area-wise exhaustive analysis of the origins of the pipe failure and equipment malfunction within the water supply system. On the contrary, there exists a research gap with respect to the development of detail in transient analysis focused on water hammering.
This will, therefore, be conducting comprehensive research on the challenges faced by the SMD Multi-Village Water Supply Schemes, which will analyze with articulation the exact causes of pipe failure and equipment malfunction, and finally, provide effective protective measures to improve the safety, performance, and system reliability of the water supply. The findings from this research are going to make very substantial contributions toward improving the overall sustainability, as well as the functionality of the water supply project, thus maintaining the accruing benefits in the long term. Bridging these gaps in this research work can be said to be of paramount importance in ensuring long-term functionality and reliability of the SMD Multi-Village Water Supply Scheme. Thus, this study evaluates the water hammer phenomenon and investigates the source of it in the Transmission Main Pipeline of the SMD Multi-Village Water Supply Schemes in Afar Region, Ethiopia.
2. Materials And Methods
2.1. Description of the Study Area
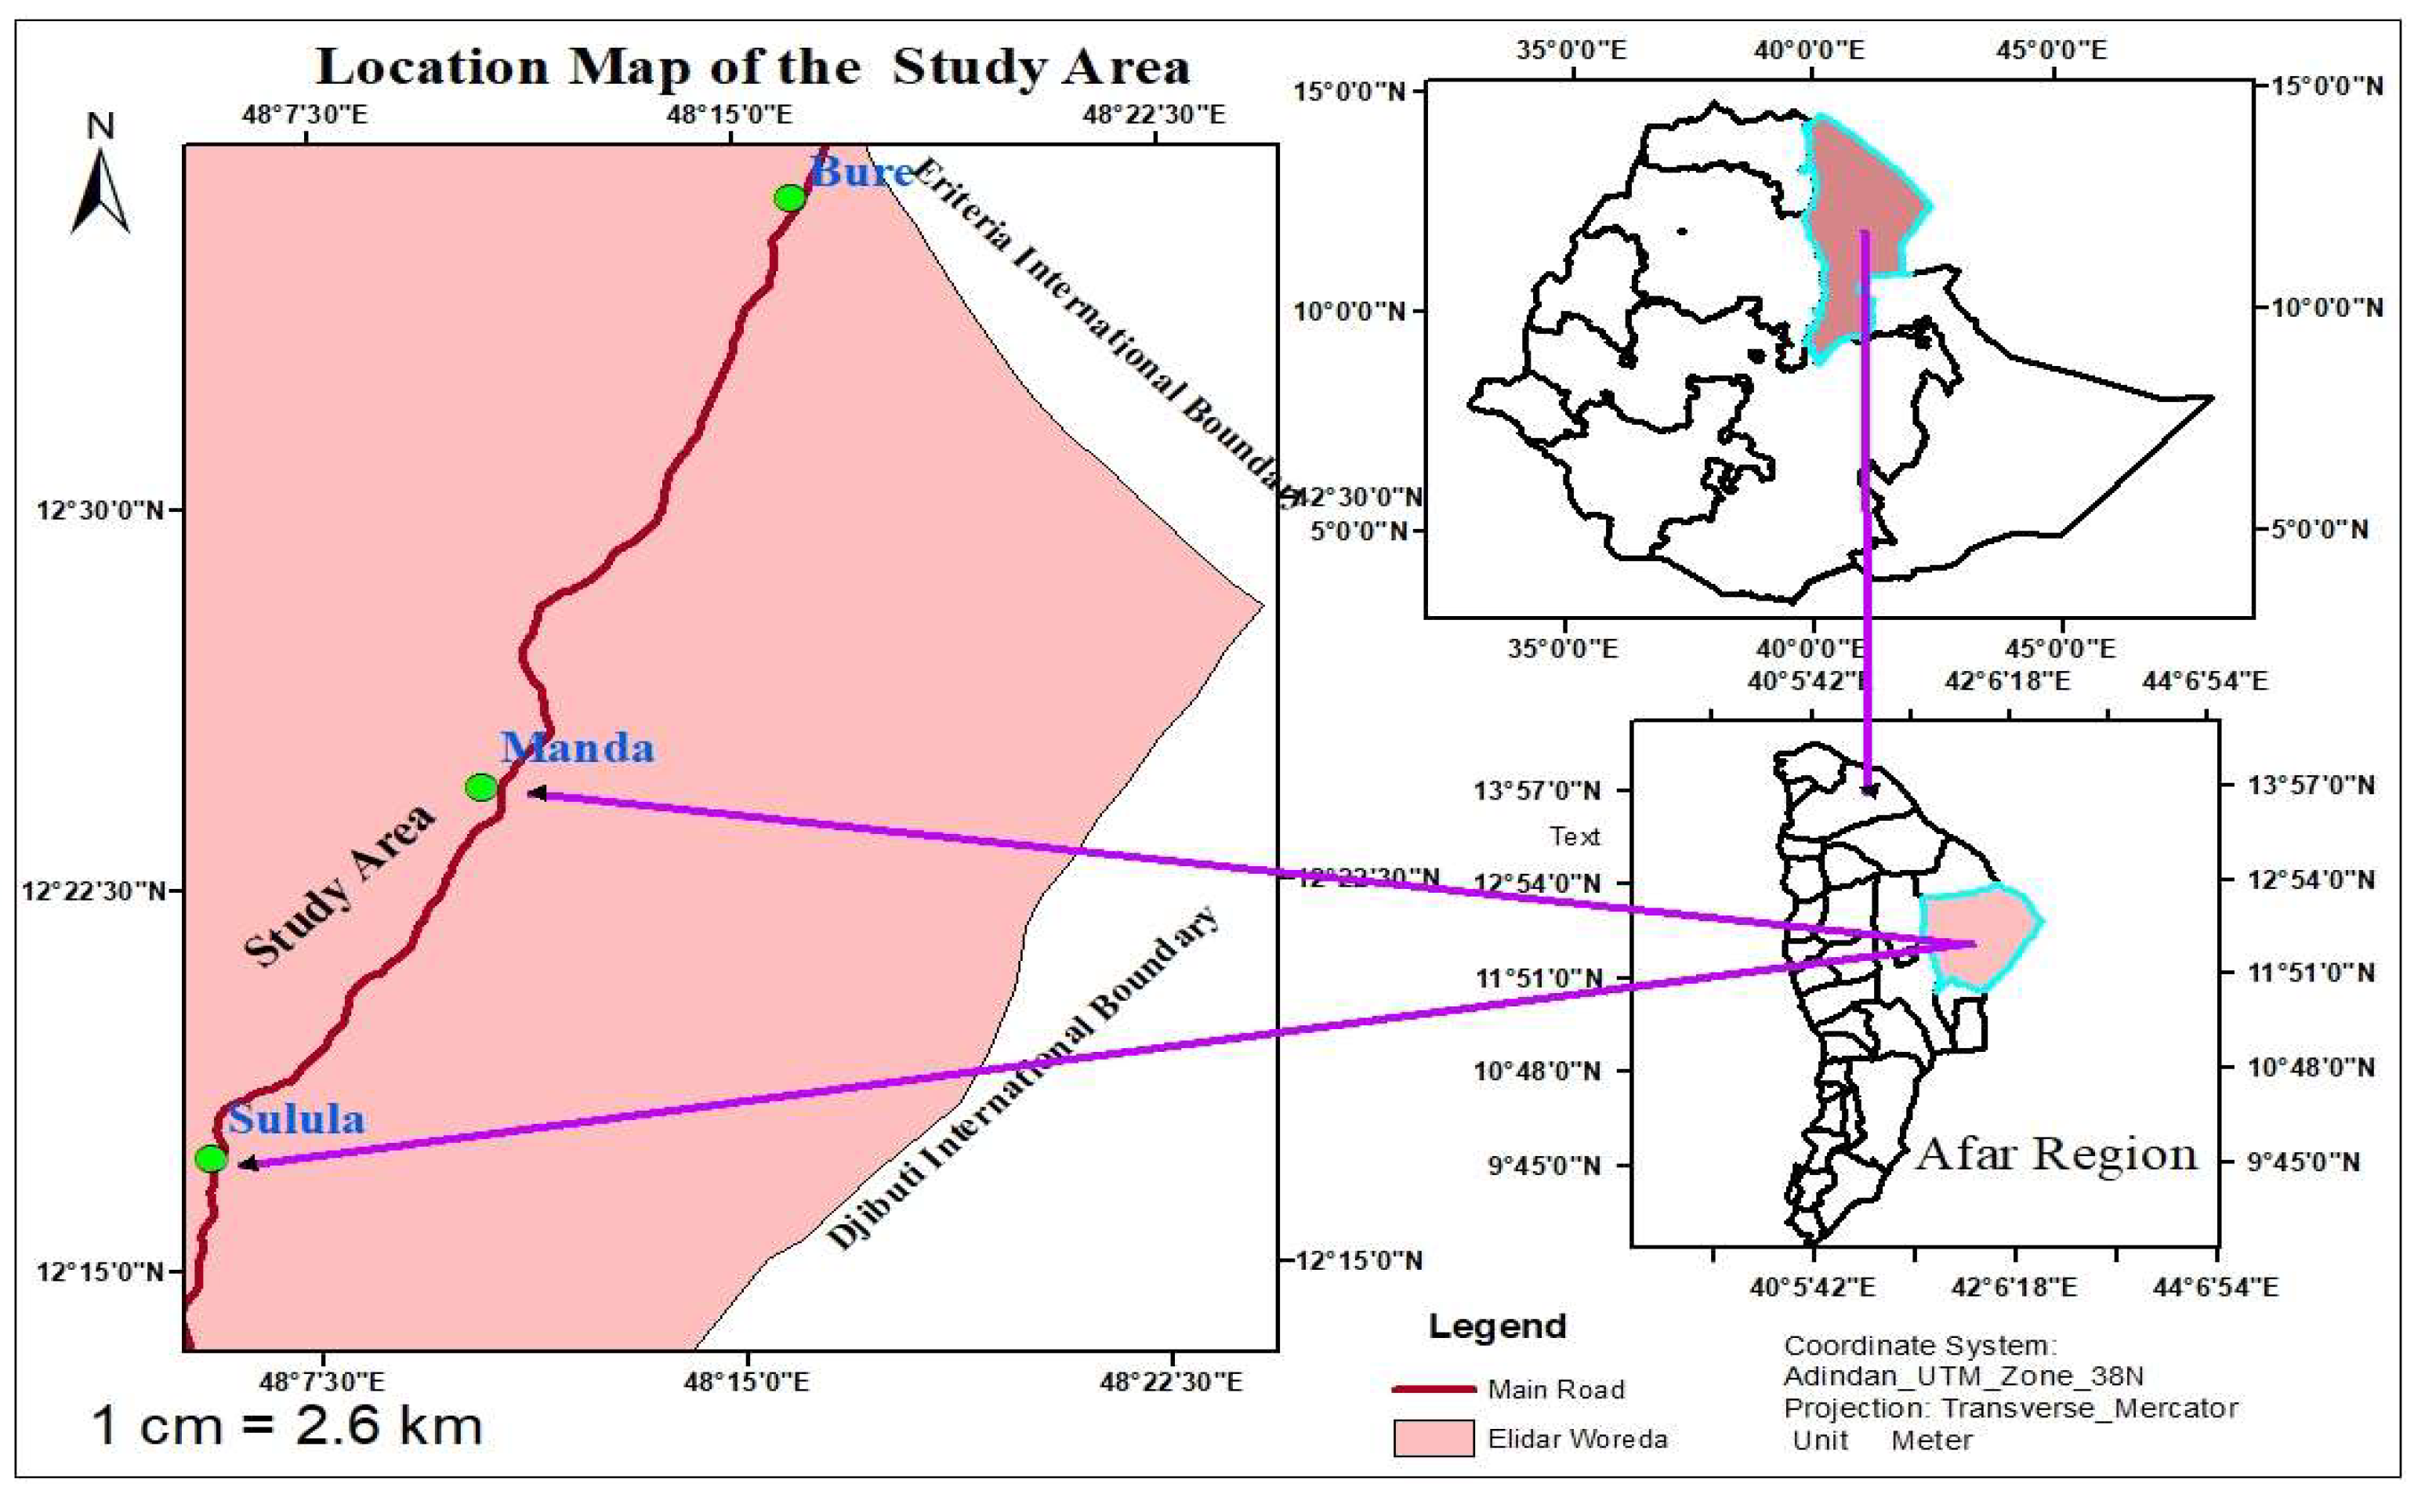
In the Èlidar Woreda of Zone 1 in the Afar Region of the northeastern Ethiopia, the project was executed in the Suula-Manda-Daba Towns. The figure below shows the climate state of the study area; which is an arid area and also the temperature ranges from 28°C to 37°C on average monthly. There is no predicting of precipitation, but the near future forecasts are dry and hot weather. Such most rainy months are July to September hence it takes up to three or four weeks to rain while the other times, especially in April, there will be no rain. The number of people at Suula, Manda, and Daba went up from 5,974 in 2007 to the estimated 8,102 in 2022.
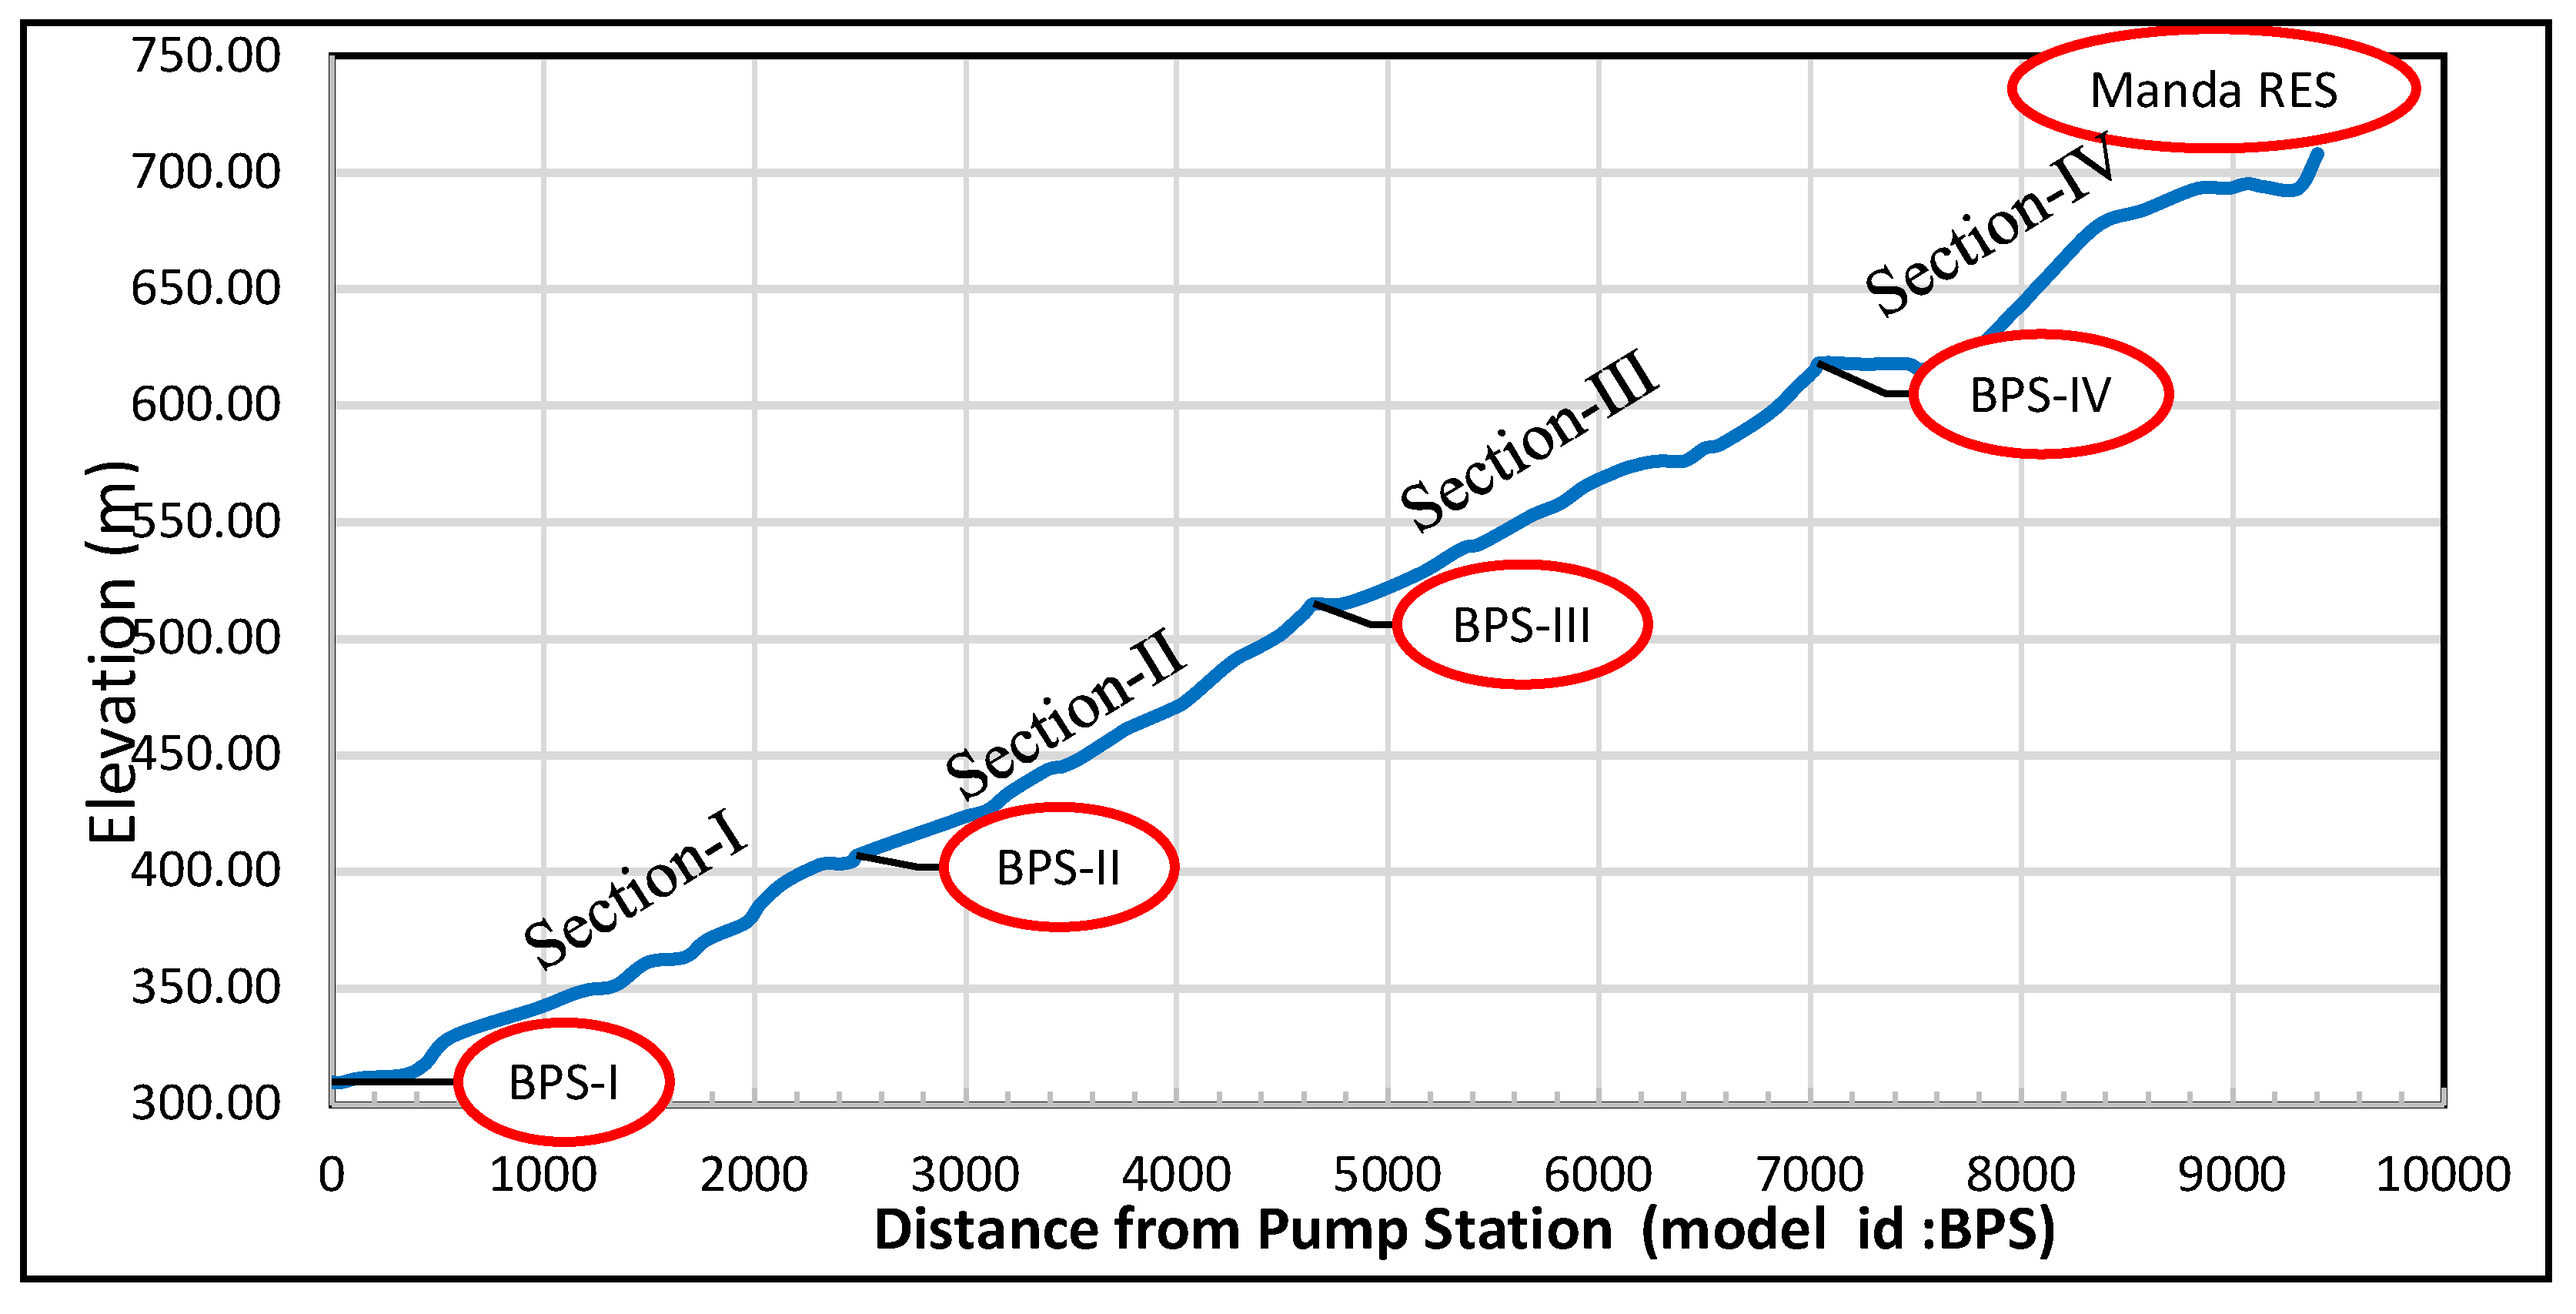
The leading economic enterprise in the district is livestock cultivation, executed by nomads, while Manda Town is a more diversified economy. The water supply system in the research area is made up of different items like underground water sources, the diesel generator to produce energy, the collector pipes, storage reservoirs, air valves, distribution mains, and a nine and a half kilometer long DCI conveyance pipeline. The transmission pipeline is divided into four sections, namely Section-I (BPS-I-BPS-II), Section-II (BPS-II-BPS-III), Section-III (BPS-III-BPS-IV), and Section-IV (BPS-IV-Manda Reservoir), designed in order to maximize the transfer of water efficiency.
Figure 2 demonstrate convincingly how each of these sections performs the transmission of water.
Figure 1.
Location map of the study area.
Figure 1.
Location map of the study area.
Figure 2.
Longitudinal pipeline profile (BPS I-Manda Reservoir).
Figure 2.
Longitudinal pipeline profile (BPS I-Manda Reservoir).
2.2. Data Collection
Primary as well as secondary data sources were used for this study. Direct primary data collection involved collecting and analyzing one-on-one information that related to the performance and weaknesses of the water supply system. Besides, additional information was gleaned from the previous studies, reports and records that have been reviewed and/ or gathered from the water supply system in respect of the secondary data. The main goal of this survey was to capture three-dimensional coordinates of the water pipe. The collected secondary data revealed which of the pipeline parts needed repair and/or maintenance. On the other hand, it was this data that provided us with the required accurate map of the pipeline. A topographic survey of the existing water distribution network was made revealing the location of the existing pipes and checking their distance from the main water supply line.
2.3. Methodology of Data Analysis and Simulation
A In this regard, a systematic methodology shall be used to undertake a detailed analysis of the behavior of the SMD water supply system for transient flow conditions. The analysis shall be executed in two major phases.
Steady-State Analysis: This was an initial calculation in the steady state, done within the Bentley HAMMER V8i software to establish base conditions within a system. It would constitute the determination of flow rates, hydraulic grades, and heads computed for every time step in the results. The results from the steady state were used as a comparison in establishing the need for surge protection devices.
Transient Flow Analysis: Transient Flow Analysis After performing the steady-state analyses, hydraulic transient behavior of the system was modeled. The critical dimensions of this analysis are the wave speed calculations, Hazen-William’s coefficients, and H-Q curves of the pumps. These allow for an accurate representation of hydraulic behavior when sudden flow changes occur.
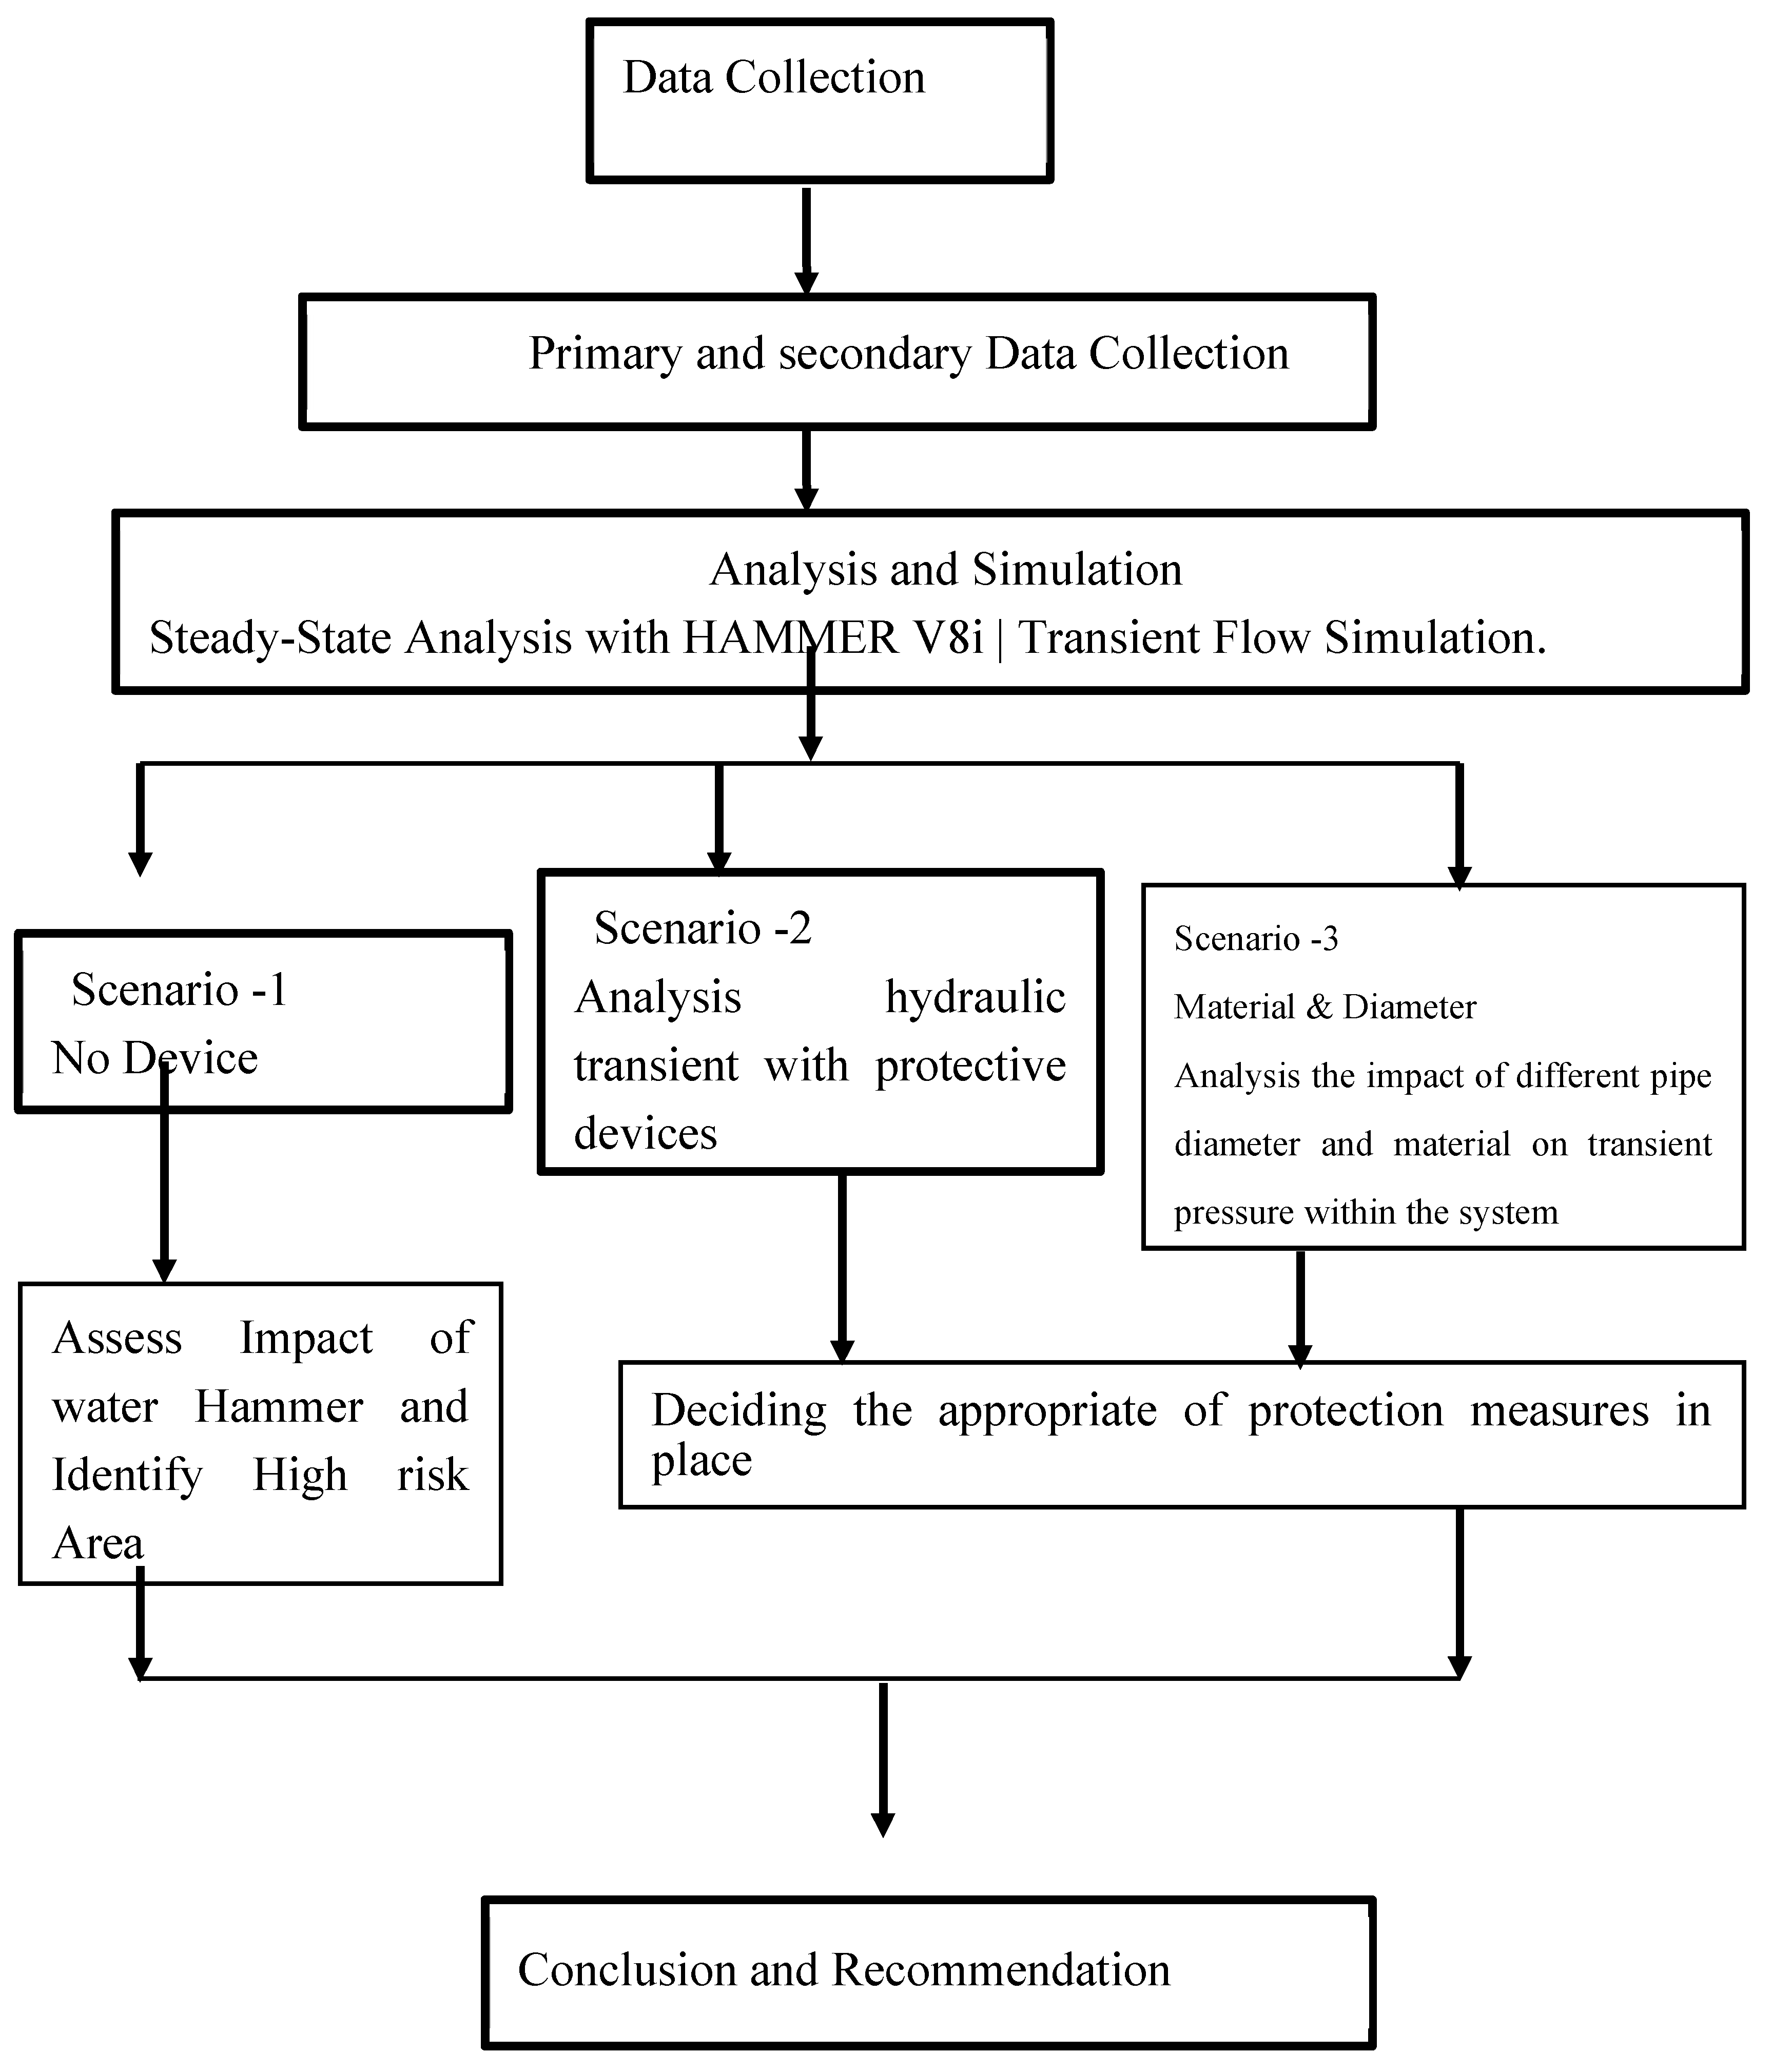
Besides this, the study analyzed three different scenarios to observe the system’s response under different conditions, emphasizing the phenomenon of occurrence of water hammer and its mitigation management. These included analyzing the system without protection devices, analysis of protection measures using hydro-pneumatic tanks, and finally, analysis of the system with varying pipe material and diameter. A color-coded pipeline risk mapping can be used to show all the vulnerabilities of the system based on maximum and minimum pressure values from the derived results of the simulations. This comprehensive methodology aims to detail the assessment for the water hammer effects to effectively mitigate it and improve the system. The overall flow chart of the methodology used in this study is presented in
Figure 3.
3. Results And Discussions
Section gives the results of the analysis under three different scenarios: one without any protection measure, the second one with a hydro-pneumatic tank for protection, and the third with changes in the geometrical design. In carrying out this research, some specific aspects of the study are considered in the analysis: the profiles of the pressure variation during the transient stages, especially along the pipeline due to shut-offs of the pumps.
The results actually return rapid pressure drops that are like waves during the transient events in the unprotected pipeline. This directly implies that, without protection, the pipeline lies wide open to pressure fluctuation/damage. In contrast, the protected pipeline with a hydro-pneumatic tank indicates controlled changes in pressure and velocity; hence it is rated to be effective in handling transient conditions. It also includes the incorporation of a hydro-pneumatic tank that provides stability to the system and thus reduces, to a large extent, the pressure surge problem.
The impact of pipe diameter and material is found by running different simulations. These simulations bring out valuable information on the potential economic implications for the SMD water supply system. Using different pipe diameters and materials, this research avails full understanding of how the hydraulic behavior is and hence helps in bringing about the best design with respect to cost and performance.
It is important to note that the study results have not been validated by field measurements since such field measurement equipment happened to be out of order. Thus, field measurement results could not be collated to give indication of the study in behavior of a pipeline under transient effects. Though modeling provided some useful insights, validating and verifying the accuracy of the results would have required field measurements.
Bottom of Form
3.1. Scenario 1: Transient Analysis Without Protection
3.1.1. Steady State Analysis
A base run of the network without transient events was calculated to relatively assess the performance of the system under steady-state conditions. This run included only the pumps alongside the pipeline; no transient protection was included. This hydraulic modeling was done to see if the pumping and piping system can provide the required heads at the delivery points.
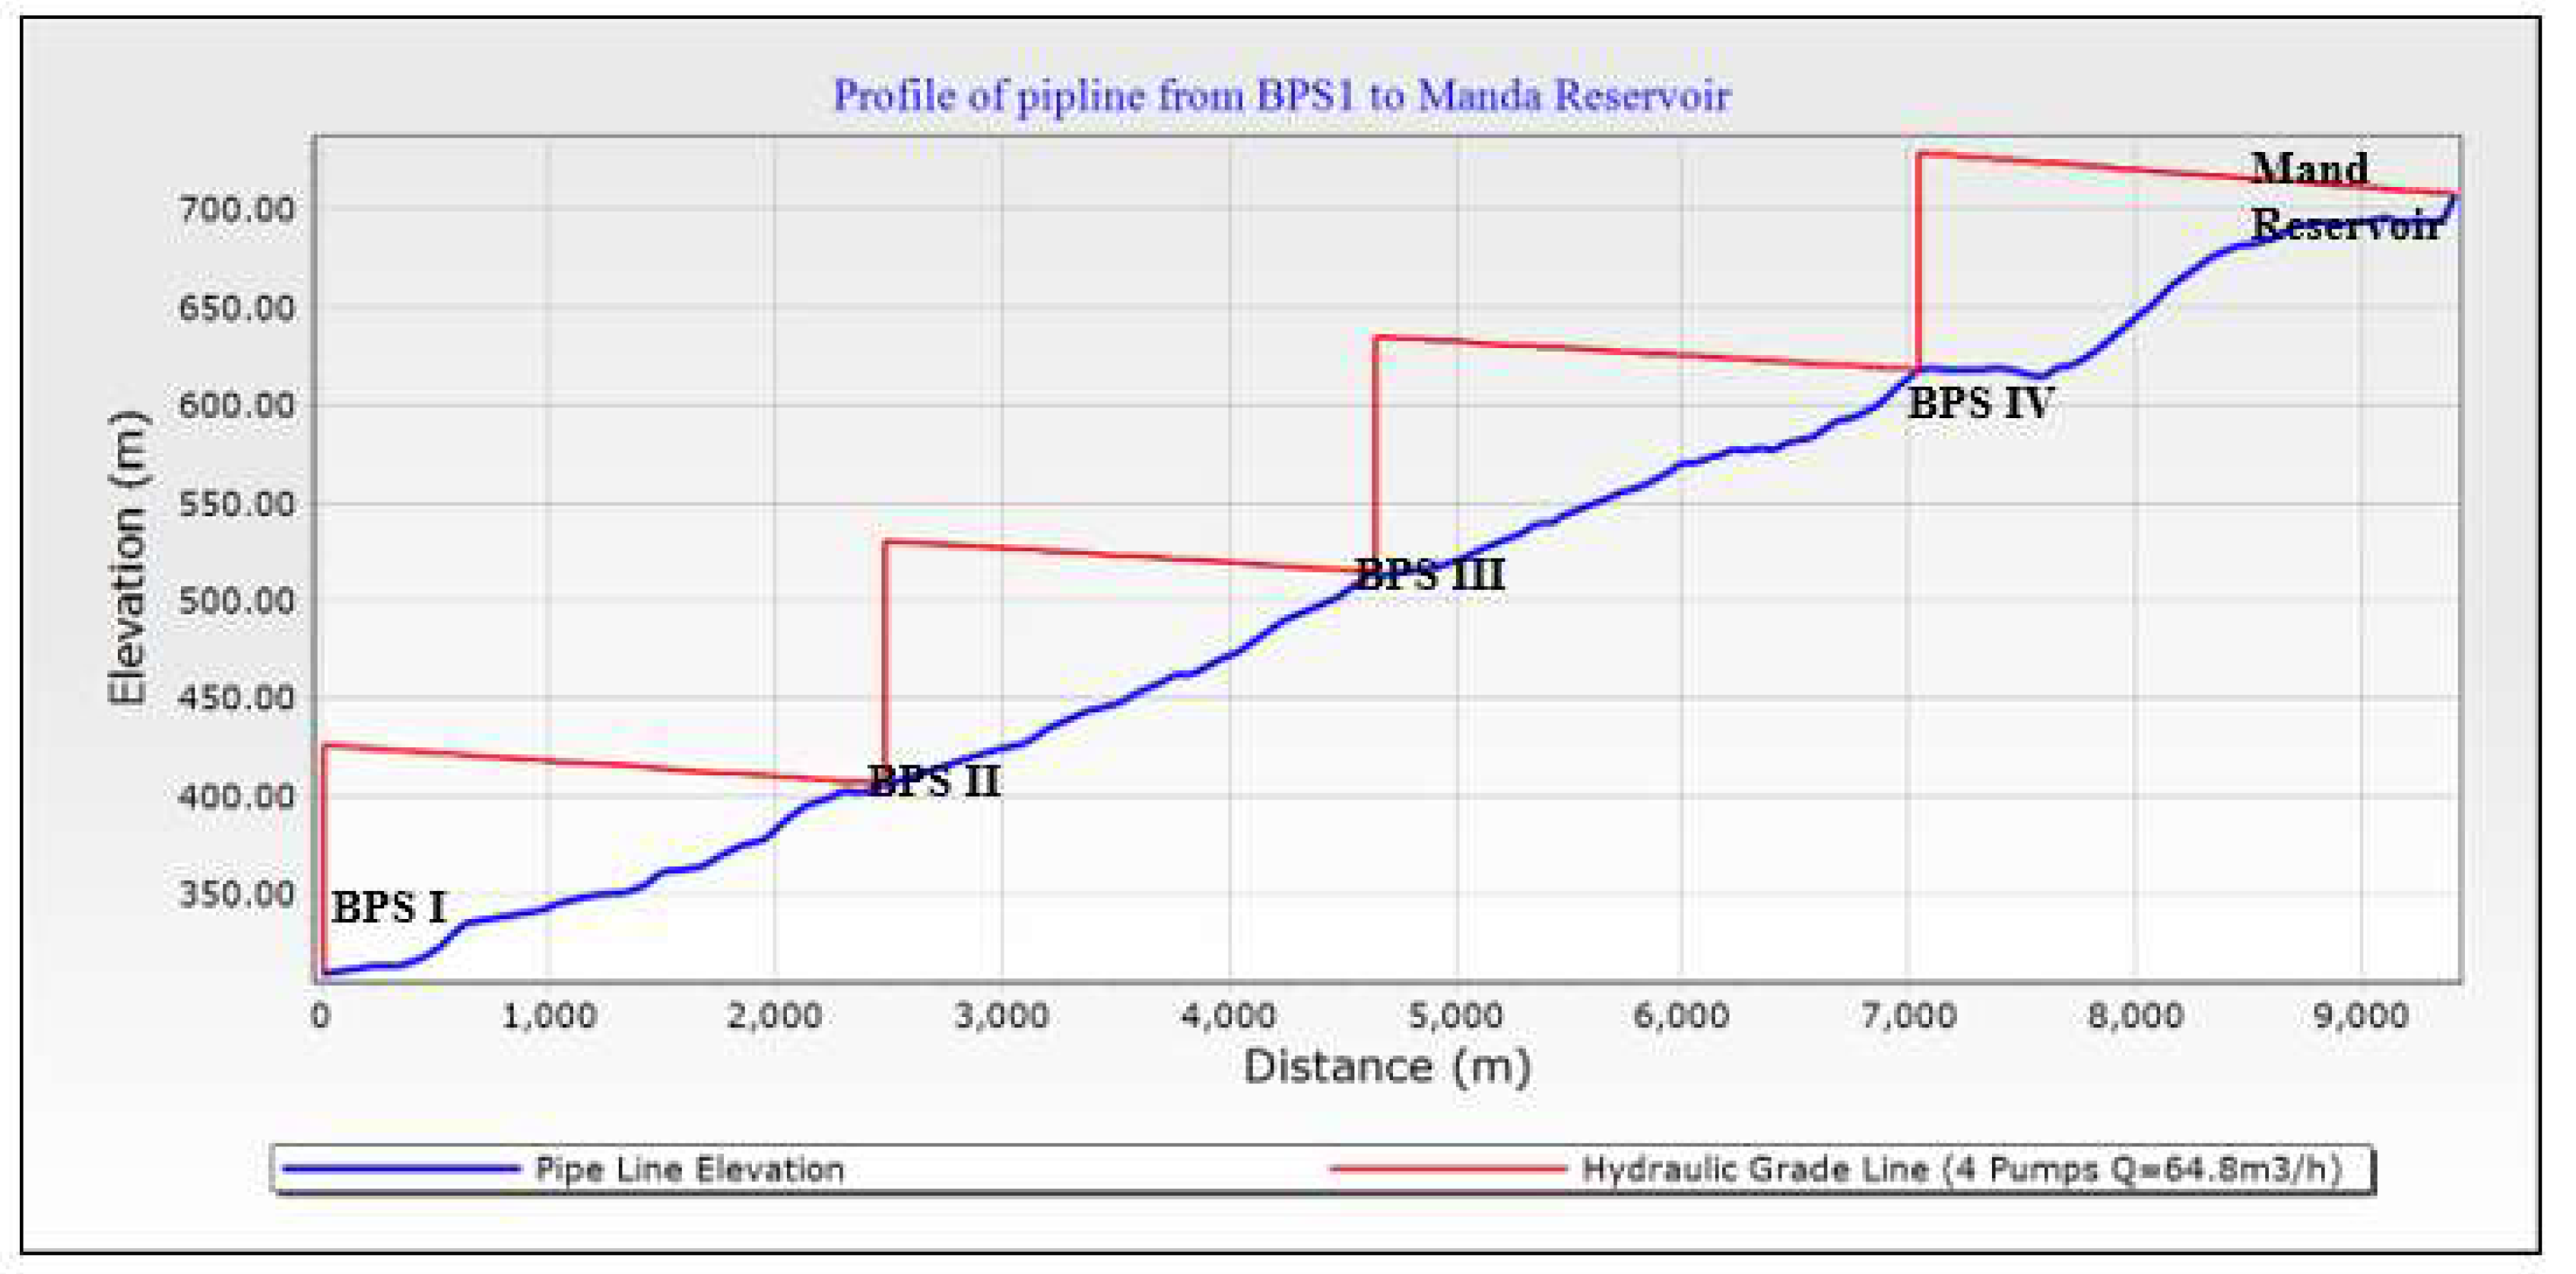
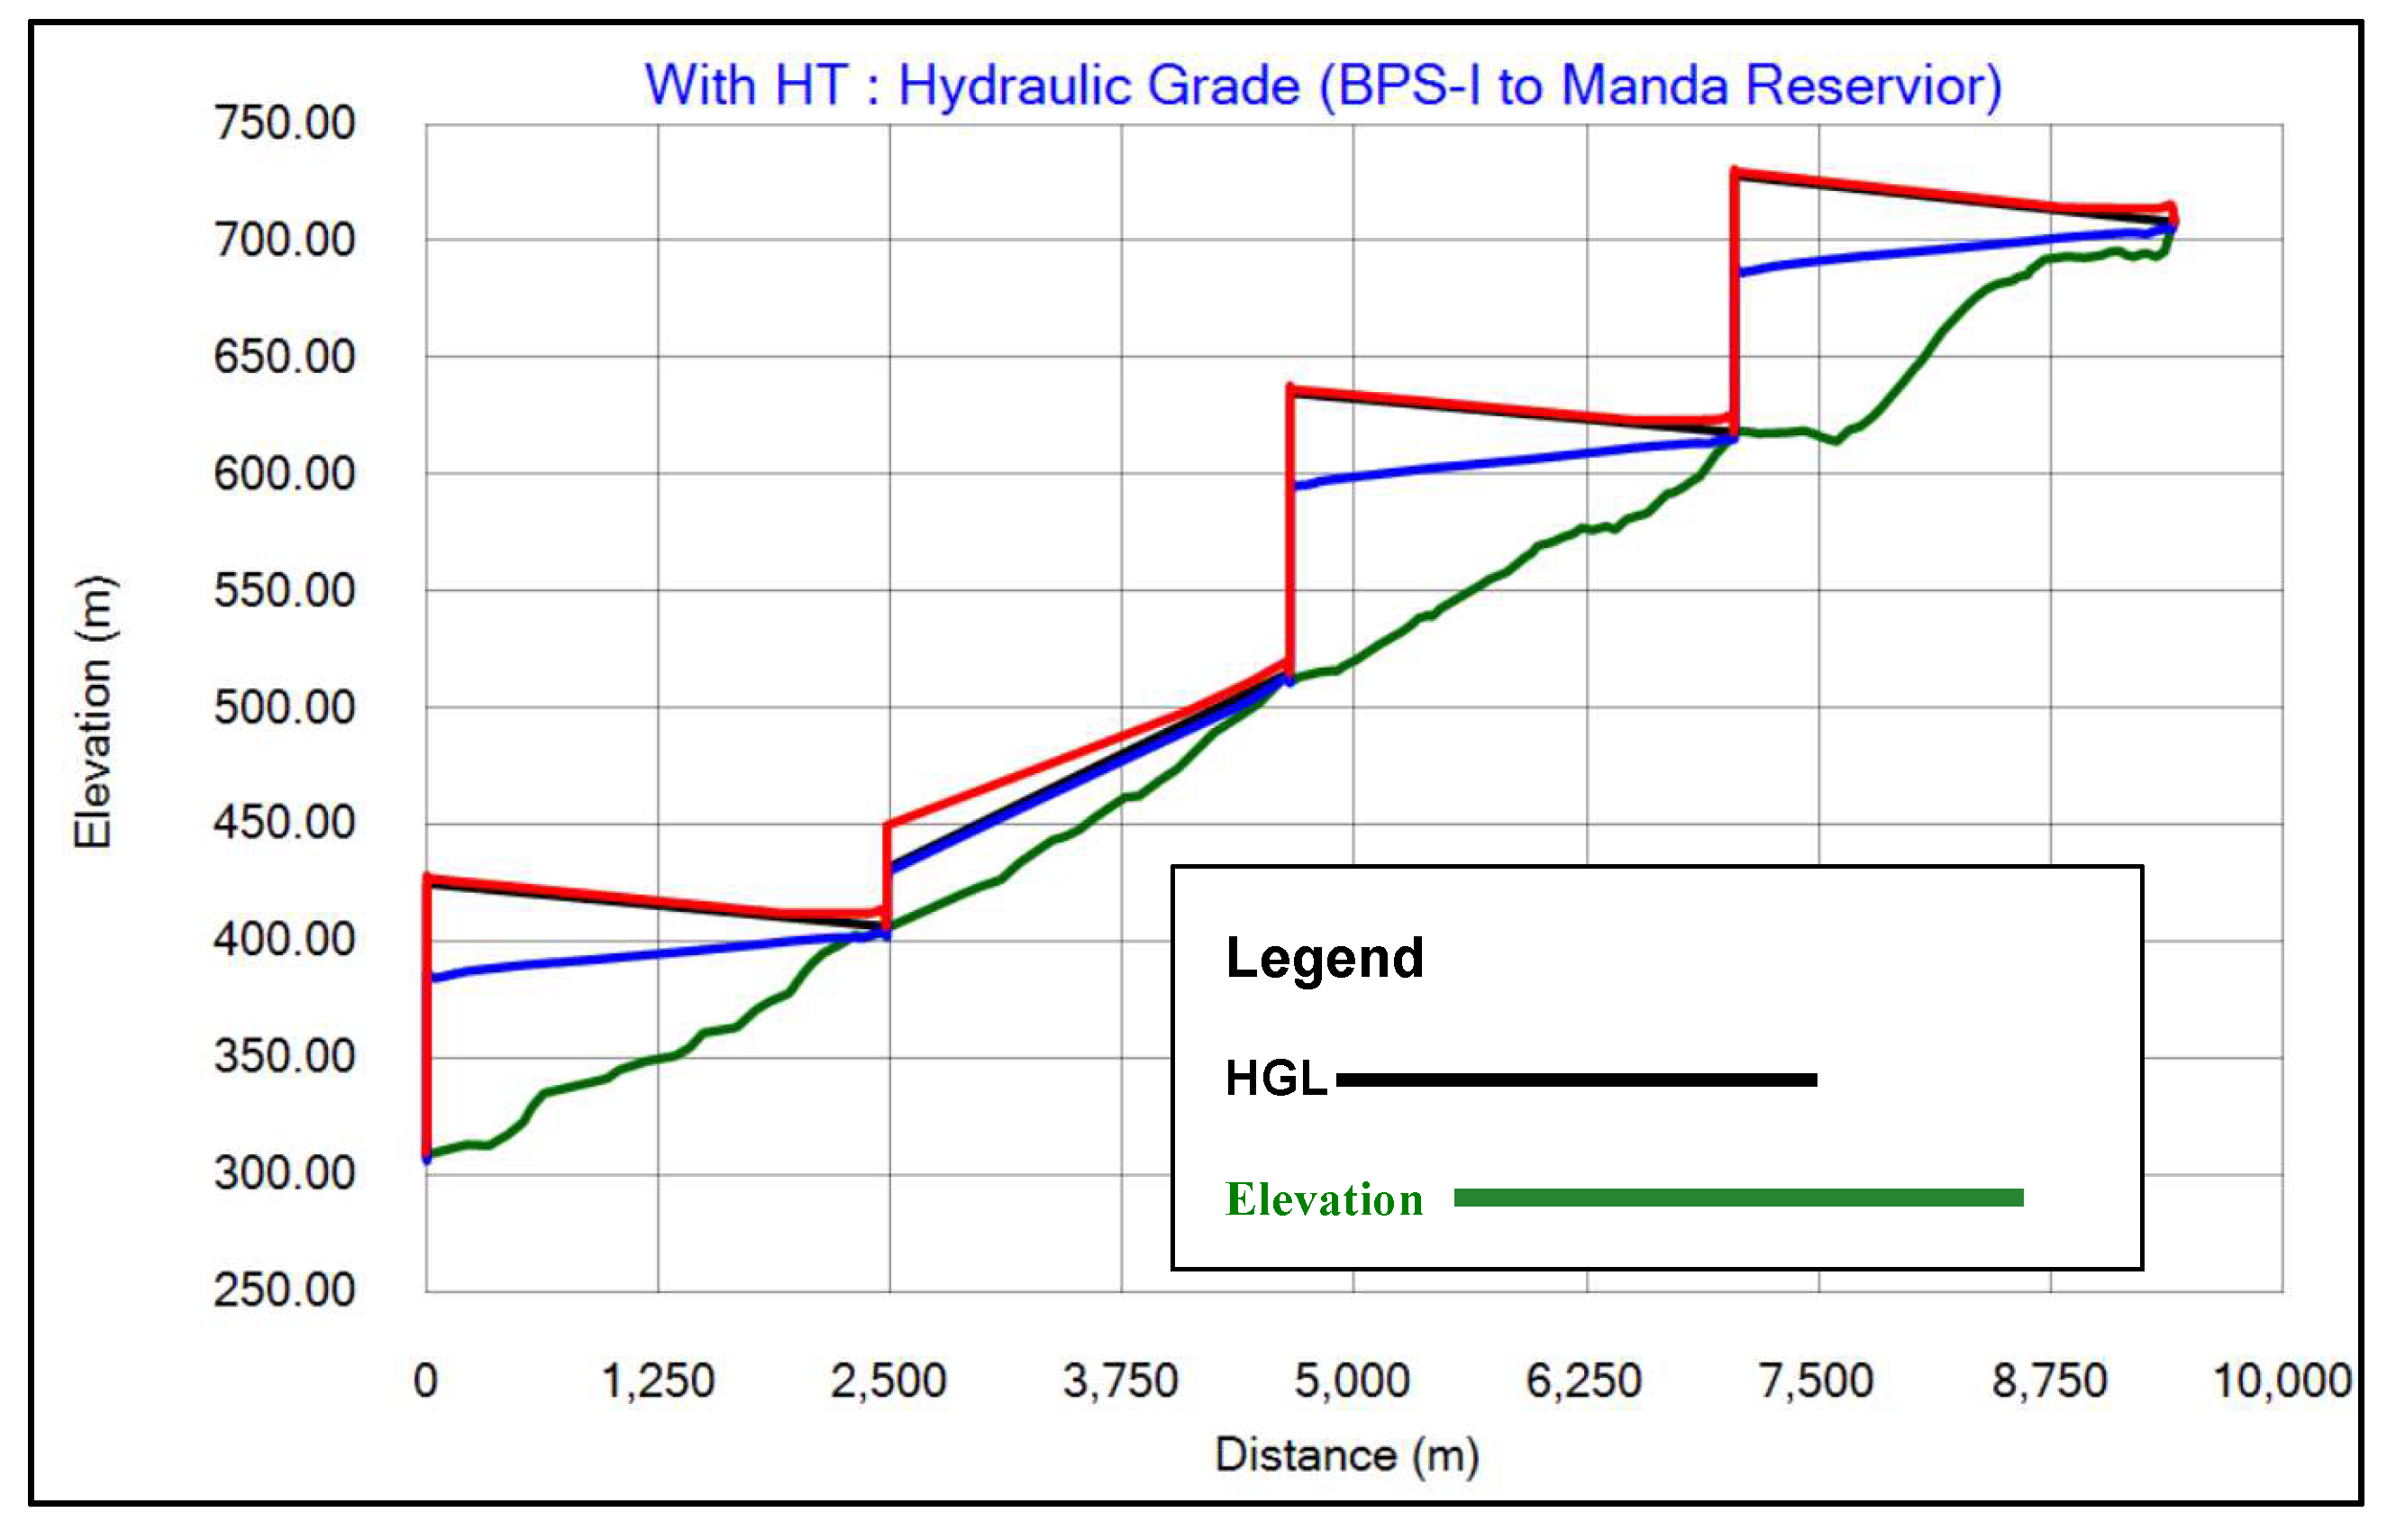
Figure 4 graphically illustrates the hydraulic grade line with respect to pipeline elevations along the entire length of the pipeline under steady-state conditions. With the HGL represented by a red line and pipeline elevation represented by a blue line, as can be seen, under steady-state conditions, there was no separation; this clearly shows that the system is hydraulic efficient and can be used for the delivery of the required head at the endpoint.
This transient analysis is very important not to be swept under the carpet as most system analyses and designs are by steady states. Computing transient pressures is considered in pipeline designs to ensure that the pipeline will survive extreme pressure variations (El-turki et al., 2013).
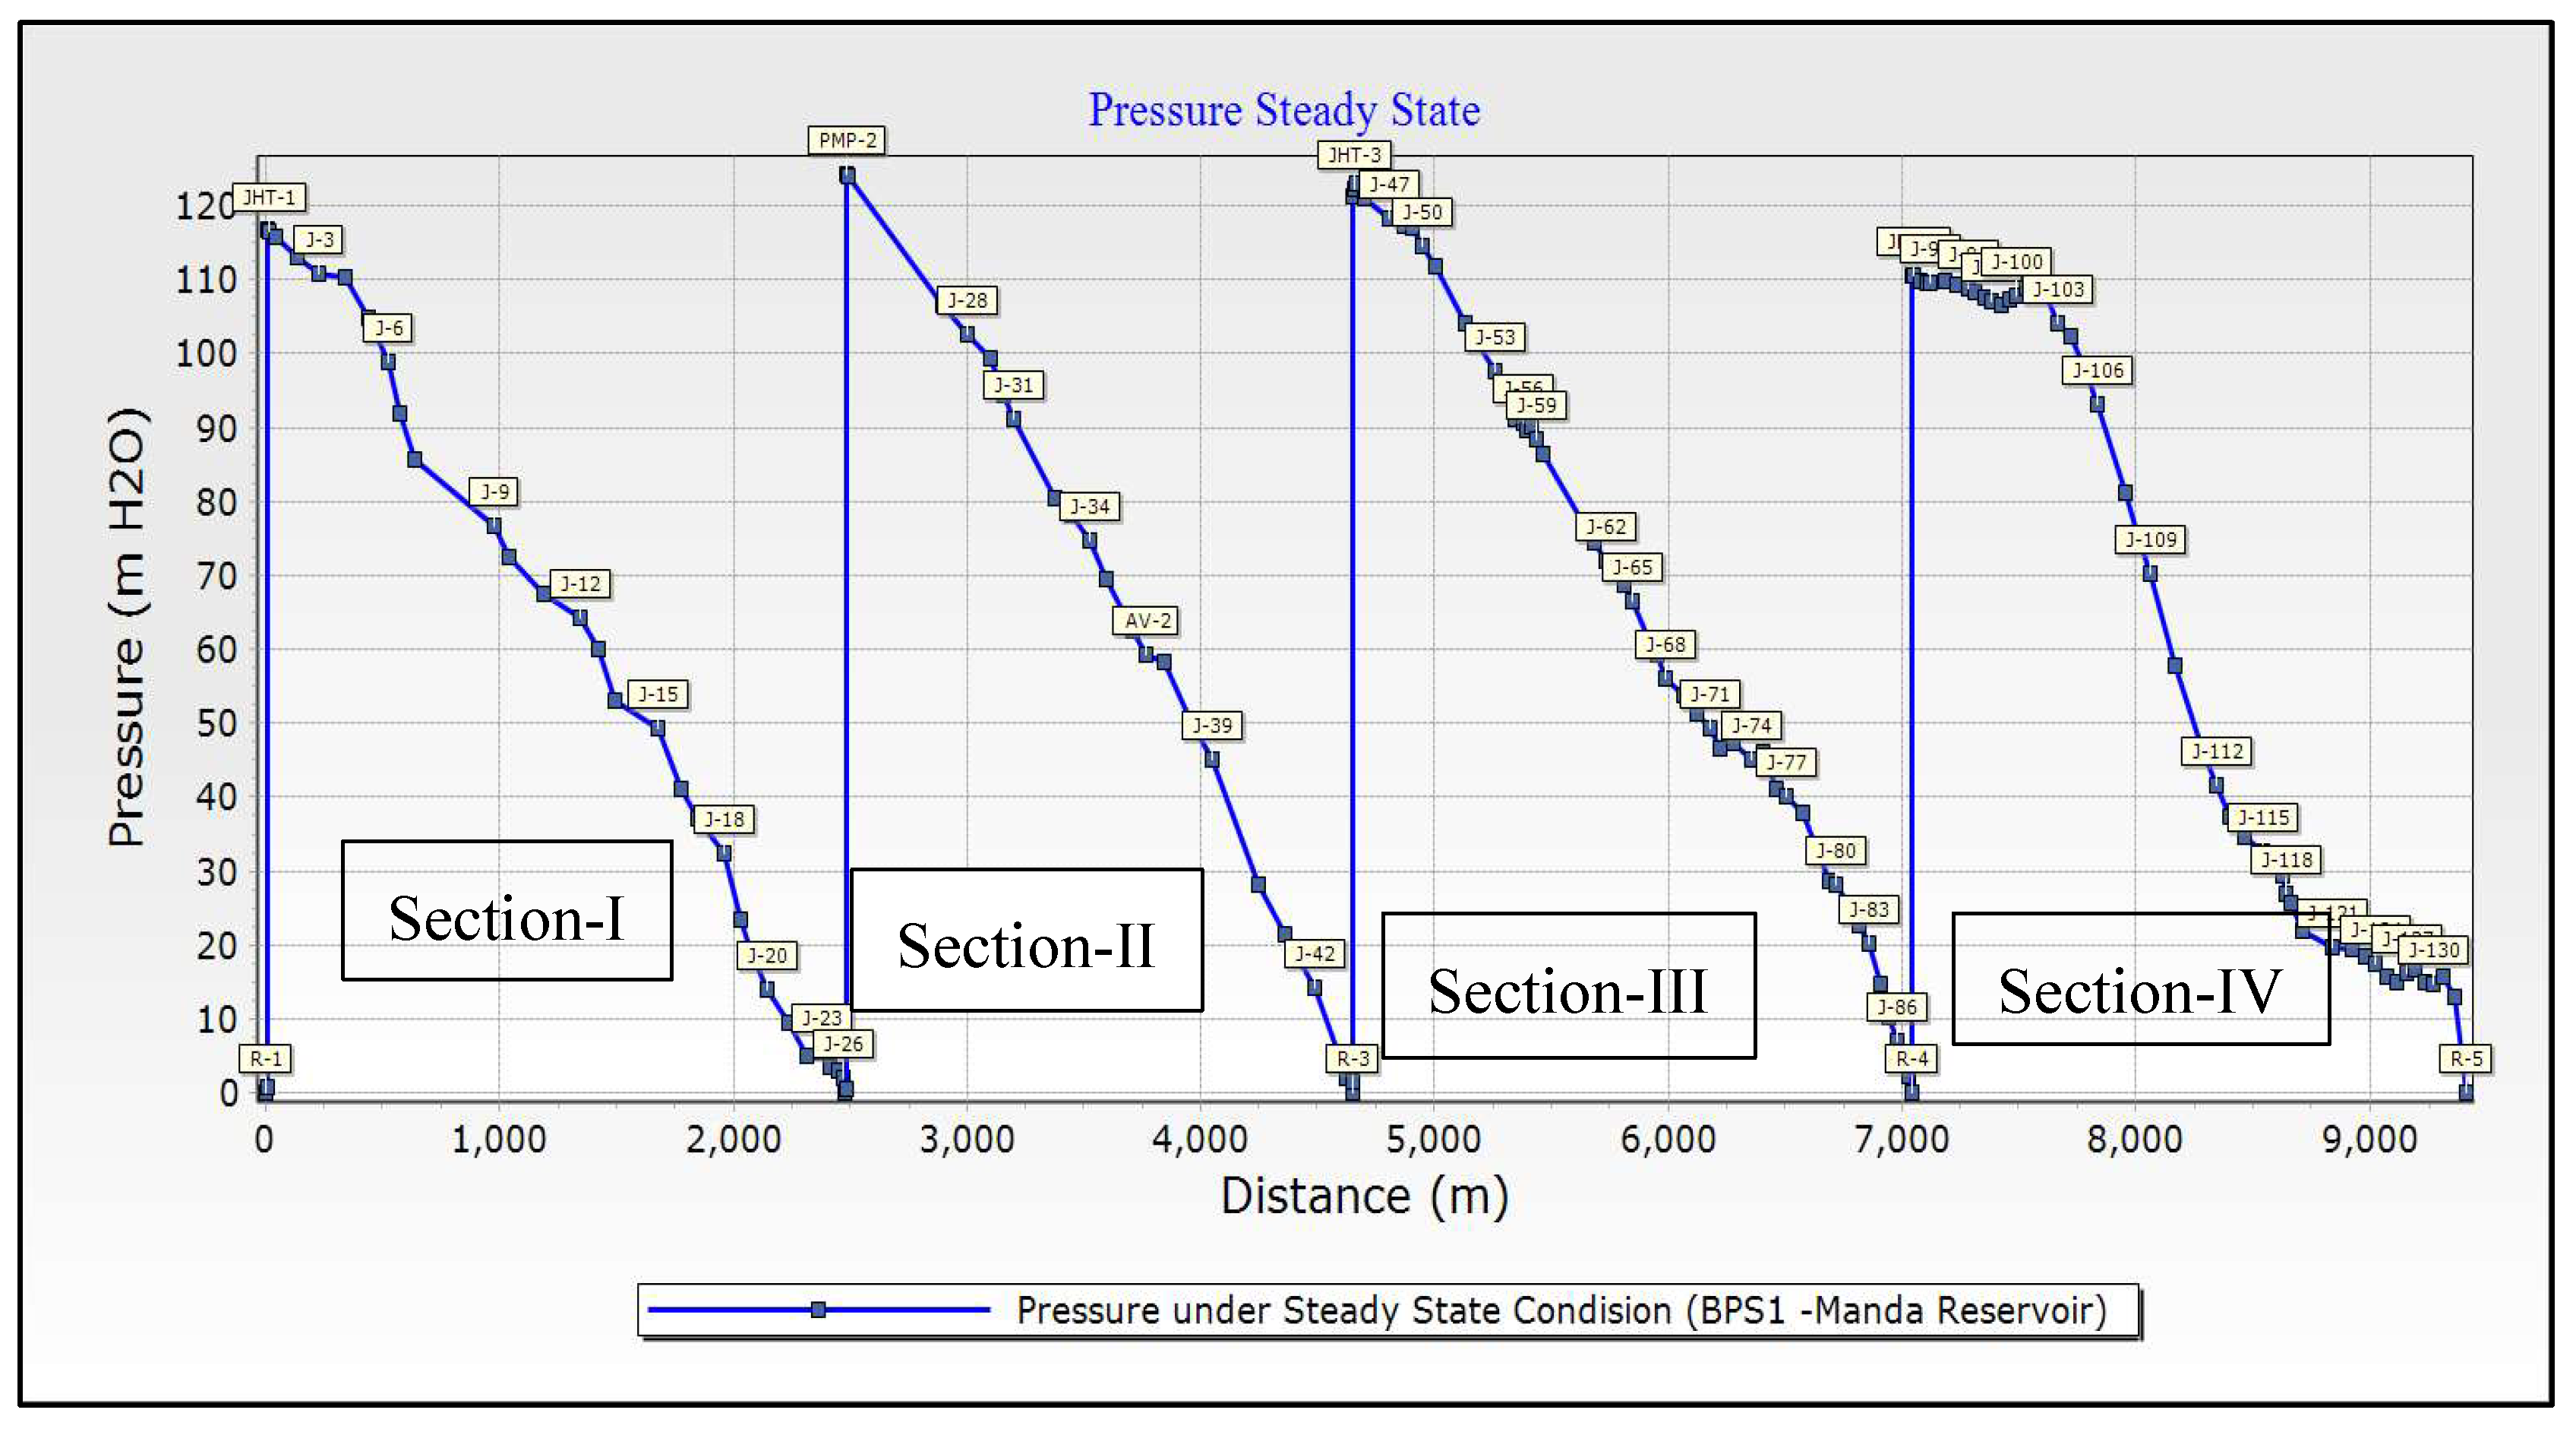
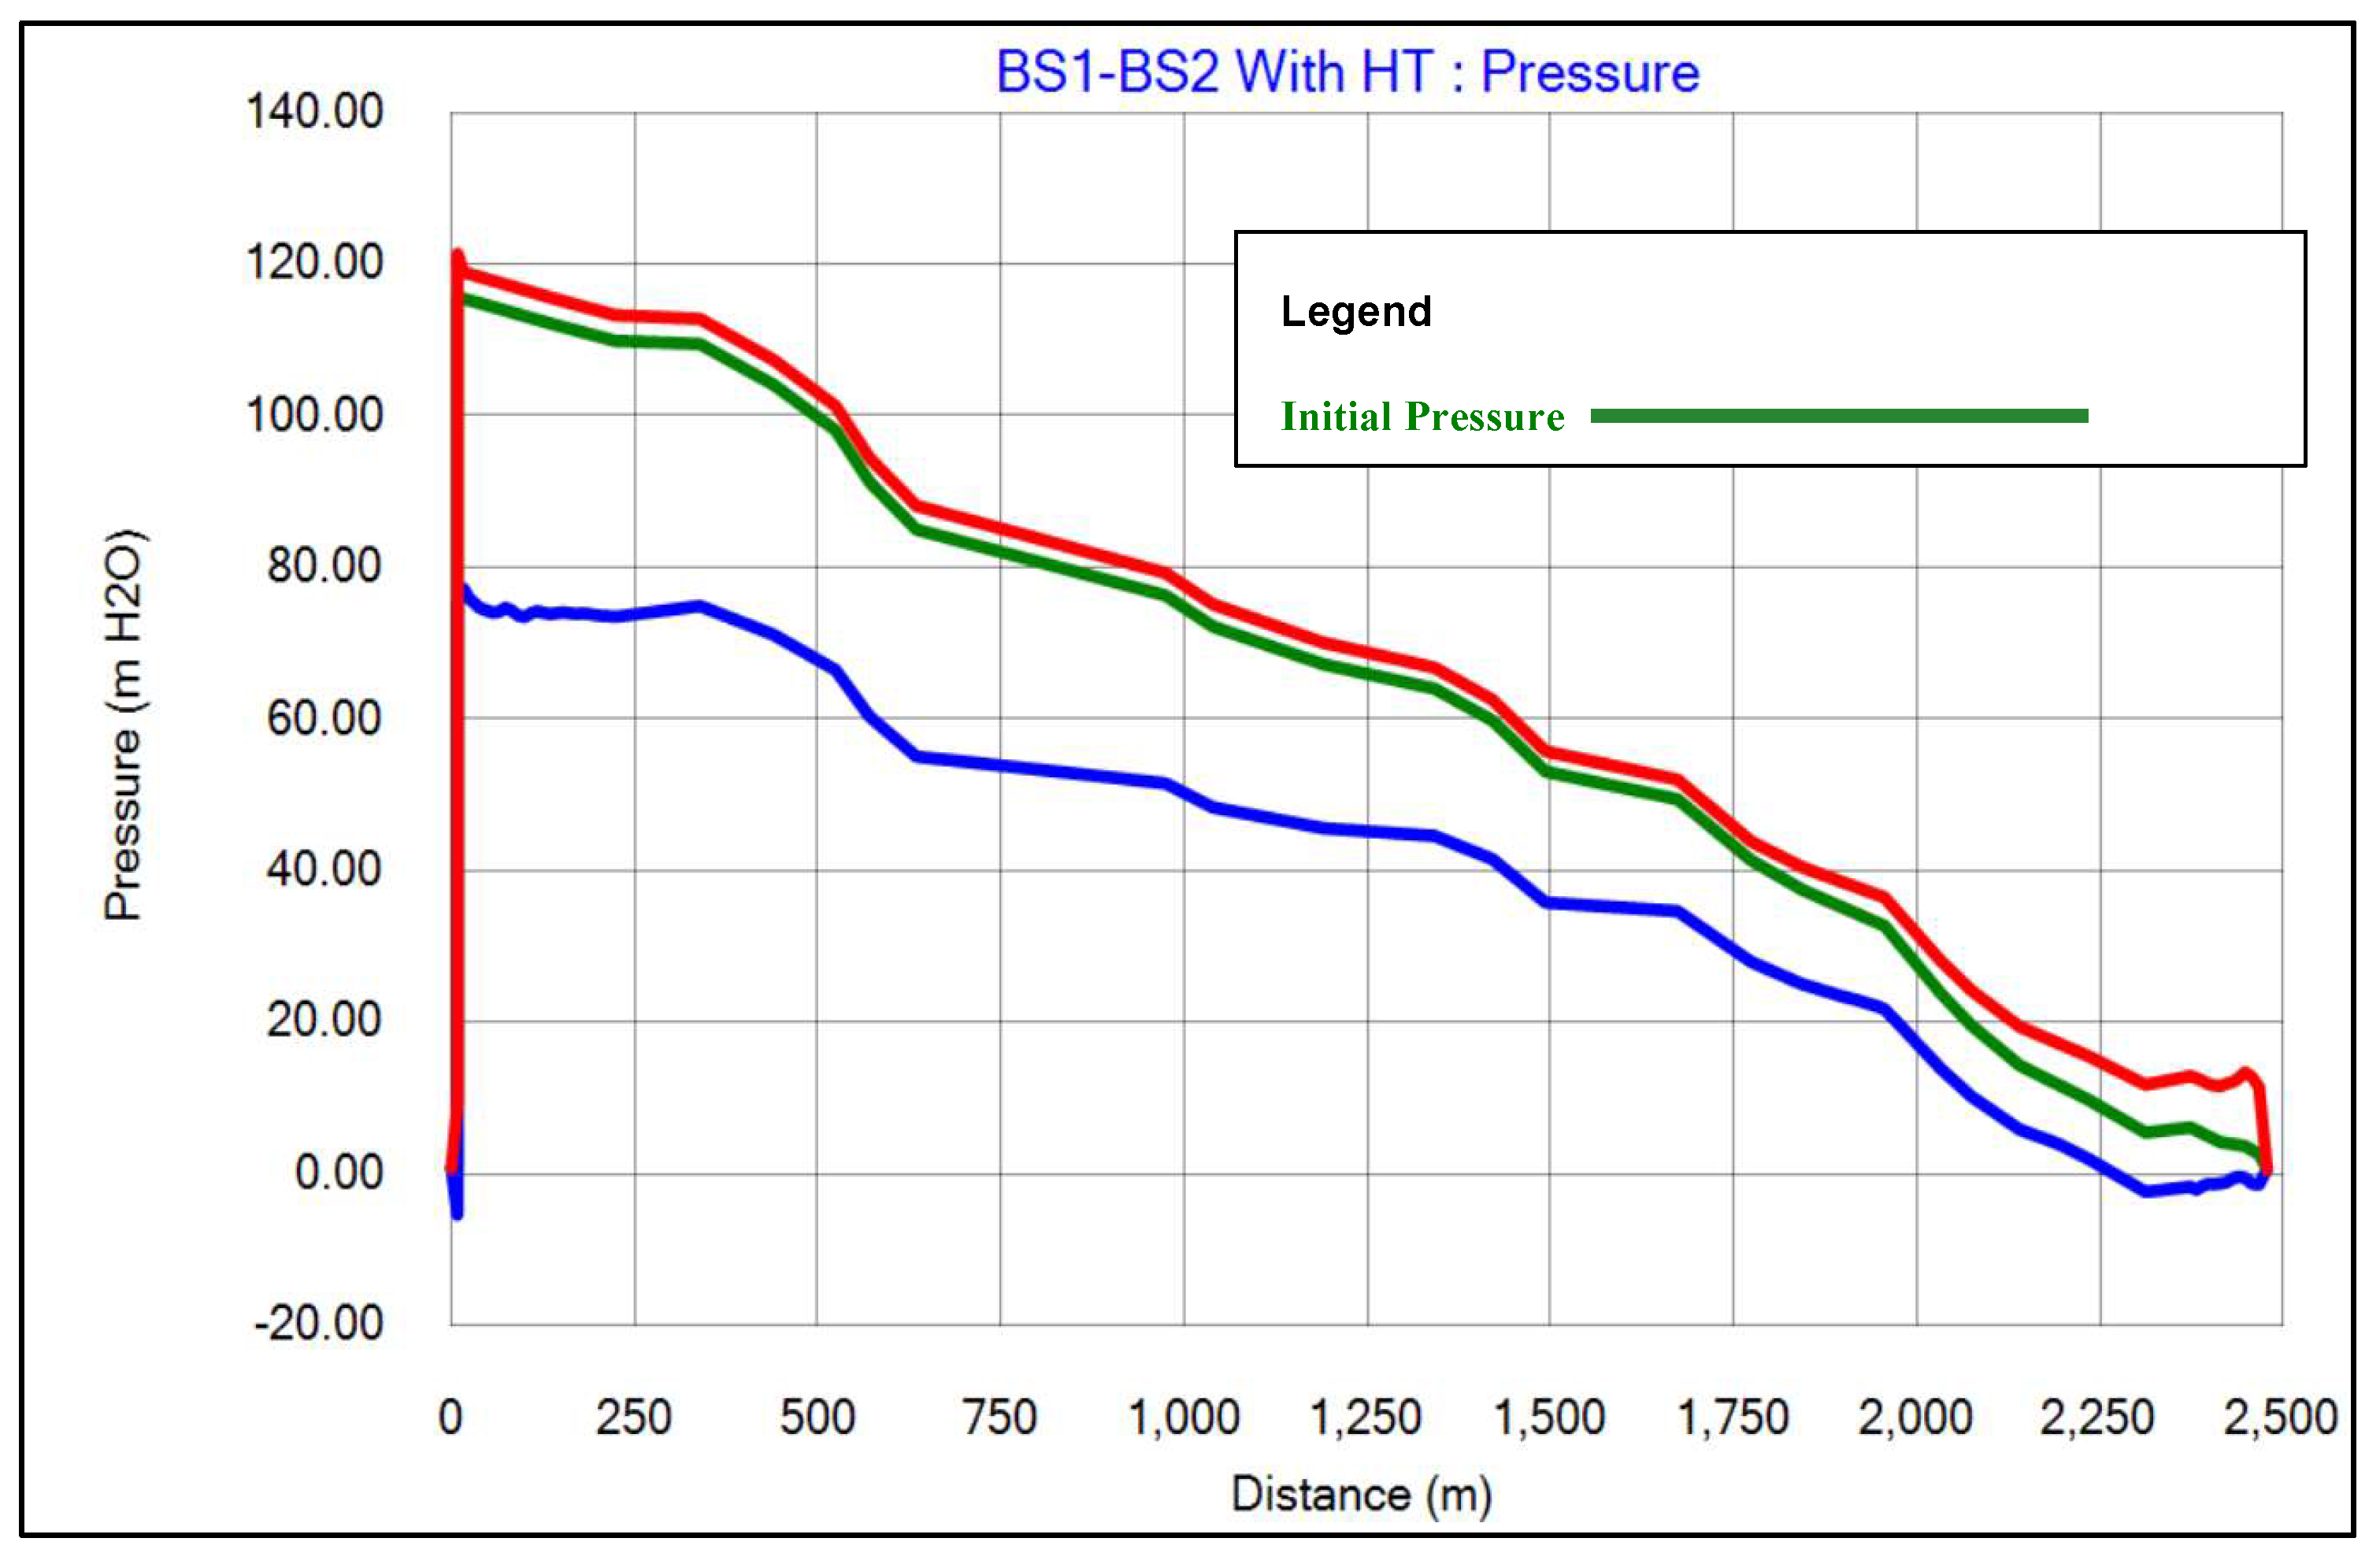
Figure 5 provides a detailed pressure profile along the entire pipeline under steady-state conditions for sections I-IV. This exercise identifies points of concern. The maximum pressure would be just under 125 mH₂O near the ends of the pumps, while it gradually drops to 4 m at successor collection chambers in steady-state operation. However, transient analysis is necessary to understand what happens in the pipeline as dynamic events occur when pumps are turned on or when valves close during changing operational conditions.
3.1.2. Transient Analysis without Surge Protection Device
Transient analysis for an emergency power failure was run on a 9,486-meter pipeline section to investigate the transient behavior of air vapor volume, maximum and minimum pressure, and hydraulic gradient. The idea was to get insight, without any surge protection in place, into the transient behavior of the system and the need to mitigate it against the water hammer. The results from the simulated study are presented in plots, showing how the pipeline would behave under critical conditions.
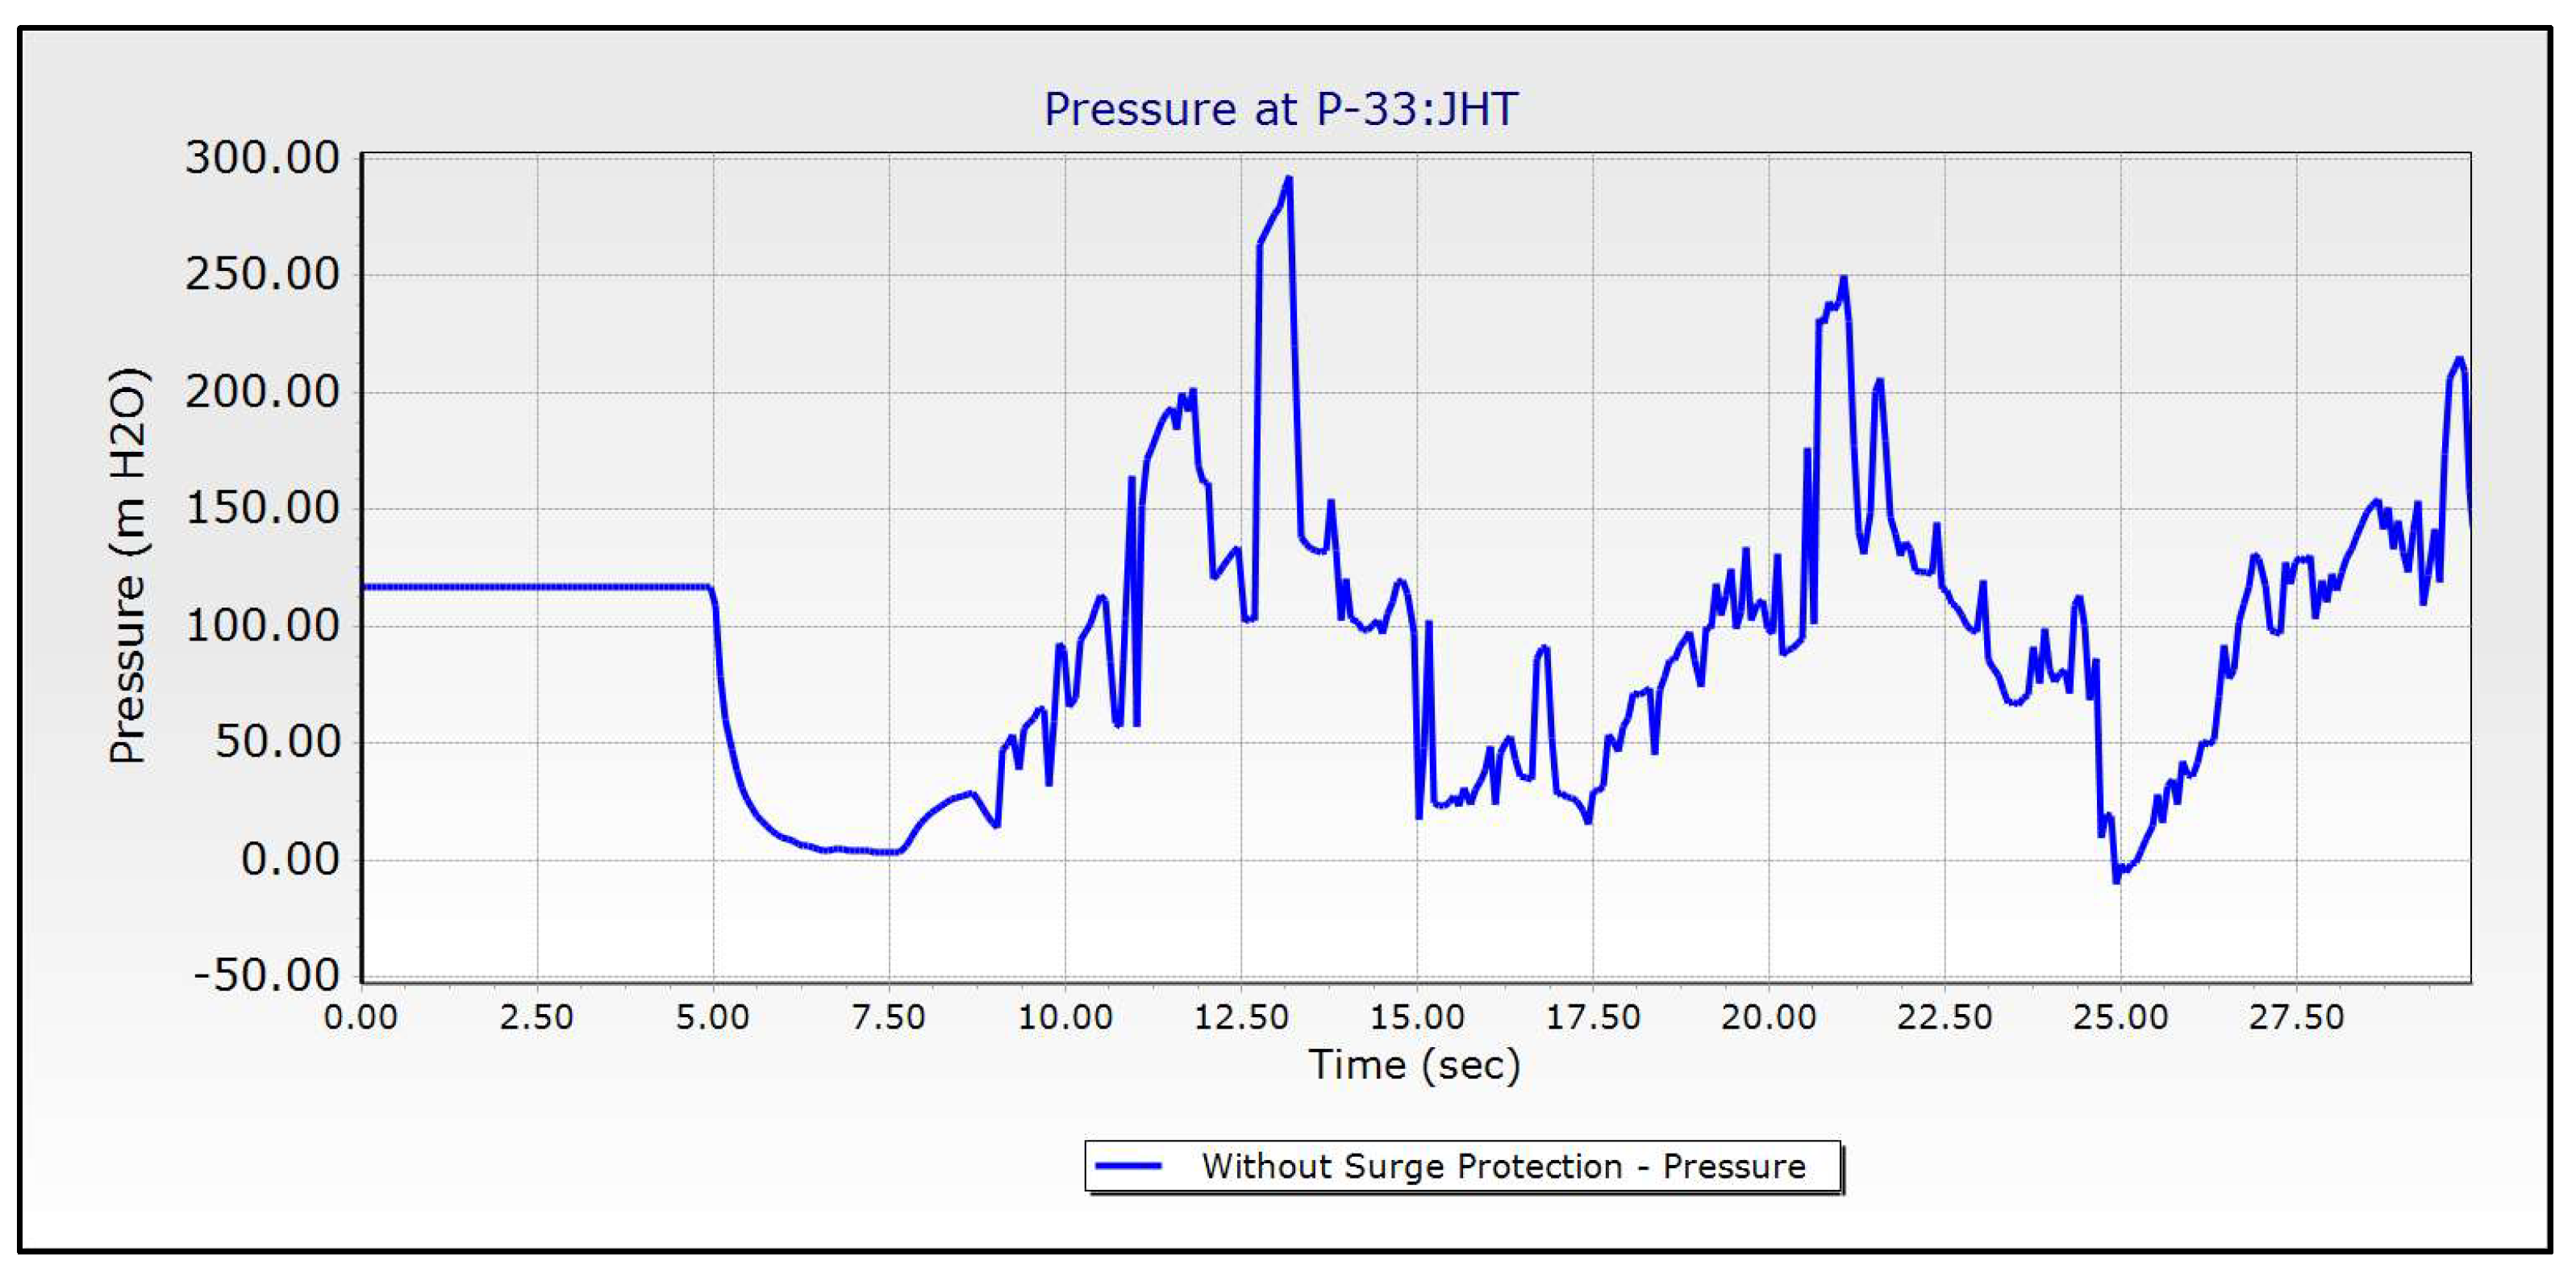
Figure 6 shows the variations in the pressure of the unprotected pipeline due to power failure. Peak pressure is 292.85 mH₂O, very large, and arrives at 13.2 seconds. As can be further seen, there is a dropout of the surge to -10.02 mH₂O at 24.922 seconds, thus showing a vacuum or cavitation. It is further noticed that the successive oscillations of the pressure do die down progressively, indicative of the stabilization of the system after the initial power failure and surge transient. The occurrence of negative pressure thus points to the complexity of transient effects, which would require further investigation into pipeline integrity and system performance.
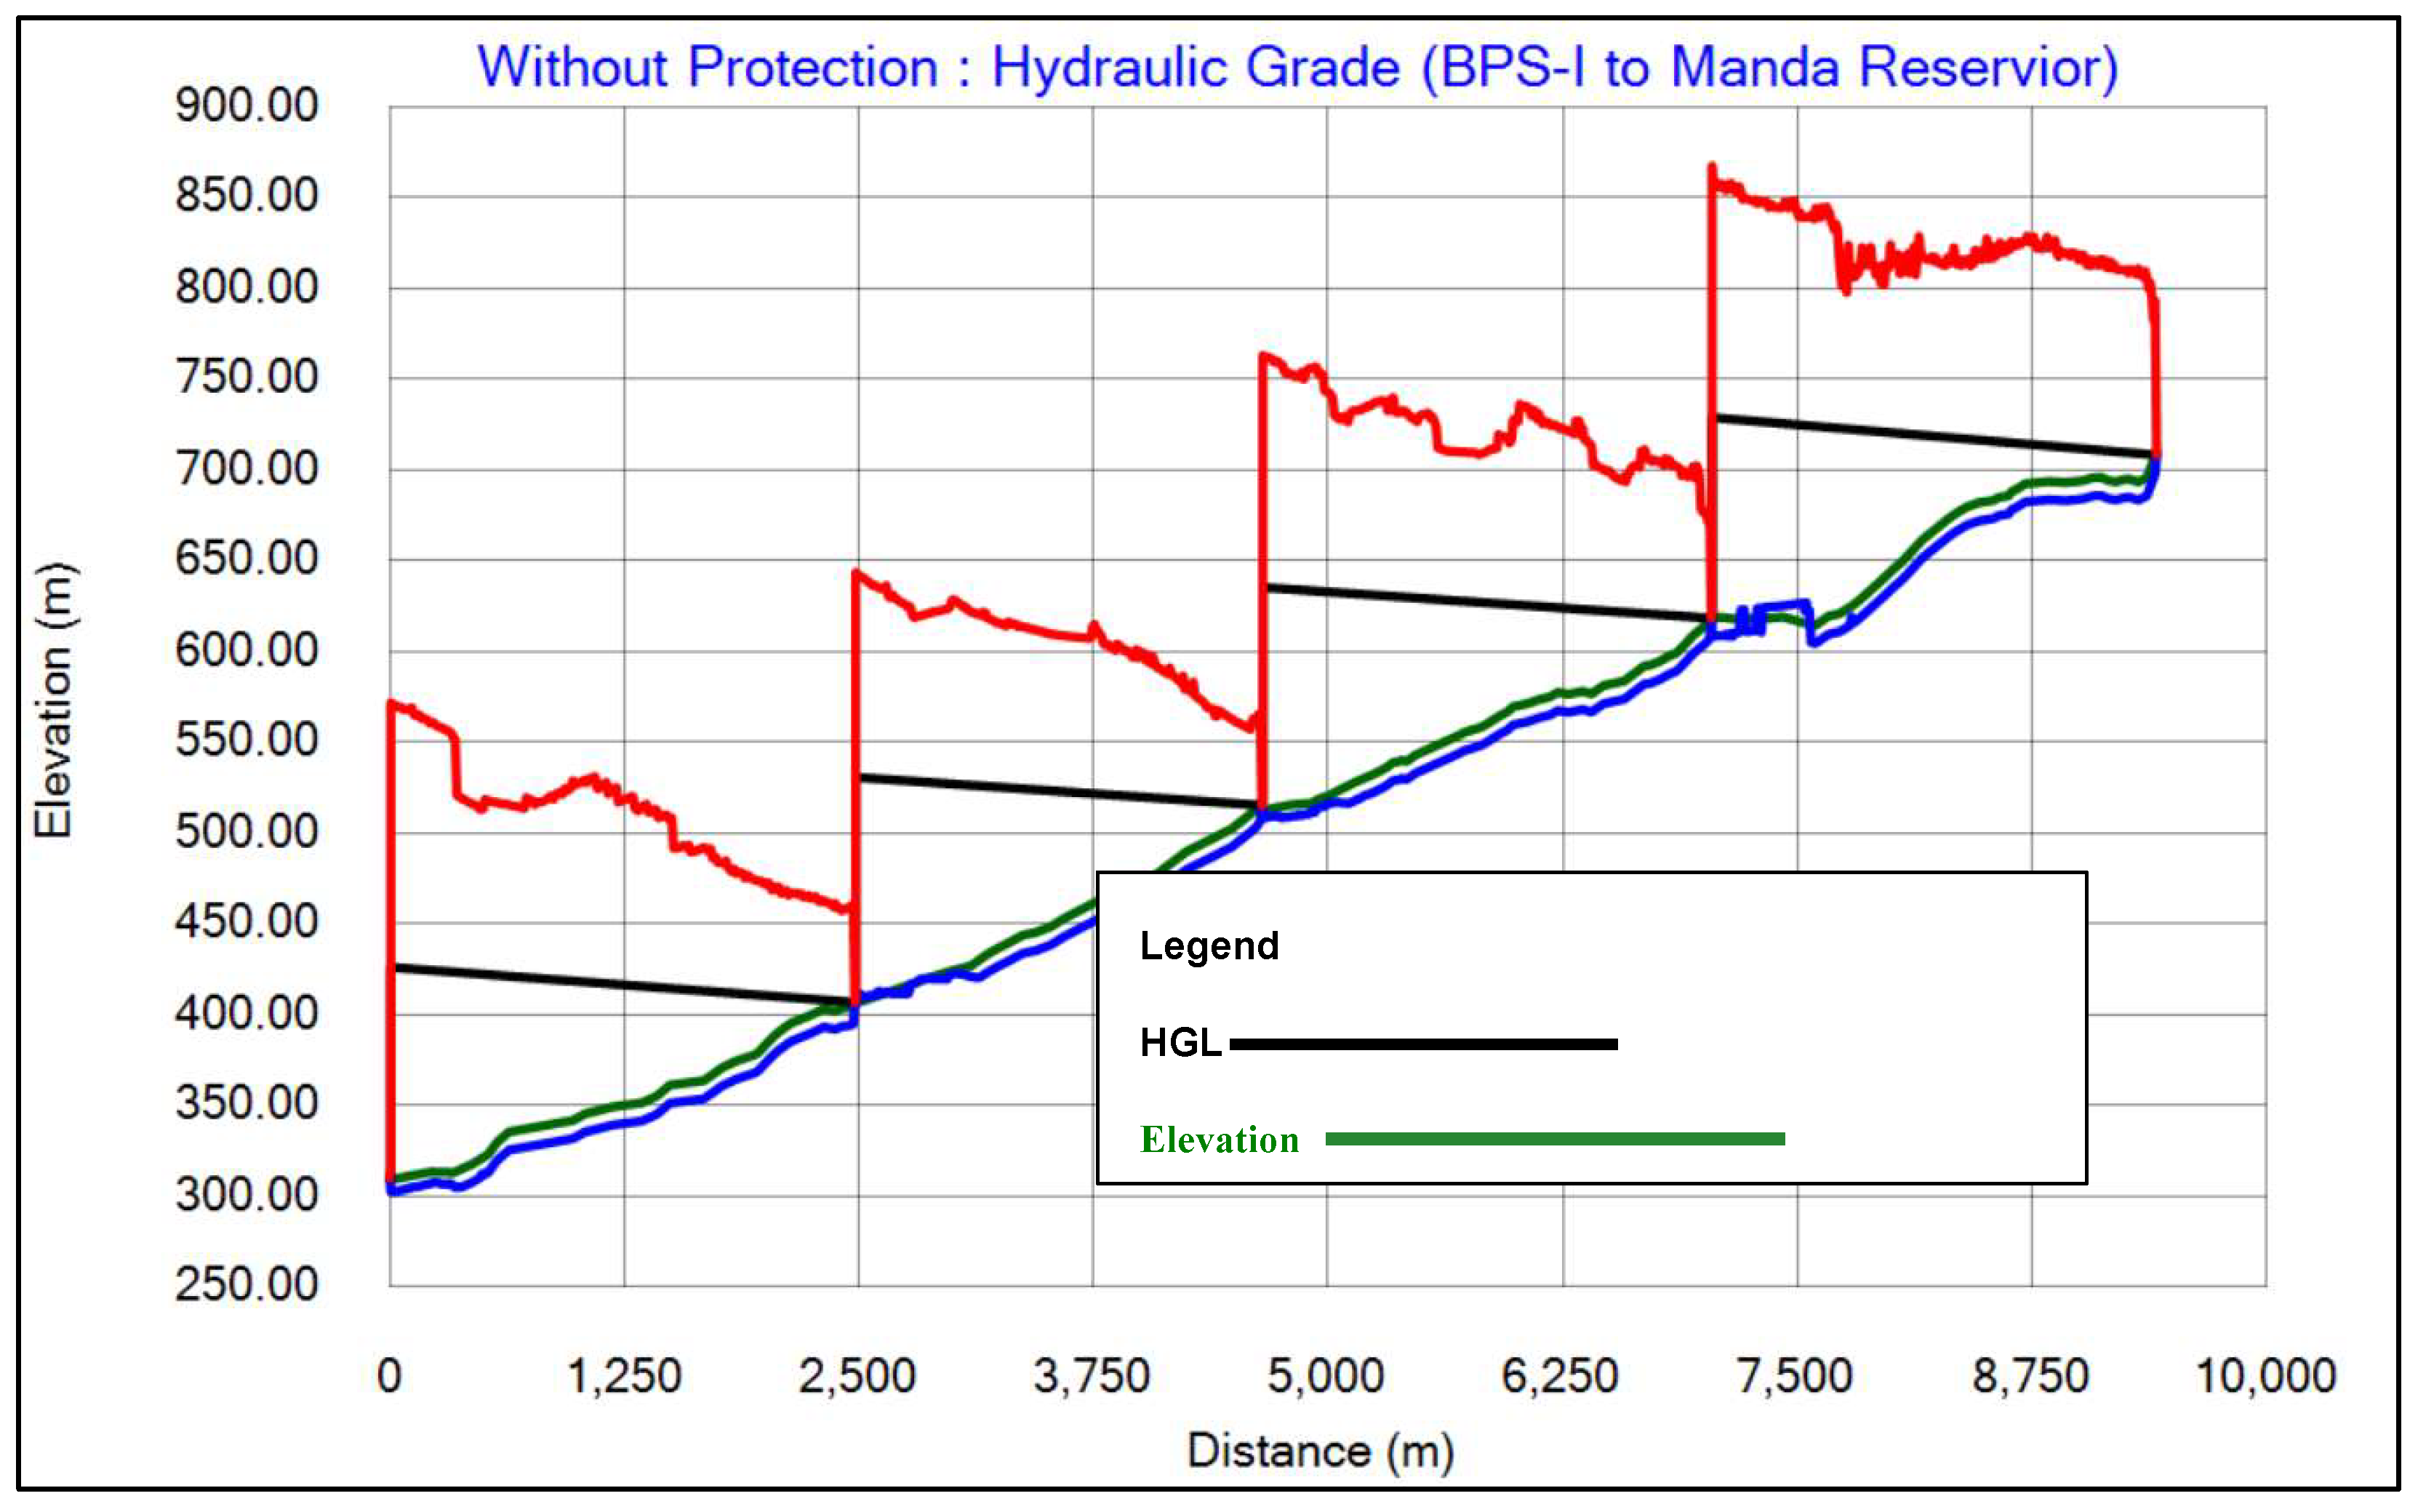
Figure 7: Maximum and minimum transient head envelope along the entire pipeline system; red is the maximum envelope and blue is the minimum envelope. Ground elevations are in green. The plot brings together, in one picture, the steady-state information with the transient to really understand the hydraulic behavior under normal and transient operating conditions. The results of this analysis remain in constant decrease of the minimum head, indicating a negative pressure in the system in the absence of protective equipment. Associated risks of negative pressure include water column separation, pipe collapse, and formation of vapor cavities. These result in piping damage, incidents of water hammer, and poor performance. Protective measures using surge tanks, air-valves, or pressure relief valves are then important in mitigating negative pressure to guarantee stable and reliable pipeline operation.
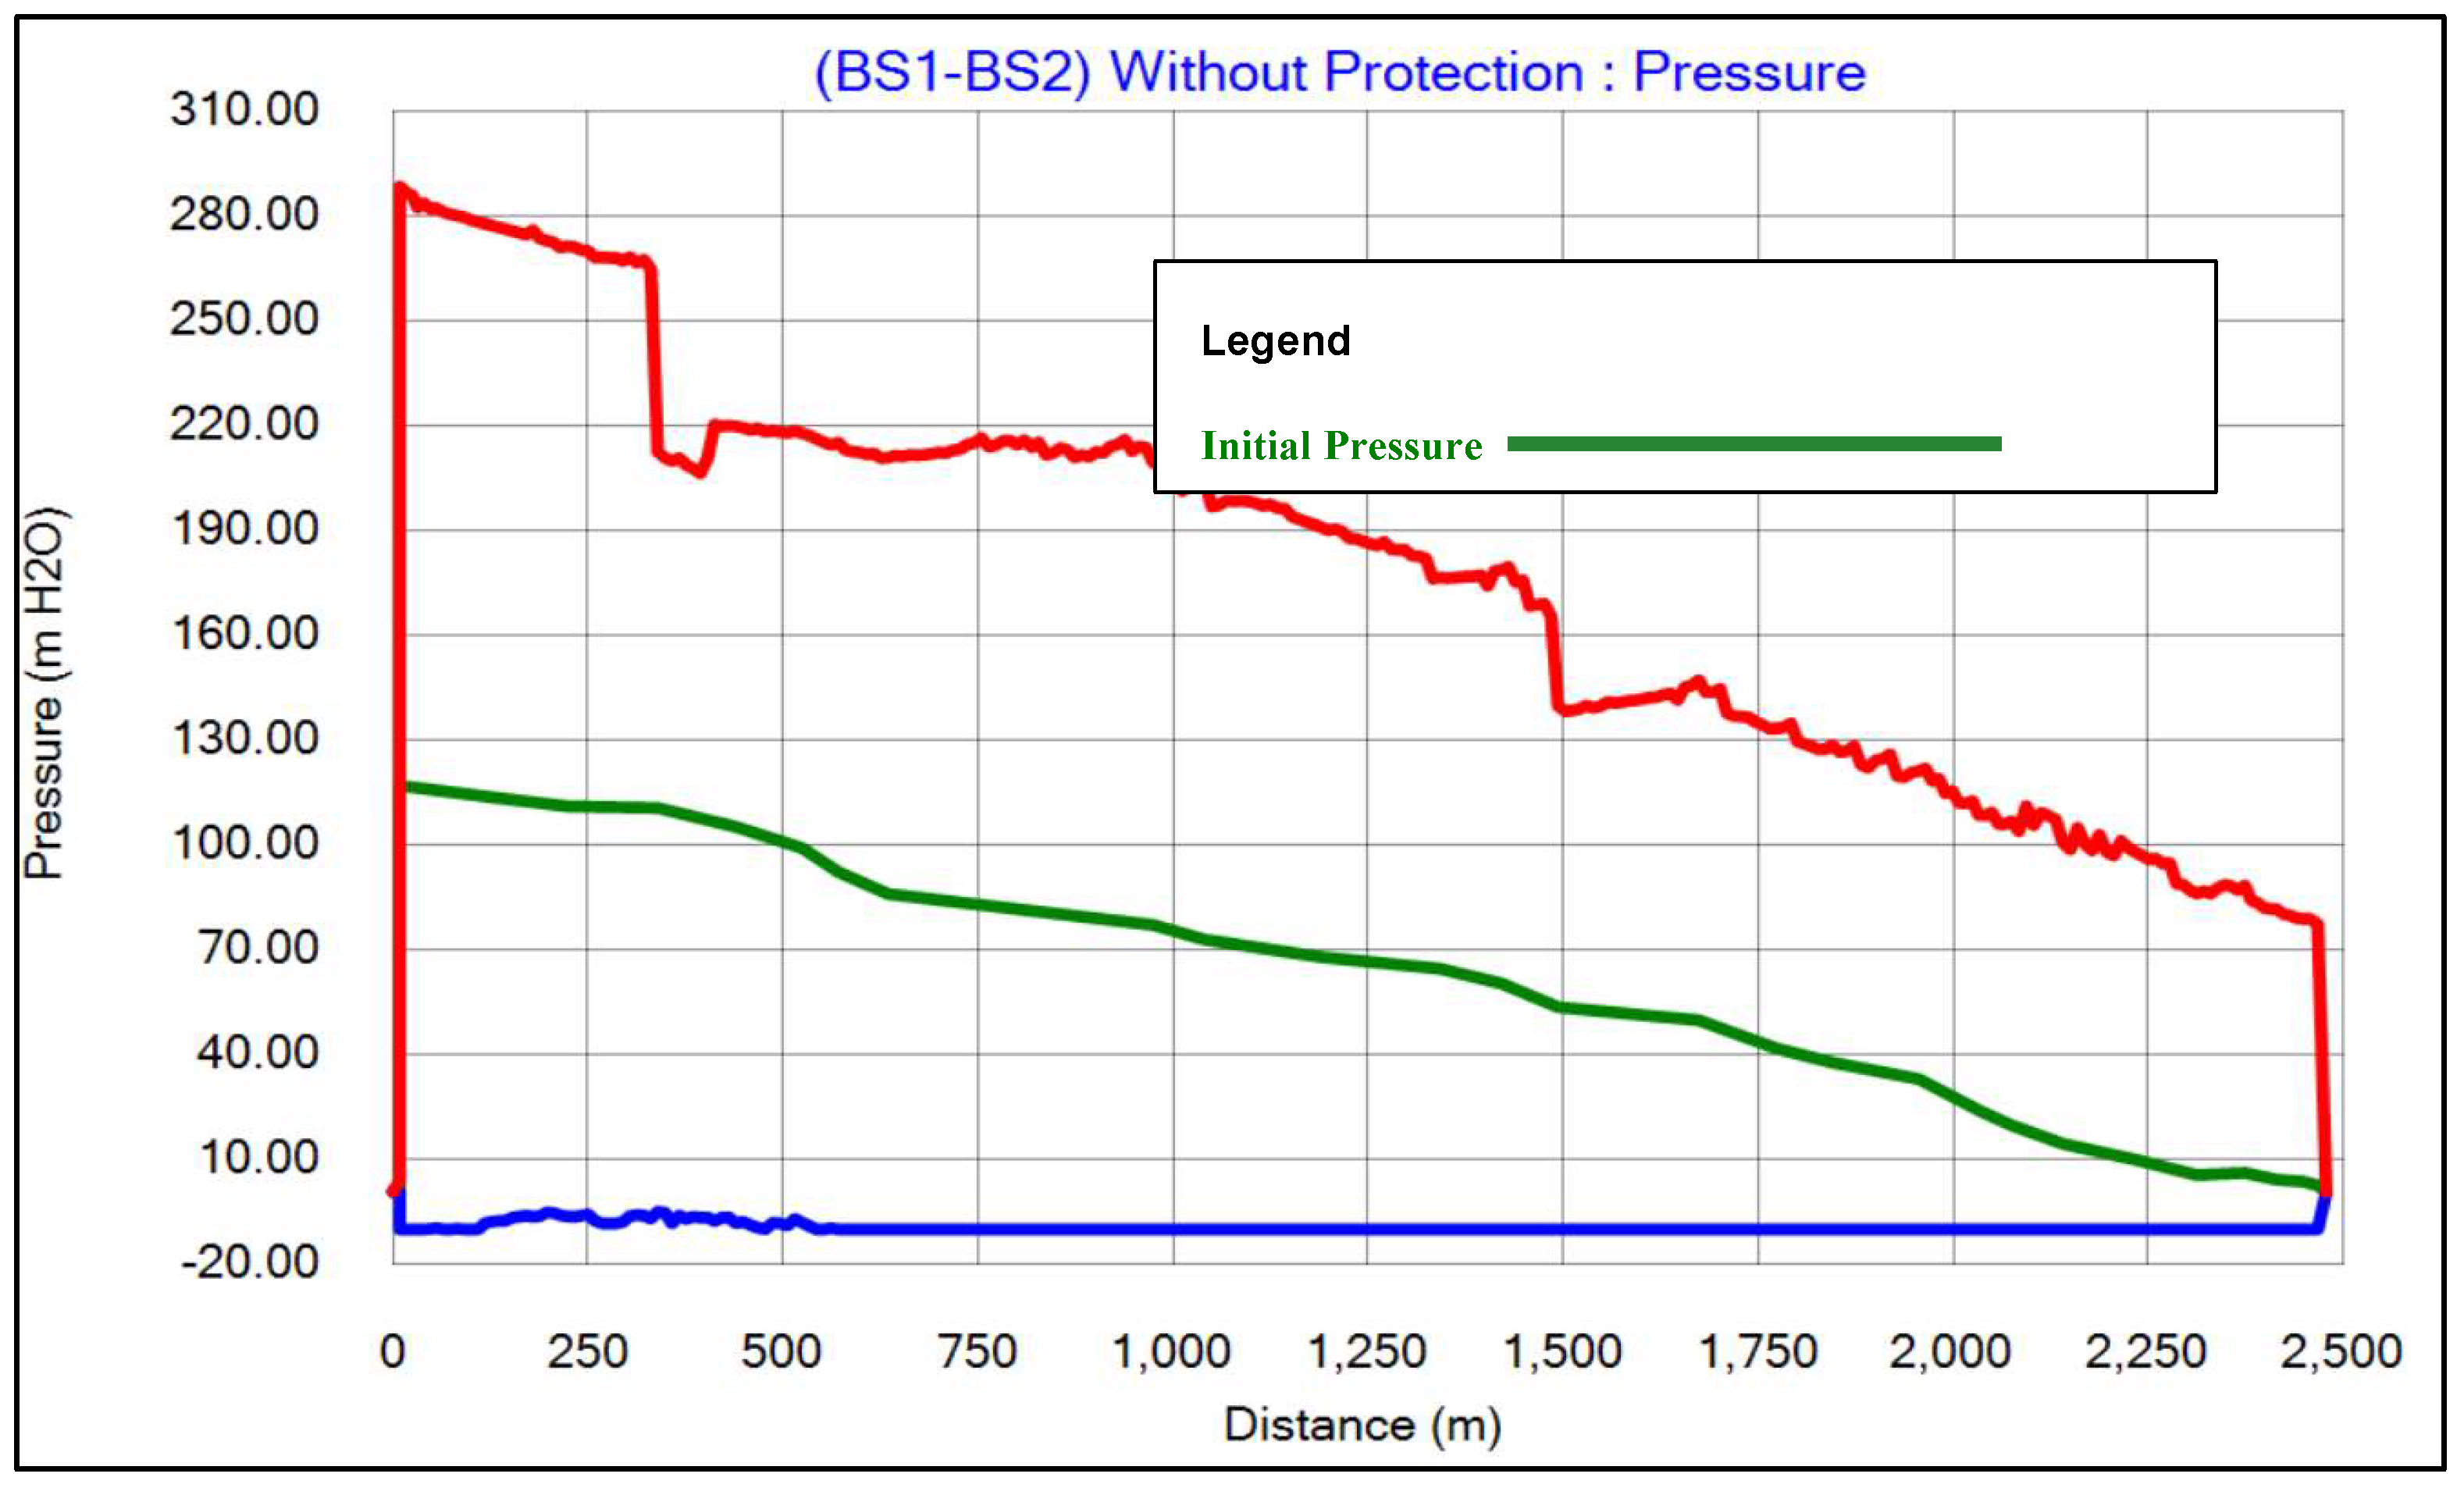
Figure 8: Transient Pressure Conditions along Pipelines without Protective Measures for a Pump-Outage Condition: The surge pressures at the outlet from the pump will shoot up to 288.27 mH₂O, much above the working safe limits. As one goes down the pipeline, it gradually falls to about 77.3 mH₂O at the inlet of Pump Station-I. Negative pressures were also recorded, with the lowest pressure of -10 mH₂O. Such excessively low pressures may cause buckling, implosion, and leakage at pipe joints during sub-atmospheric phases, increasing the risk of collapse for some pipeline materials, diameters, and wall thicknesses.
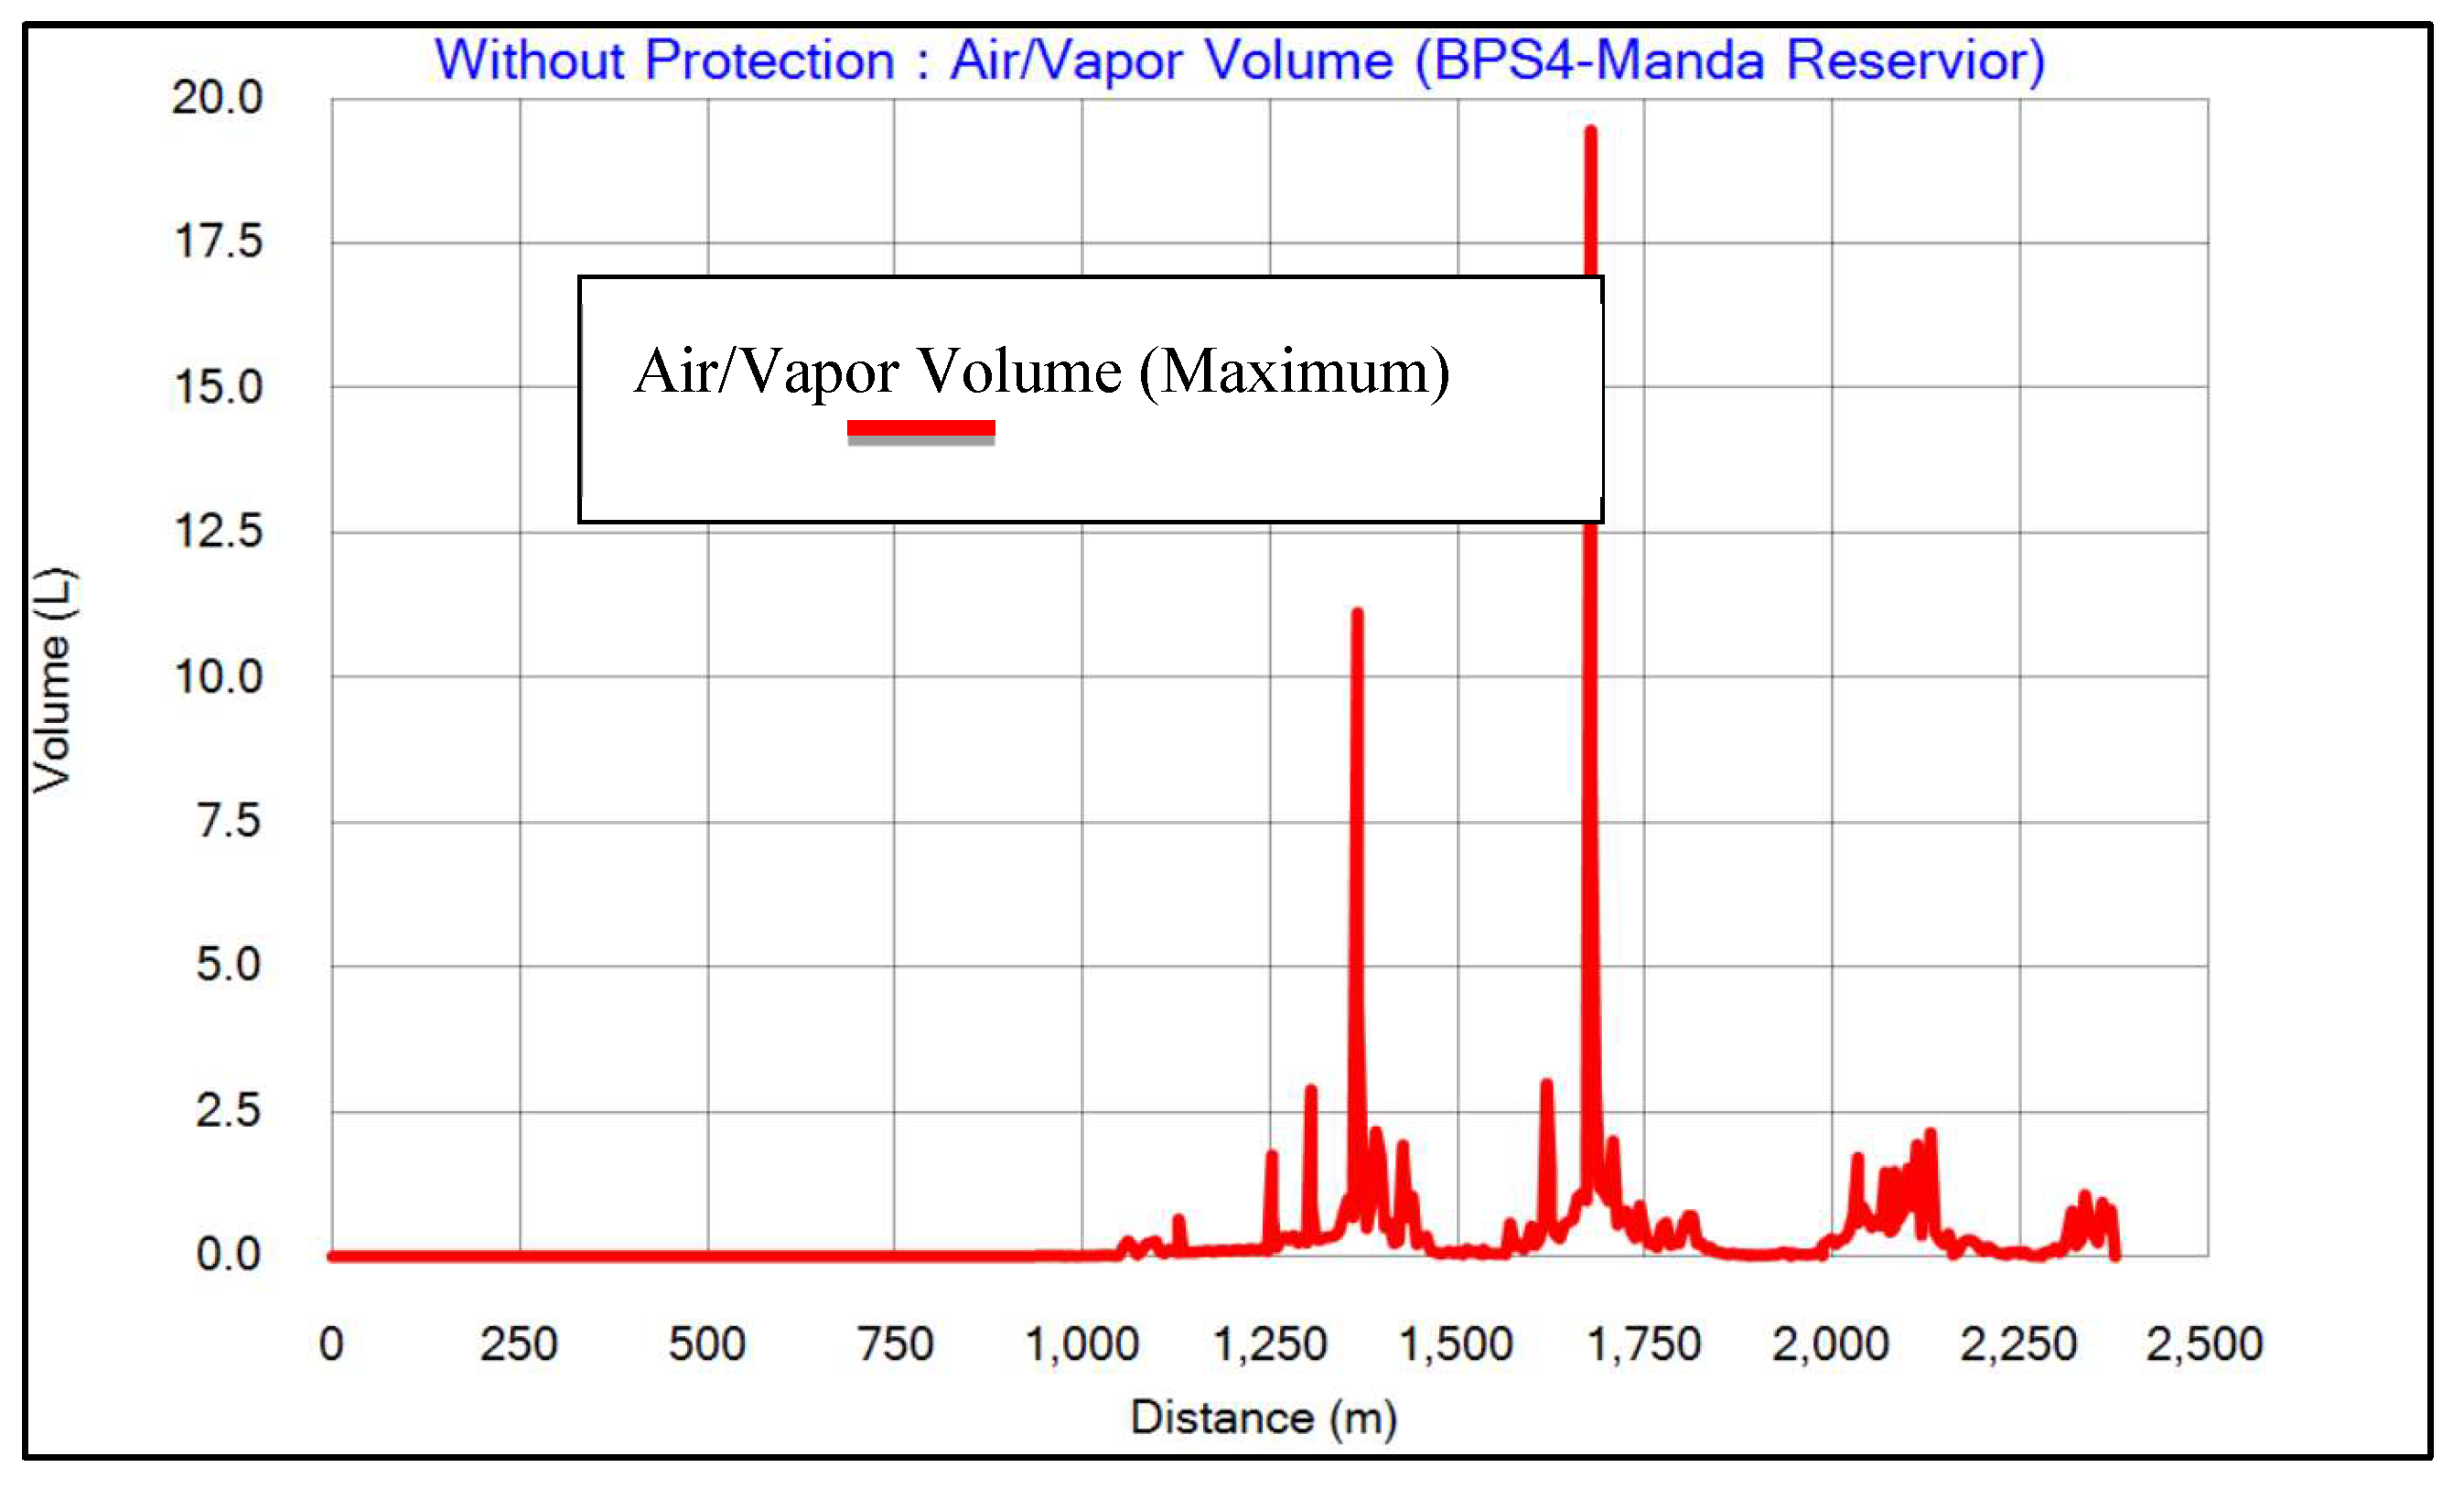
Figure 9 presents key information on the distribution of air vapor volume in the water pipeline transmission, paying attention to the section that starts from Booster Station 4 (BPS4) to Manda Reservoir. It gives insight into the air pocket behavior dynamism, which is very important for the mitigation of water hammer problems. In general, figures and data showcase a comprehensive analysis of transient behavior and pressure fluctuations. The research clearly identifies the surge tanks, air valves, and hydro-pneumatic tanks as vital safety measures that counteract the very undesirable and dangerous effects occasioned by transient events, that is, generation of undesirable negative pressure and elimination of unsatisfactory/unreliable pipeline operations.
3.2. Scenario 2: Transient Analysis with Protection
In this case, transient analysis was performed on the transmission pipeline fitted with protection devices such as air valves, hydro-pneumatic tanks, and pressure vessels to calculate their response in controlling water hammer effects. This clearly showed that an air valve could not be able to dissipate a large amount of air that was generated at the instant of power failure. Therefore, a hydro-pneumatic tank surge protection device was chosen. Hydro-pneumatic tanks can work both in the positive and negative pressure stages; the flow of water continues without the formation of vapor pockets. The tank was sited at the outlet of the pumping station; its volume was determined to be a 2000-liter bladder type, equal in size to the transmission main pipe for economic reasons (Arefi et al., 2021).
3.2.1. Graphical Result Representation with Protection
Pressure: Figure 10 shows the pressure profiles in transient conditions when protection measures were included. It shows that at no time did the maximum pressures that had developed along the pipeline sections ever exceed a working limit of 160 mH₂O, and as such, the system was very safe. The minimum negative pressure also remains within the allowable range of -10 mH₂O to prevent cavitation for safe and stable pipeline operation.
Hydraulic Grade:
Figure 11 shows the hydraulic grade lines with protection measures; it compares the steady-state head with the maximum and minimum head during unsteady conditions. The minimum head remains, without exception, always higher than the elevation of the pipeline that ensures that the pipeline can resist structural collapsing.
These plots show how well the protective measures keep pressures within safe bounds and avoid negative pressures, thereby providing a potential pipeline damage mode. Inclusion of a hydro-pneumatic tank, combined with air valves, allows enhanced protection against water hammer effects, all in the way of reliable and stable operation of the pipeline system.
3.2.2. Comparing Protected and Unprotected Results
Simulation results, as shown in
Figure 6 through
Figure 9, indicate the risks arising because of the absence of protection devices, including column separation and damage to pipes. On the other hand, the application of protective measures, especially the use of a hydro-pneumatic tank, improved the minimum pressure and diminished water hammer risks. Besides, there is a reduction in maximum head, hence increased pressure control along the pipeline. This greatly reduces the pipeline vulnerability, as summarized in
Table 1.
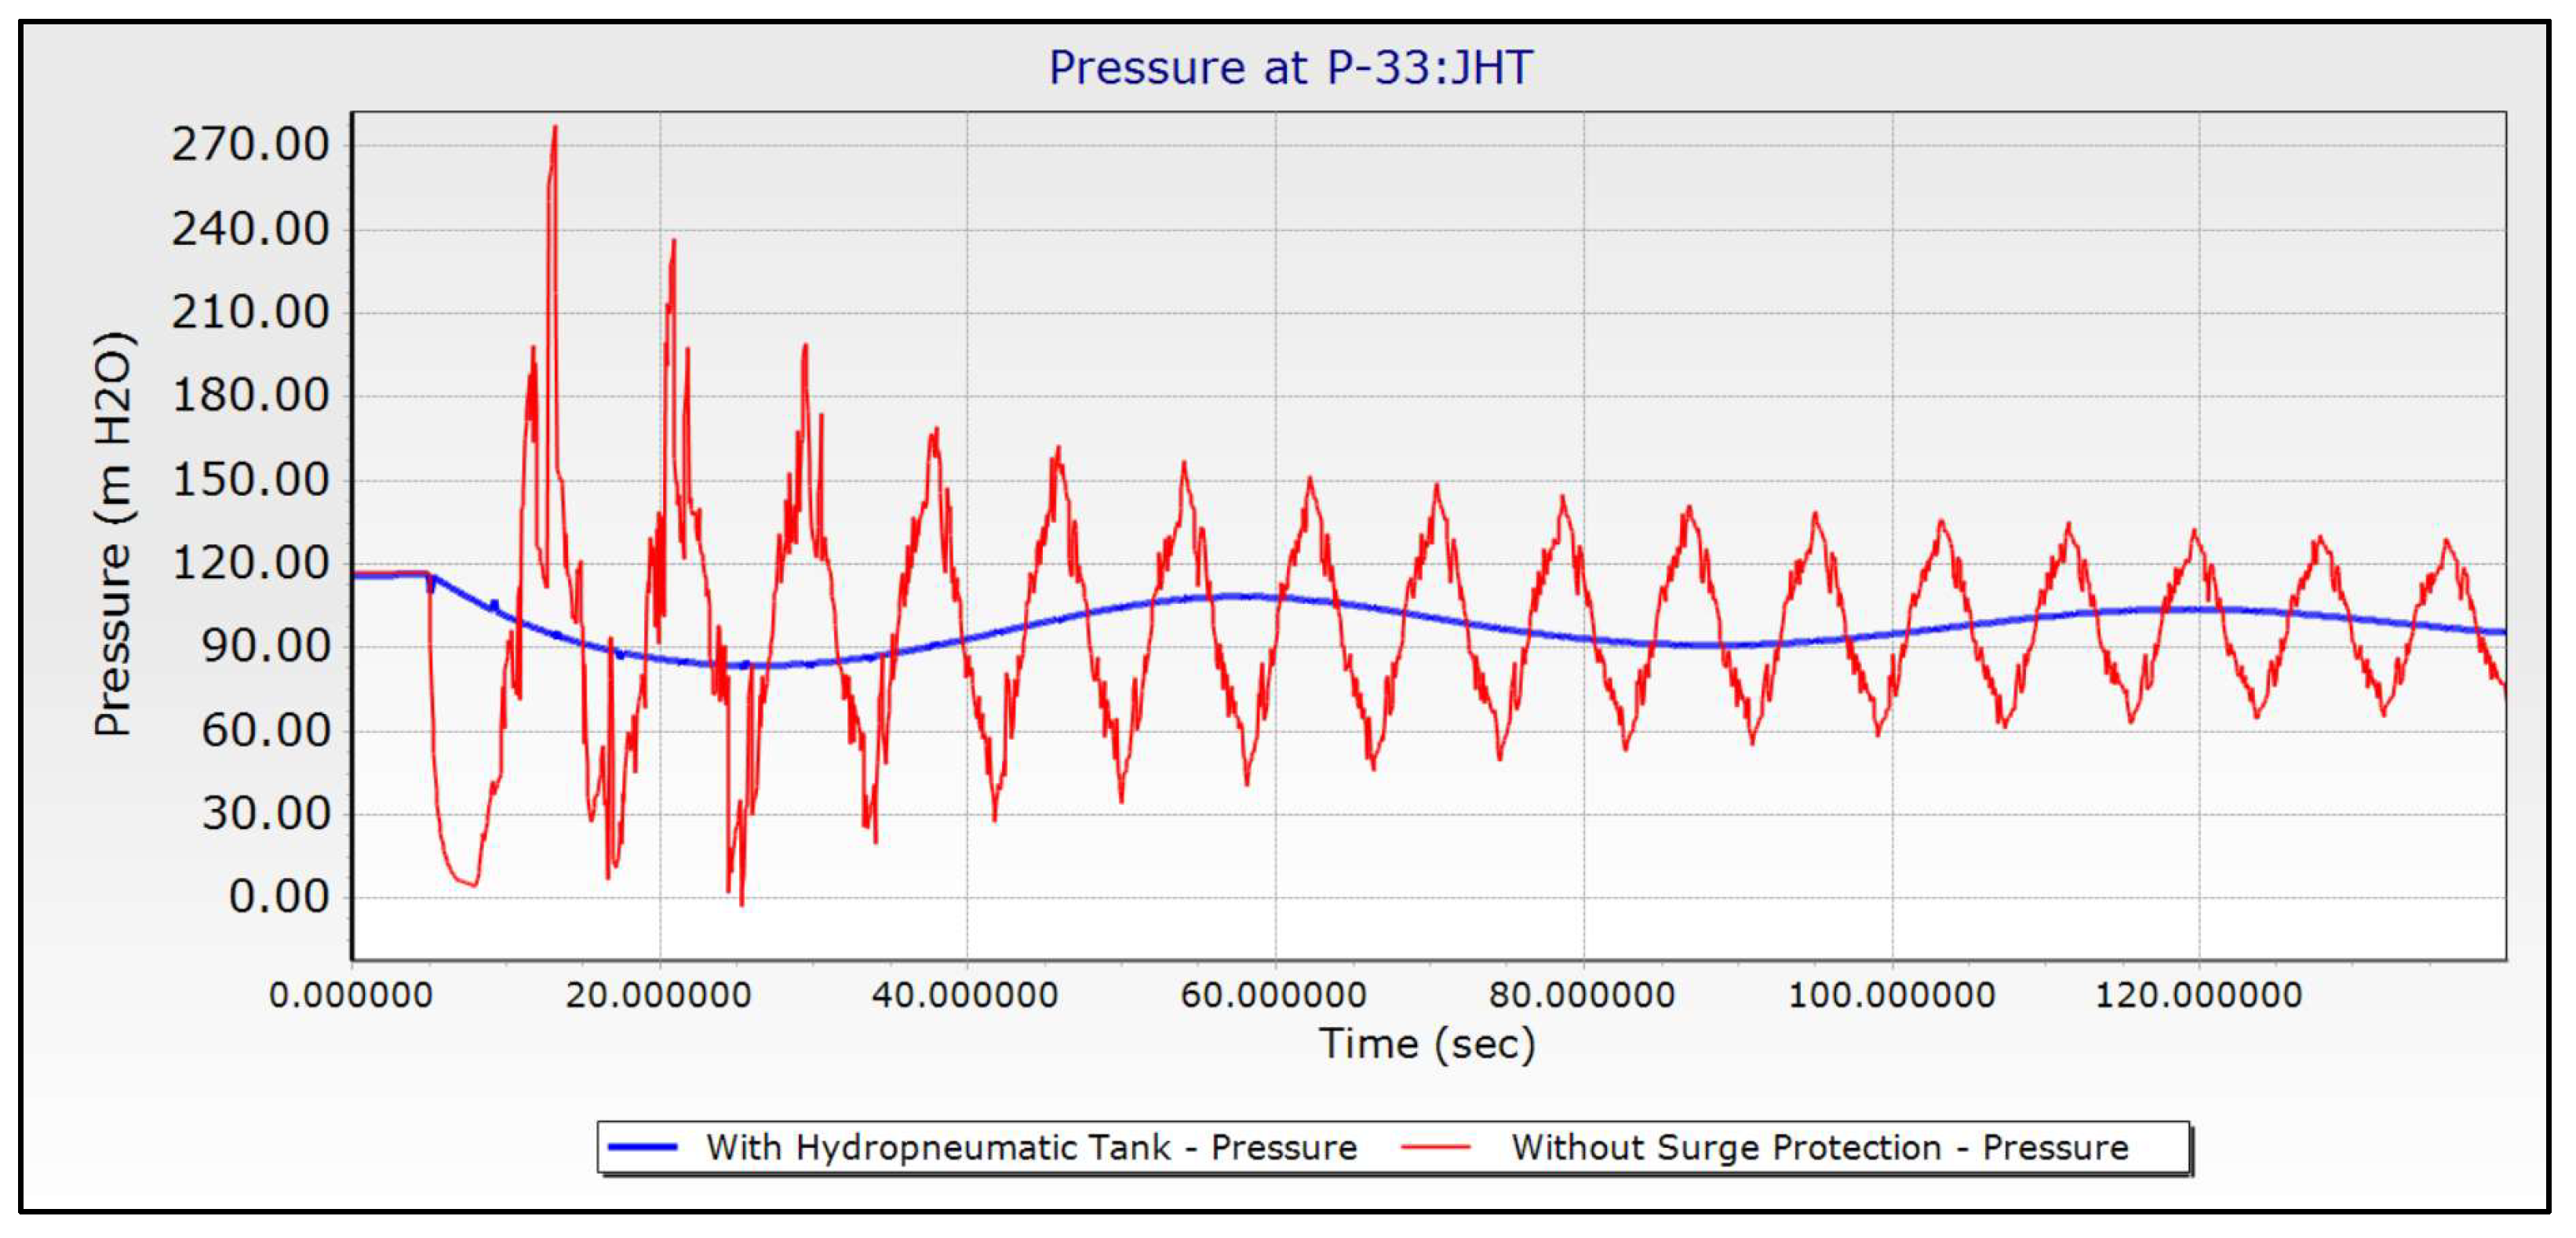
Figure 12 compares the pressure head time histories without and with protection for the first reach of the transmission line BPS IBPS II. In red, one can see the transient wave without any kind of control; it is noticed that there exist pressure fluctuations during the water hammer events. On the other hand, the wave with a hydro-pneumatic tank is represented by the blue line, indicating that the amplitude of the pressure wave is significantly reduced. This reduction indicates that the protective measure was quite effective against water hammer effects. The hydro-pneumatic tank controls very effectively the spikes of pressure, avoiding unstable pipeline operation during any transient event and hence ensuring greater system safety and performance.
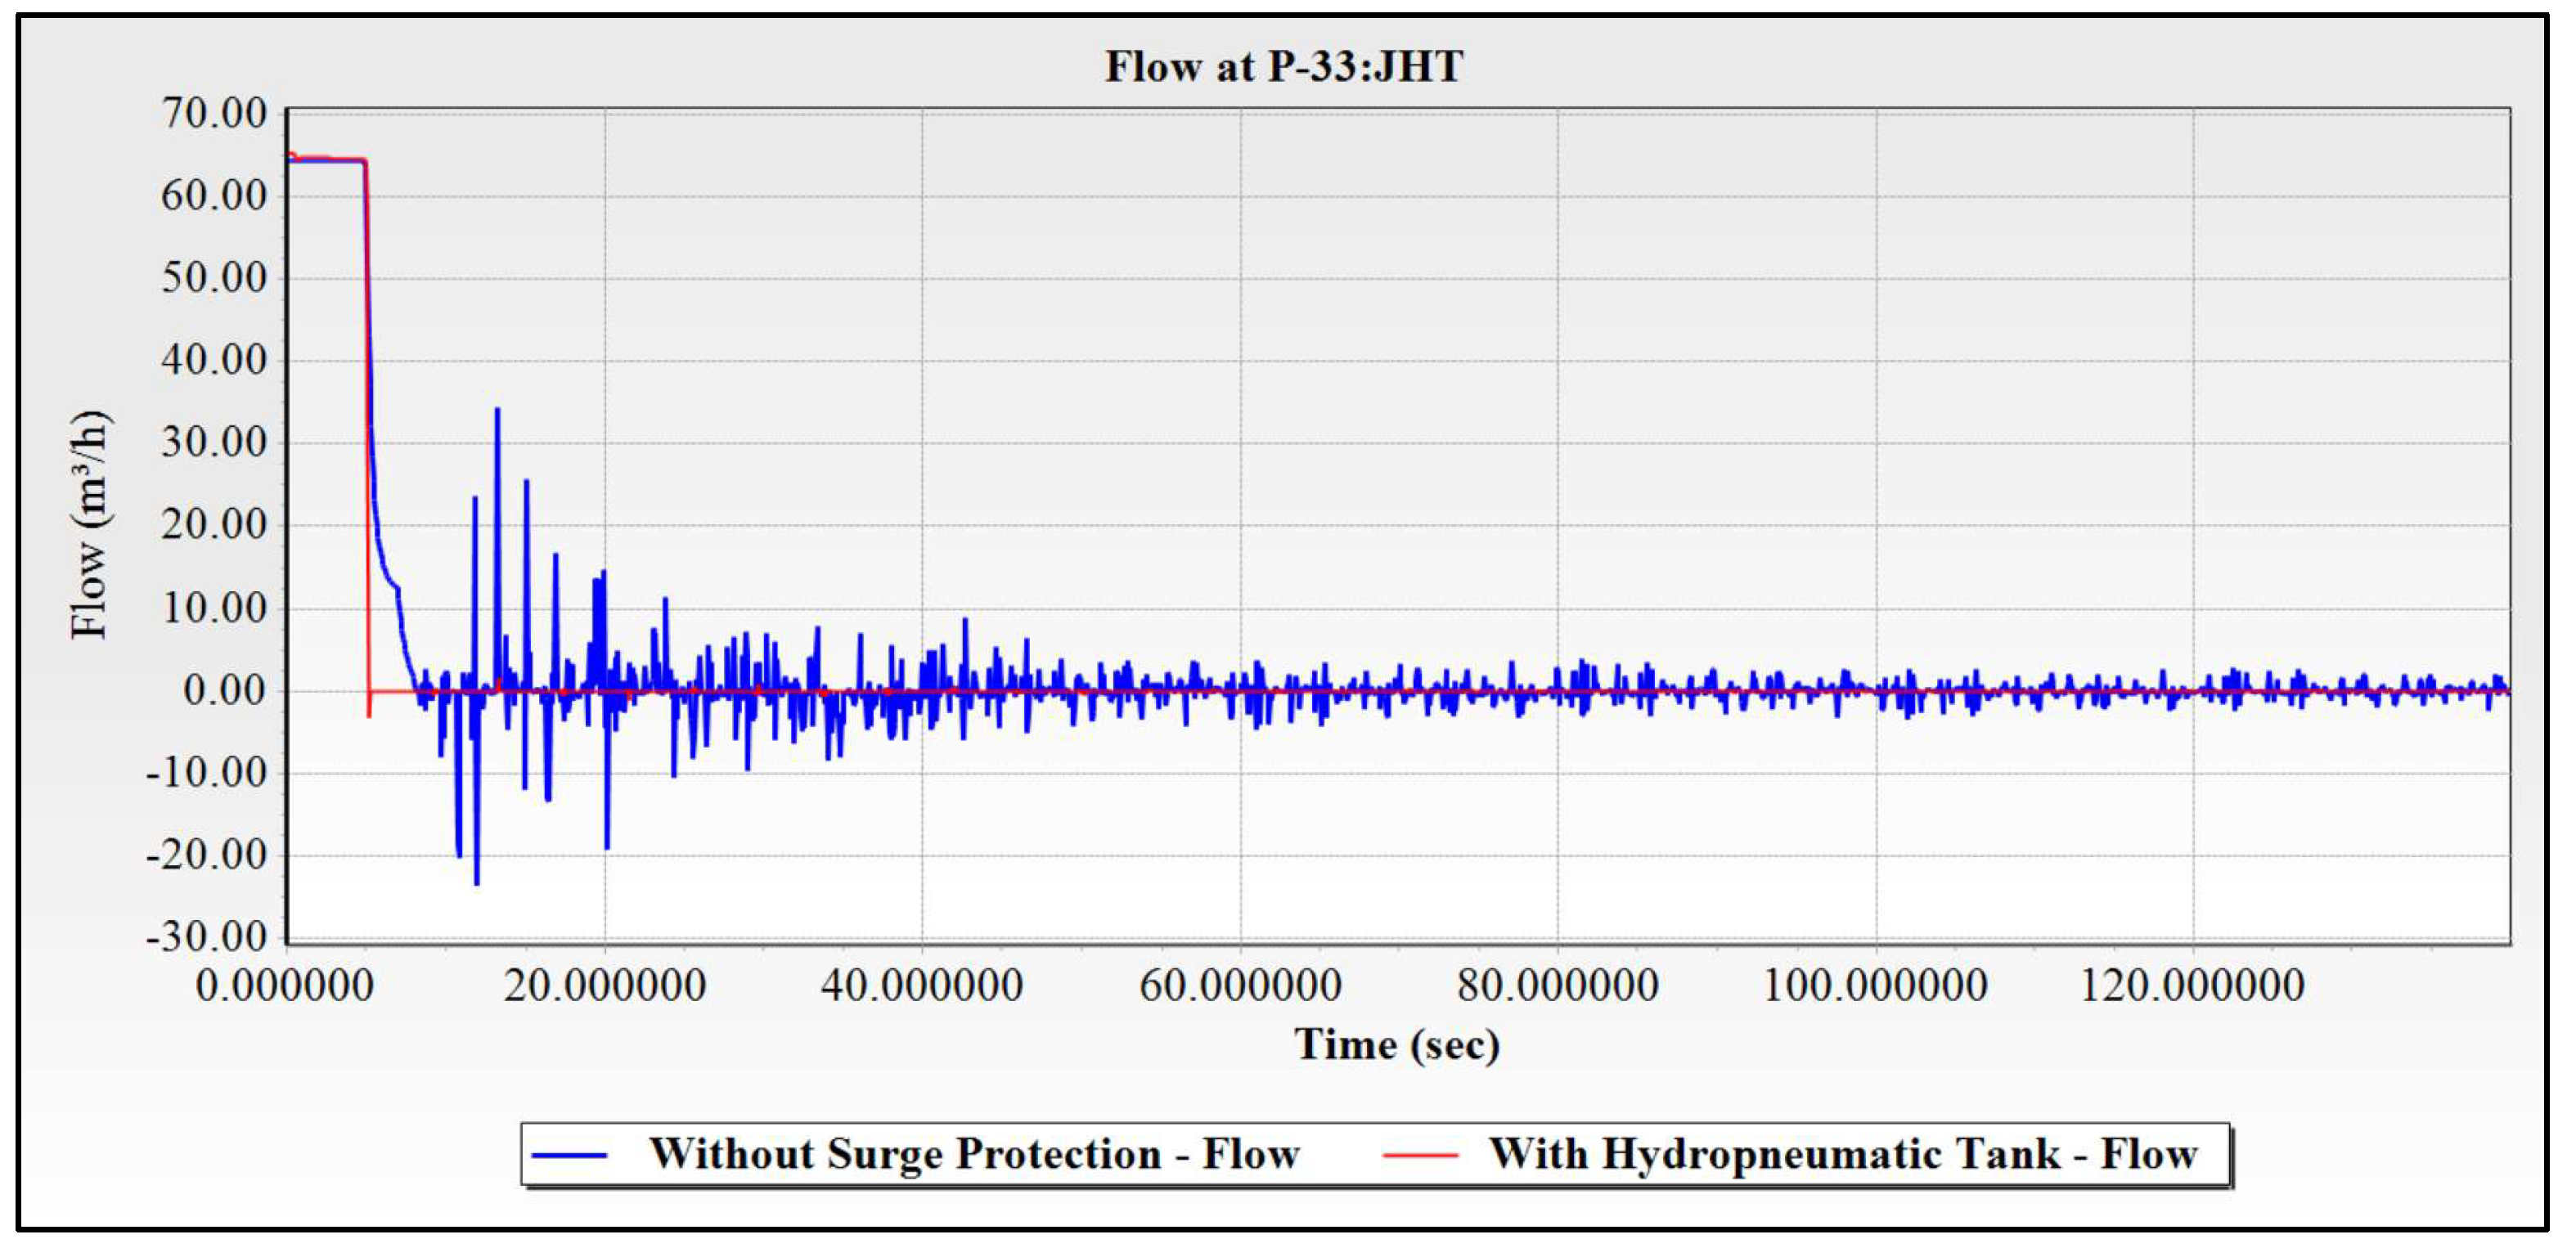
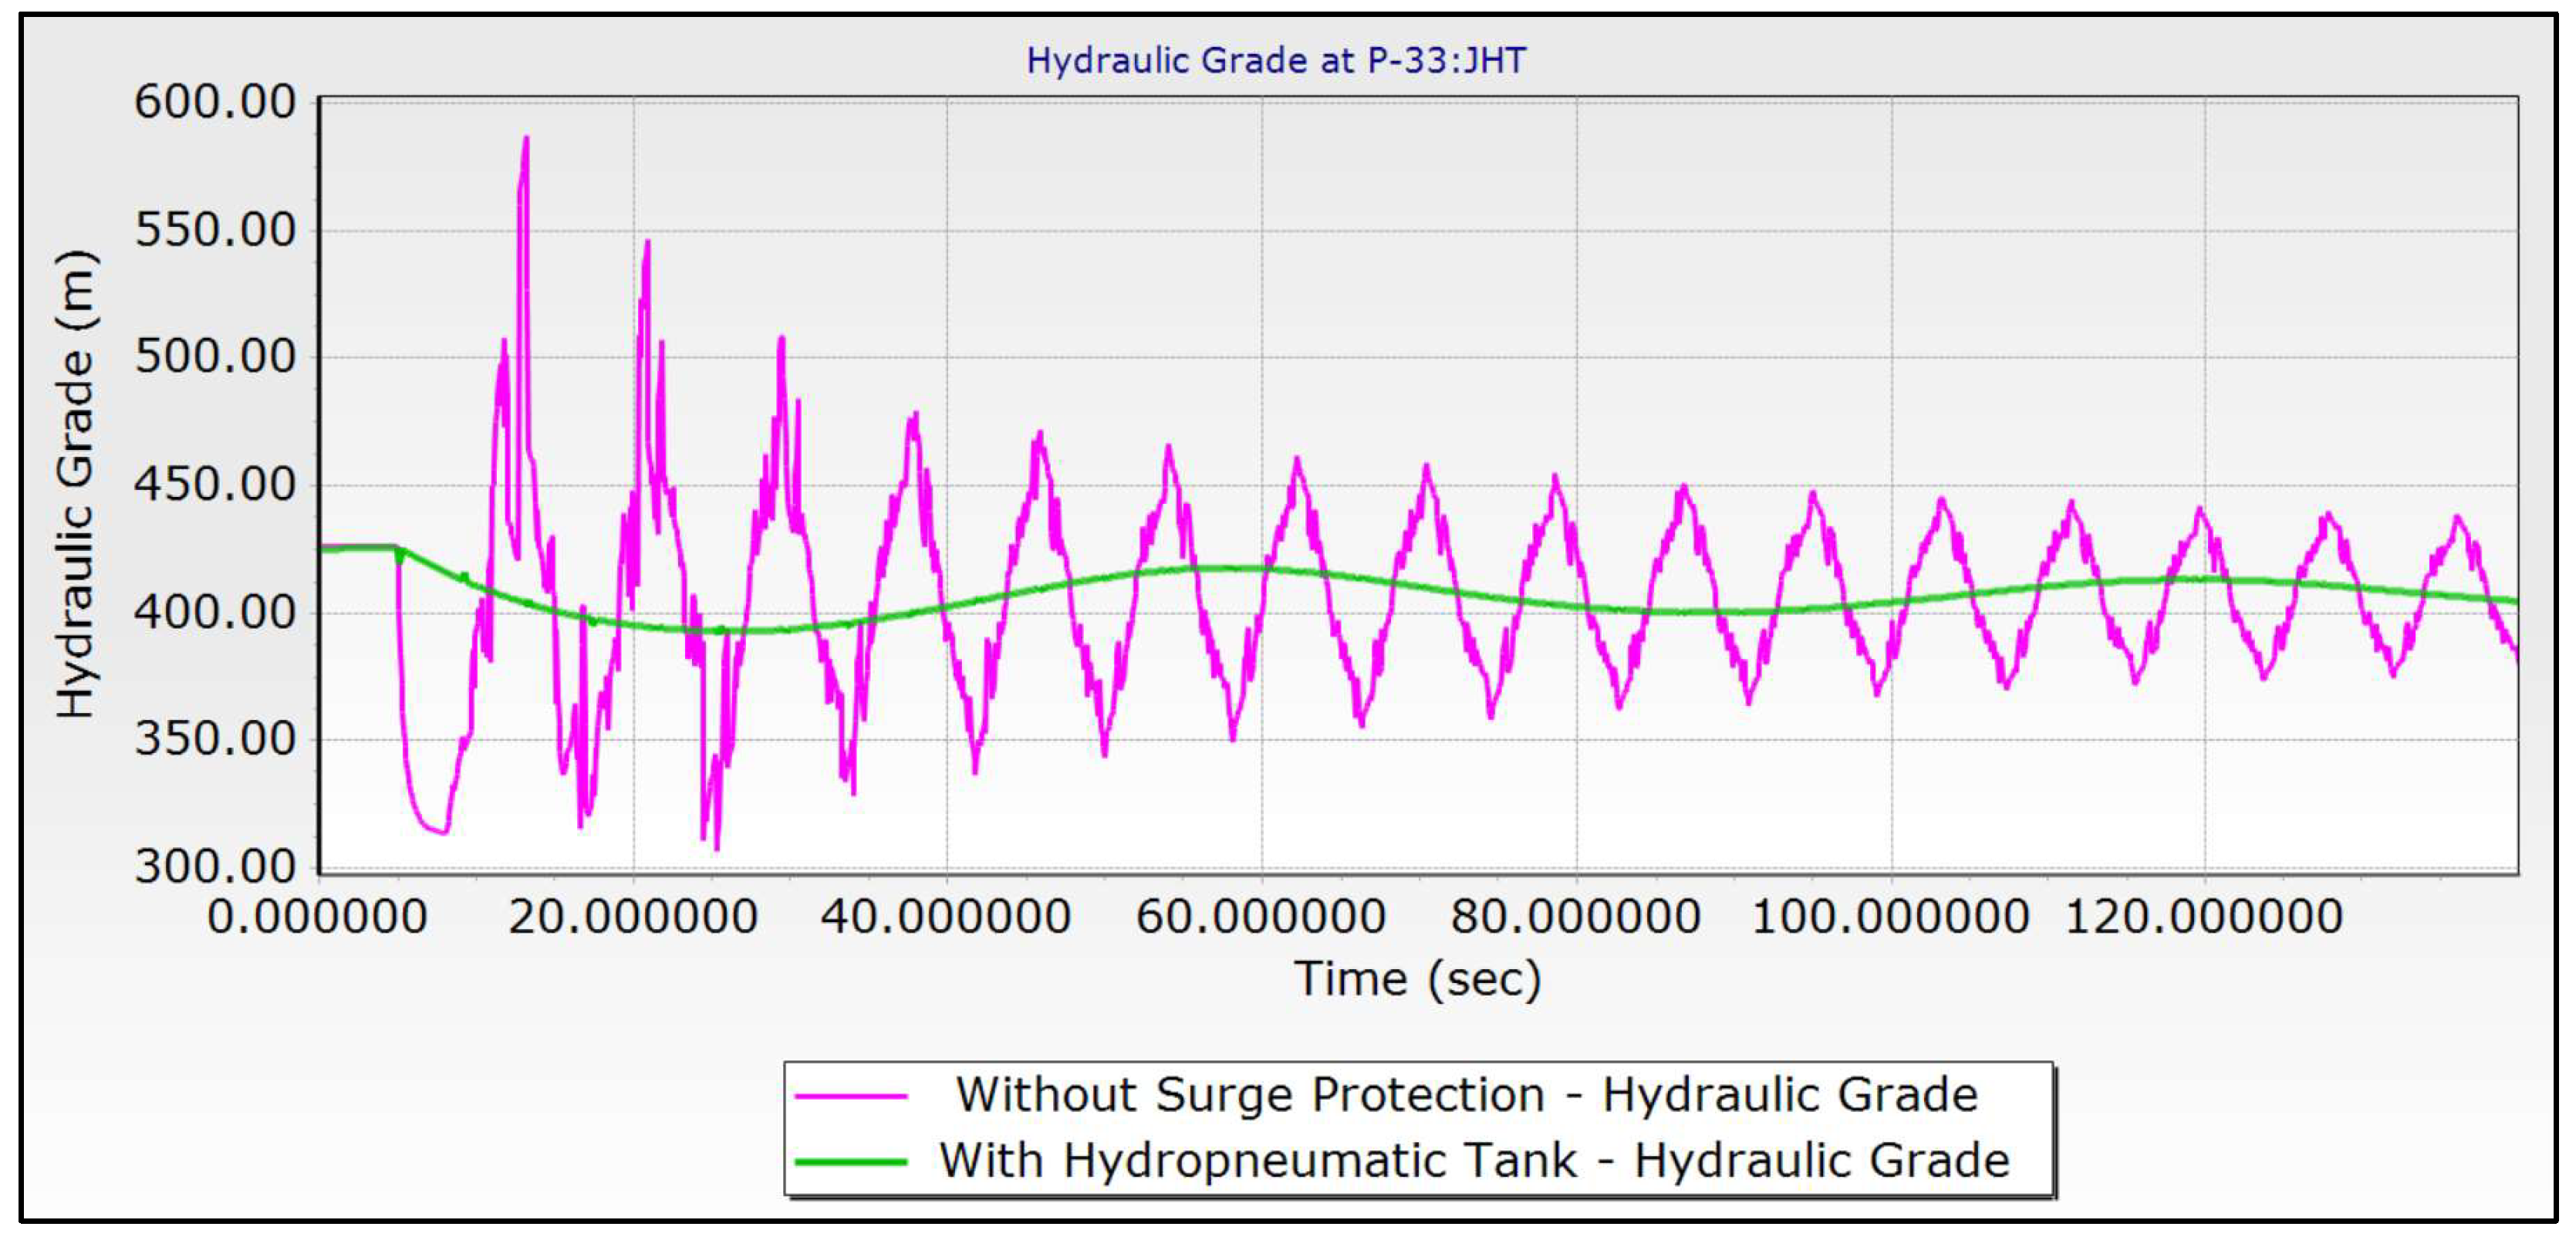
Figure 13 and
Figure 14 present the results of discharge flow rate and hydraulic grade oscillation with time in a power failure condition, both with and without a hydro-pneumatic tank. These graphs also produce what is attained by the protective measure: better flow stability and reduced hydraulic grade oscillations when including a hydro-pneumatic tank.
Comparing the results in a protected system with those in an unprotected one clearly indicates the large advantages supplied by the introduction of protective measures, and more importantly, the hydro-pneumatic tank, in reducing water hammer effects and improving system stability toward the reliable operation of the pipeline.
Table 2 shows different maximum pressures at various sections for the pipeline with and without protection. If without protection, already high maximum pressures may be generated in the pipeline, dangerous for the integrity of the system. The addition of a hydro-pneumatic tank for protection will greatly reduce these maximum pressures to make the pipeline operate much safer and stably.
Implementation Recommendations: Based on the results of the simulation and the benefits observed with a hydro-pneumatic tank, a 2000-liter hydro-pneumatic tank should be installed at each pump station. This recommendation is made for the reducing of possible pressure fluctuations at each pump station in order to achieve the stability of the system, as well as for pipeline safety and reliability during the transient conditions arising out of power failure or water hammer incidents. The hydro-pneumatic tank will, to some extent, dampen pressure transients so that column separation, cavitation, and consequential pipe damages are averted, and a much more controlled and constant flow of water is provided. With these measures in place, the pipeline system operates within an acceptable window of pressure, preventing possible damage and improving overall system performance.
3.3. Scenario 3: System Geometrical Design Modifictions
Geometrically, modifications were made to enhance the overall transient performance of the piping system, more on the suction lines. The design modifications were quite successful and resulted in an appreciable reduction in the chances of cavitation.
The parameters and conditions checked in this project ensure that the surge pressures will not damage the pipeline. In the simulations, different pipe materials will be evaluated: HDPE, uPVC, and DCI pipes, and the changes in the diameters of the pipelines. The scenarios protected and unprotected are considered in these simulations.
It is worth mentioning that Scenario 3 was beyond the scope of the SMD Multi Village Water Supply Project. The transmission main pipeline had already been constructed with DCI pipe material of size DN150 mm. These changes are only possible in the preliminary stages of a project; therefore, preliminary surge analysis can point out cost-effective surge protection measures which may turn out to be impracticable to adopt at a later stage. For example, a pipe material with a lower modulus of elasticity and celerity increases the flexibility of the system and decreases acoustic wave speed. Such choices must, however, be taken after an appropriate risk analysis and cost-benefit study considering capital costs and operational and maintenance expenses. It is, however, still cardinal to investigate changes in geometric design as it contributes to the needed knowledge beyond the current pipeline design standards. Scenario 3, therefore, is thus fur-there broken down into two sub-scenarios, as follows.
3.3.1. Scenario 3a: The Effect of Changing Pipe Material
Here, the hydraulic model developed will be linked to investigating how different pipe materials can prevent column separation problems. In this regard, it would compare between Ductile Cast Iron pipe and High-Density Polyethylene and Polyvinyl Chloride pipes all of diameter 150mm. The respective unprotected-media effects on water hammer were evaluated, and the wave speed calculation for each pipe material utilized is shown in
Table 3, which was important in checking on the system response to water hammer.
DCI pipes will have the most excellent wave velocity because it was quite stiff, normal in uPVC pipes having intermediate stiffness and; HDPE pipe having the least wave speed because it was flexible. However, for attempting to draw inferences about its personal nature and application possibility, now the properties of each pipe material have been separately analyzed.
1. Case -1 DCI pipe System
In this case, the hydraulic transient model developed in section 3.1.2 was used to ascertain unsteady flow due to a pump power failure in the system with no safeguards. The wave speed for the DCI pipe, 150mm diameter worked out earlier was equal to 1283.68m/s. From the above analysis, it is noted that the contribution of water hammer action is very high in the existing DCI pipe system and undesirable pressure fluctuation will be more than the acceptable limits. This necessitated a surge protection solution implementation. Deeper investigation, based on 2000-liter hydro-pneumatic surge protection tank, implemented at the pump end of the system, yielded positive results, as shown in
Figure 6,
Figure 7,
Figure 8 and
Figure 9.
2. Case-2 uPVC pipe System
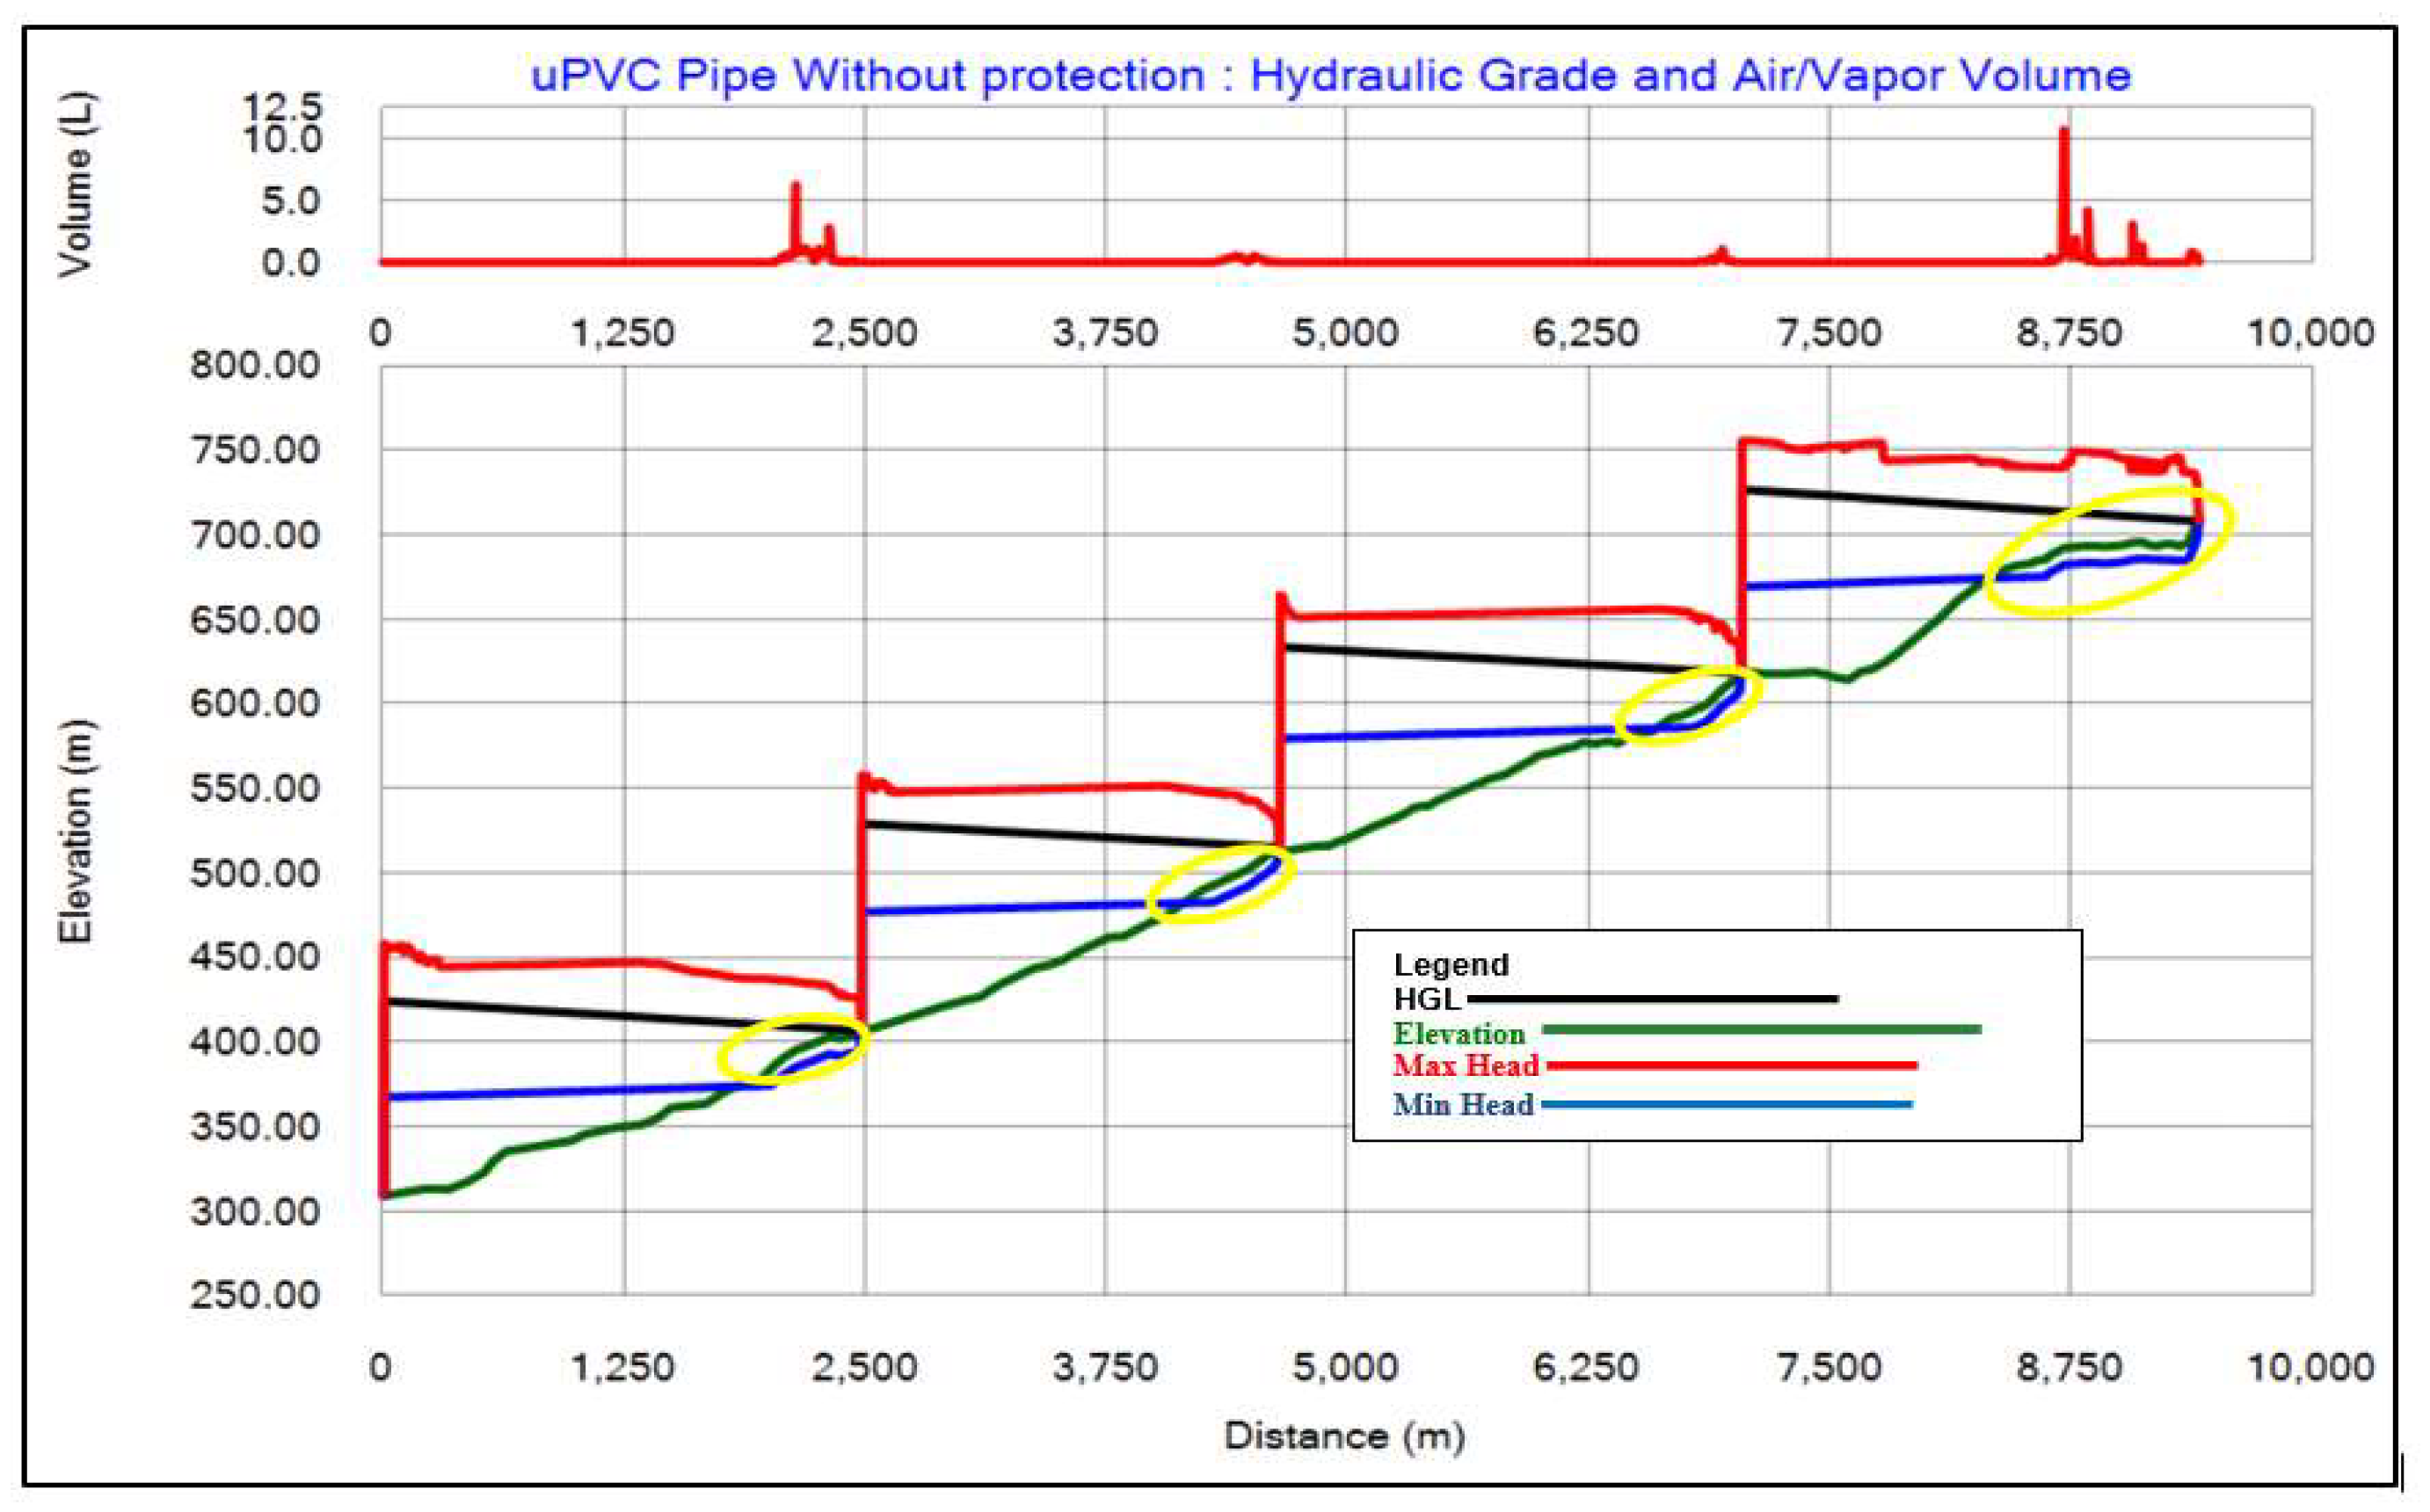
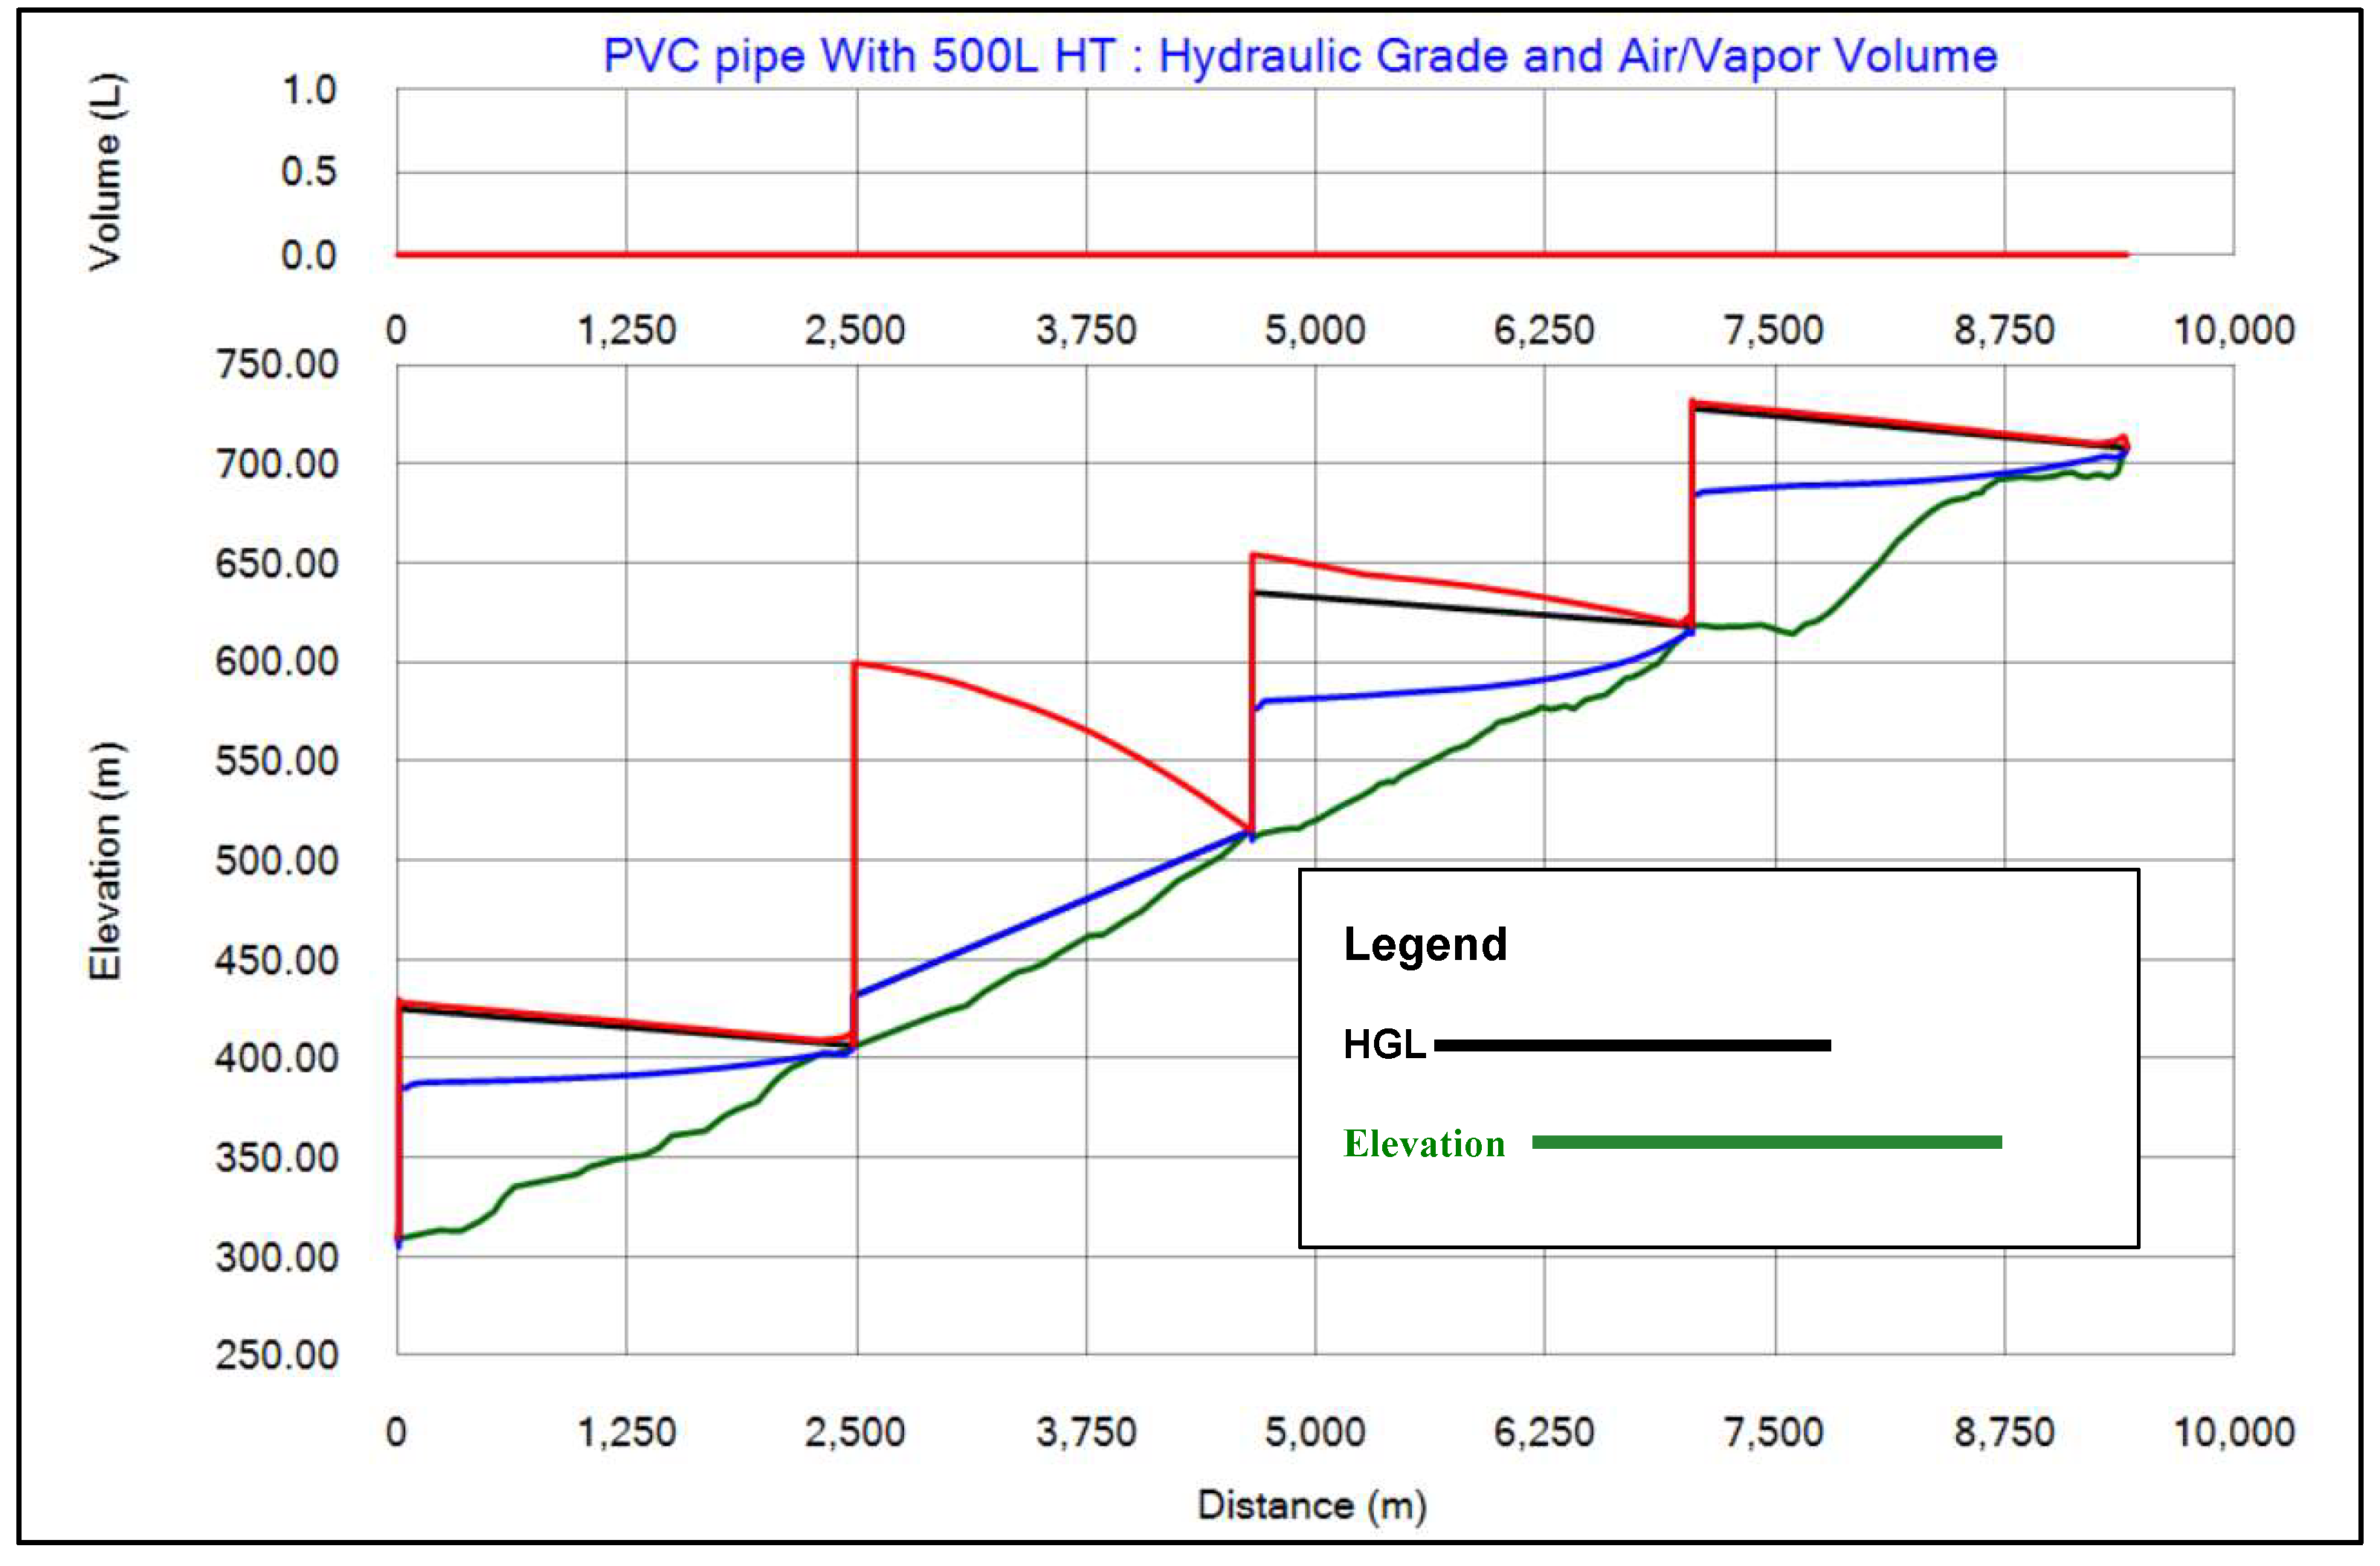
To carry on a study on indications arising out of the replacement of DCI pipe with uPVC pipe, on the same diameter of the discharge, and with pump power failure protection, analysis has been done. The wave speed calculated for the uPVC pipe was 449.37 m/s. In order to plot the hydraulic grade lines and pressure history at specific points in an uPVC pipe system, the system was modeled using an uPVC pipe and its transient performance was produced by introducing an open-end condition. The obtained results are depicted in
Figure 15 and
Figure 16, respectively, with yellow areas indicating water column separation.
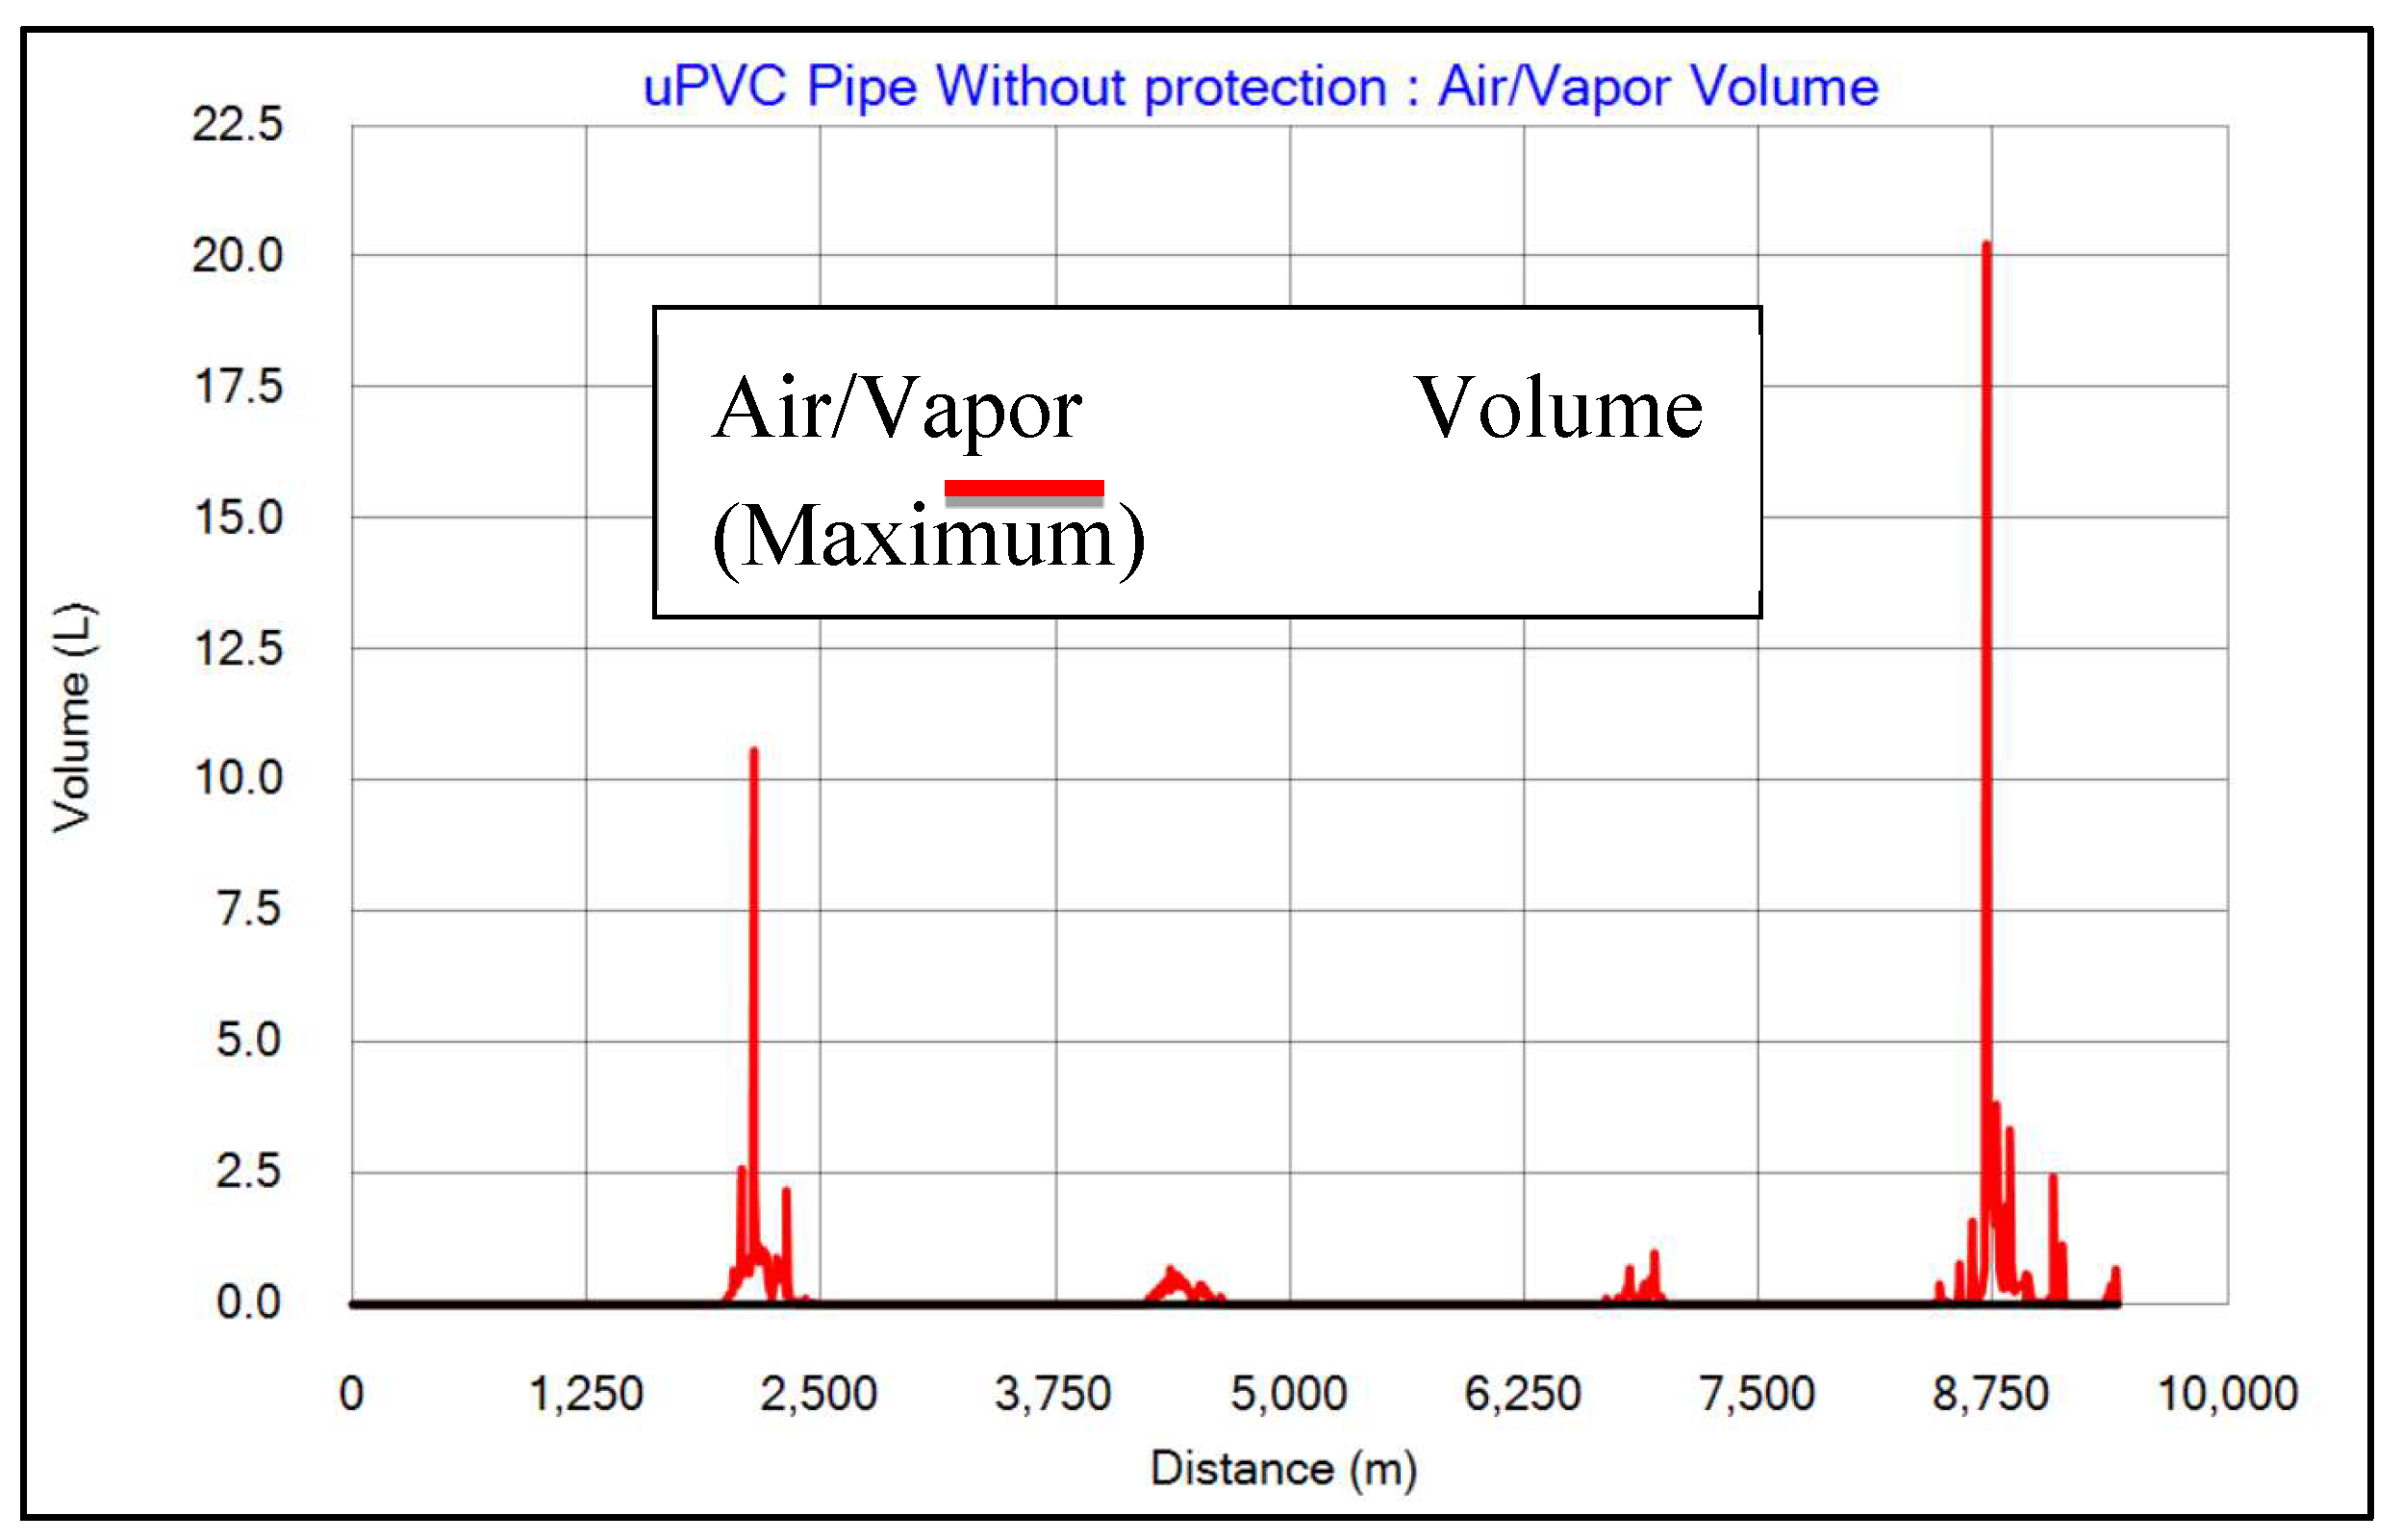
Figure 17 shows how the air vapor volume can be developed during a break in the water transmission pipeline without any protection methods. A high volume of air vapor, up to 21 liters, represents the column separation and cavitation occurrence at the critical points of the pipeline. The cavitation breaks the column of water, which later collapses due to the returning flow from the downstream collection chamber.
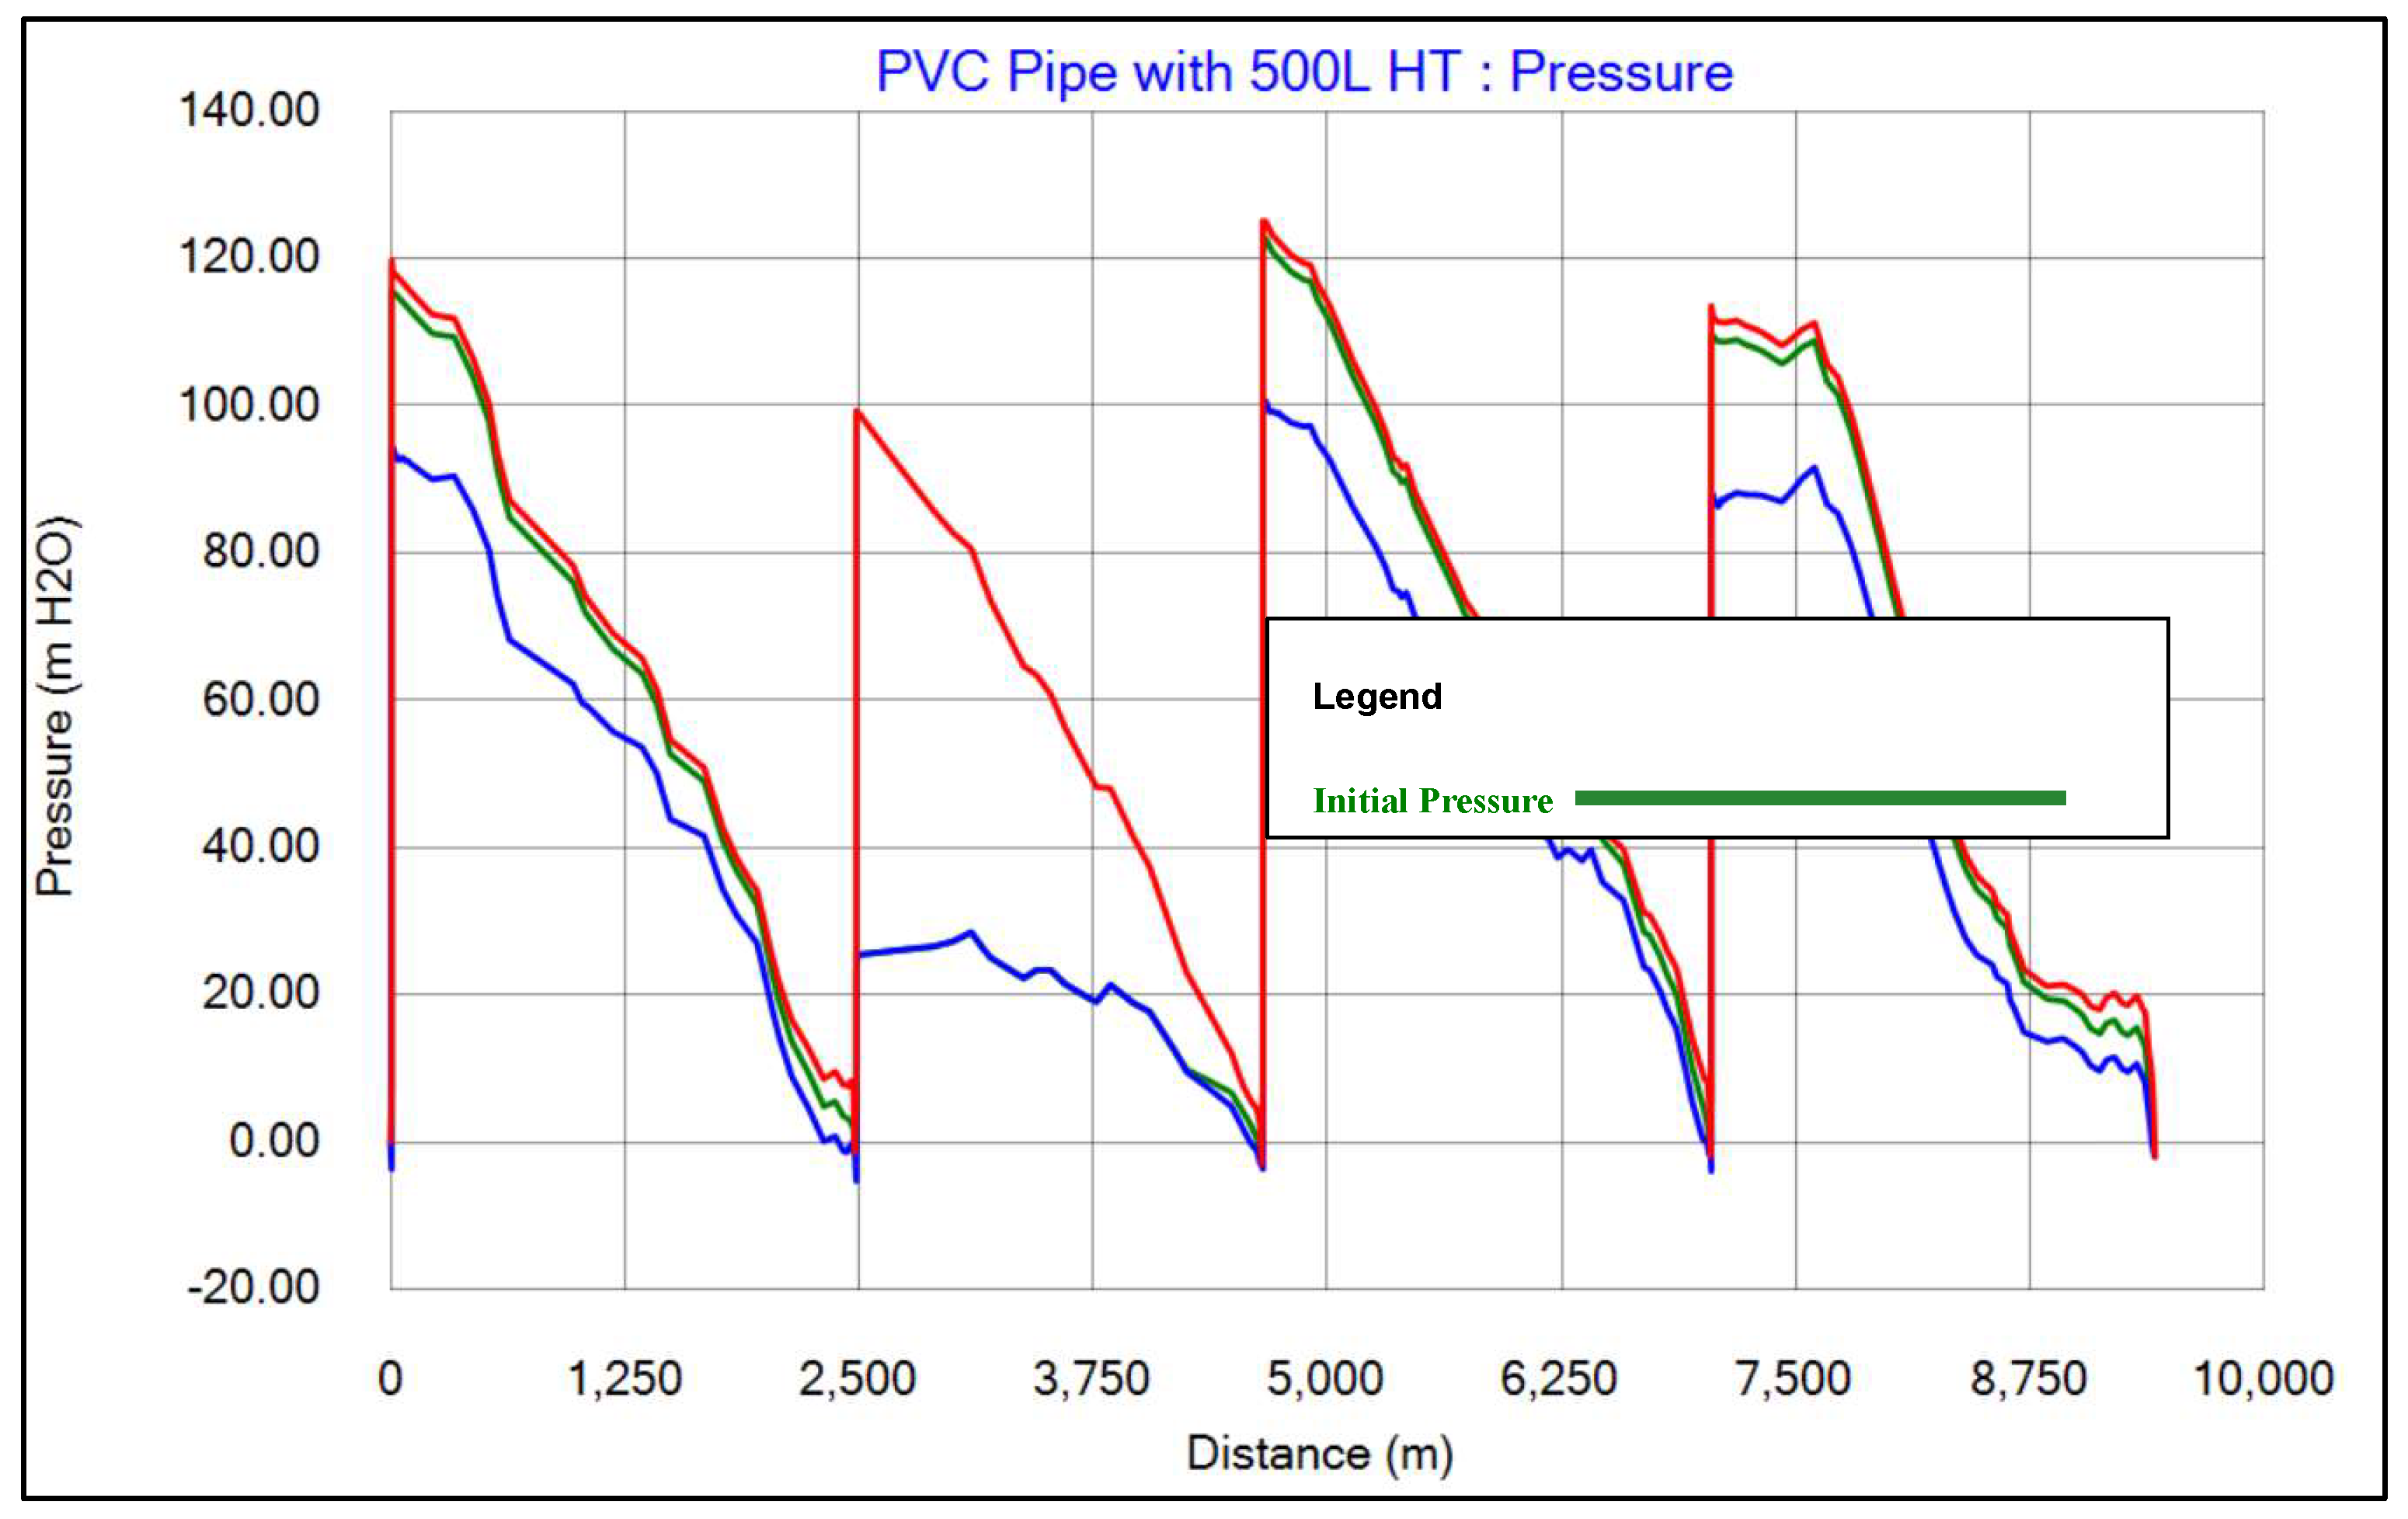
A subsequent analysis was conducted by adding a 500-liter surge protection hydro pneumatic tank at the pump station, resulting in improved system performance, as shown in
Figure 18 and
Figure 19.
3. Case-3 HDPE pipe System
The pipeline system had undergone reconfiguration, now with an HDPE pipe as the material type; all other configurations remained the same. Again, the number of pipes, nodes, length, volume flow rate, and diameter of the pipe remained at their values. The adopted wave speed value for this analysis is calculated to be 273.89 m/s. The results that came from the configuration of the HDPE pipe are presented graphically below:
Hydraulic Grade:
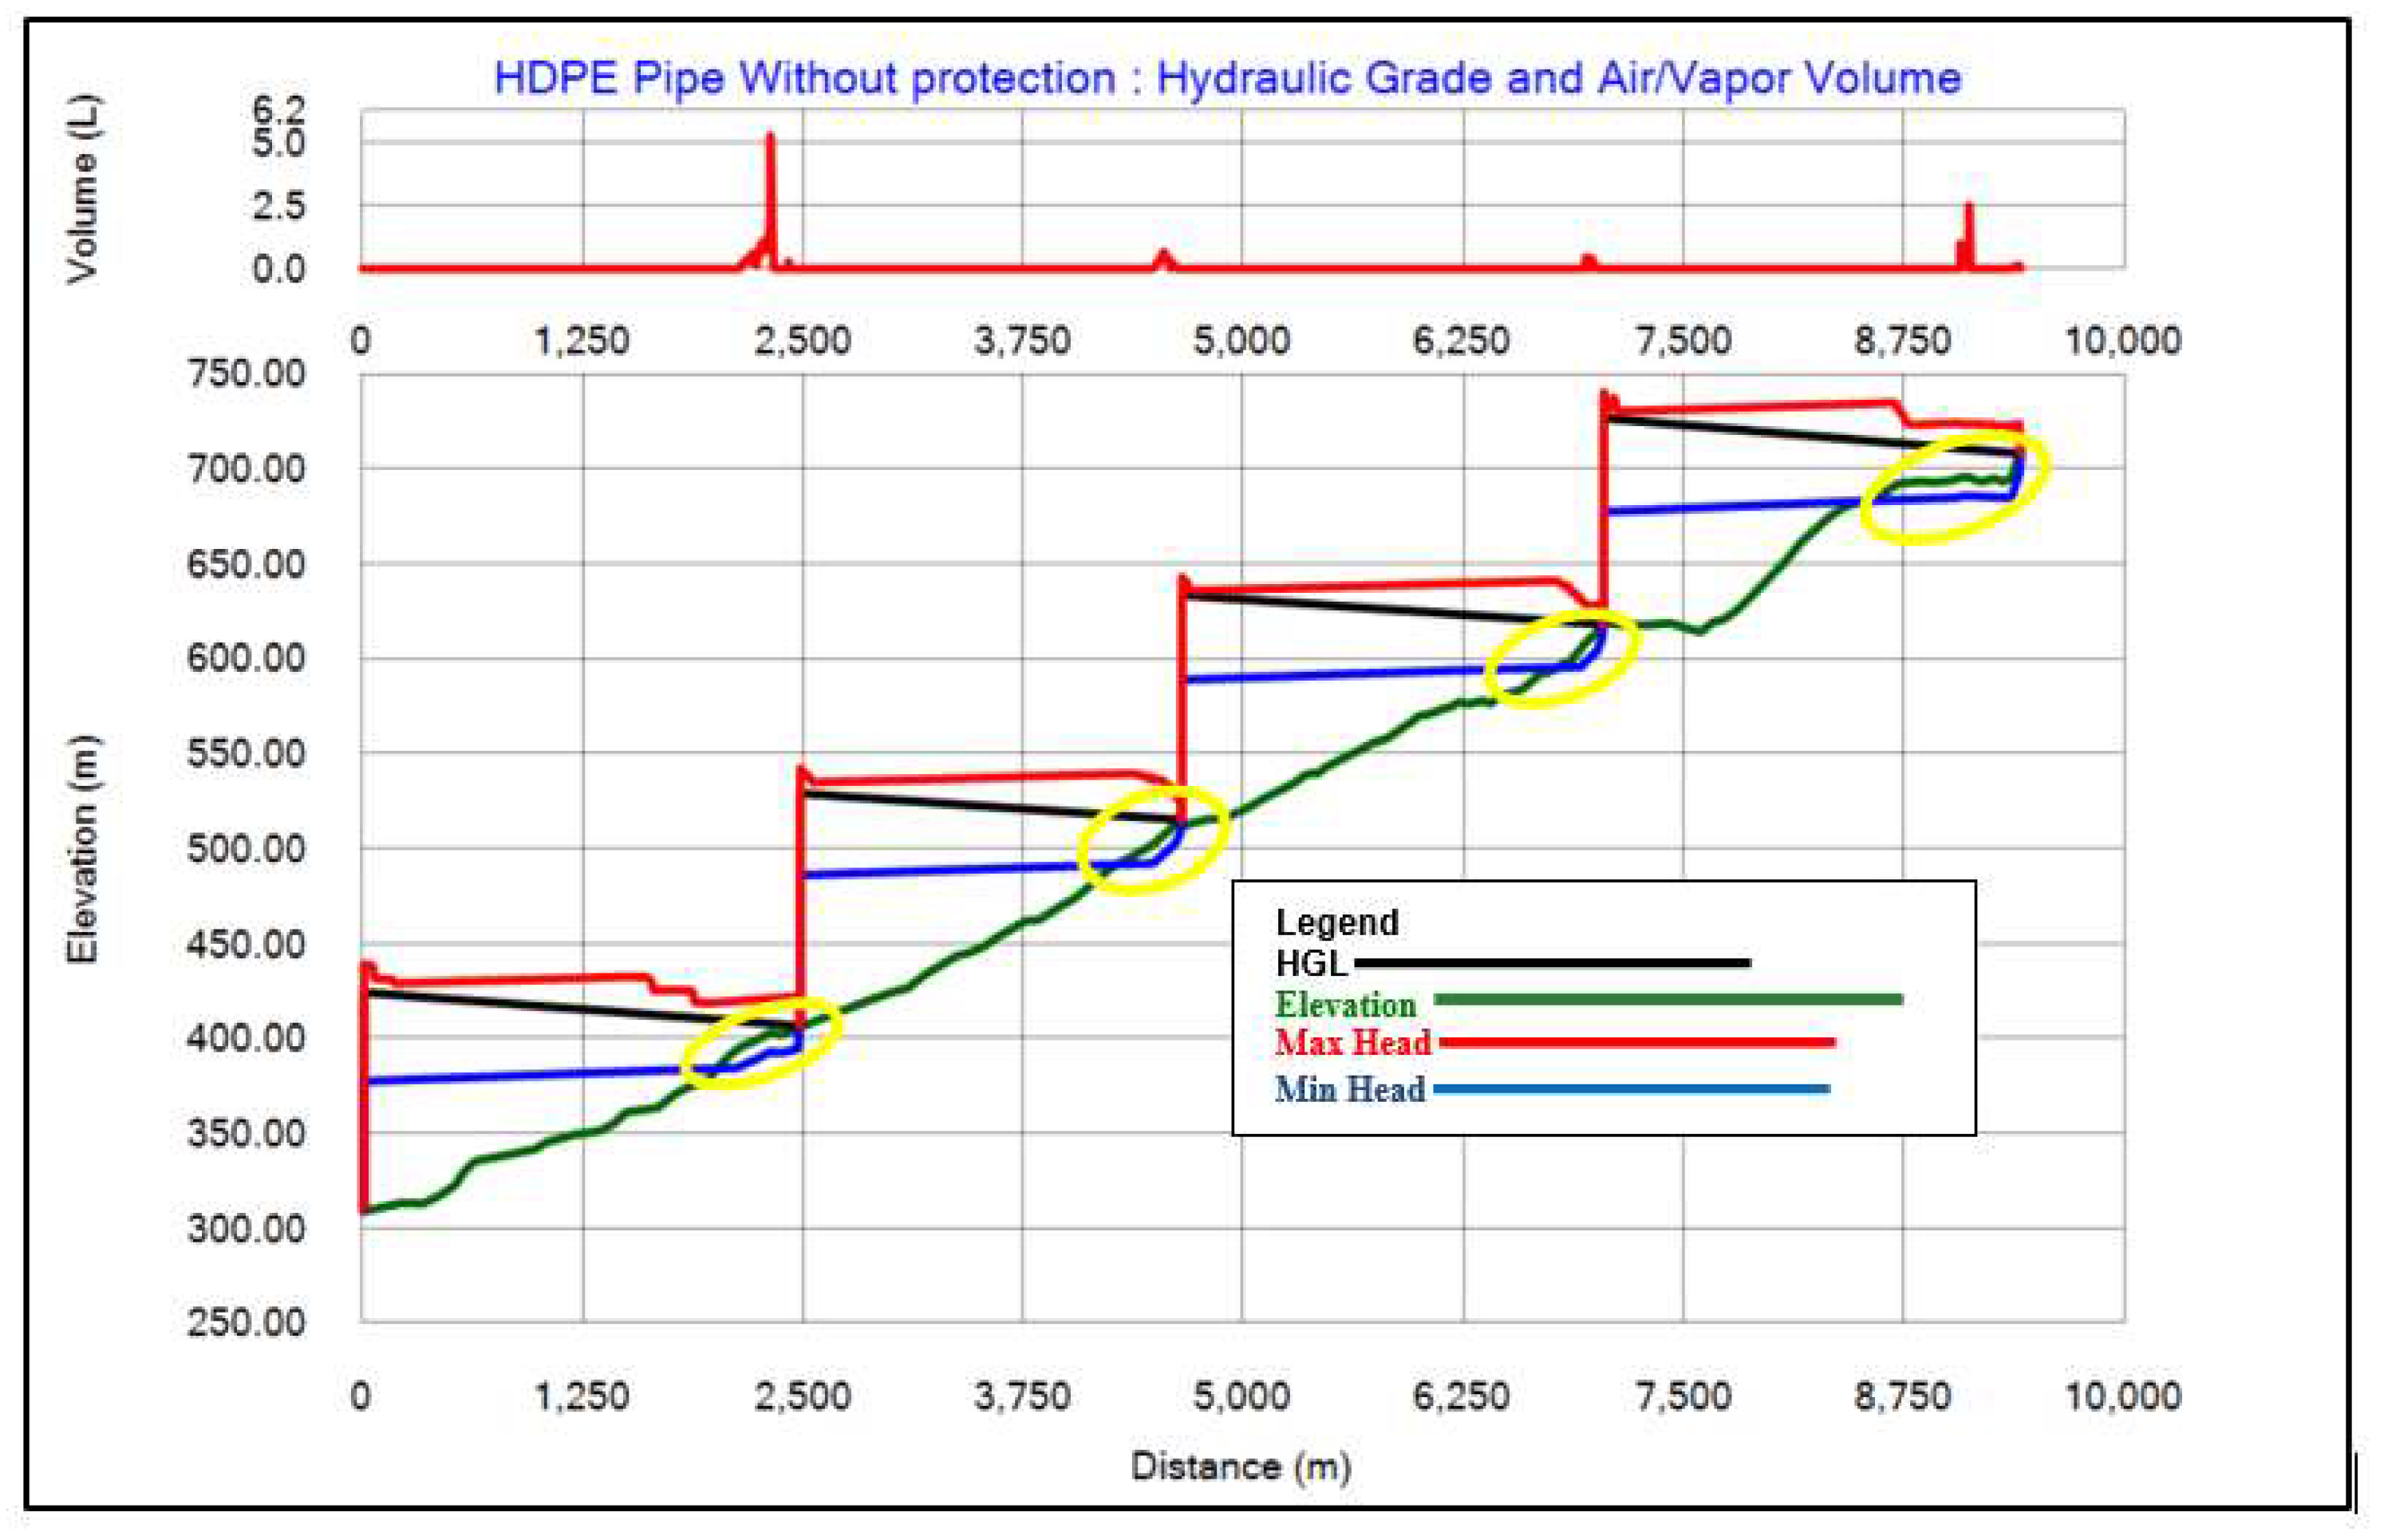
Figure 20 presents the air content and head envelope of the pipeline at all computing nodes in case of fault-induced stoppage of the pump. As observed, maximum heads are always maintained within tolerable limits. Only a few localized cases of negative pressures, represented by the yellow color, are recorded for a short time near the end of the pipe. It thus means that the column separation/cavitation had occurred, but in comparison with the DCI and uPVC pipe systems, the risk is low.
Pressure:
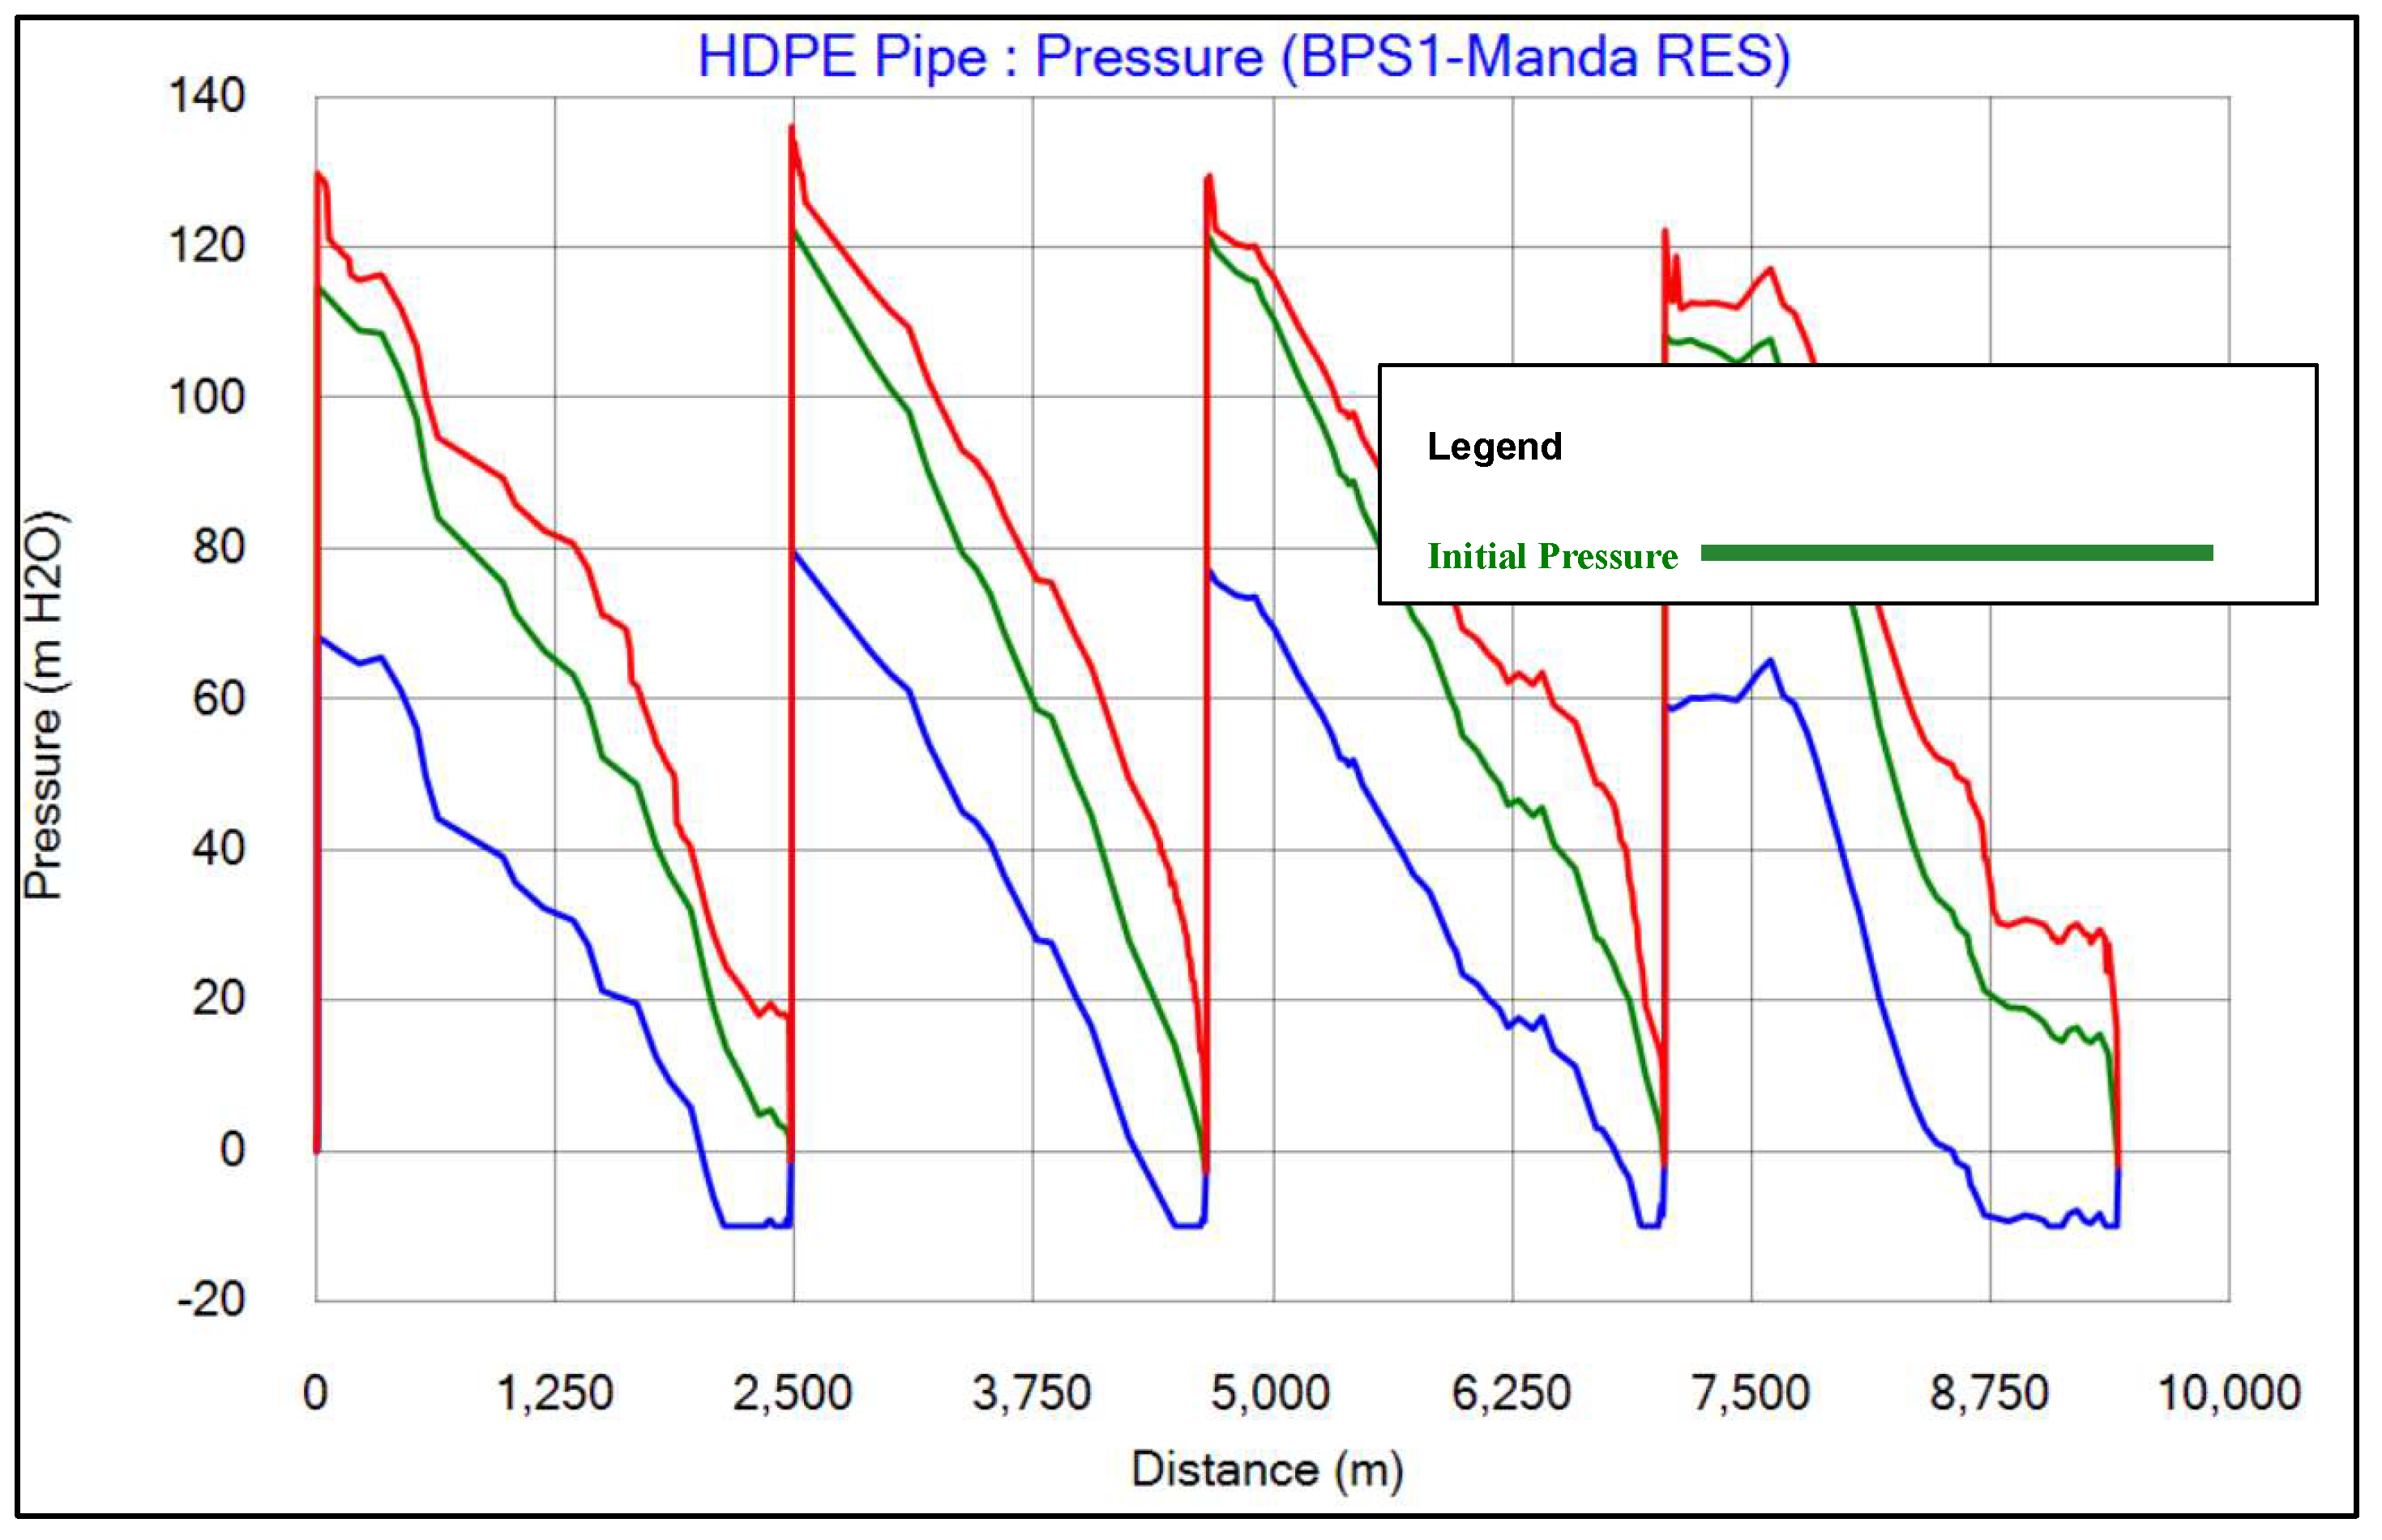
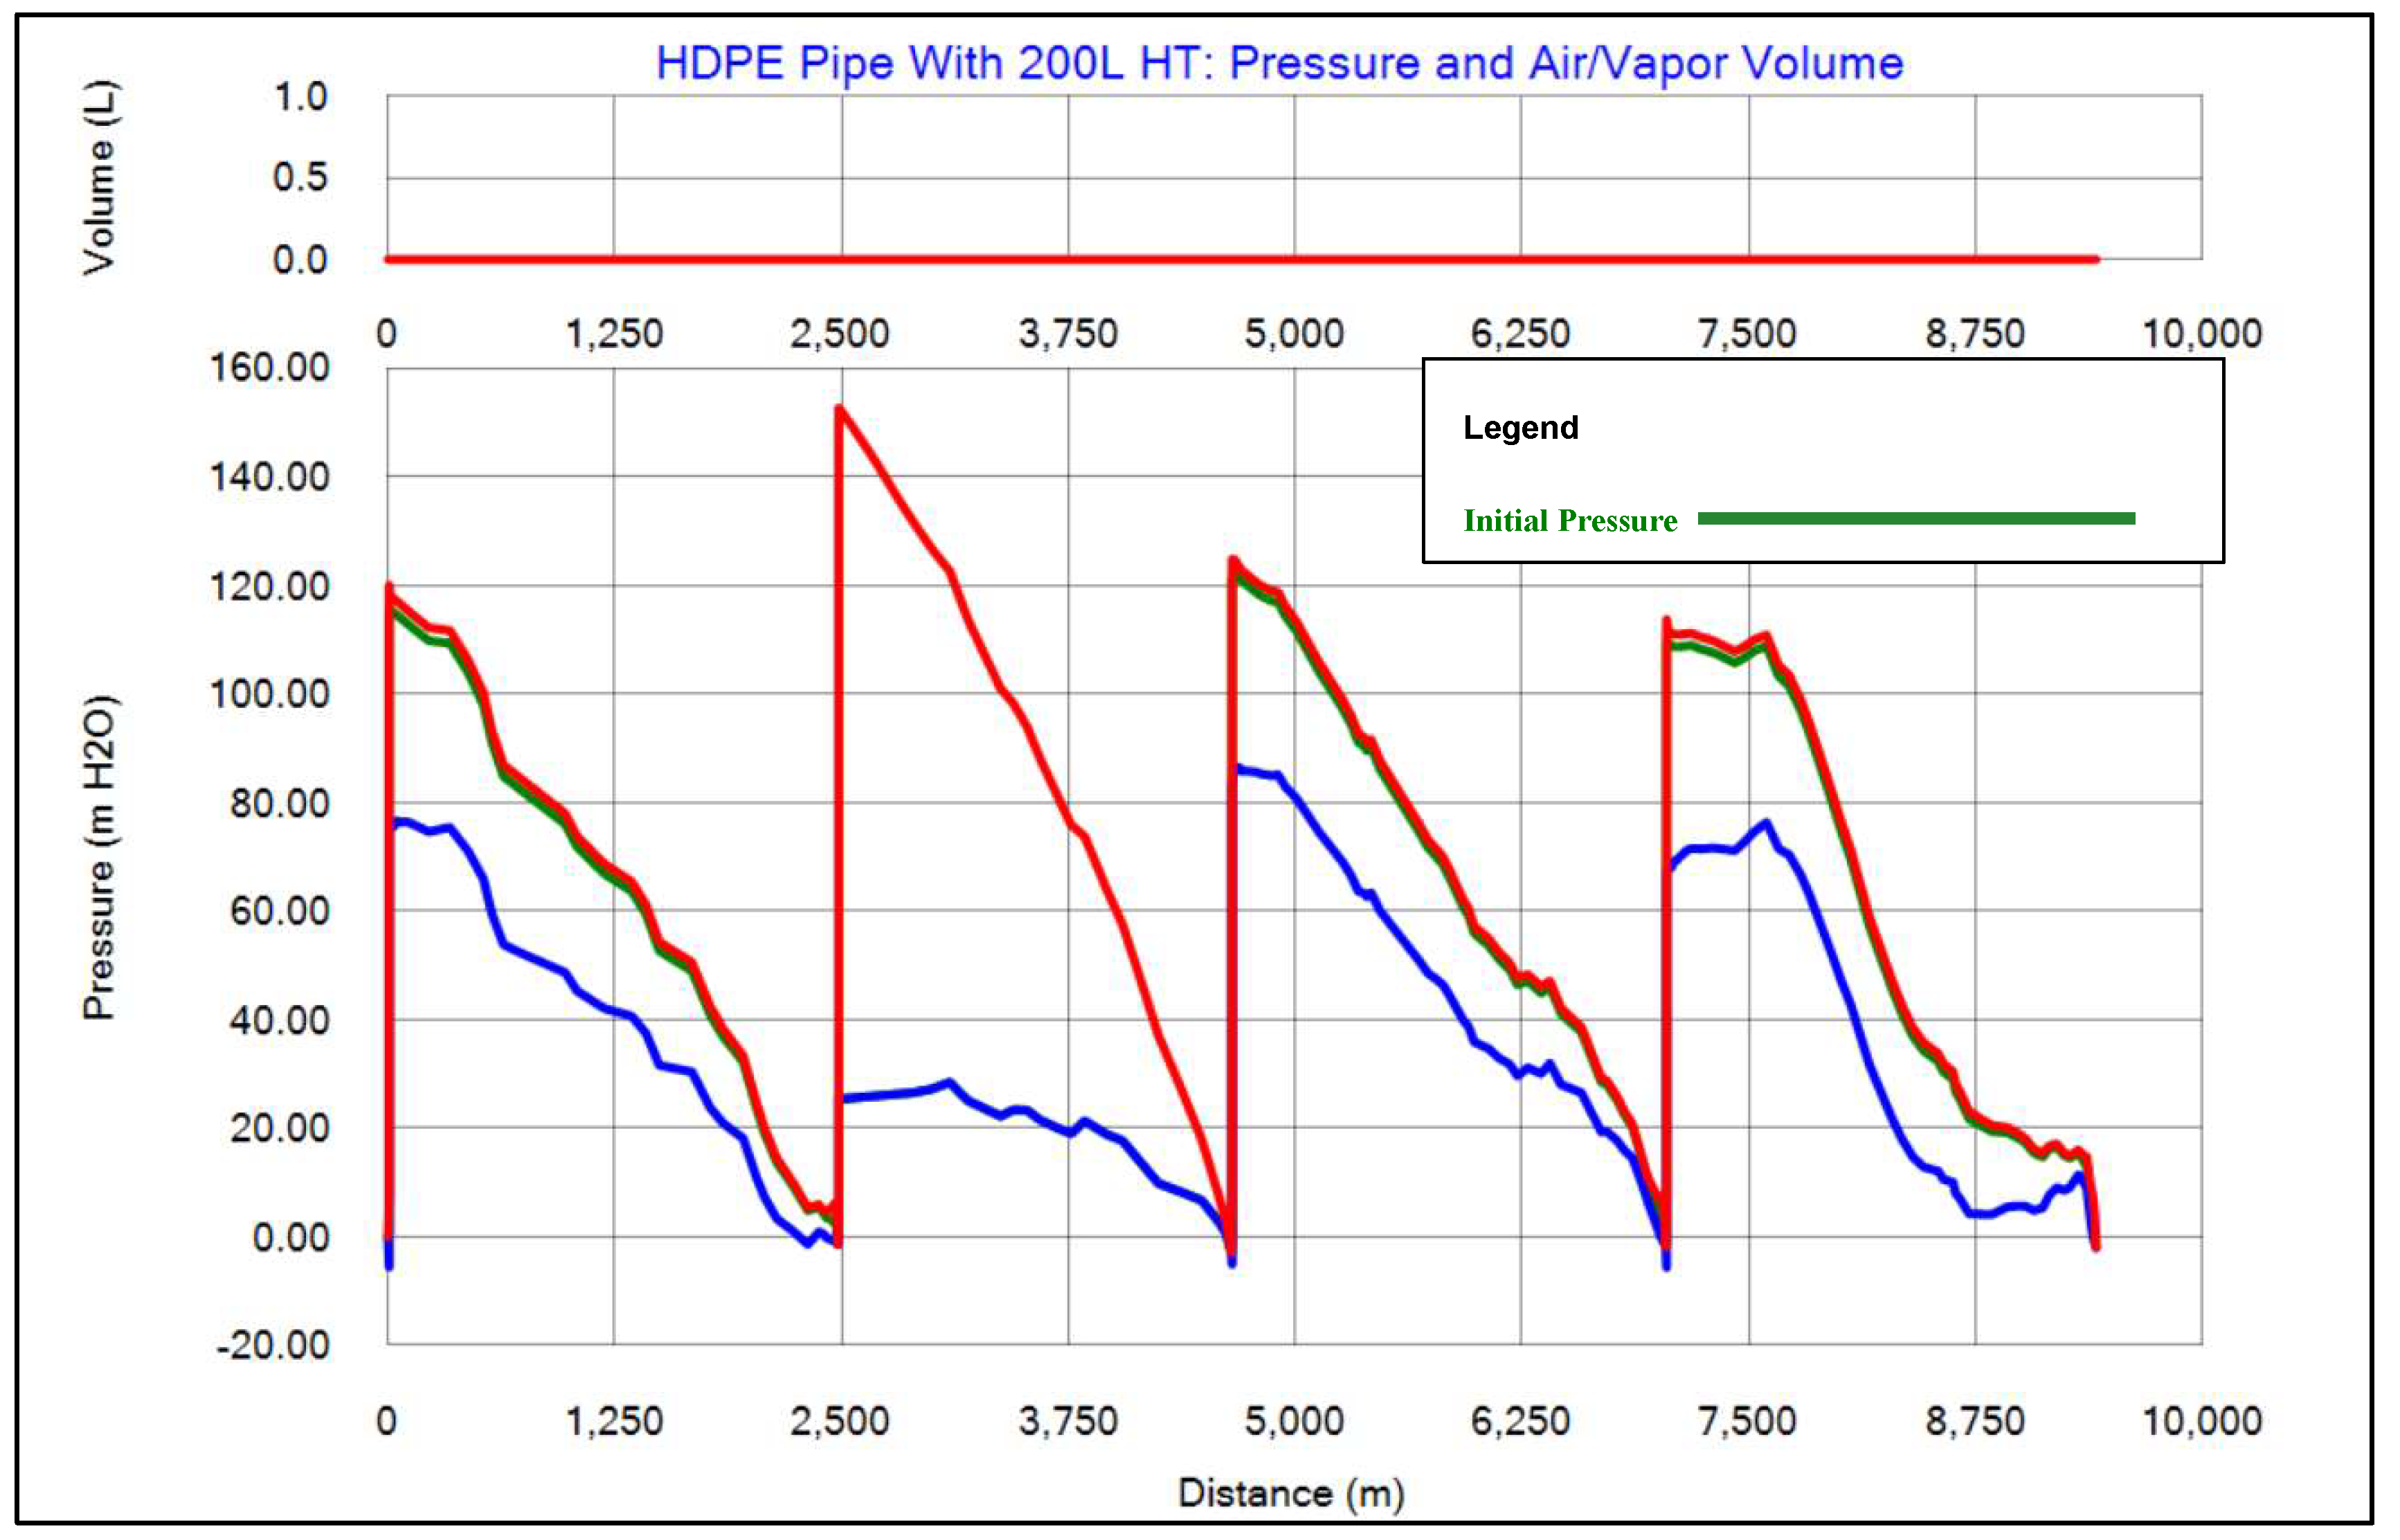
Figure 21 depicts a high reduction in maximum pressure, as shown by the red line; its maximum value is at the outlet section and is considered to be 130m. It was expected that the maximum pressure during the operation of this pipe should not be more than 160m or 16 bars, which is less when compared to being viewed on all sections of the pipe. These figures indicate that smaller hydro-pneumatic tanks would be required to protect against the magnitude of negative pressures experienced at the end of each pipeline section if it were desirable to reduce more minor surge pressures.
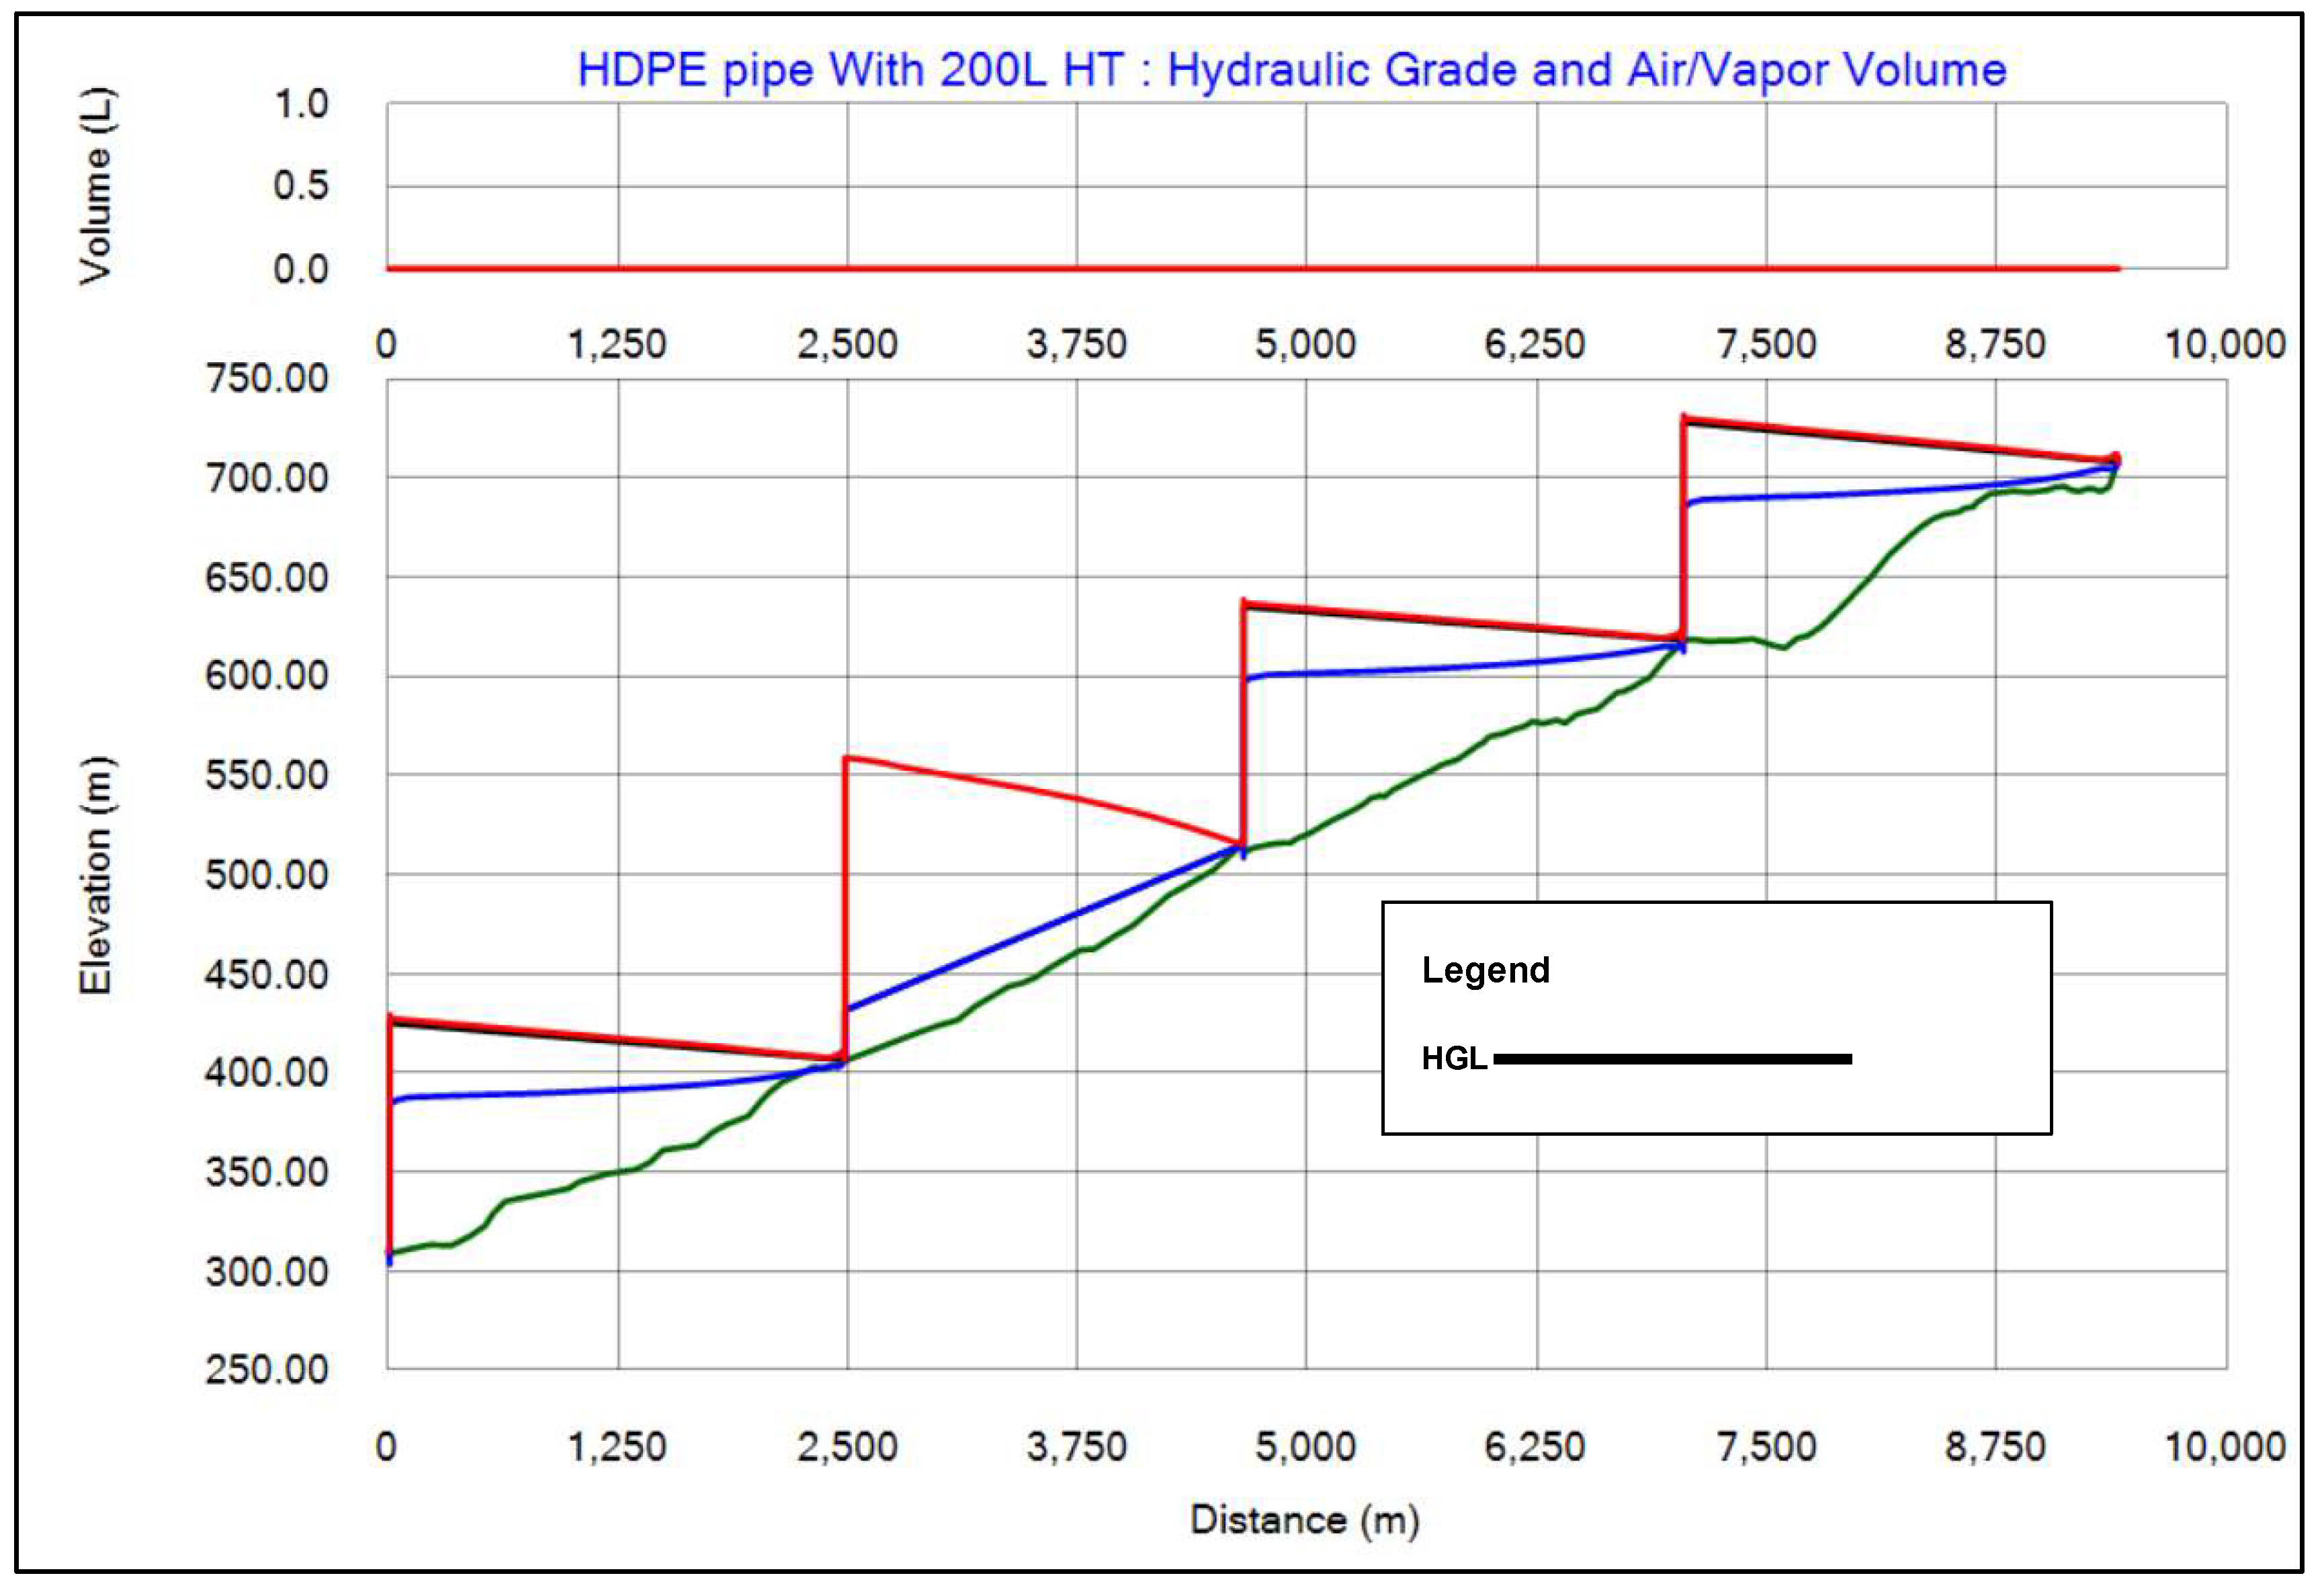
Therefore, the surge vessel at the pumping station is necessary to keep the minimum pressure envelope within the acceptable limits. In view of this, a supplementary analysis was performed which involved the breaking of the addition of a 200-liter volume surge protection hydro-pneumatic tank installed at the endpoint of the pump within the system. The outcome of the analysis is as depicted in
Figure 22 and
Figure 23.
3.3.2. Scenario 3b: The Effect of Changing Pipe Diameter
The choice of pipe diameter, on the other hand, can be effectively executed at a design stage; transient effects, therefore, show a great influence on the velocity of flow and hence give resultant pressure generated at times of a water hammer. This influence seems apparent on pump pipeline junctions and is usually considered as critical spots in any conveyance pipeline system(Emadi & Solemani, 2011).
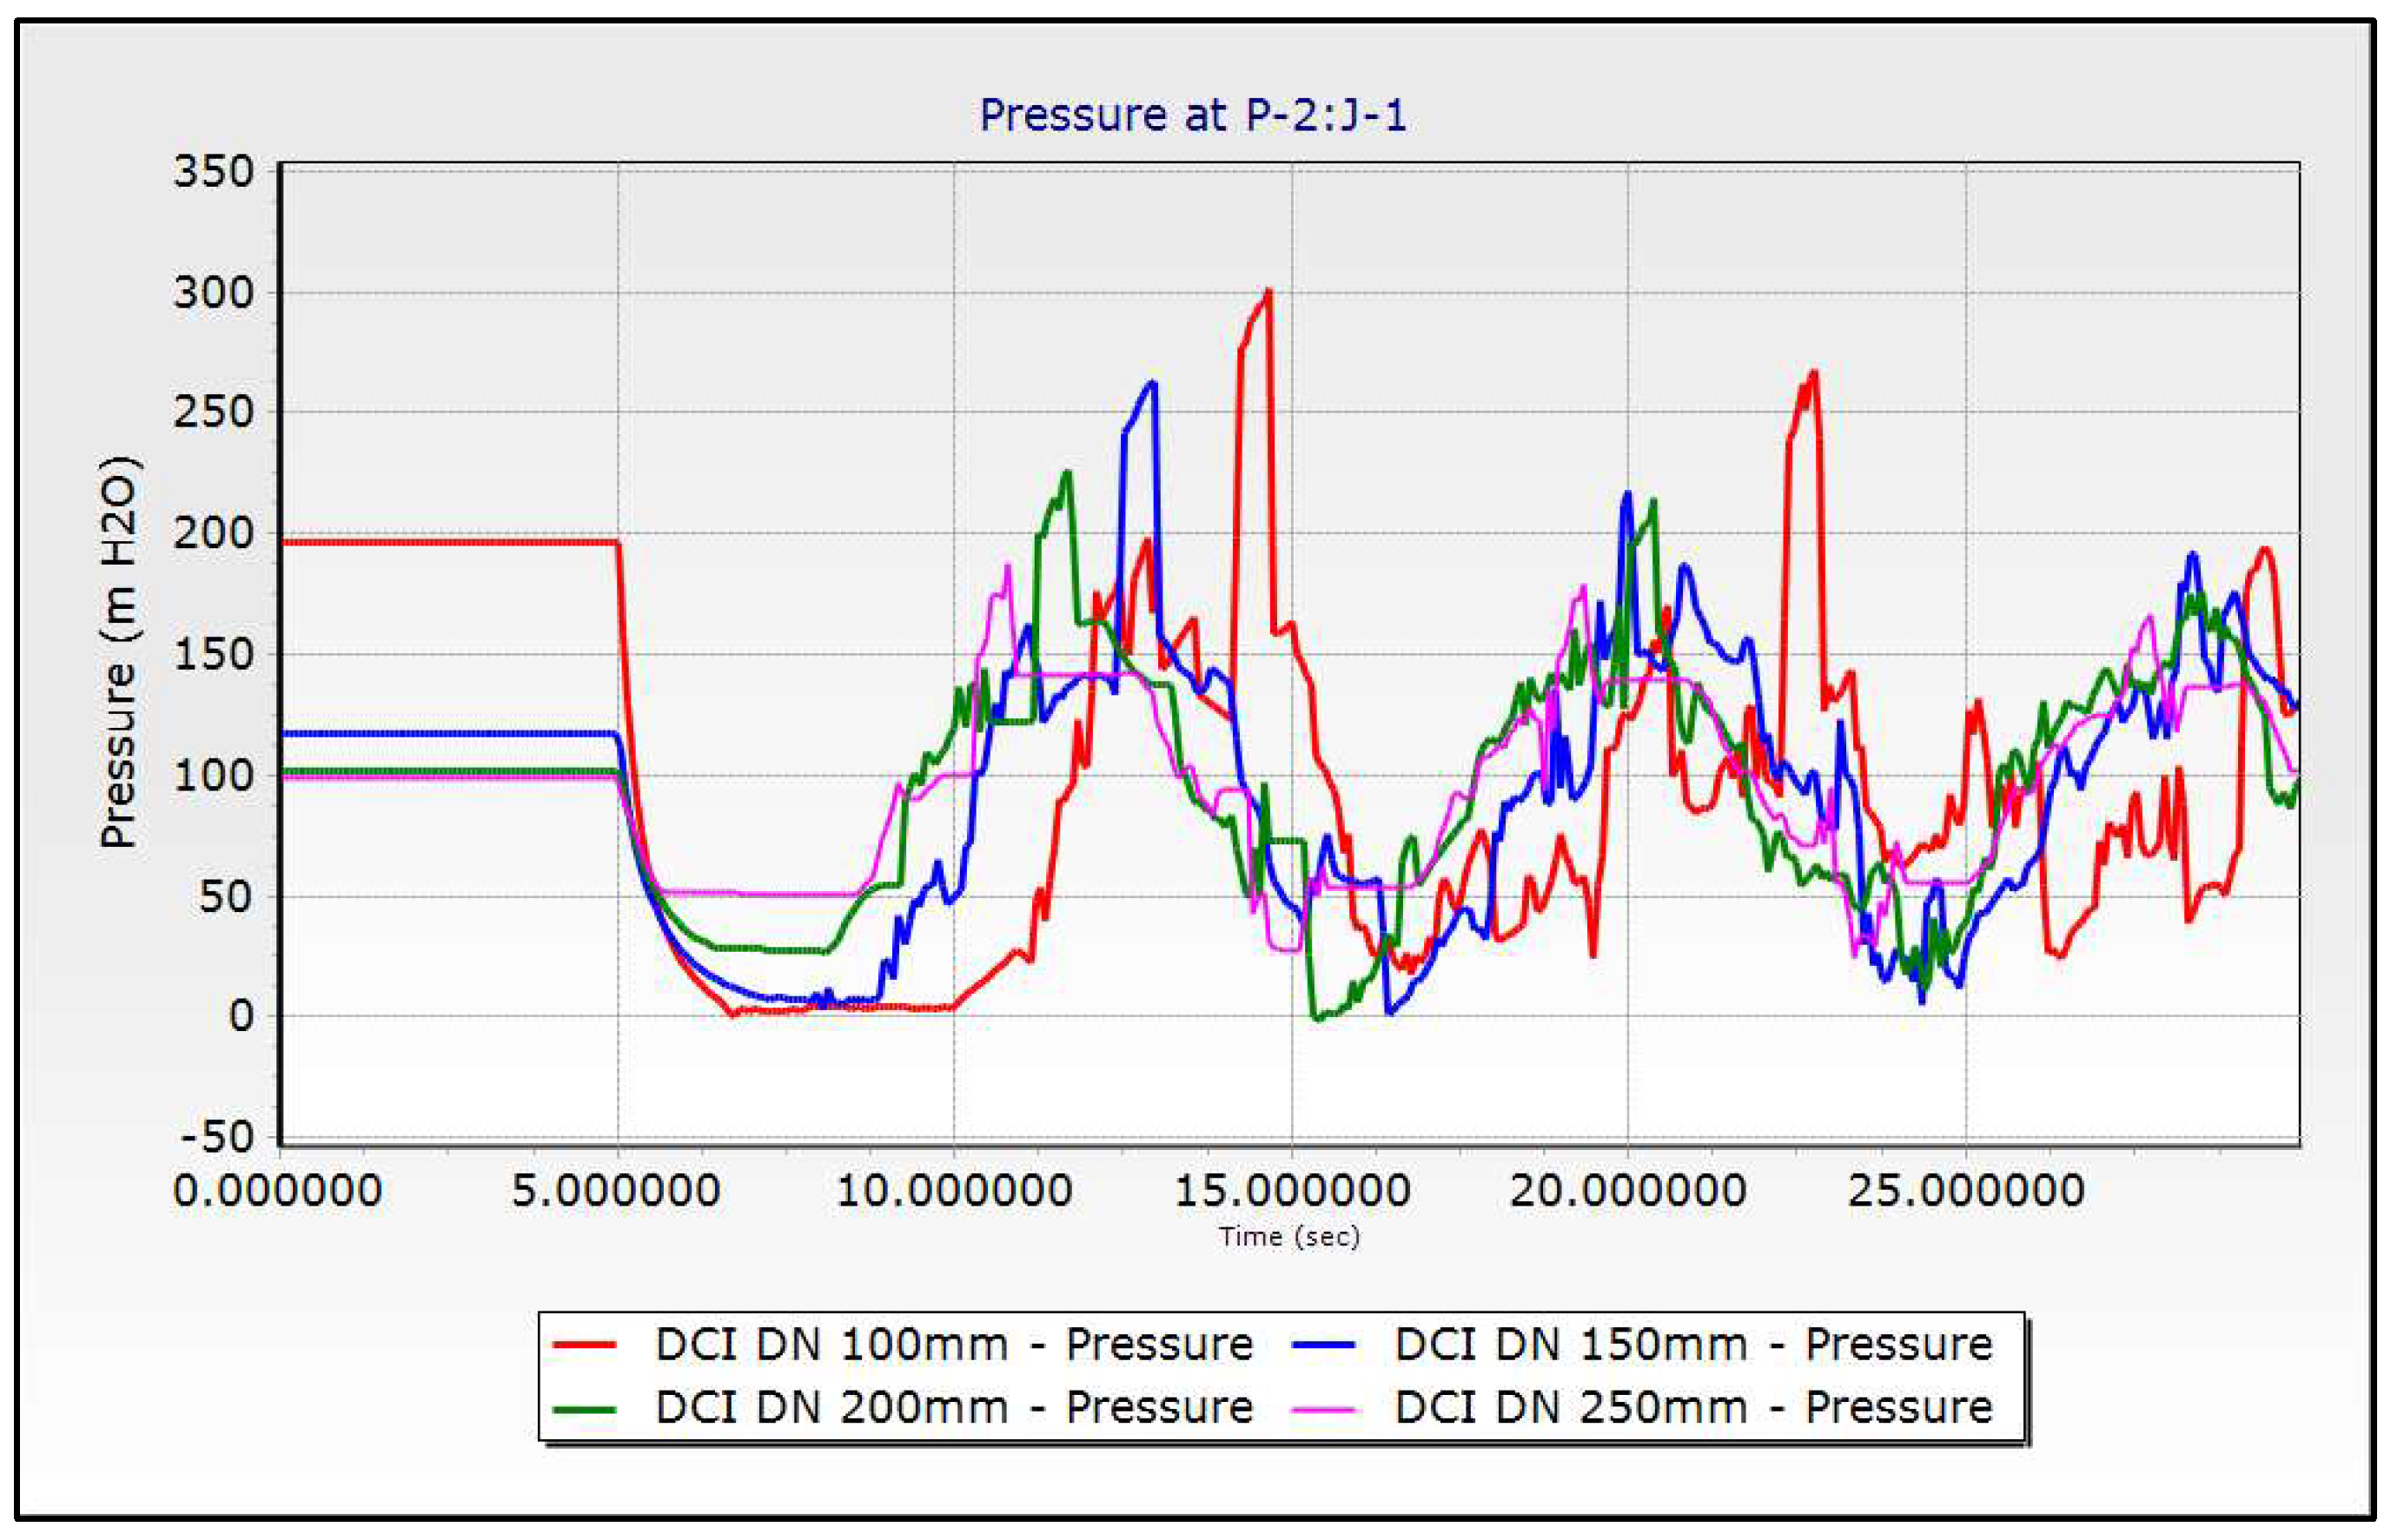
His aim of this scenario is to study further the effects of a change in pipe diameter on the minimum and maximum pressures developed by pressure surges in the pipe that is, the effect of reducing and increasing the diameter. In doing this, four different pipe diameters will be used to report the variance in results: 100mm, 150mm, 200mm, and 250mm, while the pipe material and the rates of flow are always constant. It should be noted that the changes in pump head had been made to meet the design requirements at the reservoir and reduced the flow due to increased friction loss mainly. Results from modeling of the pipeline with different diameters are shown below in
Table 4.
Table 4 summarizes the results of the analysis with respect to the effects of pipe diameter on wave velocity and maximum water hammer pressure: Max +WHP. With the reduction in the pipe diameter from 150 mm to 100 mm, it is observed that the wave velocity will increase slightly from 1283.68 to 1327.83 m/s. This effect, in turn, increases the maximum water hammer pressure from 286 m to 308 m.
On the other hand, when the diameter of the pipe is increased to 200 mm from 150 mm, there is a corresponding decrease in wave velocity from 1283.68 m/s to 1251 and maximum water hammer pressure from 286 m to 238 m. Further increase in diameter to 250 mm REDUCES wave velocities to 1228.24 m/s and maximum water hammer pressures to 198 m.
The results clearly indicated one consistent trend: an increase in pipe diameter by 50 mm will always result in a decrease of approximately 37m in maximum water hammer pressure. This shows a linearity relationship regarding the reduction in the water hammer effect with changing pipe diameters.
Figure 24 shows three different curves, each of them with a different color; this was done in such a way that the oscillations for the pressure during the water hammer in the analyzed system for each one of the internal diameters studied can be clearly observed.
4. Conclusions
In The present study of the SMD multi-village water supply schemes is comprehensive and returns valuable experience regarding water hammer effects and mitigation measures. Several important risks have been brought out, existing without protective measures in the water supply system, including scenarios of water column separation and pipe damage. This has been considered one of the efficient ways of controlling hammering by placing the 2000-liter hydro pneumatic tanks as close to the pumping stations as possible. As the strati-graphic placement of the tanks reduced the pressure and minimized cavitation, it enhanced the safety and performance features of a system to a great extent.
The research has further investigated the influence of pipe diameter and material on water hammer effects. The results indicate that larger pipe diameters should diminish the pressures developed due to water hammer, improving the stability of the system. It is, however, appreciated that in many instances, pipes of different materials or diameters might not be a viable solution because of existing infrastructure and environmental conditions.
The optimized emplacement of 2000-liter hydro pneumatic tanks at each pumping station has become a quite practical and very effective solution to mitigate the effects of hammering on the system, ensuring system stability and reducing maintenance costs along the way.
It has come out as being very resourceful research in offering valuable insight into the resilience and effectiveness of water supply systems. This means that these infrastructures need very key attention, protective measures, good design practices, and a call for proper follow-up and maintenance into the future to secure their integrity.
Acknowledgments
The authors wish to extend their appreciation to the Afar Region Water and Energy Bureau for the necessary data provision that helped a lot in developing this manuscript.
Declaration of competing interest
The authors hereby state that they have no known competing financial interests or personal relationships that could have appeared to influence in the work.
References
- Abozaid, G.; Mohammed, H.I.; Hassan, I. Studying of Waterhammer Phenomenon Caused By Sudden Variation of Water Demand At Water 1- Introduction. 2012, 40, 353–366. [Google Scholar]
- Arefi, M.H.; Ghaeini-Hessaroeyeh, M.; Memarzadeh, R. Numerical modeling of water hammer in long water transmission pipeline. Applied Water Science 2021, 11, 1–10. [Google Scholar] [CrossRef]
- Boulos, P.F.; Karney, B.W.; Wood, D.J.; Lingireddy, S. Hydraulic transient guidelines for protecting water distribution systems. Journal / American Water Works Association 2005, 97, 111–124. [Google Scholar] [CrossRef]
- Choon, T.W.; Aik, L.K.; Aik, L.E.; Hin, T.T. Investigation of Water Hammer Effect Through Pipeline System. International Journal on Advanced Science, Engineering and Information Technology 2012, 2(3), 246. [Google Scholar] [CrossRef]
- El-turki, A.; Grigg, N.; Wohl, E. Modeling of Hydraulic Transients in Closed Conduits. MS Thesis, University of Fort Collins, Colorado, USA, 2013. [Google Scholar]
- Emadi, J.; Solemani, A. Maximum water hammer sensitivity analysis. World Academy of Science, Engineering and Technology 2011, 73(1), 416–419. [Google Scholar]
- Huo, J., Eckmann, D. H., & Morris, K. (2010). Surge protections: Modeling vs. design vs. construction. American Water Works Association Annual Conference and Exposition 2010, ACE 2010, Papers, December, 42–48.
- Kim, S.H.; Asce, M. Impulse Response Method for Pipeline Systems Equipped with Water Hammer Protection Devices. 2008, 134, 961–969. [Google Scholar] [CrossRef]
- Kumar Patel, A. Experimental Study of Water Hammer Pressure in a Commercial Pipe. IOSR Journal of Mechanical and Civil Engineering 2016, 03, 16–21. [Google Scholar] [CrossRef]
- Nikodijevic, M.; Stamenković, Ž.; Petrović, J.; Kocić, M. Valve Selection for the Purpose of Reducing the Water Hammer Effect in a Pressurized Pipeline. Facta Universitatis, Series: Working and Living Environmental Protection 2019, 15, 217. [Google Scholar] [CrossRef]
- Ramos, H.; Covas, D.; Borga, A.; Loureiro, D. Surge damping analysis in pipe systems: Modelling and experiments. Journal of Hydraulic Research 2004, 42, 413–425. [Google Scholar] [CrossRef]
- Rayan, R. A.-, Safwat, M., Djebedjian, B., & Management, P. (2008). Optimization of Water Distribution Systems Subjected to Water Hammer Using Genetic Algorithms Thesis Submitted in Partial Fulfillment of Requirements for the Master Degree in Mecha ... Optimization of Water Distribution Systems Subjected to Water Hammer U. June 2014.
- Water, T. I., & Conference, T. (2019a). Influence of Water Pipe Network Material on Water Hammer Surge Wave Zidan , Ahmed Abdel Razik Path line Pipeline Bosat / El-Mansoura Bosat / Menyet El- Nasr Bosat / Dekerns Bosat / El-Mansoura Bosat / Dekerns Bosat / Damietta Type Ductile Iron Cast Iron C. September, 12–13.
- Water, T. I., & Conference, T. (2019b). Influence of Water Pipe Network Material on Water Hammer Surge Wave Zidan , Ahmed Abdel Razik Path line Pipeline Bosat / El-Mansoura Bosat / Menyet El- Nasr Bosat / Dekerns Bosat / El-Mansoura Bosat / Dekerns Bosat / Damietta Type Ductile Iron Cast Iron Cast Iron Cast Iron P . V . C Cast Iron Diameter ( mm ) Length ( km .). September, 12–13.
Figure 3.
Methodology flowchart.
Figure 3.
Methodology flowchart.
Figure 4.
Comprehensive overview of pipeline elevations and hydraulic gradient line (HGL) under steady-state conditions along the entire pipeline.
Figure 4.
Comprehensive overview of pipeline elevations and hydraulic gradient line (HGL) under steady-state conditions along the entire pipeline.
Figure 5.
Pressure under steady-state condition ( section I-IV).
Figure 5.
Pressure under steady-state condition ( section I-IV).
Figure 6.
The pressure in the pipeline with time due to power failure without Protection.
Figure 6.
The pressure in the pipeline with time due to power failure without Protection.
Figure 7.
Hydraulic grade (max, min and initial) and elevations on the entire pipeline without any protection.
Figure 7.
Hydraulic grade (max, min and initial) and elevations on the entire pipeline without any protection.
Figure 8.
Pressures (max, min and initial) without protection (BPS1-BPS2).
Figure 8.
Pressures (max, min and initial) without protection (BPS1-BPS2).
Figure 9.
Air vapor volume along water pipeline transmission without protection (BPS4-Mand Reservoir).
Figure 9.
Air vapor volume along water pipeline transmission without protection (BPS4-Mand Reservoir).
Figure 10.
Pressures max, min, and initial for transient-state under the protection.
Figure 10.
Pressures max, min, and initial for transient-state under the protection.
Figure 11.
Hydraulic grade with protection on the entire length of the schemes.
Figure 11.
Hydraulic grade with protection on the entire length of the schemes.
Figure 12.
Comparation of presure with and without protection (BPS I-BPS II).
Figure 12.
Comparation of presure with and without protection (BPS I-BPS II).
Figure 13.
Comparation of flow rate with and without Protection (BPSI-BPSII).
Figure 13.
Comparation of flow rate with and without Protection (BPSI-BPSII).
Figure 14.
Comparison of HGL with and without protection (BPS I-BPS II).
Figure 14.
Comparison of HGL with and without protection (BPS I-BPS II).
Figure 15.
Hydraulic grade lines uPVC Pipe (without protection).
Figure 15.
Hydraulic grade lines uPVC Pipe (without protection).
Figure 16.
Pressures (max, min, and initial) -uPVC Pipe (without protection).
Figure 16.
Pressures (max, min, and initial) -uPVC Pipe (without protection).
Figure 17.
Cavitation volume -uPVC Pipe (without protection).
Figure 17.
Cavitation volume -uPVC Pipe (without protection).
Figure 18.
Hydraulic grade lines and Cavitation volume -uPVC Pipe ( 500L hydro pneumatic tank).
Figure 18.
Hydraulic grade lines and Cavitation volume -uPVC Pipe ( 500L hydro pneumatic tank).
Figure 19.
Pressure variations -uPVC Pipe (500L hydro pneumatic tank).
Figure 19.
Pressure variations -uPVC Pipe (500L hydro pneumatic tank).
Figure 20.
Hydraulic grade lines along the entire pipe length (HDPE Pipe without protection).
Figure 20.
Hydraulic grade lines along the entire pipe length (HDPE Pipe without protection).
Figure 21.
Pressure variations in HDPE pipeline (without protection).
Figure 21.
Pressure variations in HDPE pipeline (without protection).
Figure 22.
Pressure variations HDPE pipe( 200-liter hydro pneumatic tank.
Figure 22.
Pressure variations HDPE pipe( 200-liter hydro pneumatic tank.
Figure 23.
Hydraulic grade line HDPE Pipe (200L hydro pneumatic tank).
Figure 23.
Hydraulic grade line HDPE Pipe (200L hydro pneumatic tank).
Figure 24.
Pressure fluctuations with different value of pipe diameter.
Figure 24.
Pressure fluctuations with different value of pipe diameter.
Table 1.
Summary of effects of protective measures on water hammer parameters.
Table 1.
Summary of effects of protective measures on water hammer parameters.
| Parameter |
Without Protection |
With hydro pneumatic Tank |
| Minimum Head (mH₂O) |
Lower than pipe elevation level |
Increase |
| Minimum Pressure (mH₂O ) |
Lower than permissible level |
Increase |
| Maximum Head (mH₂O) |
Far away from Steady State HGL |
Decrease |
| Maximum pressure (mH₂O) |
Higher than workable pressure levels |
Decrease |
| Maximum volume of Air (liters) |
Significant generation |
Reduced |
Table 2.
Comparison of Maximum pressures with and without Protection.
Table 2.
Comparison of Maximum pressures with and without Protection.
| Pipeline Section |
Without Protection (mH₂O) |
With Hydro Pneumatic Tank (mH₂O) |
| BPSI-BPSII |
288.27 |
121.38 |
| BPS II-BPS III |
266.16 |
150.49 |
| BPS III-BPS IV |
280.43 |
133.68 |
| BPS IV-Manda Reservoir |
308.93 |
121.54 |
Table 3.
Pipe material and its respective wave speed to the analyzed the system.
Table 3.
Pipe material and its respective wave speed to the analyzed the system.
| Case |
Pipe Material |
Wave Speed (m/s) |
| 1st |
DCI |
1283.68 |
| 2nd |
uPVC |
449.37 |
| 3rd |
HDPE |
273.89 |
Table 4.
Wave Speed and maximum water hammer with variation in pipe diameter.
Table 4.
Wave Speed and maximum water hammer with variation in pipe diameter.
| Case |
Pipe Diameter (mm) |
Wave Velocity (m/s) |
Max+WHP(m) |
Change in +WHP(m) |
| 1st |
100 |
1327.83 |
308 |
|
| Existing |
150 |
1283.68 |
286 |
22 |
| 2nd |
200 |
1251 |
238 |
48 |
| 3rd |
250 |
1228.24 |
198 |
40 |
| |
|
Average |
|
37 |
|
Disclaimer/Publisher’s Note: The statements, opinions and data contained in all publications are solely those of the individual author(s) and contributor(s) and not of MDPI and/or the editor(s). MDPI and/or the editor(s) disclaim responsibility for any injury to people or property resulting from any ideas, methods, instructions or products referred to in the content. |
© 2024 by the authors. Licensee MDPI, Basel, Switzerland. This article is an open access article distributed under the terms and conditions of the Creative Commons Attribution (CC BY) license (http://creativecommons.org/licenses/by/4.0/).

