1. Introduction
The phenomenon of percolation (from the Latin word percolatio – seepage) occurs in many materials, which can be referred to the group of composite materials. Initially, this phenomenon was studied in terms of the flow of gases or liquids through materials, containing capillaries [
1,
2,
3]. These are a kind of composites, consisting of a solid phase and free spaces in the form of capillaries, filled with air, another gas or liquid. One of the main directions of research on the phenomenon of percolation is theoretical studies, see, for example [
4,
5,
6,
7] and computer simulation [
8,
9,
10,
11]. Currently, the most widespread are simulation studies using the Monte Carlo method [
12,
13,
14]. So far, simulations of the percolation phenomenon have been performed in matrices with translational symmetry, such as square, triangular, honeycomb and many others [
15,
16,
17,
18,
19,
20,
21,
22,
23].
Experimental work on the flow of liquids or gases through materials containing capillaries is complicated enough for implementation and subsequent analysis. Therefore, this phenomenon began to be studied in composite materials by means of electric current flow [
24,
25,
26,
27,
28,
29]. For this purpose, composites were used in which the matrix are highly resistive materials, such as dielectrics or semiconductors. On the other hand, metallic inclusions are used as a dispersed phase, as a rule [
30,
31,
32,
33,
34]. Electrical testing involves gradually increasing the content of the dispersed phase and measuring the conductivity of the composite. Initially, the conductivity of the composite is very low, close to that of a dielectric matrix. Once a certain value of the dispersed phase concentration is reached, the conductivity begins to increase rapidly. This content is called the percolation threshold. The conductivity of the composite at this increases through the formation of a percolation channel, connecting contacts on opposite surfaces of the material. A channel of metallic conductivity is formed by the contacting of dispersed phase inclusions with each other [
35,
36,
37]. A further increase in the content of the dispersed phase increases the number of percolation channels and their thickness. This results in a rapid, much stronger than linear, increase in the conductivity of the composite as a function of metallic phase content [
38].
The most characteristic objects for studying percolation phenomena by electrical methods are metal-dielectric nanocomposites and the like [
38,
39,
40,
41]. According to documents [
42,
43] nanomaterials include objects whose dimensions in at least one direction are less than 100 nm. Observation of the percolation phenomenon in nanocomposites requires several conditions to be met simultaneously. First, there should be potential wells in the nanocomposites, which can be, for example, metallic phase nanoparticles, semiconductors or other inclusions that differ in electron structure from the matrix. Second, the distances between the potential wells must also be nanometer sized. This opens the possibility for the occurrence of the quantum mechanical phenomenon of electron tunneling between nano-inclusions [
44]. This kind of electron transfer is often referred to as hopping conductivity. In this case, electrons under the influence of an electric field do not move smoothly from electrode to electrode, as occurs in metals and semiconductors. After each tunneling (hop) between adjacent potential wells (nanowires), the electrons remain there for a certain time, called the relaxation time [
45]. After this time, another tunneling occurs. Thirdly, the electrical conductivity of the matrix in which the nano-objects are located should be many orders of magnitude lower than the conductivity associated with the tunneling phenomenon. Otherwise, the current, associated with the hopping conductivity, cannot be measured.
Methods involving the simultaneous sputtering of several different elements, or their compounds are now widely used to produce nanocomposites [
46,
47]. After their deposition on substrates, nanocomposites are formed. Due to the chemical composition, the deposited layers of nanocomposites have different adhesion to the substrate. Some of them have good adhesion to metals or semiconductors [
47,
48], while others have good adhesion to dielectrics [
46,
49]. Consequently, two different measurement schemes are used for hopping conductivity measurements in nanocomposite layers, as shown in
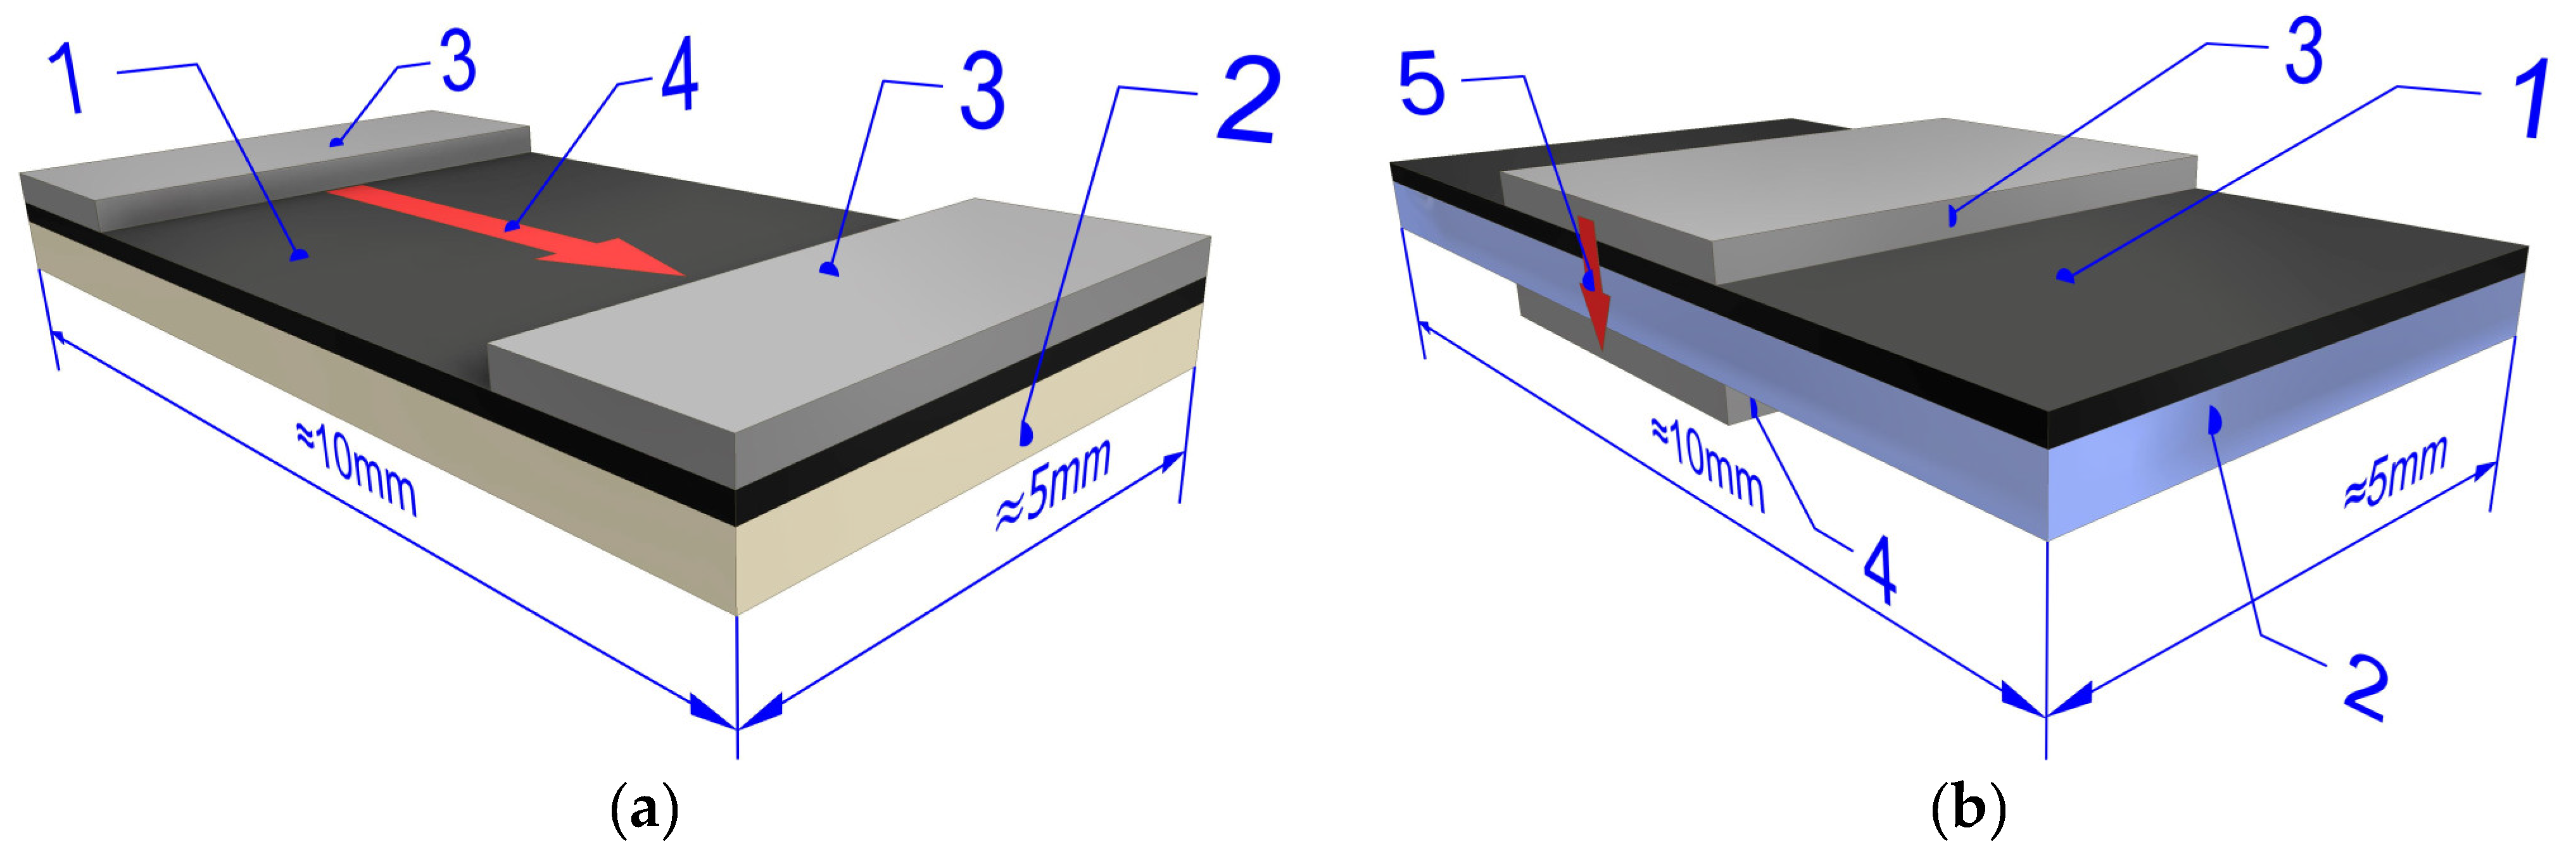
Figure 1. In the case of a layer on a dielectric substrate, measurements are used with current flow along the sample (
Figure 1a) [
46].
Applying a layer to a highly conductive substrate (metals or semiconductors) requires measurements to be made with current flow in the transverse direction (
Figure 1b) [
47]. In both cases, the cross-section of the layer is rectangular. In the case shown in
Figure 1a, the current flows along the layer. For the measurements in the scheme, shown in
Figure 1b – perpendicular to it. Considering the difference in the length of the layers, which is about 10 mm, and its thickness on the order of 1 μm, we see that the differences in the path of current flow, caused by hopping conductivity in the cases in
Figure 1a,b are about 10
4 times. A similar situation occurs in the case of studies of insulating cellulosic materials used in power transformers, conductivity in which takes place by electron tunneling [
45]. The thickness of the insulation paper is around 50 μm while the length is many centimeters. Also used in insulation, the pressboard has a thickness of approximately 0.5 mm, a length of several to tens of centimeters. Intuitively, it can be assumed that with an increase in inclusion content, it will be faster to create a percolation channel several orders of magnitude shorter across the layer (
Figure 1b), rather than about 10
4 times longer (
Figure 1a). To test such a hypothesis, an attempt of the Monte Carlo method was made to simulate the percolation phenomenon in rectangular matrices with a shape like the cross-sections of real nanocomposite layers, shown in
Figure 1. It should be noted that in our previous studies by the Monte Carlo simulation method [
50,
51] found that the average value of the percolation threshold for square-shaped matrices practically does not depend on the dimensions of the matrices and on the number of iterations starting from 5‧10
4 to 5‧10
6.
The purpose of this study was to determine, by Monte Carlo simulation, the effect of the shape of rectangular matrices on the average values of percolation thresholds and to determine the statistical parameters of percolation as a function of the quotient of the length to height of the matrices.
2. Materials and Methods
2.1. Test Method
To date, simulations of percolation phenomena in matrices with translational symmetry (square, triangular, honeycomb and others) [
15,
16,
17,
18,
19,
20,
21,
22,
23] have been performed for matrices with square shapes. The dimensions of a square can vary from tens to as many as 1000 units, corresponding to the distance between adjacent matrix nodes [
19,
20,
23]. In the case of square-shaped matrices, that due to the presence in them of a fourth axis of symmetry perpendicular to the center of the matrix, the average values of the percolation threshold for the directions of current flow between the top and bottom edges and between the side edges are the same.
As can be seen from
Figure 1, measurements of the hopping conductivity of composites, including nanocomposites, are carried out for rectangular objects, the dimensions of which - length and thickness differ. Since there is a percolation phenomenon in composites, one of the characteristics of which is the percolation threshold, we performed Monte Carlo simulations of the percolation threshold for rectangular matrices for which the length is greater than or equal to the height. Square networks with translational symmetry were chosen for the study, the distances between nodes where in both directions of the network are unitary. As a rule, to determine the value of the percolation threshold, conductive elements in the form of metallic disks with unit diameters were randomly introduced into the initially empty matrix. When a new element is drawn next to an existing one, tangency between them occurs in cases where they are placed at a unit distance from each other in the horizontal or vertical directions. The tangency of neighboring elements results in the formation of conducting clusters. After successive iterations, there is an increase in the size of the clusters, consisting of conductive elements in contact. This allows observation of the development of conductive clusters. When, after another iteration, a conductive cluster touches electrodes on opposite edges of the matrix, a conductive channel is formed, it is called a percolation channel. This means that the percolation threshold has been reached. The value of the percolation threshold is defined in this case as the quotient of the number of conductive elements needed to form the first percolation channel to the total number of nodes in the matrix. Threshold values, obtained in successive samples, are random values [
50,
51]. Therefore, to accurately determine the average value of the percolation threshold, it is necessary to repeat the samples many times, and calculate the average values based on the percolation threshold values obtained in each sample.
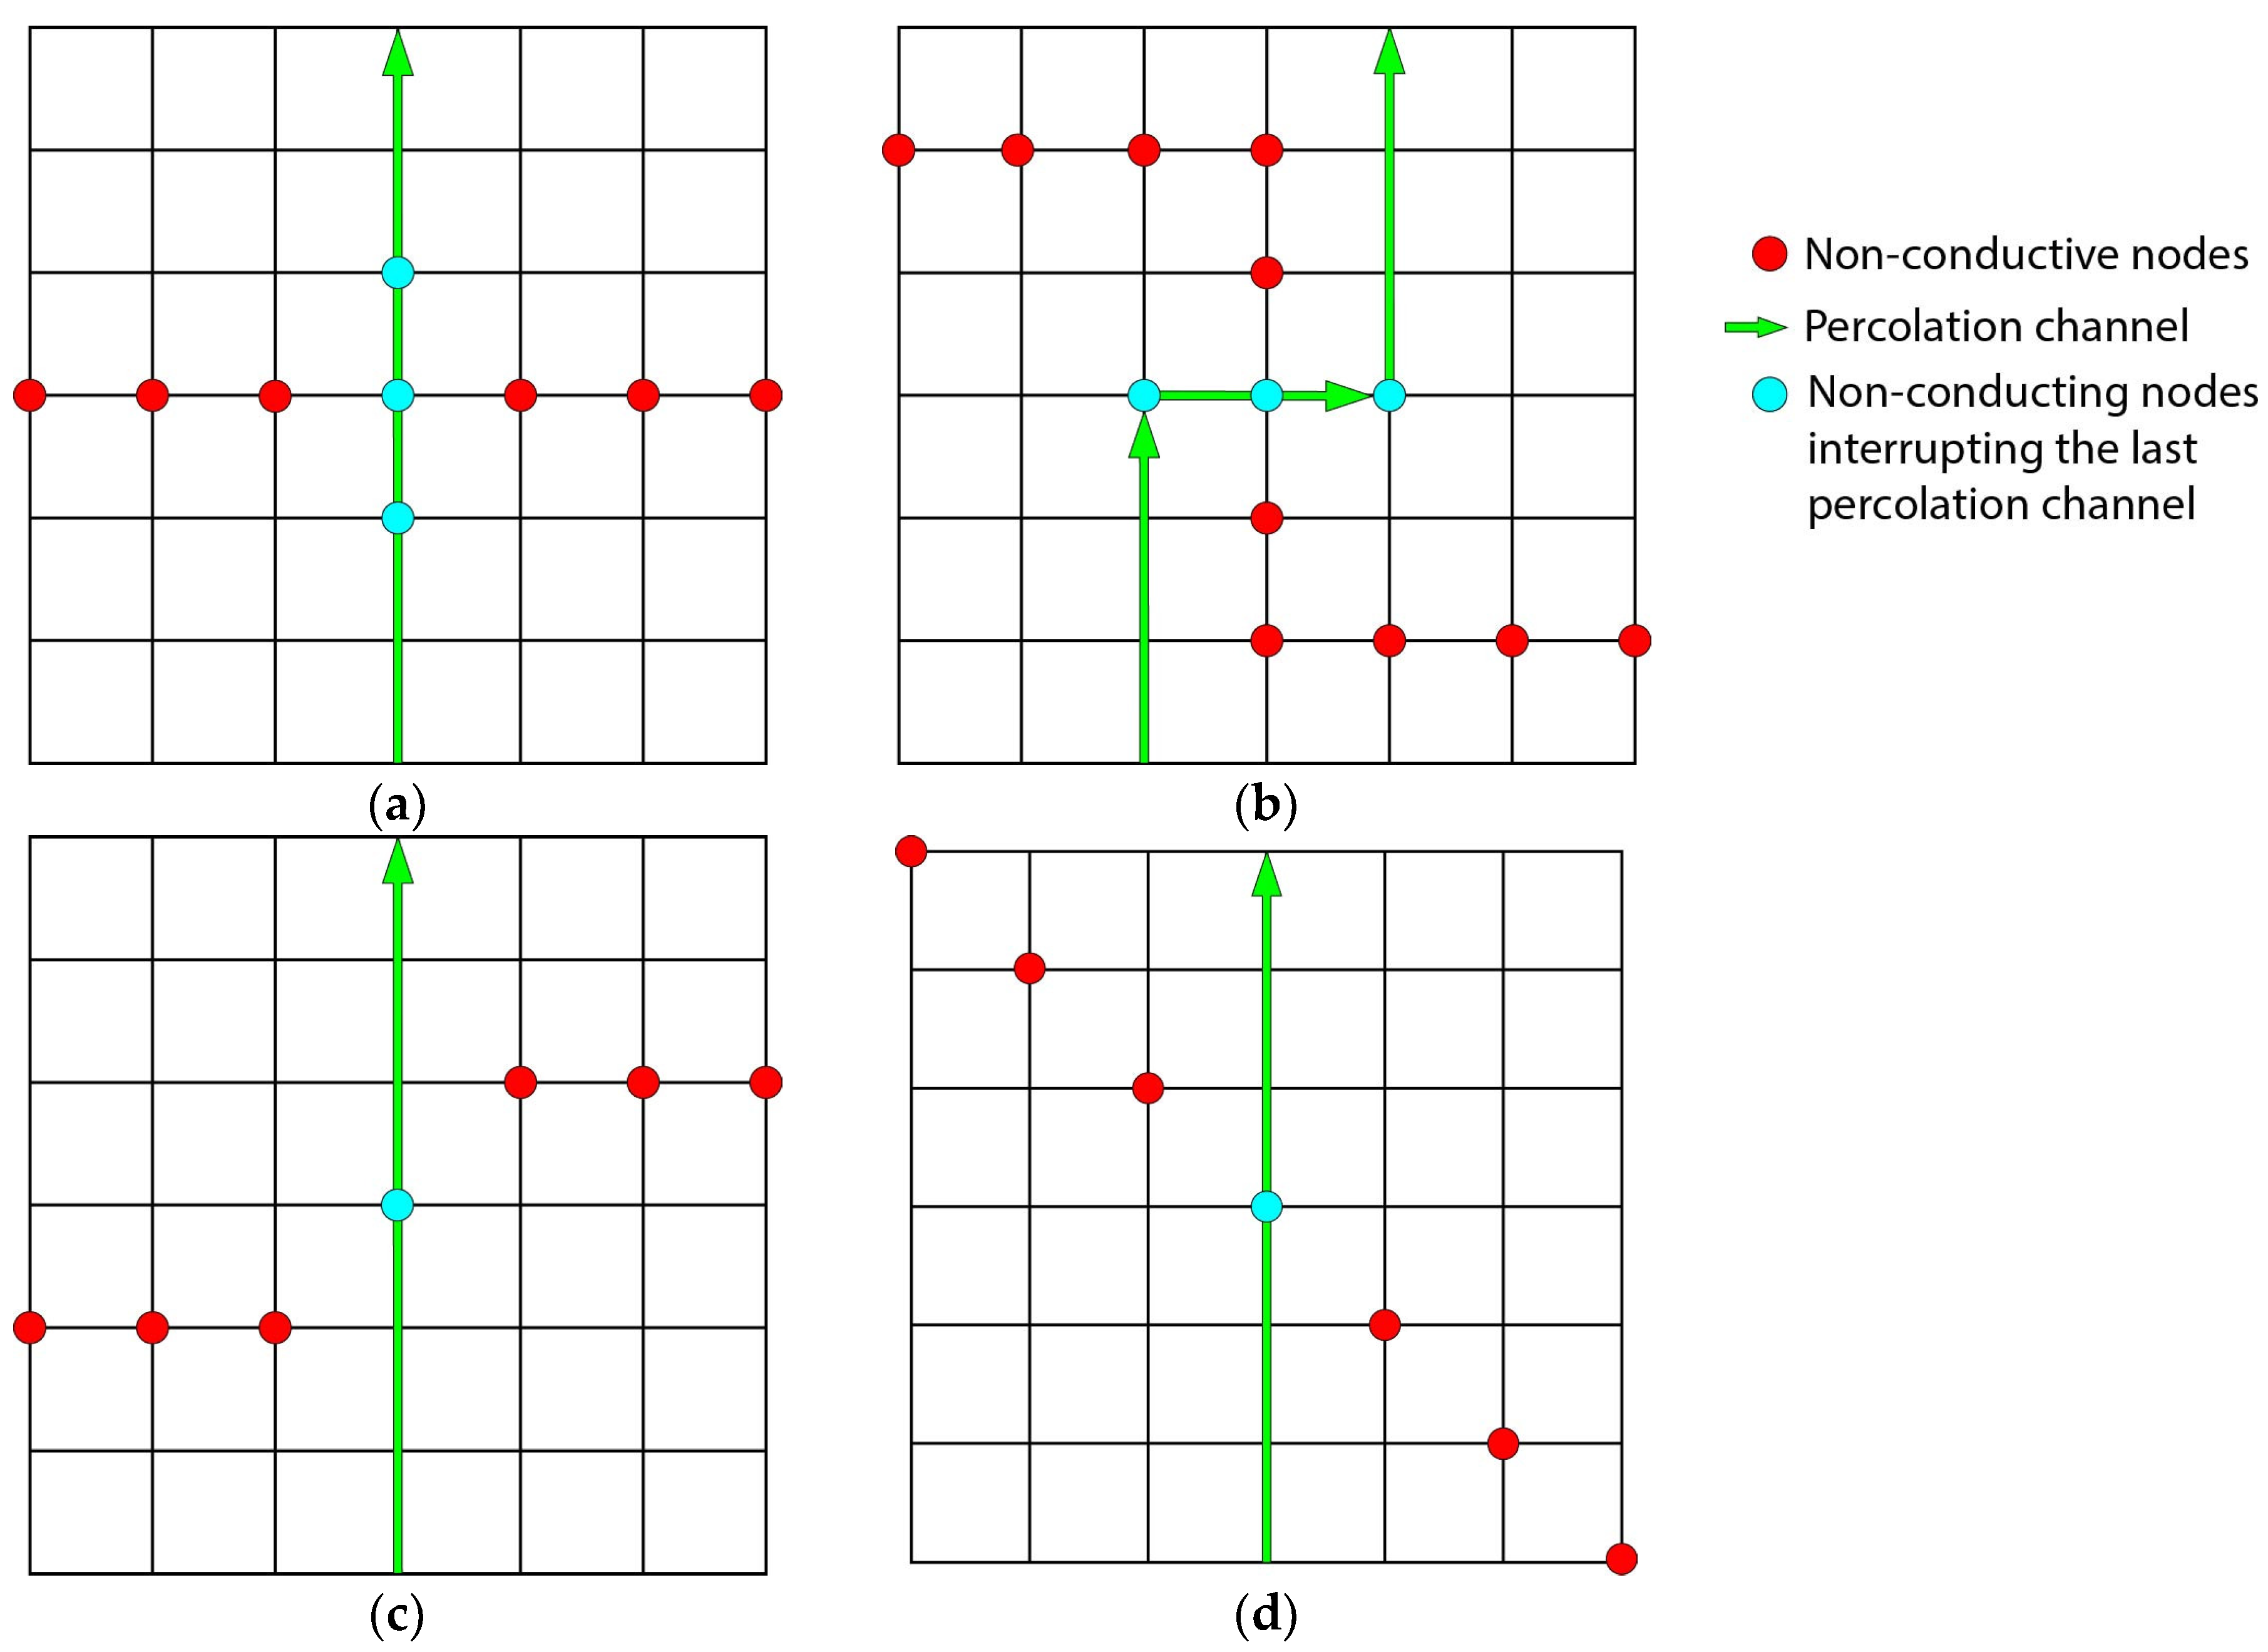
In the research presented, an inverted simulation logic was used for node percolation. The initial state of the matrix in this case is that all nodes are occupied with conductive elements. Then, non-conductive elements with diameters, equal to the diameter of the conductive disc, are randomly distributed in the matrix, replacing the conductive elements. After each draw, it is checked whether the drawn non-conductive element has a unit distance or distance √2 of another non-conductive element. This is because the interruption of the conductive channel in a square lattice matrix occurs both when neighboring non-conductive elements are distributed at unit distances and at distances √2 (
Figure 2). When the percolation channel passes through non-conductive nodes arranged in vertical or horizontal directions, the node, interrupting the last percolation channel, can occupy three positions, shown in
Figure 2a, b.
When a drawn non-conductive element has no neighbors, the program creates a unitary non-conductive cluster. When it turns out that it has, at least, one such neighbor, the newly drawn element is added to the existing cluster. The program then checks whether the cluster has non-conductive discs lying on the top and bottom edges. If not, the program performs another iteration. When, after another iteration, it is found that the resulting cluster has non-conductive elements on the top and bottom edges, it means that the last percolation channel of current flow between the side edges of the matrix has been interrupted. In this case, the program calculates the value of the percolation threshold in the horizontal direction
Xc(
w), which is equal to the ratio of the conductive elements remaining in the matrix plus the element that interrupts the current flow to the initial number of conductive elements. In a similar manner, the program analyzes non-conductive clusters in the horizontal direction and calculates the percolation threshold in the vertical direction
Xc(
h). After both percolation threshold values are determined, the program saves these values and the coordinates of the non-conductive elements interrupting the last percolation channels in the vertical and horizontal directions. After this, the program performs the next iteration cycle, which results in determining the next values of percolation thresholds
Xc(
w) and
Xc(
h). To obtain satisfactory uncertainty in the determination of the average values of both percolation thresholds, 50000 samples were performed for each of the matrices examined. This value considered sufficient based on the data of the paper [
51]. Based on the obtained values of percolation thresholds, the mean values, and standard deviations necessary for further statistical analysis were calculated. To perform computer simulations of the percolation thresholds of the matrices, the Monte Carlo method was used, which is widely used for modeling [
52,
53,
54,
55]. The algorithm and software developed for the simulations are widely described in our previous article [
50]. The “
Mersenne Twister” algorithm was used to generate pseudorandom numbers [
56], often used for this purpose [
57].
The dimensions of the tested matrices
h (height)-height,
w (width)-length were chosen as follows. The first matrix tested was a square-shaped matrix with dimensions
L‧
L=200x200. The number of nodes in the matrix is
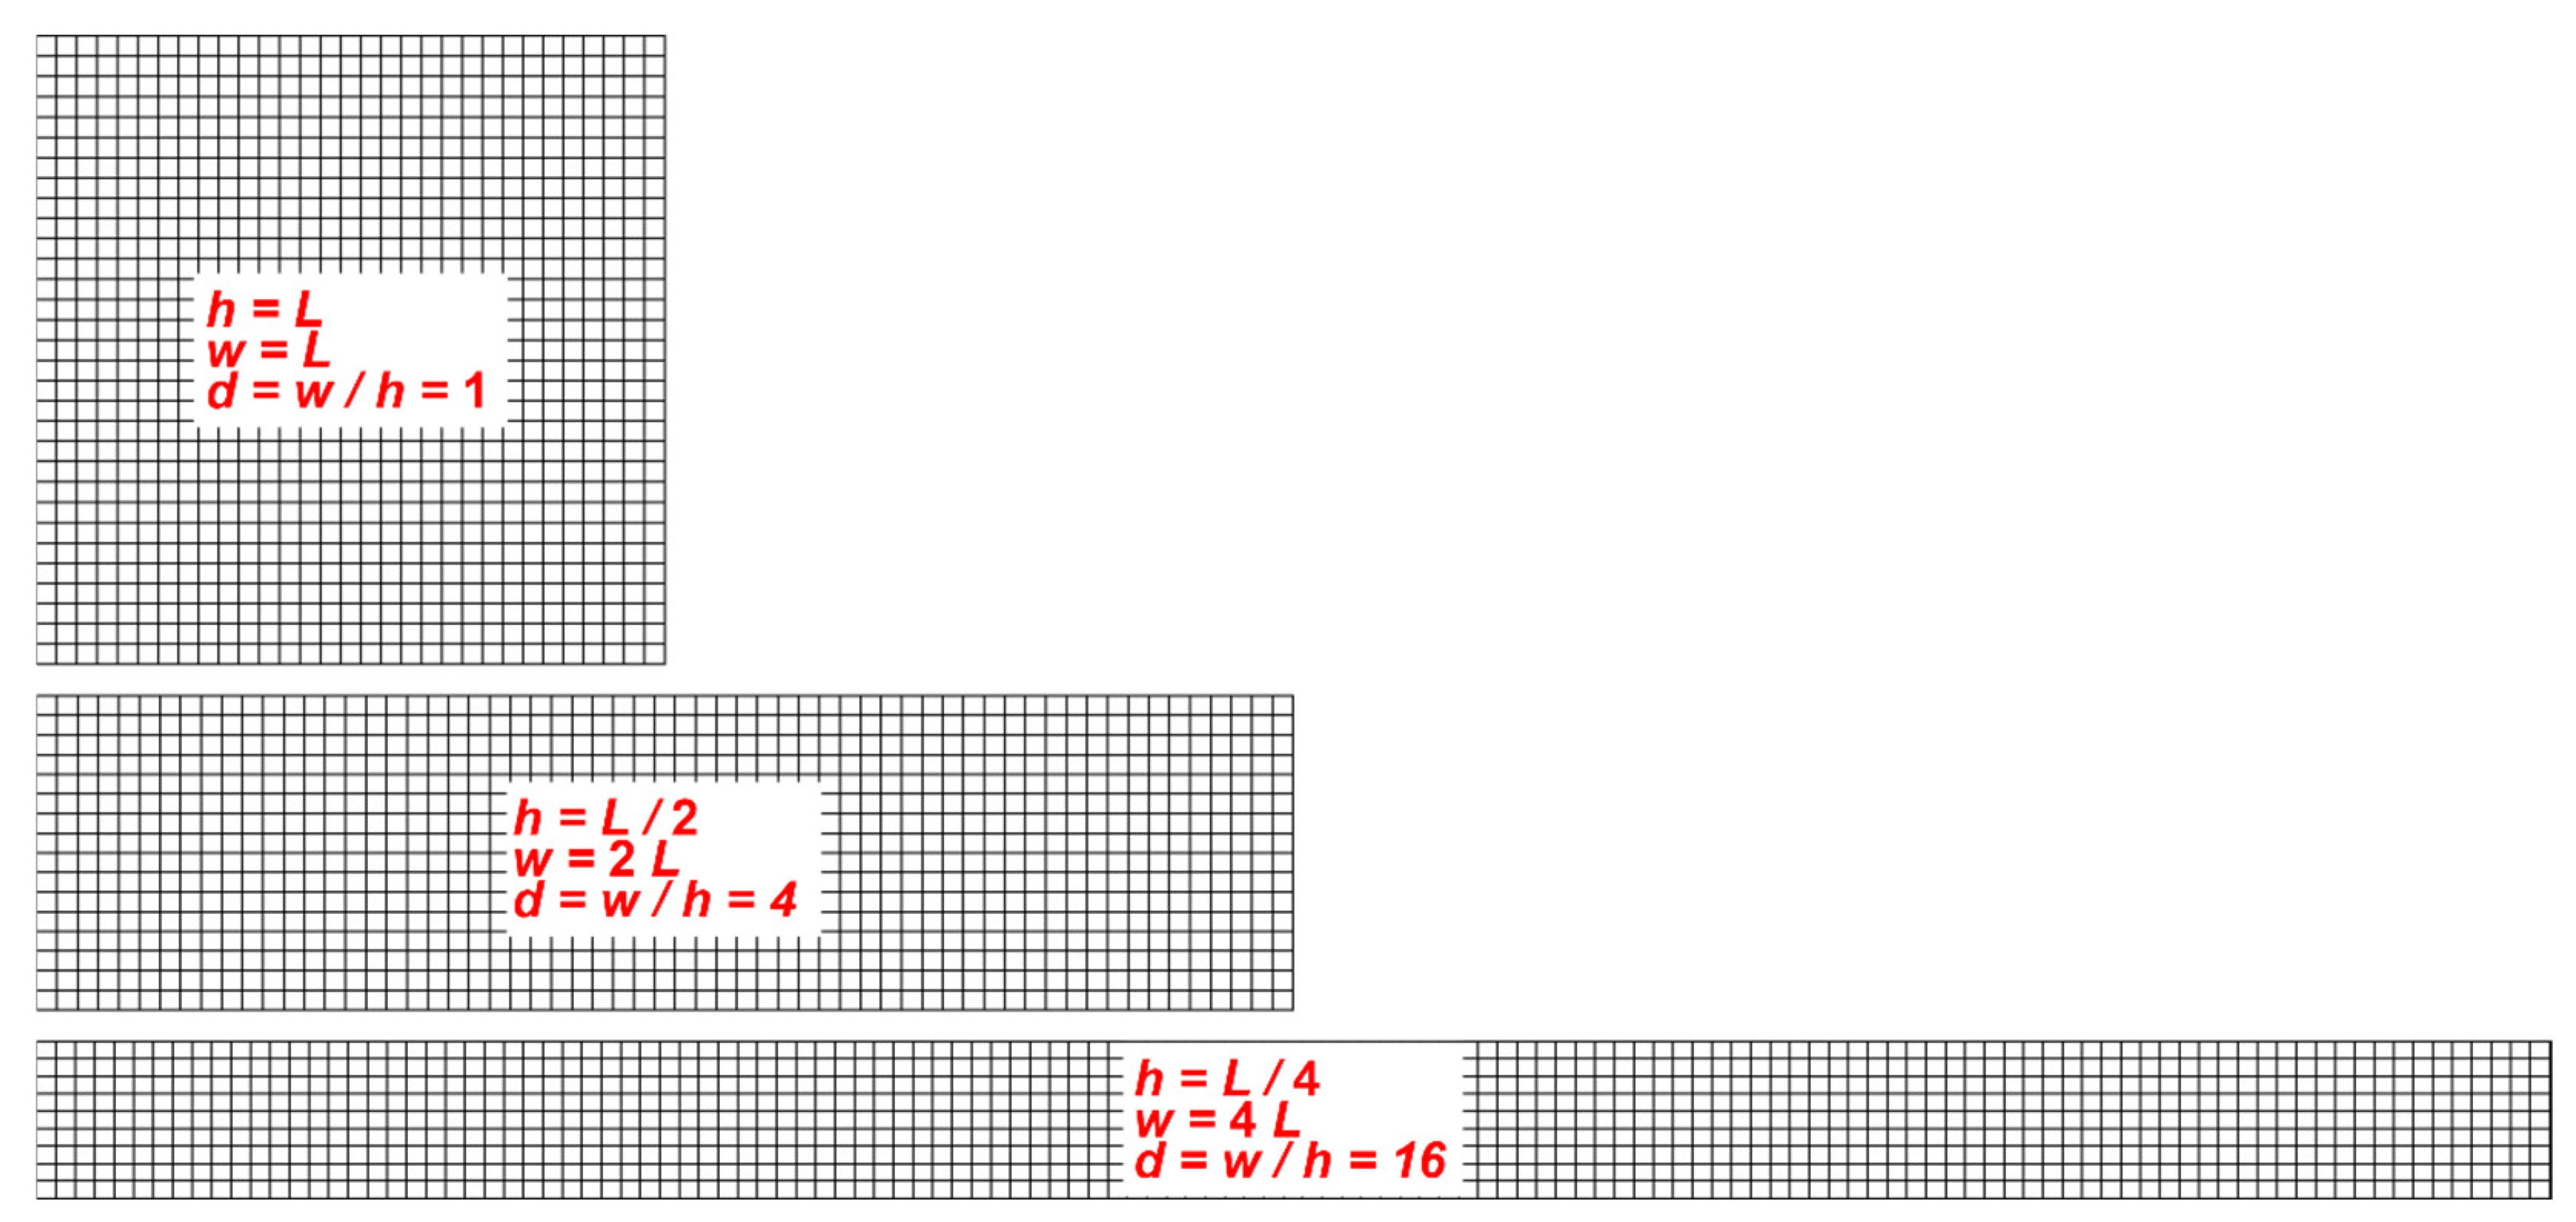
L2=200‧200=40000 nodes. The next matrices are rectangular matrices, containing the same number of nodes as the square-shaped matrix. This means that lengthening the matrix causes a simultaneous reduction in its height, so that
h‧
w=
L2. Examples of such matrices are shown in
Figure 3.
The first is a square-shaped matrix with dimensions
h=
w=
L, which contains the number of nodes
L2. The next matrix shown in
Figure 3 has dimensions
h=
L/2,
w=2
L and contains
h‧
w=
L/2‧2
L=
L2 nodes, that is, as many as the previous square-shaped matrix as well. Another matrix shown in
Figure 3 has dimensions
h=
L/4,
w=4
L and contains
L/4‧4
L=
L2 nodes. The values of height
h and length
w of the matrices were chosen so that they were integers, and their quotients
w/
h were fairly evenly distributed on a logarithmic scale on the x-axis. The dimensions of the matrices used in the simulation and the quotients of their lengths to height
d=
w/
h are given in
Table 1.
2.2. Fundamentals of Statistical Analysis of Percolation Threshold Simulation Results
For statistical analysis of probability distributions, the mean value
and the central moments of order
k=1, 2, 3 are used. The general formula for the central moments of a discrete random variable is written in the form [
58]:
where:
n – number of iterations;
– average value;
xi – result for iteration
i;
k=1, 2, 3...- order of central moment.
Central moments are used to characterize the shape of probability distributions. The central moment of order two is called the variance:
The variance characterizes the width of a probability distribution. The greater the variance, the wider the distribution. The square root of the variance is called the standard deviation and shows the width of the probability distribution in the same units as the mean value:
In the case of a normal probability distribution, the mean value
corresponds to the position of the distribution’s maximum. When the distribution is asymmetric, the position of the maximum and the mean value are not equal. For the analysis of asymmetric distributions, the third central moment is used:
A negative value of the third central moment means that the maximum of the distribution is shifted from the mean value toward larger
x. The tail is more developed toward smaller
x. For positive values, there is a shift in the position of the maximum toward smaller
x. The tail pulls toward larger
x. To evaluate the asymmetry of the probability distribution, the classical asymmetry coefficient is used, defined by the formula [
58]:
By substituting into (5) the values of the third central moment (4) and the standard deviation (3), we get:
The sign of the coefficient
A(
x) is that of the third central moment. Due to the value of the coefficient of
A(
x), the asymmetry of probability distributions can be weak, moderate, and strong [
58]. In the case of weak asymmetry, the coefficient
A(
x) takes values:
Moderate asymmetry occurs in:
Strong asymmetry is observed for the coefficients:
In the remainder of this paper, the mean values , standard deviations σ and classical asymmetry coefficients A(x) of probability distributions of percolation threshold values will be used to analyze the obtained results of percolation threshold simulations.
3. Research Results and Their Statistical Analysis
For the selected matrices with square and rectangular shapes, 50000 simulation samples each were performed. In each of them, percolation thresholds were determined, based on which the average values of percolation thresholds for current flow across and along the matrix were determined. The results obtained from the simulations are shown in
Table 2.
It can be seen from
Table 2, that for a square-shaped matrix, the average values of percolation thresholds in both directions of current flow are practically the same. As mentioned above the square-shaped matrix has a fourth axis of symmetry. Therefore, both directions of current flow - between the top and bottom edges of the matrix and between the side edges are equivalent. As is known, in square-shaped matrices, due to their high symmetry, there is no direction chosen. Lengthening of a rectangular matrix while reducing its height causes the average value of the percolation threshold to start increasing in the direction of a current flow along the matrix. In contrast, the percolation threshold in the transverse direction begins to decrease. This is due to a decrease in symmetry from 4 for a square-shaped matrix to 2 for rectangular matrices. In rectangular matrices, the direction selected appears, the parameters for which differ from those for the perpendicular direction.
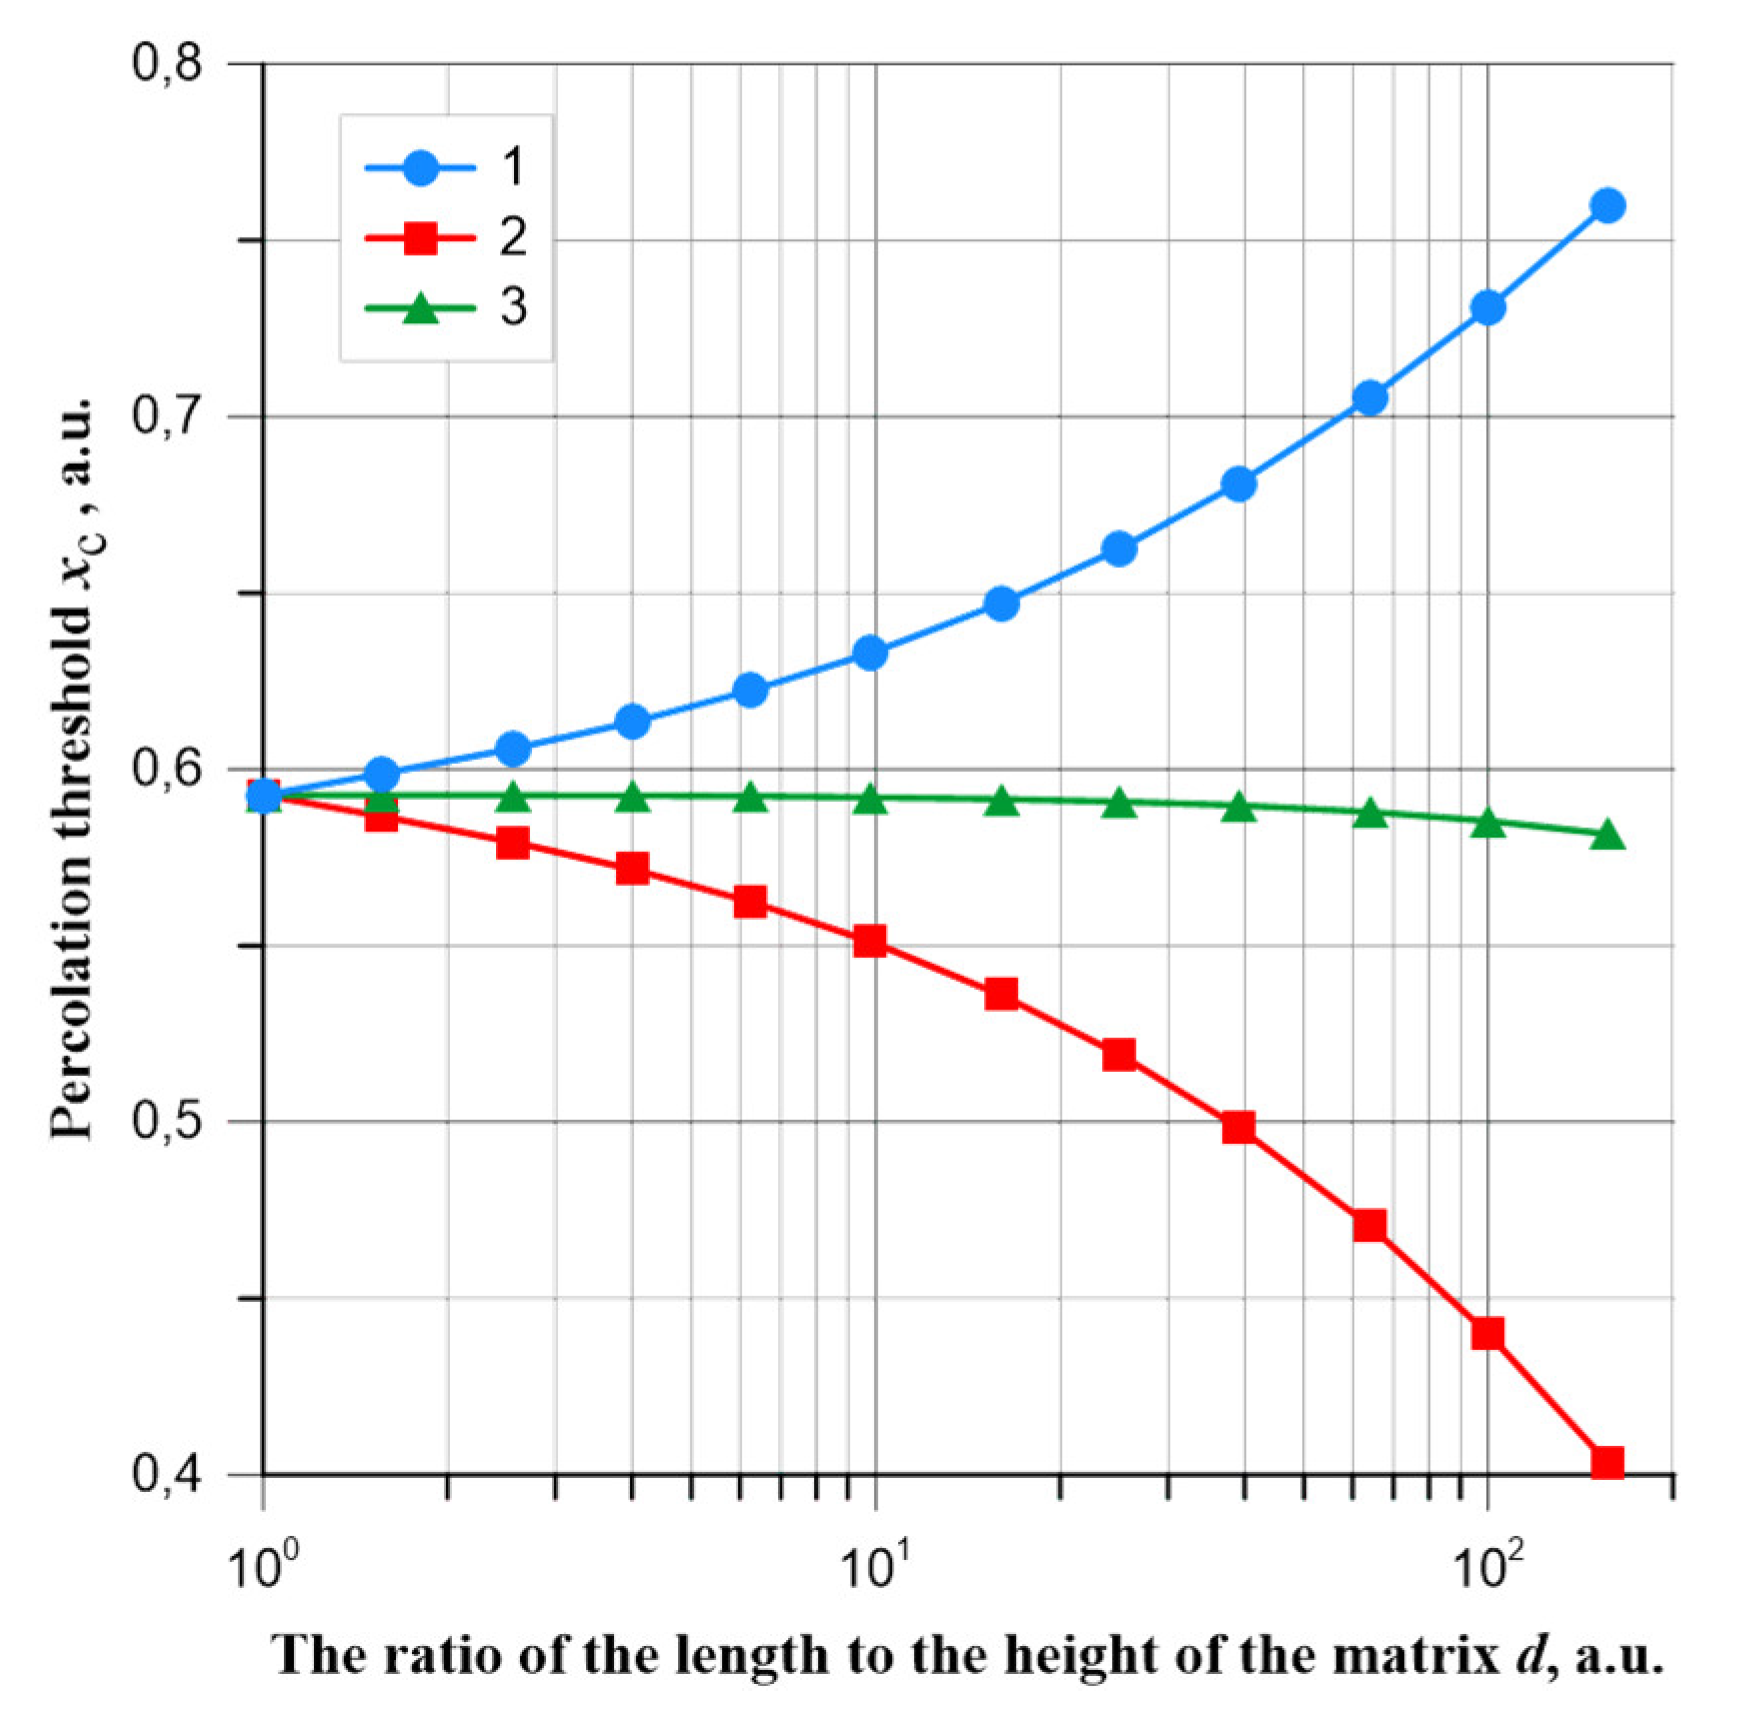
This can be clearly seen in
Figure 4, where the dependence of both percolation threshold values on the quotient
d of the length of the matrix to its height is shown. It can be seen from
Figure 4 that the average values of percolation thresholds with the elongation of the matrices change almost symmetrically with respect to the percolation threshold value of the square matrix. This is indicated by the average value of the percolation thresholds along and across the matrix, shown in
Figure 4 by line 3. The average value of the percolation threshold in the transverse direction of the rectangle decreases from a value of 0.592740 to 0.403614. In the direction along the matrix, it increases from 0.592665 to 0.759847. Based on the simulation results using equation (3), the standard deviations for both directions of current flow were determined, and their values are shown in
Table 2.
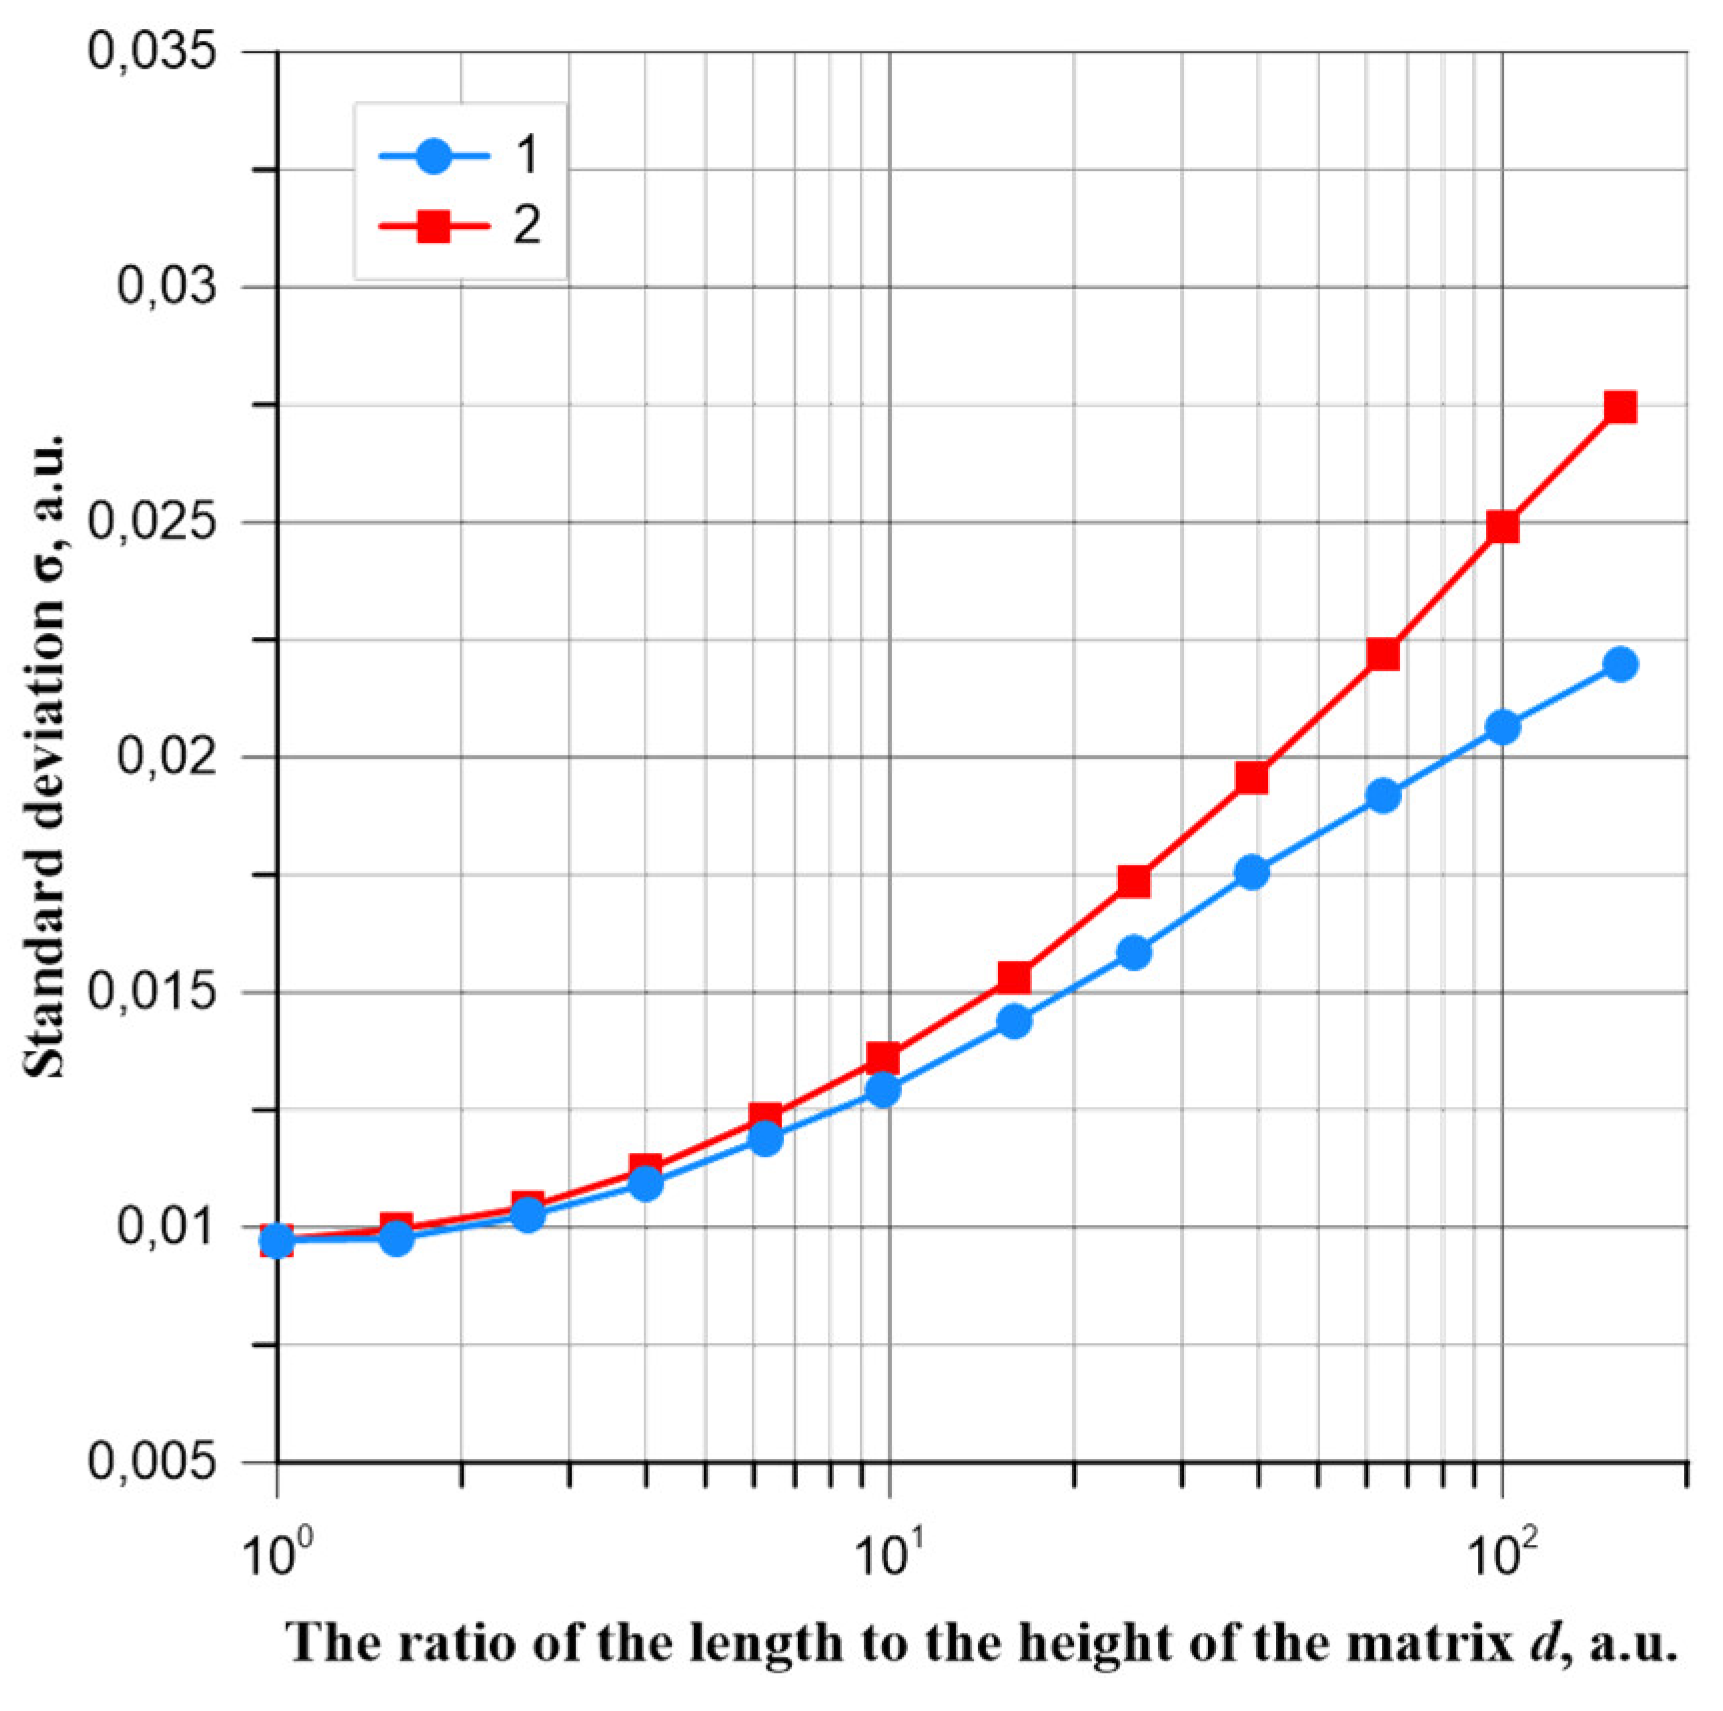
Figure 5 shows the dependence of the standard deviation values of the percolation thresholds for current flow along and across the rectangular matrices. It can be seen from
Figure 5, that both values of standard deviations increase with the extension of the matrix. The standard deviation for the direction along the matrix increases from about 0.009732 to about 0.021989. The value for current flow in the transverse direction of the matrix changes from about 0.009733 to about 0.027463.
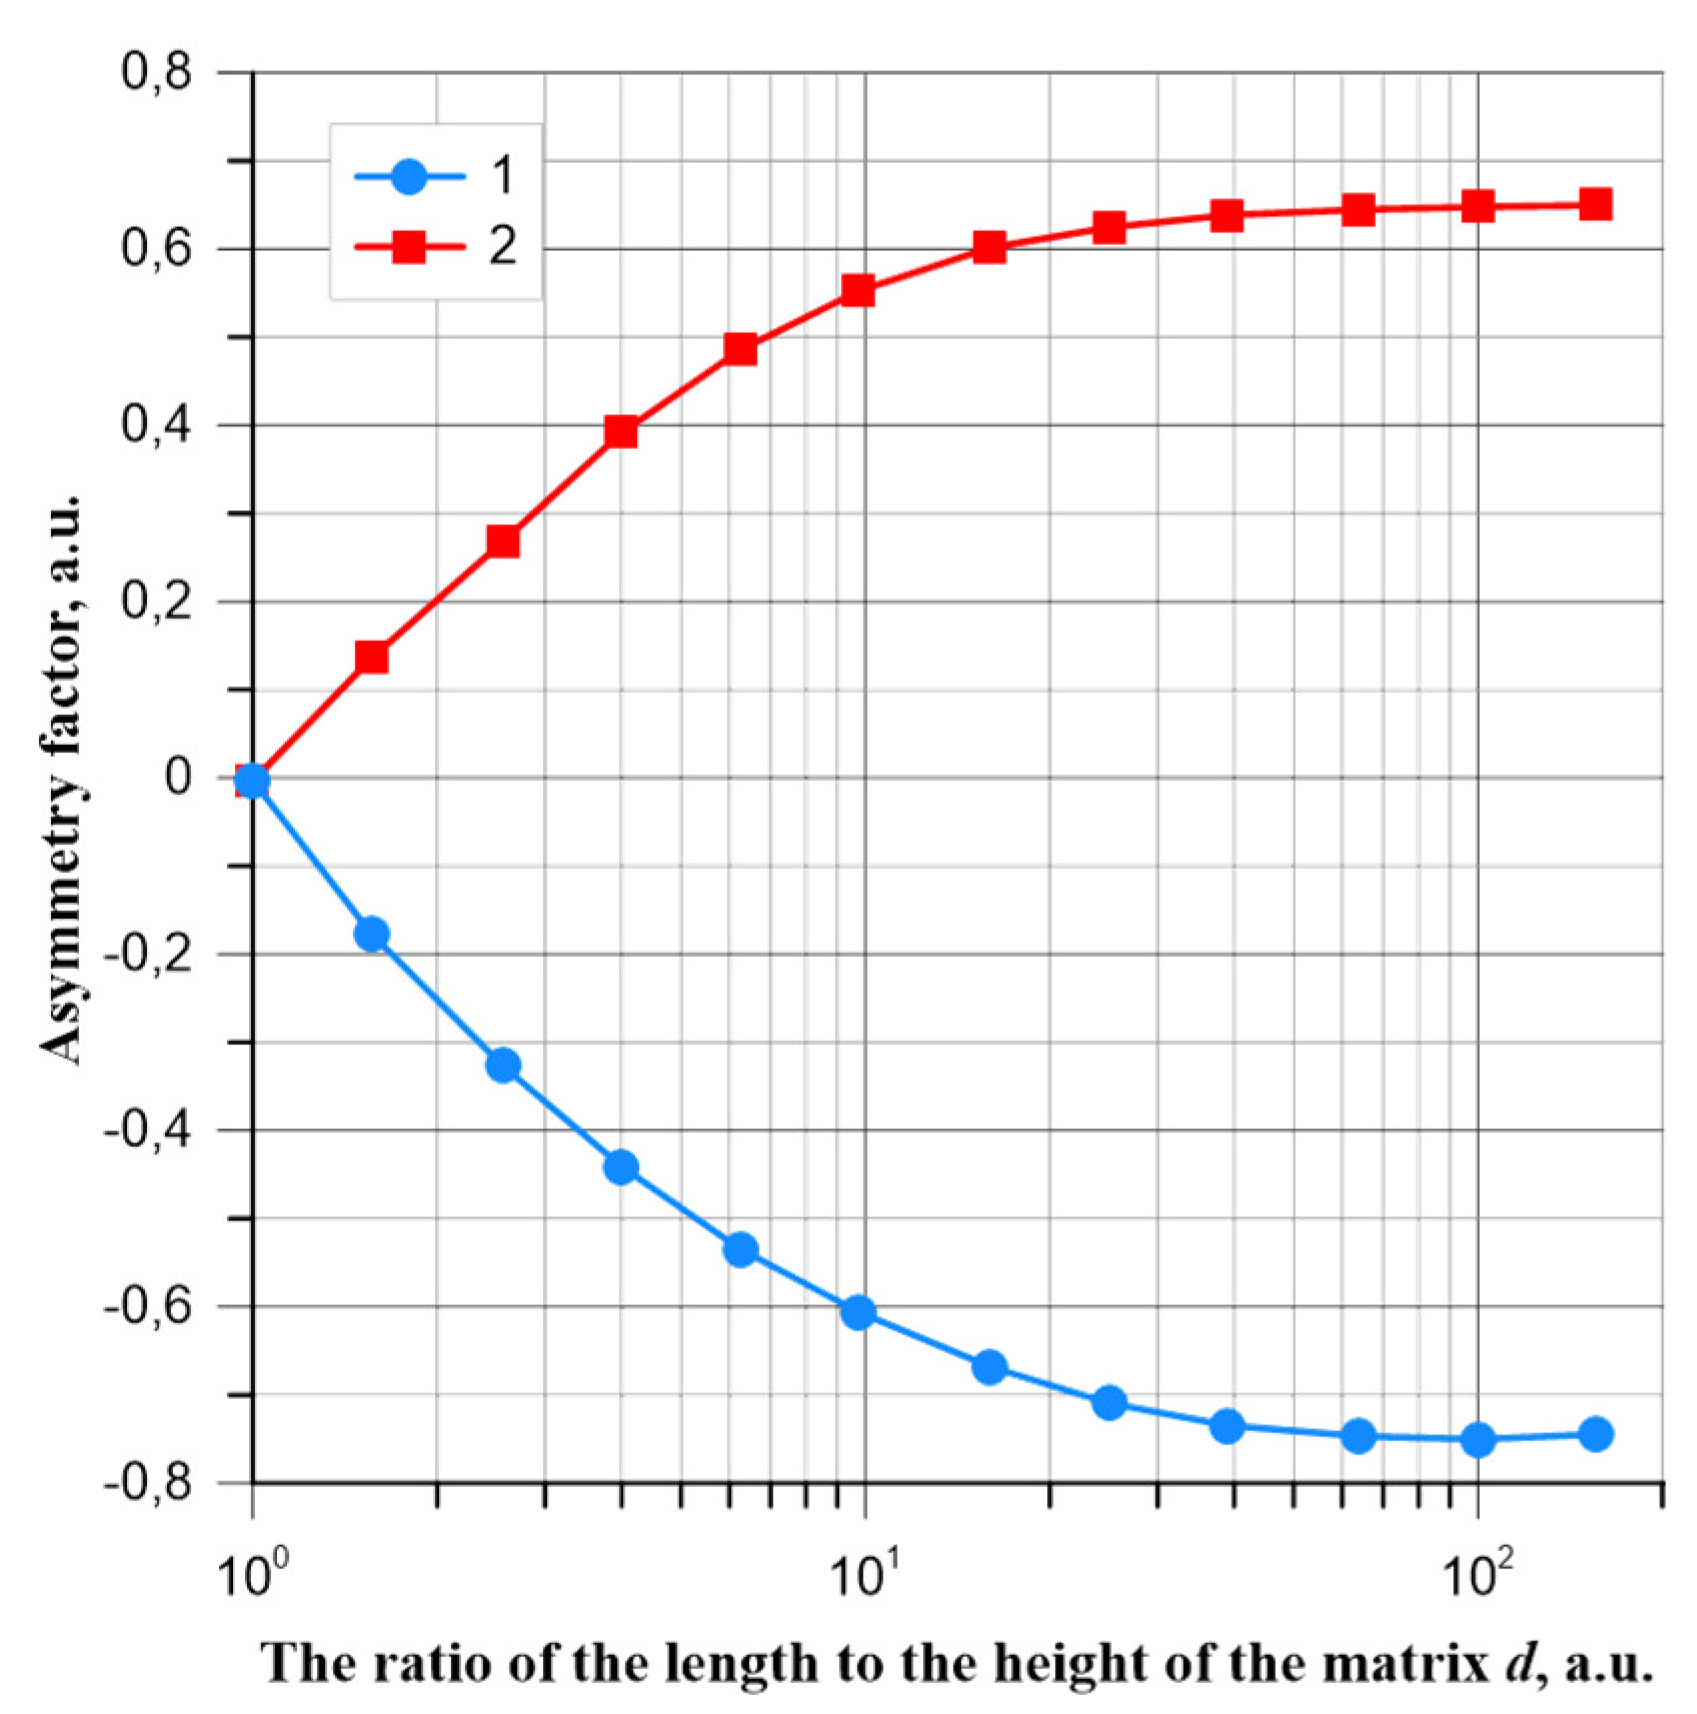
Based on the mean values of the percolation threshold (
Figure 4) and the values of the standard deviations (
Figure 5), the values of the asymmetry coefficients of the probability distributions
A(
x), formula (6), were determined. For both directions of current flow – along and across matrices with square and rectangular shapes. The results are shown in
Figure 6.
From the waveforms shown in
Figure 6, for a square-shaped matrix (
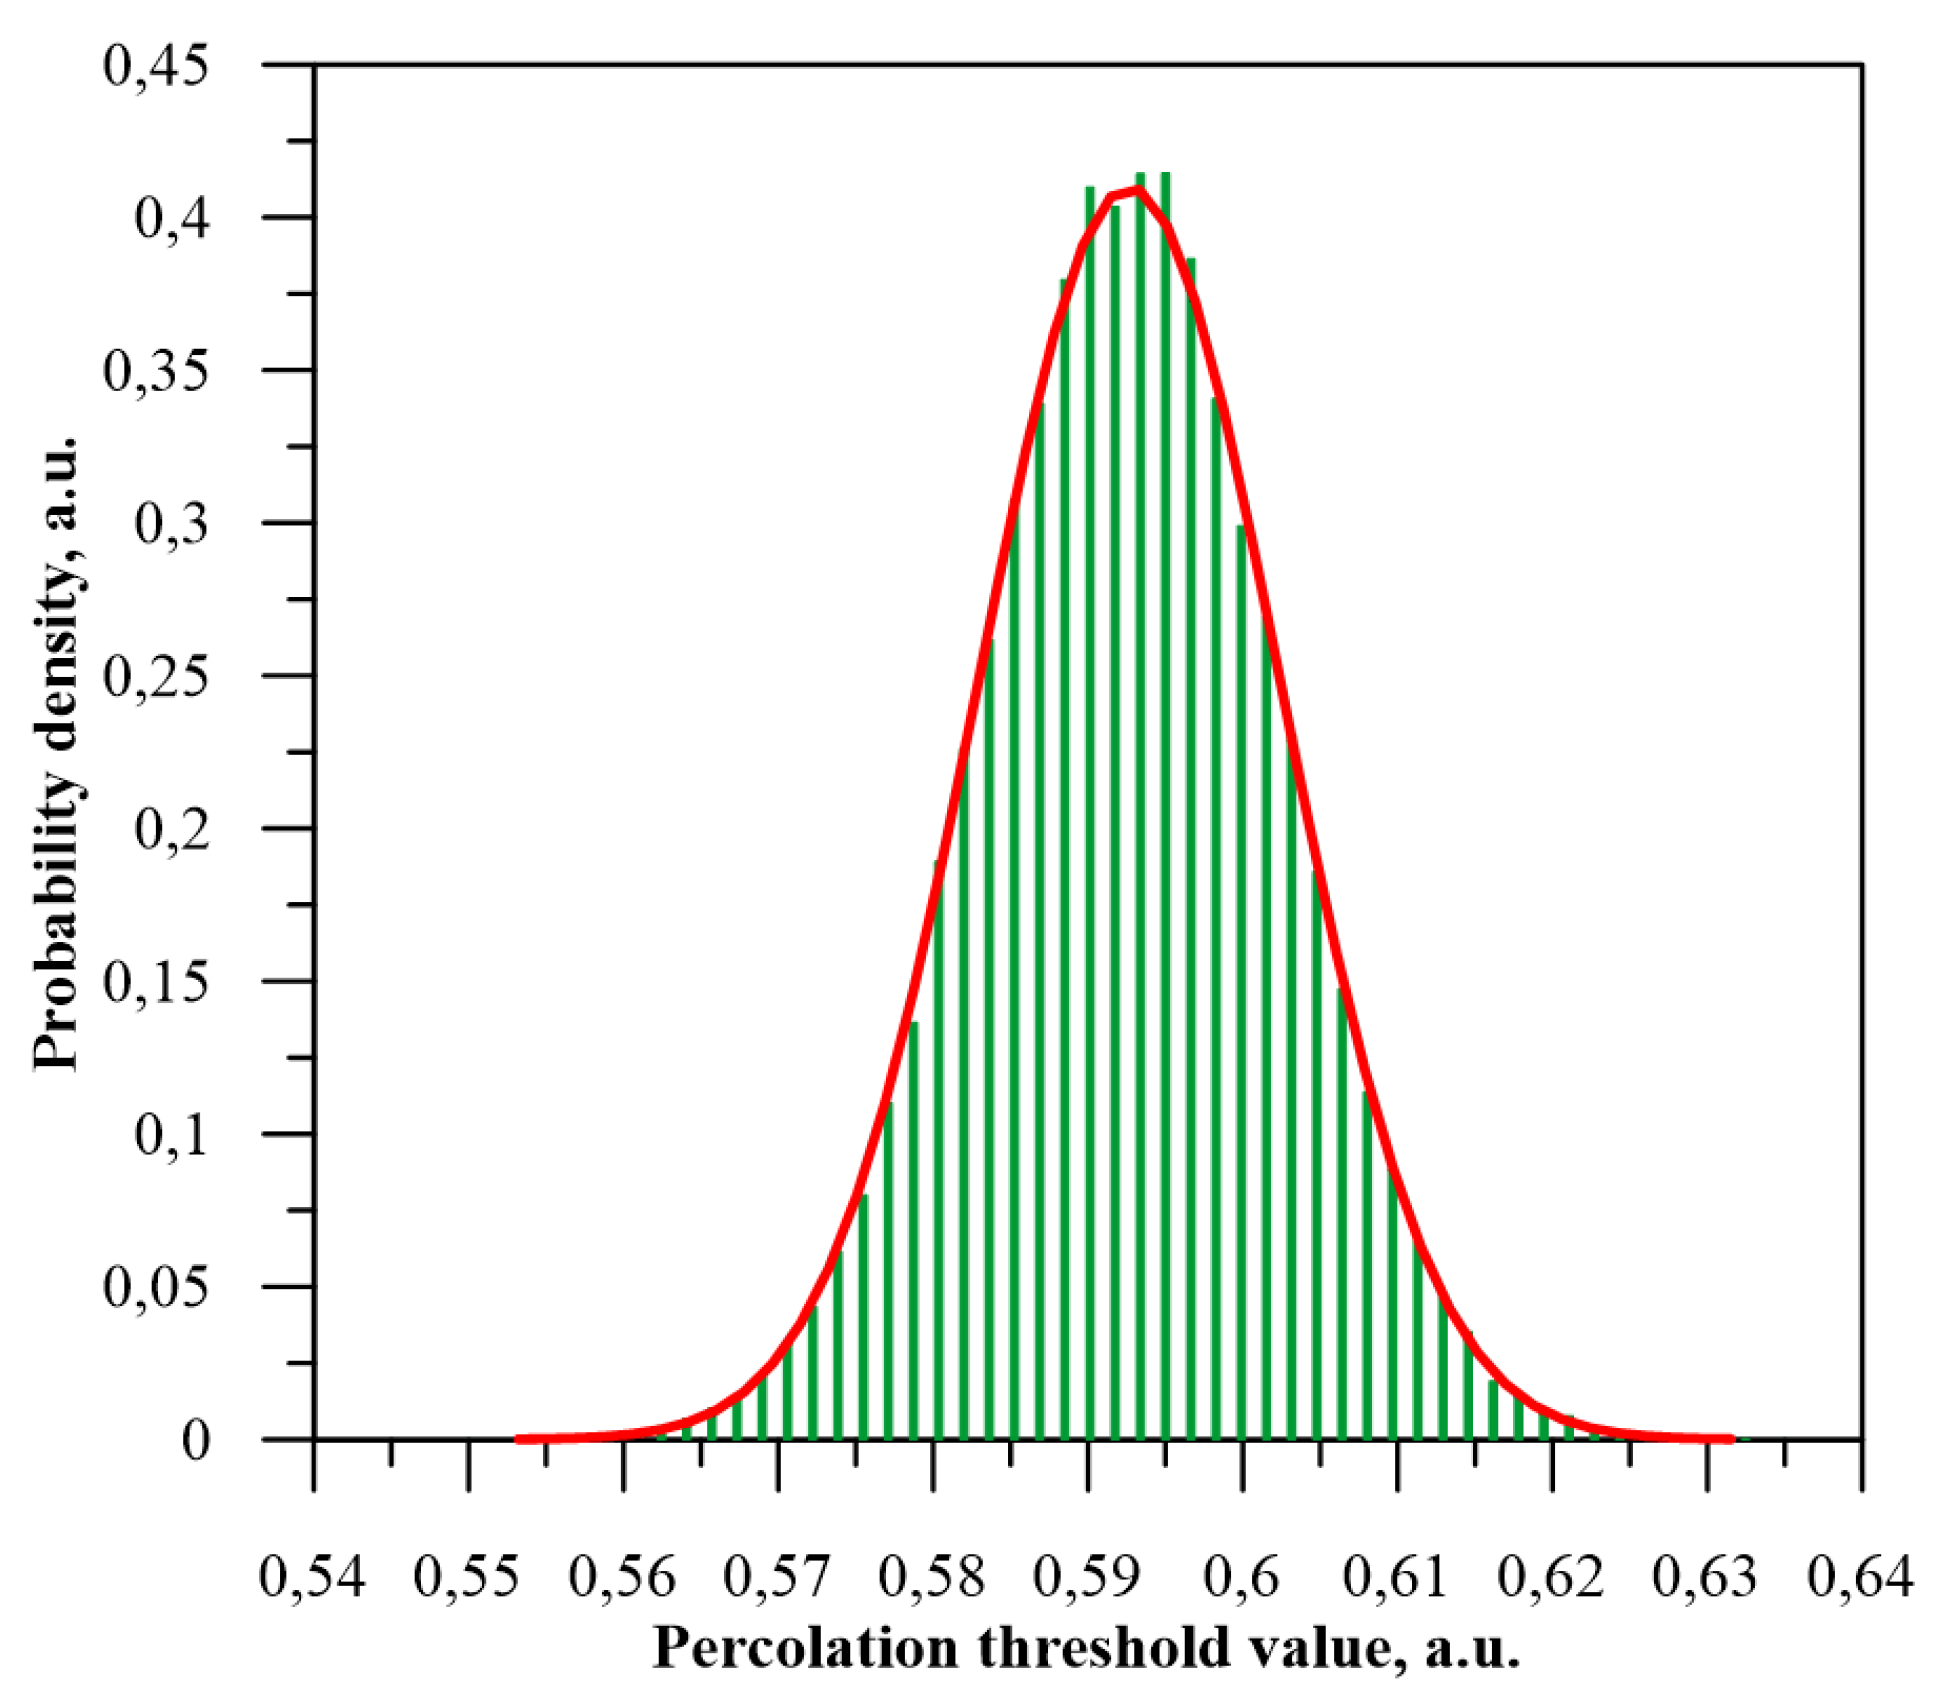
d=1) the classical asymmetry coefficient is zero. This means that the probability distribution is symmetric. The histogram of the probability distribution for the square-shaped matrix (
Figure 7) which was determined from the simulation results, was compared with the normal distribution, shown as a continuous line in
Figure 7. As shown, the normal distribution perfectly describes the probability distribution of percolation threshold values in the square-shaped matrix. This result is consistent with the results obtained in the thesis of [
50]. This is also proven by the very close to unity value of the coefficient of determination
R2≈0.99805.
For rectangular matrices there are two values of asymmetry coefficients (
Figure 6). For flow across the matrix, the coefficients are negative, and their values do not exceed 0.7. This means, that in the direction along the matrix there is a weak asymmetry – formula (7). For current flow along the matrix, the asymmetry coefficients are positive. For
d≤16 their values are less than 0.7. This means weak asymmetry – formula (7). With a further increase in
d, the asymmetry coefficients exceed the value of 0.7 and the asymmetry becomes moderate – formula (8).
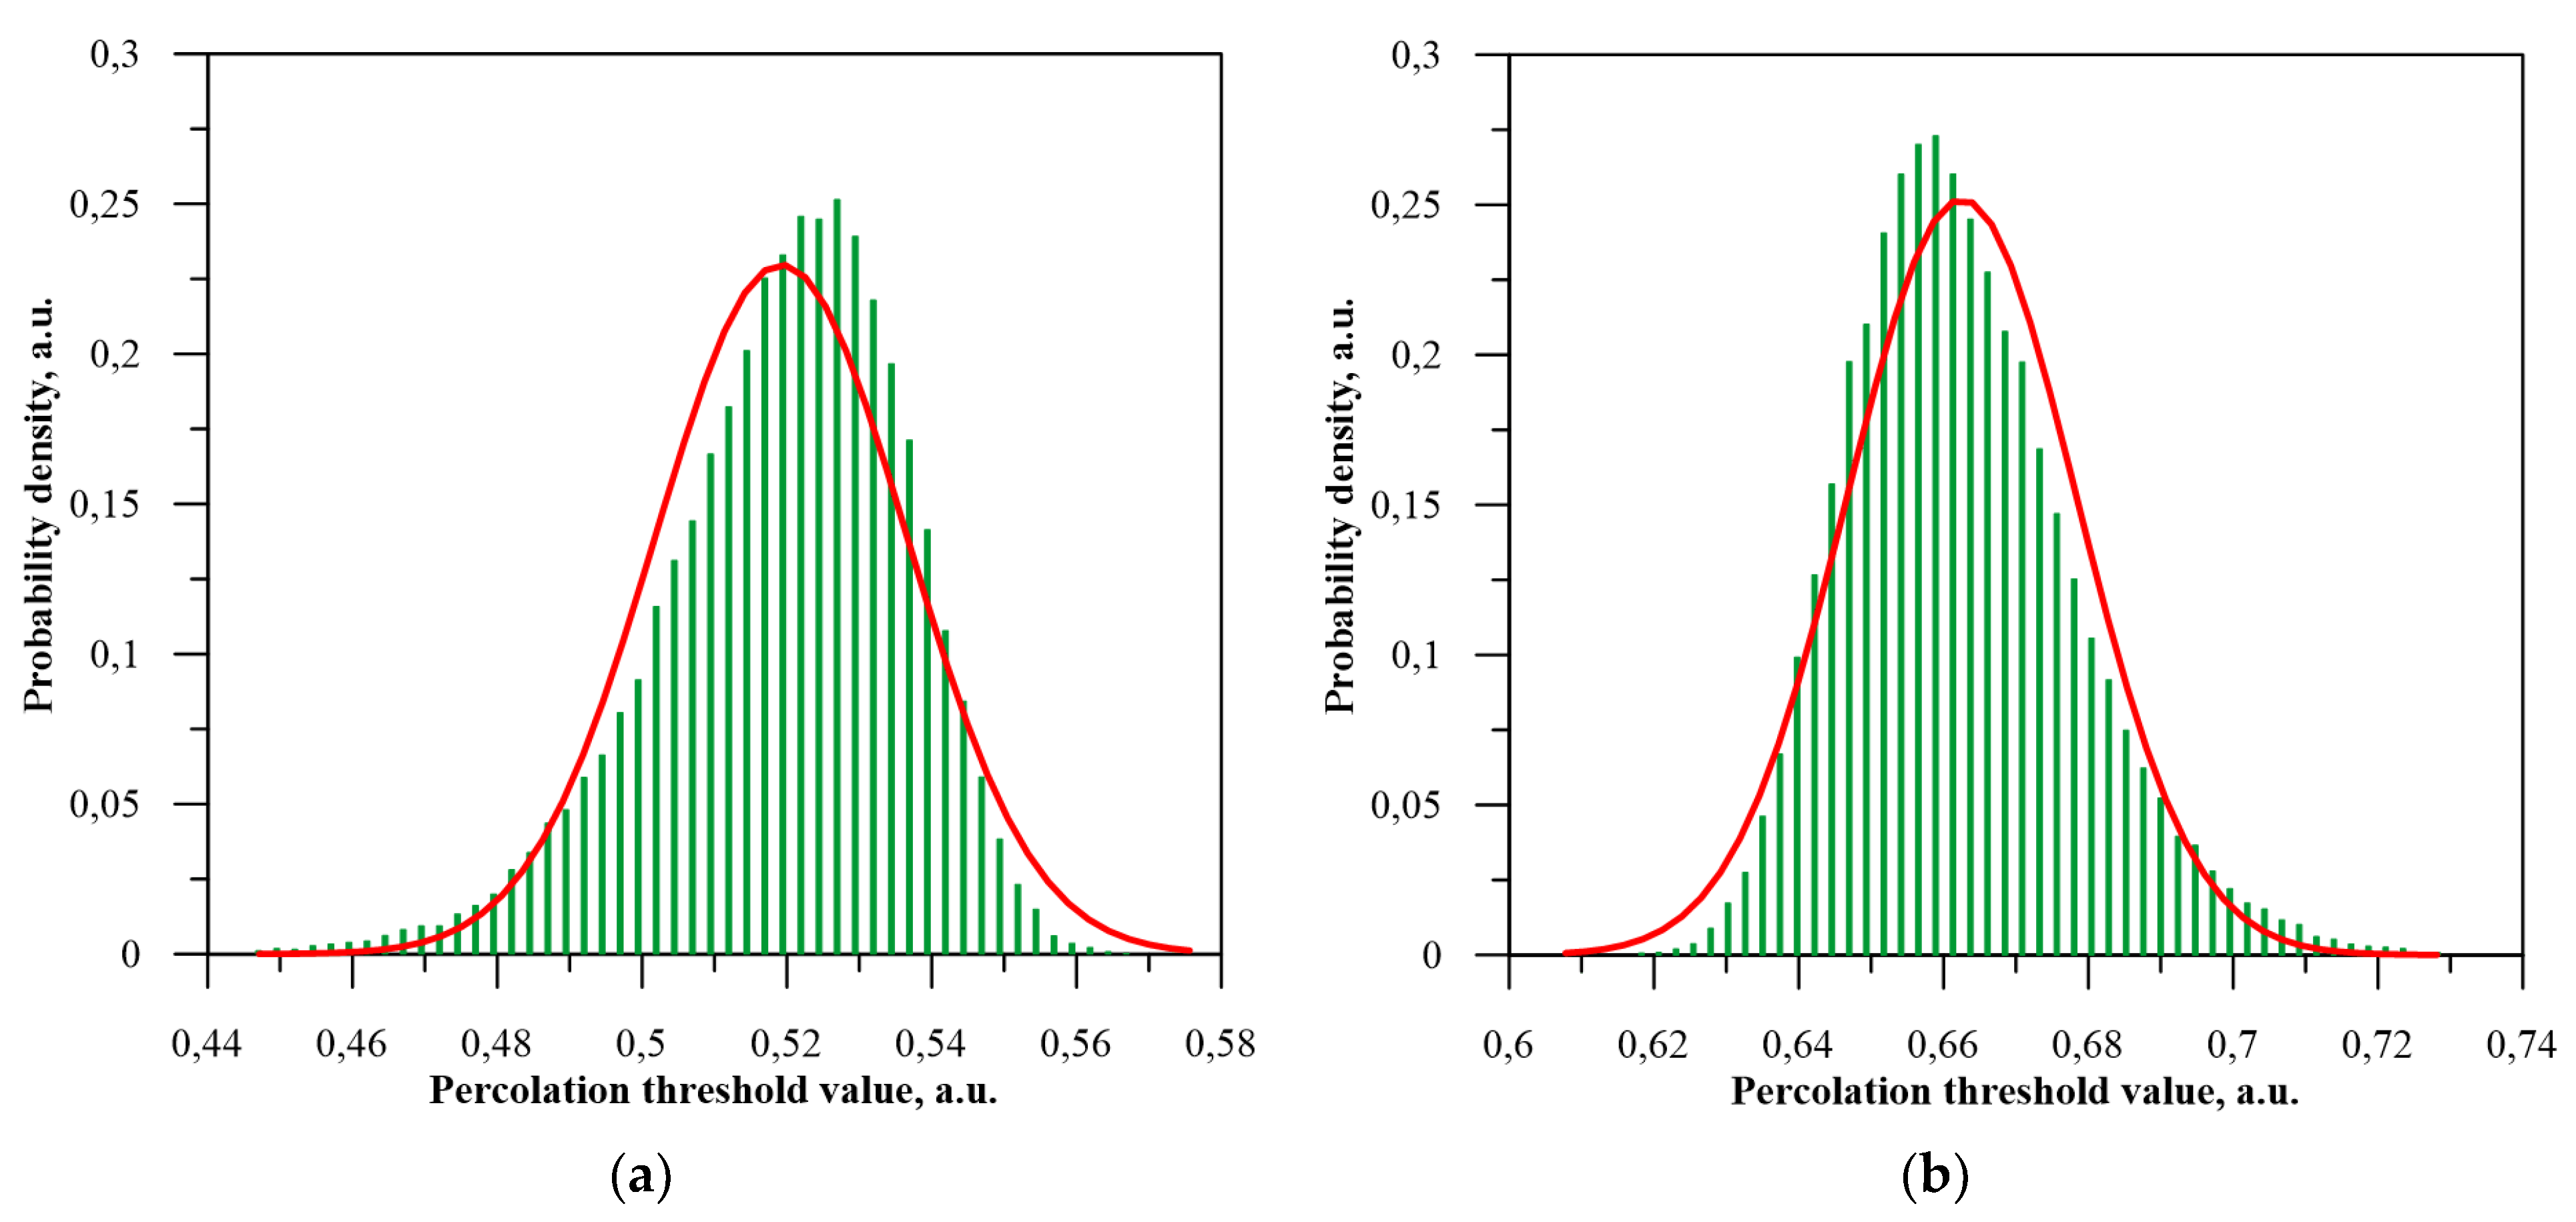
Figure 8 shows, to illustrate the asymmetry of the probability distributions, an example of the probability distributions of percolation threshold values in the form of histograms for a matrix of length 1000 and height 40. The probability distributions in the form of histograms were compared with normal distributions determined by the mean values of percolation thresholds and standard deviations.
A comparison of histograms and normal distributions (
Figure 8) shows that the rectangular matrices have asymmetric probability distributions of percolation thresholds. For current flow in the transverse direction (
Figure 8a), the position of the maximum shifts, compared to the normal distribution, into the area of higher values of percolation thresholds. The asymmetry of the waveform is negative, which means that the left slope is clearly wider than the right slope. In the case of current flow along the matrix (
Figure 8b), the opposite situation occurs. The position of the maximum moves into the region of smaller percolation threshold values. There is a positive asymmetry, for which the left slope is steep, and the right slope is stretched into the area of higher percolation threshold values. A comparison of the waveforms for a square-shaped matrix (
Figure 7) and rectangular matrices with the same number of nodes (
Figure 8) also shows that extending the matrix increases the maximum value of the distribution compared to a normal distribution. Similar histograms were obtained for the other rectangular matrices.
One of the most accurate ways to study percolation thresholds in composites [
59,
60,
61,
62,
63] and nanocomposites [
64,
65,
66,
67,
68] is to determine the dependence of DC or AC conductivity [
38,
47,
49] on the content of conductive inclusions. The analysis of these publications shows that for low inclusion contents, far from the percolation threshold, the conductivity is close to that of the matrix [
38]. Once the percolation threshold is reached and then exceeded, the increase in conductivity begins to increase more rapidly. An increase in the value of the percolation threshold shifts the onset of the increase in conductivity and the episode of rapid growth into the area of higher concentrations of inclusions. This means that for a nanocomposite with a certain content of nano-inclusions, the higher the percolation threshold, the lower its conductivity. From the experimental results presented in this paper, the elongation of a thin film of a nanocomposite with a fixed concentration of nano-inclusions causes an increase in the value of the percolation threshold for current flow in the direction along the matrix, and thus a decrease in the conductivity of the film. In contrast, a decrease in the thickness of the layer causes a decrease in the value of the percolation threshold in the direction perpendicular to the layer, and thus to an increase in the conductivity. Such phenomena should be considered when analyzing experimental results on conductivity studies of nanocomposite thin films.
4. Conclusions
In this thesis, computer simulations of percolation threshold values were performed using the Monte Carlo method for square and rectangular shaped matrices. The square-shaped matrix is 200x200 and contains 40000 nodes. The subsequent matrices are rectangular matrices, containing the same number of nodes as the square matrix. This means that lengthening the matrix results in a simultaneous decrease in its height. The values of the length and height of the matrices were chosen in such a way that they were integers, and their quotients were evenly distributed on a logarithmic scale on the x-axis. For each matrix, 50000 samples were made. In each sample, the percolation threshold value was determined, from which the mean values of percolation thresholds and standard deviations for current flow along and across the matrices were determined. Mean values , standard deviations σ and classical asymmetry coefficients A(x) of probability distributions of percolation threshold values were used to analyze the obtained results of percolation threshold simulations.
It was found that for a square-shaped matrix, the average values of percolation thresholds in both directions of current flow are the same. Lengthening the rectangular matrix while reducing its height causes the average value of the percolation threshold to begin to increase in the direction of current flow along the matrix. In contrast, the percolation threshold in the transverse direction begins to decrease. The mean value of the percolation threshold in the transverse direction decreases from 0.592664 to 0.403614. In the direction along the matrix, it increases from 0.592740 to 0.759847. The standard deviation for the direction along the matrix increases from 0.009732 to 0.021989. The value for the current flow in the transverse direction of the matrix increases from 0.009733 to 0.027463.
Based on the obtained values of the percolation threshold and standard deviations, the values of the classical asymmetry coefficients of the probability distributions were determined for both directions of current flow – along and across the square and rectangular matrices.
It is established that for a square-shaped matrix, the classical asymmetry coefficient is equal to zero. This means, that the probability distribution is symmetric. For rectangular matrices there are two values of asymmetry coefficients. For current flow across the matrix, the coefficients are negative, and their values indicate weak asymmetry. For current flow along the matrix, the asymmetry coefficients are positive. Up to the value of the quotient of length to height of the matrix d=16, there is weak asymmetry, above this value – moderate.
Histograms of probability distributions of percolation threshold values for square-shaped matrix and rectangular matrices were made. The probability distributions in the form of histograms were compared with normal distributions, determined by the mean values of percolation thresholds and standard deviations.
It was found that in rectangular matrices there are asymmetric probability distributions of percolation thresholds. For current flow in the transverse direction, the position of the maximum shifts, compared to the normal distribution, to the area of higher values of percolation thresholds. For current flow along the matrix, the position of the maximum shifts to the area of lower percolation threshold values.
It was found that the occurrence of the phenomenon of variation of percolation thresholds in layers with a rectangular cross-section for current flow along and across the layer should be considered when analyzing the results of testing the electrical conductivity of thin layers of insulating materials used in power transformers, composites, and nanocomposites.
Author Contributions
Conceptualization, V.B., P.O. and P.Z.; methodology, V.B., P.O., P.R., A.P. and P.Z.; software, P.O. and P.R.; validation, V.B., P.O. and P.Z.; formal analysis, V.B., P.O., P.R., A.P. and P.Z.; investigation, V.B., P.O., P.R., A.P. and P.Z.; resources, P.O. and A.P.; data curation, V.B., P.O., A.P. and P.Z.; writing—original draft preparation, V.B., P.O. and P.Z.; writing—review and editing, V.B.; visualization, V.B. and P.O.; supervision, V.B. and P.Z.; project administration, V.B. and P.Z.; funding acquisition, V.B., P.O. and P.R. All authors have read and agreed to the published version of the manuscript.
Funding
The research was supported by the subsidy of the Ministry of Education and Science (Poland) for the Lublin University of Technology as funds allocated for scientific activities in the scientific discipline of Automation, Electronics, Electrical Engineering and Space Technologies—grants: FD-20/EE-2/701, FD-20/EE-2/705, FD-20/EE-2/707.
Data Availability Statement
The original contributions presented in the study are included in the article, further inquiries can be directed to the corresponding author
Conflicts of Interest
The authors declare no conflict of interest.
References
- Prat, M. Percolation Model of Drying under Isothermal Conditions in Porous Media. International Journal of Multiphase Flow 1993, 19, 691–704. [Google Scholar] [CrossRef]
- Rossen, W.R.; Gauglitz, P.A. Percolation Theory of Creation and Mobilization of Foams in Porous Media. AIChE Journal 1990, 36, 1176–1188. [Google Scholar] [CrossRef]
- Stauffer, D.; Aharony, A. Introduction To Percolation Theory; Taylor & Francis, 2018. [Google Scholar]
- Wilkinson, D.; Willemsen, J.F. Invasion Percolation: A New Form of Percolation Theory. J Phys A Math Gen 1983, 16, 3365–3376. [Google Scholar] [CrossRef]
- Kirkpatrick, S. Percolation and Conduction. Rev Mod Phys 1973, 45, 574–588. [Google Scholar] [CrossRef]
- Hammersley, J.M.; Handscomb, D.C. Percolation Processes. In Monte Carlo Methods; Springer Netherlands: Dordrecht, 1964; pp. 134–141. [Google Scholar]
- Broadbent, S.R.; Hammersley, J.M. Percolation Processes. Mathematical Proceedings of the Cambridge Philosophical Society 1957, 53, 629–641. [Google Scholar] [CrossRef]
- Sieradzki, K.; Corderman, R.R.; Shukla, K.; Newman, R.C. Computer Simulations of Corrosion: Selective Dissolution of Binary Alloys. Philosophical Magazine A 1989, 59, 713–746. [Google Scholar] [CrossRef]
- Qiao, R.; Catherine Brinson, L. Simulation of Interphase Percolation and Gradients in Polymer Nanocomposites. Compos Sci Technol 2009, 69, 491–499. [Google Scholar] [CrossRef]
- Benkstein, K.D.; Kopidakis, N.; van de Lagemaat, J.; Frank, A.J. Influence of the Percolation Network Geometry on Electron Transport in Dye-Sensitized Titanium Dioxide Solar Cells. J Phys Chem B 2003, 107, 7759–7767. [Google Scholar] [CrossRef]
- Stanley, H.E.; Teixeira, J. Interpretation of the Unusual Behavior of H2O and D2O at Low Temperatures: Tests of a Percolation Model. J Chem Phys 1980, 73, 3404–3422. [Google Scholar] [CrossRef]
- Newman, M.E.J.; Ziff, R.M. Efficient Monte Carlo Algorithm and High-Precision Results for Percolation. Phys Rev Lett 2000, 85, 4104–4107. [Google Scholar] [CrossRef]
- Gawlinski, E.T.; Stanley, H.E. Continuum Percolation in Two Dimensions: Monte Carlo Tests of Scaling and Universality for Non-Interacting Discs. J Phys A Math Gen 1981, 14, L291–L299. [Google Scholar] [CrossRef]
- Sweeny, M. Monte Carlo Study of Weighted Percolation Clusters Relevant to the Potts Models. Phys Rev B 1983, 27, 4445–4455. [Google Scholar] [CrossRef]
- d’Iribarne, C.; Rasigni, G.; Rasigni, M. Determination of Site Percolation Transitions for 2D Mosaics by Means of the Minimal Spanning Tree Approach. Phys Lett A 1995, 209, 95–98. [Google Scholar] [CrossRef]
- Ziff, R.M.; Gu, H. Universal Condition for Critical Percolation Thresholds of Kagomé-like Lattices. Phys Rev E 2009, 79, 020102. [Google Scholar] [CrossRef] [PubMed]
- Suding, P.N.; Ziff, R.M. Site Percolation Thresholds for Archimedean Lattices. Phys Rev E 1999, 60, 275–283. [Google Scholar] [CrossRef]
- Sykes, M.F.; Essam, J.W. Exact Critical Percolation Probabilities for Site and Bond Problems in Two Dimensions. J Math Phys 1964, 5, 1117–1127. [Google Scholar] [CrossRef]
- Lee, M.J. Complementary Algorithms for Graphs and Percolation. Phys Rev E 2007, 76, 027702. [Google Scholar] [CrossRef] [PubMed]
- Feng, X.; Deng, Y.; Blöte, H.W.J. Percolation Transitions in Two Dimensions. Phys Rev E 2008, 78, 031136. [Google Scholar] [CrossRef]
- Dean, P.; Bird, N.F. Monte Carlo Estimates of Critical Percolation Probabilities. Mathematical Proceedings of the Cambridge Philosophical Society 1967, 63, 477–479. [Google Scholar] [CrossRef]
- Dean, P. A New Monte Carlo Method for Percolation Problems on a Lattice. Mathematical Proceedings of the Cambridge Philosophical Society 1963, 59, 397–410. [Google Scholar] [CrossRef]
- Tencer, J.; Forsberg, K.M. Postprocessing Techniques for Gradient Percolation Predictions on the Square Lattice. Phys Rev E 2021, 103, 012115. [Google Scholar] [CrossRef] [PubMed]
- Wang, J.; Kazemi, Y.; Wang, S.; Hamidinejad, M.; Mahmud, M.B.; Pötschke, P.; Park, C.B. Enhancing the Electrical Conductivity of PP/CNT Nanocomposites through Crystal-Induced Volume Exclusion Effect with a Slow Cooling Rate. Compos B Eng 2020, 183, 107663. [Google Scholar] [CrossRef]
- Haghgoo, M.; Ansari, R.; Hassanzadeh-Aghdam, M.K.; Nankali, M. Analytical Formulation for Electrical Conductivity and Percolation Threshold of Epoxy Multiscale Nanocomposites Reinforced with Chopped Carbon Fibers and Wavy Carbon Nanotubes Considering Tunneling Resistivity. Compos Part A Appl Sci Manuf 2019, 126, 105616. [Google Scholar] [CrossRef]
- Abdelrazek, E.M.; Abdelghany, A.M.; Tarabiah, A.E.; Zidan, H.M. AC Conductivity and Dielectric Characteristics of PVA/PVP Nanocomposite Filled with MWCNTs. Journal of Materials Science: Materials in Electronics 2019, 30, 15521–15533. [Google Scholar] [CrossRef]
- Qi, F.; Chen, N.; Wang, Q. Dielectric and Piezoelectric Properties in Selective Laser Sintered Polyamide11/BaTiO3/CNT Ternary Nanocomposites. Mater Des 2018, 143, 72–80. [Google Scholar] [CrossRef]
- Wang, Y.; Weng, G.J. Electrical Conductivity of Carbon Nanotube- and Graphene-Based Nanocomposites. In Micromechanics and Nanomechanics of Composite Solids; Springer International Publishing: Cham, 2018; pp. 123–156. [Google Scholar]
- Marsden, A.J.; Papageorgiou, D.G.; Vallés, C.; Liscio, A.; Palermo, V.; Bissett, M.A.; Young, R.J.; Kinloch, I.A. Electrical Percolation in Graphene-Polymer Composites. 2d Mater 2018, 5, 032003. [Google Scholar] [CrossRef]
- Yu, Z.; Bai, Y.; Wang, J.H.; Li, Y. Effects of Functional Additives on Structure and Properties of Polycarbonate-Based Composites Filled with Hybrid Chopped Carbon Fiber/Graphene Nanoplatelet Fillers. ES Energy & Environment 2021, 12, 66–76. [Google Scholar]
- Xie, P.; Liu, Y.; Feng, M.; Niu, M.; Liu, C.; Wu, N.; Sui, K.; Patil, R.R.; Pan, D.; Guo, Z.; et al. Hierarchically Porous Co/C Nanocomposites for Ultralight High-Performance Microwave Absorption. Adv Compos Hybrid Mater 2021, 4, 173–185. [Google Scholar] [CrossRef]
- Liu, H.-C.; Zeng, S.-M.; Li, R.; Jiang, Y.-P.; Liu, Q.-X.; Tang, X.-G. Multiferroic Properties and Resistive Switching Behaviors of Ni0.5Zn0.5FeO24 Thin Films. Adv Compos Hybrid Mater 2021, 4, 1–7. [Google Scholar] [CrossRef]
- Wang, X.; Shi, Z.; Chen, M.; Fan, R.; Yan, K.; Sun, K.; Pan, S.; Yu, M. Tunable Electromagnetic Properties in Co/Al2O3 Cermets Prepared by Wet Chemical Method. Journal of the American Ceramic Society 2014, 97, 3223–3229. [Google Scholar] [CrossRef]
- Jiang, Y.; Xie, P.; Wang, Z.; Fan, G.; Qu, Y.; Sun, K.; Man, H.; Zhang, Z.; Liu, Y.; Fan, R. Iron Granular Percolative Composites toward Radio-Frequency Negative Permittivity. ECS Journal of Solid State Science and Technology 2018, 7, N132–N136. [Google Scholar] [CrossRef]
- Ao, X.; Wang, X.; Tan, J.; Zhang, S.; Su, C.; Dong, L.; Tang, M.; Wang, Z.; Tian, B.; Wang, H. Nanocomposite with Fast Li+ Conducting Percolation Network: Solid Polymer Electrolyte with Li+ Non-Conducting Filler. Nano Energy 2021, 79, 105475. [Google Scholar] [CrossRef]
- Fang, C.; Zhang, J.; Chen, X.; Weng, G.J. Calculating the Electrical Conductivity of Graphene Nanoplatelet Polymer Composites by a Monte Carlo Method. Nanomaterials 2020, 10, 1129. [Google Scholar] [CrossRef] [PubMed]
- Khosla, A.; Shah, S.; Shiblee, M.N.I.; Mir, S.H.; Nagahara, L.A.; Thundat, T.; Shekar, P.K.; Kawakami, M.; Furukawa, H. Carbon Fiber Doped Thermosetting Elastomer for Flexible Sensors: Physical Properties and Microfabrication. Sci Rep 2018, 8, 12313. [Google Scholar] [CrossRef]
- Zukowski, P.; Koltunowicz, T.N.; Bondariev, V.; Fedotov, A.K.; Fedotova, J.A. Determining the Percolation Threshold for (FeCoZr)x(CaF2)(100−x) Nanocomposites Produced by Pure Argon Ion-Beam Sputtering. J Alloys Compd 2016, 683, 62–66. [Google Scholar] [CrossRef]
- Moya, J.S.; Lopez-Esteban, S.; Pecharromán, C. The Challenge of Ceramic/Metal Microcomposites and Nanocomposites. Prog Mater Sci 2007, 52, 1017–1090. [Google Scholar] [CrossRef]
- Faupel, F.; Zaporojtchenko, V.; Strunskus, T.; Elbahri, M. Metal-Polymer Nanocomposites for Functional Applications. Adv Eng Mater 2010, 12, 1177–1190. [Google Scholar] [CrossRef]
- Sarychev, A. Electromagnetic Field Fluctuations and Optical Nonlinearities in Metal-Dielectric Composites. Phys Rep 2000, 335, 275–371. [Google Scholar] [CrossRef]
- Singh, D.K.; Singh, S.; Singh, P. Nanomaterials; Singh, D.K. , Singh, S., Singh, P., Eds.; Springer Nature Singapore: Singapore, 2023. [Google Scholar]
- Ramesh, K.T. Nanomaterials. In Nanomaterials; Springer US: Boston, MA, 2009; pp. 1–20. [Google Scholar]
- Mott, N.F.; Davis, E.A. Electronic Processes in Non-Crystalline Materials; Clarendon Press, 1979. [Google Scholar]
- Żukowski, P.; Kierczyński, K.; Koltunowicz, T.N.; Rogalski, P.; Subocz, J. Application of Elements of Quantum Mechanics in Analysing AC Conductivity and Determining the Dimensions of Water Nanodrops in the Composite of Cellulose and Mineral Oil. Cellulose 2019, 26, 2969–2985. [Google Scholar] [CrossRef]
- Svito, I.A.; Fedotov, A.K.; Saad, A.; Zukowski, P.; Koltunowicz, T.N. Influence of Oxide Matrix on Electron Transport in (FeCoZr)x(Al2O3)1-x Nanocomposite Films. J Alloys Compd 2017, 699, 818–823. [Google Scholar] [CrossRef]
- Pogrebnjak, A.; Ivashchenko, V.; Maksakova, O.; Buranich, V.; Konarski, P.; Bondariev, V.; Zukowski, P.; Skrynskyy, P.; Sinelnichenko, A.; Shelest, I.; Erdybaeva, N.; Galaszkiewicz, P.; Koltunowicz, T.N. Comparative Measurements and Analysis of the Mechanical and Electrical Properties of Ti-Zr-C Nanocomposite: Role of Stoichiometry. Measurement 2021, 176, 109223. [Google Scholar] [CrossRef]
- Zukowski, P.; Galaszkiewicz, P.; Bondariev, V.; Okal, P.; Pogrebnjak, A.; Kupchishin, A.; Ruban, A.; Pogorielov, M.; Koltunowicz, T.N. Comparative Measurements and Analysis of the Electrical Properties of Nanocomposites TixZr1−xC+α-Cy (0.0 ≤ x ≤ 1.0). Materials 2022, 15, 7908. [Google Scholar] [CrossRef] [PubMed]
- Koltunovich, T.N.; Galashkevich, P.; Kierczynski, K.; Rogalski, P.; Okal, P.; Pogrebnjak, A.D.; Buranich, V.; Pogorielov, M.; Diedkova, K.; Zahorodna, V.; Balitskyi, V.; Serhiienko, V.; Baginskyi, I; Gogotsi, O. Investigation of AC Electrical Properties of MXene-PCL Nanocomposites for Application in Small and Medium Power Generation. Energies 2021, 14, 7123. [Google Scholar] [CrossRef]
- Zukowski, P.; Okal, P.; Kierczynski, K.; Rogalski, P.; Bondariev, V. Analysis of Uneven Distribution of Nodes Creating a Percolation Channel in Matrices with Translational Symmetry for Direct Current. Energies 2023, 16(22), 7647. [Google Scholar] [CrossRef]
- Zukowski, P.; Okal, P.; Kierczynski, K.; Rogalski, P.; Borucki, S.; Kunicki, M.; Koltunowicz, T.N. Investigations into the Influence of Matrix Dimensions and Number of Iterations on the Percolation Phenomenon for Direct Current. Energies 2023, 16(20), 7128. [Google Scholar] [CrossRef]
- Gilli, M.; Maringer, D.; Schumann, E. Generating Random Numbers. In Numerical Methods and Optimization in Finance; Elsevier, 2019; pp. 103–132. [Google Scholar]
- Gentle, J.E. Computational Statistics. In International Encyclopedia of Education; Elsevier, 2010; pp. 93-97.
- Muralidhar, K. Monte Carlo Simulation. In Encyclopedia of Information Systems; Elsevier, 2003; pp. 193-201.
- Johansen, A.M. Monte Carlo Methods. In International Encyclopedia of Education; Elsevier, 2010; pp. 296-303.
- Matsumoto, M.; Nishimura, T. Mersenne Twister. ACM Transactions on Modeling and Computer Simulation 1998, 8, 3–30. [Google Scholar] [CrossRef]
- Noel, K. Analysis of Random Generators in Monte Carlo Simulation: the Mersenne Twister and Sobol. SSRN Electronic Journal 2016. [Google Scholar] [CrossRef]
- Nowak, R. Statistics For Physicists; WYDAWNICTO NAUKOWE PWN, 2002.
- Wasselynck, G.; Trichet, D.; Fouladgar, J. Determination of the Electrical Conductivity Tensor of a CFRP Composite Using a 3-D Percolation Model. IEEE Trans Magn 2013, 49, 1825–1828. [Google Scholar] [CrossRef]
- Aryanfar, A.; Medlej, S.; Tarhini, A.; Damadi, S.R.; Tehrani B., A. R.; Goddard III, W.A. 3D Percolation Modeling for Predicting the Thermal Conductivity of Graphene-Polymer Composites. Comput Mater Sci 2021, 197, 110650. [Google Scholar] [CrossRef]
- R̈ímská, Z.; Křuesálek, V.; S̈pac̈ek, J. AC Conductivity of Carbon Fiber-Polymer Matrix Composites at the Percolation Threshold. Polym Compos 2002, 23, 95–103. [Google Scholar] [CrossRef]
- Wang, M.; Gurunathan, R.; Imasato, K.; Geisendorfer, N.R.; Jakus, A.E.; Peng, J.; Shah, R.N.; Grayson, M.; Snyder, G.J. A Percolation Model for Piezoresistivity in Conductor-Polymer Composites. Adv Theory Simul 2019, 2, 1800125. [Google Scholar] [CrossRef]
- Rahaman, M.; Aldalbahi, A.; Govindasami, P.; Khanam, N.; Bhandari, S.; Feng, P.; Altalhi, T. A New Insight in Determining the Percolation Threshold of Electrical Conductivity for Extrinsically Conducting Polymer Composites through Different Sigmoidal Models. Polymers (Basel) 2017, 9, 527. [Google Scholar] [CrossRef]
- Zare, Y.; Rhee, K.Y. A Simple Methodology to Predict the Tunneling Conductivity of Polymer/CNT Nanocomposites by the Roles of Tunneling Distance, Interphase and CNT Waviness. RSC Adv 2017, 7, 34912–34921. [Google Scholar] [CrossRef]
- Tomes, O.; Soul, A.; Zhang, H.; Bilotti, E.; Papageorgiou, D.G. A Novel Electrical Depercolation Model for Stretchable Nanocomposite Strain Sensors. Nanoscale 2024, 16, 6163–6175. [Google Scholar] [CrossRef]
- Zare, Y.; Rhee, K.-Y.; Park, S.-J. A Developed Equation for Electrical Conductivity of Polymer Carbon Nanotubes (CNT) Nanocomposites Based on Halpin-Tsai Model. Results Phys 2019, 14, 102406. [Google Scholar] [CrossRef]
- Wang, L.; Song, P.; Lin, C.-T.; Kong, J.; Gu, J. 3D Shapeable, Superior Electrically Conductive Cellulose Nanofibers/Ti3C2Tx MXene Aerogels/Epoxy Nanocomposites for Promising EMI Shielding. Research 2020, 2020. [Google Scholar] [CrossRef] [PubMed]
- Hicks, J.; Behnam, A.; Ural, A. A Computational Study of Tunneling-Percolation Electrical Transport in Graphene-Based Nanocomposites. Appl Phys Lett 2009, 95. [Google Scholar] [CrossRef]
|
Disclaimer/Publisher’s Note: The statements, opinions and data contained in all publications are solely those of the individual author(s) and contributor(s) and not of MDPI and/or the editor(s). MDPI and/or the editor(s) disclaim responsibility for any injury to people or property resulting from any ideas, methods, instructions or products referred to in the content. |
© 2024 by the authors. Licensee MDPI, Basel, Switzerland. This article is an open access article distributed under the terms and conditions of the Creative Commons Attribution (CC BY) license (http://creativecommons.org/licenses/by/4.0/).
