1. Introduction
The growth dynamics of fish have long been a subject of interest in ichthyology, aquaculture, and fisheries management [
1]. Understanding the internal factors influencing fish growth is crucial for optimizing aquaculture practices, managing wild fish populations, and predicting ecosystem responses to environmental changes [
2,
3]. This study aims to elucidate the complex interplay of endogenous factors that regulate fish growth.
Fish growth is a multifaceted process influenced by both external environmental factors and internal physiological mechanisms [
4]. While external factors such as temperature, food availability, and water quality have been extensively studied [
5], the internal regulatory processes driving growth variations among individuals and species remain less understood [
6]. Recent advances in molecular biology and endocrinology have shed new light on the intricate network of internal factors governing fish growth [
7,
8].
The growth hormone (GH)-insulin-like growth factor-I (IGF-I) axis plays a central role in regulating fish growth [
9]. However, the exact mechanisms by which this axis interacts with other endocrine systems, such as the thyroid and reproductive hormones, are still debated [
10,
11]. Moreover, the relative importance of the GH-IGF-I axis versus local tissue-specific growth factors remains controversial [
12].
Genetic factors also significantly contribute to growth variability in fish [
13]. Quantitative trait loci (QTL) associated with growth-related traits have been identified in various species [
14], but the functional roles of many growth-related genes and their interactions are yet to be fully elucidated [
15]. The emerging field of epigenetics has further complicated our understanding of growth regulation, suggesting that environmental factors can influence gene expression patterns across generations [
16].
Metabolic processes, including protein turnover, lipid metabolism, and energy allocation, are integral to fish growth [
17]. However, the molecular mechanisms underlying metabolic efficiency and their relationship to growth performance are not fully understood [
18]. Additionally, the impact of gut microbiota on fish metabolism and growth has recently gained attention, opening new avenues for research [
19].
This study aims to integrate current knowledge and provide new insights into the complex network of internal factors influencing fish growth dynamics. Our findings may have significant implications for selective breeding programs, feed formulation strategies, and the development of novel growth-enhancing techniques in aquaculture.
This research contributes to a more comprehensive understanding of the endogenous mechanisms driving fish growth, potentially leading to improved aquaculture practices and more accurate models for fisheries management.
2. Materials and Methods
Fish Samples and Rearing Conditions
This study examined four varieties of Cyprinus carpio: Frăsinet, Ineu, Podu Iloaiei, and Koi. The Frăsinet variety was obtained from a private farmer who had maintained the pure race for over 10 years. The other three varieties (Ineu, Podu Iloaiei, and Koi) were reared at the Research and Development Station for Aquaculture and Aquatic Ecology of “Alexandru Ioan Cuza” University in Iași, Romania.
Fish were maintained in outdoor earthen ponds under natural photoperiod and temperature conditions. Water quality parameters (temperature, dissolved oxygen, pH, and ammonia levels) were monitored daily and maintained within the optimal range for carp growth.
Sampling and Measurements
Sampling was conducted at four ontogenic stages: 7 days post-hatch, summer fingerlings (0⁺), one year and summer old (1⁺), and two years and summer old (2⁺). At each stage, 30 individuals per variety were randomly selected for measurements (n = 120 per stage, total N = 480).
The following morphometric parameters were measured for each fish:
Total length (TL): measured from the tip of the snout to the end of the caudal fin using an ichthyometer.
Maximum height (MH): measured at the deepest part of the body using an ichthyometer.
Weight (W): determined using an electronic balance (precision: 0.01 g).
All measurements were performed by trained personnel to ensure consistency and minimize handling stress.
3. Results
3.1. Growth Performance
The growth performance of four Cyprinus carpio varieties (Frăsinet, Ineu, Podu Iloaiei, and Koi) was evaluated at three different age stages: summer fingerlings (0⁺), one year and summer old (1⁺), and two years and summer old (2⁺). The parameters assessed included Weight Gain (WG), Specific Growth Rate (SGR), and Relative Growth Rate (RGR).
3.1.1. Weight Gain (WG)
At the 0⁺ stage, Frăsinet and Podu Iloaiei varieties showed significantly higher WG (37.55 ± 0.15 g and 37.37 ± 0.14 g, respectively) compared to Koi (36.75 ± 0.08 g) and Ineu (36.27 ± 0.11 g) varieties (p < 0.05) (
Table 1).
For the 1⁺ stage, Podu Iloaiei exhibited the highest WG (583.65 ± 1.68 g), followed by Ineu (560.79 ± 2.00 g), Frăsinet (471.13 ± 1.78 g), and Koi (77.73 ± 2.10 g). All differences were statistically significant (p < 0.05) (
Table 1).
At the 2⁺ stage, Podu Iloaiei, Ineu, and Frăsinet showed similar WG values (849.73 ± 4.09 g, 846.25 ± 5.17 g, and 834.45 ± 5.28 g, respectively) with no significant differences. However, Koi exhibited significantly lower WG (403.99 ± 14.21 g) compared to the other varieties (p < 0.05) (
Table 1).
3.1.2. Specific Growth Rate (SGR)
For the 0⁺ stage, Podu Iloaiei, Koi, and Ineu showed higher SGR values (2.73 ± 0.04, 2.70 ± 0.09, and 2.57 ± 0.07 % day⁻¹, respectively) compared to Frăsinet (2.20 ± 0.05 % day⁻¹) (p < 0.05) (
Table 2).
At the 1⁺ stage, Podu Iloaiei and Ineu exhibited the highest SGR (0.33 ± 0.00 % day⁻¹ for both), followed by Frăsinet (0.31 ± 0.00 % day⁻¹) and Koi (0.13 ± 0.00 % day⁻¹). All differences were statistically significant (p < 0.05) (
Table 2).
For the 2⁺ stage, Koi showed the highest SGR (0.18 ± 0.00 % day⁻¹), followed by Frăsinet (0.12 ± 0.00 % day⁻¹), while Ineu and Podu Iloaiei had the lowest values (0.10 ± 0.00 % day⁻¹ for both) (p < 0.05) (
Table 2).
3.1.3. Relative Growth Rate (RGR)
At the 0⁺ stage, Koi exhibited the highest RGR (508.59 ± 141.95 g day⁻¹), which was significantly different from Frăsinet (119.98 ± 21.13 g day⁻¹) (p < 0.05). Ineu and Podu Iloaiei showed intermediate values with no significant differences from the other varieties (
Table 3).
For the 1⁺ stage, Podu Iloaiei and Ineu showed the highest RGR (4.26 ± 0.02 and 4.21 ± 0.02 g day⁻¹, respectively), followed by Frăsinet (3.40 ± 0.02 g day⁻¹) and Koi (0.58 ± 0.02 g day⁻¹). All differences were statistically significant (p < 0.05) (
Table 3).
At the 2⁺ stage, Koi exhibited the highest RGR (0.98 ± 0.05 g day⁻¹), which was significantly different from all other varieties (p < 0.05). Frăsinet, Ineu, and Podu Iloaiei showed lower RGR values (0.45 ± 0.00, 0.39 ± 0.00, and 0.38 ± 0.00 g day⁻¹, respectively) with no significant differences among them (
Table 3).
3.2. Profile Index
The profile index, which is the ratio of maximum height to total length, was analyzed for the four
Cyprinus carpio varieties (Frăsinet, Ineu, Podu Iloaiei, and Koi) at four different life stages: 7 days post-hatch, summer fingerlings (0⁺), one year and summer old (1⁺), and two years and summer old (2⁺) (
Table 4).
At 7 days post-hatch, significant differences were observed among all varieties (p < 0.05). Podu Iloaiei exhibited the highest profile index (4.22 ± 0.149), followed by Koi (3.69 ± 0.101), Frăsinet (3.06 ± 0.07), and Ineu (2.9 ± 0.07) (
Table 4).
For the 0⁺ stage, Koi showed the highest profile index (2.93 ± 0.023), which was significantly different from all other varieties (p < 0.05). Frăsinet had the second-highest value (2.57 ± 0.006), while Podu Iloaiei and Ineu showed lower, similar values (2.45 ± 0.009 and 2.44 ± 0.009, respectively) with no significant difference between them (
Table 4).
At the 1⁺ stage, Koi maintained the highest profile index (2.48 ± 0.005), followed by Frăsinet (2.4 ± 0.005). Podu Iloaiei and Ineu again showed lower, similar values (2.18 ± 0.008 and 2.17 ± 0.005, respectively). All differences were statistically significant (p < 0.05) except between Podu Iloaiei and Ineu (
Table 4).
For the 2⁺ stage, Frăsinet exhibited the highest profile index (2.43 ± 0.005), which was significantly different from all other varieties (p < 0.05). Podu Iloaiei, Koi, and Ineu showed lower values (2.18 ± 0.004, 2.17 ± 0.005, and 2.16 ± 0.004, respectively) with no significant differences among them (
Table 4).
The profile index generally decreased as the fish aged, with the highest values observed at 7 days post-hatch and the lowest at the 2⁺ stage for most varieties. However, the rate and pattern of decrease varied among the varieties:
Frăsinet showed a gradual decrease from 3.06 at 7 days to 2.43 at 2⁺.
Ineu exhibited a sharp drop from 2.9 at 7 days to 2.44 at 0⁺, then stabilized around 2.16-2.17 for later stages.
Podu Iloaiei had the most dramatic change, falling from 4.22 at 7 days to 2.45 at 0⁺, then stabilizing around 2.18 for later stages.
Koi showed a unique pattern, decreasing from 3.69 at 7 days to 2.93 at 0⁺, but then maintaining a higher profile index compared to other varieties at 1⁺ before converging with others at 2⁺.
3.3. Fulton’s Condition Factor
Fulton’s condition factor was analyzed for the four Cyprinus carpio varieties at four different life stages: 7 days post-hatch, summer fingerlings (0⁺), one year and summer old (1⁺), and two years and summer old (2⁺).
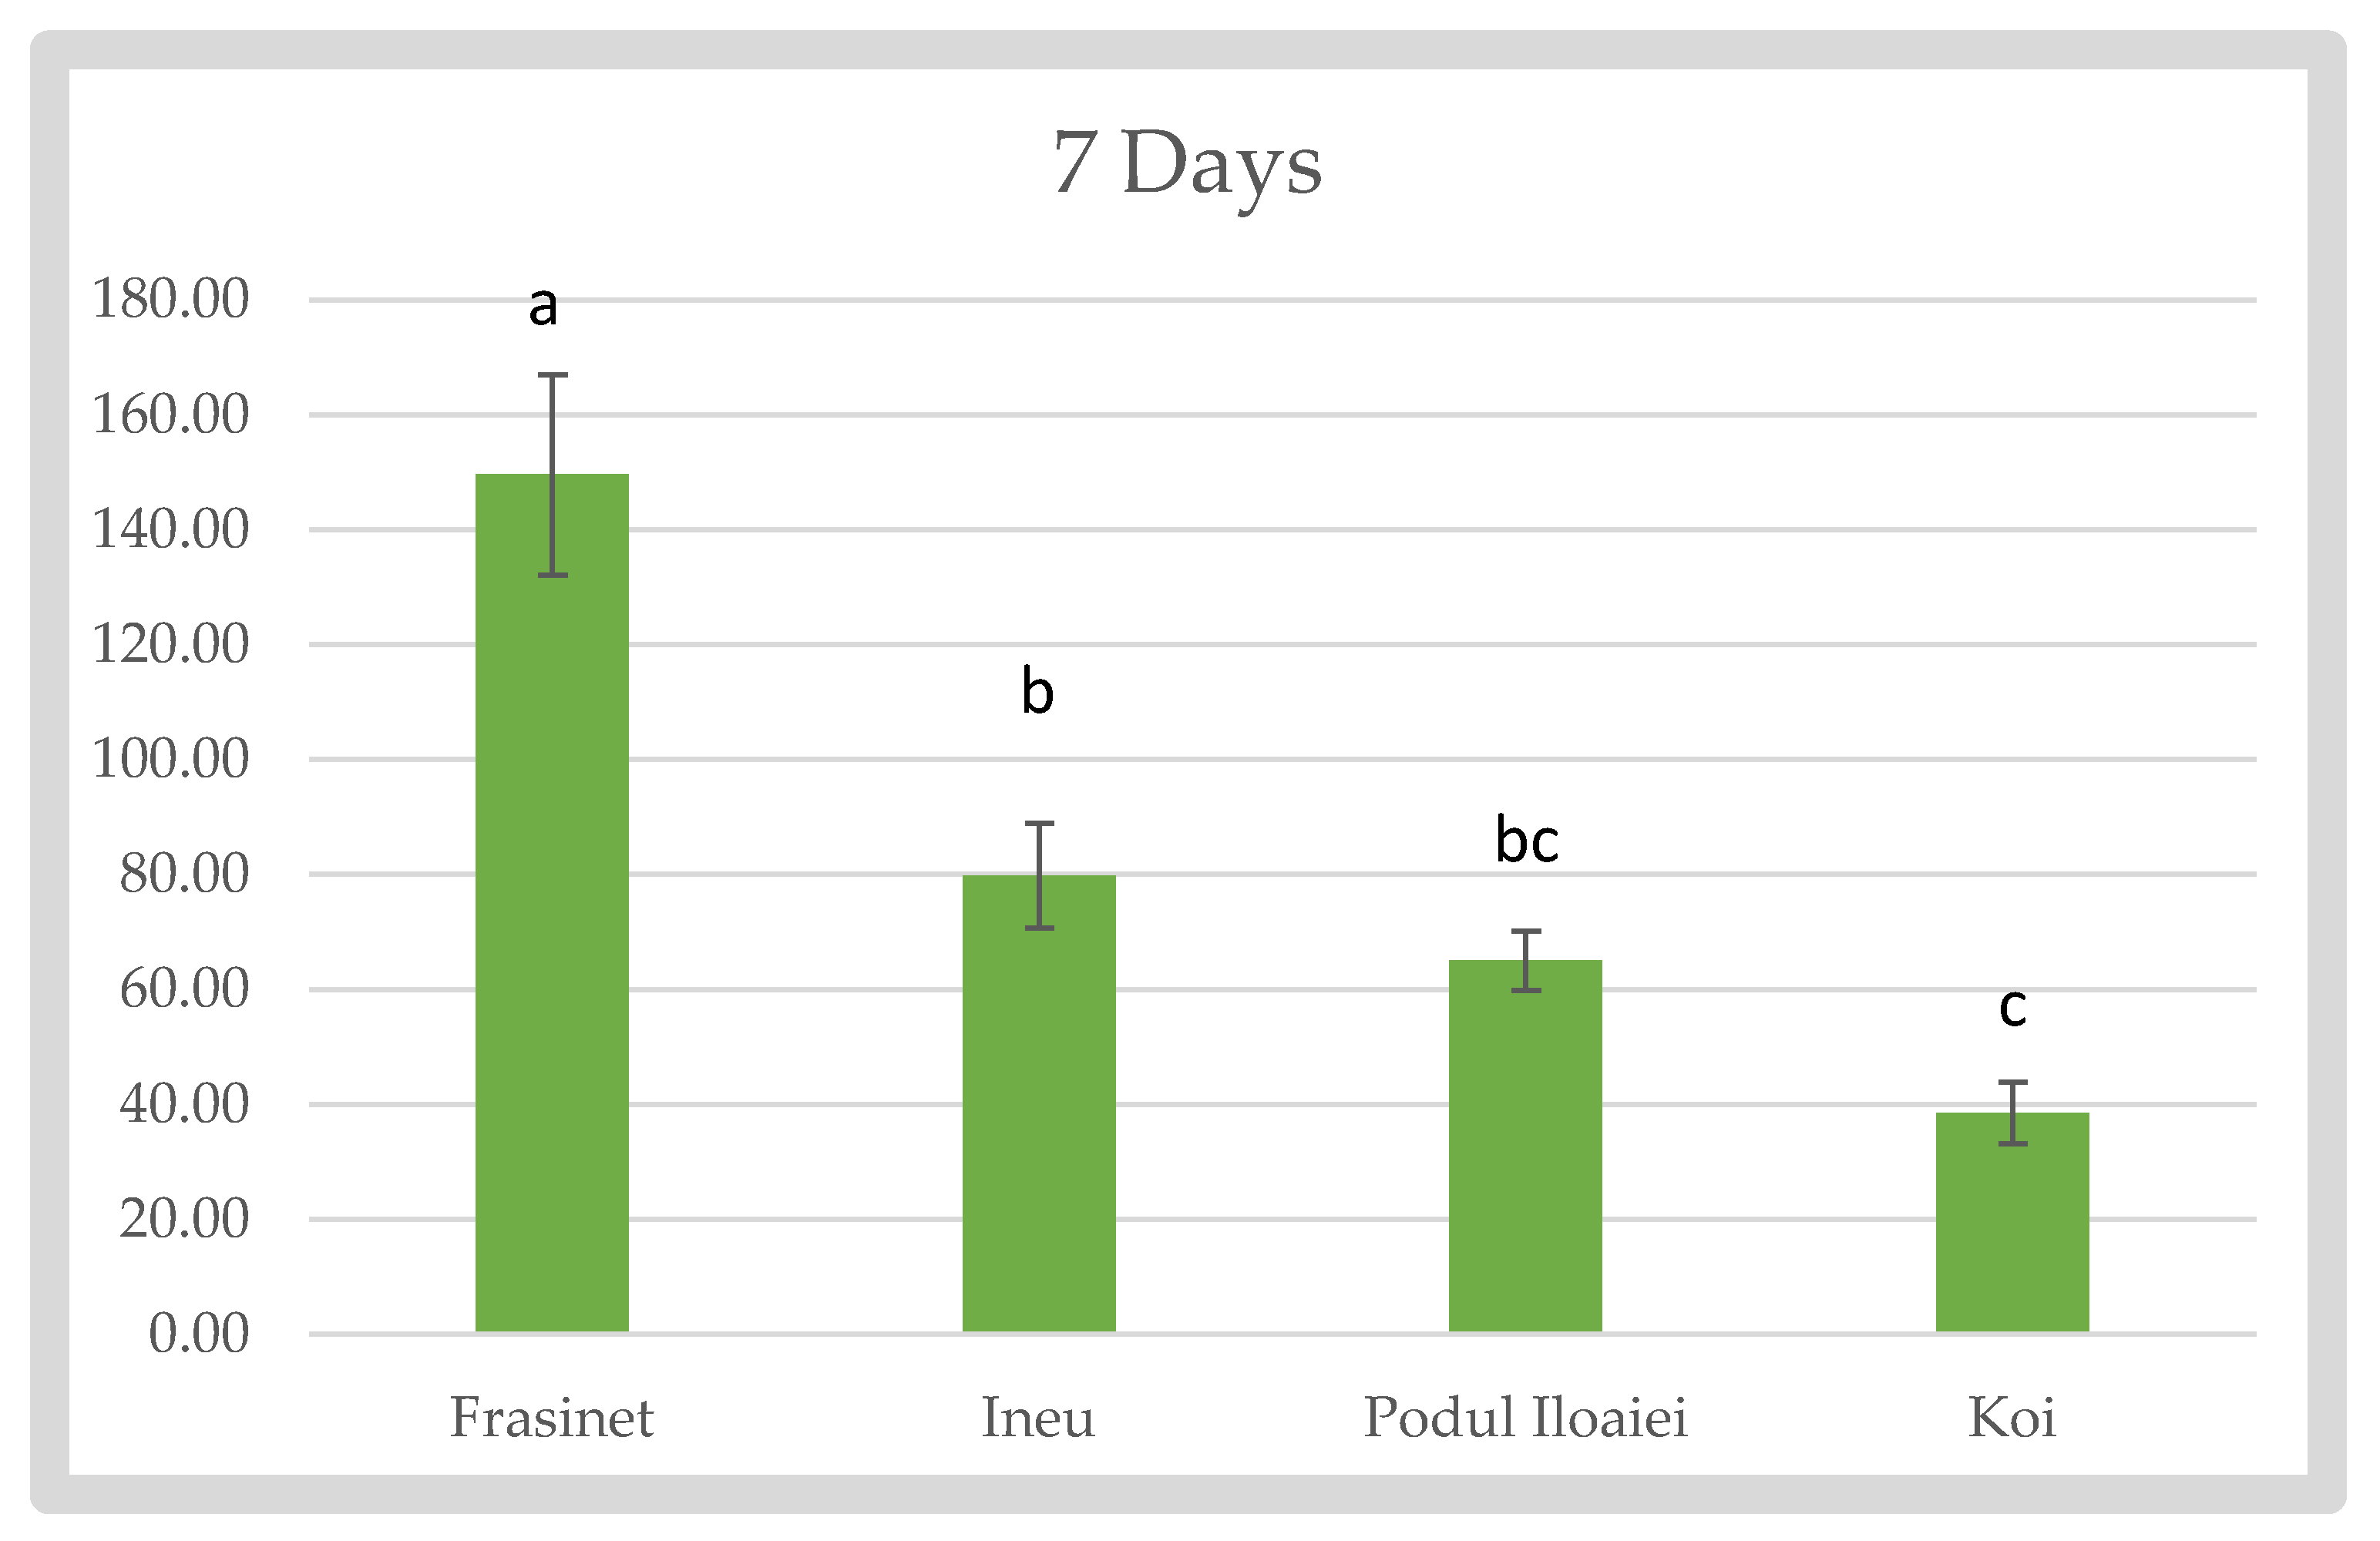
At 7 days post-hatch (
Figure 1), significant differences were observed among the varieties (p < 0.05). Frăsinet exhibited the highest Fulton’s index (149.57 ± 17.485), followed by Ineu (79.83 ± 9.173), Podu Iloaiei (65.02 ± 5.108), and Koi (38.55 ± 5.417).
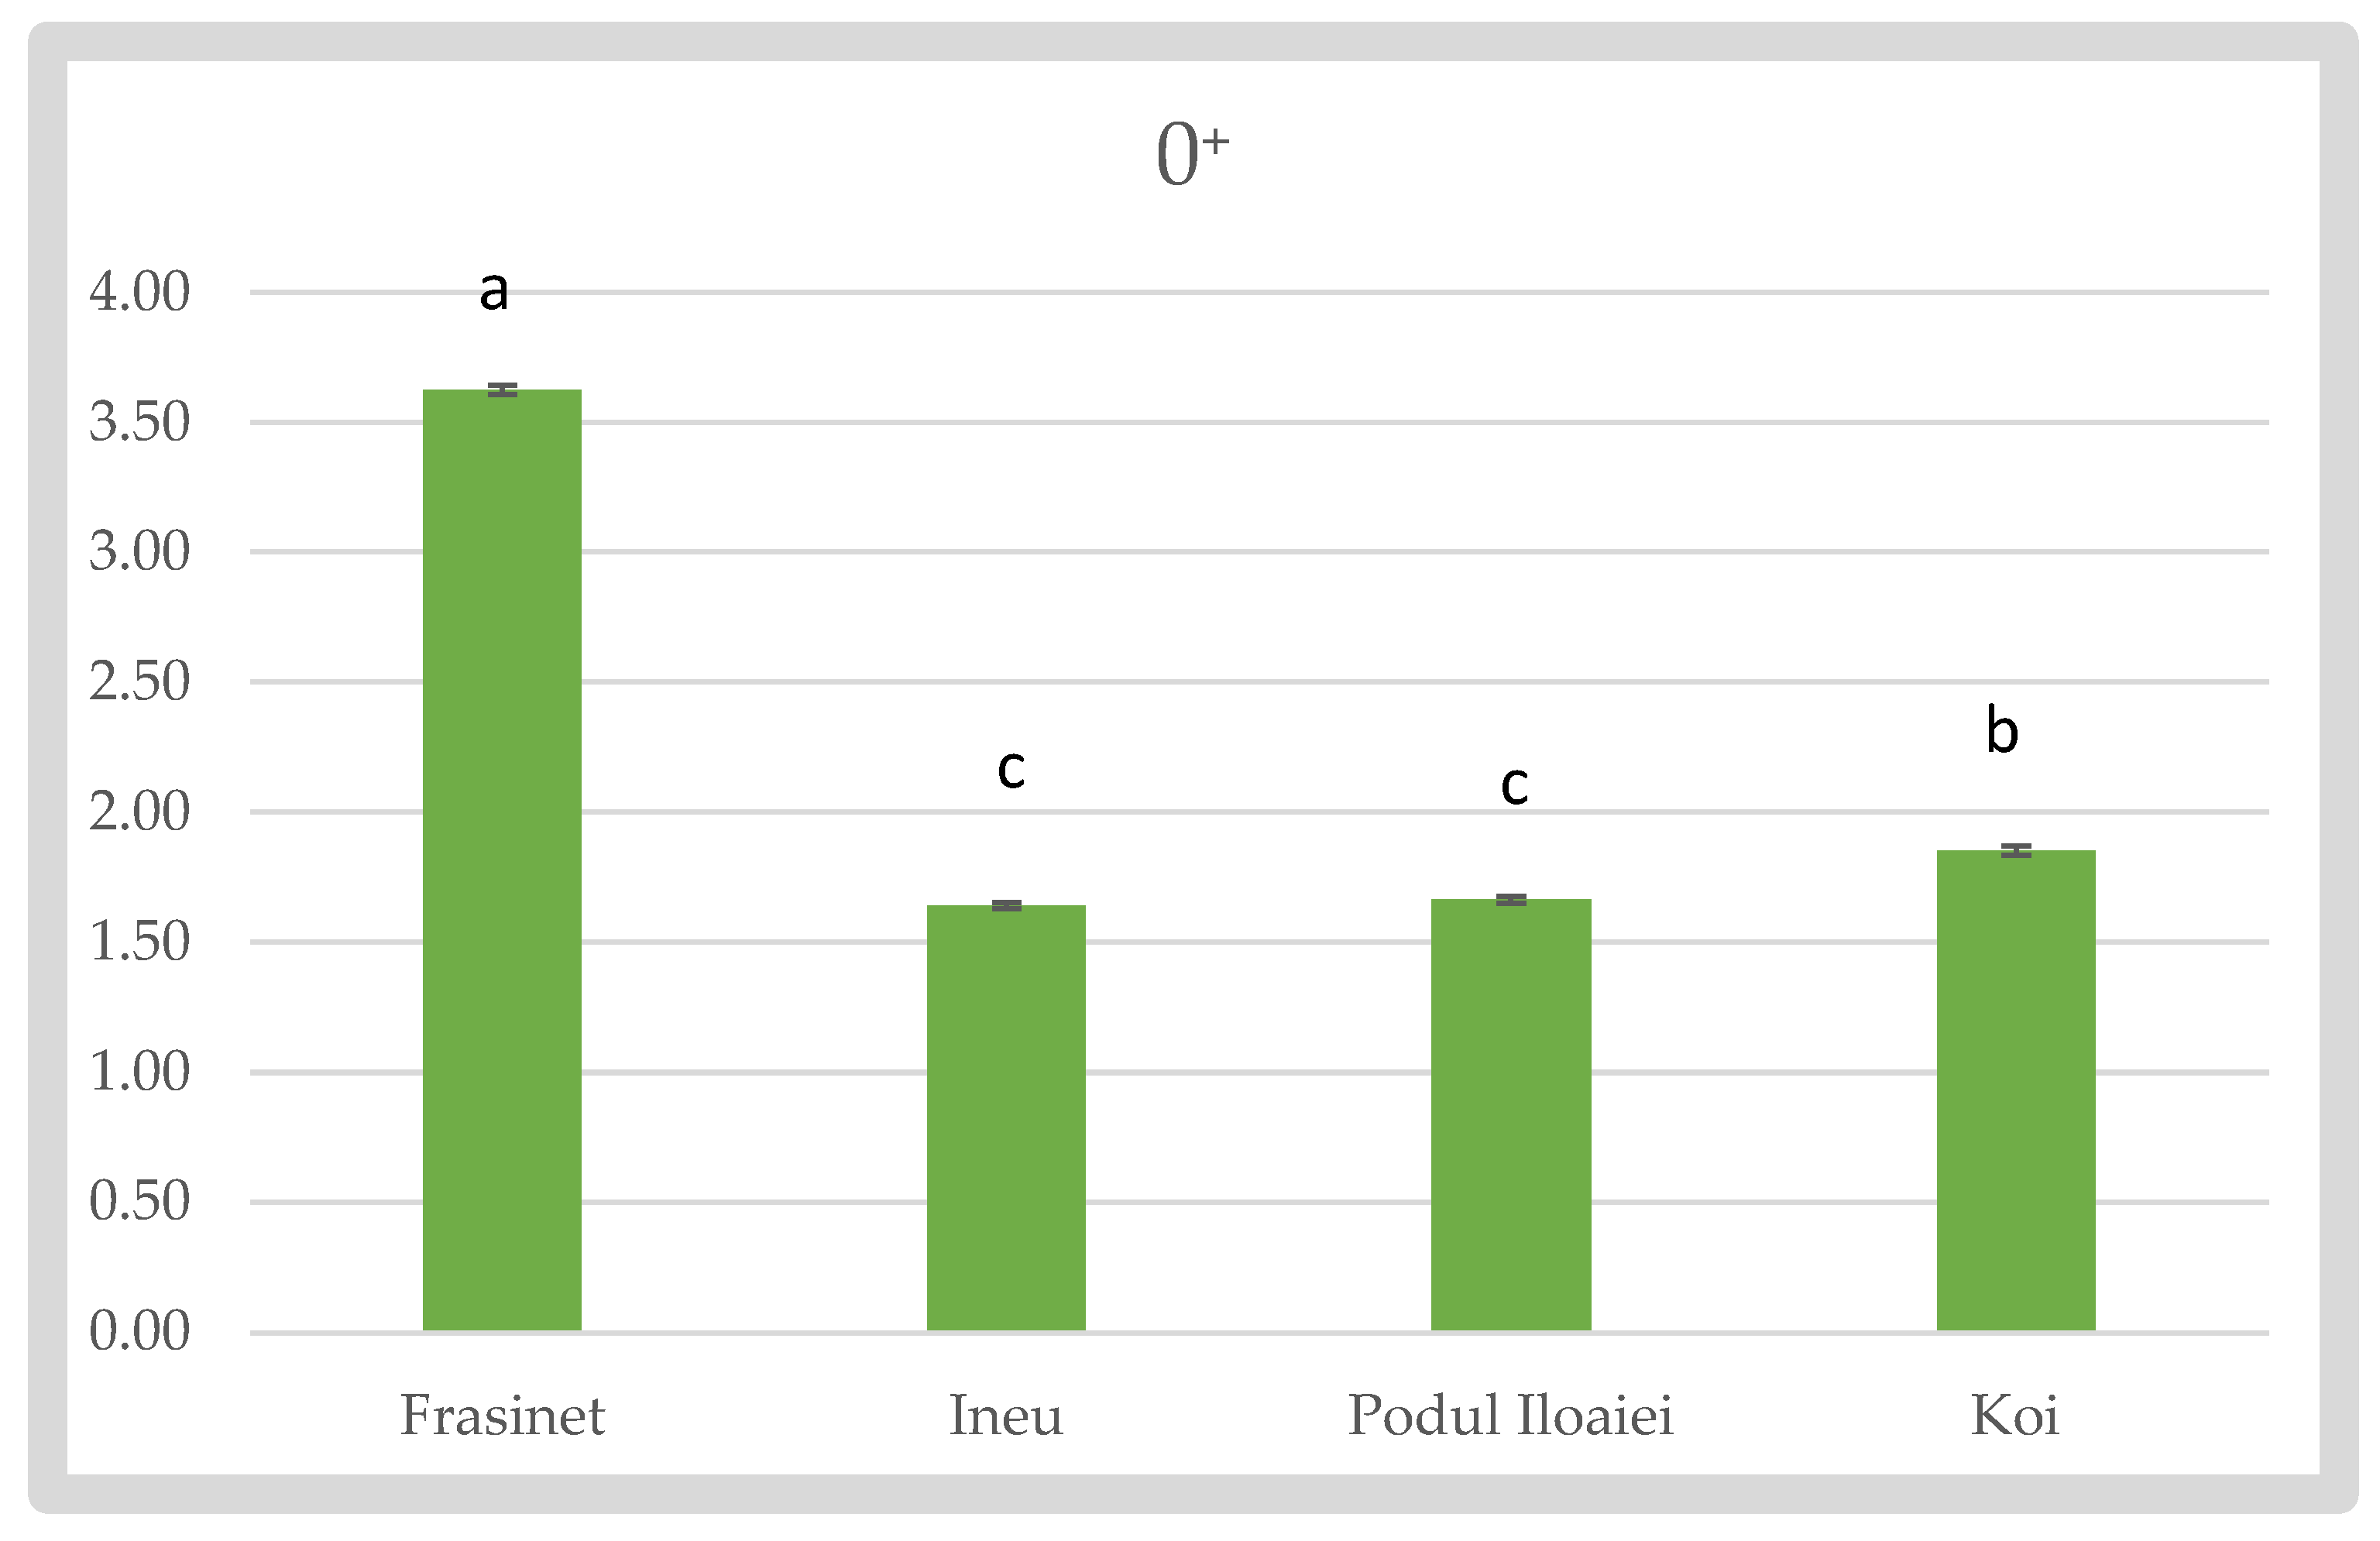
For the 0⁺ stage, Frăsinet maintained the highest Fulton’s index (3.63 ± 0.018), significantly different from all other varieties (p < 0.05). Koi showed the second-highest value (1.85 ± 0.017), while Podu Iloaiei and Ineu had lower, similar values (1.66 ± 0.014 and 1.64 ± 0.012, respectively) (
Figure 2).
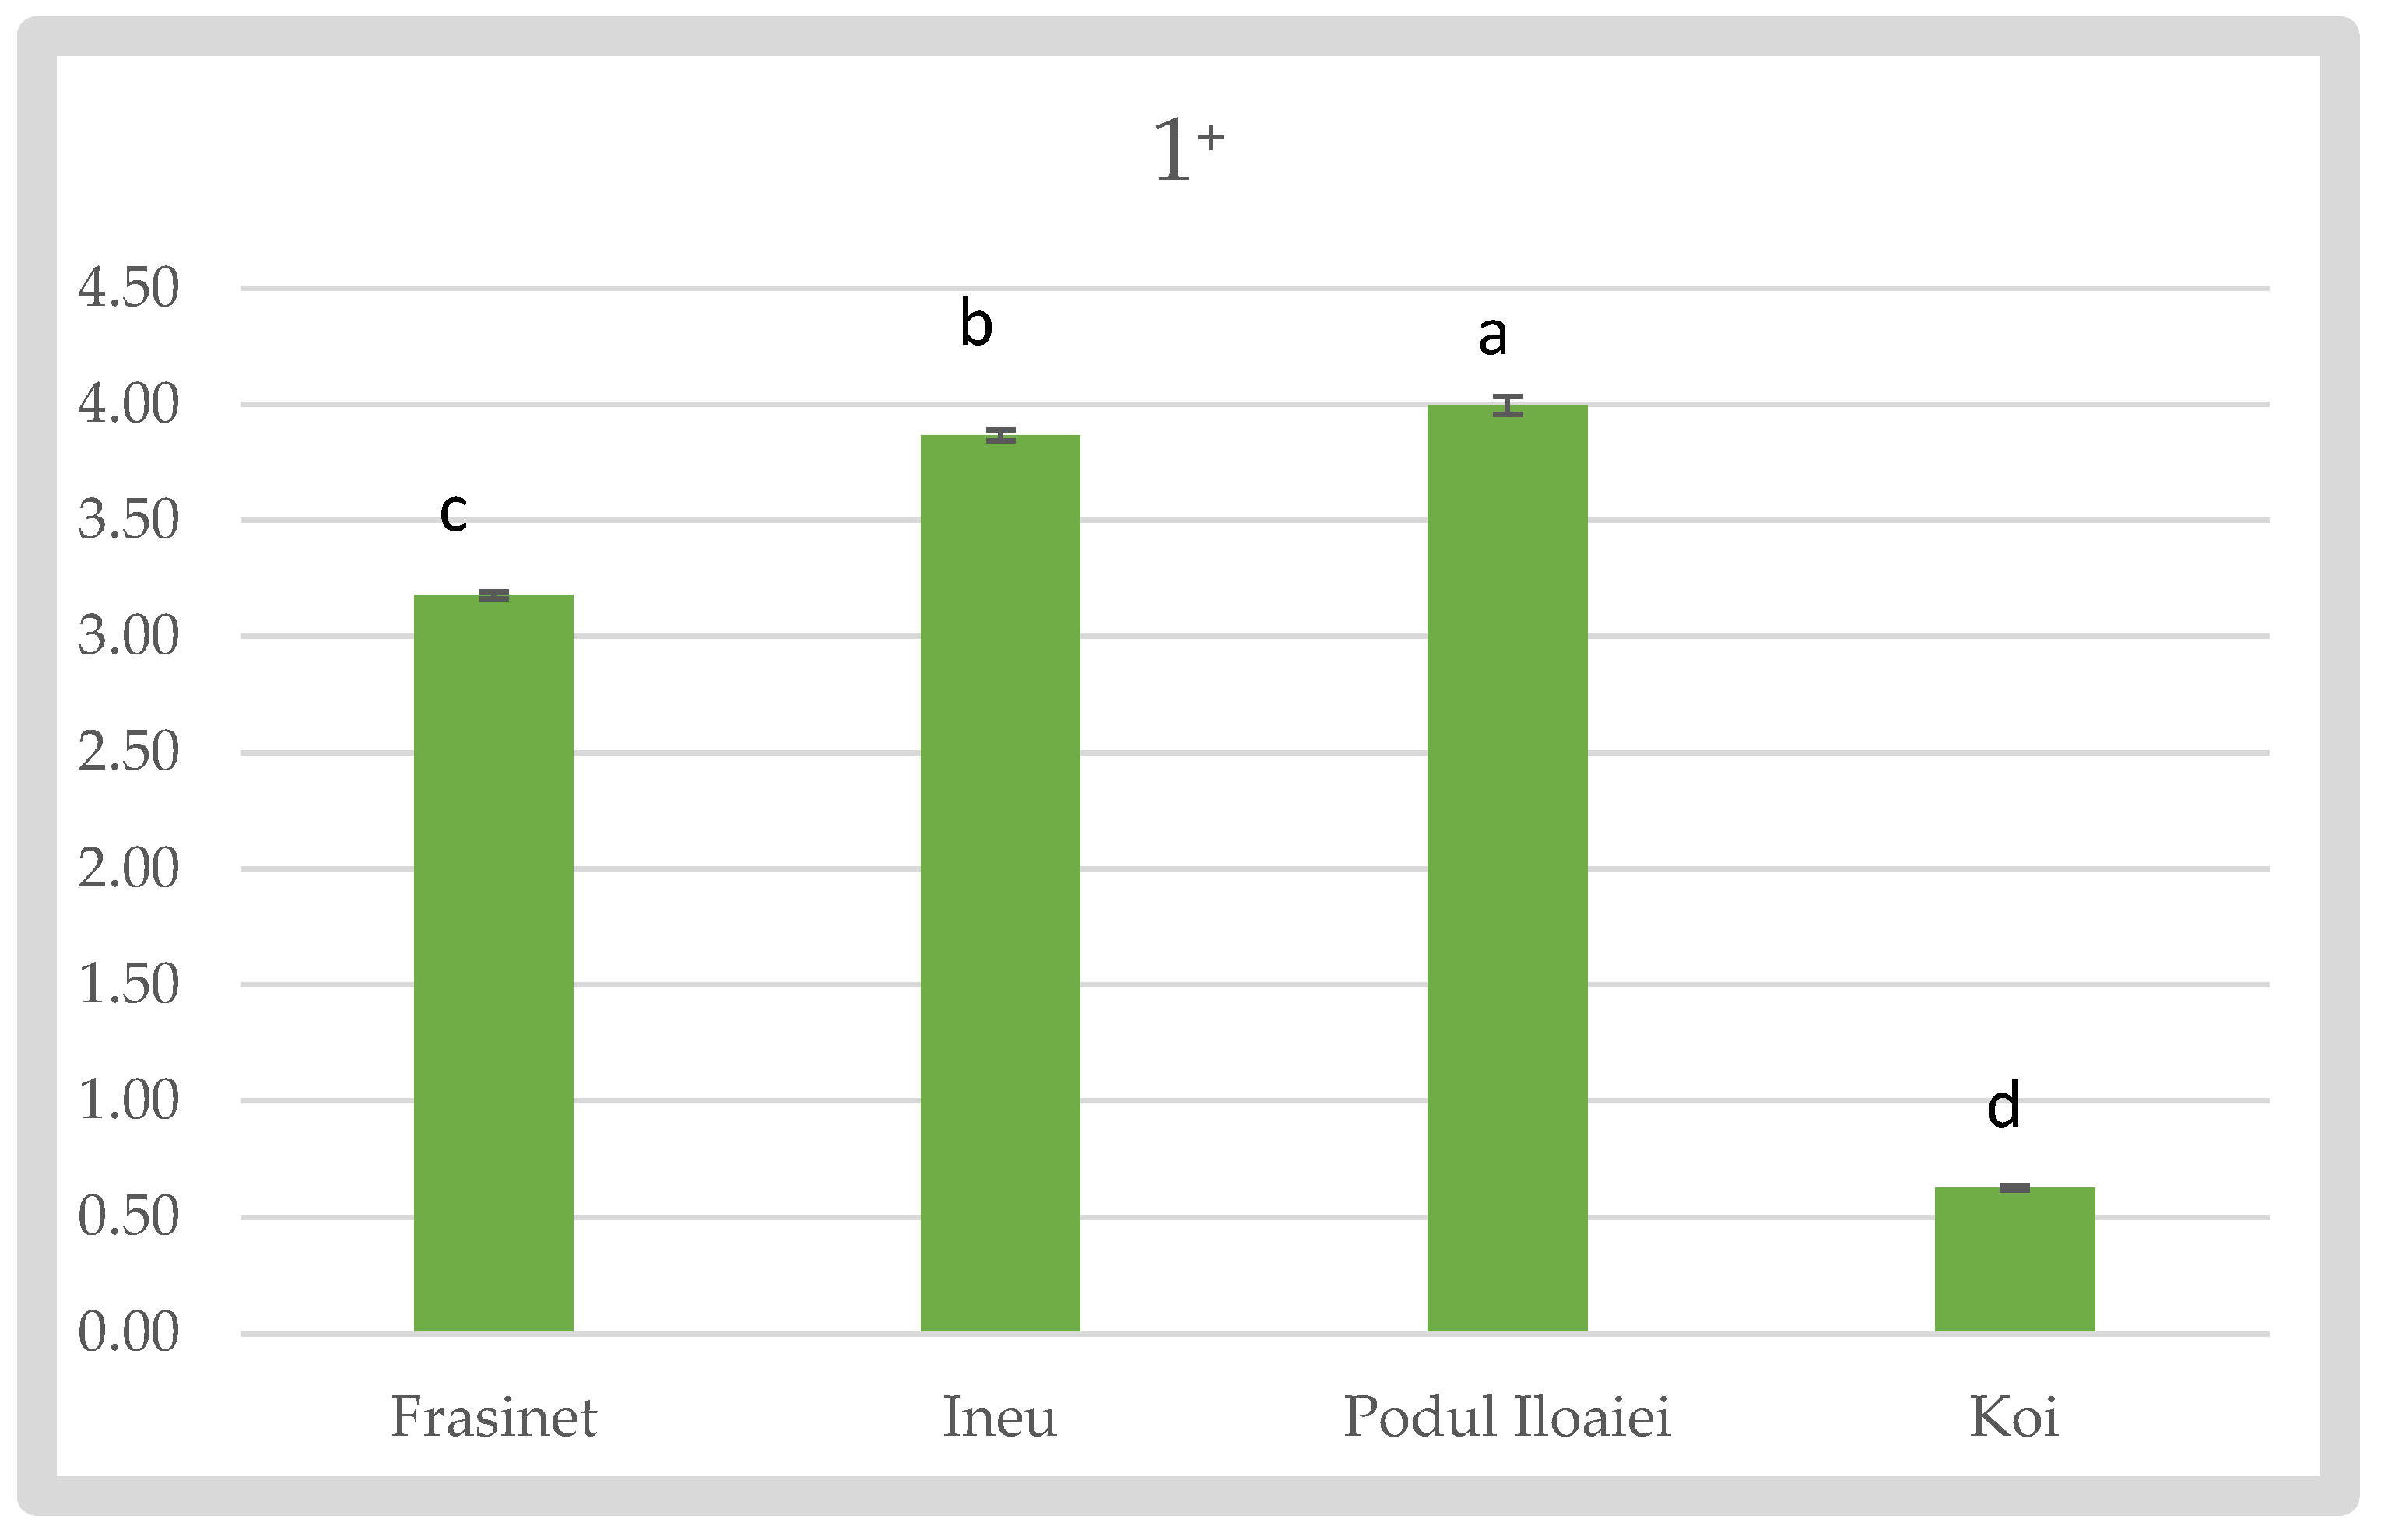
At the 1⁺ stage, Podu Iloaiei exhibited the highest Fulton’s index (4 ± 0.04), followed closely by Ineu (3.87 ± 0.024) and Frăsinet (3.18 ± 0.014). Koi showed a significantly lower value (0.63 ± 0.011) compared to other varieties (p < 0.05) (
Figure 3).
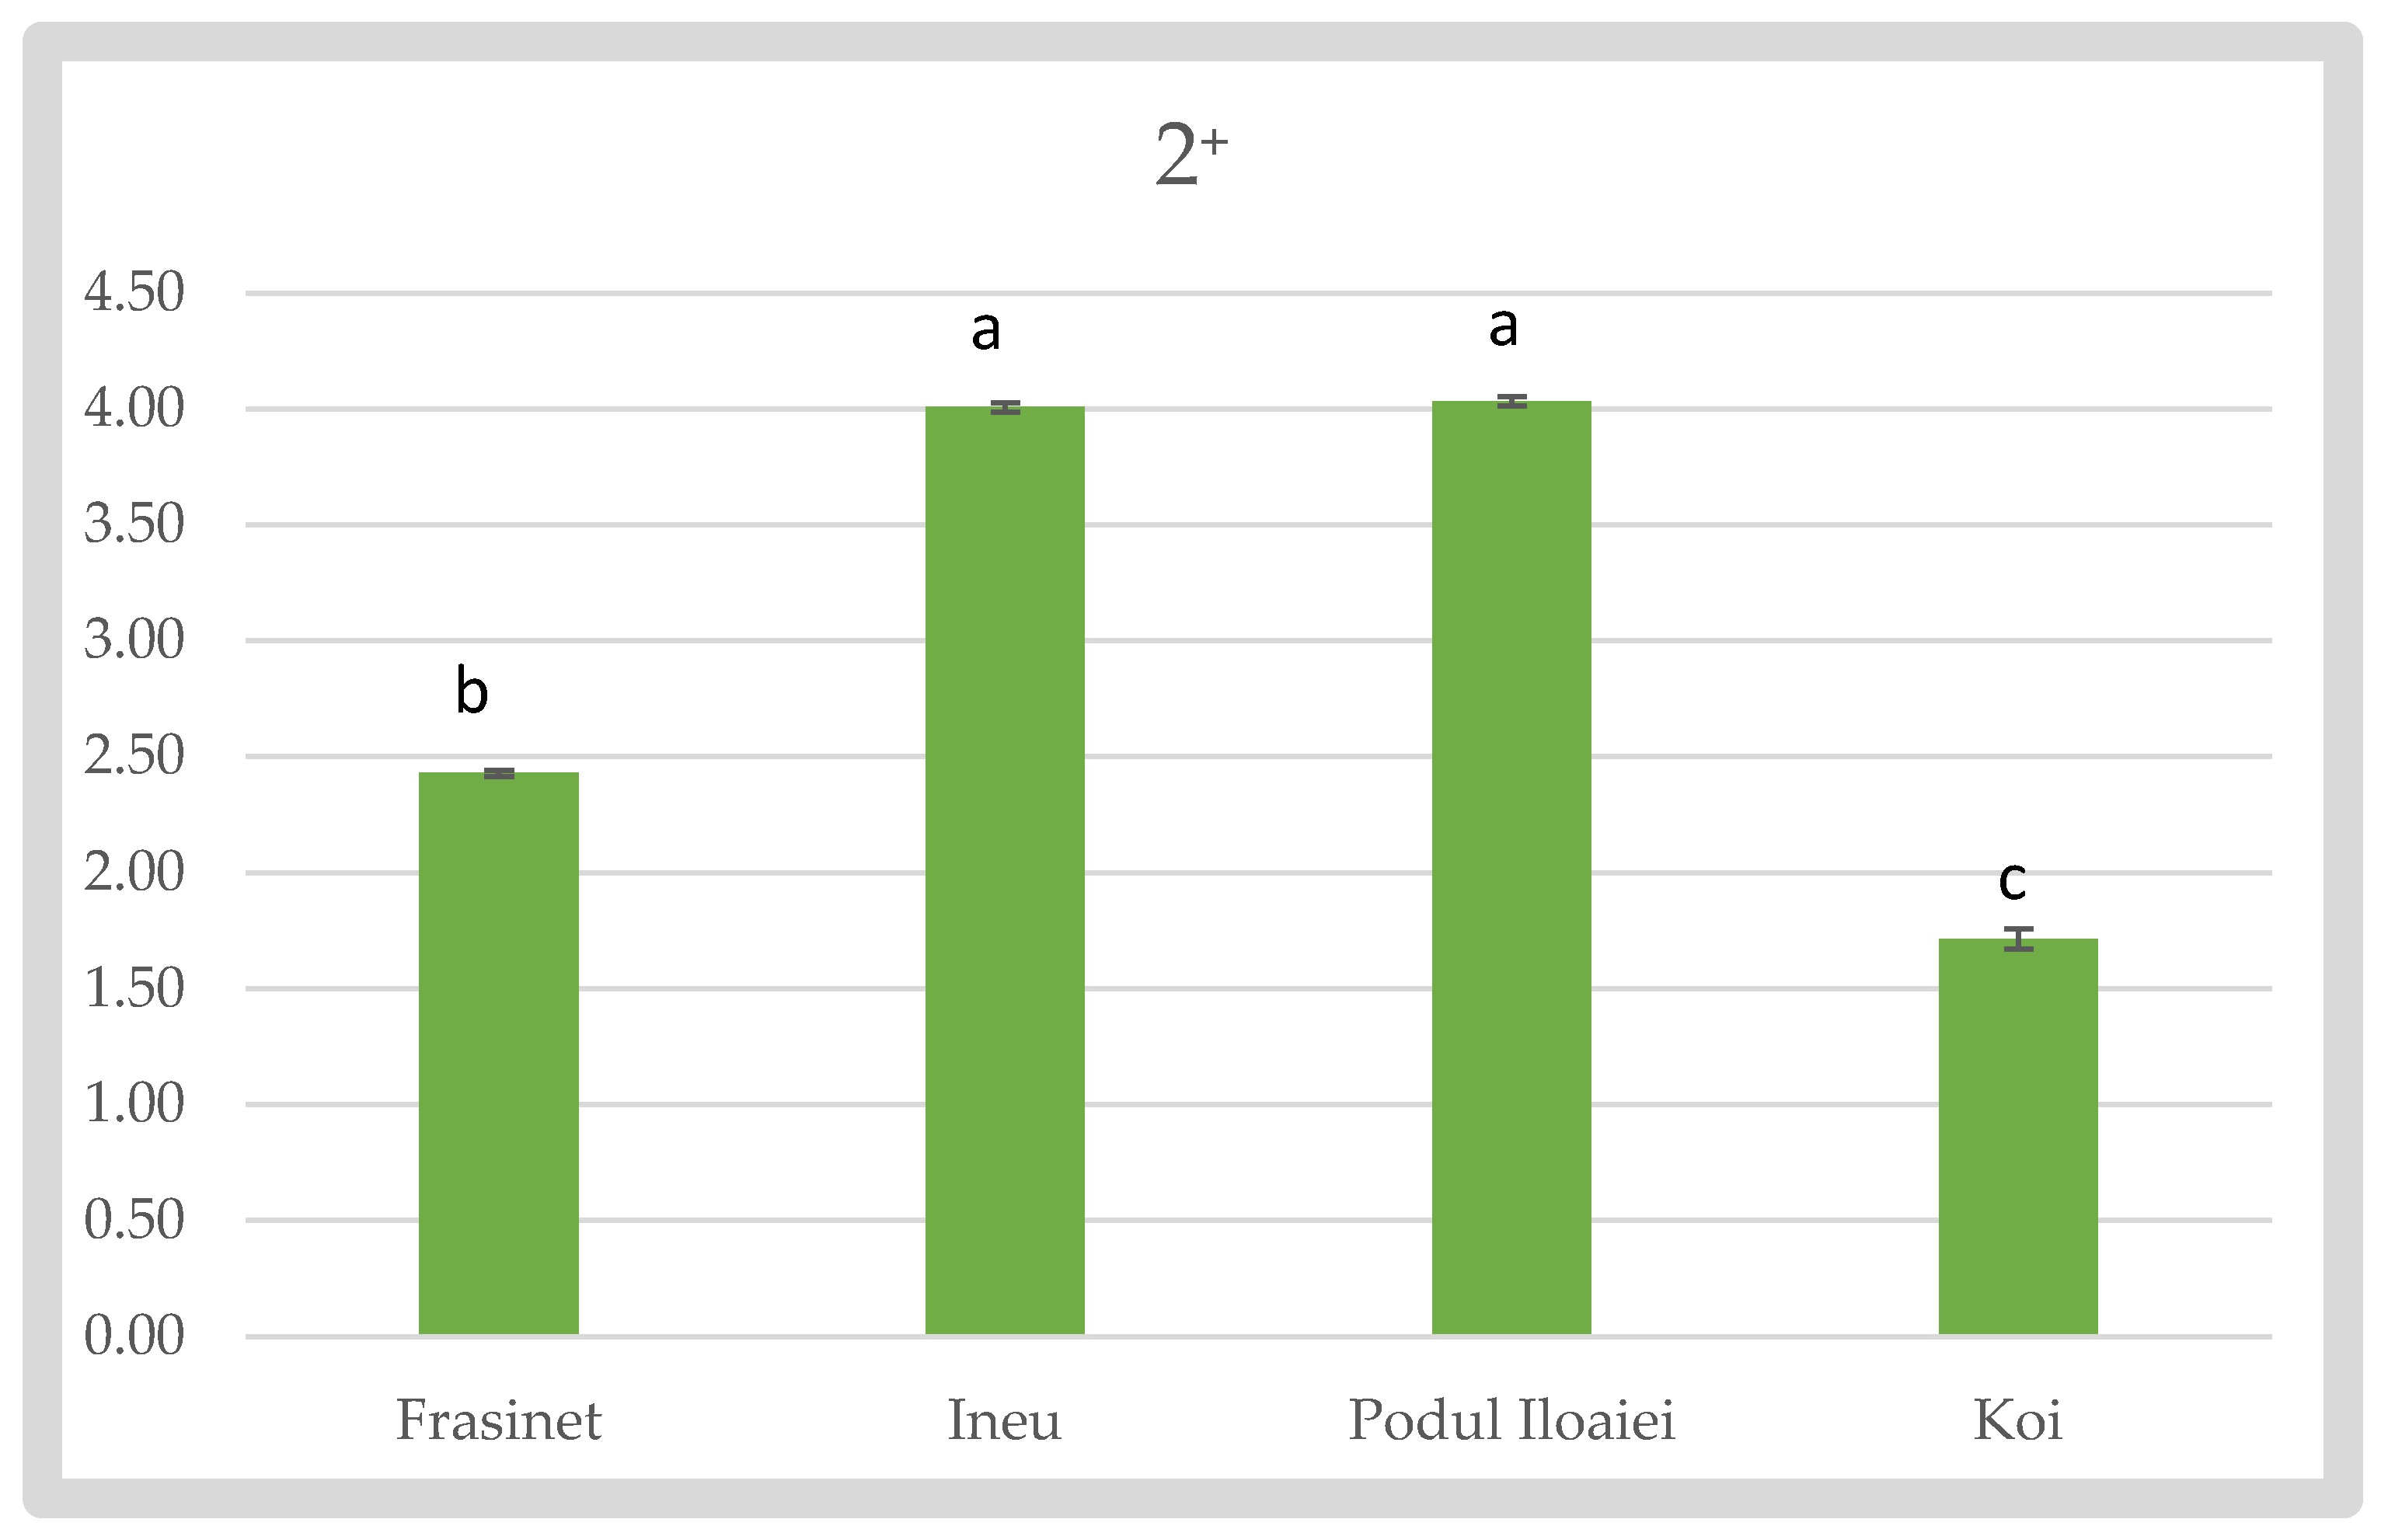
For the 2⁺ stage, Podu Iloaiei and Ineu showed the highest Fulton’s indices (4.03 ± 0.02 and 4.01 ± 0.021, respectively), with no significant difference between them. Frăsinet had a lower value (2.43 ± 0.012), while Koi exhibited the lowest Fulton’s index (1.72 ± 0.044) (
Figure 4).
These results highlight the significant variations in body shape development among different Cyprinus carpio varieties throughout their growth stages, which could have implications for their adaptation to different environments and their suitability for various aquaculture systems.
4. Discussion
The present study provides valuable insights into the growth dynamics and morphological development of four Cyprinus carpio varieties (Frăsinet, Ineu, Podu Iloaiei, and Koi) across different life stages. Our findings reveal significant variations in growth performance and body shape among these varieties, which have important implications for aquaculture practices and ecological adaptations.
Profile Index and Morphological Development
The analysis of the profile index revealed distinct patterns of body shape development among the four varieties. The general trend of decreasing profile index with age is consistent with the allometric growth patterns typically observed in fish [
24,
25]. However, the variety-specific differences in this trend provide new insights into the morphological plasticity of
Cyprinus carpio.
The dramatic change in profile index observed in the Podu Iloaiei variety, from the highest value at 7 days post-hatch to one of the lowest at later stages, is particularly intriguing. This rapid transformation could be an adaptive feature allowing for better survival in early life stages, followed by a more streamlined body shape for improved swimming efficiency in adults [
27]. The maintenance of a higher profile index in Koi at the 0⁺ and 1⁺ stages aligns with the ornamental purpose of this variety, where a deeper body shape might be favored for aesthetic reasons [
26].
Fulton’s Condition Factor
The analysis of Fulton’s condition factor revealed significant variations among the four Cyprinus carpio varieties across different life stages. These differences provide insights into the overall health and energy storage of the fish, which are crucial factors in aquaculture and ecological contexts [
24,
29].
The exceptionally high Fulton’s index observed in Frăsinet at 7 days post-hatch (149.57 ± 17.485) suggests a substantial energy reserve in early life stages, which could be advantageous for survival and initial growth [
25]. However, this advantage appears to diminish in later stages, as Frăsinet’s Fulton’s index becomes comparatively lower at 1⁺ and 2⁺ stages.
Conversely, Podu Iloaiei and Ineu varieties show a trend of increasing Fulton’s index with age, achieving the highest values at the 2⁺ stage (4.03 ± 0.02 and 4.01 ± 0.021, respectively). This pattern indicates improved condition and energy storage as these varieties mature, which could be beneficial for commercial aquaculture production [
23,
29].
The Koi variety demonstrates an unique pattern, with consistently lower Fulton’s index values across all life stages, particularly at 1⁺ (0.63 ± 0.011) and 2⁺ (1.72 ± 0.044) stages. This could be attributed to the ornamental nature of Koi, where breeding selection may have focused on aesthetic traits rather than condition factor [
26]. The lower Fulton’s index in Koi suggests that this variety might require specialized nutritional management in aquaculture settings to maintain optimal health [
22].
These findings on Fulton’s condition factor, combined with the growth performance and profile index results, provide a comprehensive view of the developmental patterns in these
Cyprinus carpio varieties. The variations observed underscore the importance of considering variety-specific traits in aquaculture management and ecological studies [
27,
28]. Future research should investigate the genetic and environmental factors influencing these differences in condition factor, as well as their implications for fish health, productivity, and adaptability to different aquatic environments [
21,
23,
29].
Implications for Aquaculture and Ecology
The varying growth patterns and morphological development observed among these
Cyprinus carpio varieties have significant implications for aquaculture practices. The superior growth performance of Podu Iloaiei and Ineu varieties at later stages suggests their potential for improved production efficiency in commercial aquaculture settings [
23,
29]. However, the unique growth pattern of Koi highlights the importance of considering the entire growth trajectory when selecting varieties for cultivation, as late-blooming varieties may still achieve desirable final sizes [
27].
The differences in profile index development could influence the varieties’ adaptability to different aquaculture systems and natural habitats. Varieties with lower profile indices at adult stages, such as Ineu and Podu Iloaiei, may be better suited for high-density aquaculture systems or habitats with stronger water currents due to potentially improved swimming efficiency [
25]. Conversely, varieties maintaining higher profile indices, like Frăsinet, might be more adapted to lentic environments or extensive aquaculture systems [
29].
Future Research Directions
To further elucidate the mechanisms underlying the observed growth and morphological differences, future studies should focus on:
Genetic analysis to identify specific genes or quantitative trait loci (QTLs) associated with growth performance and body shape in these varieties [
21,
23].
Physiological studies to investigate metabolic differences that may explain the varying growth patterns, particularly in Koi [
22].
Environmental interaction studies to assess how different rearing conditions affect the growth and morphological development of these varieties [
27,
29].
Long-term performance evaluations in various aquaculture systems to determine the optimal cultivation strategies for each variety [
23,
29].
These research directions will contribute to a more comprehensive understanding of
Cyprinus carpio varieties and their potential impacts on both aquaculture and natural ecosystems [
28,
29].
5. Conclusions
This comprehensive study on three Romanian Cyprinus carpio varieties (Frăsinet, Ineu, and Podu Iloaiei) and the ornamental Koi variety has revealed significant intervariety differences in growth performance, body shape development, and physiological condition across multiple life stages. Our findings demonstrate the complex interplay between genetic factors and developmental processes in shaping the morphological and physiological characteristics of these economically important fish.
The observed variations in Weight Gain, Specific Growth Rate, and Relative Growth Rate among the Romanian varieties highlight the potential for selective breeding programs to enhance aquaculture productivity within the region. The distinct patterns in profile index development among these varieties suggest differential adaptations to various aquatic environments found in Romania, which could inform both local aquaculture system design and ecological management strategies.
Furthermore, the marked differences in Fulton’s condition factor across the Romanian varieties and life stages underscore the importance of tailored nutritional and husbandry practices in Romanian aquaculture settings. The unique growth and condition patterns observed in the Koi variety, in contrast to the Romanian varieties, emphasize the divergent evolutionary pathways between commercial and ornamental strains.
These results provide a foundation for future research into the genetic and environmental factors underlying the observed phenotypic variations in Romanian carp varieties. Such investigations could lead to improved breeding programs, more efficient aquaculture practices tailored to local conditions, and a better understanding of the ecological implications of Cyprinus carpio diversity in Romanian ecosystems. The inclusion of the Koi variety offers valuable comparative insights, highlighting the plasticity of the species under different selection pressures.
This knowledge will contribute to the sustainable development of carp aquaculture in Romania and informed management of wild populations in diverse local ecosystems. Moreover, it underscores the importance of conserving and studying local fish varieties as valuable genetic resources for future aquaculture development and biodiversity conservation efforts.
Author Contributions
Conceptualization, D.A.Ș.; methodology, D.A.Ș.; software, M.B.; validation, D.A.Ș., M.B., M.I. and Ș.C.; formal analysis, M.B.; investigation, D.A.Ș.; resources, D.A.Ș.; data curation, D.A.Ș.; writing—original draft preparation, D.A.Ș.; writing—review and editing, D.A.Ș., M.B., M.I. and Ș.C.; visualization, M.B.; supervision, M.I. and Ș.C.; project administration, D.A.Ș. All authors have read and agreed to the published version of the manuscript.
Institutional Review Board Statement
The animal study protocol was approved by the Ethics Committee of the Unit Using Animals for Scientific Purposes, approval no. 60, 1 March 2023.
Data Availability Statement
All data generated during this study are present in this article.
Acknowledgments
The authors would like to express their sincere gratitude to ing. Nascu Emilian Gabriel, the innovative farmer who developed and maintained the Frăsinet variety of Cyprinus carpio. His dedication to long-term, pure-line breeding and meticulous record-keeping over more than a decade has been instrumental in providing valuable data for this study. Ing. Nascu’s commitment to genetic improvement in carp aquaculture exemplifies the important role that experienced farmers play in advancing both practical and scientific knowledge in the field.
We also extend our appreciation to the staff at the Research and Development Station for Aquaculture and Aquatic Ecology of “Al. I. Cuza” University, where the other varieties were studied, for their assistance in data collection and fish husbandry. This research was made possible through the collaborative efforts of academia and industry, highlighting the importance of such partnerships in advancing aquaculture science and practices.
Conflicts of Interest
The authors declare no conflicts of interest.
References
- Smith, J.A. and Brown, T.L. Principles of Fish Growth Dynamics. Annual Review of Ichthyology 2020, 35, 123–145.
- Wang, Y., et al. Implications of Fish Growth Patterns for Aquaculture and Fisheries Management. Aquaculture 2021, 530, 735924.
- Johnson, M.R. and Garcia, S.M. Fish Growth as an Indicator of Ecosystem Health. Marine Ecology Progress Series 2019, 612, 167–185.
- Lee, C.H., et al. External and Internal Factors Affecting Fish Growth: A Comprehensive Review. Reviews in Aquaculture 2018, 10, 527–548.
- Pauly, D. and Cheung, W.W.L. Sound physiological knowledge and principles in modeling shrinking of fishes under climate change. Global Change Biology 2017, 23, 3449–3459.
- Thompson, R.J. and Liu, X. Individual Variation in Fish Growth: Causes and Consequences. Journal of Fish Biology 2022, 100, 789–805.
- Zou, J. and Secombes, C.J. The Function of Fish Cytokines. Biology 2016, 5, 23.
- Mommsen, T.P. Paradigms of growth in fish. Comparative Biochemistry and Physiology Part B: Biochemistry and Molecular Biology 2001, 129, 207–219. [CrossRef]
- Reinecke, M. Influences of the environment on the endocrine and paracrine fish growth hormone-insulin-like growth factor-I system. Journal of Fish Biology 2010, 76, 1233–1254. [Google Scholar] [CrossRef]
- Power, D.M., et al. Thyroid hormones in growth and development of fish. Comparative Biochemistry and Physiology Part C: Toxicology & Pharmacology 2001, 130, 447–459.
- Taranger, G.L., et al. Control of puberty in farmed fish. General and Comparative Endocrinology 2010, 165, 483–515. [CrossRef] [PubMed]
- Fuentes, E.N., et al. IGF-I/PI3K/Akt and IGF-I/MAPK/ERK pathways in vivo in skeletal muscle are regulated by nutrition and contribute to somatic growth in the fine flounder. American Journal of Physiology-Regulatory, Integrative and Comparative Physiology 2013, 305, R136–R146.
- Yáñez, J.M., et al. Genetic improvement of growth rate and disease resistance in fish: an overview. Reviews in Aquaculture 2015, 7, 231–245.
- Gutierrez, A.P., et al. Genome-wide association study (GWAS) for growth rate and age at sexual maturation in Atlantic salmon (Salmo salar). PLoS One 2015, 10, e0119730.
- Danzmann, R.G., et al. Transcriptomics of life-history trade-offs in Atlantic salmon: alternative splicing and the role of gene expression regulation. Molecular Ecology 2016, 25, 5184–5198.
- Gavery, M.R. and Roberts, S.B. Epigenetic considerations in aquaculture. PeerJ 2017, 5, e4147. [CrossRef]
- Hou, Z.S., et al. Comparative study of the effects of different feeding habits and diets on intestinal microbiota in Acipenser baeri Brandt and Huso huso. Archives of Microbiology 2017, 199, 277–285.
- Vélez, E.J., et al. Understanding fish muscle growth regulation to optimize aquaculture production. Aquaculture 2017, 467, 28–40. [CrossRef]
- Ringø, E., et al. Effect of dietary components on the gut microbiota of aquatic animals. A never-ending story? Aquaculture Nutrition 2016, 22, 219–282. [CrossRef]
- Kocour, M., Gela, D., Rodina, M., & Linhart, O. Testing of performance in common carp Cyprinus carpio L. under pond husbandry conditions I: top-crossing with Northern mirror carp. Aquaculture Research 2005, 36, 1207–1215.
- Vandeputte, M., Kocour, M., Mauger, S., Dupont-Nivet, M., De Guerry, D., Rodina, M., ... & Linhart, O. Heritability estimates for growth-related traits using microsatellite parentage assignment in juvenile common carp (Cyprinus carpio L.). Aquaculture 2004, 235, 223–236.
- Segner, H., Sundh, H., Buchmann, K., Douxfils, J., Sundell, K. S., Mathieu, C., ... & Vaughan, L. Health of farmed fish: its relation to fish welfare and its utility as welfare indicator. Fish physiology and biochemistry 2012, 38, 85–105.
- Gjedrem, T., Robinson, N., & Rye, M. The importance of selective breeding in aquaculture to meet future demands for animal protein: a review. Aquaculture 2012, 350, 117–129.
- Froese, R. Cube law, condition factor and weight–length relationships: history, meta-analysis and recommendations. Journal of applied ichthyology 2006, 22, 241–253. [Google Scholar] [CrossRef]
- Enberg, K. , Dunlop, E. S., & Jørgensen, C. (2008). Fish growth. In Encyclopedia of Ecology (pp. 1564-1572). Elsevier.
- Koldewey, H. J., & Martin-Smith, K. M. A global review of seahorse aquaculture. Aquaculture 2010, 302, 131–152.
- Thorpe, J. E. Life history responses of fishes to culture. Journal of Fish Biology 2004, 65, 263–285. [Google Scholar] [CrossRef]
- Yan, X., Zhenyu, L., Gregg, W. P., & Dianmo, L. Invasive species in China—an overview. Biodiversity & Conservation 2001, 10, 1317–1341.
- Rahman, M. M. Role of common carp (Cyprinus carpio) in aquaculture production systems. Frontiers in Life Science 2015, 8, 399–410. [Google Scholar] [CrossRef]
|
Disclaimer/Publisher’s Note: The statements, opinions and data contained in all publications are solely those of the individual author(s) and contributor(s) and not of MDPI and/or the editor(s). MDPI and/or the editor(s) disclaim responsibility for any injury to people or property resulting from any ideas, methods, instructions or products referred to in the content. |
© 2024 by the authors. Licensee MDPI, Basel, Switzerland. This article is an open access article distributed under the terms and conditions of the Creative Commons Attribution (CC BY) license (http://creativecommons.org/licenses/by/4.0/).


