Preprint
Article

Gold Recovery from Smelting Copper Sulfide Concentrate

Altmetrics

Downloads

141

Views

128

Comments

0

A peer-reviewed article of this preprint also exists.

This version is not peer-reviewed

Submitted:

19 September 2024

Posted:

19 September 2024

Read the latest preprint version here

Alerts
Abstract
Gold is a significant revenue source for custom copper smelters facing profitability challenges due to low treatment and refining charges, stricter regulations, and rising costs. Gold is also often blended with copper concentrates, but precise recovery rates from smelting processes are poorly documented despite gold critical economic importance. This paper aims to provide the first comprehensive estimates of gold first-pass recovery across various operational units within the copper sulfide concentrate processing flowsheet. It evaluates the effectiveness of different copper smelting and converting technologies in recovering gold. Optimizing gold first-pass recovery is especially important to enhance immediate financial returns and responsiveness to market dynamics, allowing companies to capitalize on favorable gold prices without delays. Given the absence of direct measurements for gold recovery rates, this research develops an estimation method based on understanding gold loss mechanisms during smelting. The study identifies and analyzes key input and output parameters by examining data from various copper producers. By correlating these parameters with gold loss, the research estimates gold first-pass recovery rates within the copper smelting process. Among integrated smelting-converting routes, the flash smelting to Peirce-Smith converting route achieves the highest gold first-pass recovery (98.8–99.5%), followed by the Mitsubishi continuous smelting and converting process (94.3–99.8%), bottom-blowing smelting to bottom-blowing converting (95.8%), flash smelting to flash converting (95.5%), Teniente smelting to Peirce-Smith converting (95.2%), and the Noranda continuous smelting and converting process (94.8%). The final recovery rates are expected to be higher considering the by-products internal recirculation and post-processing within the copper flowsheet. Additionally, superior gold recoveries are attributed to advanced metallurgical practices and control systems, which vary even among companies with similar technologies. The research demonstrates that copper smelting can effectively recover over 99% of gold from sulfide concentrates. Gold accumulates up to 1000 times its original concentration in anode slime during electrolytic refining, generating 5-10 kilograms of slime per ton of copper, which is further processed to recover gold and other by-products. Major smelters operate precious metal plants where recovering gold from highly concentrated anode slime is both cost-effective and efficient.
Keywords: 
Subject: Engineering  -   Metallurgy and Metallurgical Engineering

1. Introduction

For a custom copper smelter, there are four main sources of revenue: (1) treatment charges/refining charges (TC/RC), (2) by-products (e.g., H2SO4), (3) free metals (e.g., Cu, Au, and Ag), and (4) premiums (from Cu and Au. Premiums are additional charges or bonuses that can be added to standard TC/RC rates. These premiums may be influenced by factors such as the quality of the concentrate (e.g., high grade or low impurities) and the presence of valuable by-products (e.g., Au). The revenues generated from TC/RC and free metals play a major role in the profit margins and sustainability of the smelters. Figure 1 depicts the TC index, the CIF Asia Pacific price of copper concentrate from Fastmarkets analysis [1]. Low TC/RCs, combined with stricter environmental laws, unpredictable fuel prices, and rising labor costs, have put pressure on the profitability of custom smelters. In response to exceptionally low and competitive TC/RC market conditions, custom smelters have been focusing on improving their operational economy and sustainability by increasing metal recoveries and generating additional by-products.
Gold plays a crucial role in the profitability and sustainability of the copper industry, benefiting both smelters and miners. Following cyanide leaching, copper smelting emerges as an attractive method for gold extraction, and due to the ease of extraction and high recovery rates, smelters often blend gold concentrates with copper concentrates [2,3]. While it is widely believed, based on industry consensus and anecdotal evidence, that 98-99% of the gold contained in sulfide concentrates can be recovered, the exact recovery rates from copper smelting and converting processes are not well-documented in the literature. Most available studies focus on the partitioning of gold between matte or metal and slag as influenced by process variables such as matte grade, temperature, and oxygen partial pressure [4,5,6,7,8]. Here, “matte grade” refers to the concentration of Cu in the matte.
This paper aims to systematically analyze and, for the first time, provide estimates of gold first-pass recovery rates across various operational units within the copper sulfide concentrate processing flowsheet. It also evaluates the effectiveness of different copper smelting and converting technologies in gold recovery. The study offers insights to help custom smelters optimize their operations in the face of challenging market conditions. The overview includes global copper production and processing units, copper smelting and converting technologies, and the significant role of gold in copper smelting. It details the distribution of gold across different phase streams during copper production and assesses the efficiency of current smelting technologies in maximizing gold recovery. This evaluation is crucial not only for the economic viability of copper smelters but also for intelligent resource utilization, as end-of-life (EoL) materials are recycled through the copper flowsheet for their precious metal content [9].

2. Overview of Global Copper Production

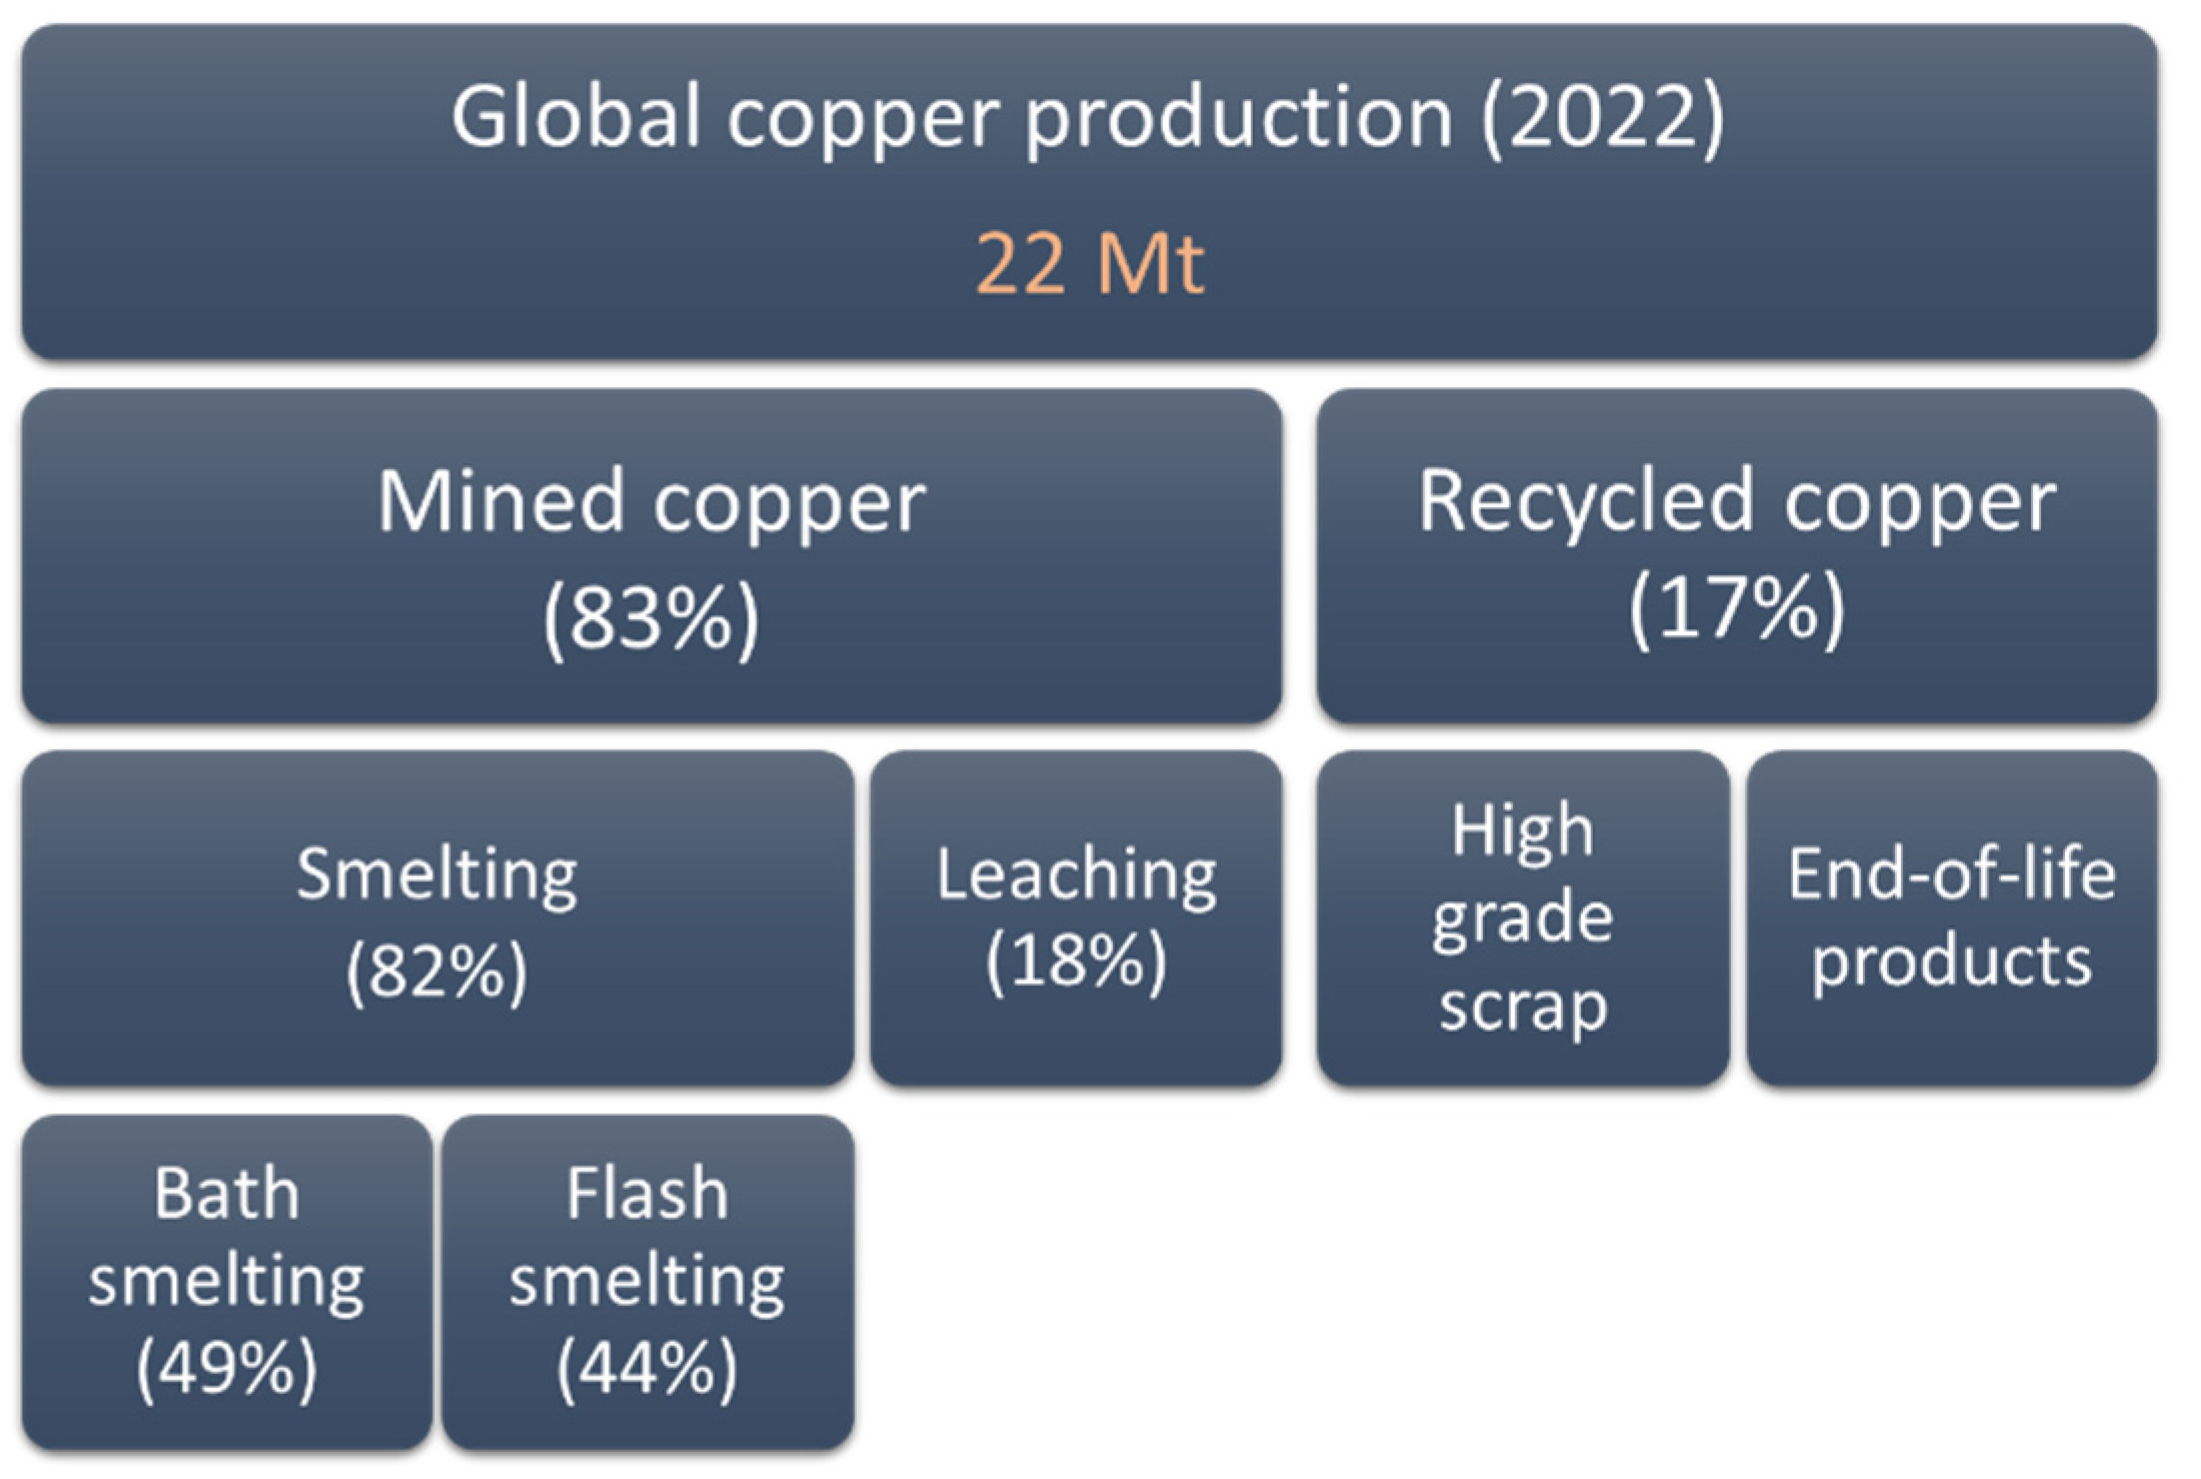
Copper is produced through either pyrometallurgy or hydrometallurgy. Figure 2 illustrates the global copper production in 2022, which totaled 22 million metric tons (Mt). Of this, 83% was derived from mined copper, predominantly processed through smelting (82%). The smelting processes were primarily divided between bath smelting, contributing 49%, and flash smelting, contributing 44%. The remaining 18% of mined copper production came from heap leaching and solvent extraction-electrowinning (SX-EW) of oxidized and sulfidic chalcocite ores. Secondary copper production from high-grade scrap and recycled EoL materials constituted 17% of total copper production. Over the past two decades, secondary copper production has steadily increased. In 2019, global EoL waste generation surpassed 50 Mt [10,11].
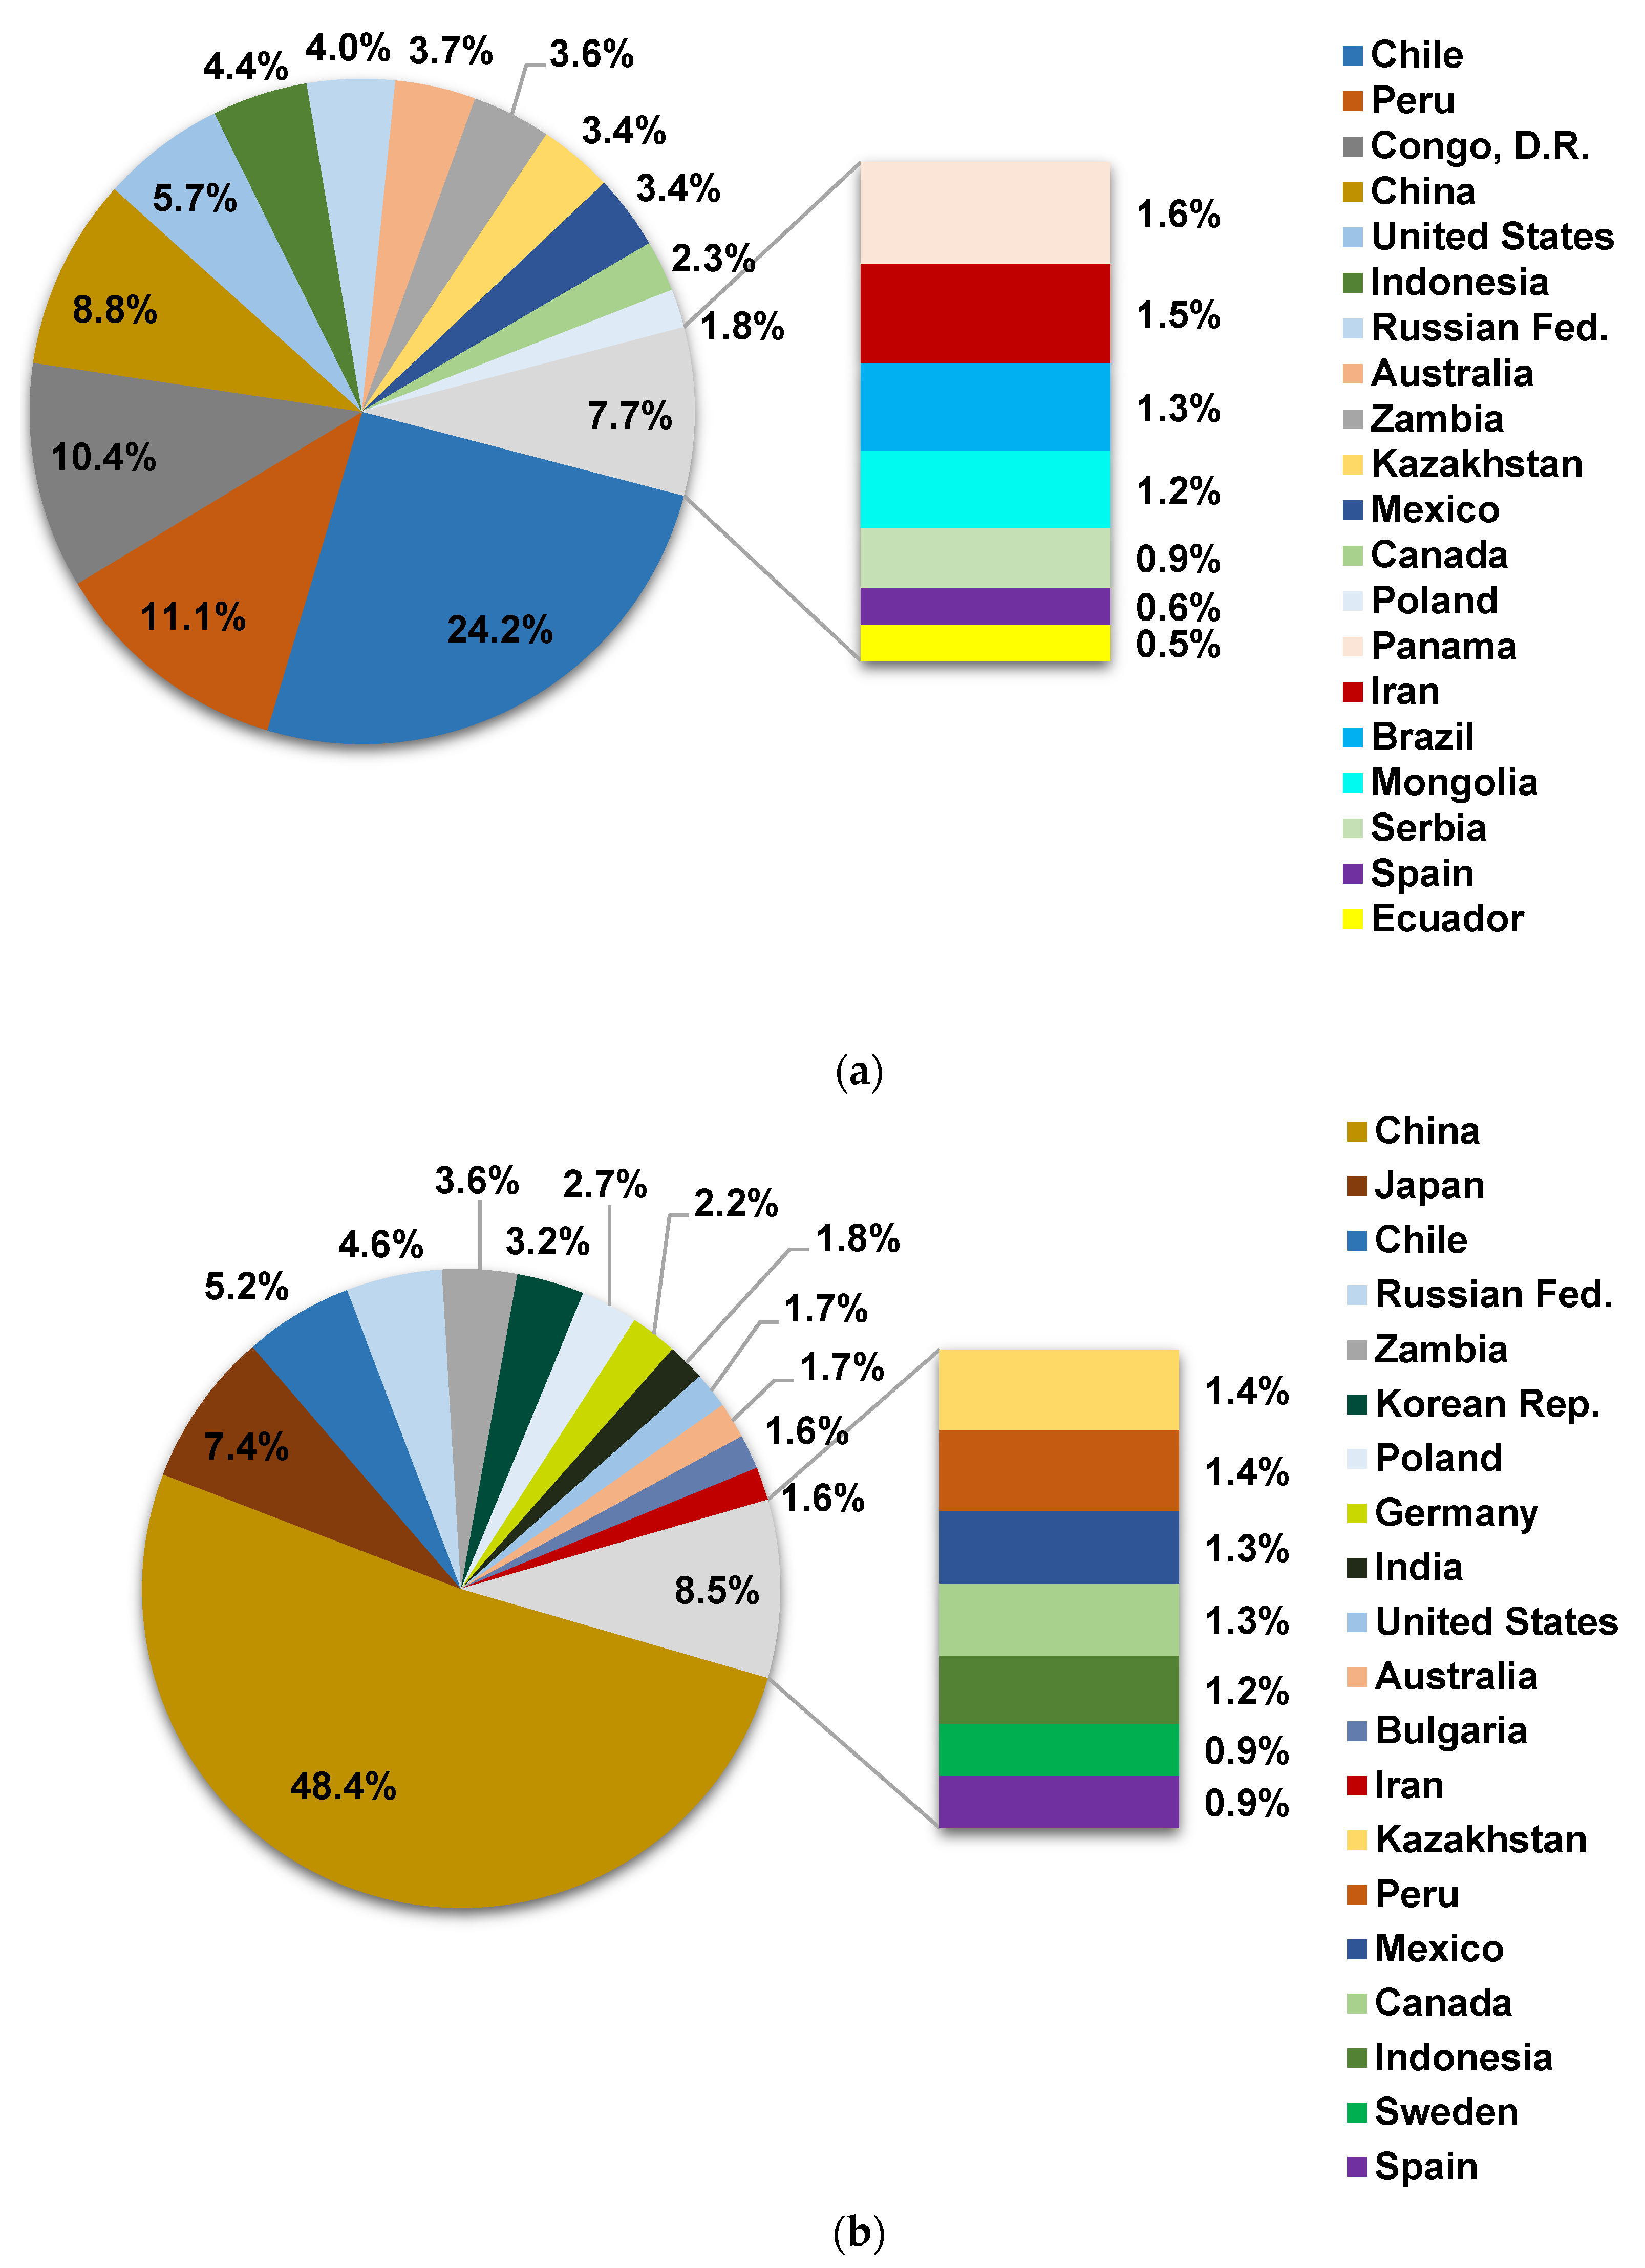
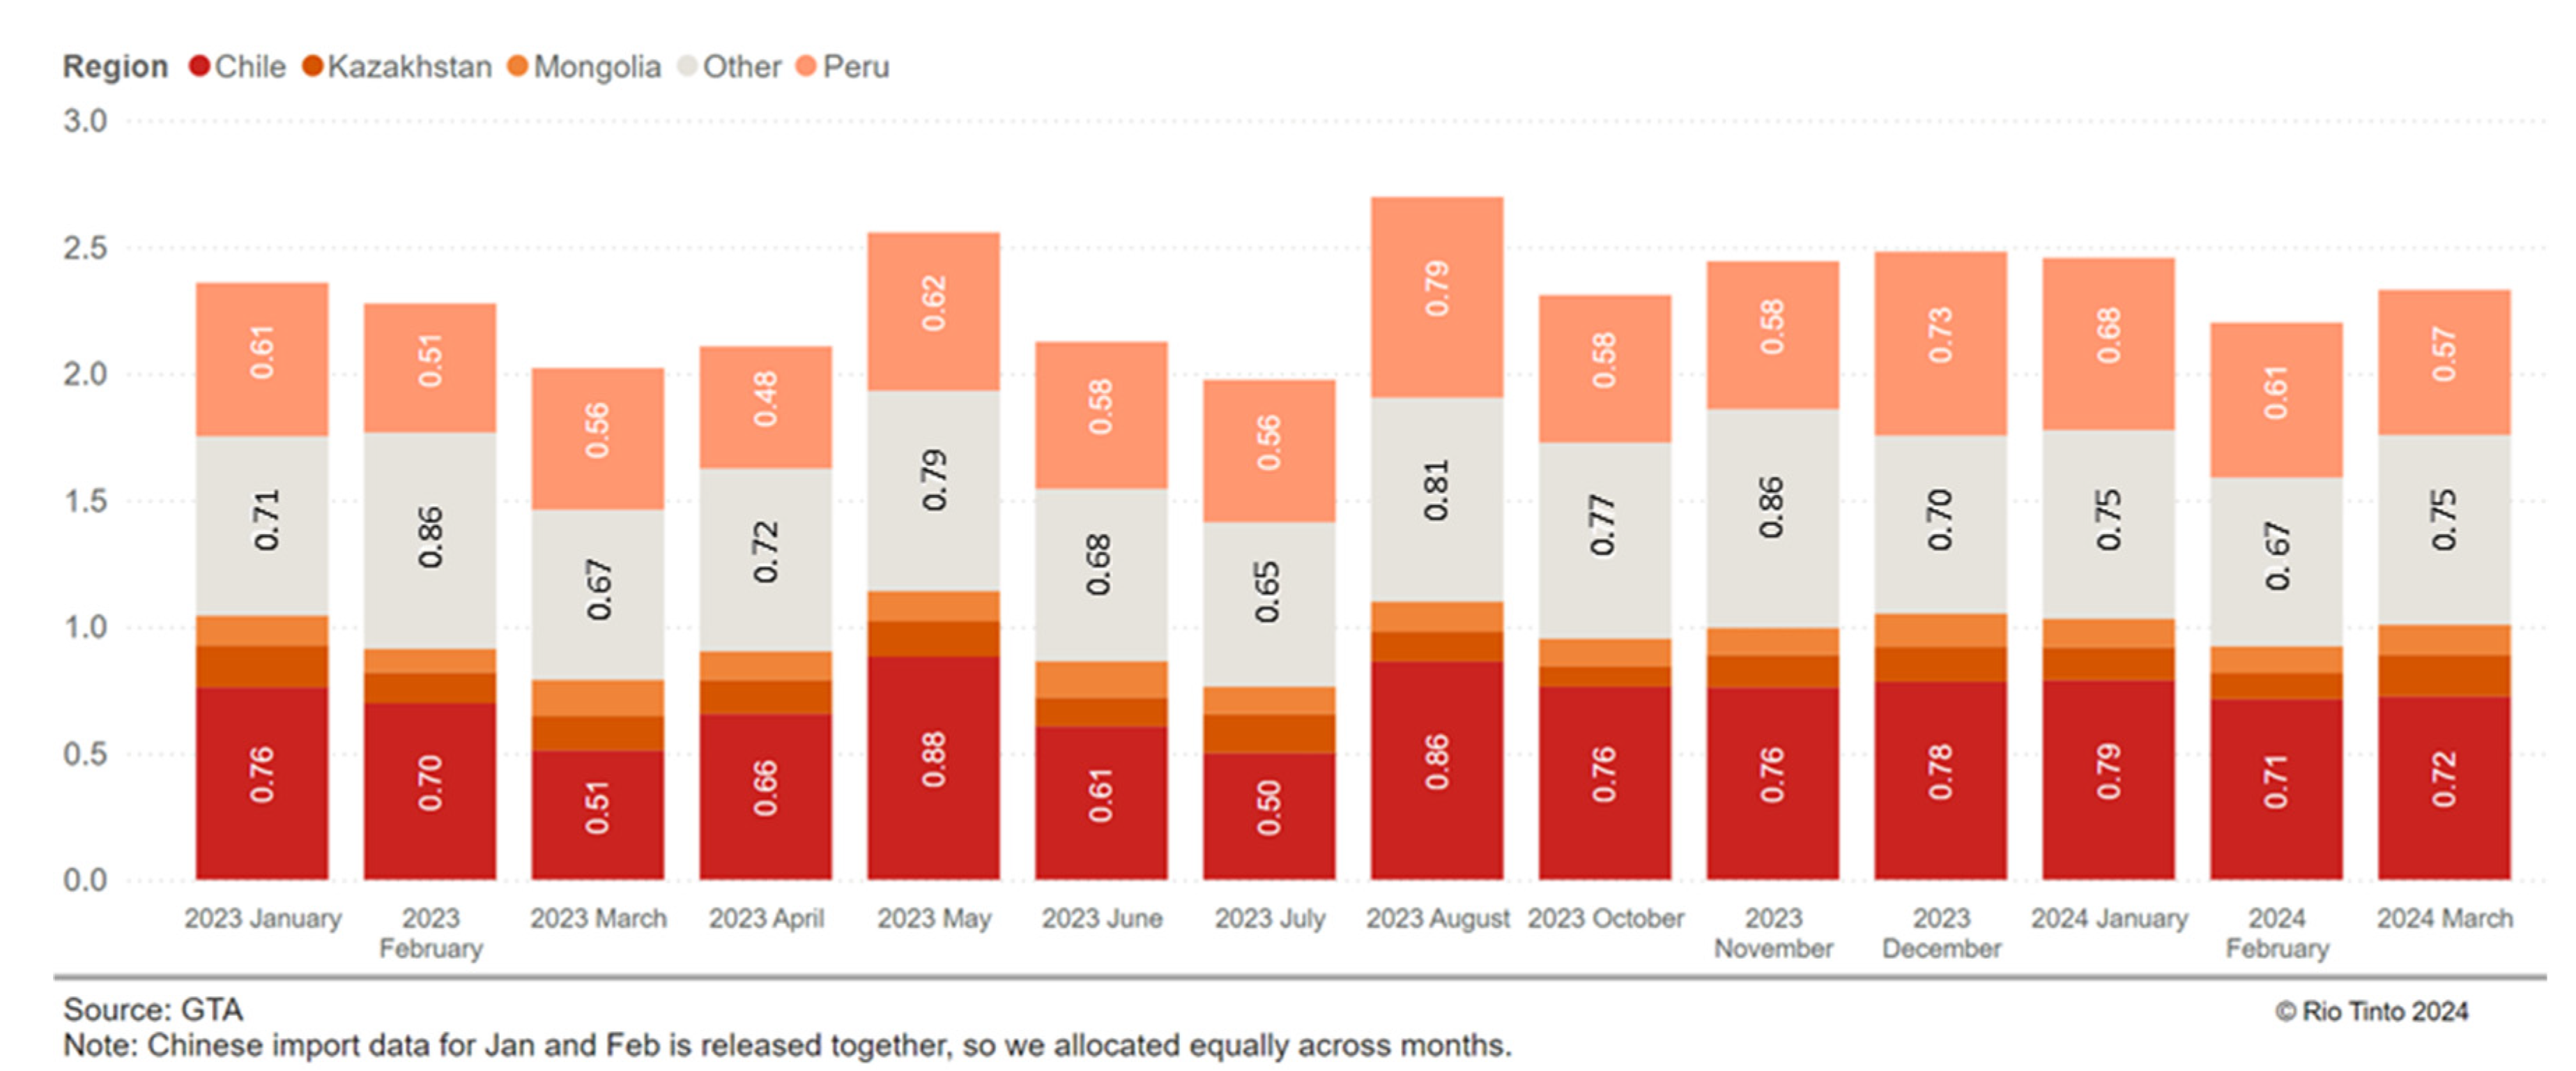
Figure 3a shows the world’s major copper mine producers, including Chile, Peru, the Democratic Republic of Congo, and China, with Chinese smelters contributing about 50%, as illustrated in Figure 3b. China operates around 55 smelters and 60 refineries to process both domestic and imported concentrates [[12]. Despite flat concentrate production, China is expanding its smelter capacity to respond to the green energy transition [13], with a projected shortfall of 9.2 Mt by 2027. To address concentrate shortages, Chinese smelters import a variety of concentrates from countries such as Chile, Peru, Kazakhstan, and Mongolia, as depicted in Figure 4. In 2023, total imported concentrate to China was reported to be 28 Mt [14].
Chinese smelters typically charge treatment and refining charges (TC/RC) to miners for processing their concentrates into final products. The international market for copper concentrates operates under a TC/RC benchmark, which is negotiated annually between major miners and smelters. Historically, this benchmark was set by Escondida or Freeport Indonesia in collaboration with Japanese smelters. However, over the past 20 years, China’s influence in the market has grown, and the benchmark is now primarily shaped by Freeport and Antofagasta Minerals in coordination with major Chinese smelters [15,16].

2.1. Pyrometallurgical Route of Copper Production

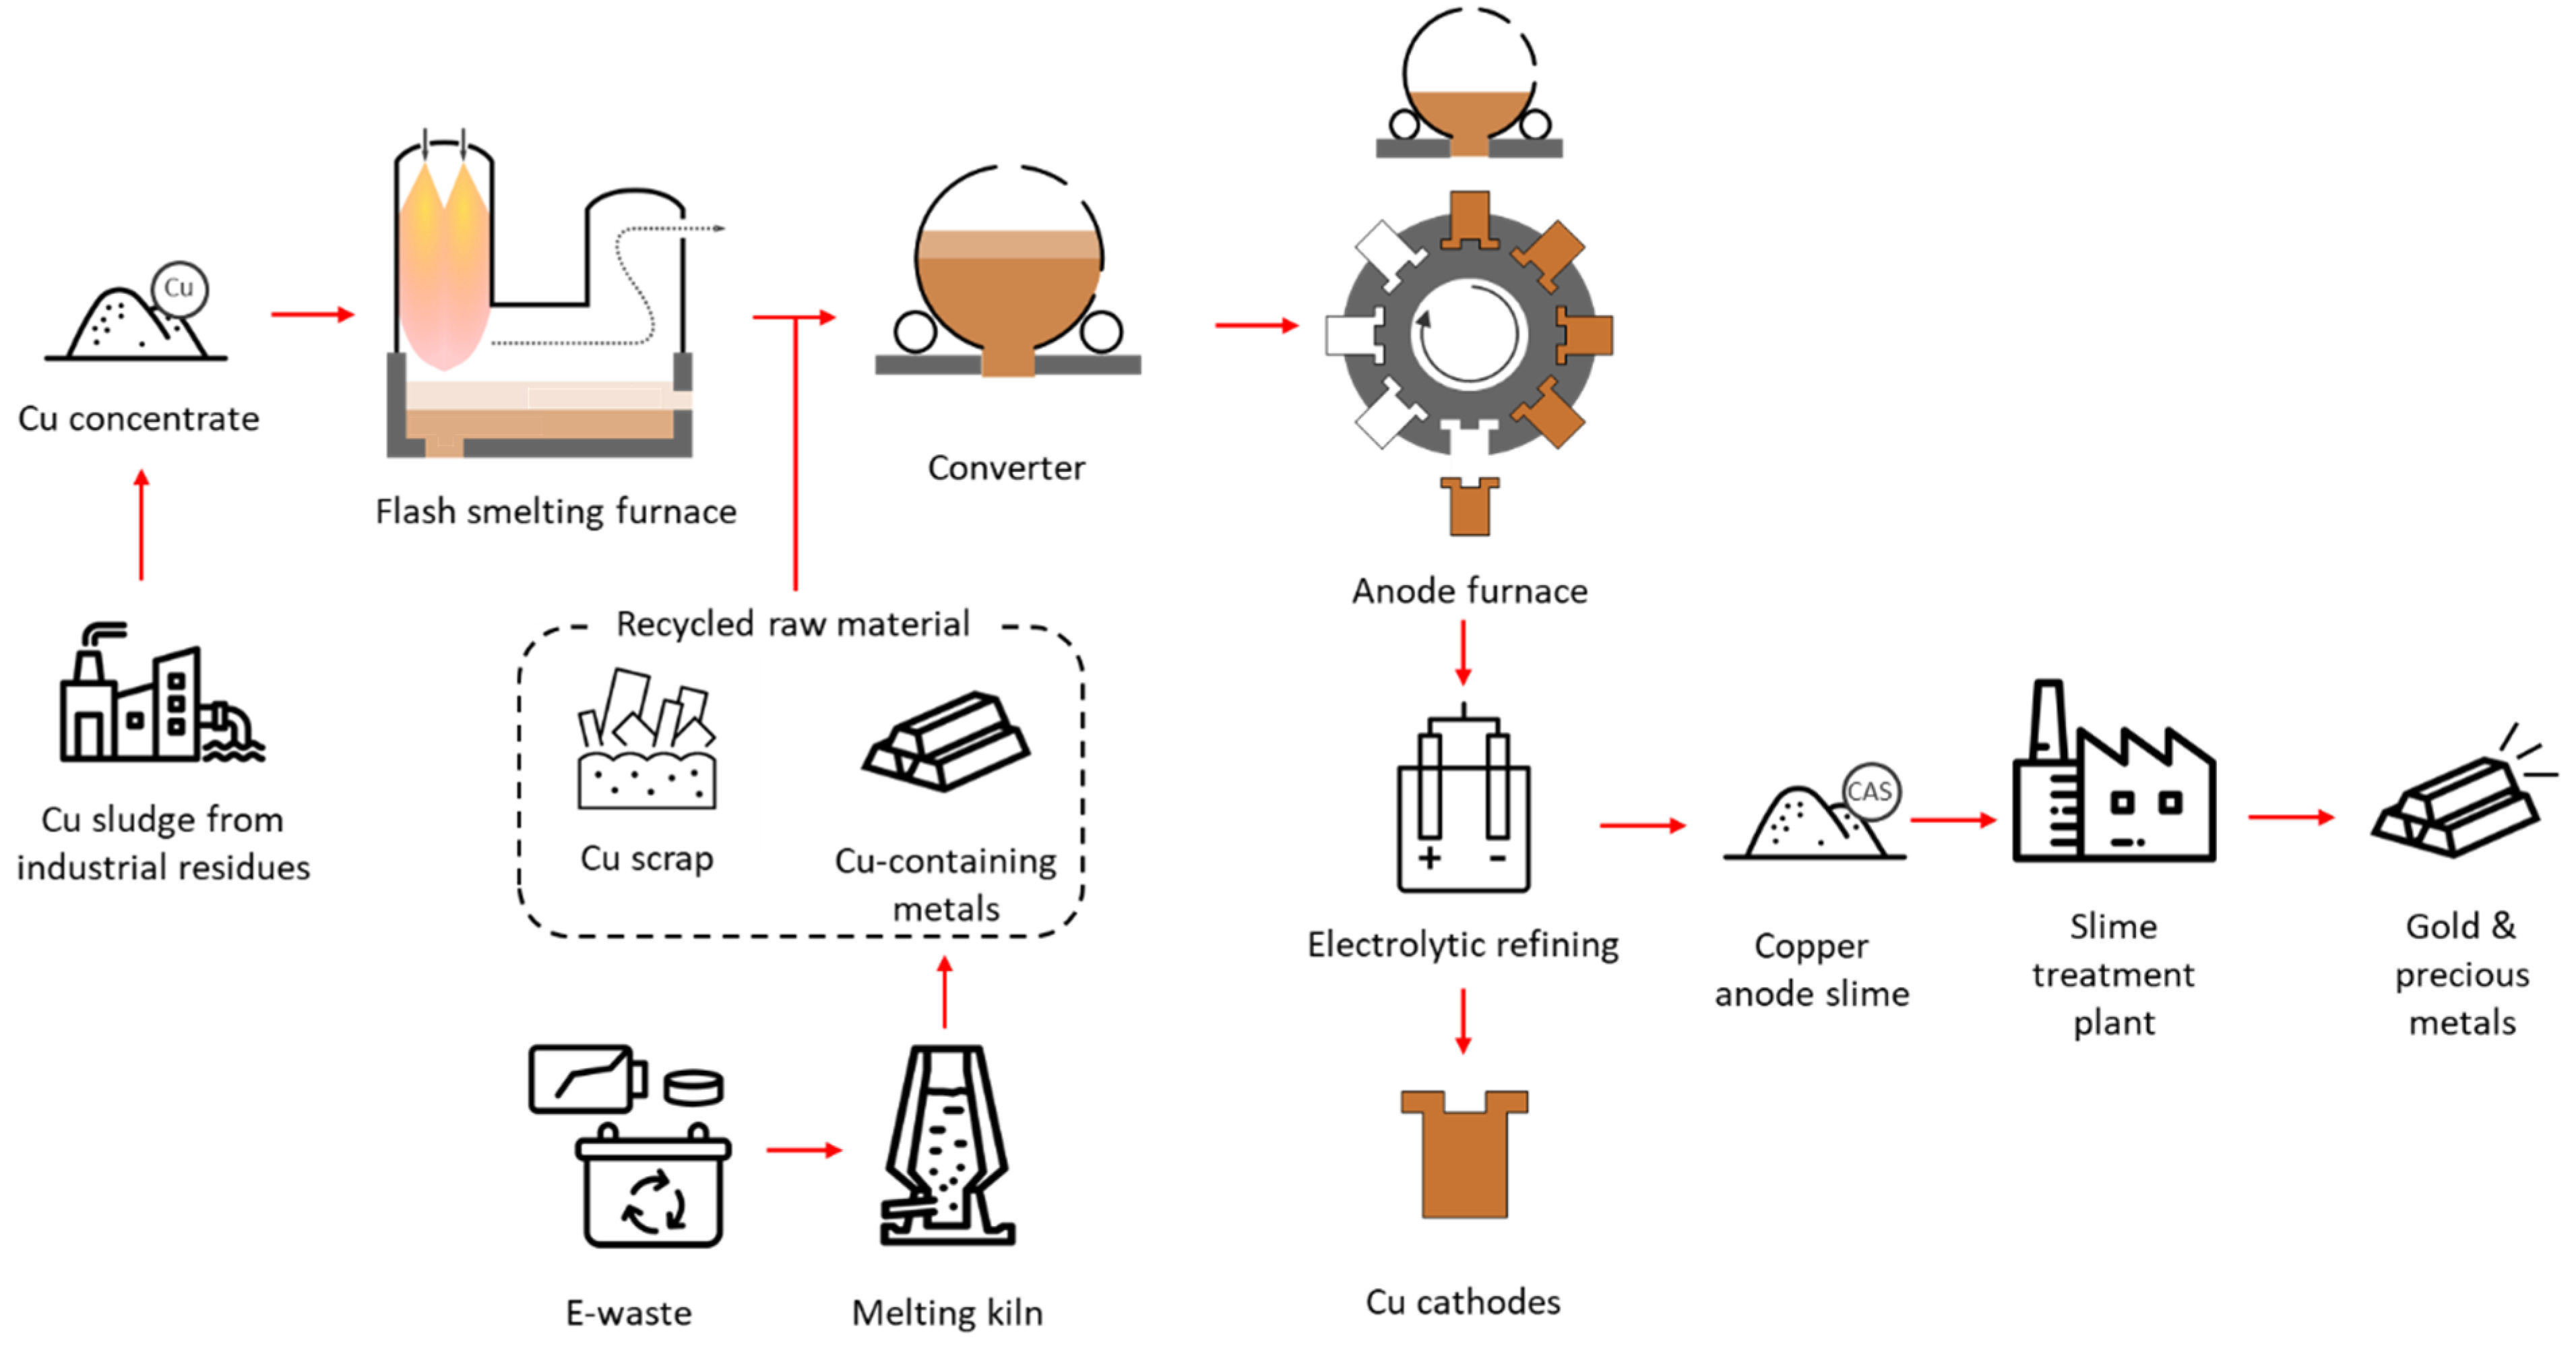
In the pyrometallurgical process, sulfide concentrate is fed into a smelting furnace to produce matte containing 45-74 wt% Cu. This matte is then converted into blister copper, which is further refined into anode copper with approximately 98-99.5 wt% Cu. The anode copper undergoes electro-refining to produce cathodes with 99.99 wt% Cu. During electro-refining, copper anode slime (CAS) is generated, which is subjected to various treatments to recover selenium (Se), tellurium (Te), precious metals (Au and Ag), and platinum group metals (PGMs) including platinum (Pt), palladium (Pd), and rhodium (Rh) [17,18,19,20]. An overview of copper smelting and refining processes is shown in Figure 5.

3. Gold in Copper Industry

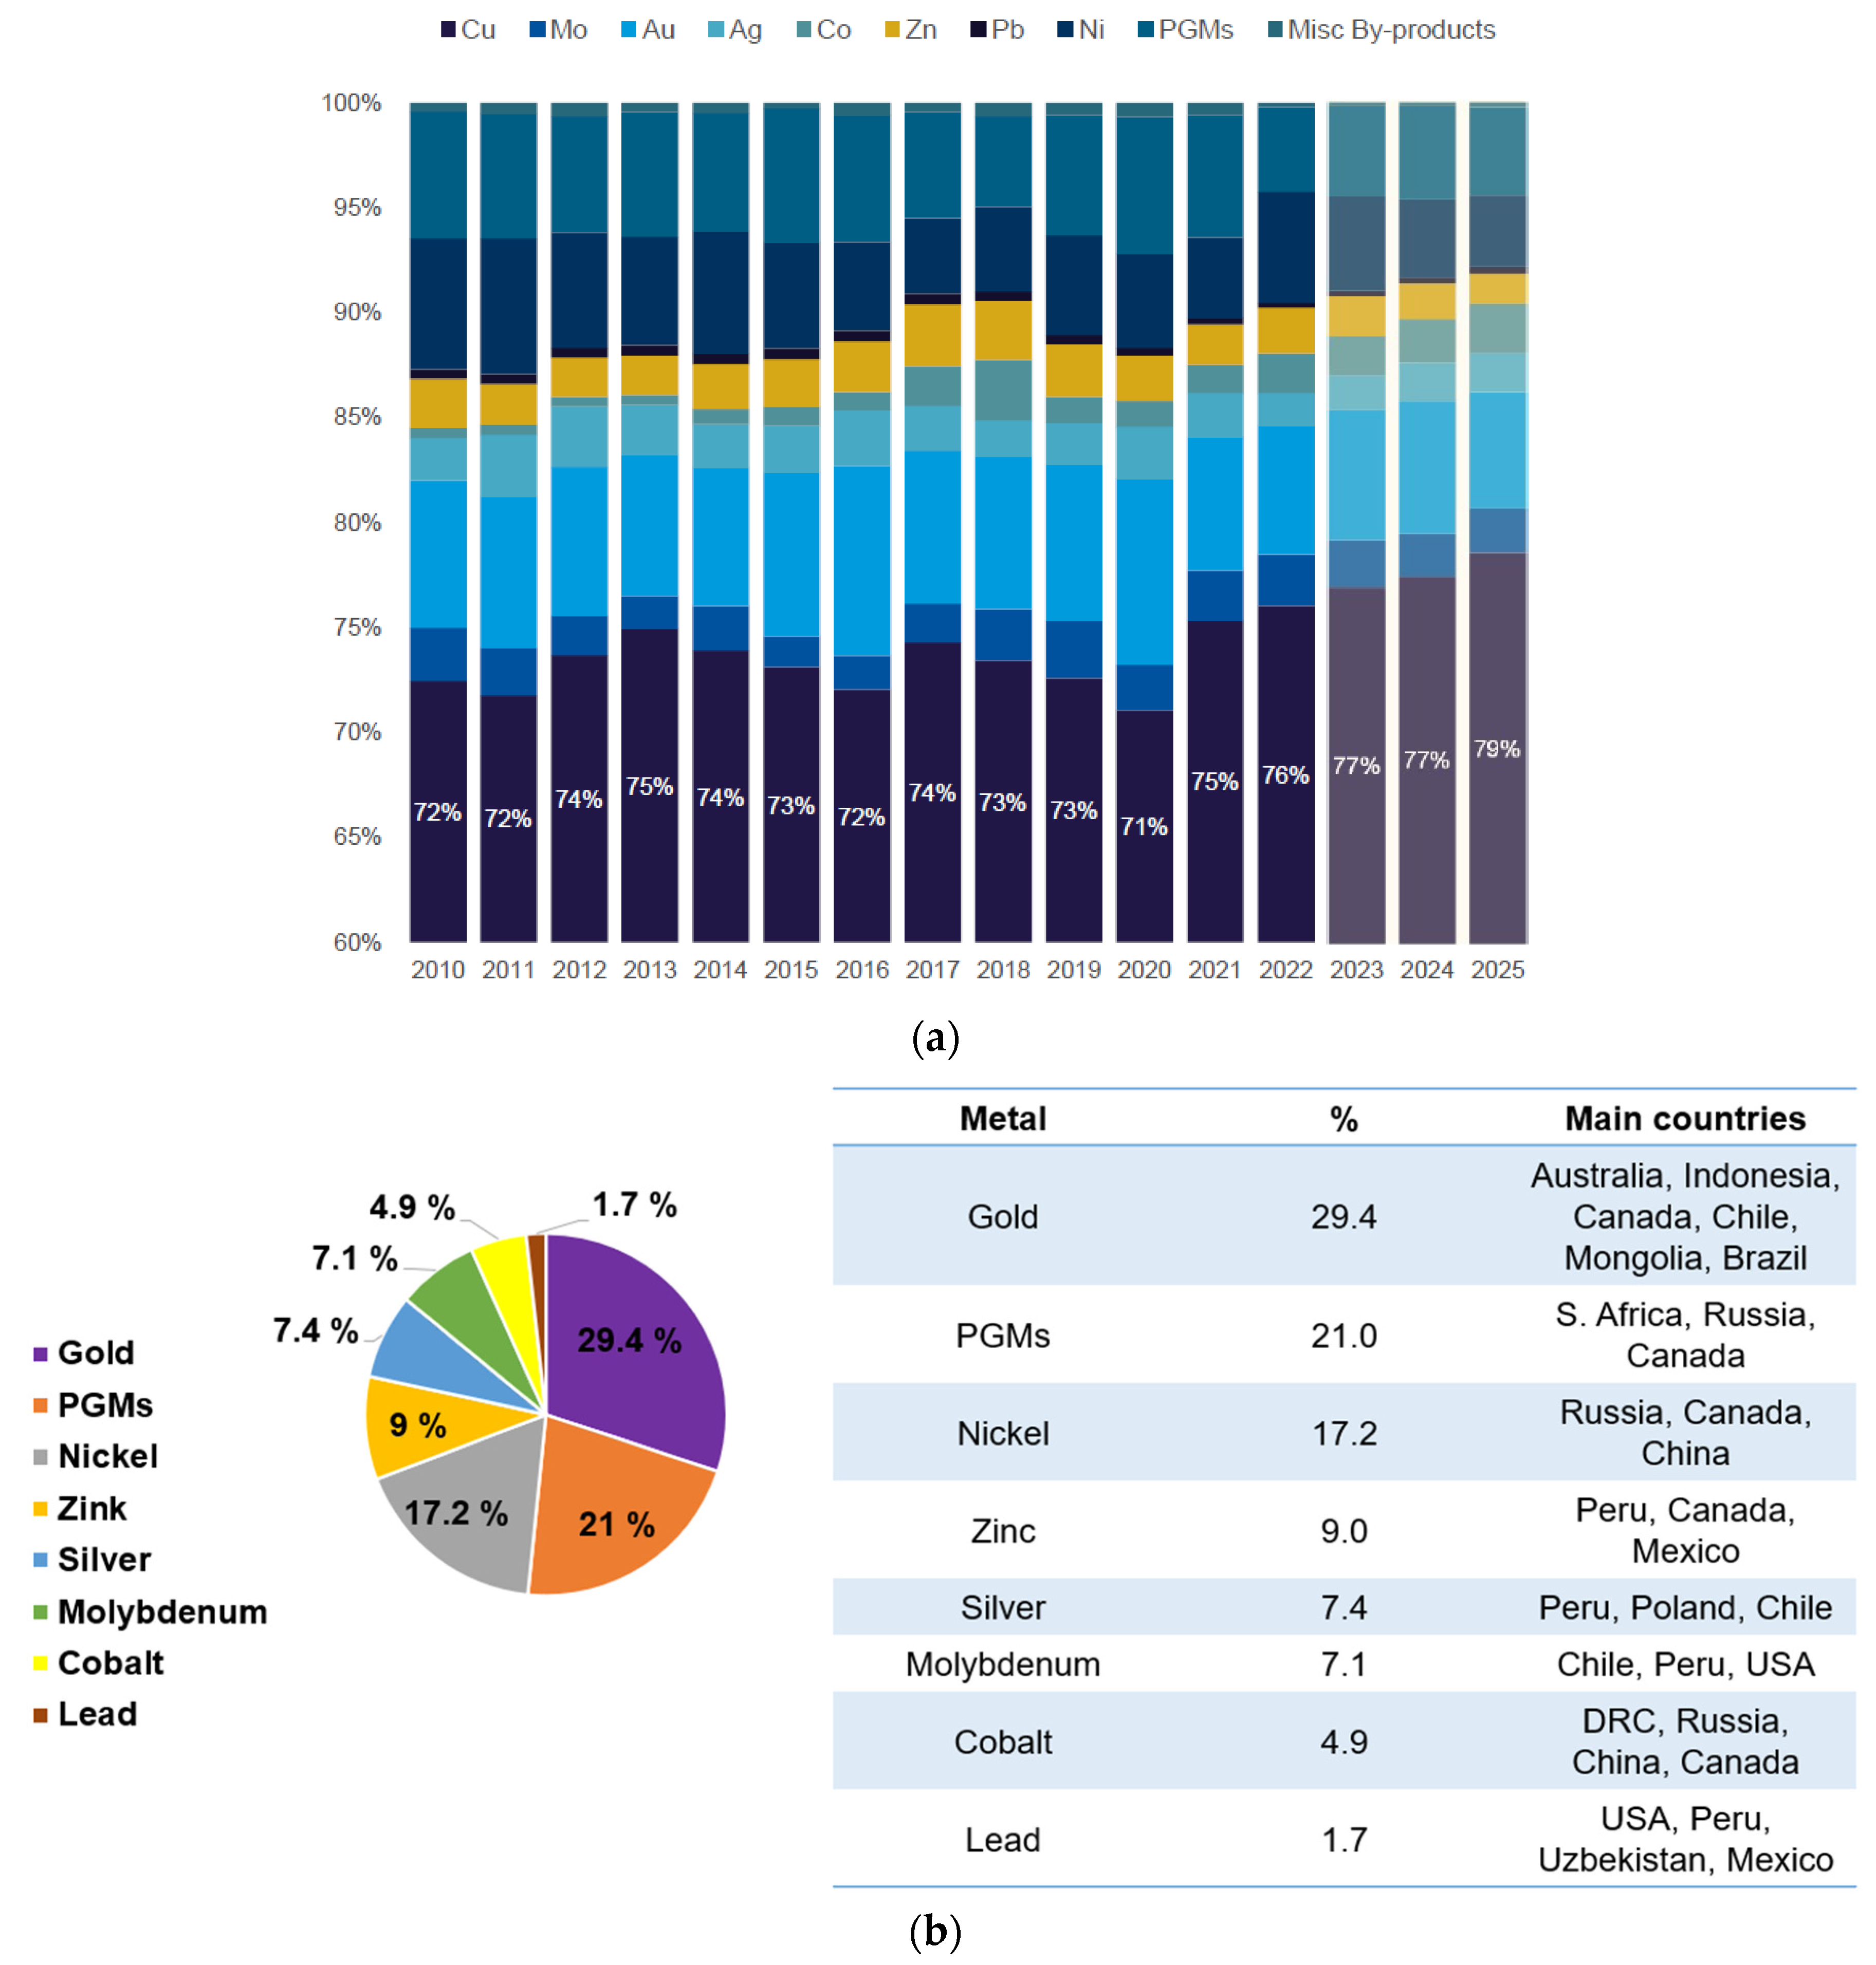
Copper concentrate naturally contains various other metals, including Mo, Co, Zn, Pb, Ni, Au, Ag, Pt, Pd, and Rh. Figure 6a shows that approximately 26% of the gross revenue for a custom copper smelter comes from the sale of these metallic by-products, with Au contributing the largest share at 6-8% [12]. In some cases, such as with concentrates from Australia, Indonesia, Canada, Chile, Mongolia, and Brazil, Au contribution can reach up to 30%, as depicted in Figure 6b. As a by-product of copper smelting, Au significantly boosts the economic value of smelter operations, requiring minimal additional effort for its recovery from the concentrate [12].
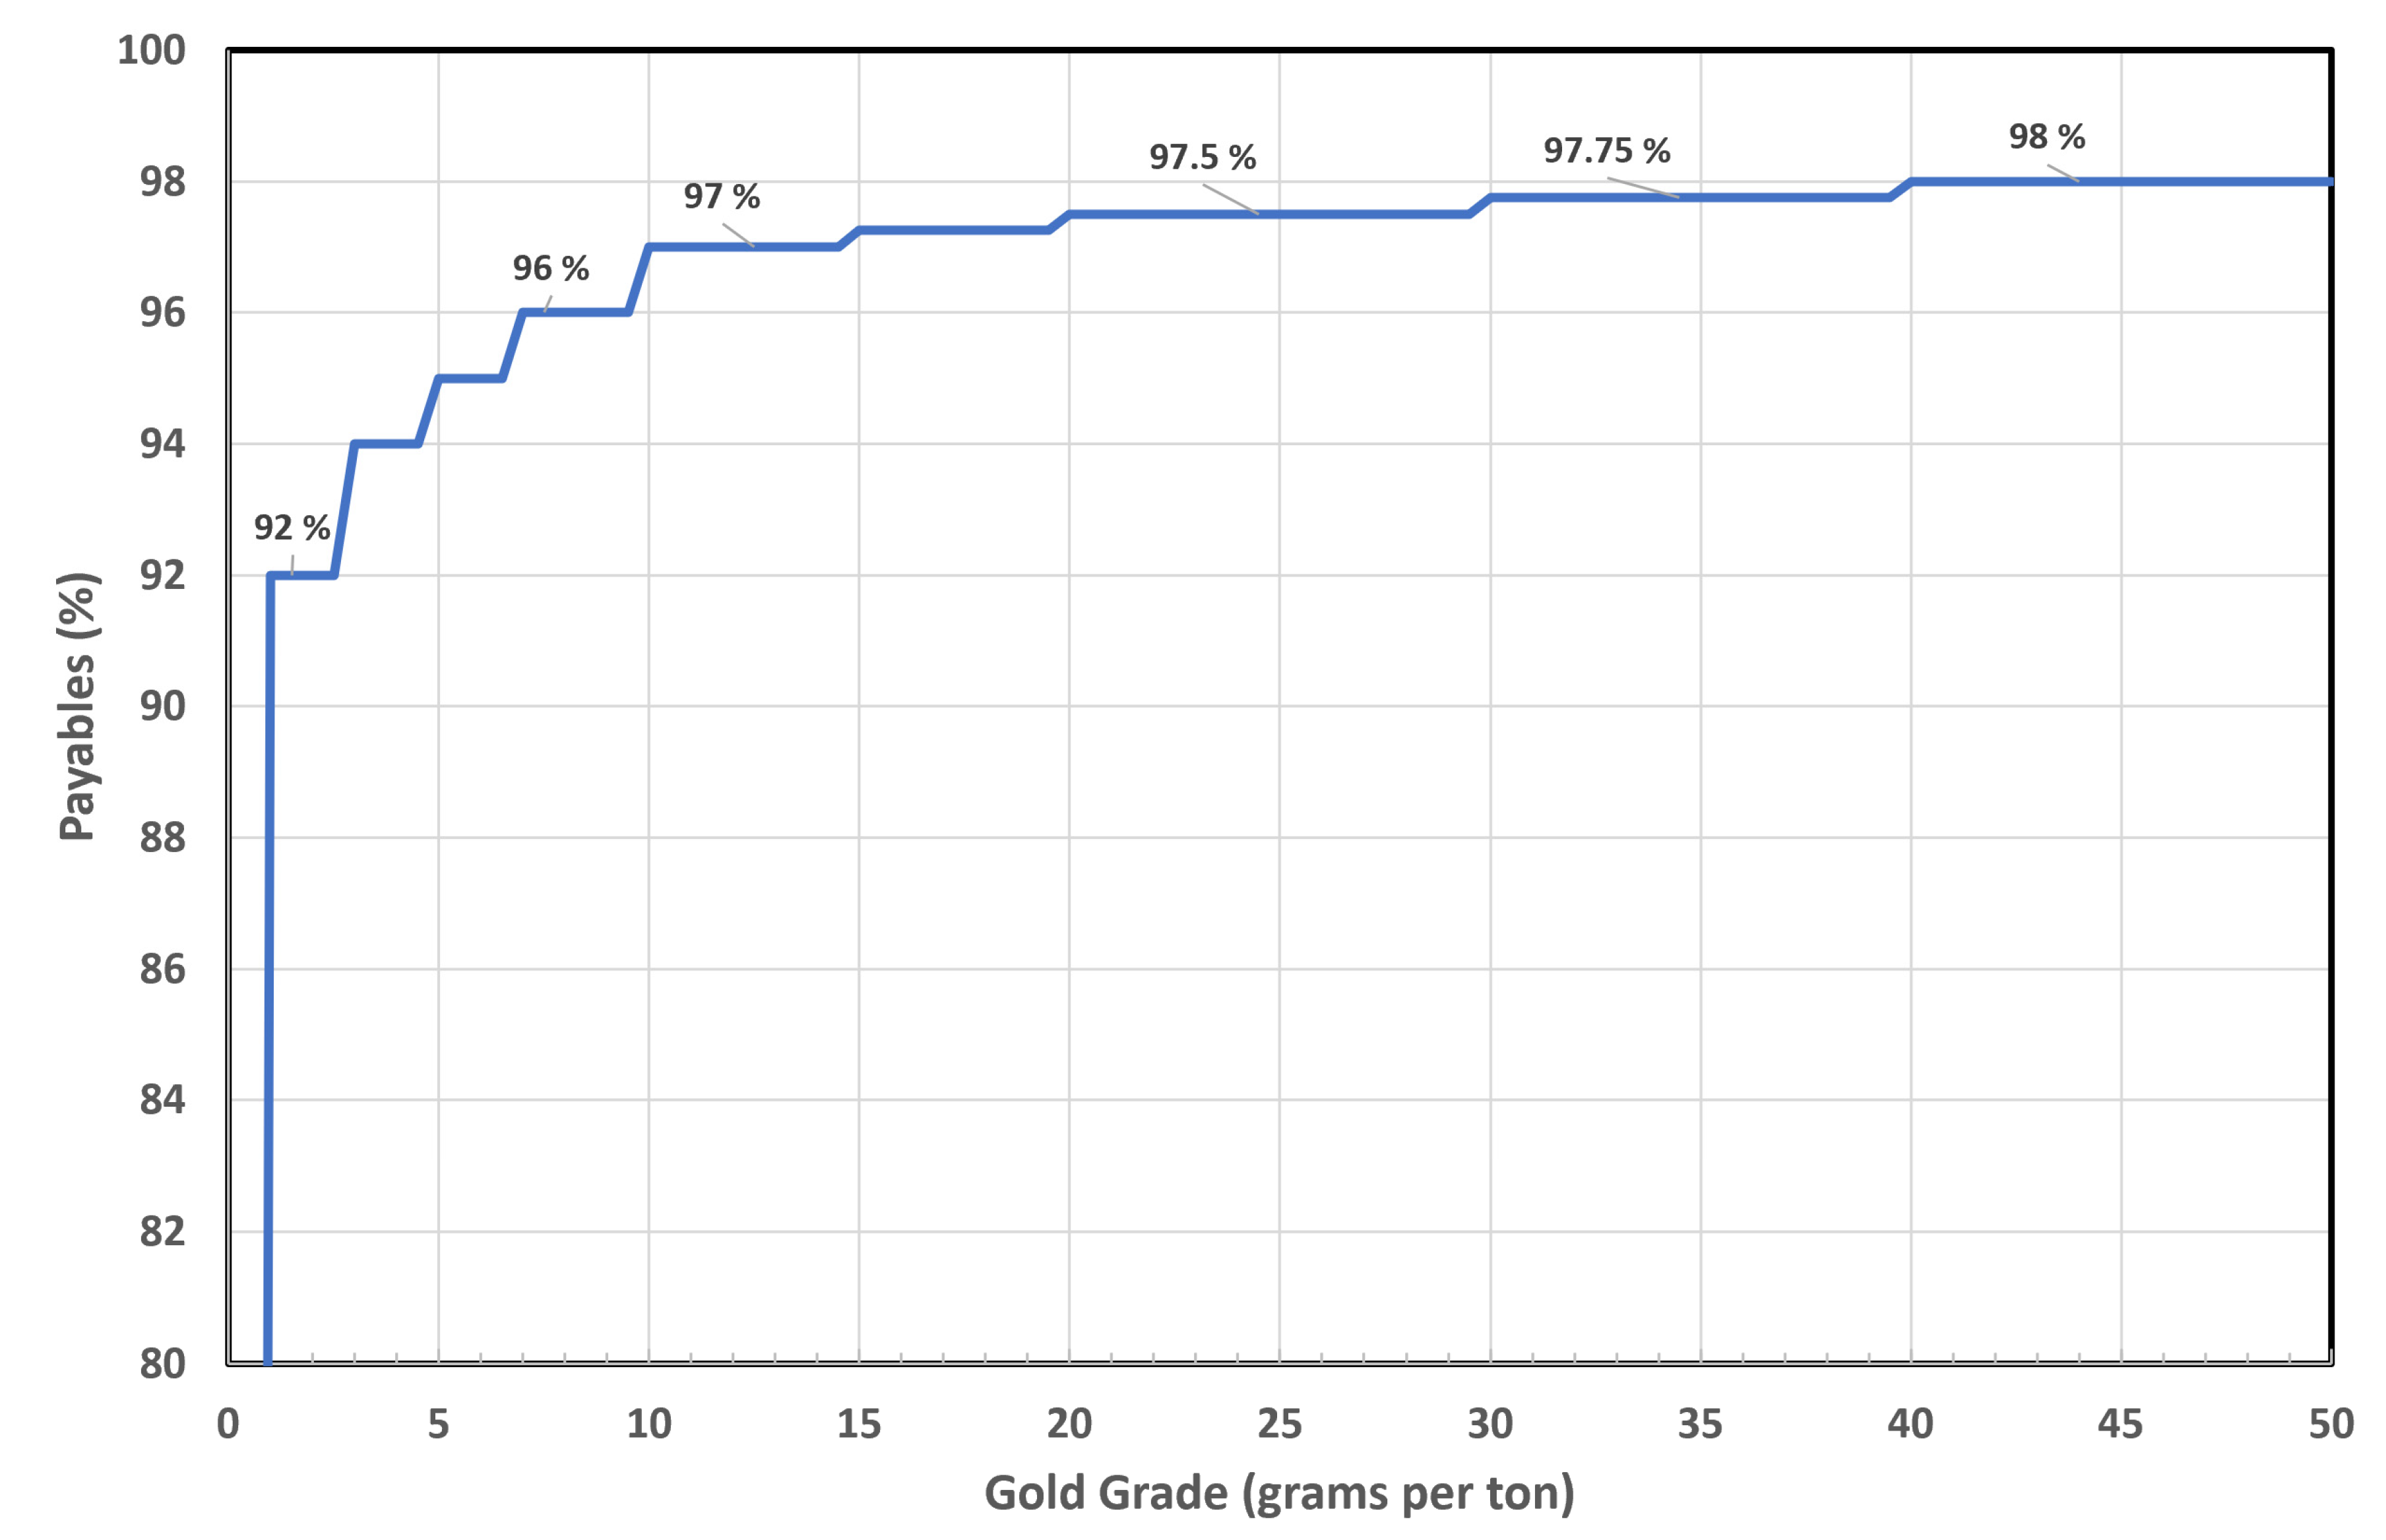
Gold also adds substantial value for copper concentrate miners. Copper smelters offer miners a significant payable—typically 90-92% of the gold content in the concentrate—starting from concentrations as low as 1 gram per ton. Smelters handling high-grade copper concentrates generally achieve higher gold recovery rates. Figure 7 illustrates the typical gold payables in the Japanese market.
With high gold concentrations (6-10 g/t) and favorable market prices, Au has become one of the most significant by-products for copper producers. Its substantial contribution to profitability has led many copper producers to focus on enhancing operational efficiency at their precious metal plants. Approximately 85% of all traded copper concentrates contain a minimum payable Au level of 1 g/t [21]. According to a published report, the treatment of CAS accounts for over 40% of China’s total output of precious metals (Au and Ag) [22].

3.1. Behavior of Gold from Copper Smelting to Refining

Gold is present in copper concentrate either as free gold particles or in solid solution within chalcopyrite [23]. During smelting and converting operations, gold remains closely associated with copper throughout the process, from matte to blister. Reported concentrations of gold in matte and blister range from 0-0.003 wt% and 0-0.004 wt%, respectively [4,21,24,25,26,27,28]. Gold also closely follows copper into the anode, with concentrations reaching up to 0.03 wt% compared to the original 6-10 ppm in the copper concentrate [21,24,25,29,30,31,32,33,34,35].
During electro-refining, nearly 100% of the Au accumulates in CAS, with only trace amounts reaching the cathode and negligible losses occurring in the electrolyte [30,31]. The CAS typically contains a high concentration of Au, averaging 0.76 wt% across various sources [36,37,38,39,40], which is nearly 1,000 times greater than the Au content in the original concentrate. Due to the relatively low mass of the slime (5-10 kilograms per ton of anode copper) and its high Au concentration, the processing costs for the final recovery and refining of Au are low [21]. The CAS is collected from the bottom of the electrolytic tanks and is sent to precious metal processing plants after the removal of Cu, Te, Se, and Ni (if applicable).
To determine Au recovery rate in copper smelting, it is crucial to understand the mechanisms of gold loss. In pyrometallurgical operations, metal losses can be categorized into colloid loss, entrainment loss, dust loss, skull formation, and chemical loss. In copper smelting, the most relevant forms of loss are colloid loss, skull formation, and chemical loss [41]. Colloid loss, or emulsion loss, refers to metal droplets entrapped in slag as colloids and removed with the slag. Skull loss occurs when metal solidifies in cold zones, on the vessel rim, or in deslagging equipment. Chemical loss happens when metal dissolves chemically in slag. This study investigates both chemical and colloidal losses that occur primarily during smelting and converting processes. For the purposes of this study, colloidal loss is considered a type of physical loss. During the anode refining stage, slag generation is minimal, leading to the assumption that there is negligible chemical or physical loss of Au at this stage. Gold loss during electro-refining is discussed in Section 3.4.

3.2. Chemical Loss

Chemical loss pertains to the oxidation of Au, forming AuO [42], and its subsequent dissolution into the bulk slag during smelting or converting processes. This type of loss can be quantified using partition coefficient data between matte and slag in smelting, and between blister copper and slag during converting. Research has examined the effects of various factors—such as copper matte grade, temperature, and slag composition—on the partition coefficient of Au between matte and slag [5,6,43]. This partition coefficient is calculated using Equations (1) and (2) for the smelting and converting stages, respectively, as follows:
L A u m / s = w t %   A u m a t t e w t %   A u s l a g
L A u c / s = w t %   A u c o p p e r w t %   A u s l a g
where m, c, and s represent matte, copper, and slag, respectively, [ ] denotes the concentration of Au dissolved in the matte (for smelting) or copper (for converting), respectively, and ( ) denotes the Au concentration dissolved in slag.

3.2.1. Smelting

Henao et al. [44] measured the Au partition coefficient between Cu₂S-FeS matte and Fe-silicate-based slag at 1300°C under a P S O 2 of 0.1 atm. The experiments were conducted using MgO crucibles, with approximately 8 wt% MgO solubility in the slag. The Au content in both the slag and matte was analyzed using inductively coupled plasma mass spectrometry (ICP-MS). In a study by Avaarma et al. [6], the distribution of Au between copper matte and silica-saturated Fe slag was investigated under flash smelting conditions, at temperatures ranging from 1250°C to 1350°C and P S O 2 of 0.1 atm. However, the electron probe microanalysis (EPMA) detection limit for Au (31 ppm) was insufficient to accurately measure its content in slag. Subsequently, Avaarma et al. [5] refined their analytical techniques, incorporating EPMA for matte and laser ablation inductively coupled plasma mass spectrometry (LA-ICP-MS) for slag, aiming for reliable bulk analyses. The instrumental uncertainty for EPMA was estimated at ±0.5 wt% and detection limits for Au in slag using LA-ICP-MS were reported to be below 1 ppm. Chen et al. [43] used a high-temperature isothermal matte-slag equilibration technique in a controlled atmosphere of CO-CO₂-SO₂-Ar gas mixture. Analytical techniques such as EPMA and laser ablation high-resolution inductively coupled plasma mass spectrometry (LA-HR-ICP-MS) were employed for precise measurements. The study explored three types of slags: pure FeOx-SiO₂, FeOx-SiO₂ with 10 wt% Al₂O₃, and FeOx-SiO₂ with 10 wt% Al₂O₃ and 10 wt% CaO, to assess the role of Al₂O₃ and CaO in enhancing metal recovery in the matte phase. Experiments were conducted at 1300°C, with controlled P O 2 and P S 2 using MTDATA software.
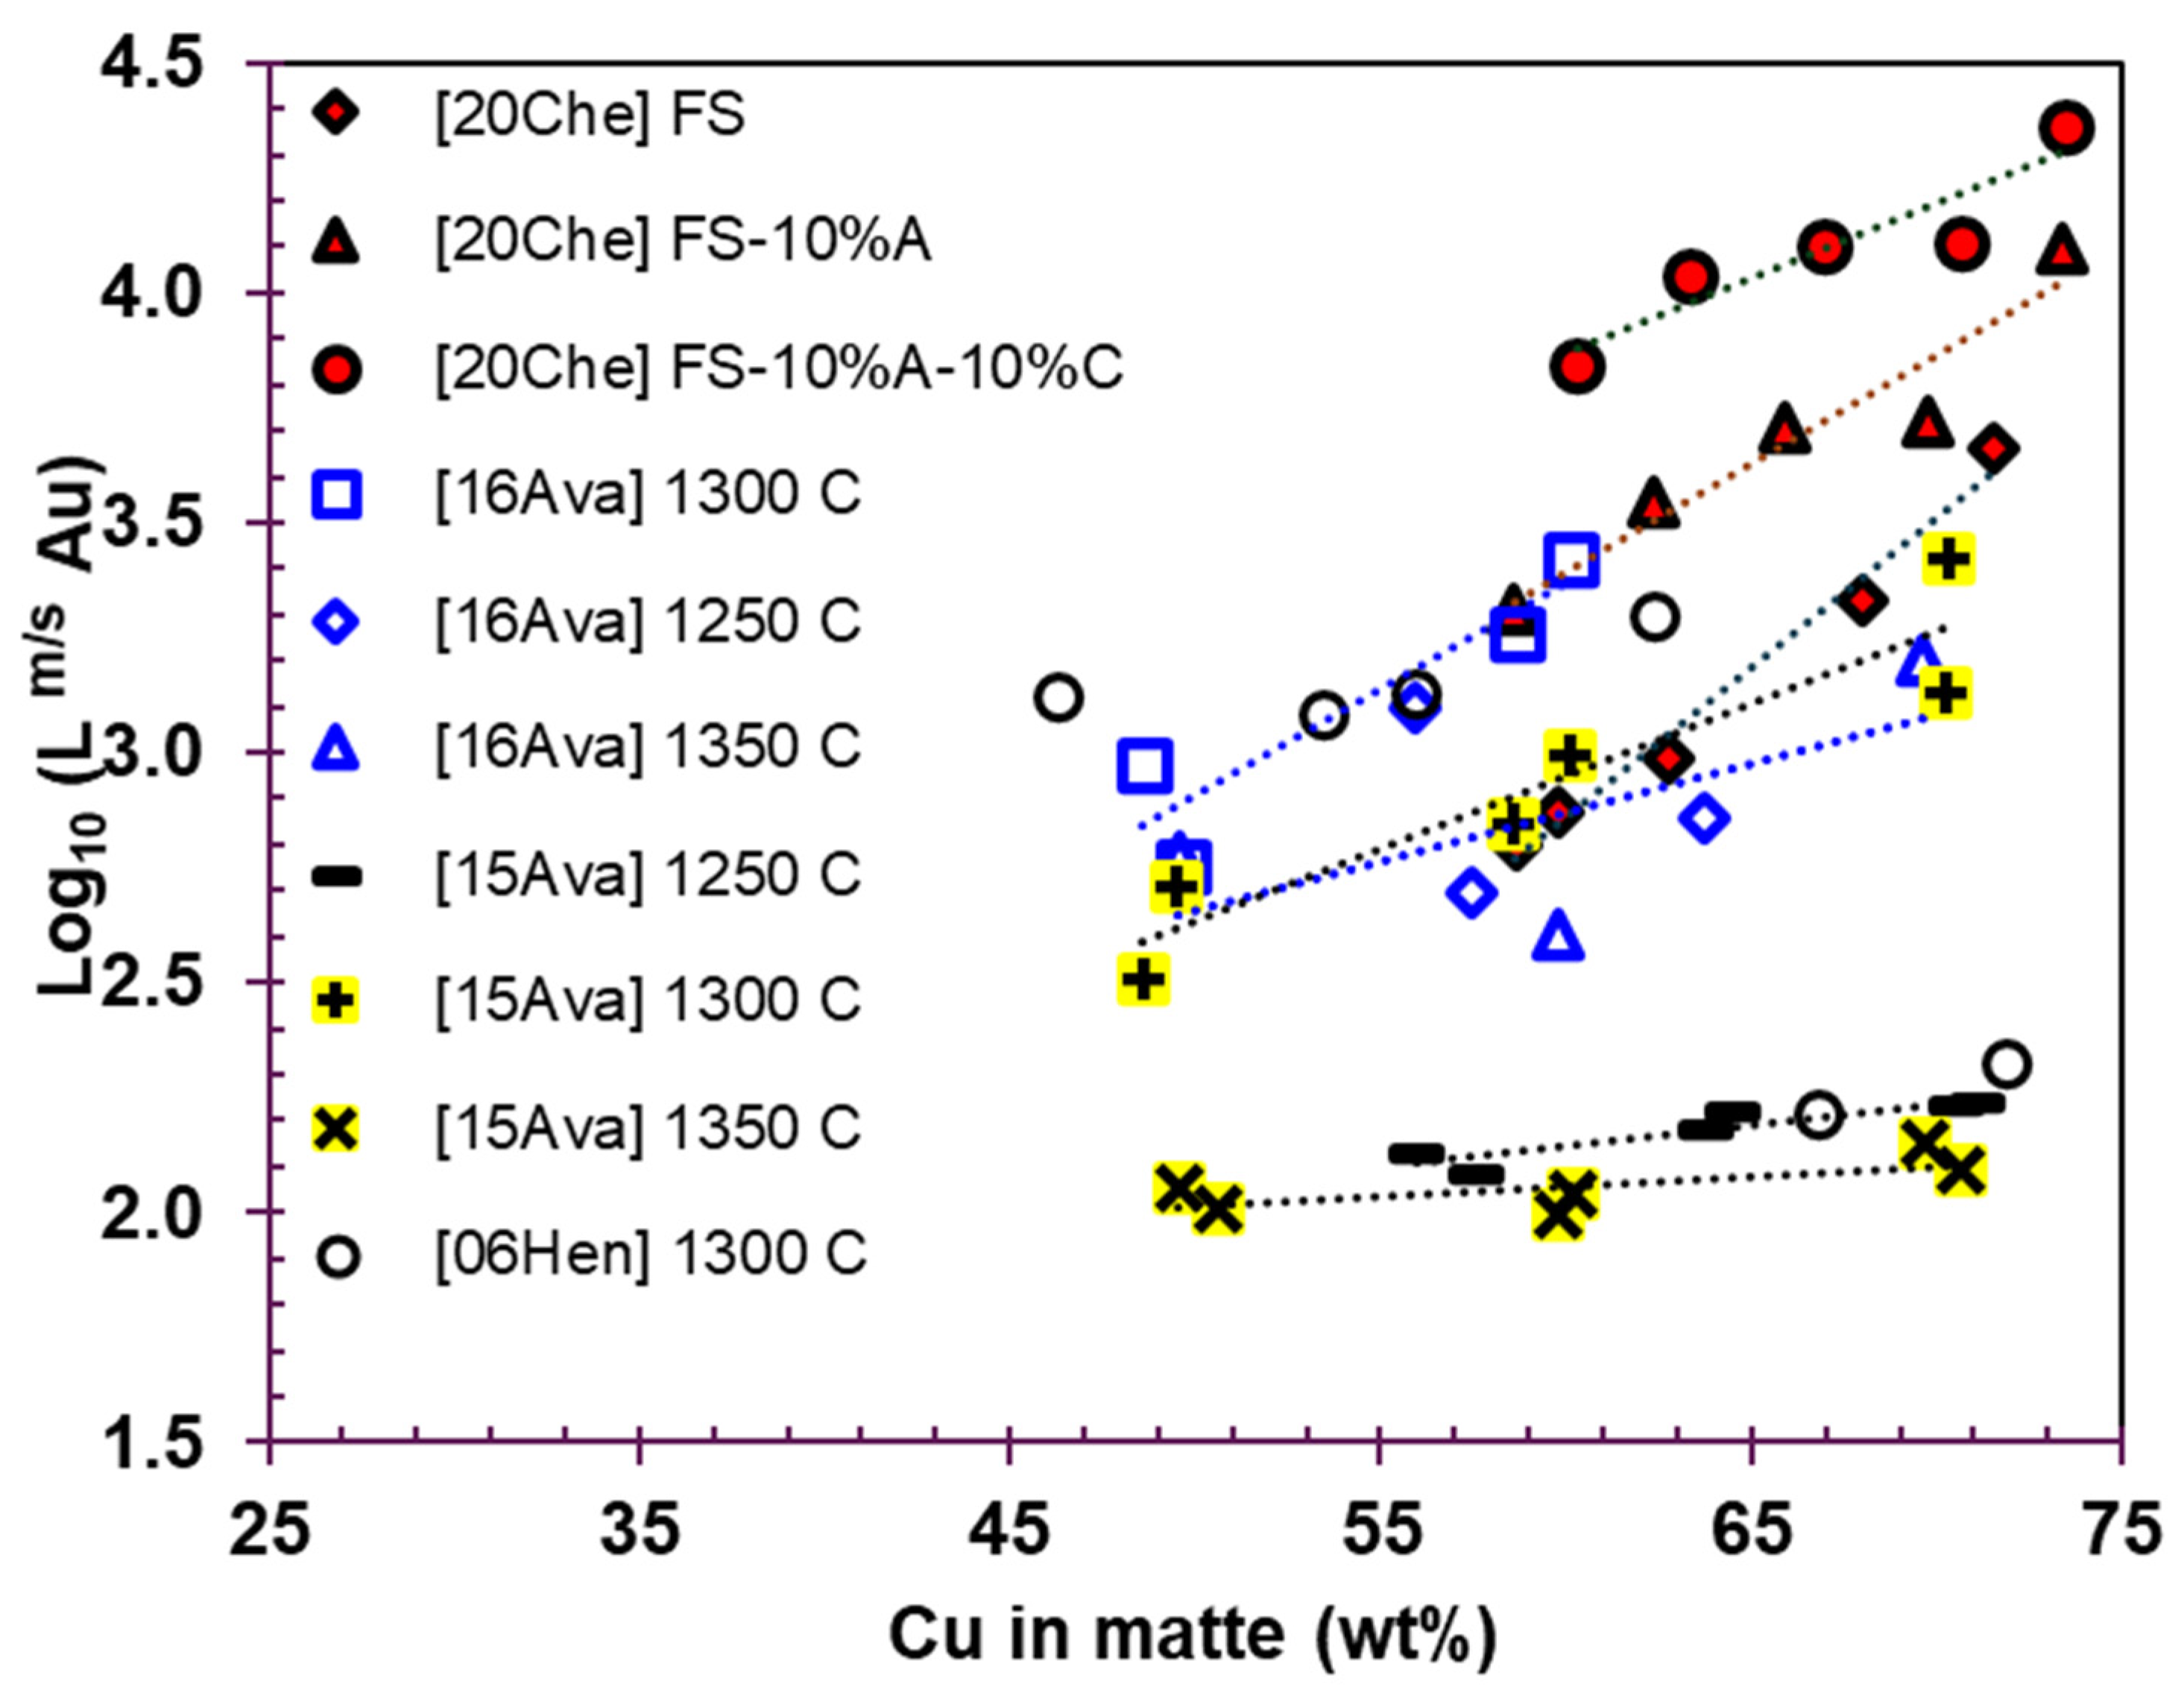
Figure 8 illustrates the gold partition coefficients ( L A u m / s ) as a function of matte copper grade, based on experimental data from the literature. The partition coefficients range from 100 to over 2000, indicating that most of the Au reports to the matte phase. The data show that increasing the Cjju content in matte from 50 wt% to over 70 wt% leads to a higher Au partition coefficient between matte and slag, suggesting that higher matte grades favor Au recovery in the matte phase. This trend is opposite to the behavior of chemically dissolved copper in slag, which increases with higher copper matte grades. At high matte grades (greater than 70 wt% Cu), most Cu losses are attributed to chemical loss [45,46,47,48].
As seen in Figure 8, there is general agreement on the trend of the gold partition coefficient with matte copper grade among the data from Avarmaa et al. [5,6] and Chen [43]. However, the trend observed by Henao et al. [44] differs, as they reported that the L A u m / s remains constant up to a matte grade of 63 wt% and then decreases as the matte grade increases beyond 63 wt%. Celmer and Toguri [49] also observed that the gold distribution coefficient between silica-saturated FeO-SiO₂ slags with varying Al₂O₃ concentrations and a Cu-Ni matte increases with higher copper and nickel concentrations in the matte at 1250°C and 0.01 bar P S O 2 . They used neutron activation analysis to determine the gold content in slag. Their findings are consistent with those of Chen et al. [43], who reported that the gold concentration in slag decreases when Al₂O₃ is present in the slag.
As shown in Figure 8, slags with compositions of FeO-SiO₂-10 wt% Al₂O₃ and FeO-SiO₂-10 wt% Al₂O₃-10 wt% CaO exhibit better Au partition coefficients compared to silica-saturated FeO-SiO₂ slag. The temperature does not show a clear impact on the distribution of gold between matte and slag, as the data appear scattered. Additionally, it is important to note that the Au concentrations in slag were measured using ICP in the studies by Avarmaa et al. [5] and Chen et al. [43], whereas in the study by Avarmaa et al. [6], EPMA was used. The detection limit of EPMA for Au (31 ppm) was not sufficient to accurately measure the gold content in slag, making the ICP-derived data more reliable.

3.2.2. Converting

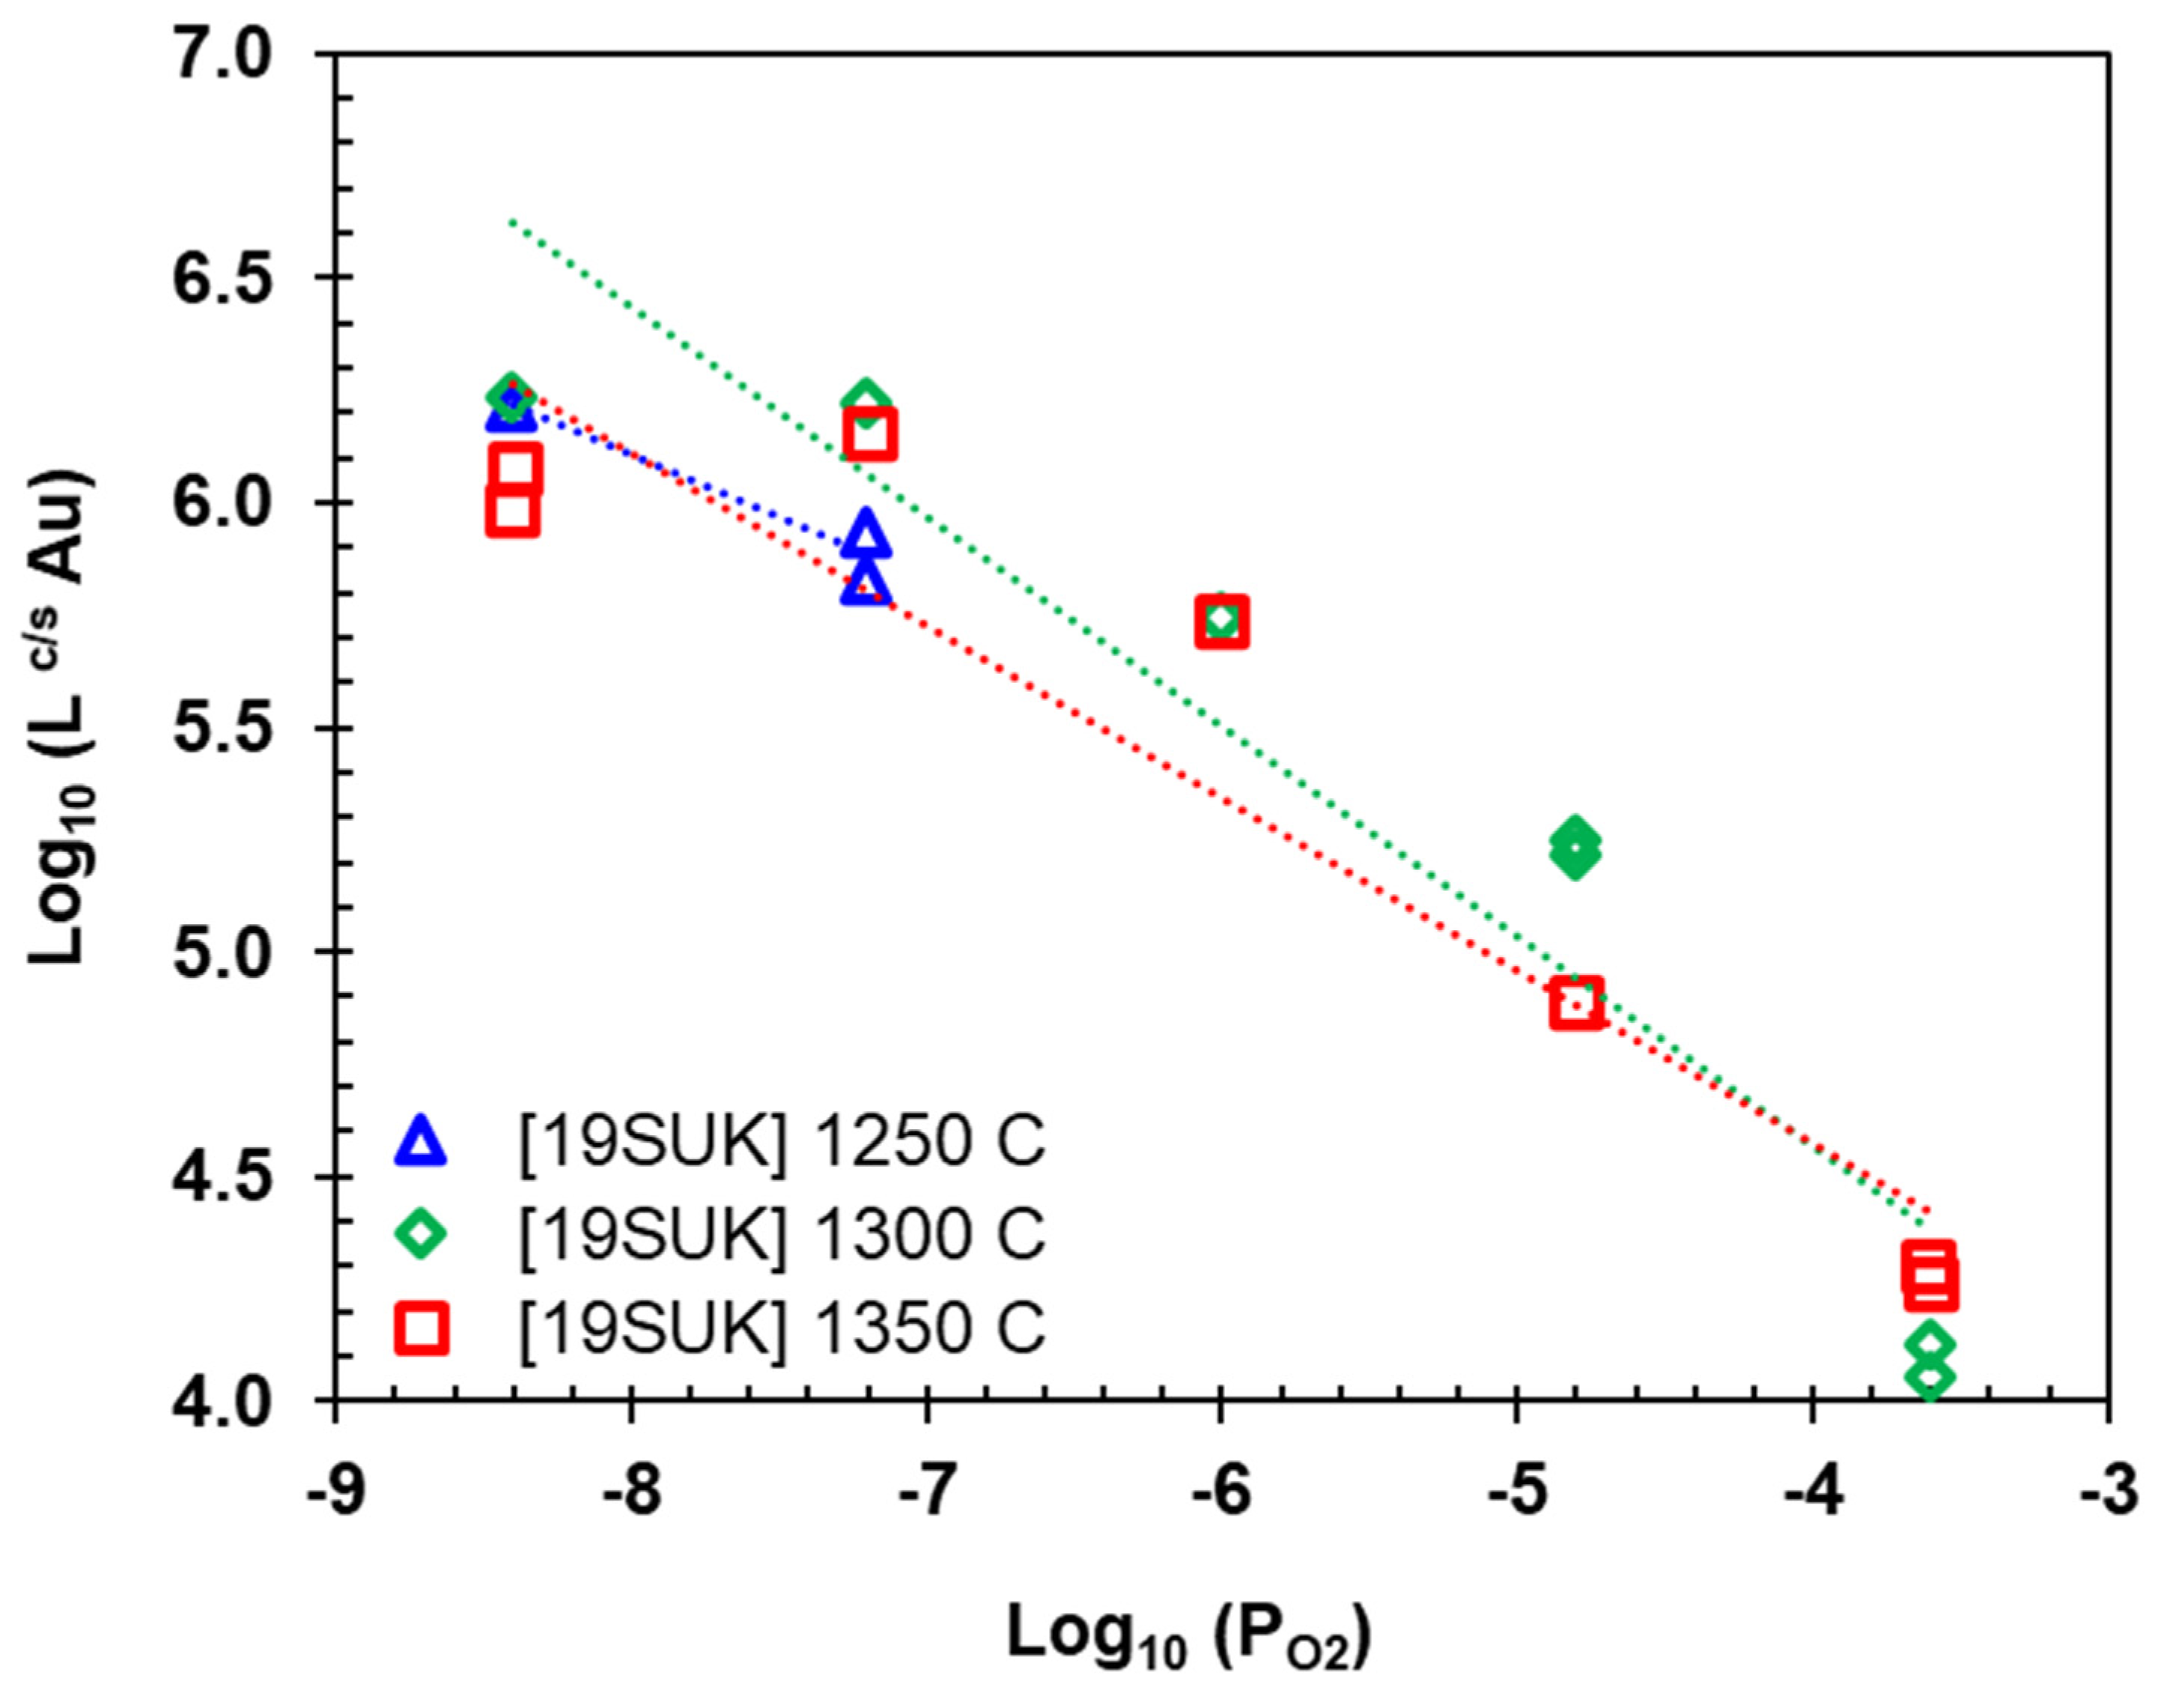
Mackey et al. [50,51,52] measured the gold distribution coefficient between copper and slag at 1250 oC, under a P S O 2 of 0.21-0.3 atm, and an Fe/SiO2 ratio of 1.4 – 1.9 using a pilot-scale Noranda converter. The Au partition coefficient was reported as 300. Toguri and Santander [53] also investigated the gold distribution coefficient between copper and iron silicate slag as a function of temperature (1250-1350 oC), P O 2 (10-8 – 10-7 atm), and composition. However, the effect of these variables on the gold partition coefficient was unclear due to scattered data (at the level of a few hundred ppm). The Au solubility in slag varied between 0 and 800 ppm. Sukhumlinov et al. [7] explored the high-temperature isothermal equilibration of metallic copper with alumina-saturated iron silicate slag under experimental conditions varying temperatures between 1250 °C, 1300 °C, and 1350 °C and P O 2 from 10-9 to 10-3 atm. The solubility of Au, was found to be low in slag, about 0.01 ppm at 1300 °C and P O 2 = 10-8 atm. Elemental analysis was conducted using EPMA and LA-ICP-MS.
Figure 9 illustrates the Au partition coefficients between metallic copper and alumina-saturated iron-silicate slag ( L A u c / s ) as a function of log P O 2 , for temperatures ranging from 1250 to 1350 oC. The L A u C / S values range from 104 to 106, indicating that Au predominately partitions into the copper phase. As shown in Figure 9, with increasing P O 2 , the L A u C / S decreases, suggesting that the Au concentration in slag increases as P O 2 rises. This implies that gold undergoes oxidation and dissolves in the slag as AuO [42]. The temperature does not appear to significantly affect the L A u c / s values, as the data across different temperatures are relatively scattered.
Holland et al. [54] measured the gold distribution coefficient between copper and white metal (WM) ( L A u C / W M ) within a temperature range of 1250 to 1350°C, under P S O 2 varying from 0.01 to 1 atm. White metal, an intermediate product formed during the copper converting process, contains a higher copper content (approximately 75-80 wt%) than matte. The gold concentration in WM and copper was determined using LA-ICP-MS and EPMA, respectively. The reported distribution coefficient for Au varied between 250 and 333.
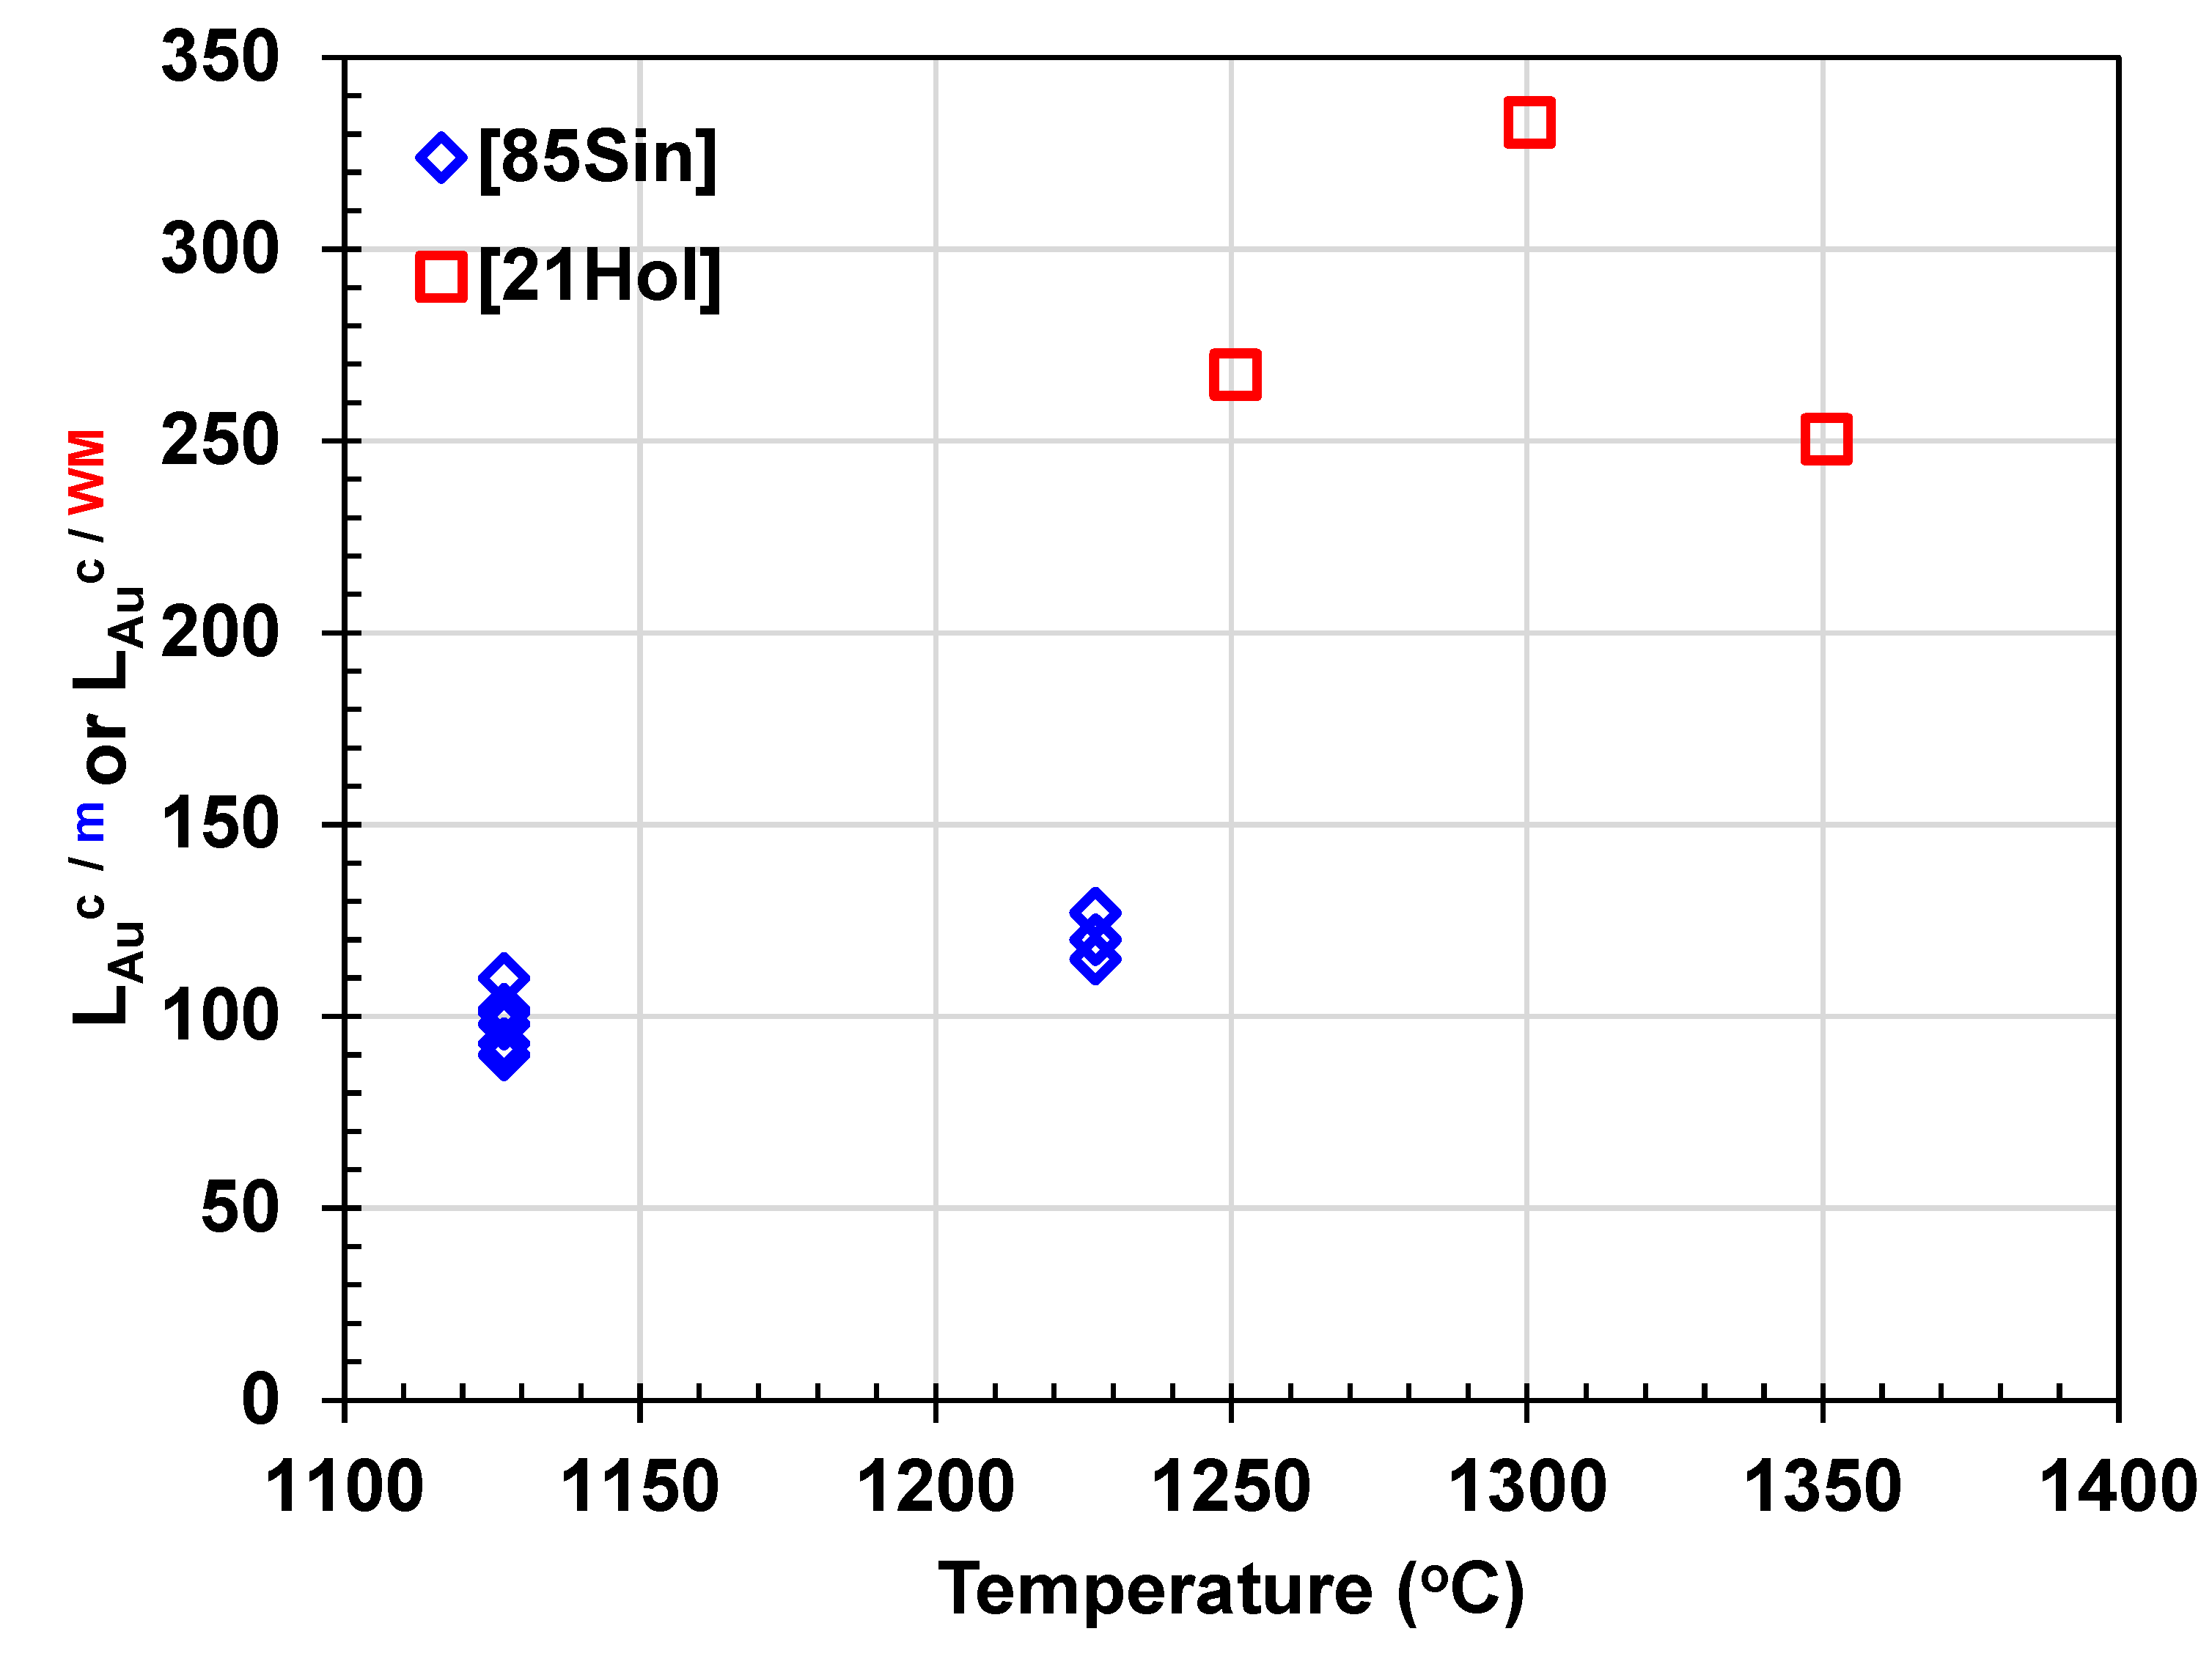
Sinha et al. [4] explored the distribution of Au between copper and matte in silica crucibles at temperatures of 1127 and 1227°C, utilizing atomic absorption spectroscopy (AAS). At 1127°C, the gold concentration in matte was measured at 32±6 ppm, while in metallic copper, it was 3182±535 ppm. At 1227°C, the Au concentration in matte was 28±3 ppm, and in copper, it was 3393±432 ppm. This results in an average Au partition coefficient between copper and matte ranging from 90 at 1127°C to 127 at 1227°C, showing an increase of over 200 ppm in Au concentration in copper with rising temperature.
Figure 10 depicts the Au partition coefficient between copper and matte and copper and WM ( L A u C / m or L A u C / W M ) as a function of temperature. These results indicate that Au preferentially dissolves in copper compared to matte and WM. During the converting process, Au becomes increasingly concentrated in copper, with its concentration rising by approximately 100-fold and 300-fold compared to that in matte and WM, respectively. The gold partition coefficient between copper and Fe-free matte was reported to range between 125 and 173 [26,27].

3.3. Physical Loss in Slag

As demonstrated above, gold closely follows the matte and copper phases during copper smelting and converting. Therefore, the gold loss can be indirectly determined from the copper physical loss in slag, the latter is a known phenomenon in the copper industry [41]. If matte or copper droplets that are entrained in the slag fail to settle completely through the slag layer during the process, it is considered a loss to slag. There are several reasons for matte or metal entrainment in slag [41,55], but only some are relevant to Au loss. For example, matte or metal precipitated from slag in colder areas of the smelting furnace [56] does not lead to Au loss, as Au does not dissolve in slag under common smelting and converting conditions, as mentioned in Section 3.2. Mechanisms contributing to Au physical loss include the following: when SO₂(g) bubbles exit the matte phase into the slag, a jet may form to fill the void, leading to matte entrainment in the slag; gas bubbles can carry matte to the slag as they rise; interfacial tension gradients, diffusion, and stranding mechanisms under mass transfer effects can result in the spreading and emulsification of matte [56,57,58]. SO₂(g) bubbles are generated via the reaction between matte and magnetite in the slag during smelting [41] and at the slag-forming stage in converting, as shown in Equations (3)–(5):
FeS(l) + 3Fe3O4(s) = 10FeO(s) + SO2(g)
FeS(l) + 1.5O2(g) = FeO(s) + SO2(g)
3FeS(l) + 5O2(g) = Fe3O4(s) + 3SO2(g)
Additionally, the intense agitation during the converting step can exacerbate copper physical loss compared to smelting. The converter slag returned to the smelting furnace also contains suspended matte droplets [59].
The physical loss of copper, which carries Au in slag, can be explained by the settling speed, v d r o p l e t , (m/s) of matte/metal droplets in the slag as predicted by Stoke’s law, which applies to laminar flow and rigid spheres. However, because large droplets are not rigid and the viscosity of matte/copper droplets is much lower than that of slag, internal tension is created. As a result, Stoke’s equation should be adjusted using the Hadamard-Rybczynski equation, given by Equation (6), as follows [41]:
v d r o p l e t = g · d d r o p l e t 2 · ρ ρ s l a g 3 · η s l a g
where g is the gravitational constant (9.81 m·s-2), ddroplet is the diameter of the metal droplet (m), ρ is the density of matte or copper (kg·m-3), ρ s l a g is the slag density, and η s l a g is the total viscosity of slag, accounting for both the liquid and solid fractions. As evident, increasing the settling speed of droplets in slag can reduce physical loss. v d r o p l e t is inversely related to the slag viscosity, while it is directly proportional to the square of matte/metal droplet size, and the difference between matte/metal and slag densities. Additionally, the interfacial tension between the matte/metal and slag, along with slag mass, affects the physical loss in slag [60]. The influence of these parameters on matte/metal physical loss in slag is detailed below.

3.3.1. Viscosity of Slag

Metal physical loss in slag can increase with rising slag viscosity, as suggested by Equation (6), due to a reduction in particle settling velocity. Slag viscosity is a crucial parameter because it can be adjusted in practice. Utigard and Warczok [61] developed a model to calculate slag viscosity as a function of composition and temperature, given by Equation (7):
log μ ( k g / m s ) = 0.49 5.1 V R +   3660 + 12,080 V R T ( K )
where VR is the viscosity ratio defined by Equations (8)–(10):
V R = A B
A = (%SiO2) + 1.5(%Cr2O3) + 1.2(%ZrO2) + 1.8(%Al2O3)
B = 1.2(%FeO) + 0.5(%Fe2O3+%PbO) + 0.8(%MgO) + 0.7(%CaO) + 2.3(%Na2O+%K2O) + 0.7(%Cu2O) + 1.6(%CaF2)
It is observed that temperature and composition significantly influence slag viscosity. However, the effect of the solid fraction on slag viscosity cannot be directly captured using the Utigard and Warczok equation (Equation (7)). Instead, the impact of the liquid and solid fractions of slag on its viscosity can be more accurately determined using the Einstein-Roscoe equation, Equation (11):
η s l a g = η o · 1 φ s , s l a g · α n
where η o is the viscosity of the liquid slag, φ s , s l a g is the volume fraction of solids in the slag, and α and n are empirical constants that depend on the size, distribution, and morphology of the solids in the slag. These parameters can vary with temperature, making slag viscosity a temperature-dependent property.

3.3.2. Solids in Slag

According to Equation (11), slag viscosity increases with the rising solid fraction, which depends on the slag’s composition and temperature. In addition to the solid fraction, the size and morphology of solid particles in slag also influence its viscosity. The parameters α and n in Equation (11) are defined as 0.8 and 2.5, respectively, for spheroidal and homogeneously distributed solids in slag. For irregularly shaped particles, such as polygonal Fe₃O₄ spinel in copper slag, these values may differ. Generally, large and irregular solid particles in slag can lead to increased metal loss by entraining metal/matte droplets. Among different particle shapes, rod-like, disc-like, and ellipsoidal particles result in the highest viscosity, respectively [62].

3.3.3. Density

According to Equation (6), a large difference between the densities of matte and slag enhances the travel speed of matte/metal droplets in slag, thereby reducing metal physical loss. The density of iron-silicate slags ( ρ s l a g ) ranges from 3.3 to 3.7 g/cm³. In contrast, the density of matte ( ρ m a t t e ) varies significantly with matte grade, from 3.9732 g/cm³ for pure FeS to 5.2744 g/cm³ for pure Cu₂S. A rough linear relationship for Cu₂S-FeS matte is described by Equation (12) [63]:
ρ C u 2 S F e S = 3.9732 + 1.3012 · X C u 2 S
An error of about 10% should be anticipated with this equation [63]. Consequently, higher matte grades have greater densities and settle more quickly. The effect of trace amounts of Au on matte density is likely negligible given the linear relationship between matte components and density. It has been reported that matte density changes by approximately 0.2 g/cm³ for every 100°C variation in temperature. Additionally, metallic copper droplets, having a higher density than matte, exhibit an increased settling rate during the converting process [64].

3.3.4. Other Parameters

Additionally, higher interfacial tension between matte/metal and slag enhances the separation of matte/metal from slag, thereby reducing physical loss. The interfacial tension between matte and slag has been reported to range from 0.02 to 0.2 N/m as the matte Cu grade increases from 0 to 70 wt% Cu2S [65]. The effect of temperature on interfacial tension has been reported to be negligible [63]. Therefore, producing higher matte grades is advantageous for reducing physical loss [60,65]. Copper/slag interfacial tension is expected to be higher than matte/slag tension, which facilitates easier copper-slag separation.
Reducing slag mass, while maintaining a constant settling speed of droplets, decreases physical loss. However, slag mass must be optimized to balance matte/metal and slag separation [60]. According to Equation (6), the settling speed of droplets ( v d r o p l e t ) is also a function of the square of droplet diameter. Increasing the size of matte/metal droplets reduces their residence time, thereby enhancing their settling rate. Matte particle sizes typically range from 10 to 20 microns or smaller. However, increasing settling time does not always translate to higher copper recovery. The attachment of copper-rich droplets to gas bubbles or spinel particles can hinder the separation of copper droplets from slag [66]. Therefore, minimizing the build-up of spinel at the matte-slag interaction layer is crucial for improving copper recovery [66]. Additionally, the formation of magnetite in Ca-ferrite slag is less likely than in Fe-silicate slag because CaO reduces the activity of Fe₂O₃ in the slag.

3.4. Loss in Electro-Refining

Compared to the few ppm of gold typically found in copper concentrate (ranging from 6-10 ppm), the Au concentration in the anode increases to 45±38 ppm. In the CAS, this concentration can increase significantly, up to 700-fold, from the anode to the CAS [30,67]. The composition of CAS can vary significantly [30,36,37,38,39,40,68,69], depending on factors such as the mineral raw materials, the composition of the copper anode, anode casting quality, and the technical conditions of the electrolyte [37]. Recovering gold from highly concentrated anode slime at the precious metal plant is a cost-effective and efficient process [21].
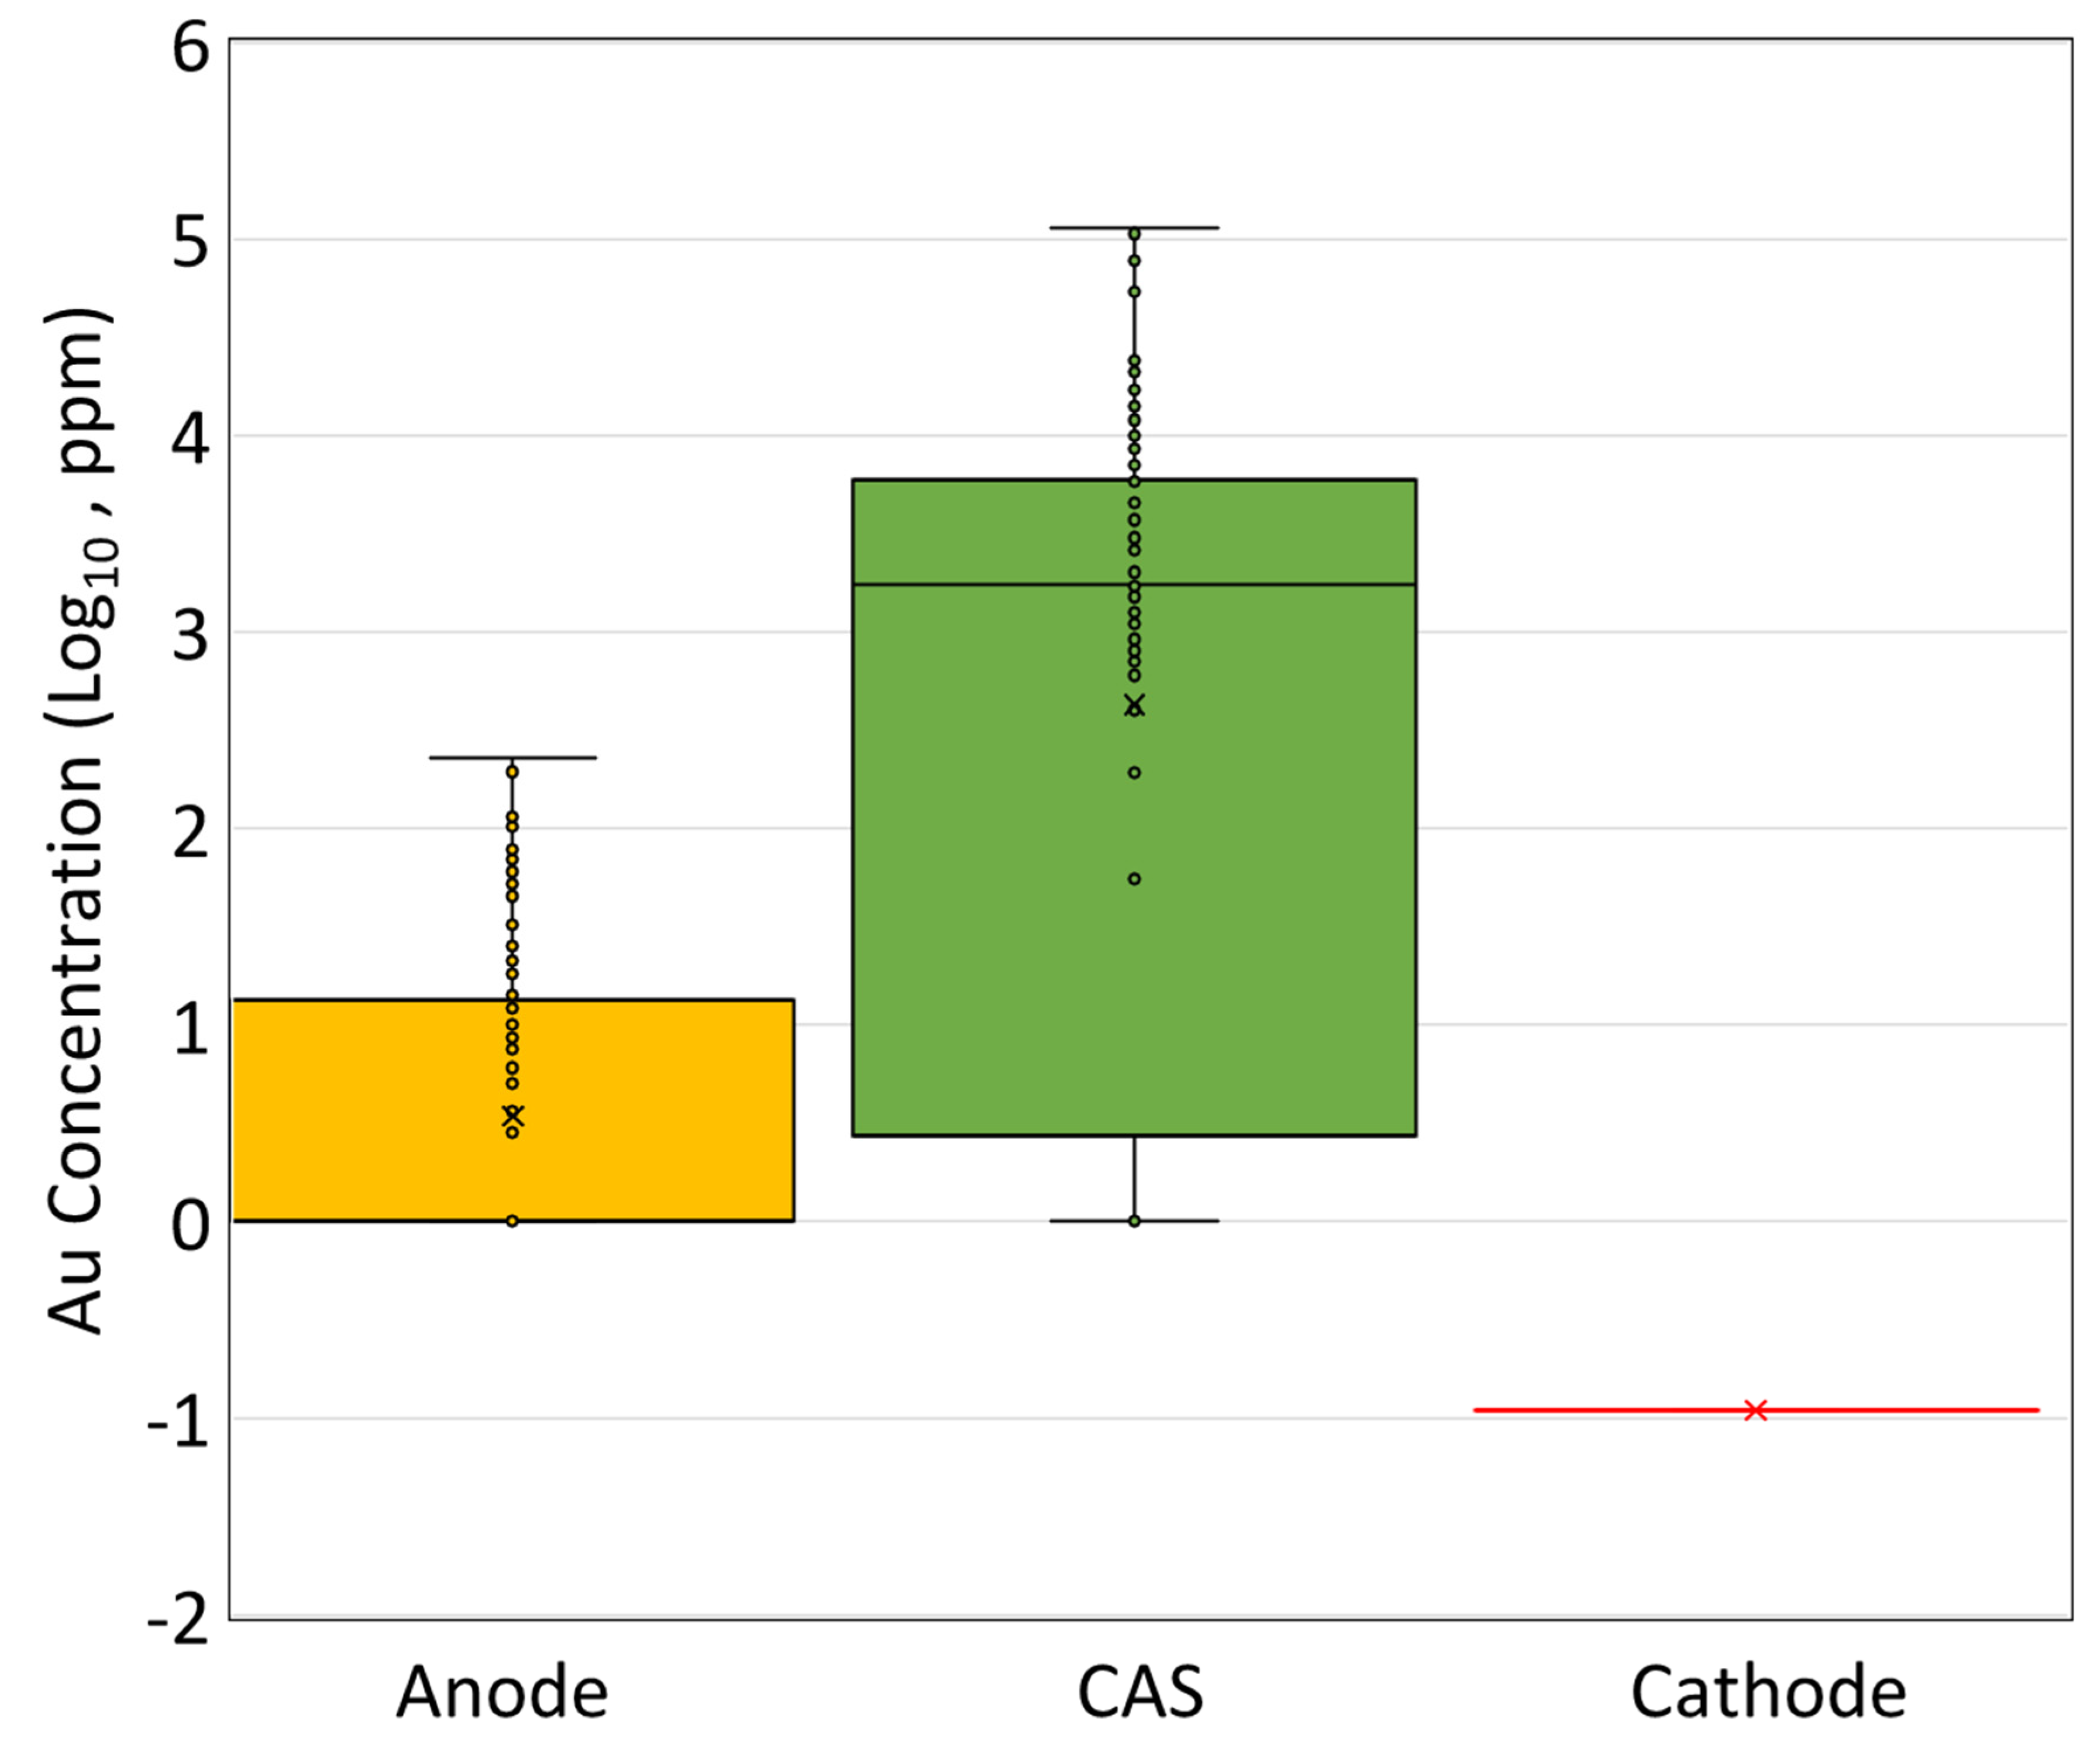
Tsukahara et al. [67] reported that only 0.11 ppm of Au was detected in the Cu cathode, yielding a distribution coefficient ( L A u C A S / C A ) of 24,545, which confirms that Au predominantly accumulates in the CAS (0.76 wt%) during electro-refining. In CAS, Au forms an insoluble product and is released as tiny particles (<1 micron) in metallic form, collected in the CAS at the bottom of the electrolysis cell [28]. Figure 11 compares the Au concentration in anode, CAS, and cathode in electro-refining.

4. Role of Copper Processing Technologies in Gold Recovery

As demonstrated, the Au chemical loss in slag during copper smelting and converting is minimal. Similarly, Au loss during the refining stages (anode refining and electrorefining) is negligible, with nearly 100% Au recovery expected from these unit operations. Therefore, the primary route for Au loss occurs through the physical loss of Cu matte or metal droplets in slag during smelting and converting.
The key parameters influencing Cu physical loss, and thus Au loss, include operational inputs (concentrate Cu content, gangue content, slag temperature, and slag residence time in furnace settling zone), the Cu concentration in matte, the density of copper/matte, and slag chemical and physical properties (Fe/SiO₂ ratio, density, and viscosity). Additionally, matte/slag interfacial tension plays a significant role [65]. Many of these factors are interdependent and vary with different operational conditions. Since these factors can change across various technologies, the degree of Cu physical loss—which serves as a carrier for Au—and, consequently, the Au recovery rate, is expected to vary accordingly. The following sections will introduce copper smelting and converting technologies and discuss the key parameters that could impact Au recovery.

4.1. Smelting Technologies

The smelting technologies can be broadly categorized into two main types: flash smelting and bath smelting. Modern smelting furnaces operate continuously and utilize advanced instrumentation and automation to optimize performance. Over the past forty years, several innovative smelting technologies have emerged, offering improved capabilities in SO₂ capture, impurity management, and EoL product recycling [41]. Contemporary smelters are adept at producing a range of by-products, including electricity, sulfuric acid, PMs, and PGMs [17,18,19,20,28,70].
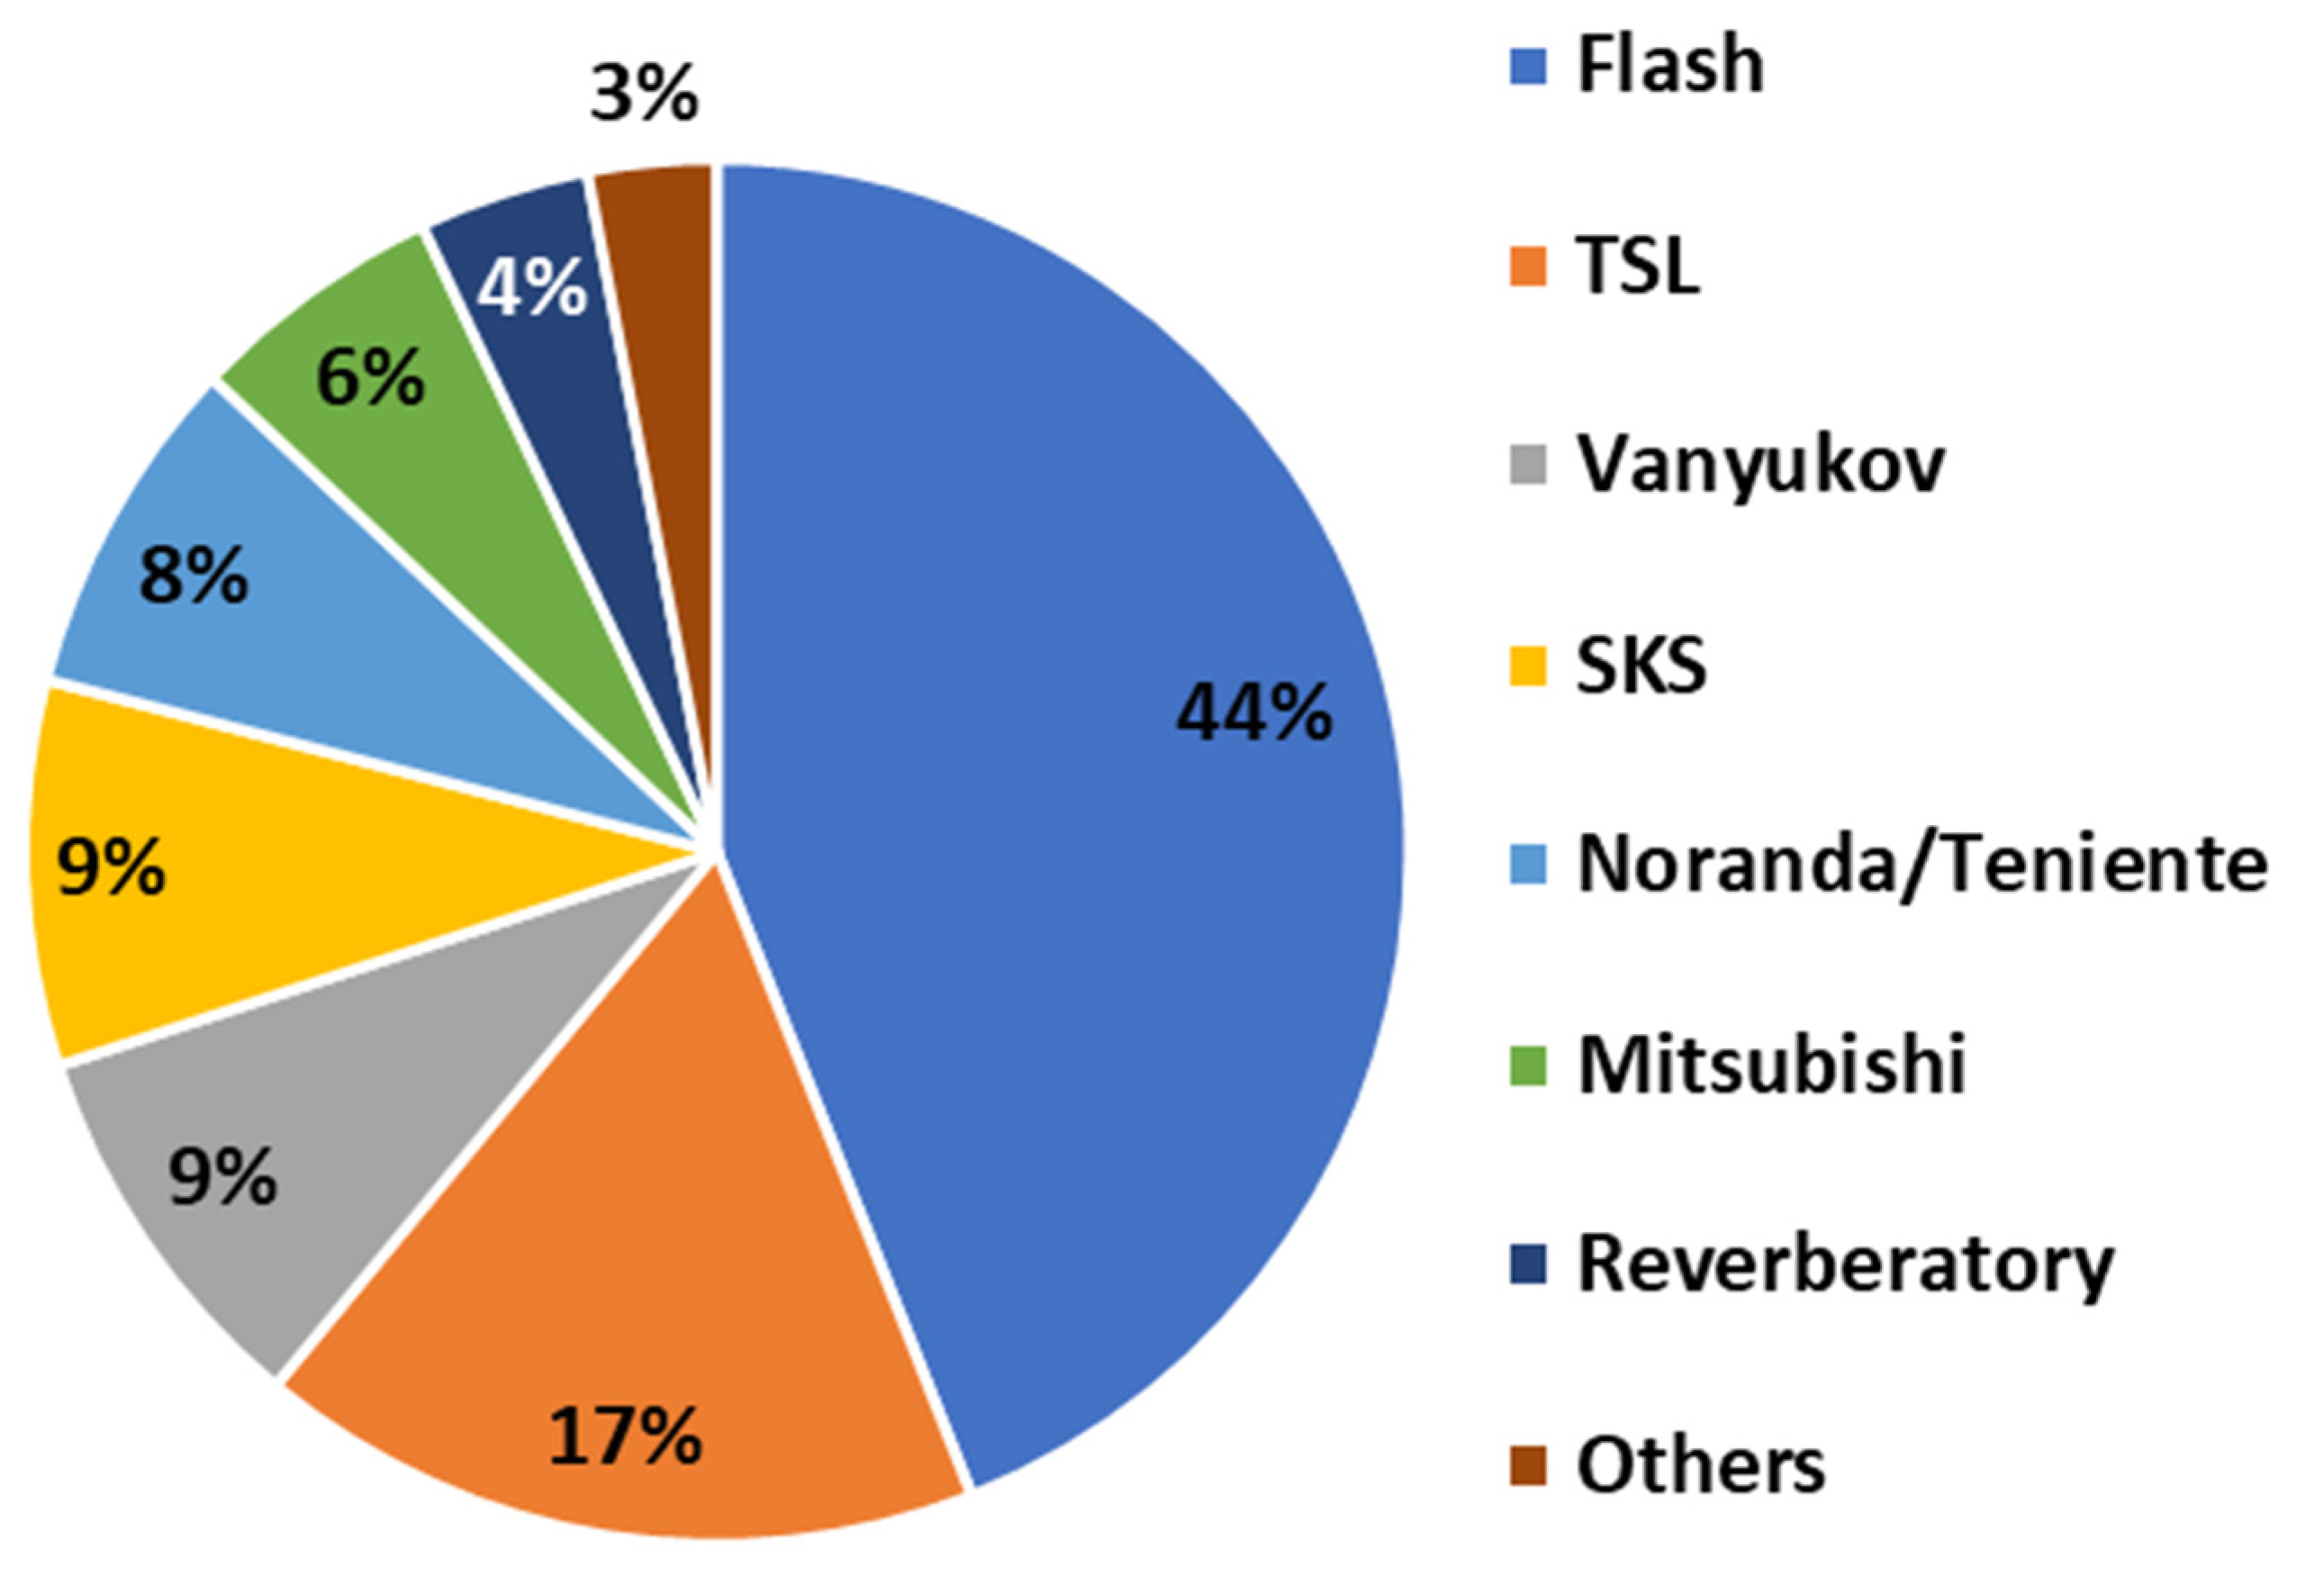
Mainstream modern smelting technologies include flash smelting (FS) (e.g., Outokumpu, Inco), top submerged lance smelting (TSL) (e.g., Isasmelt and Ausmelt), side-blowing smelting (SBS) (e.g., Noranda and Teniente furnaces), and bottom-blowing smelting (BBS) (e.g., Vanyukov furnace, Shuangyashan Kiln Stove – SKS). Figure 12 illustrates the different shares of these smelting technologies in global copper production.
Flash smelting technology is commercially offered by Outotec, a company based in Finland, occupying a dominant share of the world’s copper production (see Figure 12)[72]. Among various bath smelting technologies, TSL– Isasmelt holds a dominant market share [73]. Bath smelting technologies are commercially offered by different engineering companies such as ENFI, NERIN, and Glencore Technology. In the last two decades, 90% of the world’s increased copper production has been based on FS and TSL [12].
Major copper smelters such as Aurubis, JX Metals Smelting Saganoseki, Hibi Kyodo, Sumitomo, and Rio Tinto Kennecott, widely employ FS technology [37]. In contrast, BBS has recently gained a substantial market share in China. Both of these advanced smelting technologies increasingly utilize oxygen enrichment in gas injections, which significantly reduces fuel consumption and environmental emissions [74]. The higher oxygen levels released during the copper-making process generate more heat, enhancing the plant’s capacity to handle revert and inert materials. While oxygen enrichment raises both operational (OPEX) and capital expenditure (CAPEX) due to the costs associated with oxygen production, these are balanced by lower off-gas handling costs and increased plant productivity.
Flash smelting and bottom-blowing smelting each offer distinct competitive advantages. Flash smelting technology is known for its high furnace uptime, reduced external energy needs, increased productivity, and effective emission control—achieving high sulfur fixation and a small carbon footprint. On the other hand, BBS is recognized for its exceptional adaptability to various raw materials, effective impurity control, high oxygen utilization efficiency, thermal efficiency, and flexible production capacity. These features have made BBS increasingly attractive within the copper industry, especially in China [41].
Bottom-blown technology can be operated in various configurations, such as Dongying Phase I, which employs BBS + PSC + AF, BBS + BBC + AF, or BBS + BBC + BBAF, and Dongying Phase II, which utilizes BBS + BBCR (PSC, AF, BBAF, and BBCR represent Peirce Smith Converter, anode furnace, bottom blowing anode furnace, and bottom blowing converter and refining). Zhongyuan Gold uses BBS + FCF instead of PSC, aiming to maximize gold recovery. Currently, seven smelters in China operate the standard BBS technology, including Nonfemet Phase I (Dongying), Feishang Copper (FS), Humon Smelter, Shuikoushan (SKS), Yunnan Yimen, Zhongtiaoshan (ZTS), and Zhongyuan Gold (CG). Additionally, the double BBS + BBC technology is used by five smelters: Baotou Huading (BT), Nonfemet Phase II (Dongying), SDIC Jincheng, Qinghai Copper, and Henan Yuguang Gold and Lead. Globally, there are 18 commercial operations utilizing bottom-blown technology [71].

4.1.1. Metal Physical Loss

Table 1 lists reported key operational parameters for smelting furnaces that impact metal recovery, including copper, which also serves as a carrier for gold. The data were used for calculating the Au recovery from smelting technologies. These parameters include concentrate Cu concentration (wt%), generated slag mass (tons), slag SiO₂/Fe or CaO/Fe weight ratio, slag tapping temperature (oC), matte Cu grade (wt%), and generated matte mass (tons). The reported concentrate Cu grades for various furnace types vary. Mitsubishi, Teniente, and Noranda furnaces exhibit the highest grades, ranging from 31–34 wt%, 27-33 wt%, and 26–29 wt%, respectively. In flash furnaces, Cu grades vary between 23 and 29.2 wt%. Isasmelt furnaces have Cu grades ranging from 18 to 32 wt%, BBS furnaces from 18 to 25 wt%, Ausmelt furnaces from 14 to 26 wt%, and Vanyukov furnaces from 12 to 23 wt%. Consequently, after Mitsubishi, Teniente, and Noranda furnaces, FS processes higher-grade concentrates compared to SBS and BBS technologies.
The slag mass generated per ton of processed concentrate (t/t-conc) varies from 0.43–1.23 and 0.57–0.67 in FS and Mitsubishi furnaces, respectively, with JX metals smelting Saganoseki being an exception with a value of 1.23. Teniente and Noranda smelting furnaces generate a higher amount of slag/concentrate ratio, varying 0.70-0.71 and 0.67-0.78 (t/t-conc), respectively. For BBS, the slag to concentrate ratio was calculated to be 0.67 [75]. For Isasmelt, Ausmelt and Vanyukov.
Flash smelting furnaces operate with the lowest Fe/SiO₂ weight ratio, ranging from 0.88 to 1.56, with a recent average of 1.25 reported for Kennecott. For Mitsubishi furnaces, the ratio ranges from 1.11 to 1.25. Isasmelt and Ausmelt furnaces follow, with Fe/SiO₂ ratios of 1.18 to 1.54 and 1.25 to 1.43, respectively. The Fe/SiO₂ ratio for Noranda furnace is 1.43. Teniente and BBS furnaces exhibit the highest Fe/SiO₂ weight ratios from 1.49 to 1.92 and from 1.59 to 1.79, respectively [41,43,60,75,76,77,78].
The slag tapping temperature for Vanyukov furnaces ranges from 1250 to 1320 °C. Following closely, Rio Tinto Kennecott operates at the highest reported slag tapping temperature of 1315 °C. For other FS furnaces, this temperature ranges from 1240 to 1260 °C. Teniente and Noranda furnaces rank third and fourth, with temperatures of 1240 °C and 1220–1230 °C, respectively. Isasmelt and Ausmelt furnaces are fifth and sixth, operating at 1180–1190 °C and 1180 °C, respectively, although Zhong Tiao Shan operates at a relatively higher temperature of 1200–1300 °C. BBS furnaces have the lowest slag tapping temperatures, ranging from 1080 to 1210 °C.
The matte grade for Noranda and Teniente smelting furnaces has been reported at 72-75 wt% and 71-73 wt%, respectively. Vanyukov furnaces show a matte grade ranging from 45-74 wt%, while BBS furnaces range from 52-75 wt%, with recent operations achieving the highest range of matte grade. Flash furnaces report matte grades between 54-63.5 wt%, with Rio Tinto Kennecott reaching a high of 66.5-74.5 wt%. Isasmelt and Ausmelt furnaces operate with Cu matte grades of 52-65 wt% and 50-60 wt%, respectively [37,39,68,69,70,71,78].
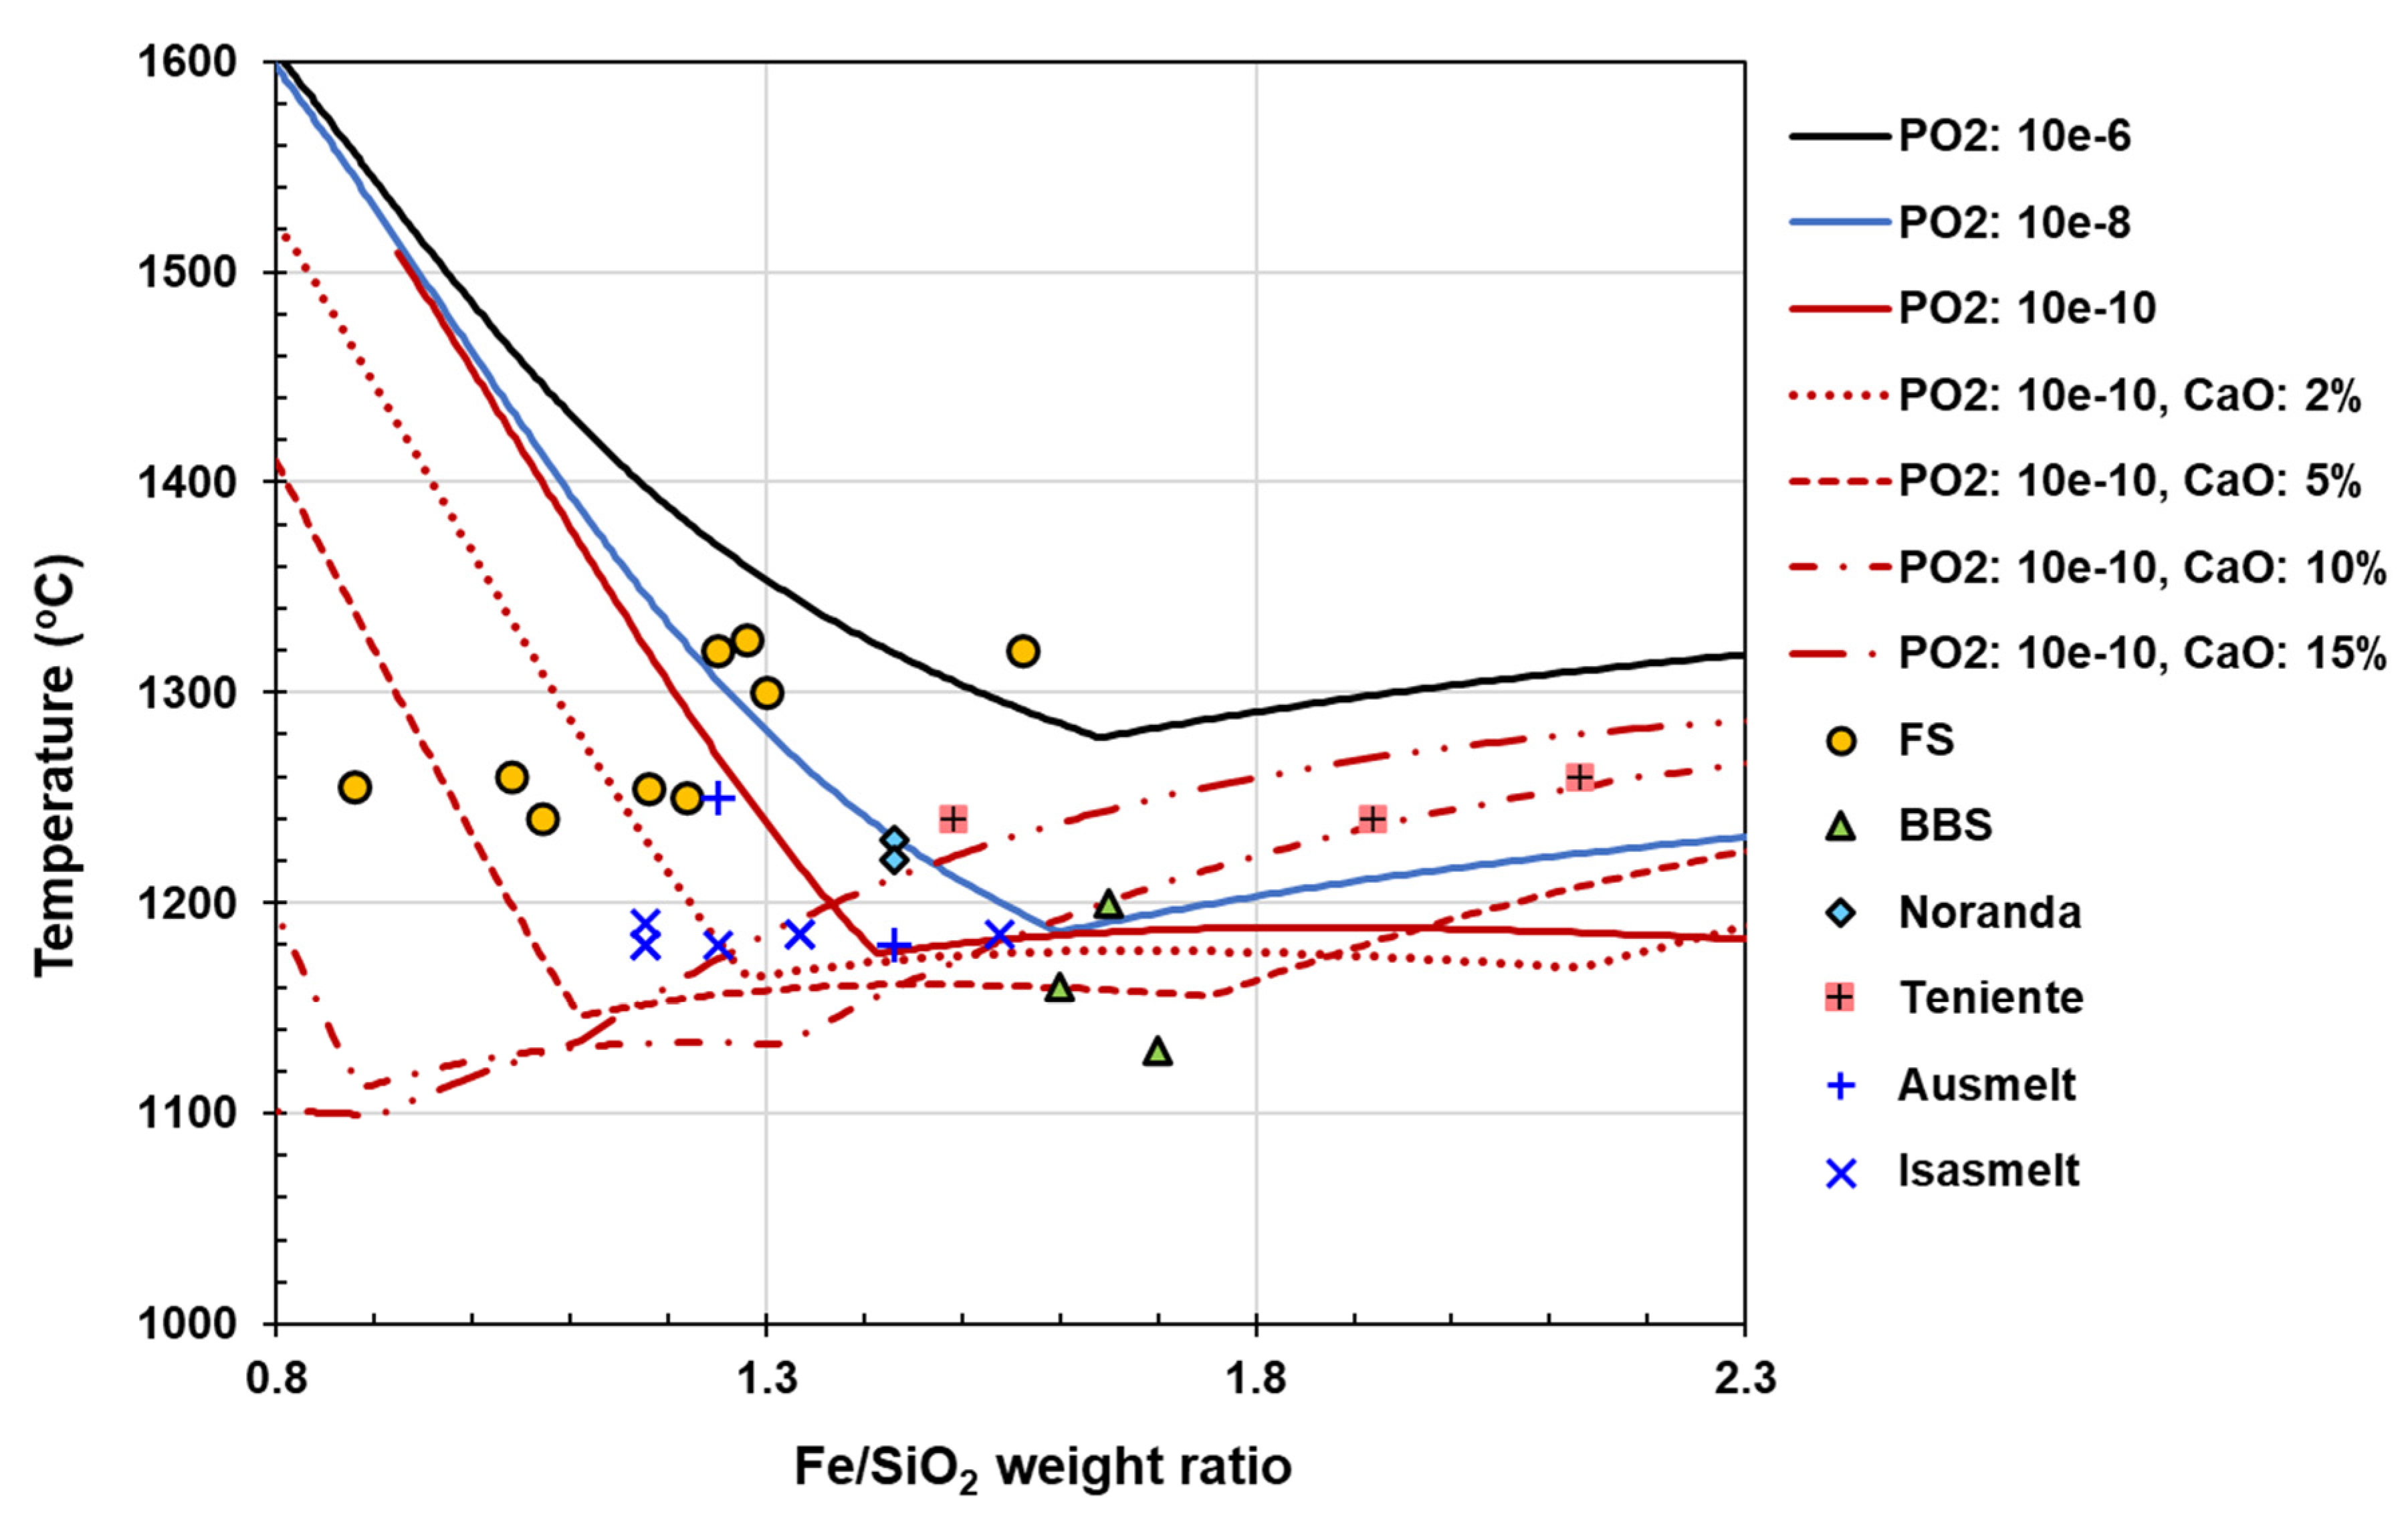
Figure 13 illustrates the relationship between slag liquidus temperature and the Fe/SiO₂ weight ratio in bulk slag, calculated for iron-silicate slags with varying CaO content under different P O 2 conditions using the FactSage 8.3 FToxid database. The figure also compares these calculated values with the slag tapping temperatures reported for various smelting operations. It is evident that BBS and TSL furnaces operate with the lowest slag tapping temperatures, averaging 1163°C and 1190°C, respectively. In contrast, FS furnaces operate at significantly higher temperatures, with an average of 1280°C [41,43,60,81].
(in atm) and CaO contents (in wt%) along with slag tapping temperatures of various smelting furnaces [41,43,48,60,80,81,85,88].
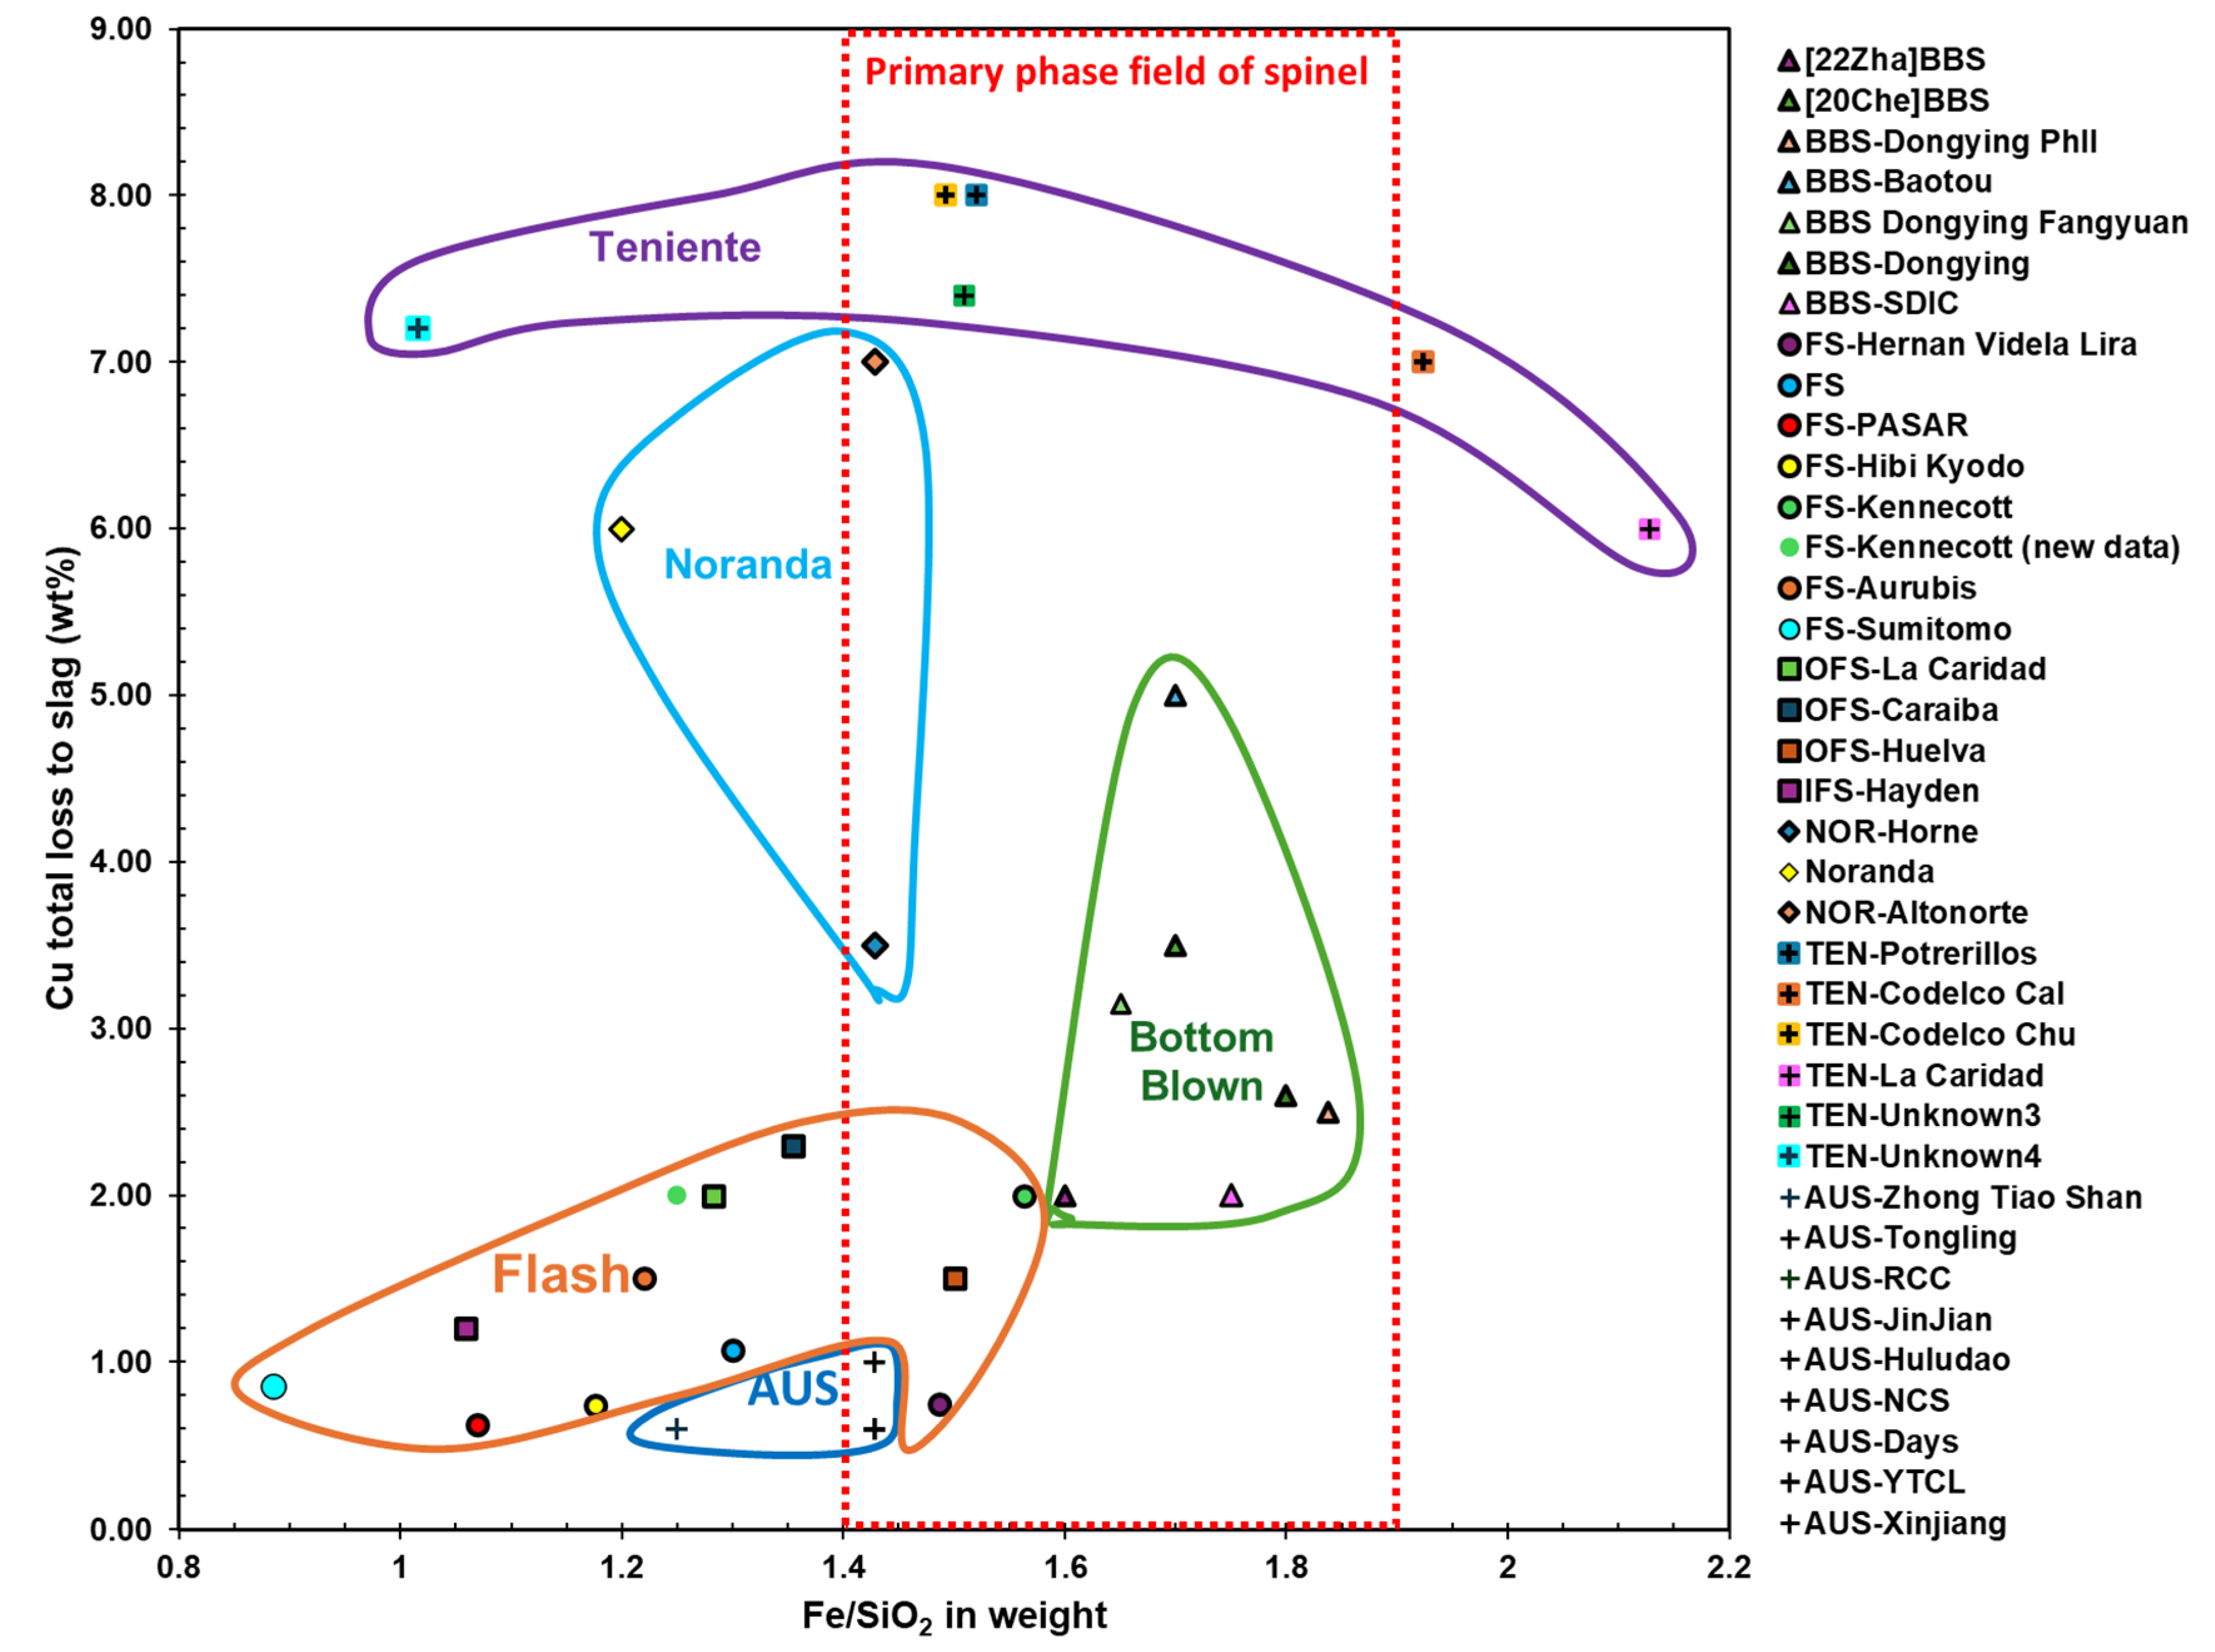
Figure 14 illustrates the total Cu loss to slag versus the Fe/SiO₂ weight ratio in bulk slag across various smelting technologies: FS (PASAR, Aurubis, JX Metals Smelting Saganoseki, Sumitomo Toyo, Hibi Kyodo, Rio Tinto Kennecott, Grupo Mexico La Caridad, Caraíba Metais, Huelva, Hayden, and Hernan Videla Lira), SBS, including Noranda smelting (Horne and Altonorte) and Teniente smelting (Codelco Caletones, Codelco Chuquicamata, and Potrerillos), Ausmelt furnaces (Zhong Tiao Shan, Tongling, JinJian, Huludao, Daye, YTCL, Xinjiang, RCC, and NCS), Isasmelt (Mount Isa), and BBS (Dongying Fangyuan, Yuguang Gold, SBF Heding, Chifeng, BYSBF Baiyin Nonferrous Group, and Baotou) [6,41,43,60,81,89,90,91,92,93,94,95,96]. The data indicates that the total Cu mass in slag is relatively low in FSF (0.63 – 3.23 wt%) compared to BBS (0.7 – 5.0 wt%), Noranda smelting (3.5 – 7 wt%), and Teniente smelting (6 – 8 wt%). Copper in slag from Ausmelt and Isasmelt furnaces as low as 0.6 – 1.0 wt% was reported after settling.
Comparing Figure 13 and Figure 14 indicate that a key factor influencing Cu loss in slag is the Fe/SiO₂ weight ratio in the bulk slag and slag temperature. Most FSF operations maintain an Fe/SiO₂ ratio below 1.4, with the exception of Hernan Videla Lira and Huelva, and operate at a higher range of temperature. TSL furnaces also operate at the lower end of the Fe/SiO₂ spectrum, with ratios of 1.24, 1.25, and 1.43. On the opposite end, BBS furnaces operate at a higher Fe/SiO₂ ratio, ranging from 1.64 to 1.80, and a lower end of temperature. For most SBS furnaces, the Fe/SiO₂ ratio varies more widely, between 1.02 and 2.13, with Noranda furnaces operating at the lower end of this range (1.2 and 1.43). This correlation suggests that lower Fe/SiO₂ ratios and higher slag temperature in FSF contribute to reduced Cu loss in slag, while higher Fe/SiO2 ratios and slag temperature, typical of BBS and certain SBS operations, are associated with increased Cu loss.
Operating significantly below the slag liquidus temperature in BBS and TSL furnaces, as shown in Figure 13, leads to an increased fraction of solids in the slag. This elevation in solid content raises the slag viscosity, as shown in Equation (11), consequently increasing metal physical loss, as depicted in Figure 14. In contrast, FS furnaces typically operate at higher temperatures, as also illustrated in Figure 13, often exceeding the slag liquidus temperature, which minimizes metal physical loss in the slag. It has been reported that FS slag contains no spinel crystals, whereas in BBS, spinel is stable in the slag, with large matte droplets becoming entrained between them [43].

4.2. Converting Technologies

Different copper matte converting technologies have been developed over the years, such as the Peirce-Smith converter (PSC), Hoboken converter, Outotec flash converter (FC), Noranda continuous converter, Mitsubishi top-blown converter, Ausmelt TSL, Isaconvert, and bottom-blown converting (BBC) [41]. The PSC, the oldest technology with over 100 years of use, is used for Cu-matte converting by most of the companies such as Pasar, Aurubis, Boliden, Codelco Caletones, Hibi Kyodo, Sumitomo, and JX metals smelting Saganoseki [37,41]. PSC main flaw is large SO2 emission, which was the driving force for developing the above-mentioned technologies [97]. Flash converting is used by Rio Tinto Kennecott and Teniente converters are largely operated in Chile [37]. Bottom-blown converting is the most recent one and is largely used in China.
Table 2 lists the reported key operational parameters impacting the metal physical loss for some of the converting furnaces, used for calculating the recovery of Au [60,75,89,98,99,100,101]. These parameters include input matte (ton), generated slag (ton), Cu loss in slag in the form of chemical and physical loss, Fe/SiO2 or CaO/Fe weight ratio in bulk slag, slag tapping temperature (oC), and produced blister Cu (ton). The generated mass of slag for 1 ton of matte treated is the smallest for BBC (0.14 calculated by Shishin et al. [75]), PSC (in average 0.28), and Rio Tinto FC (0.33). Among PSCs, Boliden followed by Hibi Kyodo operates with rather a high slag/matte ratio (0.44 and 0.32, respectively). Due to the lack of information, the slag/matte ratio cannot be calculated for the other technologies including Noranda, Mitsubishi, and Teniente.
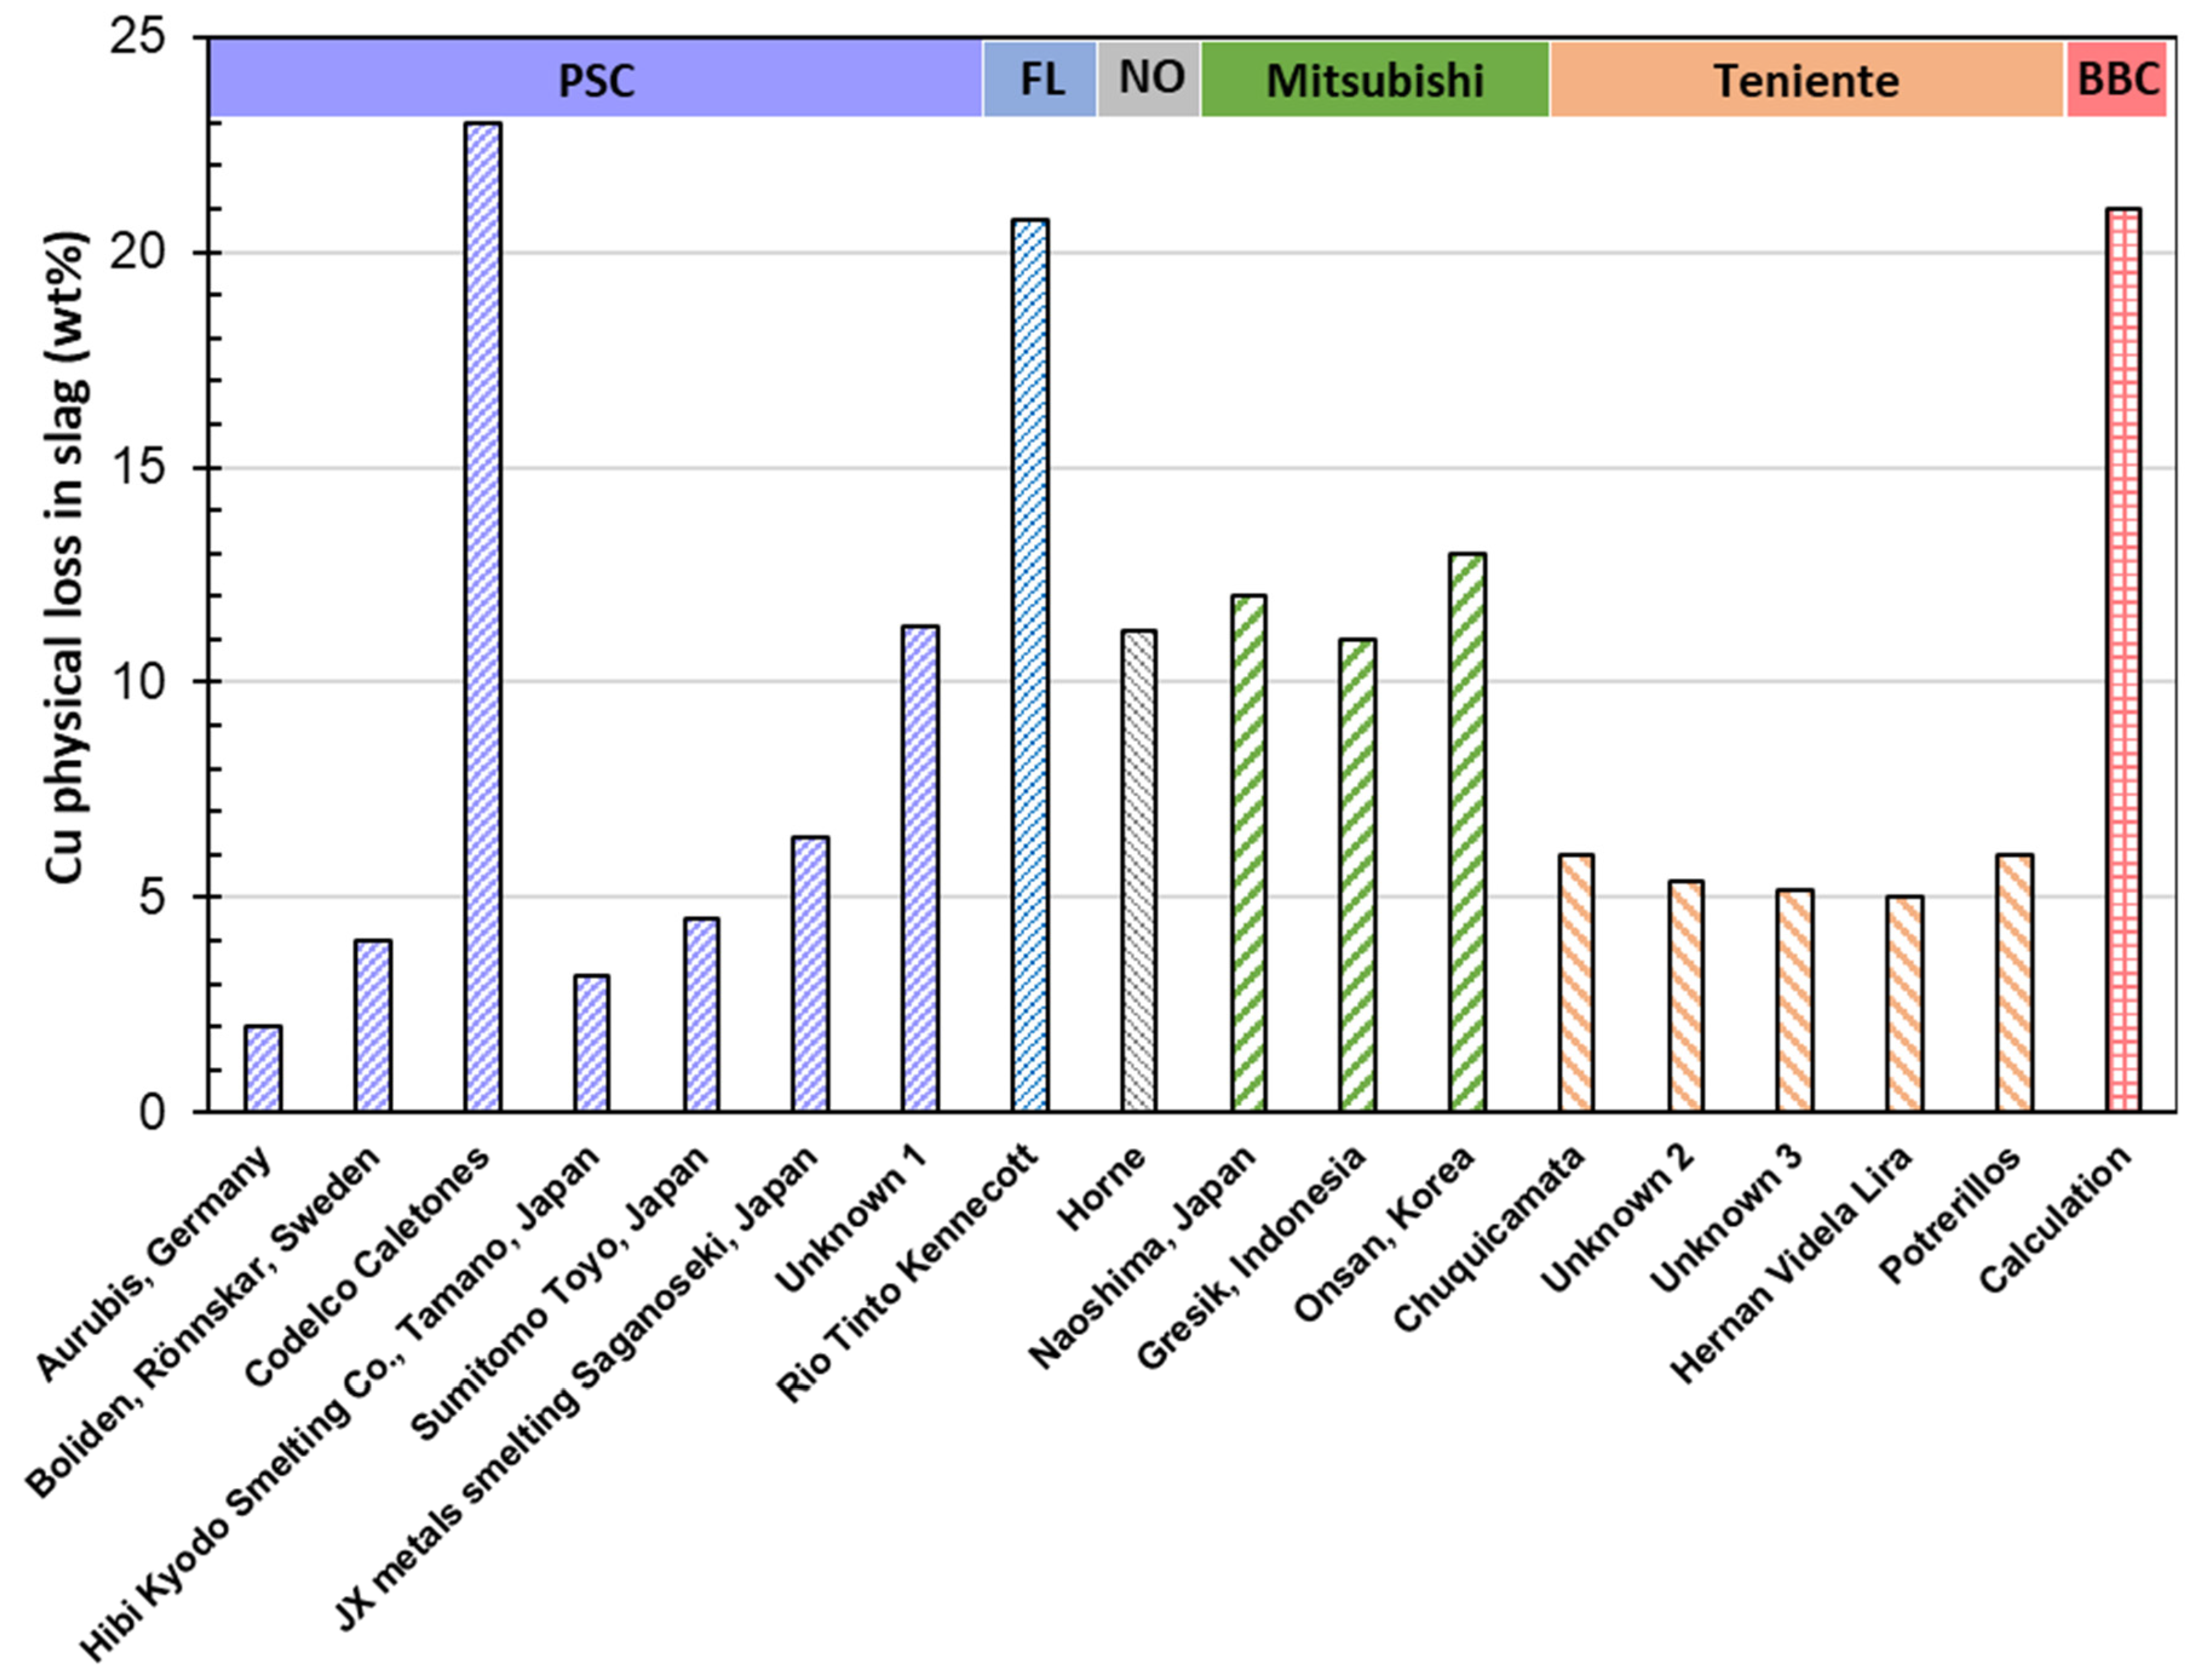
Figure 15 illustrates the Cu physically lost in slag (in wt%) for several converting technologies: PSCs including Aurubis (Hamburg, Germany), Boliden (Sweden), Codelco Caletones (Chile), Hibi Kyodo Smelting Co. (Tamano, Japan), Sumitomo Toyo (Japan), and JX metals smelting Saganoseki (Japan), FC from Rio Tinto Kennecott, Noranda Horne (Canada), Mitsubishi (Naoshima,Japan, Gresik, Indonesia, and Onsan, South Korea), Teniente (Chuquicamata, Hernan Videla Lira, and Potrellos, Chile), and BBC (calculated). The physical loss Cu content of slag was calculated by subtracting the mass of Cu chemically dissolved in the slag from the total Cu mass reported in the slag. An average mass of chemically dissolved Cu in the slag was selected as 2 wt% for the matte converting conditions based on the data reported by Shishin et al. [102].
As shown in Figure 15, the Codelco PSC exhibits the highest physical copper loss in slag at 23 wt%, followed by the BBC at 21 wt%, Rio Tinto Kennecott at an average of 19.5 wt%, and the Mitsubishi converter at an average of 12 wt%. For most PSCs, the physical copper loss in slag remains relatively low, staying below 7 wt%. The Fe/SiO2 ratio in PSC generally correlates with copper loss; as the Fe/SiO2 weight ratio increases above 2, copper loss tends to rise. In general, the increase in Fe content in slag promotes the formation of large magnetite spinel particles, raising slag viscosity (refer to Equation (11) and enhancing copper loss (see Equation (6)), which also affects gold recovery. However, the data presents some inconsistencies, such as Boliden, with a lower Fe/SiO2 weight ratio of 1.33, exhibiting double the copper loss compared to Aurubis, which operates at a higher ratio of 1.88. This suggests that factors beyond Fe/SiO2 ratio contribute to metal loss. Although Teniente and BBC converters operate with relatively low Fe/SiO2 ratios, they still experience high metal losses, indicating the involvement of other influential parameters that require further investigation. Additionally, FC and Mitsubishi processes operate with calcium ferrite slags. According to Yazawa et al. [103], calcium ferrite slags are favored over iron silicate slags due to their lower flux requirements and reduced copper loss to slag. Davenport [60] further noted that the high activity coefficient of Cu2O in calcium ferrite slags decreases Cu2O solubility, leading to lower chemical copper losses. However, despite these advantages, the copper loss in the FC of Rio Tinto and Mitsubishi is still higher compared to PSC technologies, suggesting that copper is primarily lost through physical entrainment in the slag rather than through chemical dissolution.

4.3. First Pass Gold Recovery

The slag is treated for recovery of copper, which is a carrier of gold via 1) pyrometallurgical routes, 2) hydrometallurgical routes, 3) flotation, 4) sorting, or 5) hybrid processes. According to 2004 data, 37% of smelters used electric furnaces, 26% flotation, 6% no treatment, and 5% other techniques, and there is no information for the rest of 26% of smelters [104]. A largely used method is the recycling of the smelting slag in the slag mill concentrate, and converting slag and dust streams into the smelting furnaces, especially the ones with a calm settling zone like flash furnace [105,106]. While internal recirculation of slag/dust or additional processing to recover Cu can reduce Au losses, it increases production lead time without improving the overall recovery rate from smelting and converting operations. Based on smelter visits, it is estimated that overall gold recoveries at the Chinese smelter after slag cleaning are between 97.5 and 99% [78]. However, it is crucial to consider first-pass recovery as a key metric for comparing the effectiveness of different technologies in recovering Au from Cu sulfide concentrate to final products. The importance of first-pass recovery becomes particularly significant in the context of fluctuating Au prices in the market. As Au prices rise, the economic value of even small quantities of recoverable Au increases, making efficient recovery crucial for maximizing profitability. If a process requires extended lead times or multiple recirculation steps, it can delay the realization of revenue from Au sales, which is especially detrimental when market prices are high. Additionally, inefficiencies in first-pass recovery may result in more Au being tied up in slag, representing a lost opportunity when prices peak. Therefore, optimizing first-pass recovery not only enhances the immediate financial return but also ensures that operations are more responsive to market dynamics, allowing companies to capitalize on favorable Au prices without unnecessary delays.
As previously mentioned, there are potentially two streams for Au loss during smelting and converting: physical loss of matte and copper entrained in slag, and loss through dust. We assumed that Au loss occurs solely through the physical loss of matte and copper in slag, with no consideration of Au loss in dust. This assumption seems reasonable, as the high density of matte and copper, which act as carriers of Au, reduces the likelihood of losing Au-containing alloys to dust. Moreover, available data on this topic appears inconsistent and insufficient. For instance, Chen et al. [43] characterized flue dust from both BBS and FS processes, reporting annual dust generation of 5-6% in FS compared to 2-3% in BBS. The FS process, using a dry, fine feed, results in a higher dust entrainment rate than the humid feed used in BBS. The chemical composition of FS flue dust primarily consisted of Fe₃O₄ and CuSO₄ crystals, along with some amorphous phases like Cu-Zn-FeOx. Conversely, BBS flue dust was characterized by crystalline phases such as PbSO₄, Fe₃O₄, and CuFe₅O₈, with some amorphous Cu-Zn-S phases. However, Davenport et al. [107] reported that Outotec FS dust contains 3% of Au in addition to oxides like Cu₂O and Fe₃O₄. These findings highlight the need for further investigation and characterization of dust to assess Au concentration in future studies. Additionally, it is important to note that Au loss to dust via evaporation is unlikely, as suggested by the work of Avarmaa et al. [5].
The first pass Au recovery for smelting was calculated using Equations (13)–(17) based on the data provided in Table 1 as follows:
A u i n p u t g = A u C o n c e n t r a t e p p m · C o n c e n t r a t e   m a s s   ( t )
C u P h y s i c a l   l o s s t o n = C u S l a g   w t % · S l a g   m a s s   ( t ) 100
A u m a t t e ( p p m ) = A u i n p u t   ( g ) M a t t e   m a s s   ( t )
A u S l a g g = C u P h y s i c a l   l o s s t o n · A u m a t t e ( p p m )
G o l d   r e c o v e r y   r a t e   % = 100 A u S l a g A u i n p u t · 100
Similarly, the first-pass Au recovery from converting was calculated using the data reported in Table 2. Primarily, operational plant data was used for calculating Au recovery rates, except for BBS/BBC technology, where calculated data from Shishin et al. [75] were considered due to the lack of sufficient data reported in the literature. For BBS, the physical Cu loss was determined by subtracting the chemical loss of Cu from the total Cu loss, which was averaged from all reported plant data in the literature. The dissolution of Cu as oxide and sulfide was calculated based on the Fe/SiO2 ratio in slag, as per the work of Furuta et al. [87]. It has been reported that the physical loss of matte in slag is the major contributor to Cu loss at low matte grades (<70 wt%). However, at high matte grades (>70 wt% Cu), significant Cu losses are attributed to chemical loss [45,46,47,60,108]. This trend, observed in the data from Furuta et al., was considered in the calculation. Additionally, it was assumed that the composition of matte and copper entrained in the smelting and converting slags is the same as the matte/copper collected at the bottom of the furnace. Liao et al. [109] reported that the matte grade entrapped in slag is consistent with that settled at the bottom of the FS furnace and collected at the tap hole.
Figure 16 shows the Au first pass recovery calculated in this work for several smelting and converting technologies based on data provided in Table 1 and Table 2.
Among the various smelting technologies, the Mitsubishi process achieves the highest first-pass Au recovery at 99.8%, followed closely by FS (97.9–99.9%), BBS (95.3%), Teniente furnaces (89–97.1%), and Noranda furnaces (88.6–95.1%). Steinhauser et al. [110] estimated that in FS, 99% of the Au is recovered in the matte, with only 1% lost to slag, though dust was not considered in their analysis. Davenport et al. [107], however, reported a 95% Au recovery in matte from flash smelting, with 2-3% lost to slag and dust. Our calculations, based on various sources without considering possible Au loss to dust, align with Steinhauser’s findings.
Among converting technologies, PSCs offer the highest Au recovery rates (95.2–99.5%), followed by Mitsubishi converters (94.3–99.8%), BBC (95.8%), FC (95.5%), and Noranda converters (94.8%). Integrated smelting-converting routes reveal that the FS-PSC route achieves the highest gold recovery (98.8–99.5%), followed by Mitsubishi-Mitsubishi (94.3–99.8%), BBS-BBC (95.8%), FS-FC (95.5%), Teniente-PSC (95.2%), and Noranda-Noranda (94.8%). The higher Au recoveries are also attributed to superior metallurgical practices and advanced control systems, which can vary even among companies using similar technologies.
Mitsubishi and flash smelting demonstrate better metal recoveries compared to other technologies like BBS and SBS. Mitsubishi smelting treats high-grade concentrates (31.7–34 wt% Cu), produces a low slag amount per ton of concentrate (0.57–0.67), operates with a low Fe/SiO2 ratio (1.11–1.25), maintains a high slag tapping temperature (1300–1450 °C), and achieves a medium matte grade (~68 wt% Cu). The Cu physical loss to slag is minimal (<1 wt%) due to the presence of three furnaces, including a settling furnace between the smelting and converting stages. These conditions favor a high gold recovery rate, although the Mitsubishi process is considered somewhat outdated in modern copper smelting [60].
Flash furnaces feature low Fe/SiO2 ratio, relatively high slag tapping temperatures (1240–1320 °C), moderate matte grades (~63 wt% Cu), effective copper-slag separation, low Cu loss (0.63–4 wt%), and high gold recovery. In contrast, BBS processes lower-grade concentrates, operates with a high Fe/SiO2 ratio, and at lower slag tapping temperatures (1080–1210 °C), which can be up to 100 °C below the slag temperature in FS. This leads to a two-phase region slag (liquid+spinel) with higher viscosity, negatively impacting the metal recovery rate.

5. Conclusions

Gold recovery as a by-product of copper smelting significantly increases the economic value of the custom operation. This is due to the minimal extra effort required to extract gold from copper concentrates and the high payable rates for gold content. Copper smelters typically provide a payable rate of around 90-92% for gold content, with gold being recoverable from concentrates with as little as 1 g/t gold. Over 85% of traded copper concentrates have a minimum gold content of 1 g/t. This work conducted an extensive evaluation of the efficacy of different copper smelting and converting technologies with a focus on gold recovery with the aim to estimate the gold first-pass recovery rate. Main highlights of the work and some perspectives are provided below.
  • This study confirms that the chemical dissolution of gold in slag is negligible, with gold primarily remaining associated with copper throughout the smelting, converting, and anode refining processes:
    • The gold partition coefficient between matte and slag ( L A u m a t t e / s l a g ) ranges from 100 to over 2000, indicating that the majority of gold is concentrated in the matte phase.
    • The gold partition coefficient between copper and slag ( L A u c o p p e r / s l a g ) ranges from 104 to 106, signifying that gold predominantly reports to blister copper.
    • The mass of slag in anode refining is minimal, and gold nearly completely reports to the anode.
  • Gold loss primarily occurs through the physical loss of matte or copper in slag:
    • Lower slag viscosity (achieved by higher temperatures above slag liquidus temperature and rather low Fe/SiO₂ ratios) reduces physical loss.
      • Higher matte grades increase the density difference between slag and matte and raise slag/matte interfacial tension, improving separation and reducing physical loss.
      • Reducing slag mass for a constant droplet settling speed decreases physical loss, though slag mass should be optimized to enhance matte/metal and slag separation.
  • The choice of technology significantly impacts gold physical loss, which is primarily carried by copper:
    • Among smelting technologies, the Mitsubishi process achieves the highest first-pass gold recovery (99.7–99.8%), followed by flash smelting (98.3–99.9%), bottom-blown smelting (96%), Noranda furnaces (~95%), and Teniente furnaces (85.6–89%).
    • Among converting technologies, the Peirce Smith Converter offers the highest gold recovery (95.2–99.3%), followed by the Mitsubishi converter (92.4–99.8%), bottom-blown converter (95.8%), Noranda furnace (93.4%), and flash converter (88.1%).
    • Integrated routes show that flash smelting combined with Peirce Smith Converter provides the highest gold recovery (98.3–99.5%), followed by Mitsubishi-Mitsubishi (92.8–99.8%), bottom-blown smelting with bottom-blown converting (95.8%), Teniente with Peirce Smith Converter (95.2%), Noranda-Noranda (93.4%), and flash smelting with flash converting (88.1%).
  • During electro-refining, gold is found in the anode slime with << 1 ppm reported in the cathode, suggesting near 100% gold recovery during this stage.
Future work should focus on investigating and characterizing dust to evaluate gold concentration and possible loss more accurately. Additionally, there is a need to address the gap in operational plant data related to the gold recovery rate, particularly for BBS/BBC technology, and verify data from calculations.

Author Contributions

Conceptualization, investigation, data collection and analysis, and representation, E.M.-K.; Resources, E.M.-K. and N.T.; Writing—Original Draft Preparation: E.M.-K. and N.T.; Writing—Review & Editing, E.M.-K. and N.T.; Visualization, E.M.-K. and N.T.; Supervision, E.M.-K. and N.T.; Project Administration, E.M.-K. and N.T. All authors have read and agreed to the published version of the manuscript.

Funding

The authors would like to thank Rio Tinto Singapore for its generous financial support, without which this project would not have been possible.

Institutional Review Board Statement

Not applicable.

Informed Consent Statement

Not applicable.

Data Availability Statement

Not applicable to this work.

Conflicts of Interest

On behalf of all authors, the corresponding author states that there is no conflict of interest.

References

  1. Available from: https://www.fastmarkets.com/insights/copper-concentrate-tcs-still-negative-how-and-what-does-it-mean-for-copper-prices/.
  2. https://www.ausimm.com/bulletin/bulletin-articles/gold-concentrate-marketing-101/.
  3. www.gold.org/about-gold, World Gold Council. 2021.
  4. Sinha, S.N., H.Y. Sohn, and M. Nagamori, Distribution of Gold and Silver between Copper and Matte. Metallurgical Transactions B, 1985. 16(1): p. 53-59. [CrossRef]
  5. Avarmaa, K., et al., Equilibrium Distribution of Precious Metals Between Slag and Copper Matte at 1250–1350 °C. Journal of Sustainable Metallurgy, 2015. 1. [CrossRef]
  6. Avarmaa, K., H. Johto, and P. Taskinen, Distribution of Precious Metals (Ag, Au, Pd, Pt, and Rh) Between Copper Matte and Iron Silicate Slag. Metallurgical and Materials Transactions B, 2016. 47(1): p. 244-255. [CrossRef]
  7. Sukhomlinov, D., et al., Distribution of Ni, Co, Precious, and Platinum Group Metals in Copper Making Process. Metallurgical and Materials Transactions B, 2019. 50(4): p. 1752-1765. [CrossRef]
  8. Chen, Y., et al., Characterization of Copper Smelting Flue Dusts from a Bottom-Blowing Bath Smelting Furnace and a Flash Smelting Furnace. Metallurgical and Materials Transactions B, 2020. 51(6): p. 2596-2608. [CrossRef]
  9. Reuter, M. and I. Kojo, Copper: A Key Enabler of Resource Efficiency. World of Metallurgy - ERZMETALL, 2014. 67: p. 46.
  10. World Copper Factbook 2023.
  11. Tripathi, N. and S. Mostaghel. A Review on Integrating E-Waste Recycling in Flash and Bath Copper Smelting Operations. in Proceedings of the 62nd Conference of Metallurgists, COM 2023. 2023. Cham: Springer Nature Switzerland.
  12. Copper 101 – Module – Concentrates & By-Products.
  13. https://www.reuters.com/markets/commodities/chinas-top-copper-smelters-agree-production-cut-amid-raw-material-tightness-2024-03-13/.
  14. https://sayari.com/, Global Trade Atlas.
  15. https://www.spglobal.com/commodityinsights/en/market-insights/latest-news/metals/111623-china-copper-smelters-miners-split-over-finalizing-tcrcs-for-2024.
  16. https://www.miningweekly.com/article/freeport-settles-six-year-high-copper-charges-for-2023-with-chinese-smelters---source-2022-11-25.
  17. Kaur, R., et al., KENNECOTT-OUTOTEC ‘DOUBLE FLASH’ TECHNOLOGY AFTER 16 YEARS. 2011.
  18. Becker, E., Modernisation of precious metals refining at Norddeutsche Affinerie AG. 2006. 59: p. 87-94.
  19. Hait, J., R. Jana, and S. Sanyal, Processing of copper electrorefining anode slime: a review. Mineral Processing and Extractive Metallurgy, 2009. 118(4): p. 240-252. [CrossRef]
  20. Furuzono, T., et al. Unique hydrometallurgical process for copper-anode slime treatment at saganoseki smelter and refinery. in Extraction 2018: Proceedings of the First Global Conference on Extractive Metallurgy. 2018. Springer.
  21. Barr, G., et al., The new CESL gold process. ALTA, Perth, WA, Australia, 2007.
  22. Zeng, Y., et al., Occurrence Behaviors of As/Sb/Bi in Copper Anode Slime and Their Separation by Compound Leaching Followed by Stepwise Precipitation. ACS Omega, 2023. 8(11): p. 10022-10029. [CrossRef]
  23. Sluzhenkin, S.F., Mikhov, A.B.,, Gold and silver mineralogy in the orebodies of Norilsk mining camp. Geology, Genesis anf Mining Developments of Precious Metals Orebodies, 2003: p. 326-330.
  24. Pannell, D., A survey of world copper smelters. World Survey of Nonferrous Smelters, 1988: p. 3-118.
  25. Lehner, T., et al., The 1993 survey of worldwide copper and nickel converter practices. Converting, fire refining and casting, 1994: p. 1-58.
  26. Schlitt, W. and K. Richards, The distribution of silver, gold, platinum and palladium in metal-matte systems. Metallurgical Transactions B, 1975. 6: p. 237-243. [CrossRef]
  27. Asano, N., Distribution of Gold, Silver and Selenium between Liquid Copper and Cuprous Sulfide. J. Min. Mater. Proc. Inst. Japan, 1971. 87: p. 347-352. [CrossRef]
  28. Ferron, C., Recovery of gold as by-product from the base-metals industries, in Gold Ore Processing. 2016, Elsevier. p. 831-856.
  29. Johnson, R., N. Themelis, and G. Eltringham, A survey of worldwide copper converter practices. Copper and Nickel Converters, 1979: p. 1-32.
  30. Moats, M., et al., Electrolytic copper refining - 2007 world tankhouse operating data. Copper - Cobre 2007 International Conference, 2007. 5: p. 195-241.
  31. Larouche, P., MINOR ELEMENTS IN COPPER. 2001, Faculty of Graduate Studies and Research in Partial Fulfillment of the ….
  32. Forsén, O., J. Aromaa, and M. Lundström, Primary copper smelter and refinery as a recycling plant—a system integrated approach to estimate secondary raw material tolerance. Recycling, 2017. 2(4): p. 19. [CrossRef]
  33. Wang, K., et al., A novel slag cleaning method to recover copper from molten copper converter slag. Transactions of Nonferrous Metals Society of China, 2023. 33(8): p. 2511-2522. [CrossRef]
  34. Nakajima, K., et al., Thermodynamic Analysis for the Controllability of Elements in the Recycling Process of Metals. Environmental Science & Technology, 2011. 45(11): p. 4929-4936. [CrossRef]
  35. Dosmukhamedov, N., et al., Converting of copper-lead matte: loss of gold and silver with slag. Kompleksnoe Ispolzovanie Mineralnogo Syra= Complex use of mineral resources, 2020. 314(3): p. 5-14.
  36. Li, X., et al., Emulsification and Flow Characteristics in Copper Oxygen-Rich Side-Blown Bath Smelting Process. Metals, 2020. 10(11): p. 1520. [CrossRef]
  37. Barros, K.S., et al., Chemical Composition Data of the Main Stages of Copper Production from Sulfide Minerals in Chile: A Review to Assist Circular Economy Studies. Minerals, 2022. 12(2): p. 250. [CrossRef]
  38. Cooper, W.C., The treatment of copper refinery anode slimes. JoM, 1990. 42(8): p. 45-49. [CrossRef]
  39. Mahmoudi, A., et al., Tellurium, from copper anode slime to high purity product: A review paper. Metallurgical and Materials Transactions B, 2020. 51: p. 2555-2575. [CrossRef]
  40. Hall, S., Gold and silver recovery from copper anode slimes at the Olympic Dam Joint venture, Roxby Downs, SA. Australasian mining and metallurgy, 1993. 19: p. 1102-1105.
  41. Schlesinger, M.E., et al., Extractive metallurgy of copper. 2021: Elsevier.
  42. Swinbourne, D.R., S. Yan, and S. Salim, The solubility of gold in metallurgical slags. Mineral Processing and Extractive Metallurgy, 2005. 114(1): p. 23-29. [CrossRef]
  43. Chen, M., et al., Recovery of Precious Metals (Au, Ag, Pt, and Pd) from Urban Mining Through Copper Smelting. Metallurgical and Materials Transactions B, 2020. 51(4): p. 1495-1508. [CrossRef]
  44. Henao, H.M., K. Yamaguchi, and S. Ueda. Distribution of precious metals (Au, Pt, Pd, Rh and Ru) between copper matte and iron-silicate slag at 1573 K. in 2006 TMS Fall Extraction and Processing Division: Sohn International Symposium. 2006.
  45. Rusen, A., et al., Effects of Some Additives on Copper Losses to Matte Smelting Slag. JOM, 2016. 68. [CrossRef]
  46. Jalkanen, H., J. Vehviläinen, and J. Poijärvi, Copper in solidified copper smelter slags. Scandinavian Journal of Metallurgy, 2003. 32(2): p. 65-70. [CrossRef]
  47. Yazawa, A., Thermodynamic considerations of copper smelting. Canadian Metallurgical Quarterly, 1974. 13(3): p. 443-453.
  48. Hyvärinen, O. and M. Hämäläinen, HydroCopper((TM)) - a new technology producing copper directly from concentrate. Hydrometallurgy, 2005. 77: p. 61-65.
  49. Celmer, R. and J. Toguri, Cobalt and Gold Distribution in Nickel--Copper Matte Smelting. Nickel Metallurgy., 1986. 1: p. 147-163.
  50. Nagamori, M. and P.J. Mackey, Thermodynamics of Copper Matte Converting: Part II. Distribution of Au, Ag, Pb, Zn, Ni, Se, Te, Bi, Sb and As Between Copper, Matte and Slag in the Noranda Process. Metallurgical Transactions B, 1978. 9: p. 567-579.
  51. P. Mackey, G.M., and P. Tarassoff, Minor elements in the Noranda Process. TMS-AIME, 1975.
  52. Mackey, P.J., The Physical Chemistry of Copper Smelting Slags—A Review. Canadian Metallurgical Quarterly, 1982. 21(3): p. 221-260.
  53. Toguri, J. and N. Santander, Distribution of copper between Cu-Au alloys and silica-saturated fayalite slags. Metallurgical and Materials Transactions B, 1972. 3: p. 590-592. [CrossRef]
  54. Holland, K., et al., Distribution of Co, Fe, Ni, and precious metals between blister copper and white metal. Mineral Processing and Extractive Metallurgy, 2021. 130(4): p. 313-323. [CrossRef]
  55. Klaffenbach, E., et al., Sustainable and comprehensive utilization of copper slag: a review and critical analysis. Journal of Sustainable Metallurgy, 2023. 9(2): p. 468-496. [CrossRef]
  56. Barnett, S., The methods and economics of slag cleaning. 1979.
  57. Bellemans, I., et al., Metal losses in pyrometallurgical operations-A review. Advances in Colloid and Interface Science, 2018. 255: p. 47-63. [CrossRef]
  58. Poggi, D., R. Minto, and W.G. Davenport, Mechanisms of Metal Entrapment in Slags. JOM - Journal of the Minerals, Metals and Materials Society, 1969. 21: p. 40-45. [CrossRef]
  59. Cardona, N., Martin, A., Jim_enez, F., Ríos, G., Mackey, P., & Coursol, P. , Optimizing converter aisle operation at Atlantic copper smelter, Huelva, Spain, R.P. R. Bassa, A. Luraschi, & S. Demetrio, Editor. 2013, symposium on pyrometallurgy and process engineeringProceedings of copper 2013 p. 163-183.
  60. Schlesinger, M., et al., Extractive Metallurgy of Copper. Extractive Metallurgy of Copper. 2011.
  61. Utigard, T. and A. Warczok. Density and viscosity of copper/nickel sulphide smelting and converting slags. in Proceedings of COPPER. 1995.
  62. Schrama, F.N.H., et al., Optimal hot metal desulphurisation slag considering iron loss and sulphur removal capacity part I: fundamentals. Ironmaking & Steelmaking, 2021. 48(1): p. 1-13. [CrossRef]
  63. Sundström, A., J. Eksteen, and G. Georgalli, A review of the physical properties of base metal mattes. Journal of the Southern African Institute of Mining and Metallurgy, 2008. 108(8): p. 431-448.
  64. Fagerlund, K. and H. Jalkanen. Some aspects on matte settling in copper smelting. in Fourth International Conference Copper 99-Cobre. 1999.
  65. Nakamura, T. and J. Toguri, Interfacial phenomena in copper smelting processes, in Pyrometallurgy of copper, C. Díaz and A.A.L. C. Landolt, & C. J. Newman, Editors. 1991: New York. p. 537-551.
  66. Isaksson, J., et al., Influence of process parameters on copper content in reduced iron silicate slag in a settling furnace. Metals, 2021. 11(6): p. 992. [CrossRef]
  67. Tsukahara, I., Extraction-spectrophotometric determination of traces of gold in copper in silver, lead, blister copper, copper concentrate and anode slime with 4, 4′-bis (dimethylamino)-thiobenzophenone. Talanta, 1977. 24(10): p. 633-637. [CrossRef]
  68. Xing, W.D. and M.S. Lee, Development of a hydrometallurgical process for the recovery of gold and silver powders from anode slime containing copper, nickel, tin, and zinc. Gold Bulletin, 2019. 52: p. 69-77. [CrossRef]
  69. Lee, J.-c., et al., Metallurgical process for total recovery of all constituent metals from copper anode slimes: a review of established technologies and current progress. Metals and Materials International, 2021. 27: p. 2160-2187. [CrossRef]
  70. MAEDA, Y., Recent Operations at Hitachi Refinery. Journal of MMIJ, 2007. 123(12): p. 605-607.
  71. Tripathi, R.L.a.N., Overview of Bottom Blown Technology. 2024.
  72. https://www.metso.com/portfolio/flash-smelting-process/.
  73. https://www.glencoretechnology.com/en/technologies/isasmel.
  74. https://www.metso.com/insights/blog/mining-and-metals/detailed-opex-comparison-of-modern-copper-smelting-technologies-using-hsc-sim/.
  75. Denis Shihin, N.T., Igor Babaian, Evgueni Jak, Unveiling the link between slag chemistry and arsenic flows in primary copper smelting. 2024, COM.
  76. Zhao, B. and J. Liao, Development of Bottom-blowing copper smelting technology: A review. Metals, 2022. 12(2): p. 190. [CrossRef]
  77. Chen, M., Z. Cui, and B. Zhao. Slag chemistry of bottom blown copper smelting furnace at Dongying Fangyuan. in 6th International Symposium on High-Temperature Metallurgical Processing. 2016. Springer.
  78. Tripathi, N., Personal communication. 2024, Rio Tinto Technical Marketing.
  79. Carrasco, J., Glencore, Altonorte Smelter. 2020, Personal Communication, cited in the book “Extractive Metallurgy of Copper, 6th Ed. 2021”.
  80. Prevost, Y., Glencore Horne Smelter. 2020, Personal communication, cited in the book “Extractive Metallurgy of Copper, 6th Ed. 2021”.
  81. Zapata, R., Continuous reactor Altonorte smelter, in The Carlos Diaz symposium on pyrometallurgy, C.J.N. A. E. M. Warmer, A. Vahed, D. G. George, P. J. Mackey, & A. Warczok, Editor. 2007: Montreal: CIM. p. 141e153.
  82. Ramachandran, V., Lehner, T., Diaz, C., Mackey, P. J., Eltringham, T., Newman, C. J., Primary copper production e a survey of operating world copper smelters, J.K. Diaz, & C. Newman, Editor. 2003, Pyrometallurgy of copper, the Hermann Schwarze symposium on copper pyrometallurgy: Montreal: CIM. p. 3e119.
  83. Tarasov, A.V., & Paretsky, V. M., J.K. C. Diaz, & C. Newman, Editor. 2003, Pyrometallurgy of copper (Book 1) the Hermann Schwarze symposium on copper pyrometallrgy: Montreal: CIM. p. 173e187.
  84. Ospanov, Y. 2020, Personal communication, cited in the book “Extractive Metallurgy of Copper, 6th Ed. 2021”.
  85. Burrows, A. 2011, Personal communication, cited in the book “Extractive Metallurgy of Copper, 6th Ed. 2021”.
  86. Metso Outotec Ausmelt. (2020). Metso Outotec Ausmelt TSL Reference List. Outotec. 2020.
  87. Furuta, M., et al., Analysis of copper loss in slag in Tamano type flash smelting furnace. 2006. 8: p. 123-133.
  88. Mariscal, L., Mexicana de Cobre. SA de CV. 2020, Personal Communication, cited in the book “Extractive Metallurgy of Copper, 6th Ed. 2021”.
  89. Demetrio, S., et al., Slag cleaning: The chilean copper smelter experience. JOM, 2000. 52(8): p. 20-25. [CrossRef]
  90. Herreros, O., et al., Copper extraction from reverberatory and flash furnace slags by chlorine leaching. Hydrometallurgy, 1998. 49(1): p. 87-101. [CrossRef]
  91. Busolic, D., et al., Recovery of iron from copper flash smelting slags. Mineral Processing and Extractive Metallurgy, 2011. 120(1): p. 32-36. [CrossRef]
  92. Nazer, A.S., O. Pavez, and F. Rojas, Use of copper slag in cement mortar. Rem: Revista Escola de Minas, 2012. 65. [CrossRef]
  93. Yan, J. Recent operation of the oxygen bottom-blowing copper smelting and continuous copper converting technologies. in Proceedings of the 9th International Copper Conference (Copper 2016), Kobe, Japan. 2016.
  94. Bin, T. and Y. Suping, Application And Development of Modern Copper Metallurgical Technologies in China’s Copper Industry. 2019, Canadian Institute of Mining, Metallurgy and Petroleum.
  95. Guo, X., et al. Advanced copper smelting technologies used to quadruple China copper production between 2000 and 2015. in 9th international copper conference (Copper 2016), Kobe, Japan. 2016.
  96. Yongcheng, Z., L. Bing, and L. Kai, Engineering and Production Practice of Double Bottom-Blowing Continuous Copper Smelting Process with “Three Connected Furnaces” Arrangement. 2019, Canadian Institute of Mining, Metallurgy and Petroleum.
  97. Tuominen, J., K. Pienimäki, and K. Fagerlund. Kennecott-outotec flash converting–leading the way for over 20 years. in Proc. copper. 2016.
  98. Marín, O., et al., Potential of Tailing Deposits in Chile for the Sequestration of Carbon Dioxide Produced by Power Plants Using Ex-Situ Mineral Carbonation. Minerals, 2021. 11(3): p. 320. [CrossRef]
  99. Montenegro, V., H. Sano, and T. Fujisawa, Recirculation of Chilean Copper Smelting Dust with High Arsenic Content to the Smelting Process. MATERIALS TRANSACTIONS, 2008. 49(9): p. 2112-2118. [CrossRef]
  100. Imris, I., et al., The Copper Losses in the Slags From the El Teniente Process. Canadian Metallurgical Quarterly, 2000. 39(3): p. 281-290.
  101. Cardona, N., et al., The Physical Chemistry of Copper Smelting Slags and Copper Losses at the Paipote SmelterPart 2 – Characterisation of industrial slags. Canadian Metallurgical Quarterly, 2011. 50(4): p. 330-340. [CrossRef]
  102. Shishin, D., et al. Thermodynamic modelling of liquid slag-matte-metal equilibria applied to the simulation of the Peirce-Smith converter. in Advances in Molten Slags, Fluxes, and Salts: Proceedings of the 10th International Conference on Molten Slags, Fluxes and Salts 2016. 2016. Springer.
  103. Yazawa, A., Distribution of Various Elements Between Copper, Matte and Slag. Science reports of the Research Institutes, Tohoku University. Ser. A, Physics, chemistry and metallurgy, 1981. 30: p. 154.
  104. Kapusta, J.P., JOM world nonferrous smelters survey, part I: copper. JOM, 2004. 56(7): p. 21-27. [CrossRef]
  105. Mostaghel, S., C. Samuelsson, and B. Björkman, Influence of alumina on mineralogy and environmental properties of zinc-copper smelting slags. International Journal of Minerals, Metallurgy, and Materials, 2013. 20: p. 234-245. [CrossRef]
  106. Lidelöw, S., et al., Leaching behaviour of copper slag, construction and demolition waste and crushed rock used in a full-scale road construction. Journal of environmental management, 2017. 204: p. 695-703. [CrossRef]
  107. Davenport, W.G., Jones, D. M., King, M. J., & Partelpoeg, E. H, Flash smelting, analysis, control and optimization. 2001, Warrendale, PA: TMS.
  108. Muravyov, M.I., et al., Leaching of copper and zinc from copper converter slag flotation tailings using H2SO4 and biologically generated Fe2 (SO4) 3. Hydrometallurgy, 2012. 119: p. 40-46. [CrossRef]
  109. Liao, J., K. Tan, and B. Zhao, Enhanced productivity of bottom-blowing copper-smelting process using plume eye. Metals, 2023. 13(2): p. 217. [CrossRef]
  110. Steinhauser, J., A. Vartiainen, and W. Wuth, Volatilization and distribution of impurities in modern pyrometallurgical copper processing from complex concentrates. JOM, 1984. 36: p. 54-61. [CrossRef]
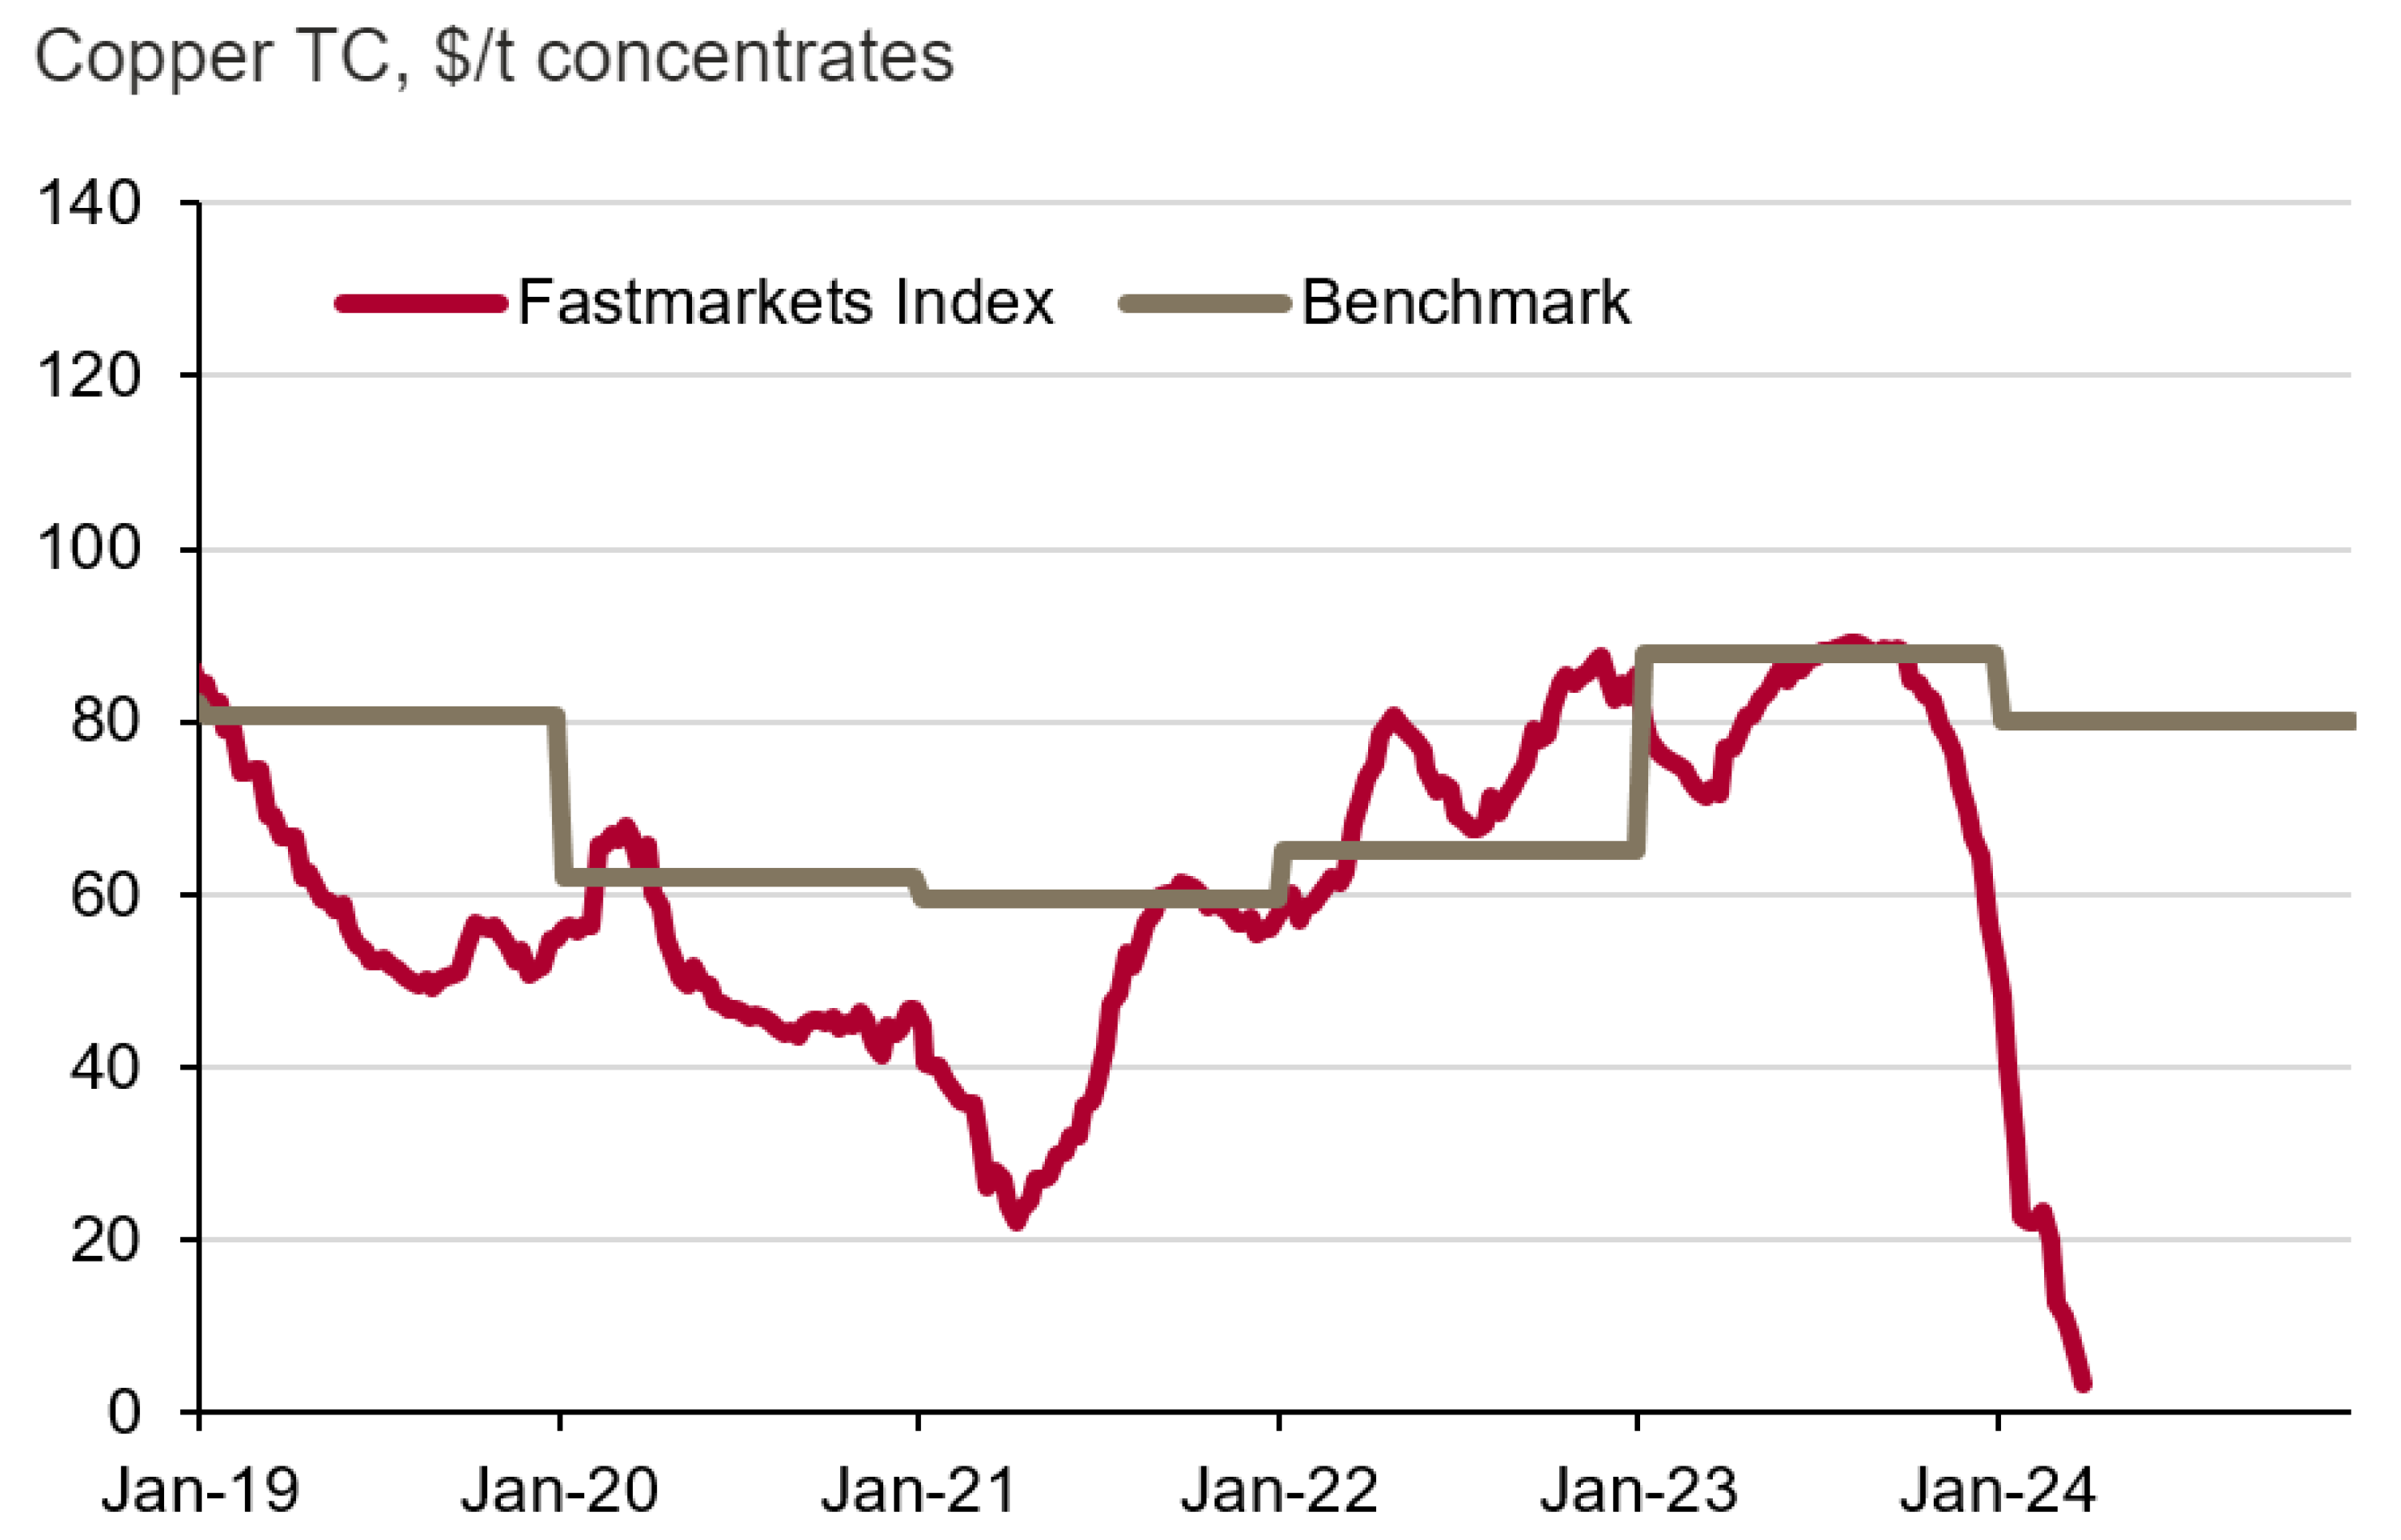
Figure 1. Treatment charges (TC) of copper concentrate from Fastmarkets analysis [1].
Preprints 118656 g001
Figure 2. Breakdown of global copper production in 2022, highlighting the shares of mined and recycled copper, and the distribution of smelting methods [10,11].
Preprints 118656 g002
Figure 3. World copper production by origin in 2022: (a) mine and (b) smelter. Reproduced from [10].
Preprints 118656 g003
Figure 4. China’s copper concentrate imports by origin in 2023 (in million tons) [14].
Preprints 118656 g004
Figure 5. Overview of copper-making flowsheet.
Preprints 118656 g005
Figure 6. (a) Average gross revenue from copper and its metallic by-products, and b) share of by-product revenues by metals and regions (averaged over 2010-2025) [12].
Preprints 118656 g006
Figure 7. Gold payables for different gold grades in a copper concentrate in the Japanese market.
Preprints 118656 g007
Figure 8. Gold partition coefficient between matte and slag versus Cu concentration in matte. [20Che]: 1300 oC, 0.1 bar SO2, ICP [43]; [16Ava]: 0.1 bar SO2, FS, EPMA [6]; [15Ava]: 0.1 bar SO2, FS slag, ICP [5]; [06Hen]: 0.1 bar SO2, FSM slag, ICP-MS [44]. F, S, M, A, and C stand for FeO, SiO2, MgO, Al2O3, and CaO in slag.
Preprints 118656 g008
Figure 9. Gold partition coefficients between copper and slag versus oxygen partial pressure. Experimental data were obtained for alumina-saturated iron-silicate slag using LA-ICP-MS [7].
Preprints 118656 g009
Figure 10. Gold partition coefficients between copper and matte (diamond) and copper and white metal (square) versus temperature [4,54].
Preprints 118656 g010
Figure 11. Gold concentrations (in log10 in ppm) in several phases in copper anode electrorefining [30,67]. CAS represents copper anode slime.
Preprints 118656 g011
Figure 12. Production shares of different copper smelting technologies. TSL and SKS stand for top submerged lance and Shuangyashan Kiln Stove, respectively [71].
Preprints 118656 g012
Figure 13. Liquidus temperatures of iron-silicate slags versus Fe/SiO2 weight ratio in bulk slag. Lines from FactSage 8.3 FToxid for different P O 2
Preprints 118656 g013
Figure 14. Total copper loss to slag in wt% versus Fe/SiO2 weight ratio in bulk slag for different smelting technologies [41,43,60,76,77,79,80,81,88,89,90,91,92,93,94,95,96].
Preprints 118656 g014
Figure 15. Copper physical loss in slag (in wt%) for several converters. Peirce Smith converters (PSC: Aurubis, Boliden, Codelco, Hibi Kyodo, Sumitomo, Pan Pacific, Unknown), Flash converter (FC: Rio Tinto Kennecott), Noranda converter (Horne), Mitsubishi converters (Naoshima, Gresik, Onsan), Teniente converters (Chuquicamata, Unknown 2, Unknown 3, Hernan Videla Vira, and Potrerillos), bottom blowing converter (BBC: Baotou, Dongying Phase II) [68,69,81,90,91,92,93].
Preprints 118656 g015
Figure 16. Gold first pass recovery (in %) calculated in this work for different smelting and converting technologies (smelting: blue and converting: orange).
Preprints 118656 g016
Table 1. Key operational parameters for smelting furnaces with respect to metal recovery; (a) flash furnaces, (b) Noranda, Teniente and Vanyukov furnaces, (c) bottom-blowing and Mitsubishi furnaces, and (d) TSL-Isasmelt furnaces, and (e) TSL-Ausmelt furnaces [41,43,48,60,75,76,77,78,79,80,81,82,83,84,85,86].
a)
Operational data Flash
Pasar, Philippines [41] Aurubis, Germany [41] JX metals smelting Saganoseki, Japan [41] Hibi Kyodo smelting Co. Tamano, Japan [60] Sumitomo Toyo, Japan [41] Rio Tinto Kennecott Utah Copper Magna, USA
[60]
Concentrate (t/d) 2000 3300 2204 2241 3830 4200
Concentrate Cu (wt%) 23-29 29 28 [60] 29.2 26.3 25.0
Slag (t/d) 800-900 2000 2700 1326 2973 2100-3100
Slag Cu total (wt%) 0.63 1.50 0.80 0.74 0.86 0.5-4
Slag Cu chemical loss (wt%) 0.5 0.45 0.45 0.46 0.44 0.83
Slag Cu physical loss (wt%) 0.13 1.05 0.35 0.28 0.42 1.42
SiO2/Fe weight 0.87-1 0.82 0.96 0.85 1.13 0.64, 0.8
Fe (wt%)
SiO2 (wt%)
CaO/Fe weight
Slag T (oC) 1240 1250 1260 1254 1255 1320
Matte Cu (wt%) 54-56 63.0 63.0 63.5 62.0 66.5-74.5
Matte (t/d) 1080 1500 1650 1129 1753 1800
Fe/SiO2 weight 1.07 1.22 1.04 1.18 0.88 1.56, 1.25
b)
Operational data Noranda Teniente Vanyukov
Noranda, Canada [41] Altonorte, Chile [41] Codelco Caletones, Chile [41] Codelco Chuquicamata, Chile [60] Balkhash smelter, Kazakhstan [41] Norilsk Copper, Siberia*[41] Sredneuralsky, Urals*[41]
Concentrate (t/d) 1900-2200 3000-3300 2000-2400 2200-2500 - - -
Concentrate Cu (wt%) 27.0 26-29 27-29 30-33 12-22 19-23 13-15
Slag (t/d) 1300-1450 2450 1400-1700 1550-1800
Slag Cu total (wt%) 3-4 7.00 6-8 6-10 <0.9 1.2; 0.9; 2.0 0.7
Slag Cu chemical loss (wt%) 0.71 0.71 1.18 0.94
Slag Cu physical loss (wt%) 2.79 6.29 5.82 7.06
SiO2/Fe weight 0.6-0.8 0.7 0.45-0.59 0.66-0.68
Fe (wt%) 31-38 48,45,25 30
SiO2 (wt%) 29-31 29,29,35 32
CaO/Fe weight
Slag T (oC) 1230 1220 1240 1240 1250-1300 1320; 1320; 1250 1280
Matte Cu (wt%) 71-73 72-73 72-75 72-74 45-55 65,55,74 45
Matte (t/d) 650-900 1350.0 800-950 990-1150
Fe/SiO2 weight 1.43 1.43 1.92 1.49
c)
Operational data Bottom Blowing Mitsubishi
[43] [76] [76] [77] Dongying [78] Baotou [78] Calculation [75] Mitsubishi Materials Corp., Naoshima, Japan [60] Gresik, Indonesia [60] Onsan, Korea [60]
Concentrate (t/d) 90-100 50 70 230 t/h 2300 2000-2300 2109
Concentrate Cu (wt%) 20 22 20-22 18 25 34 31.7 33.2
Slag (t/d) 153.4 t/h 1300 1450 1331
Slag Cu total (wt%) 3.0-4.0 1.0-3.0 2.6 2.5-3.8 2.6 5 7.6 0.7 0.7 0.8
Slag Cu chemical loss (wt%) 0.48 0.48 0.58 1.18 0.58 0.71 1.18 0.50 0.50 0.58
Slag Cu physical loss (wt%) 3.02 1.52 2.02 1.97 2.02 4.29 6.42 0.20 0.20 0.22
SiO2/Fe weight 0.62-0.56 0.59-0.67 0.56 0.53-0.71 0.56 0.59 0.63 0.9 0.8 0.9
Fe (wt%)
SiO2 (wt%)
CaO/Fe weight
Slag T (oC) 1080-1180 1150-1170 1190-1210 1150-1180 1180 1200 1250
Matte Cu (wt%) 52-60 50.0 70 75.0 70.0 72.0 74.0 68 68 68.8
Matte (t/d) 80.1 t/h 1400 1260 1240
Fe/SiO2 weight 1.69 1.59 1.79 1.61 1.60 1.11 1.25 1.11
d)
Operational data Isasmelt [60]
Mount Isa, Australia Kunming, China Miami, USA Ilo, Peru Sterlite, India Mufulira, Zambia Ust-Kamenogorsk, Kazakhstan
Concentrate (t/d)
Concentrate Cu (wt%) 22-26 18-22 25-29 25-29 26-31 28-32 22-26
Slag (t/d)
Slag Cu total (wt%)
Slag Cu chemical loss (wt%)
Slag Cu physical loss (wt%)
SiO2/Fe weight 0.85 0.85 0.65 0.75 0.75 0.85 0.8
Fe (wt%)
SiO2 (wt%)
CaO/Fe weight
Slag T (oC) 1190 1180 1185 1185 1185 - 1180
Matte Cu (wt%) 60-63 52-55 55-60 60-65 60-65 60-65 55-60
Matte (t/d)
Fe/SiO2 weight 1.18 1.18 1.54 1.33 1.33 1.18 1.25
e)
Operational data Ausmelt [60]
Zhong Tiao Shan, China Tongling, China RCC, Russia JinJian, China Huludao, China NCS, Namibia Days, China YTCL, China Xinjiang, Wuxin China
Concentrate (t/d)
Concentrate Cu (wt%) 17-22 25 14-23 26 22 25 20 22 19
Slag (t/d)
Slag Cu total (wt%) 0.6 0.6 1 0.6 0.6 1 0.6 0.6 0.6
Slag Cu chemical loss (wt%)
Slag Cu physical loss (wt%)
SiO2/Fe weight 0.8 0.7 0.7 0.7 0.7 0.7 0.7 0.7 0.7
Fe (wt%)
SiO2 (wt%)
CaO/Fe weight
Slag T (oC) 1200-1300 1180 1180 1180 1180 1180 1180 1180 1180
Matte Cu (wt%) 60 50 40 50 50 50 55 60 56
Matte (t/d)
Fe/SiO2 weight 1.25 1.43 1.43 1.43 1.43 1.43 1.43 1.43 1.43
*Operational temperatures were taken. Cu% in slag was estimated from Cu recovery to matte (97.3% and 96.2%). Cu chemical loss was calculated from loss as sulfide and oxide from Furuta et al. [87]. Cu wt% in slag from Isasmelt and Ausmelt was reported after settling.
Table 2. Key operational parameters for matte converting furnaces; (a) Peirce Smith, and (b) Flash, Noranda, Mitsubishi, Teniente, and BBC furnaces [68,69,81,90,91,92,93].
a)
Operational data Peirce Smith
Pasar, Philippines [41] Aurubis, Germany [41] Boliden, Rönnskar, Sweden [41] Codelco Caletones [41] Hibi Kyodo Smelting Co., Tamano, Japan [41] Sumitomo Toyo, Japan [41] JX metals smelting Saganoseki, Japan [41] Unknown 1 [98]
Matte (t/converter, t/d or t/h) 300 350 200 205 215 -
Matte Cu (wt%) 63 58 74.3 64 [60] 62 [60] 63
Slag (t/converter, t/d, or t/h) 70 140-160 30 65 54
Slag Cu total (wt%) 10-15 4 6 25 5.2 6.5 8.4 13.3
Slag Cu chemical loss (wt%) 2 2 2 2 2 2 2 2
Slag Cu physical loss (wt%) 10.5 2 4 23 3.2 4.5 6.4 11.3
SiO2/Fe weight ratio 0.55 0.75 - 0.41 0.45 0.46 0.46
Fe (wt%) 41.1
SiO2 (wt%) 18.9
CaO/Fe weight
Slag T (oC)
Blister Cu (t/converter, t/d or t/h) 260-300 270-310 145 214 208 -
Fe/SiO2 (Fe/CaO) weight 1.82 1.33 2.44 2.22 2.17 2.17
b)
Operational data Flash Noranda Mitsubishi Teniente Bottom Blowing
Rio Tinto Kennecott
[41]
Horne [41] Naoshima, Japan [41] Gresik, Indonesia [41] Onsan, Korea [60]
Chuquicamata
[99]
Unknown 2
[89]
Unknown 3 [100] Hernan Videla Lira [101] Potrerillos [101] Calculation
[75]
Matte (t/converter, t/d or t/h) 1200-1800 679 1080 1080-1290 1018 80.1
Matte Cu (wt%) 67-70 65 67 68.8 74
Slag (t/converter, t/d, or t/h) 200-400 297 290 576 360 11.5
Slag Cu total (wt%) 17-26 13.2 14 13 15 8 7.4 7.2 7.03 8 23
Slag Cu chemical loss (wt%) 2 2 2 2 2 2 2 2 2 2 2
Slag Cu physical loss (wt%) 19.5 11.2 12 11 13 6 5.4 5.2 5.03 6 21
SiO2/Fe weight ratio 1.49 0.66 0.98 0.66 1
Fe (wt%) 39.4 38.11 38
SiO2 (wt%) 26.1 37.5 24.19 25
CaO/Fe weight 0.24-0.36 0.4 0.4 0.34
Slag T (oC) 1260 1250
Blister Cu (t/converter, t/d or t/h) 1100-1500 640 790 850-1000 820 57.2
Fe/SiO2 (Fe/CaO) weight (2.63-5) 0.67 (2.5) (2.5) (2.94) 1.5 1.0 1.5 1.0
About 2 wt% Cu was assumed as chemical loss in slag [102]. Some of the reported data are average values.
Disclaimer/Publisher’s Note: The statements, opinions and data contained in all publications are solely those of the individual author(s) and contributor(s) and not of MDPI and/or the editor(s). MDPI and/or the editor(s) disclaim responsibility for any injury to people or property resulting from any ideas, methods, instructions or products referred to in the content.
Copyright: This open access article is published under a Creative Commons CC BY 4.0 license, which permit the free download, distribution, and reuse, provided that the author and preprint are cited in any reuse.
Prerpints.org logo

Preprints.org is a free preprint server supported by MDPI in Basel, Switzerland.

Subscribe

© 2024 MDPI (Basel, Switzerland) unless otherwise stated