1. Introduction
The flaring of associated gas results in wasted energy and raw materials in addition to atmospheric emission of greenhouse gases, which intensifies climate change. Consequently, flare gas recovery (FGR) is a priority for regulatory agencies and the oil & gas (O&G) industry [
1,
2,
3,
4,
5,
6,
7,
8,
9,
10]. Furthermore, the disposal of untreated produced water, a waste byproduct of natural gas production wells, in evaporation ponds and subsurface injection sites remains under scrutiny due to the shortage of disposal sites and the scarcity of fresh water. The call for produced water treatment for recycling and reuse is getting louder. A cost-effective, integrated solution that promotes the reuse of treated produced water with captured flare gas, not only reduces greenhouse gas emissions and generates a revenue-generating water stream, but also improves a company's Environmental, Social, and Governance (ESG) performance. In previous studies, the FGR-thermal vapor compression (FGR-TVC) processes (Compressor-based or Ejector-based) for produced water desalination were demonstrated to be technically viable [
11,
12,
13,
14,
15,
16]. In this paper, we performed Aspen Plus process modeling by simplifying the previous flowsheets to maximize potable water recovery and reduce burner flue gas emissions [
17]. The rapid advancement of solar energy technology coupled with high solar insolation in the US Southwest makes a compelling argument to utilize solar energy in O&G operations [
18,
19,
20]. The Solar-Flare Gas Recovery-Desalination (Solar-FGRD) process seeks to reduce operating and utility costs by improving heat integration and decreasing reliance on a power grid to operate the desalination plant. The process modeling, economic feasibility, and environmental impact were evaluated and compared to a produced water disposal baseline process, without flare gas recovery (FGR) and without produced water desalination [
21,
22,
23,
24,
25,
26,
27,
28,
29].
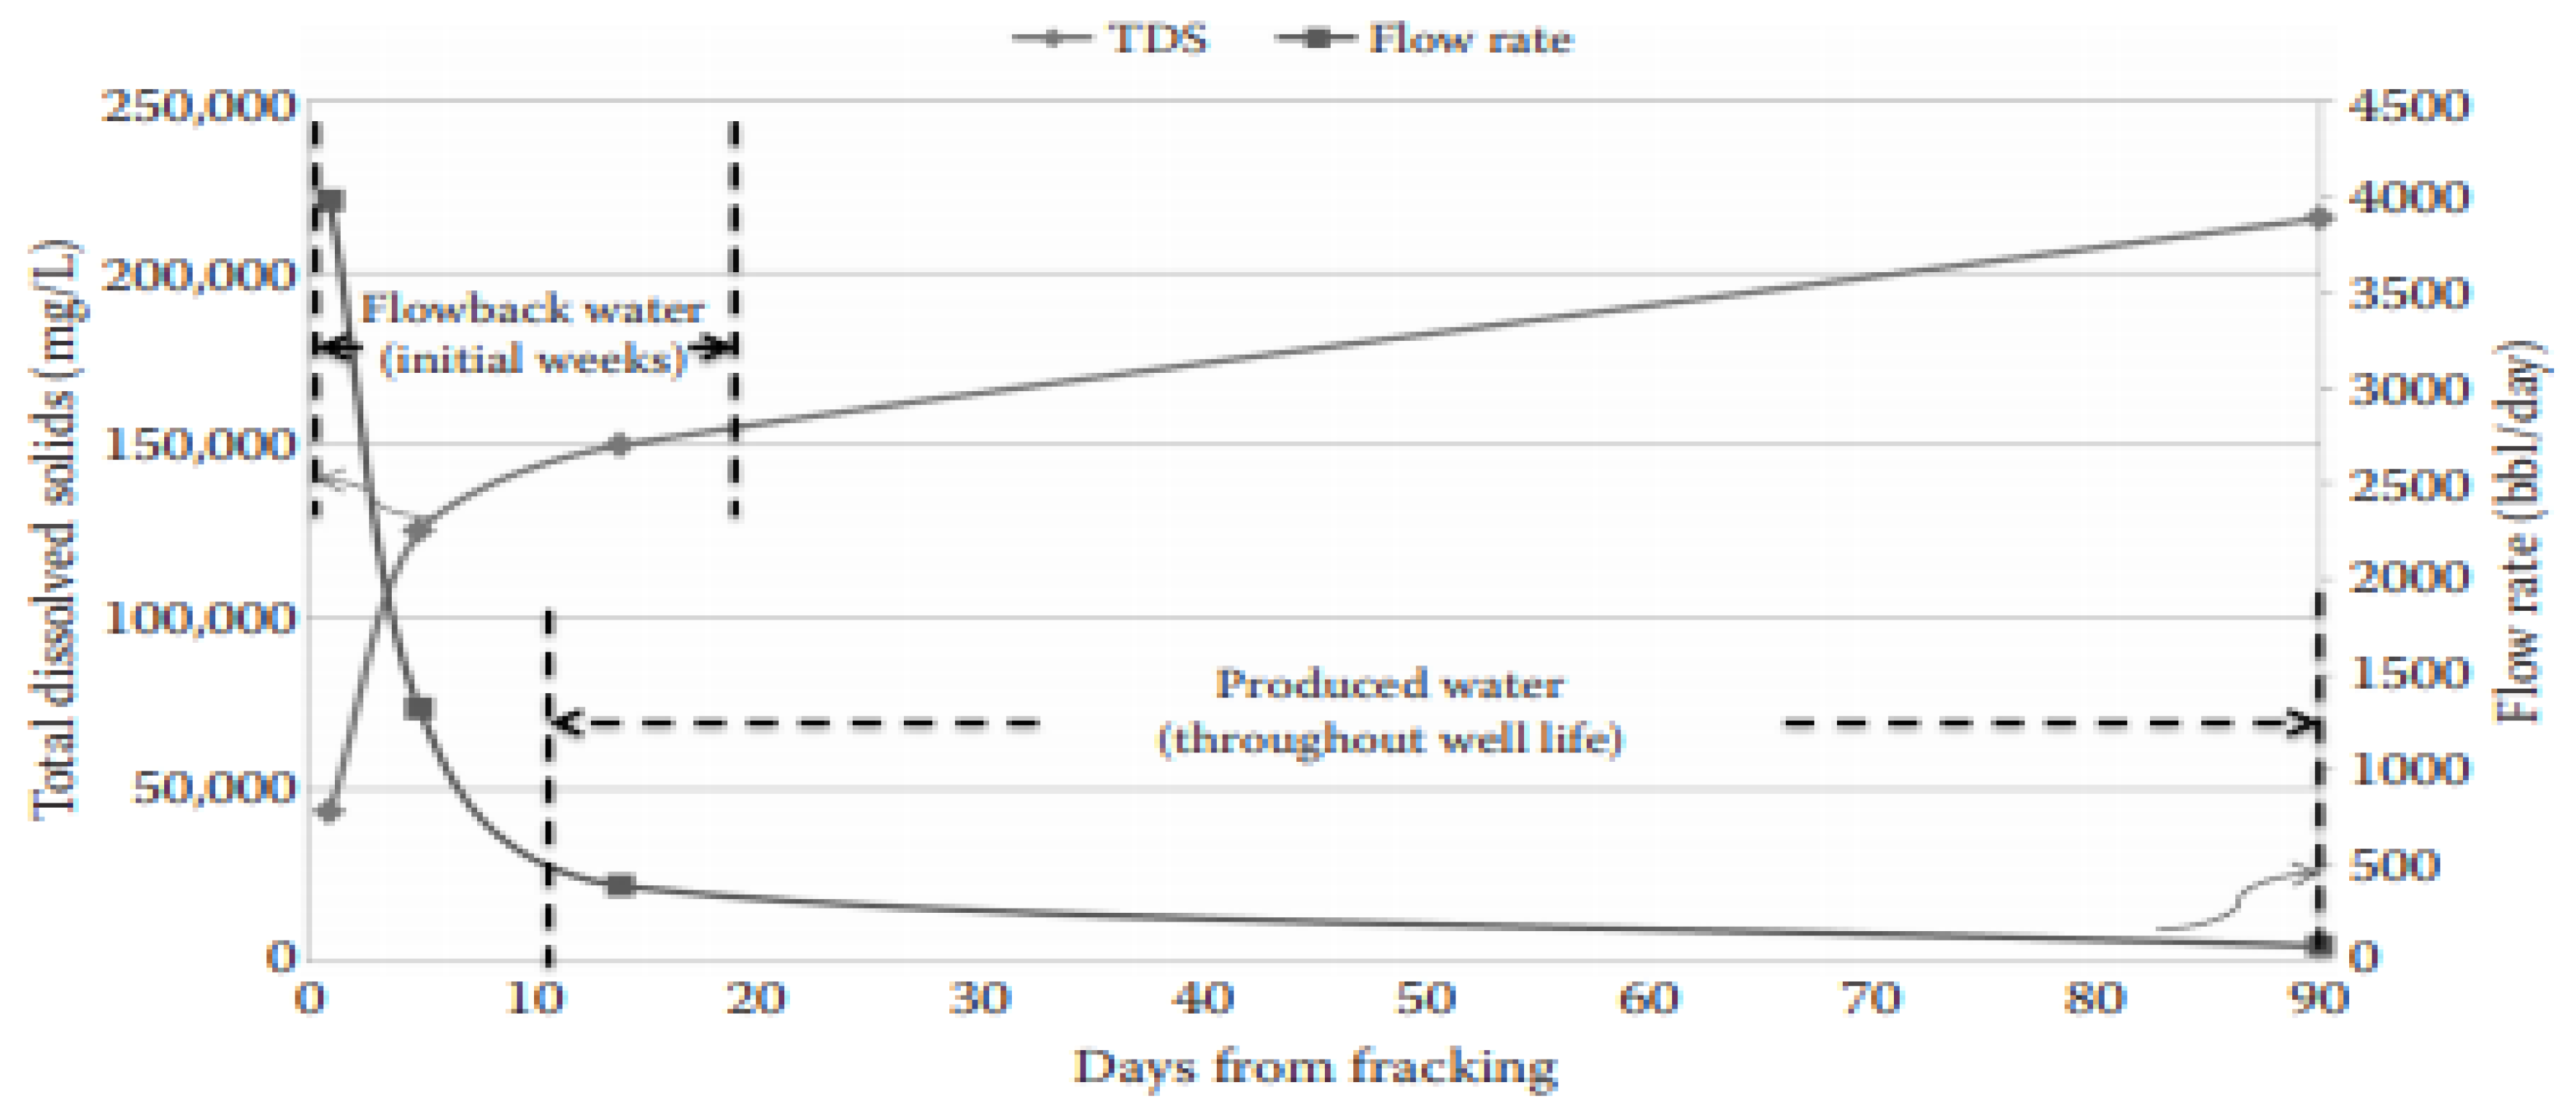
After a well begins to produce oil and gas, flow back water is observed during the first few weeks after which produced water continues to flow throughout the life of the well. The total dissolved solids (TDS) of the produced water varies from 10,000 to 300,000 mg/L.
Figure 1 [
15] estimates the flow rate of produced water for a well. In this project, 52.2 bbl/hr of produced water was assumed.
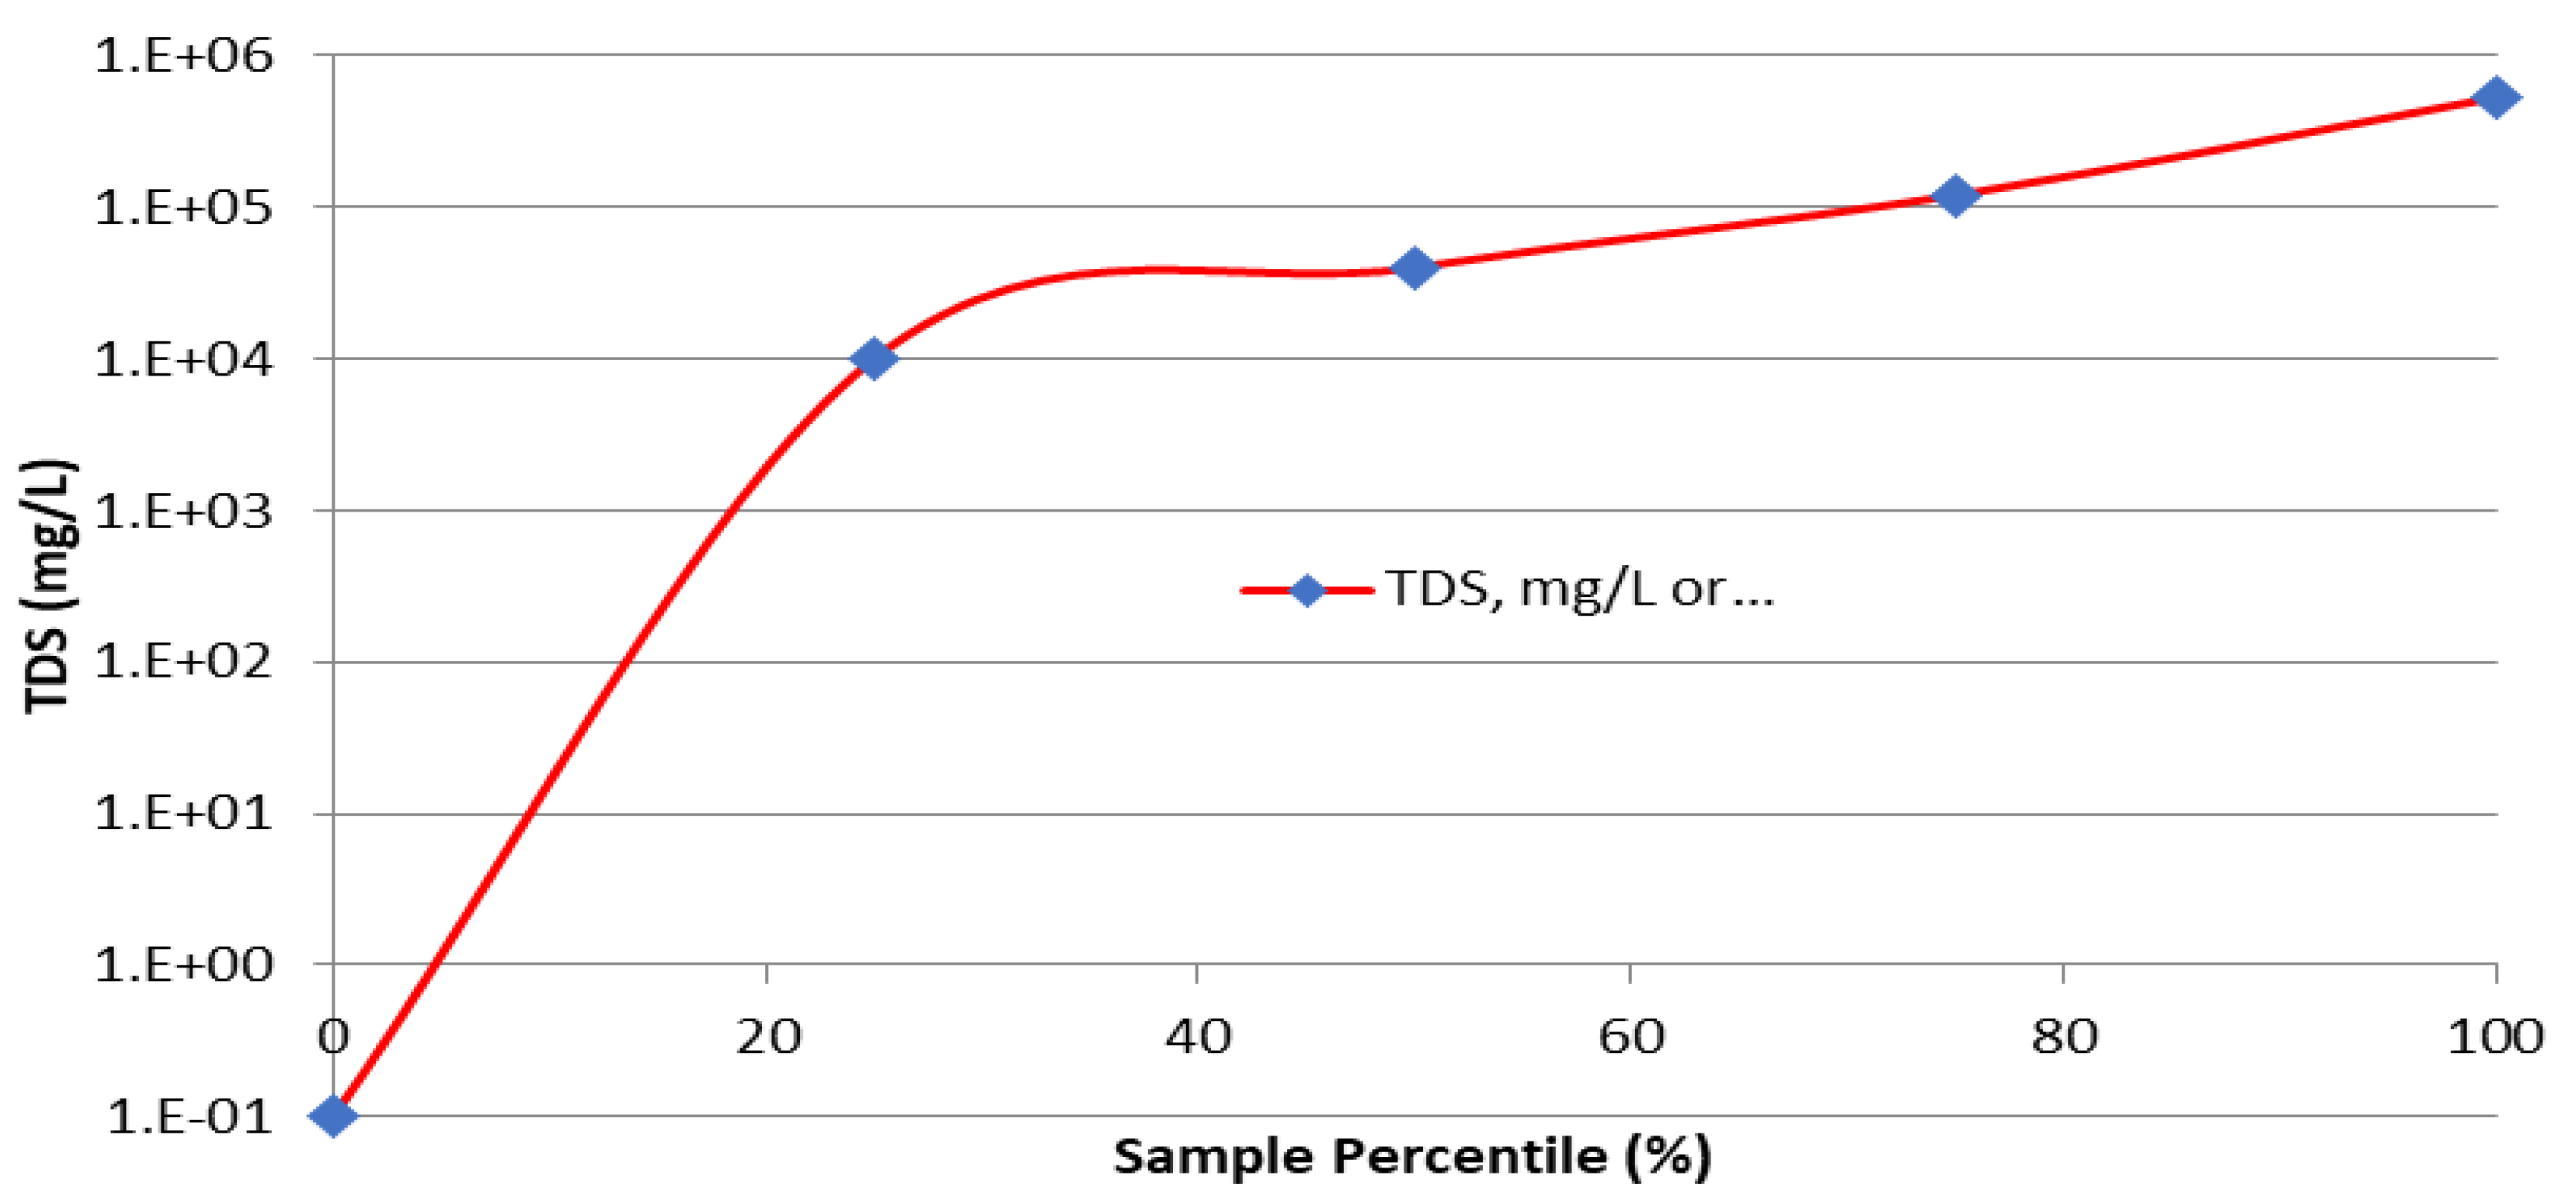
Figure 2 illustrates the TDS content in typically produced water samples. In this project, 130,000 mg/L was assumed as the average TDS content of produced water. Based on a previous work [
11], the TDS composition was assumed to be 28.9 % Na
+, 9.6% Ca
2+, and 61.5% Cl
-. The Solar-FGRD process captures this stream and converts 76.8% of the volume to potable water (<500 mg/L), which can be used by municipalities for irrigation, cleaning, household use, and drinking water.
The objective of the Solar-FGRD process is to maximize potable water and minimize waste streams including brine and burner flue gas hydrocarbons. In the Chen et al., 2016 work [
11], a potable water recovery of 36% (62.9 bbl/hr of potable water) is achieved, with 669.2 bbl/hr of waste streams (113.2 bbl/hr brine and 556 bbl/hr of cooling water). The process intake is 720 bbl/hr. The potable water revenue is
$4,628,433/yr and the waste disposal cost is
$10,258,836/yr. The Ejector based FGR-TVC (thermal vapor compression) process proposed by Mazumder et al. [
13] could save about 33% capital cost and 16% operating cost per year, compared with the compressor-based FGR-TVC process. The Solar-FGRD process simulation and economic evaluation develops on previous work in the literature [
11,
13] and integrates advances in solar thermal and photovoltaic technology to optimize produced water desalination coupled with flare gas recovery [
18,
20]. Unlike the previous works which only dealt with operating costs analysis, comprehensive economic analysis and greenhouse gas (GHG) analysis are carried in this study. Dinani et al. [
12] reported an optimization of the natural gas liquid (NGL) product plus the outlet gas (mainly methane) utilization (after FGR) for South Iran oil and gas fields. They concluded the best approach would be 93% of the methane gas going to enhanced oil recovery and 7% used for power generation. However, their paper addresses a different scope of work, and the results cannot be directly compared to this study.
2. Methodology
2.1. Process Description
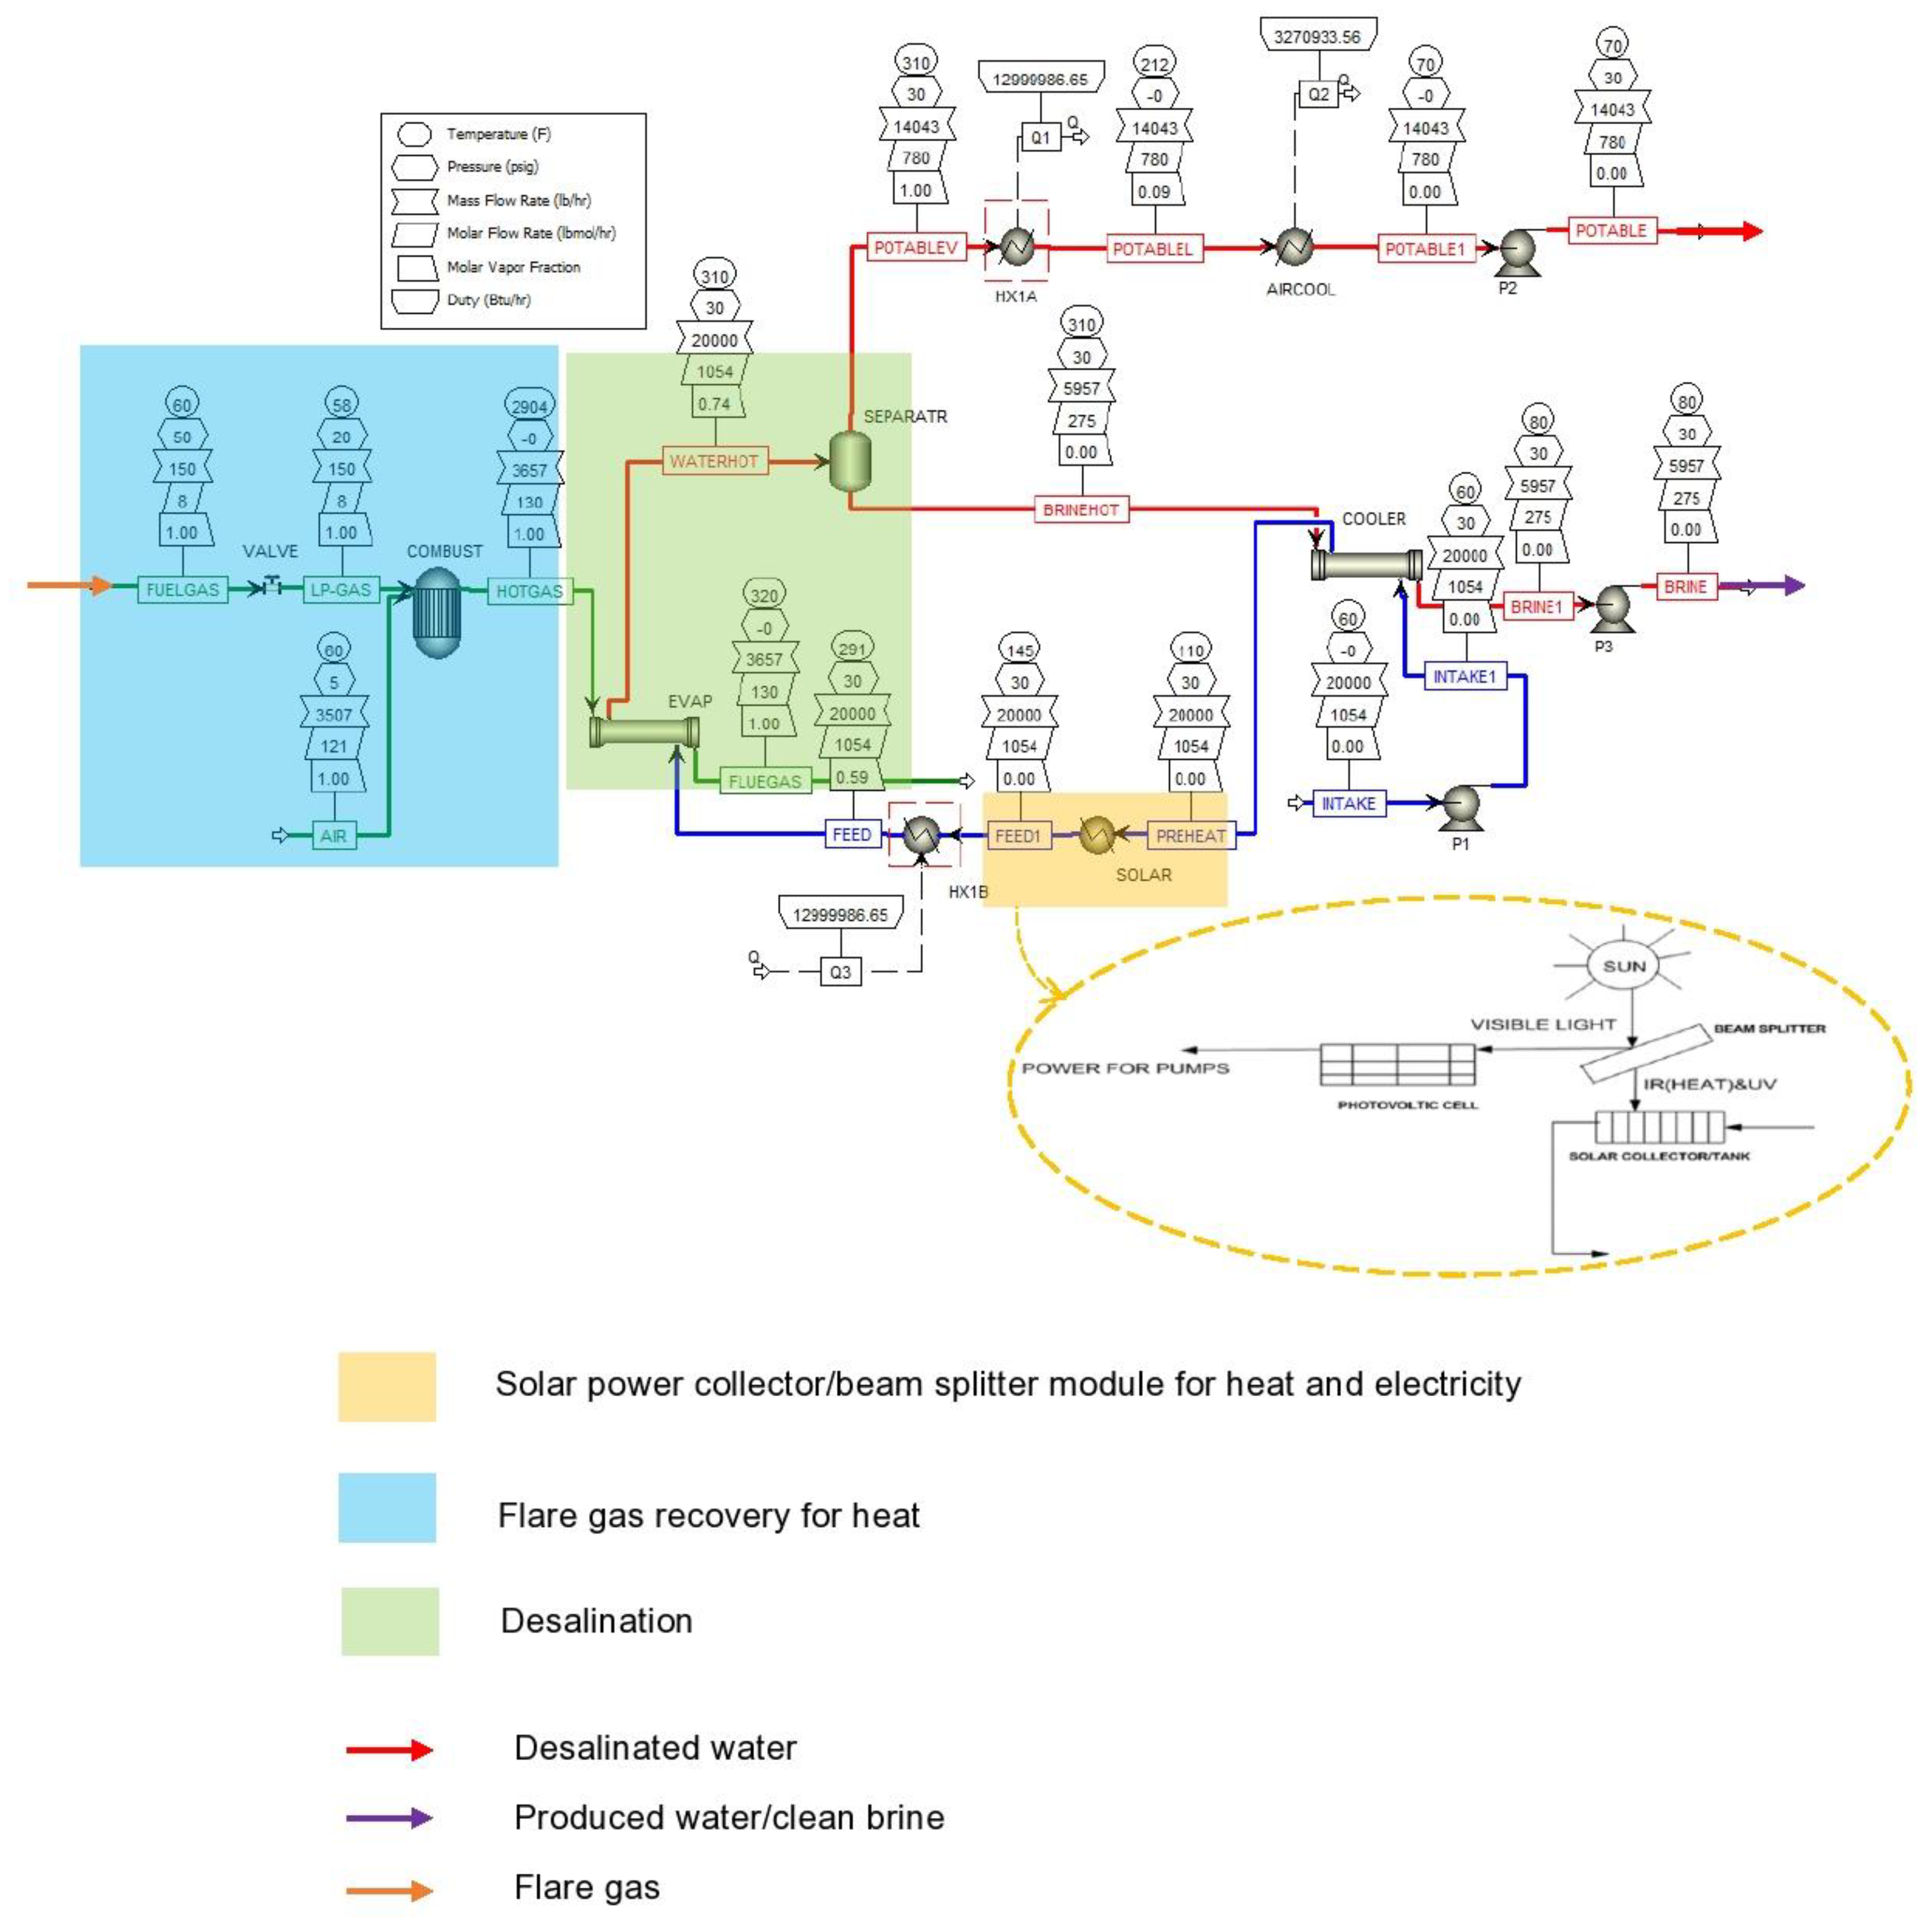
The Solar-FGRD process as shown in
Figure 3 and
Table 1 was modeled with Aspen Plus Version 11 [
17] and is summarized as follows:
- -
A feed (INTAKE) of 52 bbl/hr pretreated produced water (metals and sludge removed) at 60 °F & 0 psig containing 131,260 mg/L TDS with 28.9 % Na+, 9.6% Ca2+, and 61.5% Cl- is pumped (P1) at 30 psig (via stream INTAKE1) into a cooler (COOLER) which raises the temperature of the feed to 110 °F.
- -
The stream (PREHEAT) exits COOLER at 110 °F and is further pre-heated through a solar-powered heater (SOLAR) to 145 °F. The solar heat input is 600,000 Btu/hr. The pre-heated stream exits SOLAR as FEED1
- -
The 52 bbl/hr preheated produced water (FEED1) flows through an evaporator (HX1B) which generates a two-phase stream (FEED) of 59 mol% vapor, at 291 °F. The HX1B exchanger heat input (Q3) is 13,000,000 Btu/hr.
- -
The FEED stream is heated further via a second evaporator (EVAP) which increases the temperature of FEED from 291 °F to 310 °F and increases the vapor fraction from 59 mol% to 74 mol%. The heated two-phase stream exits EVAP as WATERHOT.
- -
Then, a separator (SEPARATR) flashes the WATERHOT stream into a 100% vapor stream (POTABLEV). This stream is free of TDS and is considered pure water. The separator also generates a 100% liquid stream BRINEHOT which contains TDS.
- -
The liquid stream exiting the separator (BRINEHOT) is at 310 °F and contains 503,268 mg/L TDS with 28.9 % Na+, 9.6% Ca2+, and 61.5% Cl-. The stream is cooled to 80 °F via COOLER and then the cooled stream (BRINE1) is pumped to storage via pump P3 at 30 psig. The produced water intake is used to cool the hot brine stream. The final waste brine liquid stream BRINE comprises 29.8wt% of the produced water feed. This waste stream will need to be disposed of at a subsurface injection site.
- -
The pure water vapor stream (POTABLEV) at 310 °F is condensed to 99.91mol% liquid at 212 °F via exchanger HX1A. Q1 represents the 13,000,000 Btu/hr of heat removed. The heat removed from the potable water vapor is used to preheat the produced water feed stream in HX1B. The condensed potable water (POTABLEL) is further cooled to 70 °F via an air-cooler (AIRCOOL), which removes 3,270,934 Btu/hr of heat (Q2). The cooled potable water stream (POTABLE1) is pumped to storage via pump P2 at 30 psig. The final product stream POTABLE is distilled water without TDS for sale and comprises 70.2wt% of the produced water feed.
- -
The primary heat source for the desalination is stream FUELGAS, which is the recovered gas from the production well at 150 lb/hr, 60 °F, 50 psig, and consists of 65.3 wt% methane, 24.8% ethane, 9.01% propane, 0.575% nitrogen, and 0.226% carbon dioxide. A VALVE is used to drop the pressure to 20 psig. The stream LP-GAS is fed to a burner COMBUST which is modelled as an equilibrium reactor based on Gibbs free energy minimization. The COMBUST combustion reactions and conversions are shown in
Figure 4. Excess air (35%) at 60 °F, 5 psig, 3507 lb/hr consisting of 21% oxygen, 78% nitrogen, and 1% argon is fed to the burner via stream AIR.
- -
The burner outlet stream HOTGAS is heated to 2904 °F and contains combustion gases. This stream is fed to the evaporator (EVAP) and transfers heat such that the flue gas stream (FLUEGAS) releases into the atmosphere at 320 °F.
- -
The flue gas waste stream flow is 3657 lb/hr (11.43 wt% carbon dioxide, 8.45 wt% water, 72.22 wt% nitrogen, 6.27 wt% oxygen, 0 wt% carbon monoxide, 0 wt% nitrous oxide, 0 wt% nitrogen dioxide, 0.29 wt% nitric oxide, 0 wt% methane, 0 wt% ethane, and 0 wt% propane).
- -
The modelled destruction efficiency for the flue gas is ~100% methane, ~100% ethane, and ~100% propane.
- -
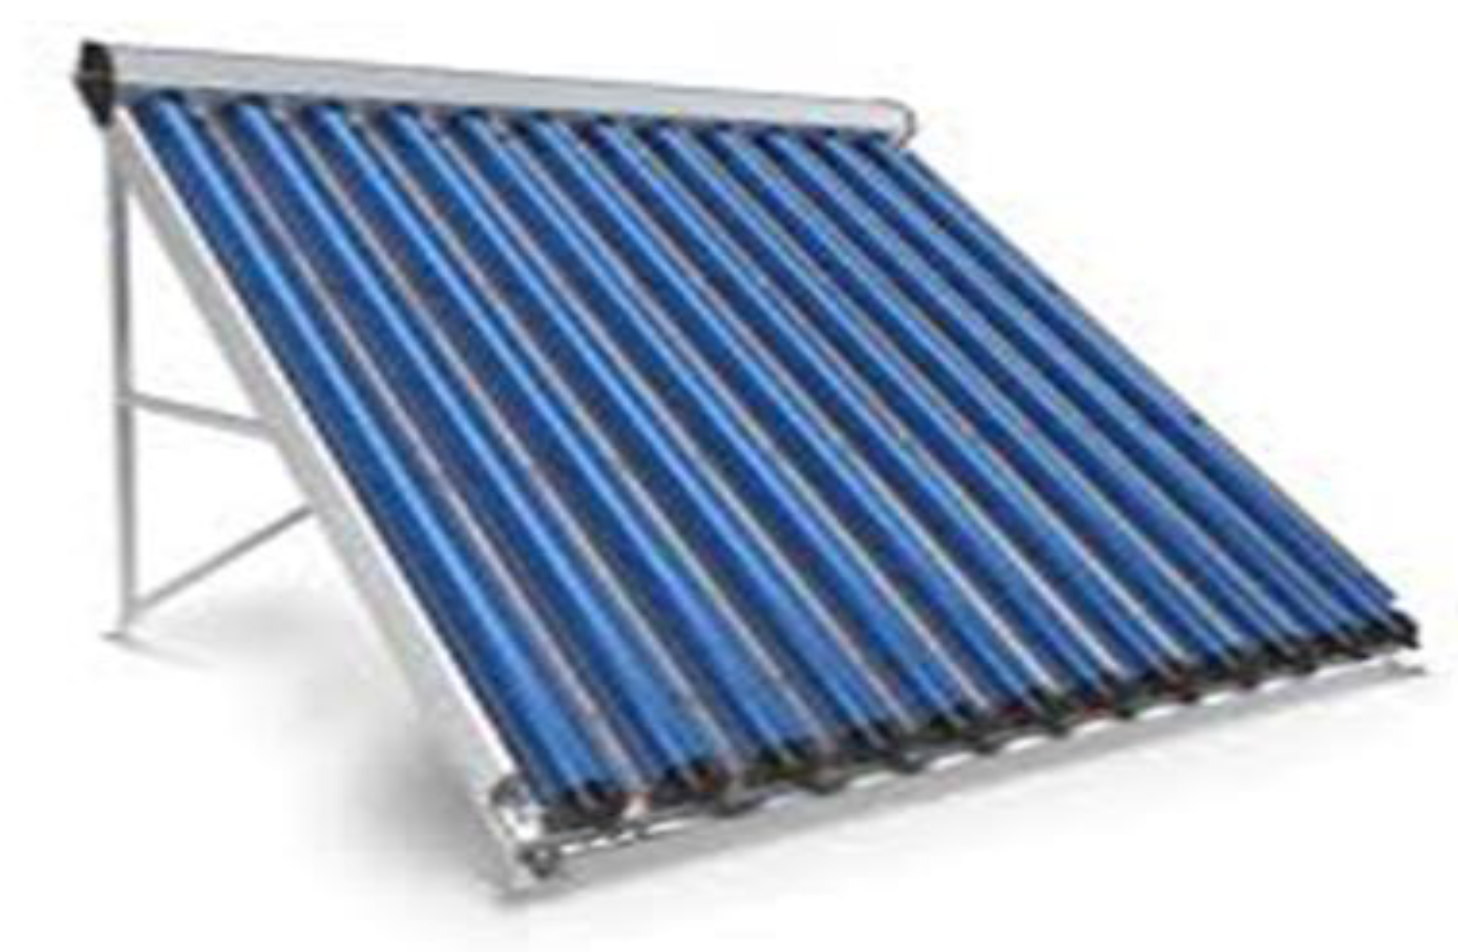
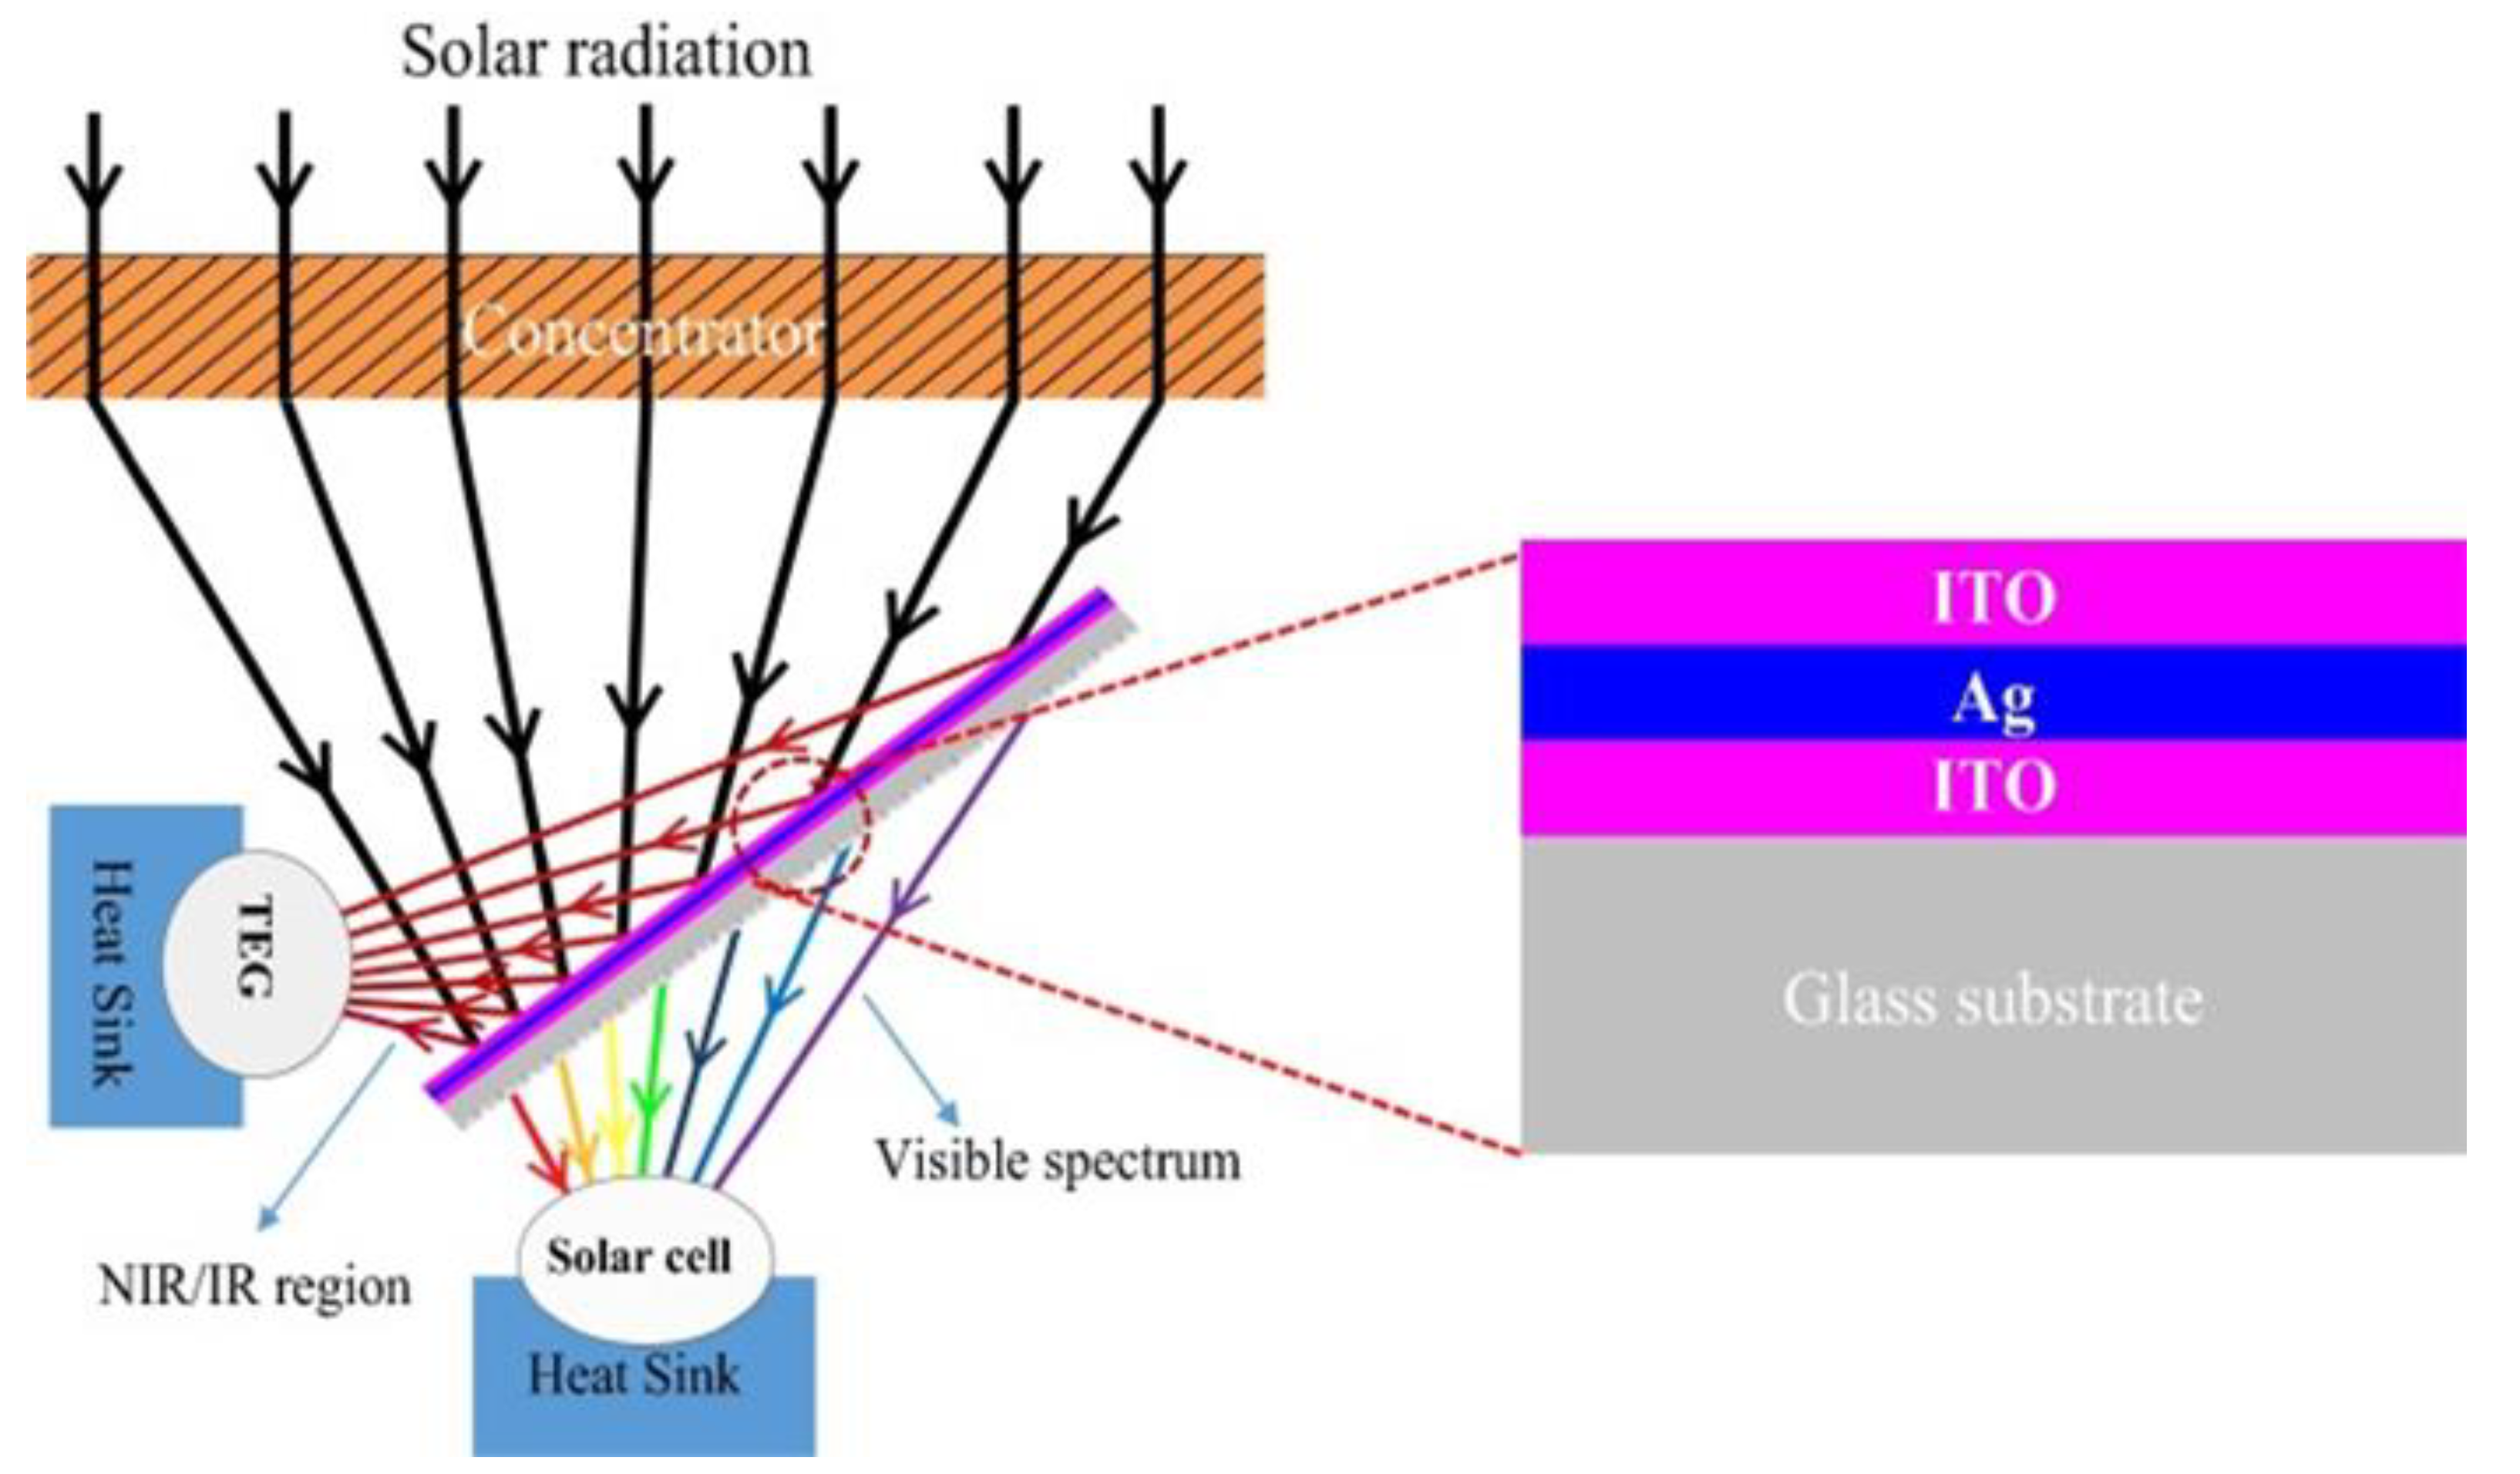
The heat for exchanger SOLAR is provided via solar energy through a solar collector module as shown in
Figure 5. The solar heat input is 600,000 Btu/hr. The Solar-FGRD process utilizes a novel solar beam splitter that can split sunlight into photovoltaic (500 <
λ <900 nm), infrared (
λ >900 nm), and higher-energy (
λ<500 nm) spectrums.
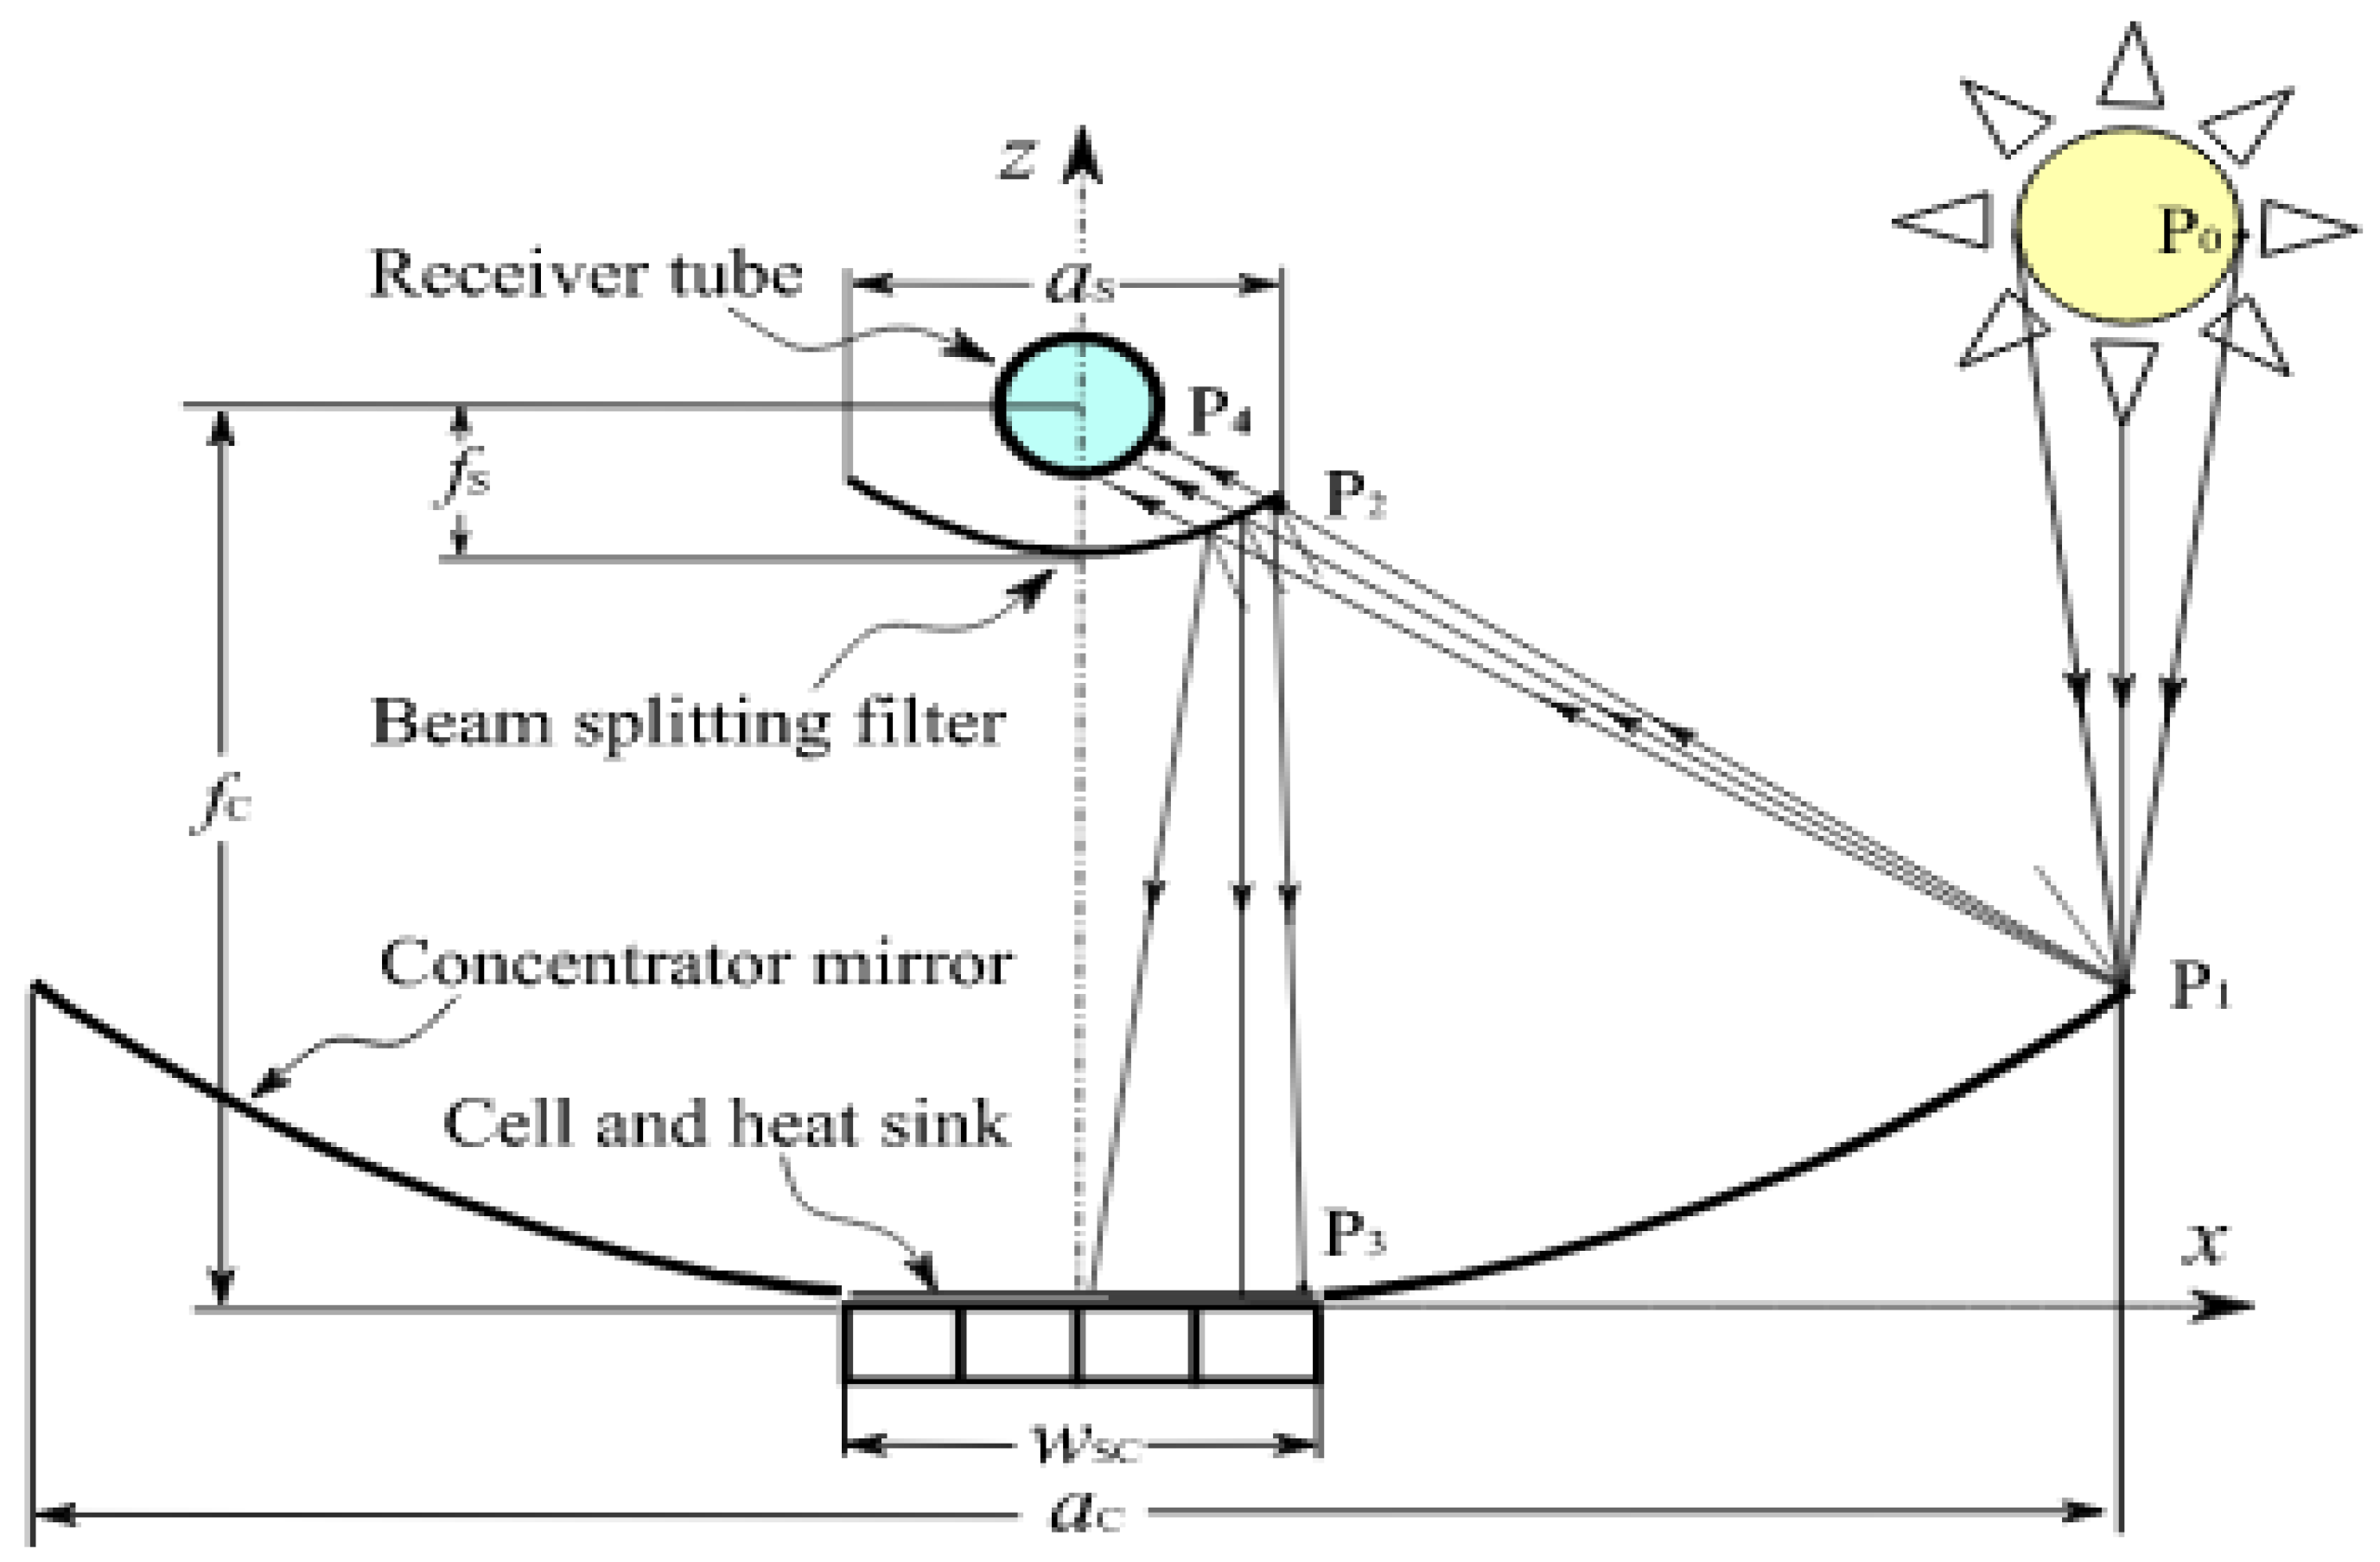
Figure 6 and
Figure 7 illustrate the novel two-stage solar beam splitter technology [
18].
2.2. Financial and Economic Feasibility Analysis
2.2.1. Aspen Process Economic Analyzer (APEA)
Aspen Process Economic Analyzer (APEA) was used to evaluate total capital cost, total operating cost, total raw material cost, and total product sales [
21]. We further investigated several investment evaluation tools: cash flow, net present value (NPV), and payback period (PBP) [
22,
23,
24,
25,
26,
27,
28,
29].
2.2.2. Cash Flow
Cash flow tables were constructed for a project period of 20 years. Cash flows are determined from design capacity, sales, capital costs, working capital, total operating cost, taxes, & interest payments. These tables also present cumulative cash flow, present value, and present worth factor [
23].
2.2.3. Net Present Value (NPV)
The NPV measures the profitability of a project or investment by assessing the difference between the present value of expected cash inflows and the present value of cash outflows over the investment’s time horizon. A positive NPV, as shown in Equation (1), indicates a potentially profitable investment, while a negative NPV suggests that the investment may not be financially viable [
24,
25,
28].
where Rt = Net cash flow (in–out flows) during a single period t;
i = discount rate;
t = number of time periods.
2.2.4. The Payback Period (PBP)
The PBP method is an important method for capital budgeting or investment decision-making as it gives a more accurate approximation even with the non-uniform future cash flows, which is more likely in the real business world [
22,
27,
29]. PBP is the point in time when the cumulative net cash flow becomes positive:
Calculate the cumulative net cash flow for each year. Start from the beginning of the project and sum the net cash flows up to that year.
Identify the latest year, denoted as “n”, when the cumulative net cash flow becomes positive. This year is when the investment has been fully recovered.
To determine the exact point in the latest year n when the remaining original investment is paid back, use the following formula:
3. Results and Discussion
3.1. Solar Heater Integration
To preheat the feed-produced water stream by 35 °F (from 110 °F to 145 °F), the thermal energy required is 175.8 kW. Assuming average solar insolation of 6.37 kWh/m
2/day in the US Southwest [
19], and solar energy heat recovery of 40%, the total solar collector area required is 1656 m
2. The Solar-FGRD process requires 20 kW to power the facility and the solar photovoltaic module assumes a 15% efficiency. While the photovoltaic module with beam splitter captures the visible spectrum for power generation, the thermal module captures the rest of the spectrum (~40%) for intake water pre-heating. The photovoltaic module area will match the solar collector area of 1655.9 m
2. The total excess photovoltaic electricity generated is 0.035 MW, which can be sold to the power grid as a revenue stream. The Solar-FGRD process requires 0.614 acres of the total area to install the plant and associated solar modules.
Table 2 summarizes the solar thermal and photovoltaic calculations.
3.2. Salt Sensitivity Analysis
The base case produced water TDS concentration is 131,260 mg/L, with 28.9 % Na
+, 9.6% Ca
2+, and 61.5% Cl
-. The base case TDS concentration results in 76.8% potable water recovery, by volume. The TDS concentration was varied according to
Figure 2, which illustrates the typical variance in produced water salinity.
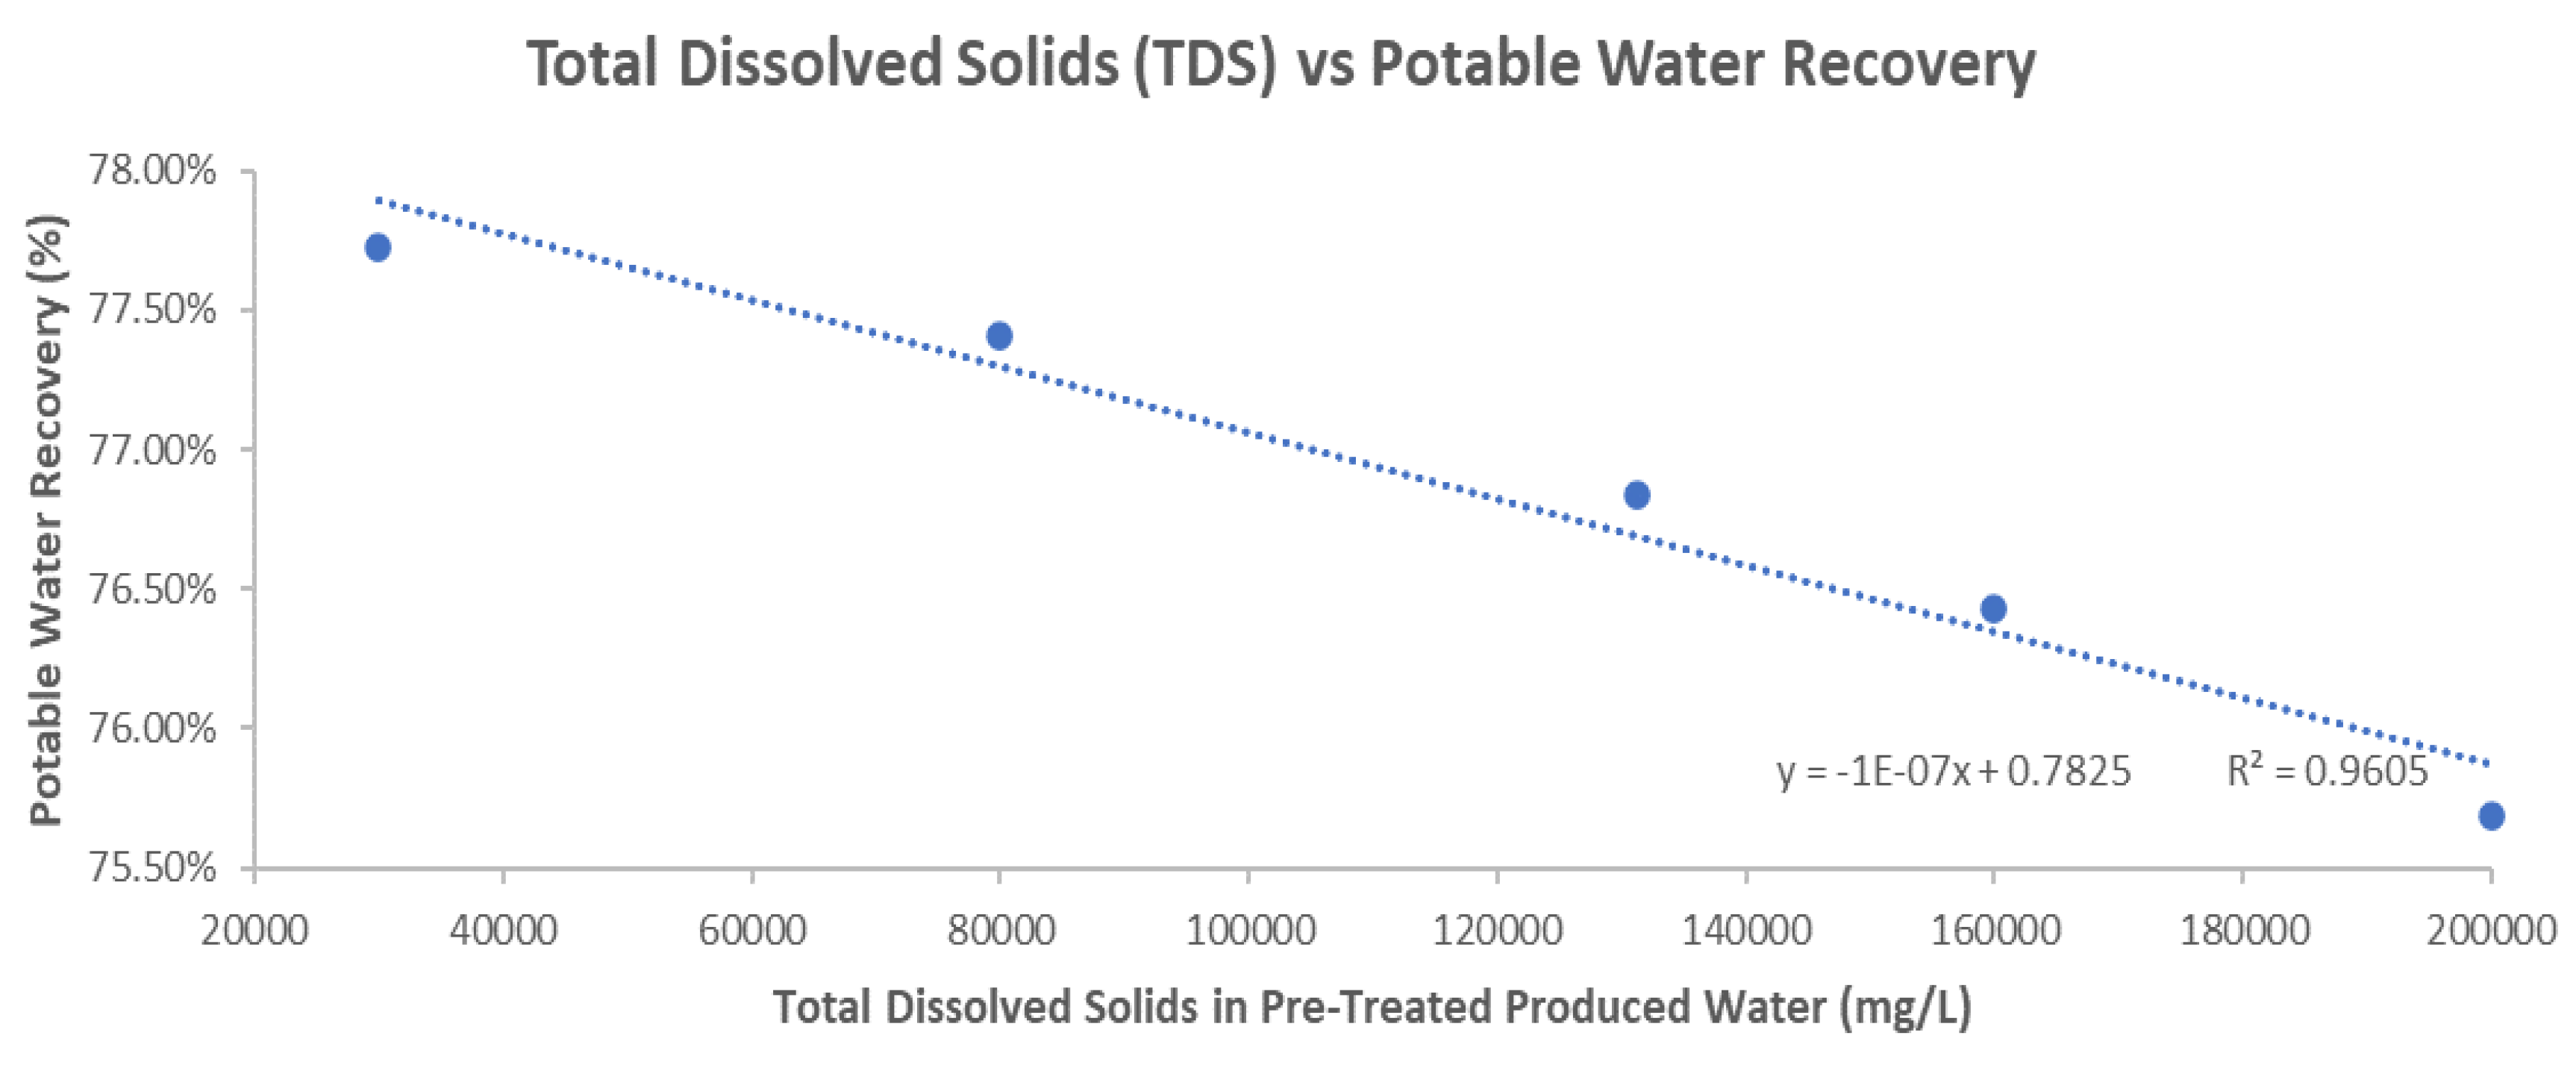
Table 3 and
Figure 8 below demonstrate the capability of the Solar-FGRD process in handling various TDS concentrations as well as the resulting potable water recovery, which varies between 75.7-77.7%.
3.3. Financial and Economic Evaluation
In this section, we demonstrate the financial-economic feasibility of investment providing a comprehensive financial analysis including the best case, base case, and the worst-case scenarios. As shown in
Table 4, the base case Solar-FGRD process generates
$1,495,168/yr revenue through sales of potable/distilled water and excess solar electricity. Since the 20-year Net Present Value (NPV) is -
$1,546,510, a tax credit is required for the base case to deem the project feasible to pursue. The annual cash flow is
$42,993. As shown in
Table 5, the NPV at year 20 is negative and the payback period for the project exceeds 20 years. Assumptions of the base case financial model include total investment of
$5,099,096 (40% equity and 60% loan), 0% down payment on loan, 6% interest rate,
$0.1/gal distilled water sales price,
$0.06/kWh electricity sales price, and
$1.75/bbl brine water disposal cost.
Depending on project cash flows, revenues, and expenses, tax credits may or may not be needed for project feasibility.
Table 6 highlights multiple cases (base case, worst case, and best case) for consideration. A higher potable water recovery percentage leads to greater revenue, in terms of potable water sales, and lower costs, in terms of third-party brine disposal costs. The financial model in
Table 4 assumes a sales price of
$0.1/gal for distilled water for drinking out of city drinking fountains or bottled consumption. This distilled water sales stream is dependent on demand for an additional volume of water to add to a municipality’s current water supply. It is also likely that this sales price may be discounted if the water stream is used for general tap use at
$0.024/gal (Current Water and Sewer Rates, 2024), such as irrigation or cleaning (worst-case scenario), instead of drinking. For the best-case scenario, the assumption for sales price is
$0.2/gal for distilled drinking water. A market analysis of distilled water in Southwestern USA is being conducted to quantify the risk of receiving a discounted sales price for distilled water intended for drinking.
The tax credit is not needed for the best case but has to be provided for the base case and the worst-case scenarios. For the base case, $134,831.75/yr tax credit is provided for the proposed process, that is equivalent to 0.175 cent/kg for water conservation, 0.226 cent/kg for flare gas reduction, or $54.3/m^2/yr. for solar panel installation.
The cash flow and payback period are also determined by the capital cost and annual operating cost, which have currently been estimated in the financial model. The best-case scenario of cash flows and the payback period is demonstrated in
Table 7.
3.4. Environmental Impacts
The environmental impacts of the Solar-FGRD process are given in terms of greenhouse gases and wastewater streams reduction.
Greenhouse Gases (GHG)
The Solar-FGRD process burner combustion efficiency is 99.8%, in contrast with the typical well-maintained flare combustion efficiency (CE) of 98% (e.g., North Sea) and a CE of 80% observed in the Texas/North Dakota oil & gas fields. [
7,
8]. CE is defined as the hydrocarbon conversion to CO2:
Another representation of the flare efficiency is the destruction and removal efficiency (DRE) as defined by each hydrocarbon species flared such as methane and ethane. DRE is referred to a particular parent compound in the fuel. For methane,
With the Solar-FGRD’s burner design and well-controlled operating temperatures, DRE of 99.99% can be achieved for methane, ethane, and propane. DRE of 98% for hydrocarbons can be realized for the same light hydrocarbons by flares operated under conditions representative of good industrial operating practices [
6]. However, the open-air flaring in oil and gas fields is often unassisted and unattended and often results in a lower DRE. For example, the University of Michigan F3UEL project sampled flares in the Permian Basin, the Eagle Ford Shale, and the Bakken Formations from a Scientific Aviation Mooney aircraft, DRE of methane was found to be 91% on average. The contributing factors include inefficient flaring (as low as ~60% DRE caused by windy conditions, insufficient air mixing, or malfunction), or even unlit flares (3-5%) [
3,
4,
5,
7].
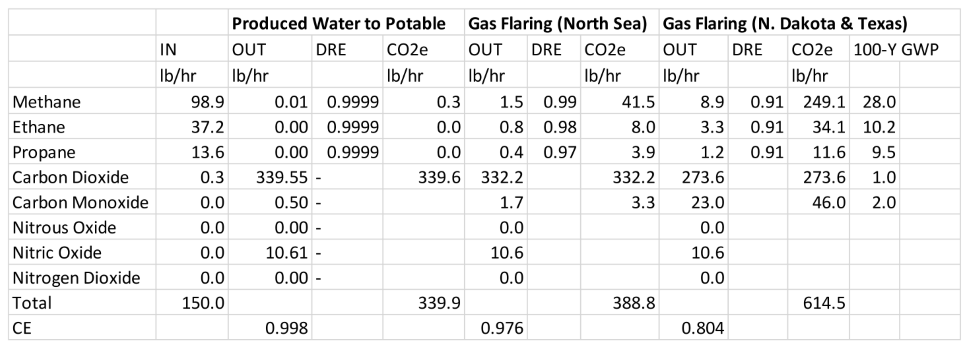
Table 8 summarizes the speciated greenhouse gas emissions of these three scenarios: solar-FGRD vs. open-air flaring in North Sea and the US.
The greenhouse gas (GHG) emissions for CO2 and unburnt hydrocarbons in terms of CO2 equivalent (CO2e) are given in
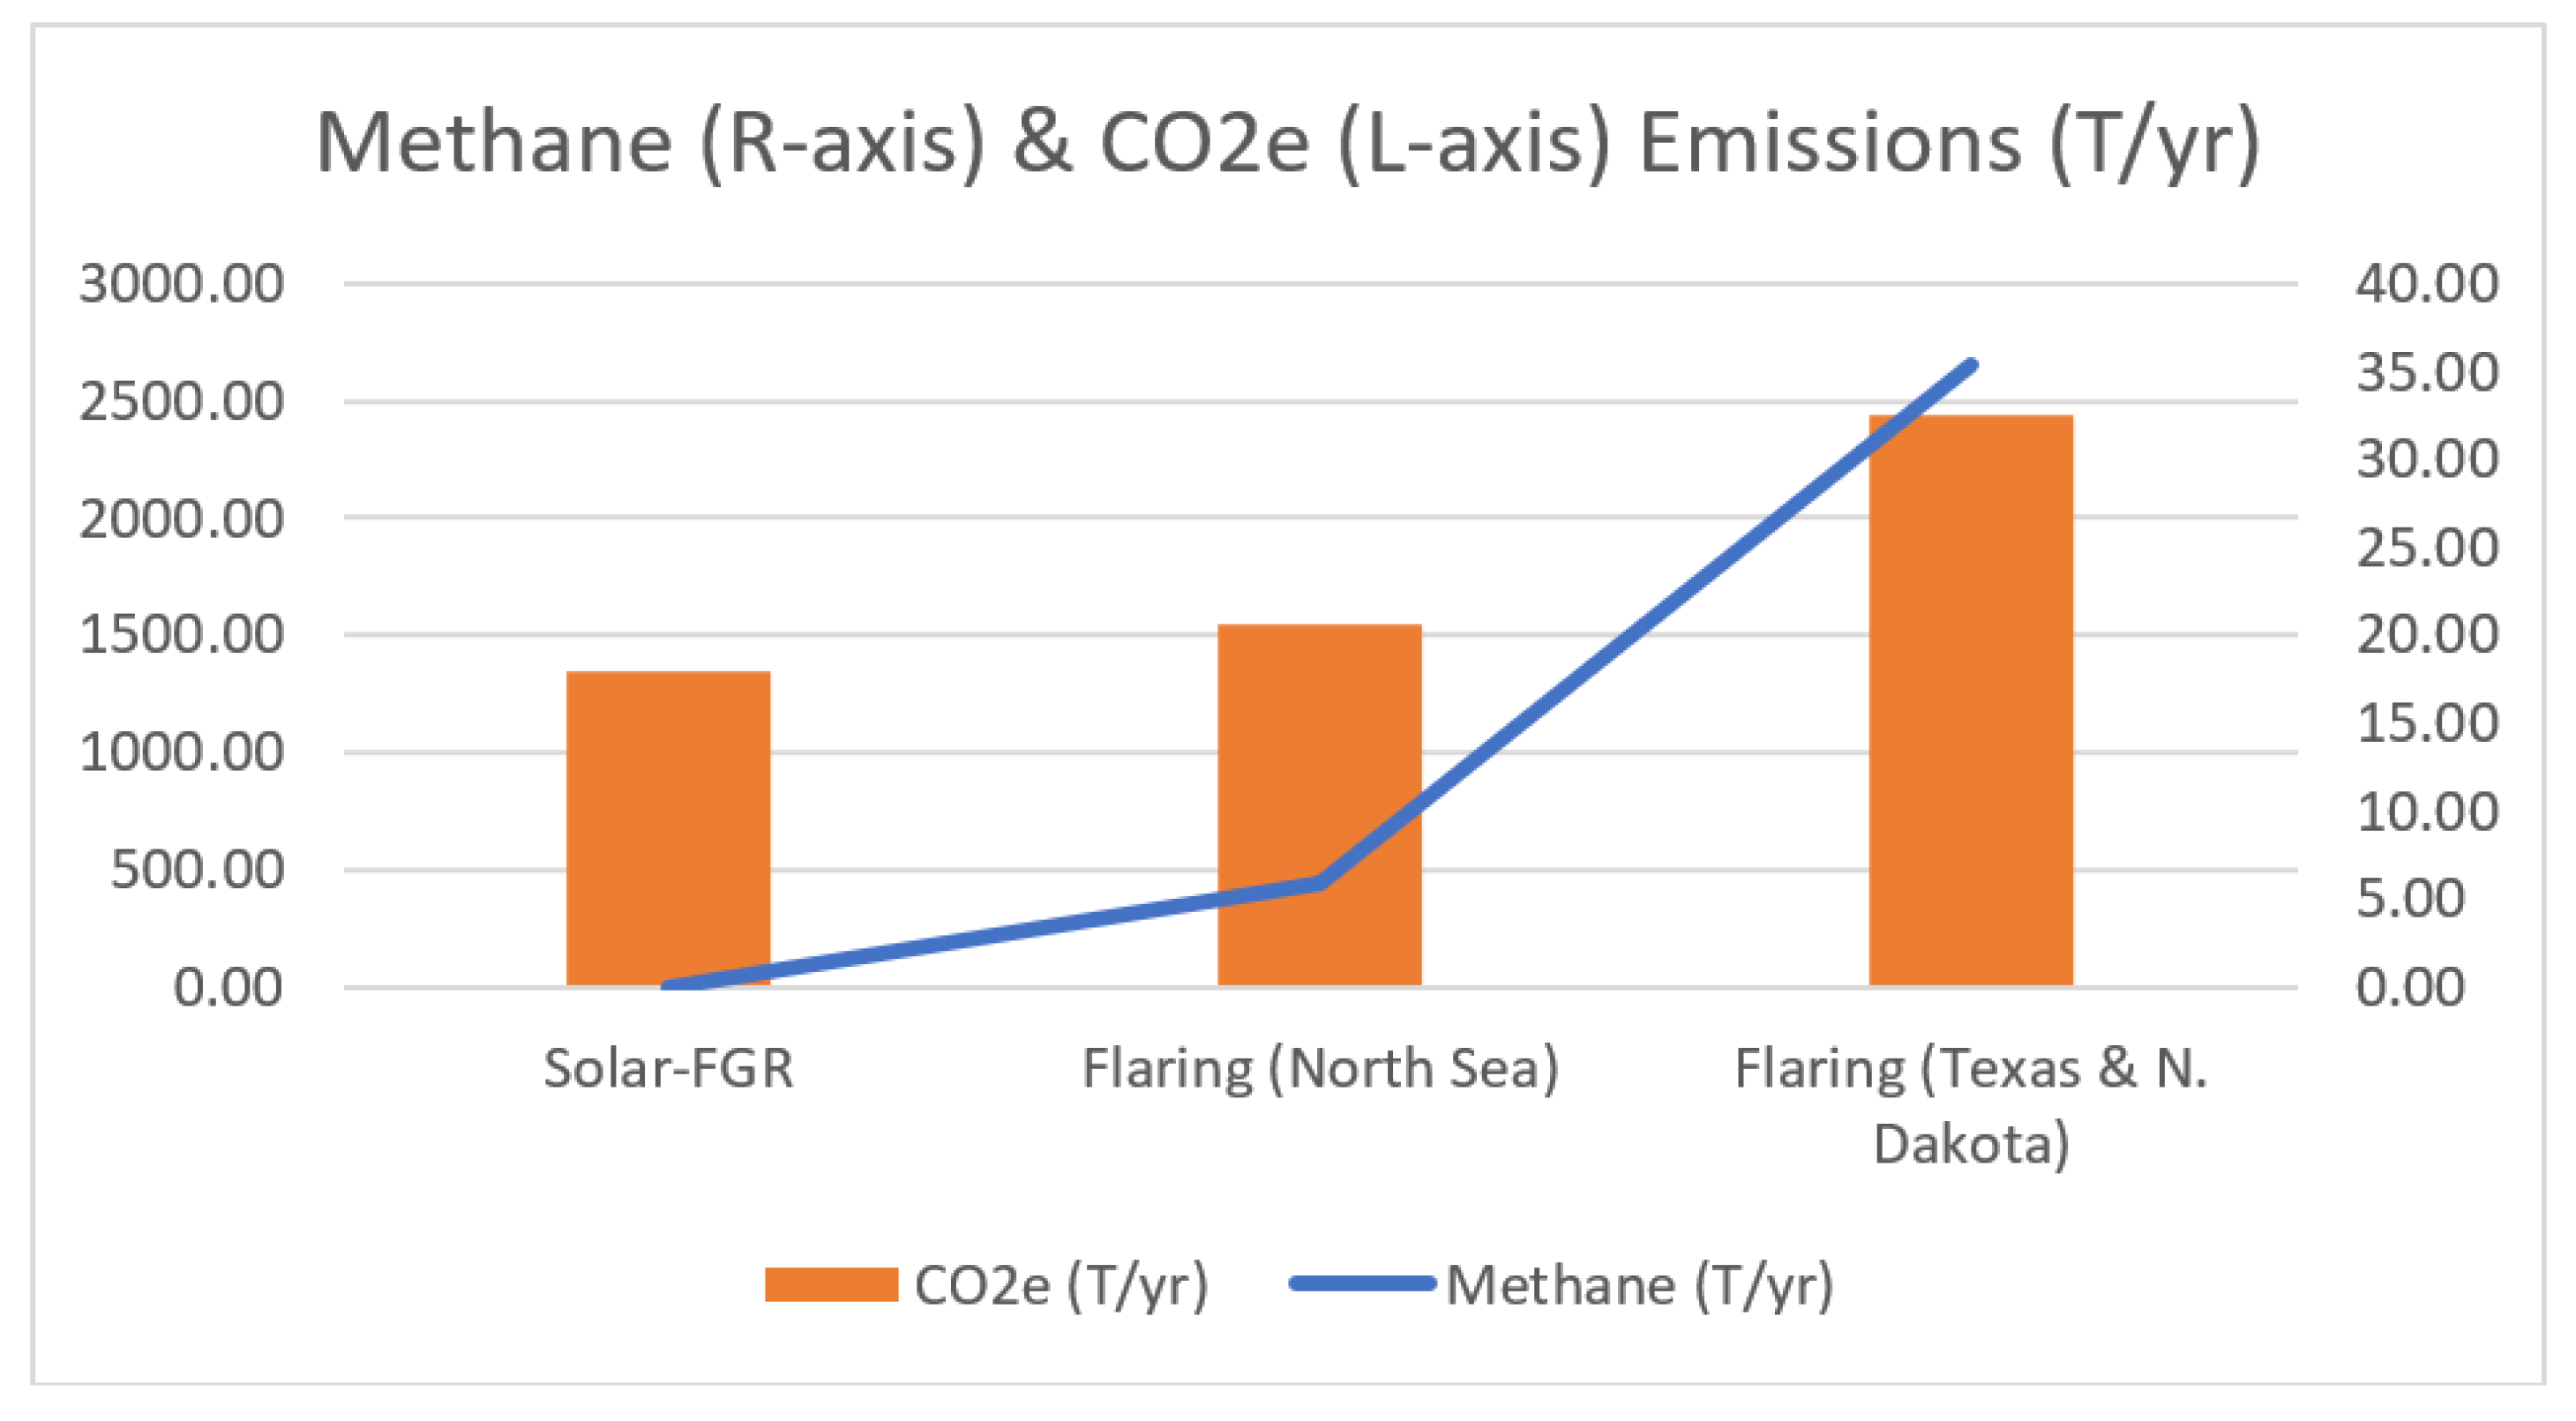
Table 9. CO2e changes from 2442 metric ton per year (T/yr., North Dokota & Texas, USA) and 1545 T/yr (North Sea) to 1351 T/yr for the Solar-FGRD process. This represents a 45% and 13% CO2e reduction.
Figure 9 shows the methane (line) and CO2e (column) emissions for the above- mentioned three scenarios.
Potable Water Recovery and Brine Reduction
The Solar-FGRD process also recovers 77% of produced water as potable water for sale or reuse,
Table 10. Without flare gas recovery, 52.2 bbl/hr of produced water would need to be disposed of underground versus 12.1 bbl/hr with the Solar-FGRD process. In comparison, the prior FGR-TVG and FGR-ETVG processes reduce brine disposal by 36% [
11,
13].
4. Conclusions
The Solar-Flare Gas Recovery-Desalination (Solar-FGRD) Process can desalinate pre-treated produced water with TDS between 30,000 – 200,000 mg/L. The process can achieve 76-78% potable water recovery with 0 mg/L TDS, which is a revenue-generating distilled water product for drinking as well as irrigation, cleaning, & household use. As such, it reduces brine disposal volume by 77%, from 52.2 bbl/hr to 12.1 bbl/hr, compared to Chen et al. & Mazumder et al.’s previous works (36%).
The photovoltaic module recovers ~100% of solar insolation with 15% photovoltaic efficiency for electricity generation and 40% recovered as thermal energy to pre-heat the produced water feed by 35 °F. The process eliminates reliance on the power grid for plant operations by generating excess solar power for sale which serves as a revenue stream.
The process burner combustion efficiency (CE) is 99.8%, in contrast with the well-maintained flare CE of 98% and some observed flare CE of 80%. In terms of the destruction and removal efficiency (DRE), the FGR burner has 99.99% DRE for light hydrocarbons such as methane whereas in flaring it can vary from 98±1% for well-maintained flares to ~91% for poorly maintained flares. The greenhouse gas (GHG) emissions for CO2 and unburnt hydrocarbons (i.e., methane) in terms of CO2 equivalent (CO2e) changes from 2442 metric ton per year (T/yr., North Dokota & Texas) or 1545 T/yr (North Sea) to 1351 T/yr for the Solar-FGRD process. This represents a 45% and 13% CO2e reduction.
The comprehensive base case financial analysis demonstrates the financial-economic feasibility of the investment project. Best-case and worst-case scenarios provide a realistic range that investors can consider before making investment decisions. The cash flow and payback period are also determined by the capital cost and annual operating cost. Depending on project cash flows, revenues, and expenses, tax credits may or may not be needed for project feasibility. The tax credit is not needed for the best case, which has a payback period of 0.8 year. Tax credit must be provided for the base case and the worst-case scenarios. For the base case, $134,831.75/yr tax credit is required at the minimum for the proposed process with a payback period of 11.95 year.
Author Contributions
D.C.: Conceptualization, Funding acquisition, Methodology, Project administration, Supervision, Writing—review and editing. F.A.: Investigation, Methodology, Software, Validation, Visualization, Writing—Original draft. G.S.: Funding acquisition, Methodology, Writing—review and editing. All authors have read and agreed to the published version of the manuscript.
Funding
This work was supported by the Center for Midstream Management & Science (CMMS). CMMS was not involved in the study design, in the collection, analysis and interpretation of data, in the writing of the report, and in the decision to submit the article for publication.
Data Availability Statement
The original contributions presented in the study are included in the article/supplementary material, further inquiries can be directed to the corresponding author.
Conflicts of Interest
The authors declare no conflicts of interest.
References
- Allen, D.T., and V.M. Torres. 2011. TCEQ 2010 Flare Study Final Report, Aug. 1, 2011, The University of Texas at Austin. Austin, Texas.
- Chen, D. & Alphones, A. (2019) Characterization of the incipient smoke point for steam-/air-assisted and non-assisted flares, Journal of the Air & Waste Management Association, 69:1, 119-130. [CrossRef]
- Gorchov Negron, A. M., Kort, E. A., Plant, G., Brandt, A. R., Chen, Y., Hausman, C. and Smith, M. L., Measurement-based carbon intensity of US offshore oil and gas production, 2024 Environ. Res. Lett. 19 064027. [CrossRef]
- Graham Sustainability Institute, University of Michigan, Quantifying Undercounted O&G Emissions and Identifying Mitigation Opportunities, https://graham.umich.edu/f3uel, accessed September 6, 2024.
- IPCC, Working Group I: The Scientific Basis https://archive.ipcc.ch/ipccreports/tar/wg1/249.htm#:~:text=Table%206.9%20shows%20that%20the,estimated%20at%202.8%20to%2010. Accessed September 7, 2024.
- McDaniel, M. Flare Efficiency Study. Washington: U.S. Environmental Protection Agency, 1983.
- Plant, G., Kort, E. A., Brandt, A. R., Chen, Y., and Zavala-Araiza, D. ”Inefficient and unlit natural gas flares both emit large quantities of methane,” Science, 29 Sep 2022, Vol 377, Issue 6614, pp. 1566-1571. [CrossRef]
- Shaw, J. T. , Foulds, A., Wilde, S., Barker, P., Squires, F. A., Lee, J., et.al., “Flaring efficiencies and NOx emission ratios measured for offshore oil and gas facilities in the North Sea,” Atmos. Chem. Phys., 23, 1491–1509, 2023. [CrossRef]
- Vijaya Durga Damodara, Arokiaraj Alphones, Daniel H. Chen, Helen H. Lou, Christopher Martin, Xianchang Li, “Flare performance modeling and set point determination using artificial neural networks,” International Journal of Energy and Environmental Engineering, August 13, 2019. [CrossRef]
- The World Bank, Global Gas Flaring Reduction Partnership (GGFR), Methane Flaring Toolkit, https://www.worldbank.org/en/programs/gasflaringreduction/publication/methane-flaring-toolkit.
- Accessed September 7, 2024.
- Chen, L., Xu, Q., Gossage, J. L., Lou, H. H., (2016) “Simulation and Economic Evaluation of a Coupled Thermal Vapor Compression Desalination Process for Produced Water Management,” Journal of Natural Gas Science and Engineering, 2016, Volume 36, Part A, pp. 442-453. https://www.sciencedirect.com/science/article/pii/S1875510016307958?via%3Dihub.
- Dinani, A. M., Nassaji, A., Hamzehlouyan, T., “An optimized economic-environmental model for a proposed flare gas recovery system,” Energy Reports, Volume 9, December 2023, Pages 2921-2934. [CrossRef]
- Mazumder, M. , Chen, L., Xu, Q., (2019) “Integrated Ejector-Based Flare Gas Recovery and On-Site Desalination of Produced Water in Shale Gas Production,” Chemical Engineering Technology, Volume 43, Issue 2, pp. 200-210. [CrossRef]
- Midland Texas, “Current Water and Sewer Rates”. Accessed September 7, 2024, https://www.midlandtexas.gov/505/Current-Water-and-Sewer-Rates.
- Richmond, P. C. , Chen, L., Tomson, R., Sustainable Water Management and Technologies: Sustainable Water Technologies, Volume 2, ed. Daniel Chen (Boca Raton: CRC Press, 2016), 246.
- G. Seefeldt G. and D. Hoon, D., Ejector Technology for Efficient and Cost Effective Flare Gas Recovery, Proc. of the GPA-GCC 24th Annual Technical Conf., Kuwait City 2016.
- Aspentech, Aspen Plus. 2024. Available online: https://www.aspentech.com/en/products/engineering/aspen-plus (accessed on 27 January 2024).
- Jiang, S. et al., "Optical modeling for a two-stage parabolic trough concentrating photovoltaic/thermal system using spectral beam splitting technology," Sep. 2010, Solar Energy Materials and Solar Cells 94 (10): pp. 1686-1696.
- National Renewable Energy laboratory, Solar Resource Maps and Data, https://www.nrel.gov/gis/solar-resource-maps.html.
- National Renewable Energy Laboratory. PVWatts Calculator, https://pvwatts.nrel.gov/, Accessed September 7, 2024.
- Aspentech, Aspen Process Economic Analyzer, https://www.aspentech.com/en/products/engineering/aspen-process-economic-analyzer, Accessed September 10, 2024.
- Al-Ani, M. K. (2015). A strategic framework to use payback period in evaluating the capital budgeting in energy and oil and gas sectors in Oman. International journal of economics and financial issues, 5(2), 469-475.
- Fernando, J. Discounted Cash Flow (DCF) Explained with Formula and Examples. Investopedia, 2024. Available online: https://www.investopedia.com/terms/d/dcf.asp (accessed on September 9, 2024).
- Fernando, J. Net Present Value (NPV): What It Means and Steps to Calculate It. Investopedia, 2023. Available online: https://www.investopedia.com/terms/n/npv.asp (accessed on 27 January 2024).
- Gallo, A. (2014). A refresher on net present value. Harvard Business Review, 19.
- Ling, V. V. (2018). Financial analysis of oil fields development efficiency. Espacios, 39(12), 30-30.
- Longmore, D. R. (1989). The persistence of the Payback Method: a time-adjusted decision rule perspective. The Engineering Economist, 34(3), 185-194.
- San Ong, T., & Thum, C. H. (2013). Net present value and payback period for building integrated photovoltaic projects in Malaysia. International Journal of Academic Research in Business and Social Sciences, 3(2), 153.
- Zis, T., Angeloudis, P., Bell, M. G., & Psaraftis, H. N. (2016). Payback period for emissions abatement alternatives: role of regulation and fuel prices. Transportation Research Record, 2549(1), 37-44.
Figure 1.
Produced water flow rate throughout well life.
Figure 1.
Produced water flow rate throughout well life.
Figure 2.
Total Dissolved Solids (TDS, mg/L or ppm) vs. Sample Percentile in typical produced water samples.
Figure 2.
Total Dissolved Solids (TDS, mg/L or ppm) vs. Sample Percentile in typical produced water samples.
Figure 3.
Aspen Plus simulation for the Solar-FGRD process with improved heat integration.
Figure 3.
Aspen Plus simulation for the Solar-FGRD process with improved heat integration.
Figure 4.
Combustion reactions in BURNER.
Figure 4.
Combustion reactions in BURNER.
Figure 5.
Solar collector module for produced water preheat.
Figure 5.
Solar collector module for produced water preheat.
Figure 6.
Two-stage parabolic trough concentrating photovoltaic/thermal system with a spectral beam splitter.
Figure 6.
Two-stage parabolic trough concentrating photovoltaic/thermal system with a spectral beam splitter.
Figure 7.
Solar concentrator and beam splitter into electromagnetic spectra.
Figure 7.
Solar concentrator and beam splitter into electromagnetic spectra.
Figure 8.
Percentage of potable water recovery via the Solar-FGRD process for various TDS concentrations.
Figure 8.
Percentage of potable water recovery via the Solar-FGRD process for various TDS concentrations.
Figure 9.
Comparison of methane and GHG (CO2e) emissions.
Figure 9.
Comparison of methane and GHG (CO2e) emissions.
Table 1.
Heat and material balance of the Solar-FGRD process.
Table 1.
Heat and material balance of the Solar-FGRD process.
| Stream |
Temperature |
Pressure |
Enthalpy Flow |
Mass Flow |
Volume Flow |
Mole vapor fraction |
| |
F |
psig |
Btu/hr |
lb/hr |
bbl/hr |
|
| AIR |
60.0 |
5 |
-14804 |
3507.1 |
- |
1.000 |
| BRINE |
80.0 |
30 |
-31680818 |
5956.7 |
12.5 |
0.000 |
| BRINE1 |
80.0 |
30 |
-31680818 |
5956.7 |
12.5 |
0.000 |
| BRINEHOT |
309.8 |
30 |
-30830429 |
5956.7 |
13.6 |
0.000 |
| FEED |
291.4 |
30 |
-113325111 |
20000.0 |
- |
0.589 |
| FEED1 |
144.6 |
30 |
-126325087 |
20000.0 |
53.2 |
0.000 |
| FLUEGAS |
320.0 |
0 |
-3148450 |
3657.1 |
- |
1.000 |
| FUELGAS |
60.0 |
50 |
-257062 |
150.0 |
- |
1.000 |
| HOTGAS |
2904.1 |
0 |
-271866 |
3657.1 |
- |
1.000 |
| INTAKE |
60.0 |
0 |
-127777647 |
20000.0 |
52.2 |
0.000 |
| INTAKE1 |
60.0 |
30 |
-127775476 |
20000.0 |
52.2 |
0.000 |
| LP-GAS |
57.7 |
20 |
-257062 |
150.0 |
- |
1.000 |
| POTABLE |
70.0 |
30 |
-95886918 |
14043.3 |
40.1 |
0.000 |
| POTABLE1 |
70.0 |
0 |
-95888587 |
14043.3 |
40.1 |
0.000 |
| POTABLEL |
212.0 |
0 |
-92617653 |
14043.3 |
6356.8 |
0.093 |
| POTABLEV |
309.8 |
30 |
-79617653 |
14043.3 |
- |
1.000 |
| PREHEAT |
109.6 |
30 |
-126925087 |
20000.0 |
52.7 |
0.000 |
| WATERHOT |
309.8 |
30 |
-110448527 |
20000.0 |
- |
0.739 |
Table 2.
Solar thermal and photovoltaic calculations.
Table 2.
Solar thermal and photovoltaic calculations.
| Solar Insolation Permian Basin |
|
| Total Solar Insolation (kWh/m2/day) |
6.37 |
| Total Solar Insolation (kWh/m2/year) |
2,325.05 |
| |
|
| Solar Collector/Water Heater |
|
| Solar Preheater ΔT (°F) |
35 |
| Water Flow Rate (bbl/day) |
1254 |
| Solar Preheater Thermal Energy Required (kW) |
176 |
| Solar Preheater Thermal Energy Required (kWh/yr) |
1,540,008 |
| Solar Energy Heat Recovery |
40% |
| Thermal Solar Insolation (kWh/m2/yr) |
930 |
| Solar Collector Efficiency |
40% |
| Solar Collector Area Required (m2) |
1,656 |
| |
|
| Solar Farm Area |
|
| Gross Area Required (m2) |
2484 |
| Gross Area Required (acres) |
0.61 |
| |
|
| Photovoltaic Module |
|
| Electrical Energy Required (kW) |
20 |
| Electrical Energy Required AC (kWh/yr) |
175,200 |
| Photovoltaic Module Efficiency |
15% |
| Electrical Solar Insolation (kWh/m2/year) |
2,325 |
| Photovoltaic Module Area (m2) |
1,656 |
| Inverter DC/AC Ratio |
1.2 |
| Photovoltaic Electricity Generated DC (kWh/yr) |
577,503 |
| Photovoltaic Electricity Generated AC (kWh/yr) |
481,253 |
| Excess Photovoltaic Electricity Generated AC (kWh/yr) |
306,053 |
| Excess Photovoltaic Electricity Generated AC (MW) |
0.03 |
Table 3.
Potable water recovery as a function of produced water TDS concentration.
Table 3.
Potable water recovery as a function of produced water TDS concentration.
| Produced water feed |
Potable water stream |
Brine |
Potable Water Recovery |
| density |
TDS |
mass flow |
volume flow |
density |
mass flow |
volume flow |
density |
mass flow |
volume flow |
|
| kg/m3
|
mg/L |
kg/hr |
bbl/hr |
kg/m3
|
kg/hr |
bbl/hr |
kg/m3
|
kg/hr |
bbl/hr |
|
| 1021.27 |
30000 |
8481.5 |
52.2374796 |
998.18 |
6443.5 |
40.603 |
1074.642 |
2628.4 |
15.384 |
77.73% |
| 1056.82 |
80000 |
8776.7 |
52.2374796 |
998.18 |
6417.0 |
40.436 |
1211.498 |
2654.8 |
13.784 |
77.41% |
| 1092.32 |
131260 |
9071.6 |
52.2374796 |
998.18 |
6370.0 |
40.140 |
1362.269 |
2701.9 |
12.475 |
76.84% |
| 1111.92 |
160000 |
9234.4 |
52.2374796 |
998.18 |
6335.4 |
39.922 |
1450.398 |
2736.4 |
11.867 |
76.42% |
| 1138.90 |
200000 |
9071.8 |
52.2374796 |
998.18 |
6274.1 |
39.536 |
1574.194 |
2797.8 |
11.179 |
75.68% |
Table 4.
The Solar-FGRD process financial model – base case.
Table 4.
The Solar-FGRD process financial model – base case.
| Assumptions |
|
|
| Capital Cost |
$5,000,000.00 |
|
| Working Capital |
$99,095.67 |
|
| Total Investment |
$5,099,095.67 |
|
| |
|
|
| Loan |
$3,059,457.40 |
60% |
| Equity |
$2,039,638.27 |
40% |
| |
|
|
| Annual Interest Rate |
6% |
|
| Loan Payback Years |
20 |
|
| Annual Loan Payment |
$263,026.84 |
|
| Down payment |
0% |
|
| Payments per Year |
12 |
|
| Operating Cycle |
1 |
months |
| Revenue |
|
|
| Produced Water Volume |
1254 |
bbl/day |
| Distilled Water Recovery |
76.84% |
|
| Distilled Water Volume |
963.34 |
bbl/day |
| Distilled Water Sales Price |
$0.10 |
$/gal |
| Distilled Water Sales |
$1,476,804.94 |
$/yr |
| |
|
|
| Solar Electricity Generated |
306052.5 |
kWh/yr |
| Electricity Sales Price |
$0.06 |
$/kWh |
| Electricity Sales |
$18,363.15 |
$/yr |
| |
|
|
| Total Annual Revenue |
$1,495,168.09 |
|
| |
|
|
| Tax Credits |
$0.00 |
$/yr |
| Cost |
|
|
| Produced Water Volume |
1254 |
bbl/day |
| Distilled Water Recovery |
76.84% |
|
| Brine Water Volume |
290.36 |
bbl/day |
| Brine Water Disposal Unit Cost |
$1.75 |
$/bbl |
| Brine Water Disposal Total Cost |
$185,465.48 |
$/yr |
| |
|
|
| Solar Area Required |
0.614 |
acre |
| Solar Farm Area Lease (1 acre) |
500 |
$/month |
| Solar Farm Lease Cost |
$3,682.57 |
$/yr |
| |
|
|
| Operating Cost |
$1,000,000.00 |
$/yr |
| Total Annual Cost |
$1,189,148.05 |
|
Table 5.
The Solar-FGRD process Cash Flows – base case.
Table 5.
The Solar-FGRD process Cash Flows – base case.
| Cash Flows |
|
|
|
| Year Count |
Cash Flow |
Present Value |
Present Worth Factor |
Cumulative Cash Flow |
| 0 |
($2,039,638.27) |
($2,039,638.27) |
1 |
($2,039,638.27) |
| 0 |
$0.00 |
$0.00 |
1 |
($2,039,638.27) |
| 1 |
$42,993.20 |
$40,559.63 |
0.943396226 |
($1,996,645.06) |
| 2 |
$42,993.20 |
$38,263.80 |
0.88999644 |
($1,953,651.86) |
| 3 |
$42,993.20 |
$36,097.92 |
0.839619283 |
($1,910,658.65) |
| 4 |
$42,993.20 |
$34,054.65 |
0.792093663 |
($1,867,665.45) |
| 5 |
$42,993.20 |
$32,127.02 |
0.747258173 |
($1,824,672.24) |
| 6 |
$42,993.20 |
$30,308.51 |
0.70496054 |
($1,781,679.04) |
| 7 |
$42,993.20 |
$28,592.94 |
0.665057114 |
($1,738,685.83) |
| 8 |
$42,993.20 |
$26,974.47 |
0.627412371 |
($1,695,692.63) |
| 9 |
$42,993.20 |
$25,447.61 |
0.591898464 |
($1,652,699.43) |
| 10 |
$42,993.20 |
$24,007.18 |
0.558394777 |
($1,609,706.22) |
| 11 |
$42,993.20 |
$22,648.28 |
0.526787525 |
($1,566,713.02) |
| 12 |
$42,993.20 |
$21,366.31 |
0.496969364 |
($1,523,719.81) |
| 13 |
$42,993.20 |
$20,156.89 |
0.468839022 |
($1,480,726.61) |
| 14 |
$42,993.20 |
$19,015.94 |
0.442300964 |
($1,437,733.40) |
| 15 |
$42,993.20 |
$17,939.56 |
0.417265061 |
($1,394,740.20) |
| 16 |
$42,993.20 |
$16,924.12 |
0.393646284 |
($1,351,746.99) |
| 17 |
$42,993.20 |
$15,966.15 |
0.371364419 |
($1,308,753.79) |
| 18 |
$42,993.20 |
$15,062.40 |
0.350343791 |
($1,265,760.58) |
| 19 |
$42,993.20 |
$14,209.81 |
0.33051301 |
($1,222,767.38) |
| 20 |
$42,993.20 |
$13,405.48 |
0.311804727 |
($1,179,774.17) |
| |
|
|
|
|
| |
NPV@Yr 20 |
($1,546,509.60) |
|
|
| |
|
|
|
|
| |
Payback Period |
>20 |
years |
|
Table 6.
The Solar-FGRD process Financial Sensitivity Study.
Table 6.
The Solar-FGRD process Financial Sensitivity Study.
| |
Base Case |
Worst Case |
Best Case |
| Capital Cost |
$5,000,000 |
$7,000,000 |
$3,000,000 |
| Annual Interest Rate |
6% |
7% |
5% |
| Loan/Equity |
60%/40% |
60%/40% |
60%/40% |
| Annual Loan Payment |
$263,026.84 |
$396,282.33 |
$147,259.15 |
| Distilled Water Sales Price ($/gal) |
$0.10 |
$0.024 |
$0.20 |
| Brine Water Disposal Cost ($/bbl) |
$1.75 |
$1.75 |
$1.75 |
| Without Tax Credit |
| Annual Tax Credit |
$0.00 |
$0.00 |
$0.00 |
| Annual Cash Flow |
$42,993.20 |
($1,212,634.05) |
$1,635,565.83 |
| 20-Year NPV |
($1,546,509.60) |
($15,686,300.66) |
$19,143,127.17 |
| Pay Back Period |
- |
- |
0.80 |
| With Tax Credits (NPV = 0 for the base case) |
| Annual Tax Credit |
$134,831.75 |
$134,831.75 |
- |
| Annual Cash Flow |
$177,824.96 |
($1,077,802.30) |
- |
| 20-Year NPV |
$0.00 |
- |
- |
| Pay Back Period |
11.95 |
- |
- |
| With Tax Credits (NPV=0 for the worst case) |
| Annual Tax Credit |
$1,480,675.81 |
$1,480,675.81 |
- |
| Annual Cash Flow |
$1,523,669.01 |
$268,041.76 |
- |
| 20-Year NPV |
$15,436,725.24 |
$0.00 |
- |
| Pay Back Period |
1.34 |
11.25 |
- |
Table 7.
The Solar-FGRD process Cash Flows – best case.
Table 7.
The Solar-FGRD process Cash Flows – best case.
| Cash Flows |
|
|
|
| Year Count |
Cash Flow |
Present Value |
Present Worth Factor |
Cumulative Cash Flow |
| 0 |
($1,239,638.27) |
($1,239,638.27) |
1 |
($1,239,638.27) |
| 0 |
$0.00 |
$0.00 |
1 |
($1,239,638.27) |
| 1 |
$1,635,565.83 |
$1,557,681.75 |
0.952380952 |
$395,927.56 |
| 2 |
$1,635,565.83 |
$1,483,506.42 |
0.907029478 |
$2,031,493.40 |
| 3 |
$1,635,565.83 |
$1,412,863.26 |
0.863837599 |
$3,667,059.23 |
| 4 |
$1,635,565.83 |
$1,345,584.06 |
0.822702475 |
$5,302,625.06 |
| 5 |
$1,635,565.83 |
$1,281,508.63 |
0.783526166 |
$6,938,190.90 |
| 6 |
$1,635,565.83 |
$1,220,484.41 |
0.746215397 |
$8,573,756.73 |
| 7 |
$1,635,565.83 |
$1,162,366.10 |
0.71068133 |
$10,209,322.56 |
| 8 |
$1,635,565.83 |
$1,107,015.33 |
0.676839362 |
$11,844,888.39 |
| 9 |
$1,635,565.83 |
$1,054,300.32 |
0.644608916 |
$13,480,454.23 |
| 10 |
$1,635,565.83 |
$1,004,095.54 |
0.613913254 |
$15,116,020.06 |
| 11 |
$1,635,565.83 |
$956,281.47 |
0.584679289 |
$16,751,585.89 |
| 12 |
$1,635,565.83 |
$910,744.26 |
0.556837418 |
$18,387,151.73 |
| 13 |
$1,635,565.83 |
$867,375.48 |
0.530321351 |
$20,022,717.56 |
| 14 |
$1,635,565.83 |
$826,071.89 |
0.505067953 |
$21,658,283.39 |
| 15 |
$1,635,565.83 |
$786,735.13 |
0.481017098 |
$23,293,849.23 |
| 16 |
$1,635,565.83 |
$749,271.55 |
0.458111522 |
$24,929,415.06 |
| 17 |
$1,635,565.83 |
$713,591.96 |
0.436296688 |
$26,564,980.89 |
| 18 |
$1,635,565.83 |
$679,611.39 |
0.415520655 |
$28,200,546.72 |
| 19 |
$1,635,565.83 |
$647,248.94 |
0.395733957 |
$29,836,112.56 |
| 20 |
$1,635,565.83 |
$616,427.56 |
0.376889483 |
$31,471,678.39 |
| |
|
|
|
|
| |
NPV |
$19,143,127.17 |
|
|
| |
|
|
|
|
| |
Payback Period |
0.80 |
years |
|
Table 8.
Speciated GHG emissions: Solar-FGRD vs. flaring scenarios.
Table 8.
Speciated GHG emissions: Solar-FGRD vs. flaring scenarios.
Table 9.
Comparison of methane, carbon dioxide, and CO2 equivalent for the Solar-FGRD, North Sea flaring, and US flaring.
Table 9.
Comparison of methane, carbon dioxide, and CO2 equivalent for the Solar-FGRD, North Sea flaring, and US flaring.
| |
Solar-FGRD |
Flaring (North Sea) |
Flaring (Texas & N. Dakota) |
| Methane (T/yr) |
0.04 |
5.89 |
35.35 |
| CO2 (T/yr) |
1349.21 |
1319.81 |
1087.28 |
| CO2e (T/yr) |
1350.52 |
1545.05 |
2441.88 |
| Potential % Reduction |
|
13 |
45 |
Table 10.
Water recovery and brine reduction from the Solar-FGRD process.
Table 10.
Water recovery and brine reduction from the Solar-FGRD process.
| |
IN |
OUT |
Water Recovery/Brine Reduction |
| |
bbl/hr |
bbl/hr |
|
| Brine/produced water |
52.2 |
12.1 |
76.8% |
| Potable Water |
0 |
40.1 |
76.8% |
|
Disclaimer/Publisher’s Note: The statements, opinions and data contained in all publications are solely those of the individual author(s) and contributor(s) and not of MDPI and/or the editor(s). MDPI and/or the editor(s) disclaim responsibility for any injury to people or property resulting from any ideas, methods, instructions or products referred to in the content. |
© 2024 by the authors. Licensee MDPI, Basel, Switzerland. This article is an open access article distributed under the terms and conditions of the Creative Commons Attribution (CC BY) license (http://creativecommons.org/licenses/by/4.0/).

