1. Introduction
The crop area for outdoor sweet pepper in Spain as a whole is only around 28% of the same crop grown in greenhouses, although in some areas (Extremadura, Castilla La Mancha, Navarra) the outdoor version equates to 99% of the total surface (MAPA, 2022), and is acquiring increasing importance.
Several studies have been conducted on the effect of nitrogen (N) on greenhouse-cultivated sweet bell pepper (da Silva et al., 2020; Flores et al., 2007; Grasso et al., 2020; Medina-Lara et al., 2008; Rodríguez et al., 2020; Yasuor et al., 2013). Little, however, has been published on the response to N of outdoor sweet pepper cultivation and more information needs to be generated on the important influence of varieties and locations on the agronomic response of the crop. Saqib et al. (2023) demonstrated the difference shown by different cultivars at different N doses in outdoor peppers under semi-arid conditions. A study with environmental conditions similar to those of the Extremadura region was carried out by Sambo et al. (2004), but with an old cultivar (cv. Tolomeo) that was exposed to different N doses to analyze canopy reflectance and relate it to different N levels.
A decisive role is played by N in maximizing crop production (Ladha et al., 2020) due to its importance in photosynthesis-driven energy formation and plant growth (Ata-Ul-Karim et al., 2020; Evans & Clarke, 2019). Therefore, a common practice in intensive horticultural production to ensure the highest yields is over-fertilization, a practice which has been associated to nitrate leaching losses that result in groundwater contamination (Thompson et al., 2007). The excessive use of N fertilizers also increases soil N2O emissions, altering the global N balance over the last few decades (Galloway, 1998; Li et al., 2022). In addition to these important problems, the consumption of raw products with high nitrate content poses a risk for human health (Jaworska, 2005; Vega-Castellote et al., 2021). Excessive fertilization rates, low efficiency of crop N absorption and excessive irrigation (Fereres et al., 2003) are common practices in horticultural cropping systems (Neeteson, 1994; Thompson et al., 2007). In Spain, some areas of horticultural production have been declared ‘Vulnerable zones to agricultural nitrate pollution’ (Directive 91/676/EEC, 1991). Despite a compulsory Action Program that limits the amount of irrigation water, N fertilizer and manure that can be used, this Directive has not been as strictly applied in southern European countries as it has in northern European ones such as Belgium, Germany, Netherland or Denmark. Greater pressure from the EU to further reduce the nitrate pollution of surface and ground waters can be expected in the coming years. In addition to the increasing legislative pressure to reduce N losses to water bodies, vegetable growers are also subject to pressure from consumers who increasingly wish to purchase vegetable produce from non-contaminating production systems (Thompson et al., 2020).
The key to reducing the groundwater pollution caused by nitrate leaching or runoff is to clearly define the crop irrigation and N requirements (Biernbaum, 1992). For some vegetable crops, this information is scarce and more research is needed to ensure safe and sustainable production (Zhu et al., 2005). In summary, there is an urgent need to contrast efficient methods of irrigation and N management that are successful in open field vegetables in terms of reducing water and N losses and thereby minimizing surface and groundwater pollution, whilst at the same time maintaining crop yield. In addition, adjusting the dose to the specific requirements of the crop constitute an economic benefit for growers. The cost of N fertilizer has increased significantly in recent years, with a 300% price surge observed in 2021 (Chojnacka et al., 2022). This has highlighted the need for efficient and accurate management strategies to optimize the use of current N fertilizer. Such strategies require a dynamic understanding of crop N demand and supply (Li et al., 2022).
The design of an N fertilizer program is closely correlated to the plant’s nutrient absorption along the crop cycle. The process is complex, and the factors influencing nutrient availability to the plant and uptake are many and varied. These include weather conditions, the physical and chemical characteristics of the soil, and the influence of agronomic practices. Therefore, models try to integrate all these variables and simulate them to ensure that the plant has the necessary mineral elements at its disposal throughout the crop cycle. These models are interesting for research, academic purposes or to support farmers and technicians, depending on their complexity. Currently, a few tools are available for efficient fertilization management of vegetable crops, including EU-Rotate_N (Larsen et al., 2010), Azofert (MacHet et al., 2017), N-Expert 4 (Feller, 2015) and the VegSyst model (Gallardo et al., 2016). In order to support farmers more directly in optimizing fertilization patterns, the Vegsyst DSS (Decision Support System) was developed based on the VegSyst model (Gallardo et al., 2014), initially for greenhouse horticultural crops (Gallardo et al., 2011, 2016, 2017; Giménez et al., 2013) and later adapted to outdoor crops (Giménez et al., 2019). As a lot of crop data is needed for the development of these models, the continuous generation of relevant information is important.
A further beneficial addition to fertilizer recommendation systems is the incorporation of nutritional status indicators, which enable the verification of whether the objectives of the fertilization plan are being met. One proposed methodology to identify when a crop is in deficiency is the critical nitrogen curve (CNC). Specific CNCs have been determined for several crop species such as wheat (Justes et al., 1994), rice (Huang et al., 2018; Song et al., 2020), maize (Yue et al., 2014), potato (Abdallah et al., 2016; Giletto & Echeverría, 2012), processing tomato (Tei et al., 2002) greenhouse tomato (Padilla et al., 2015) or cucumber (Padilla et al., 2016). The nitrogen nutritional index (NNI) is derived from the CNC by relating the critical %N of the curve to the actual N content, which would indicate nutrient excesses and deficits.
The objectives of this study are: (i) to analyze the agronomic response (yield) of processing pepper under different N fertilization rates in the Extremadura environment; (ii) to obtain useful information to optimize the fertilization of outdoor pepper; and (iii) to generate useful information (CNC, relationship between canopy cover and photosynthetically active radiation (PAR), extinction coefficient) to support future crop simulation models, based on the requirements of the VegSyst model.
2. Materials and Methods
2.1. Experimental Setup
Three field experiments (2020, 2021 and 2022) were carried out in the experimental farm of Finca La Orden (CICYTEX, Badajoz, Spain, 38°51′24.1020″ N, 6°40′2.5´´ W, datum WGS84), which is similar to those of the intensive horticultural industry of the area. The sweet green pepper plants (Capsicum annuum L., cv. Ramonete Lamuyo) were transplanted in the three years by the middle of May in paired rows. There were 16 plots, from 4 treatments and 4 replicates, in 2020 and 2021, and 12 plots, from 3 treatments and 4 replicates, in 2022. Each single plot was 12x6 m and included 6 beds with two plant rows, and a plant density of 33000 plants/ha. The treatments were: N0 (without N fertilizer), N1 (60 kg N/ha), N2 (120 kg N/ha) and N3 (180 kg N/ha) for the 2020 and 2021 seasons, and N0 (without N fertilizer), N1 (200 kg N/ha) and N2 (300 kg N/ha) for 2022. Other macronutrients were applied at the same rate in all N treatments, 100 kg P2O5/ha, 150 kg K2O/ha, and 35 kg CaO/ha in the three years.
A fertigation system was used, placing the irrigation line in the middle of the paired rows. The distance between two consecutive lines was 1.5 m, with 0.3 m between emitters within the line. The emitters have a discharge flow rate of 1.1 l h-1. Irrigation scheduling was carried out by covering the crop water requirements calculated using the reference evapotranspiration (ETo) and the crop coefficient (Kc). Daily ETo and meteorological data were obtained from the nearest meteorological station of the irrigation advisory network of Extremadura (REDAREX) from a station located on the farm itself. The Kc used was from FAO56.
The soil is an Alfisol (Survey Staff, 1999), with a loamy texture (19.4% clay, 40.4% sand), pH of 7, low organic matter content (0.62%), high bulk density (1.41 g/cm3) and low cation exchange capacity (9.41 meq/100 g). The climate is Mediterranean, with a dry season from June to September. The average annual precipitation is 500 mm, 80% of which is concentrated from October to May.
2.2. Crop Measurements
2.2.1. Intercepted Photosynthetically Active Radiation (PAR)
The fraction of photosynthetically active radiation intercepted by the crop (fi-PAR) was determined at solar noon (Board et al., 1992; Egli, 1994) by measuring PAR above (PARa) and below (PARb) the canopy. PARb was measured by placing two ceptometers (Accupar LP-80) perpendicularly to the drip irrigation line, one at each side, covering the width of two crop lines. One measurement was the average of 10 readings, taken by moving the ceptometers every 10 cm along the line. At the same time, the PAR above the canopy (PARa) was recorded.
fi-PAR was then calculated as:
The measurement was carried out on several days throughout the growing cycle, selecting different stages of canopy ground cover at each session.
2.2.2. Fraction of Crop Ground Cover
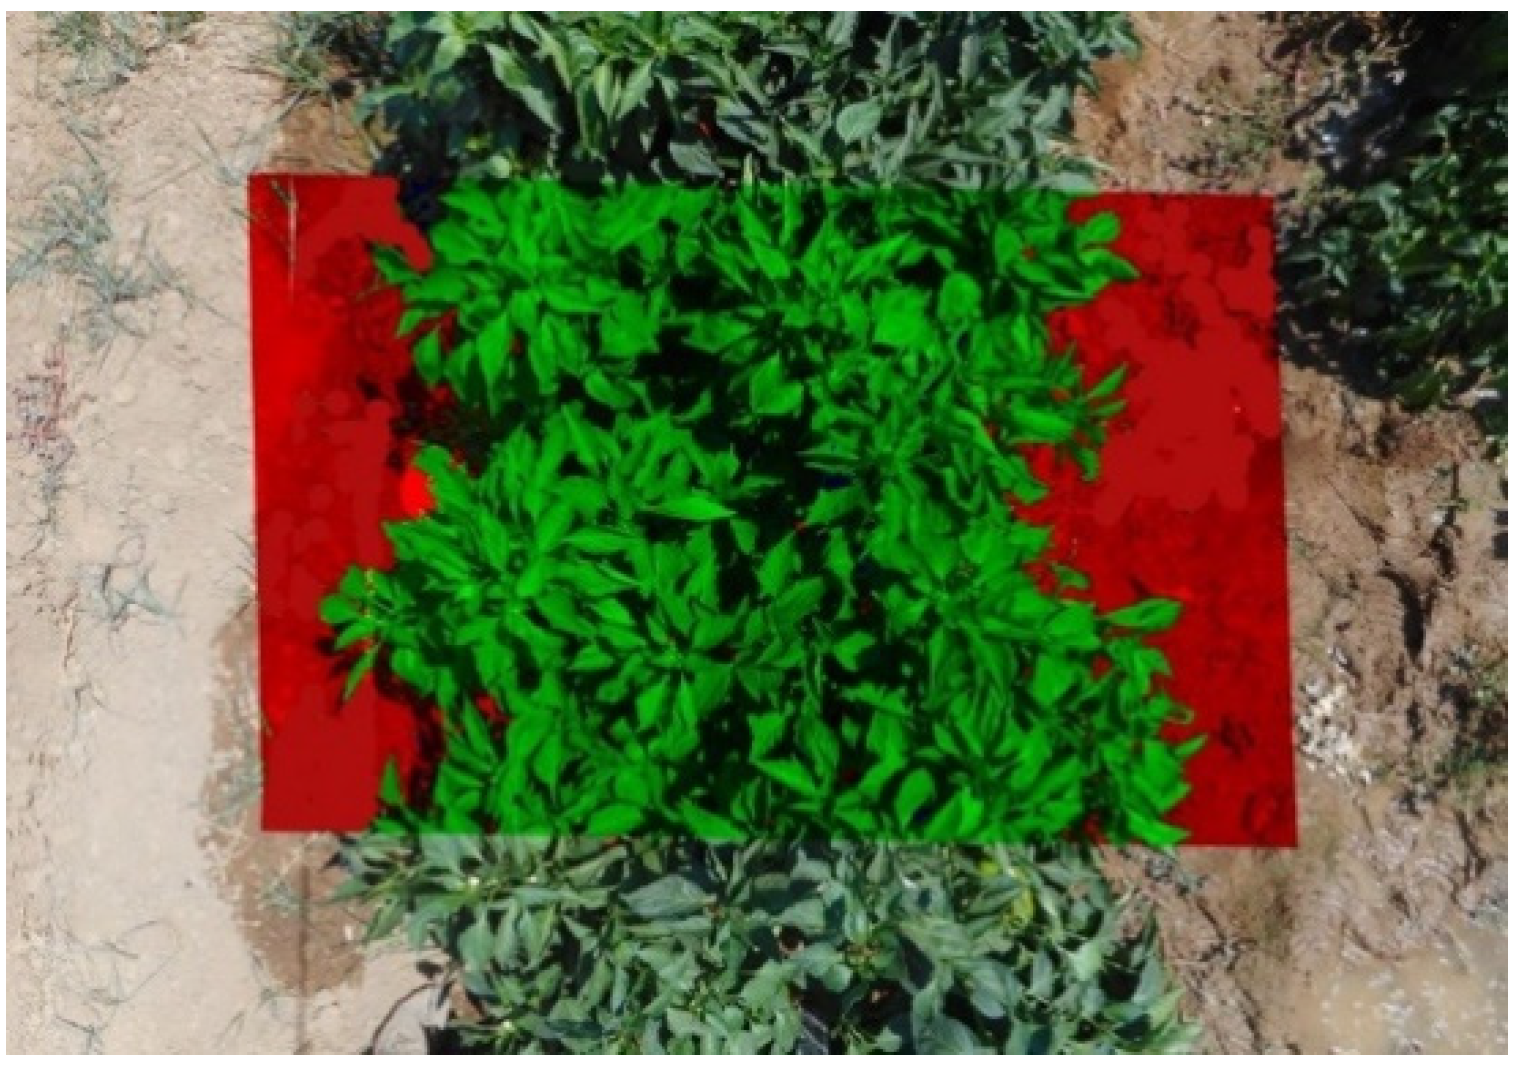
The fraction of crop cover (fCC) was measured at midday with a commercial digital camera (Nikon Coolpix A300, Nikon, Tokyo, Japan). Photographs were taken at solar noon to enhance the distinction between soil and crop pixels, and by positioning the camera at a height of 215 cm above the soil. Each photograph encompassed the entire width (150 cm) and length (80 cm) of the bed. On each sampling day, measurements were taken at the same times and locations as the PAR measurements. The images were classified according to the radiation levels displayed in an RGB crop image (0 to 255 colors) using the maximum reclassifying tool of the GIMP 2.8. software. The images were processed in accordance with the “reclassification method” described by Campillo et al. (2008).
Figure 1 shows an example of the zenithal images used to calculate the fCC via RGB reclassification.
To obtain the seasonal course of the fCC, photographs were always taken in the same preselected area (3x3 m) of each elemental plot at weekly intervals until maximum ground cover.
2.2.3. Crop Dry Matter (DM) and Leaf Area Index (LAI)
Measurement of seasonal aerial crop dry matter (DM) was carried out after sampling 4 plants/plot every 2 weeks throughout the crop cycle. There were 10 sampling dates in 2020, 7 in 2021, and 10 in 2022. Plants were split into leaves, flowers, stems and fruits, weighed separately and then dried in an oven at 65ºC to constant weight. Total dry weight was calculated as the sum of the weight of the three organs, and then referred to kg/ha considering the planting density (Rodríguez et al., 2020).
In 2020, 2 plants per single plot were separated from the biomass sample and the leaves were separated from the rest of the plant. The leaf area was measured using a planimeter (Li 3000, LiCor, Inc., Lincoln, NE, USA). The leaves were dried and weighed to obtain the ratio of leaf area to leaf dry weight, which was applied to all leaves in the biomass sample. The leaf area index (LAI) was then calculated as the total leaf area divided by the sample area.
2.2.4. Extinction Coefficient
The relationship between fi-PAR and the LAI can be written as:
where k is the extinction coefficient for PAR radiation. From this equation, k can be written as:
(Kiniry et al., 2011; Lacasa et al., 2021; Monsi et al., 2005)
LAI measurements were made with an LI-3100C area meter (Li-Cor, Inc., Lincoln, NE, USA). These measurements were taken by swiping the leaves of the plants sampled by LI-3100C in the DM productivity samplings in the 2021 season.
2.2.5. Crop Nitrogen Uptake
The N content of each organ (kg N/ha) was calculated for each biomass sampling as the product of its dry matter (kg/ha) and its %N. The %N was measured on dried samples with a Eurovector EA3000 elemental analyzer (Eurovector Srl, Pavia, Italy).
2.2.6. Critical Nitrogen Curve (CNC)
The CNC represents, for a given total crop dry matter, the minimum crop N concentration for the full plant that produces the highest dry matter. In this study, it was calculated following the methodology of Greenwood et al. (1990) and Padilla et al. (2016). For each sampling date, the N treatment showing the highest DM was determined by running an analysis of variance (ANOVA), and these values, together with their %N, were used to calculate the CNC. For those sampling dates when more than one N treatment showed the highest DM, the one with the lowest %N was selected. Based on these data, we fitted a negative power relationship:
where N
crit is the critical N concentration (%), a is the N concentration when DM is 1 t ha-1 (Justes et al., 1994; Ziadi et al., 2010), and b is the decline of %N as DM increases. Note that %N of DM lower than 1 t ha-1 were not considered as the dilution of crop N in young plants is not clear (Greenwood et al., 1990; Justes et al., 1994).
2.2.7. Crop Yield
Harvests dates were August 25, 99 days after transplant (dat), September 2 (107 dat) and September 30 (135 dat) in 2020, and July 30 (77 dat), August 31 (109 dat) and September 15 (124 dat) in 2021. In the 2022 season, the first harvest was on August 2 (82 dat) and the last on August 23 (103 dat) for N0, and on September 6 (117 dat) for N1 and N2. To quantify crop yield, we sampled three linear meters of the plants in the central area of each elemental plot. On each harvest date, commercial green and red fruits and non-commercial fruits, depending on the size, were weighed separately. Total commercial yield (t ha-1) was obtained by adding the fresh weight of commercial green and red fruits of all the harvest dates.
2.2.8. Soil Nitrogen Sampling
Soil N content was sampled just before transplanting, at mid-crop cycle, and at the end of the crop cycle after harvesting. Four points were selected at each plot, taking two samples at each point, from 0-20 cm and 20-40 cm depth. After drying and sieving the soil samples, the nitrate and ammonium content was measured with an Evolution 201/220/260 UV-Visible spectrophotometer (Thermo Fisher Scientific, Waltham, MA, USA). Nitrate content was measured according to the methodology of Sempere et al. (1993) and ammonium following Rhine et al. (1998).
2.3. Data Analysis
The seasonal evolution of the different variables is presented in terms of cumulative growing degree-days (GDD) calculated through the formula:
where
Tmax is the maximum temperature of the day,
Tmin the minimum temperature of the day and
Tbase the minimum temperature at which the crop grows, which for the pepper crop is considered to be 10 °C (Marcelis et al., 2006).
The experimental data of the three years were evaluated through ANOVA after verifying the normality and equality of variance. Significant differences were determined at P<0.05. If the principal effects or the interactions were significant at P<0.05, Tukey’s test was performed to compare the DM, yield and fi-PAR. The SPSS 22 (IBM Corp., Armonk, NY, USA) was used for all the statistical analyses. Microsoft Excel software was used to determine the equations correlating different variables and their coefficient of determination (R2).
3. Results
3.1. Crop Evolution under No Limiting Nitrogen Conditions
3.1.1. Growing Conditions
Over the three years of the trial, the average monthly maximum temperature ranged from 34.1 to 44.4 ºC and the average minimum ranged from 8.7 to 22 ºC. As shown in
Table 1, the warmest month was July in 2020 and 2022, and August in 2021. The warmest year was 2022, with an average maximum temperature of 44.4 ºC in July. In all years, there was a very low level of rainfall during the growing season.
3.1.2. Analysis of Crop Growth and Development
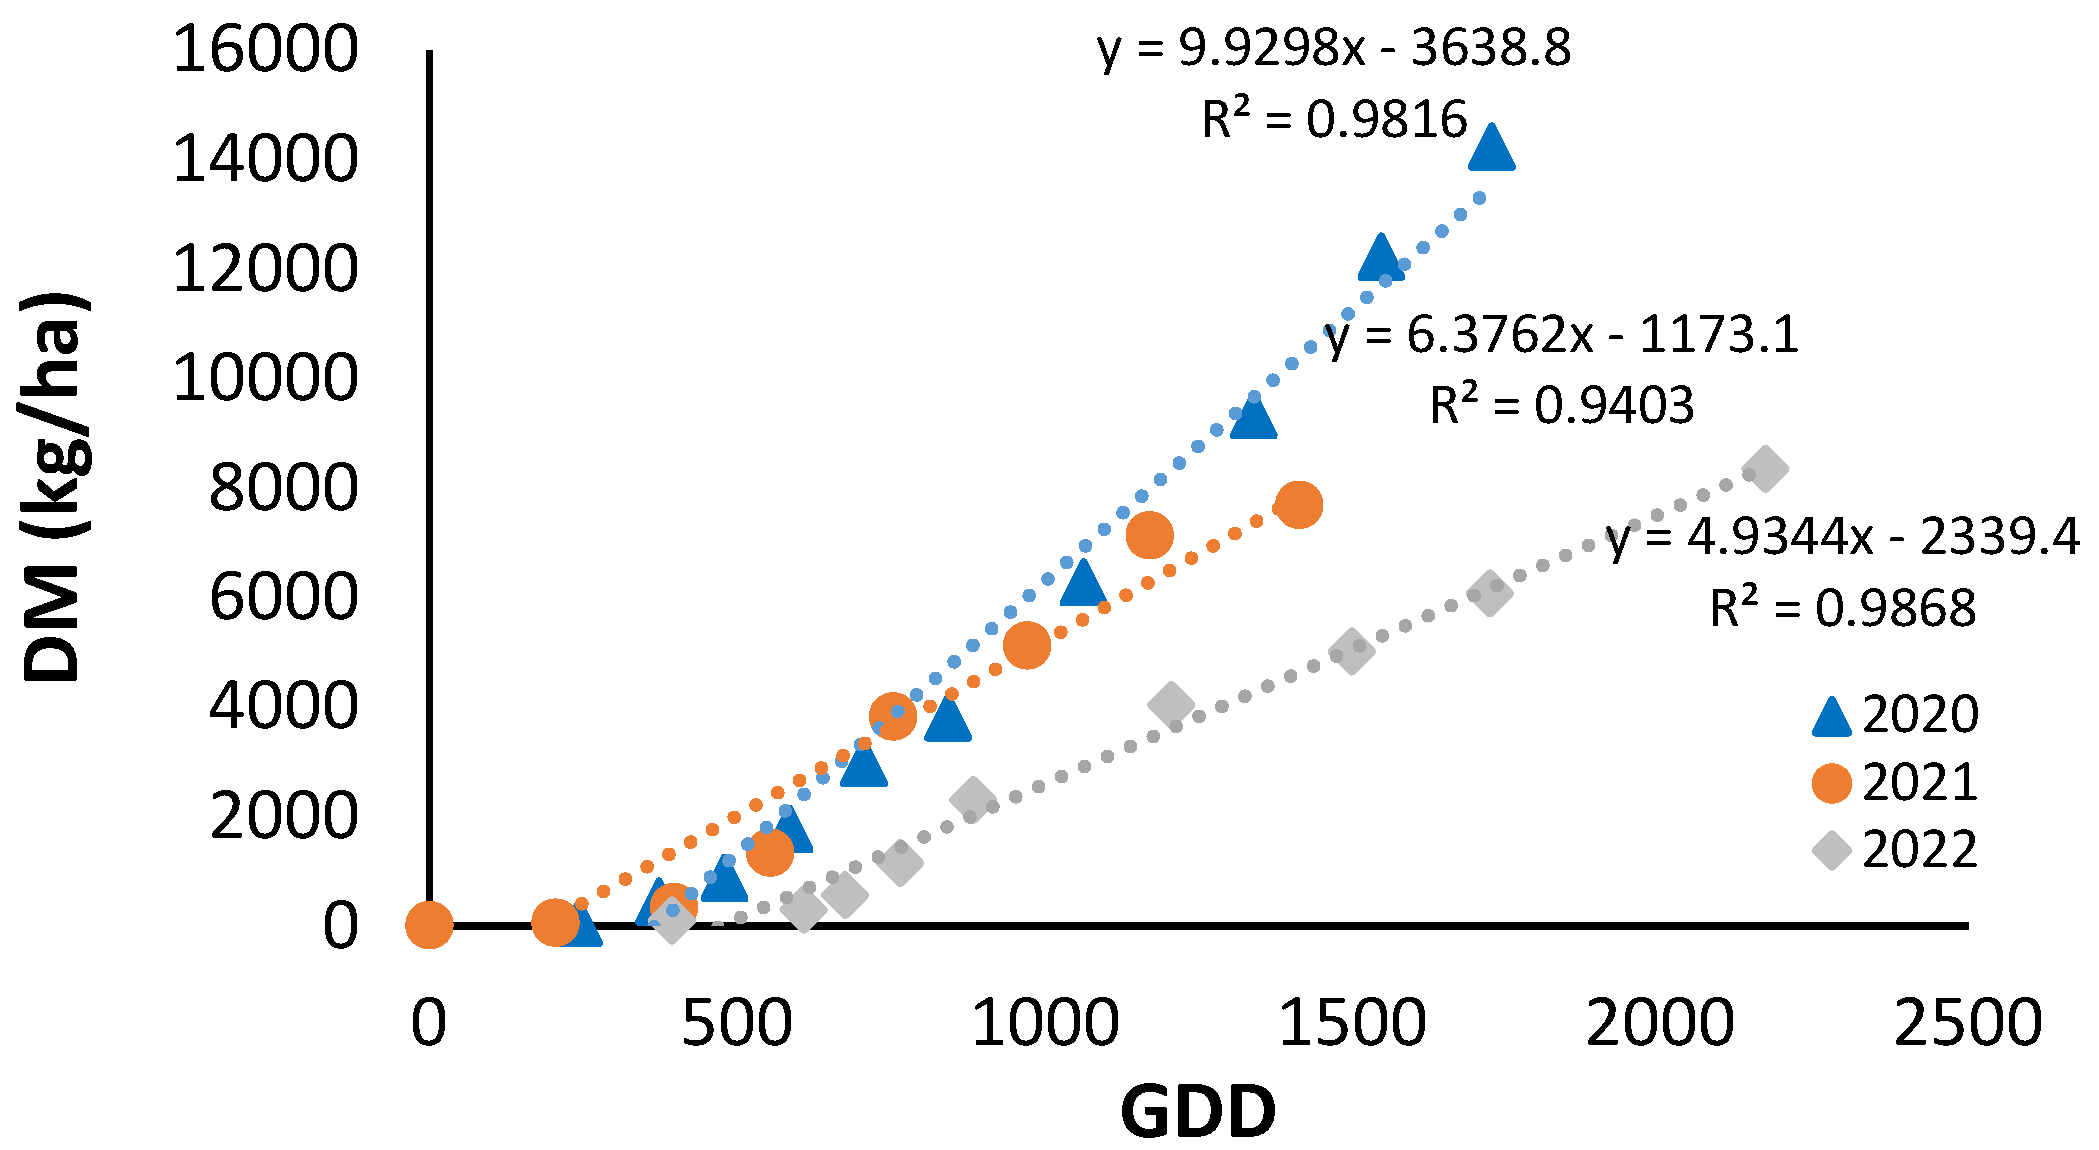
After transplanting, there was a period of plant establishment with little growth, which lasted until 400 cumulative GDDs in 2020 and 2021, and 600 GDDs in 2022 (
Figure 2). From this point onwards, the increase in plant aerial dry matter was linear with cumulative GDDs until harvest. In all three years, the linear fit was significant, with an R
2 greater than 0.94. However, the equations were different, with slopes ranging from 4.93 in 2022 to 9.93 in 2020.
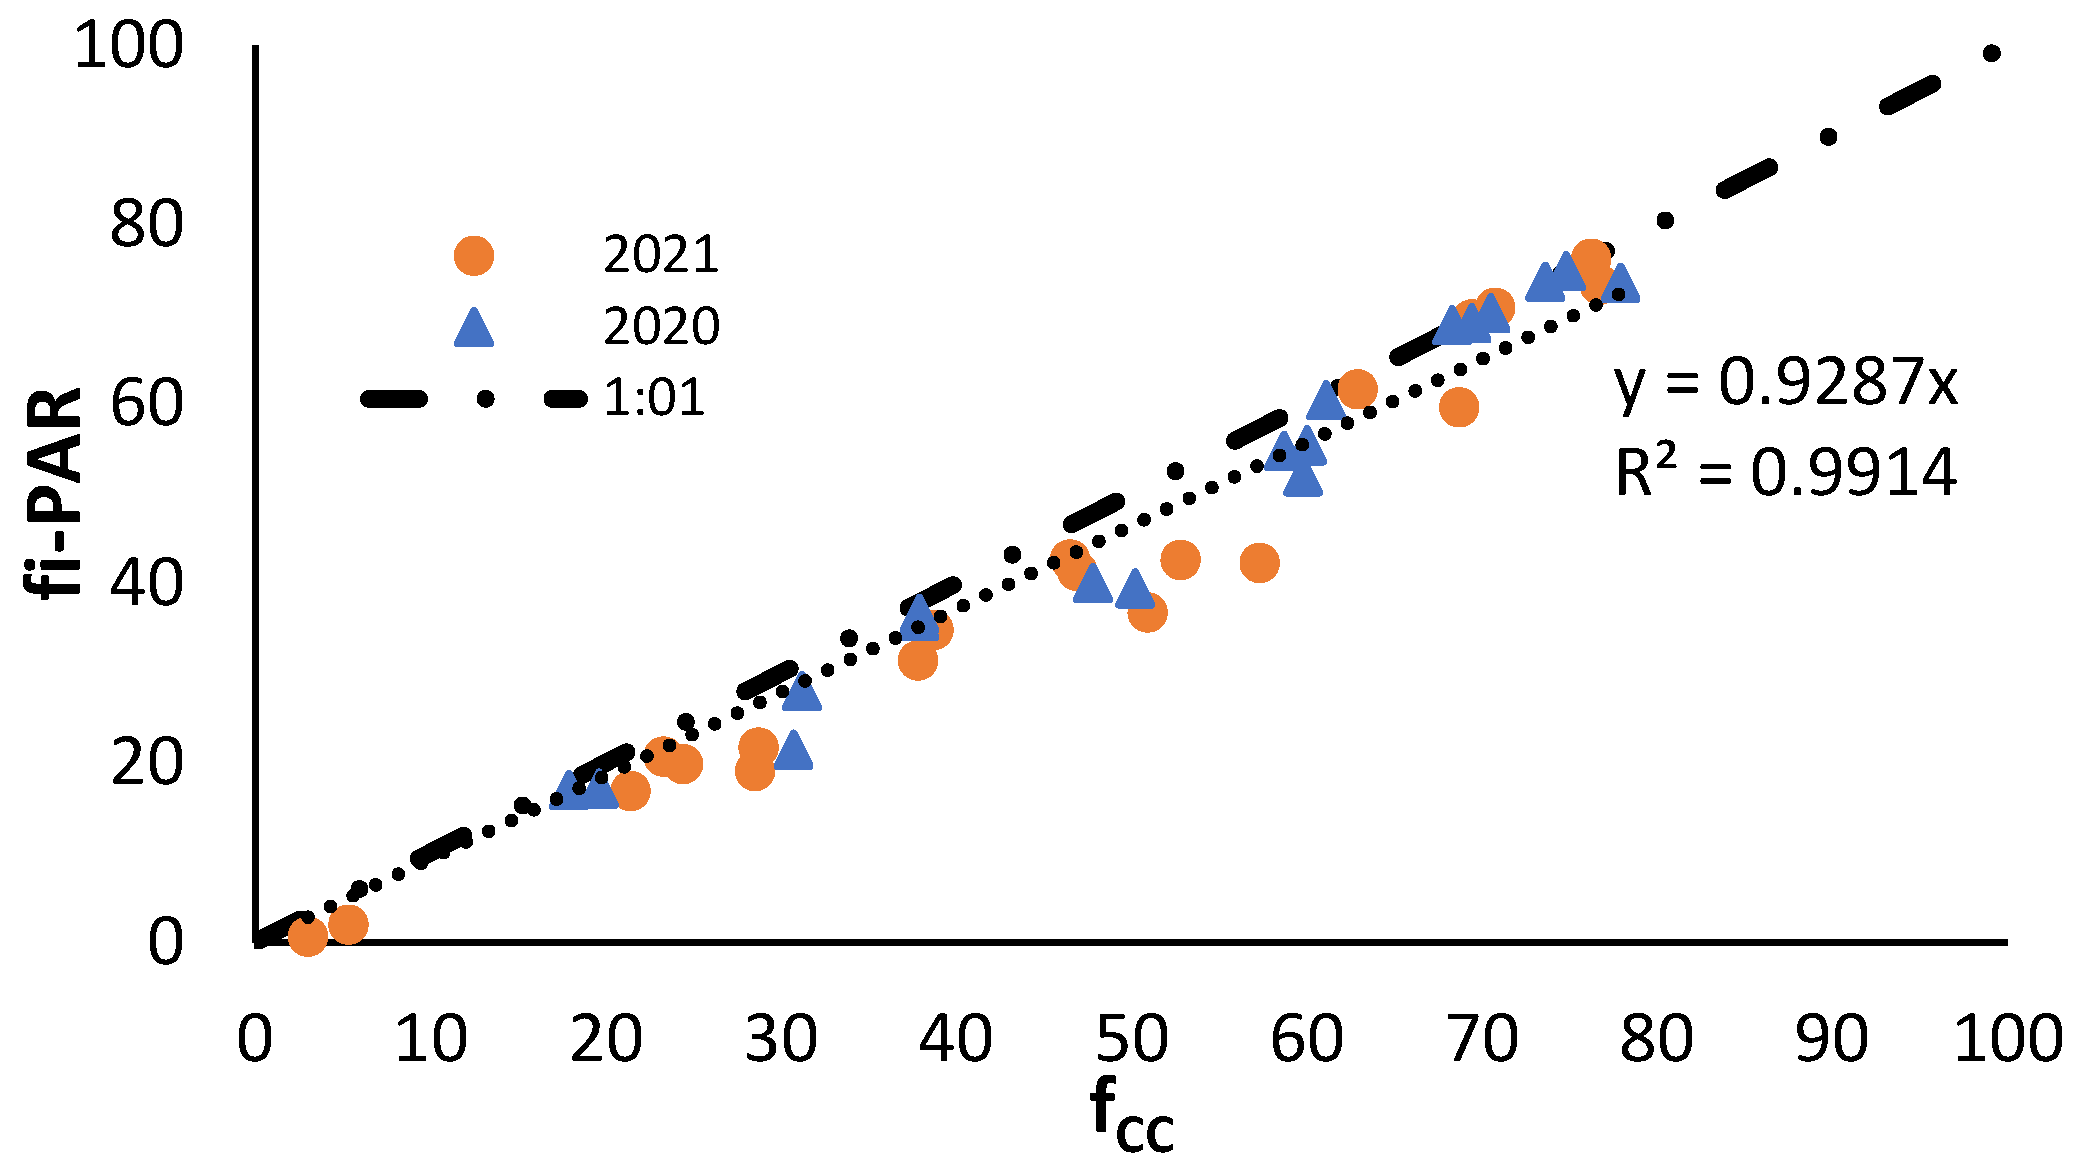
The relationship between the f
CC and fi-PAR (
Figure 3) was linear and coincident in both years with a very good fit (R
2=0.99) and very close to the 1:1 line. fi-PAR values were slightly lower than f
CC ones.
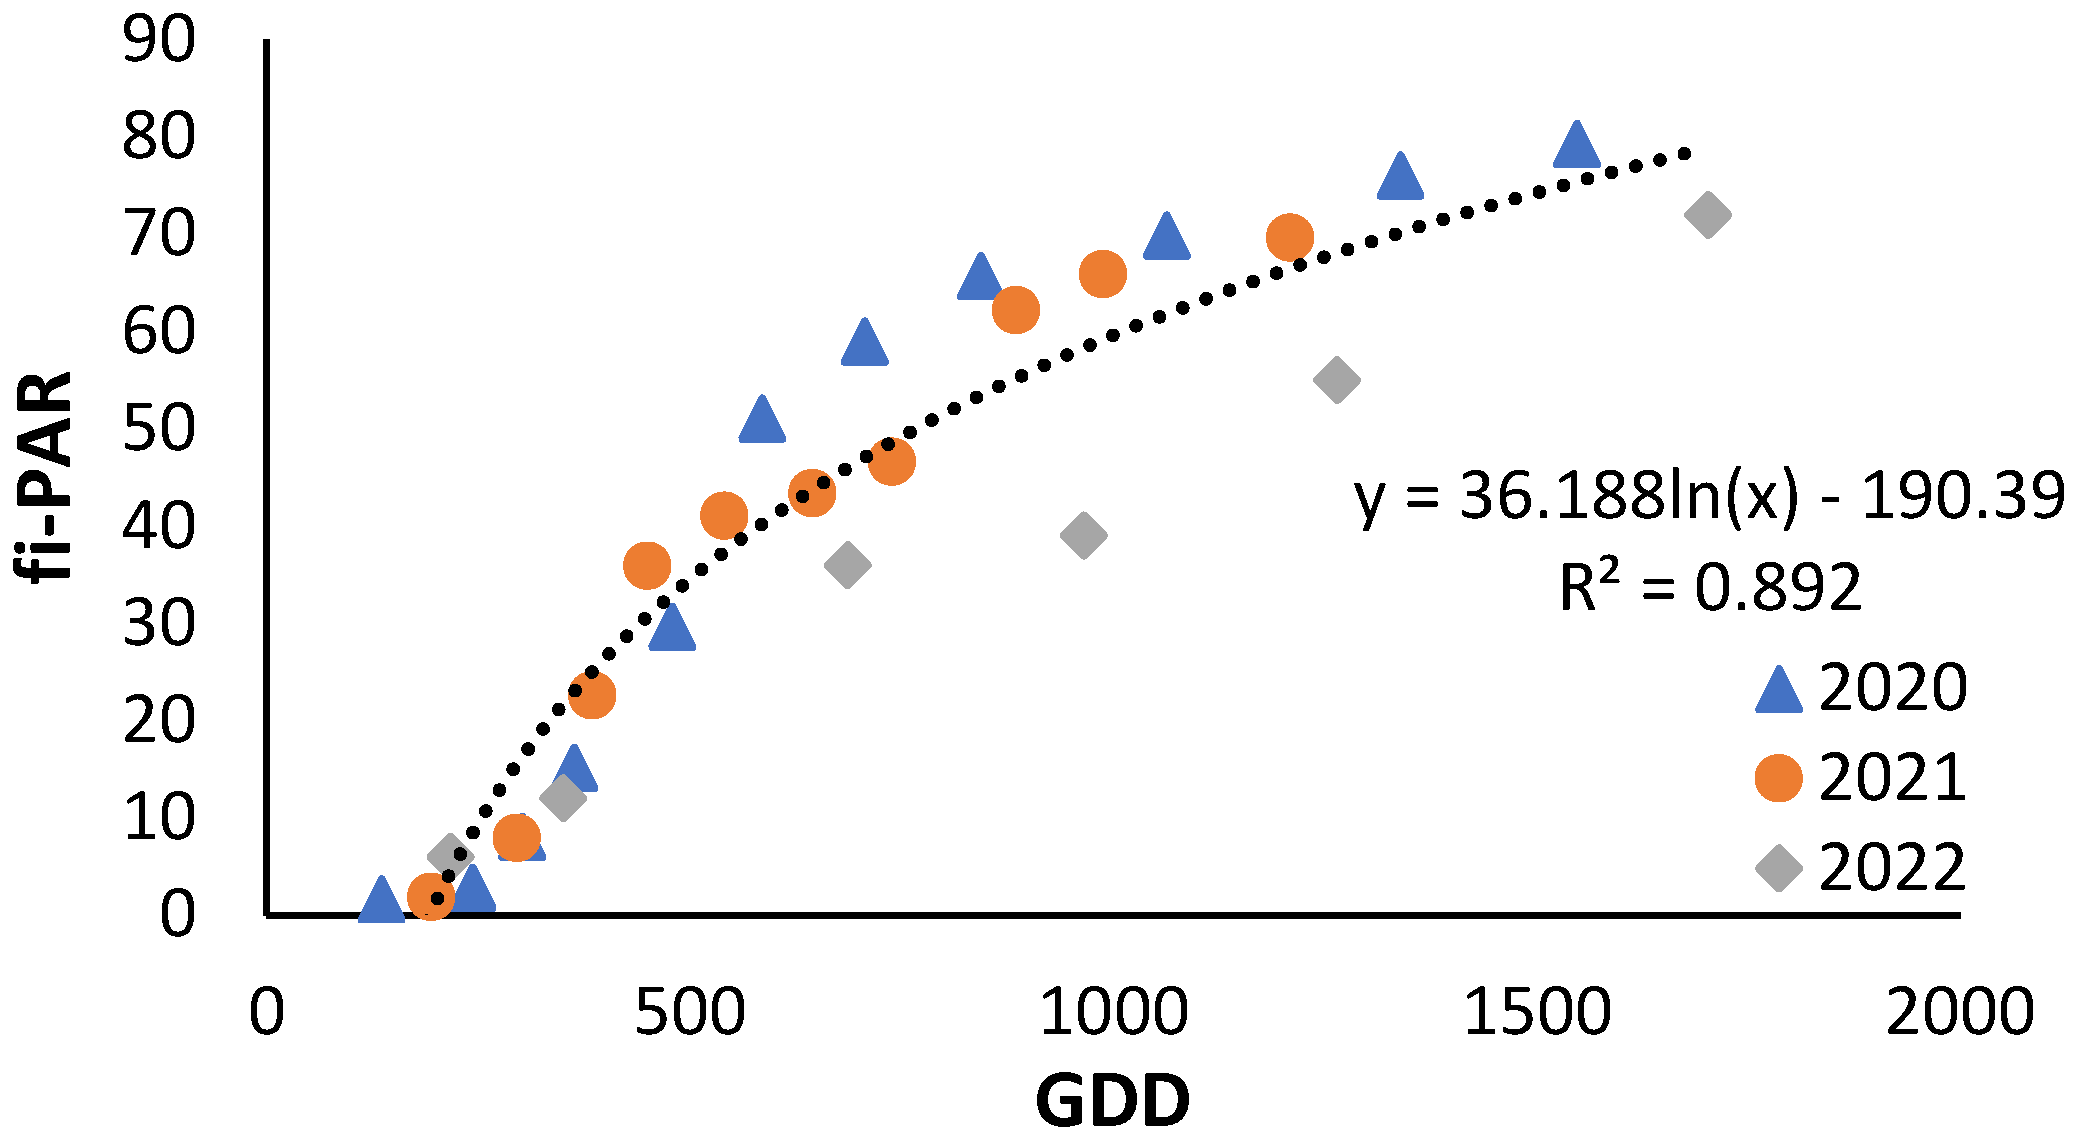
As illustrated in
Figure 4, the seasonal evolution of the fi-PAR was fitted to a logarithmic equation following the post-transplanting shutdown period. The trend was similar in each season, except in the period from GDD 900 to GDD 1200 when the data from the 2022 season was below the trend line.
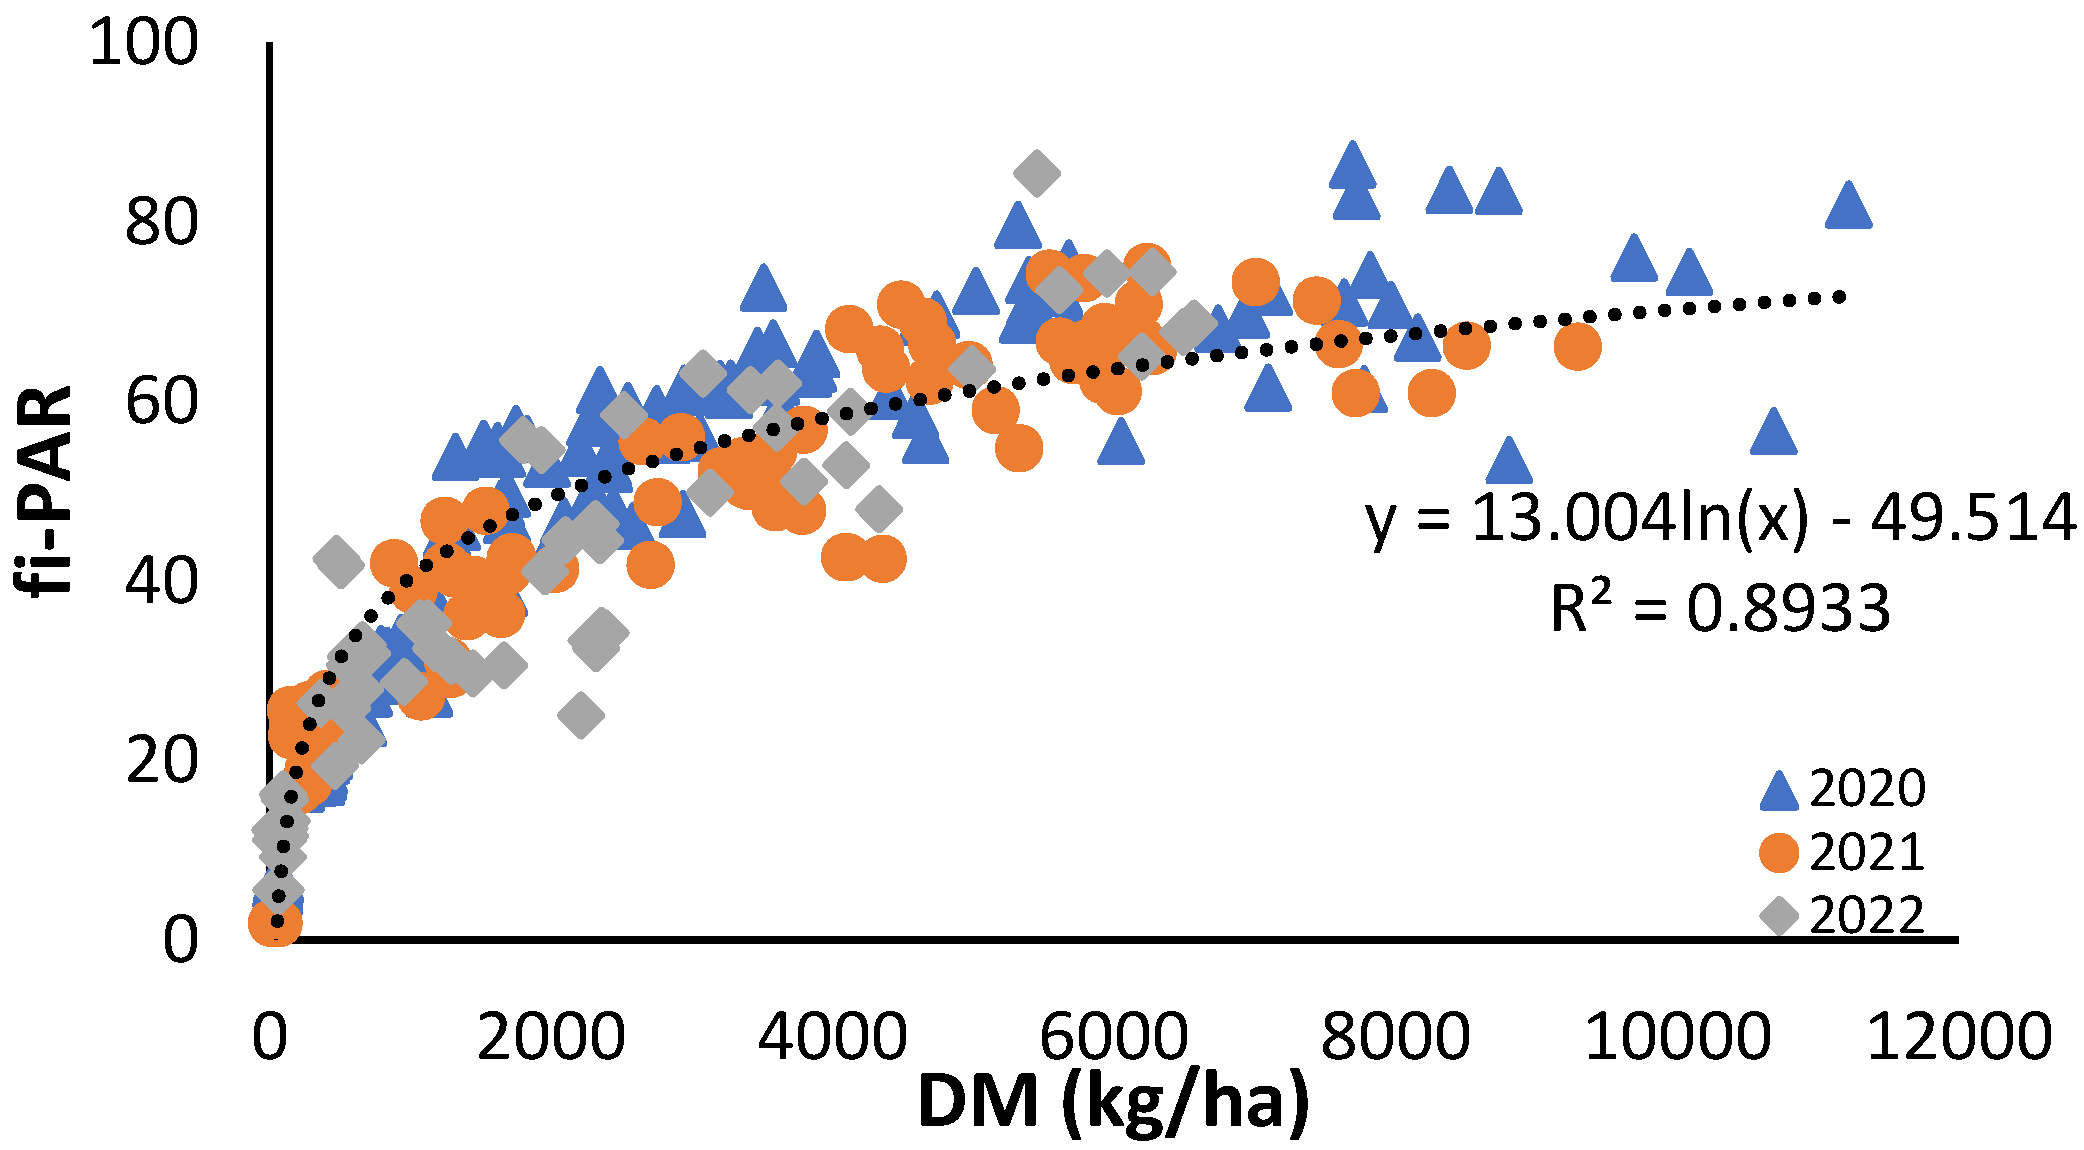
The relationship between aerial dry matter accumulation and the fi-PAR was also logarithmic, with the three years fitting the same equation.
The extinction coefficient calculated with the data from 2021 by Equation 3 was k=0.48, with an R2= 0.75 between LAI and Ln(1-fi-PAR).
3.1.3. Critical Nitrogen Curve (CNC)
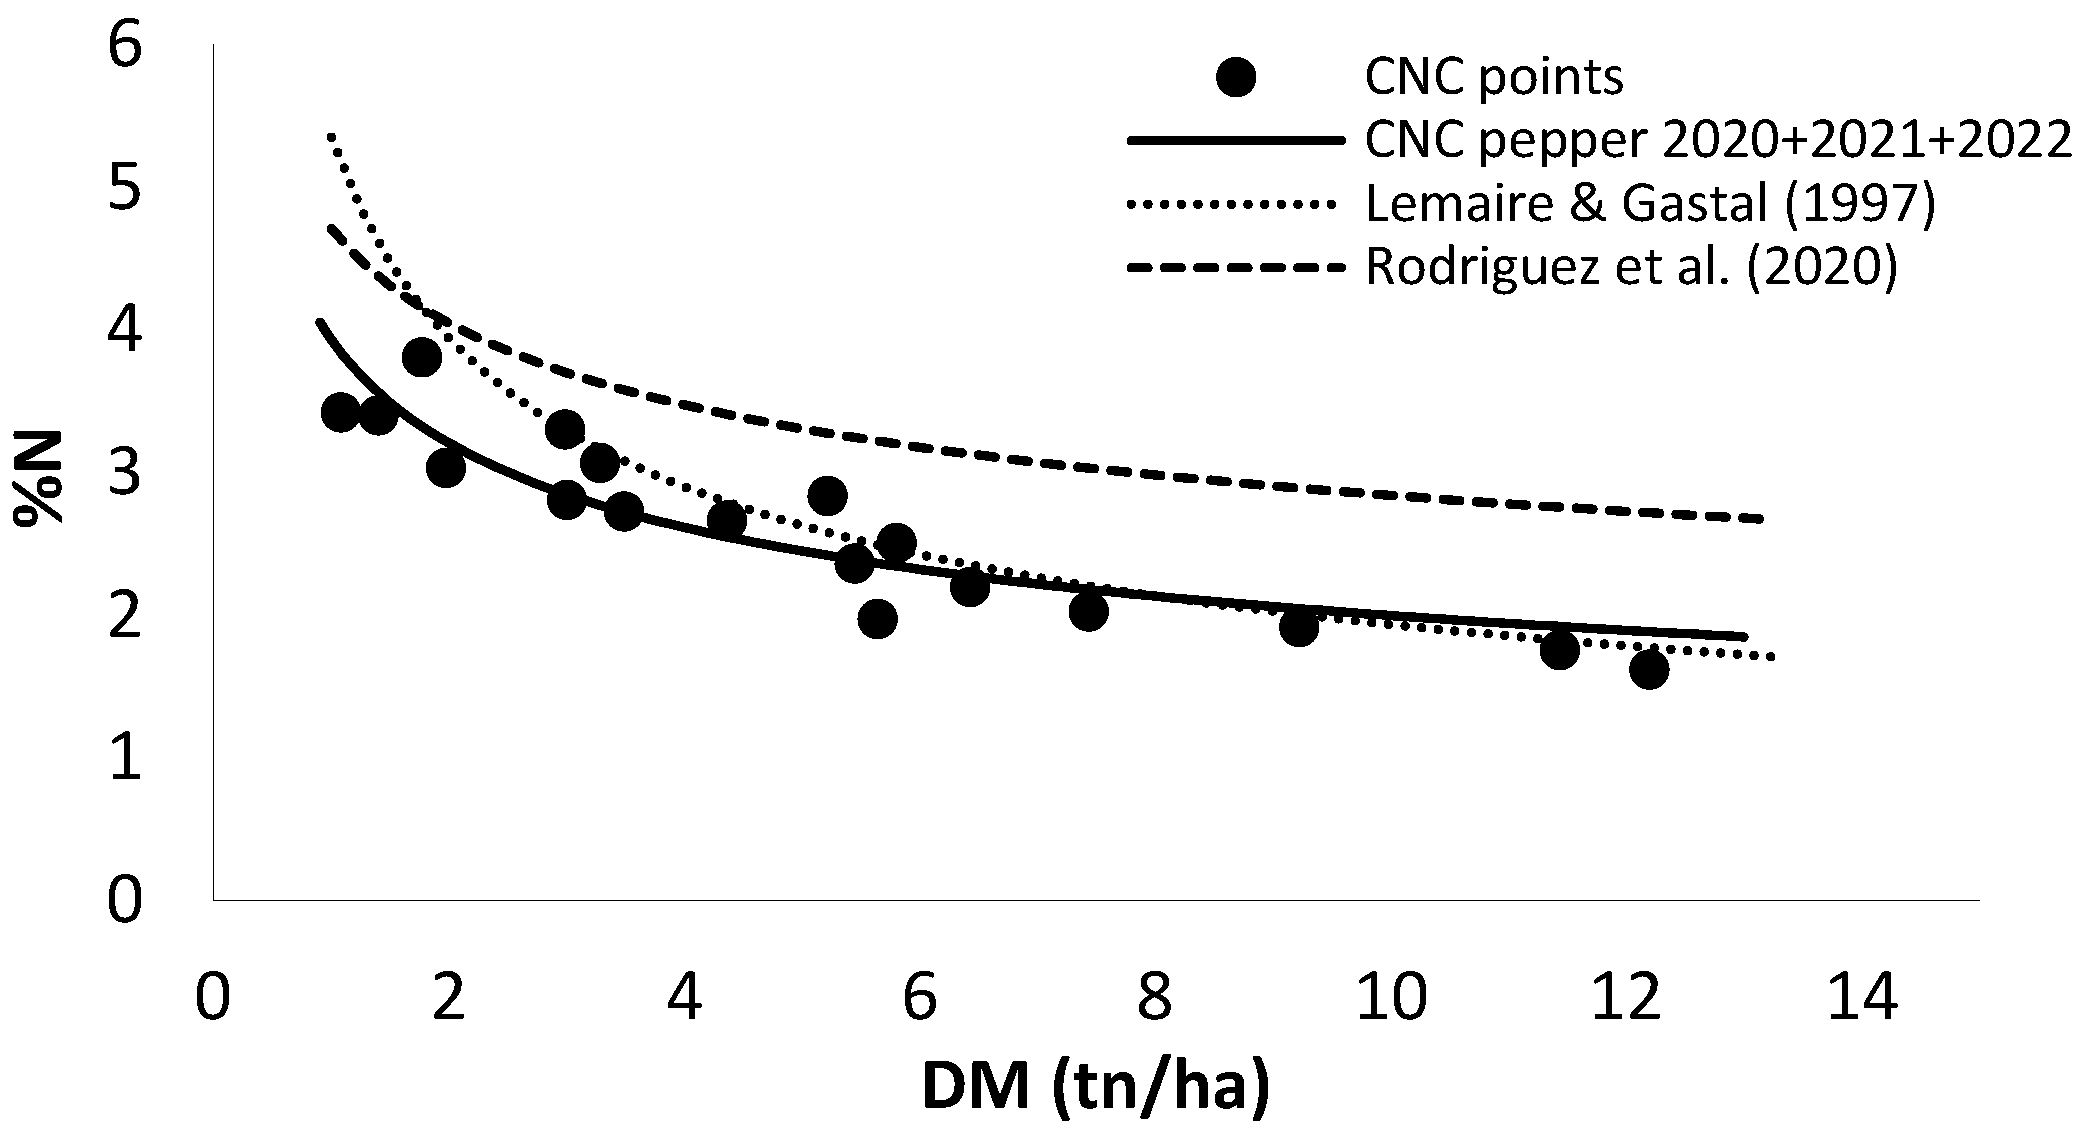
Figure 6 shows the CNC developed in this work using the data obtained in the field experiments of the three years. The CNC published by Rodríguez et al. (2020) for sweet pepper in greenhouse and the CNC published by Lemaire & Gastal (1997) for C3 plants are also shown. Although following a similar pattern, the curve developed for open field sweet pepper is much lower than that for pepper in greenhouse, and closer but also slightly lower than the curve published by Lemaire. As in other crops, Ncrit decreases as DM increases. The equation obtained was Ncrit = 3.86 * DM-0.29 (R
2=0.86) (Eq. 4), where Ncrit is the critical crop N content, 3.86 is the total crop N content (%N) for DM of 1 t ha−1, and −0.29 is the value of a dimensionless parameter that describes the slope of the relationship with which %N declines with increasing DM, the dilution coefficient.
3.2. Response of Pepper Crop to Different Doses of Nitrogen (N) Fertilization
3.2.1. Vegetative Development and Flowering
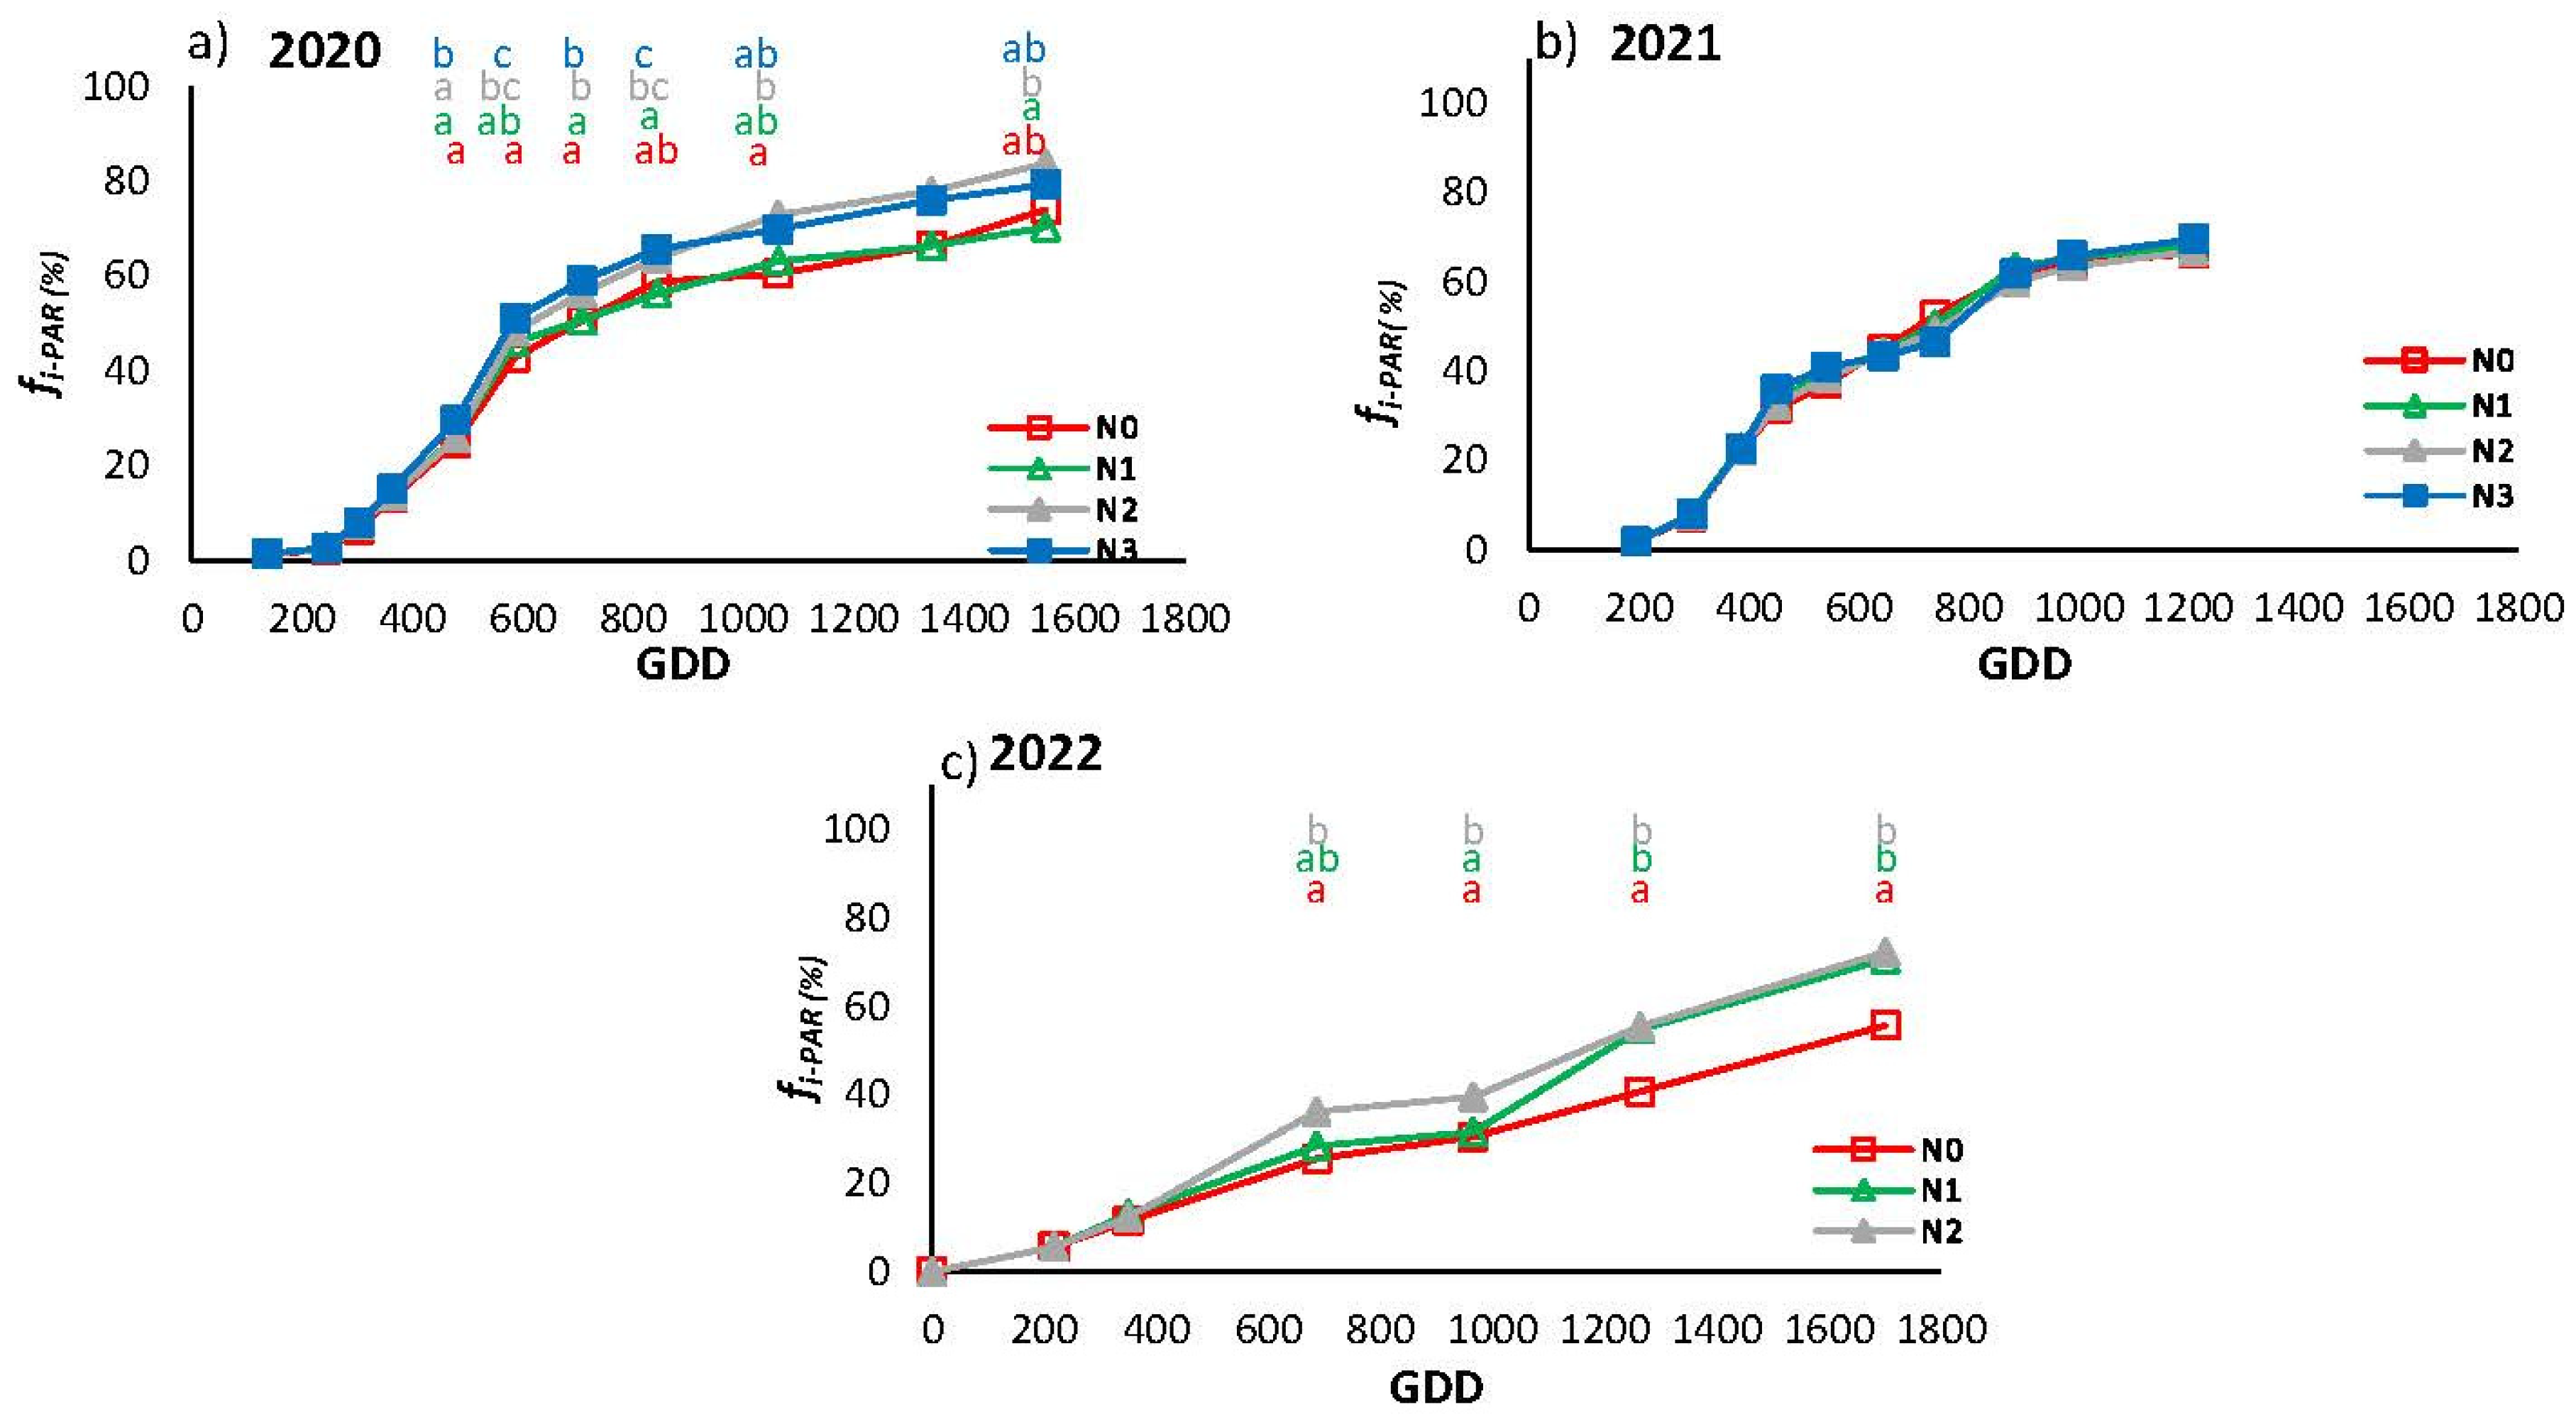
Figure 7 shows the evolution of fi-PAR for the different N treatments in the three years. The seasonal pattern of fi-PAR in 2020 and 2021 was identical: after the post-transplant period there was a rapid increase in crop cover between GDD 400 and GDD 600, followed by a slowdown. In 2022, the increase in fi-PAR was progressive throughout the cycle, unlike in the previous two years. In 2020, the maximum fi-PAR was 80% in the N2 and N3 treatment, a value higher than those seen in the following two years.
Canopy development differed between treatments in 2020 and 2022. In 2020 (
Figure 7a), there were significant differences from GDD 478. From this point onward, the treatments were grouped in pairs, differentiating between the most and least fertilized and equalized at the end of the cycle. In 2022, N0 was less developed than the other two treatments, with maximum differences in the last sampling.
Figure 8 illustrates the seasonal evolution of the dry weight of flowers over the first two years. In both years, the pattern was similar, with the appearance of the first flowers occurring at approximately 200 GDD, followed by a rapid increase to a maximum at 585 GDD in 2020 and 554 GDD in 2021, followed by a subsequent decrease. In 2020, there was a rebound to 1726 GDD, while in 2021 a certain flowering rate was maintained, with a higher rate observed in N0 than in the other treatments. In order to comprehend the discrepancies observed in the final stages, it is essential to consider the extended growing season that was experienced in 2020.
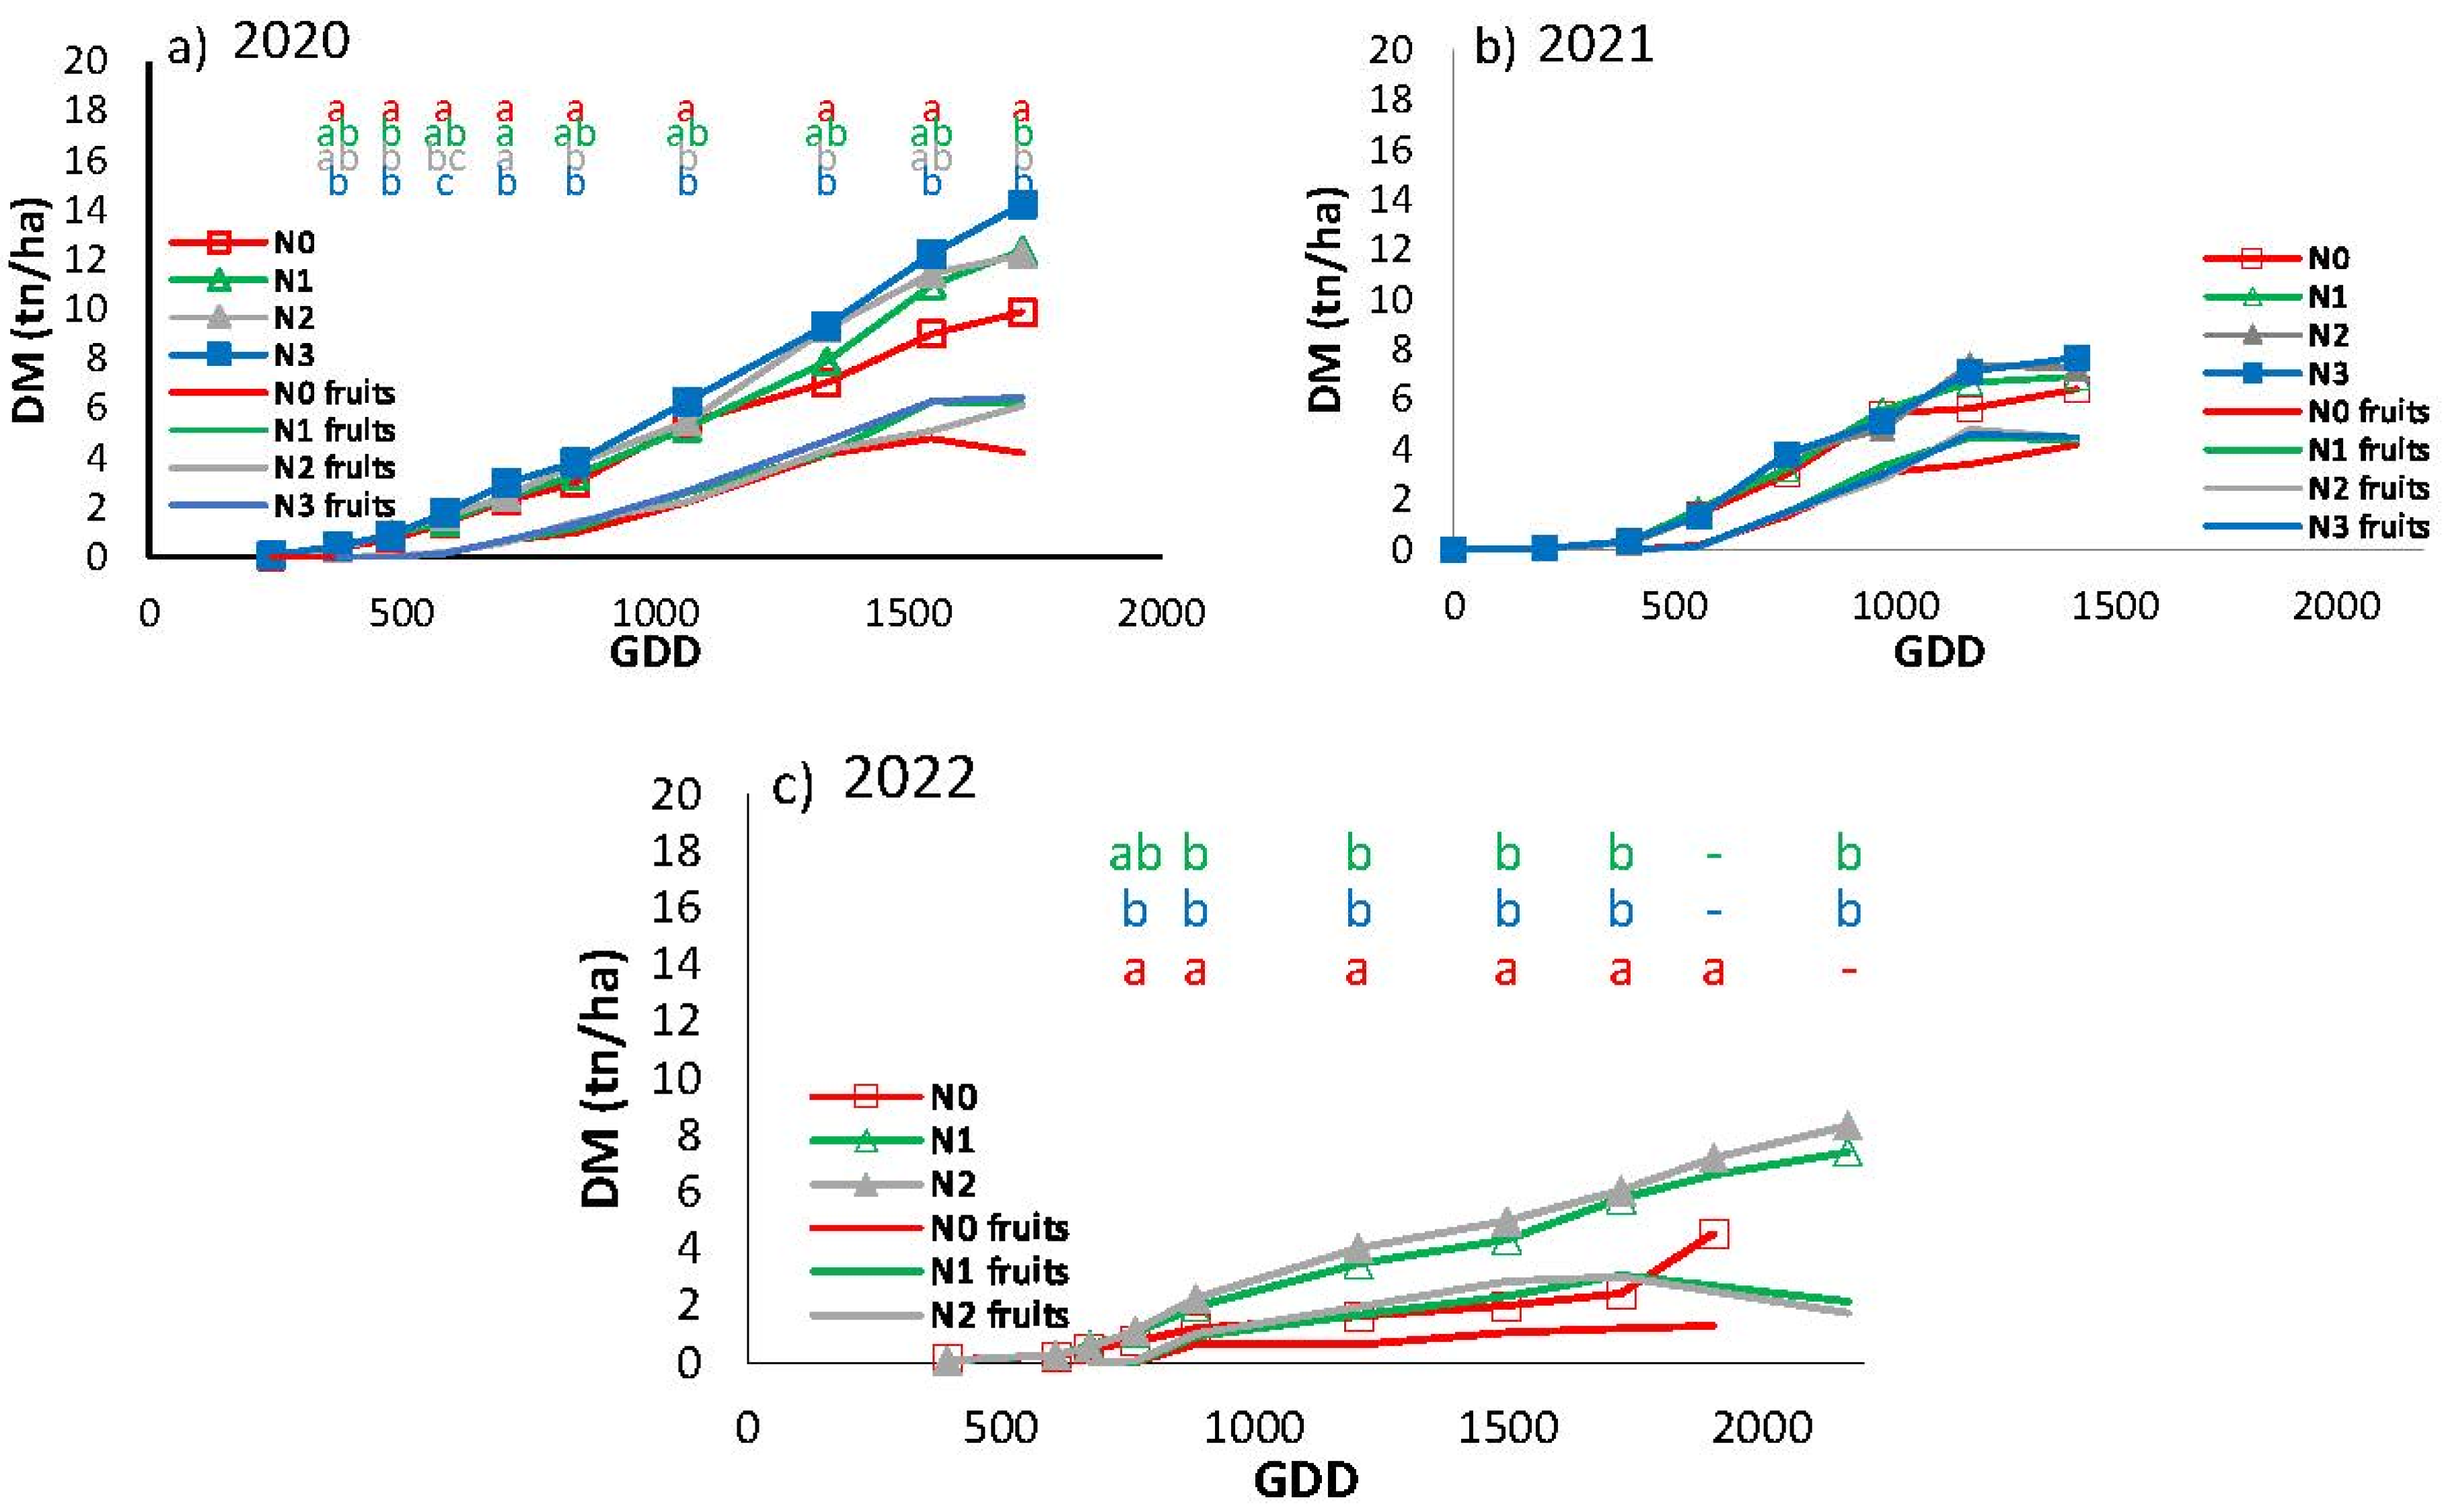
The production of dry matter in 2020 was markedly higher than in the subsequent two seasons (14.2 tn/ha for N3) (
Figure 9). The statistical differences between treatments are in accordance with those obtained in the evolution of fi-PAR, with N0 exhibiting lower values than N3 throughout the crop cycle. N1 and N2, in contrast, demonstrated intermediate values, with significant differences between them observed in certain sampling periods. In 2021, no significant differences were observed between the treatments, with dry matter yields at the end of the crop cycle reaching 6.4-7.7 tn/ha. In 2022, a clear distinction was evident between N0 and the other two treatments, with notable disparities emerging from the fourth sampling onwards. Conversely, treatments N1 and N2 exhibited no discernible differences between them. The highest biomass production in 2022 was 8.35 tn/ha in N2, while N0 exhibited the lowest aerial dry matter at the conclusion of the three-year trial, with a final yield of 4.5 tn/ha. The N0 treatment exhibited a shorter growing season, resulting in the last DM sampling being conducted at an earlier point in time relative to N1 and N2. For the purposes of the statistical analysis, the last sampling of the three treatments was grouped together, despite the fact that the samples were taken on different days.
As can be seen in
Figure 9, most of the biomass corresponds to the fruits, so that after the flowering peak at GDD 585 (
Figure 8), from GDD 600 onwards, fruit set and subsequent fruit growth are mainly responsible for the increase in biomass.
3.2.2. Crop Yield
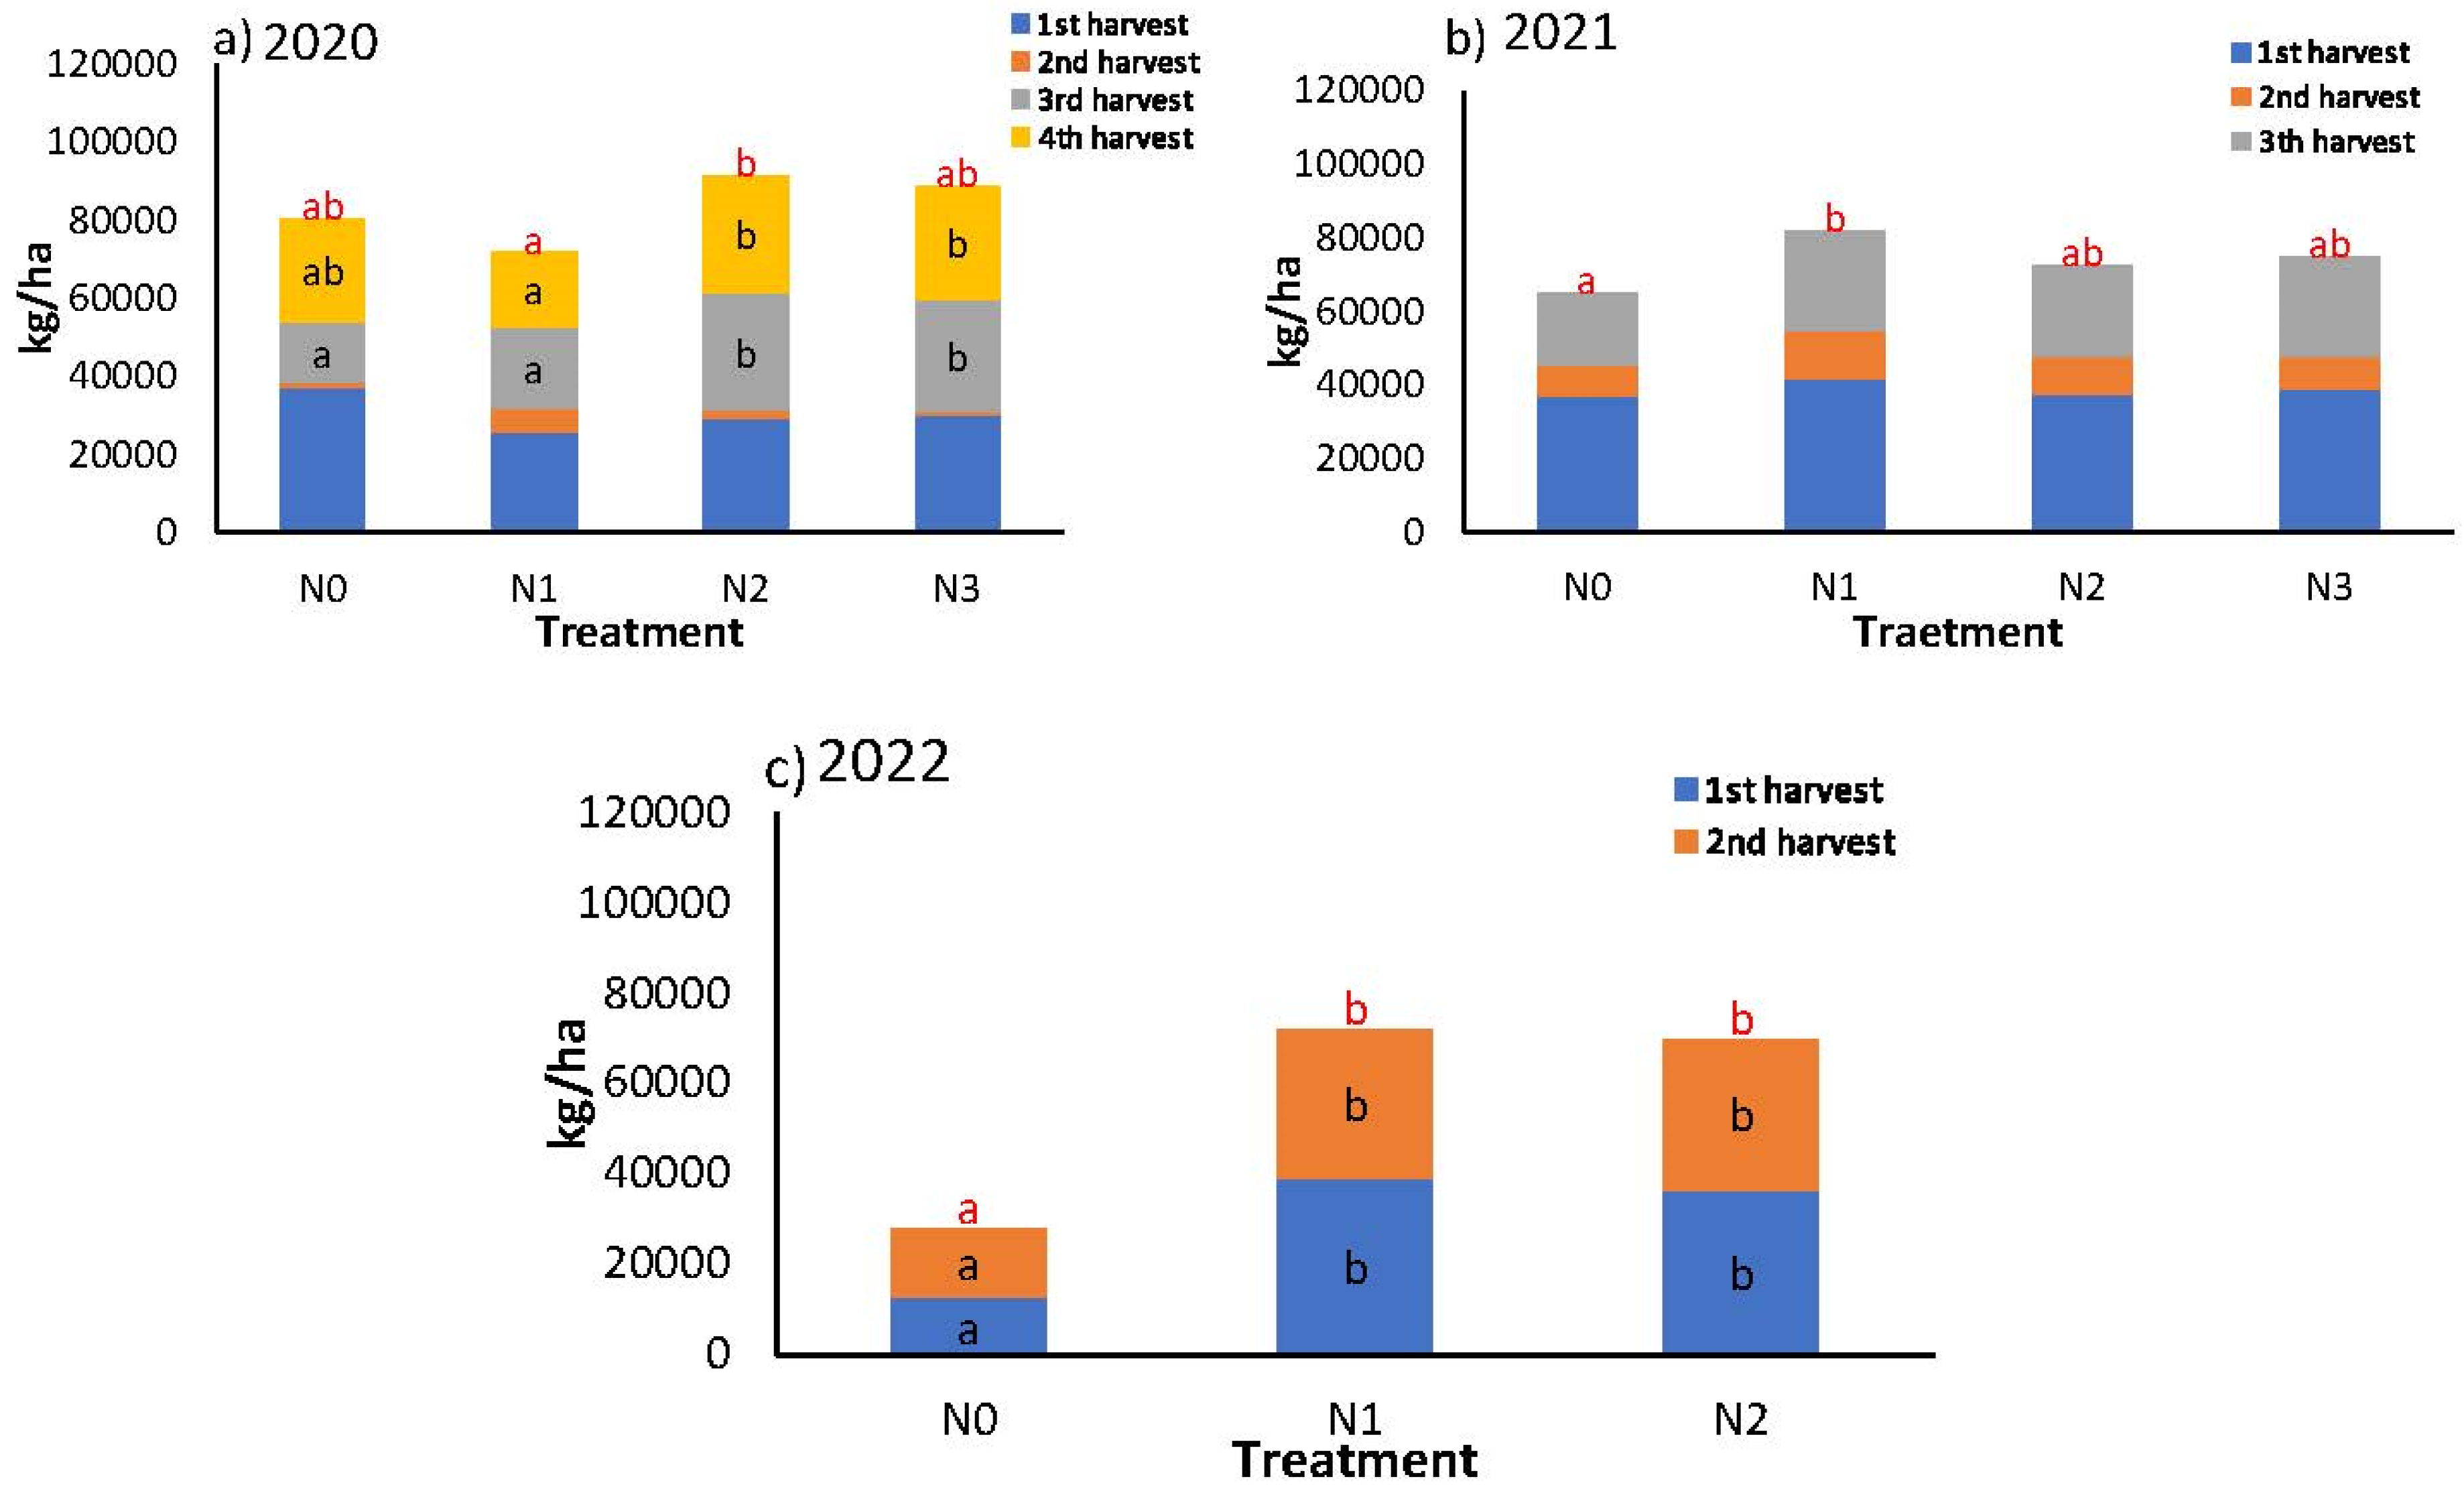
Figure 10 shows the fresh weight of commercial fruit in successive harvests. The year 2020 was the most productive with a total of four harvests. There were three harvests in 2021 and two in 2022, with the latter year being the least productive (
Table 2). In both 2020 and 2021, the differences in production between treatments were minimal, with the least productive treatments being N1 in 2020 and N0 in 2021. In 2020, N0 demonstrated an advancement in production, exhibiting higher weights in the initial and subsequent harvests. Conversely, both N0 and N1 exhibited a decline in production in comparison to the other two treatments in the subsequent two harvests. In 2021, no difference existed between treatments in the weights of each of the harvests, although in the cumulative weight N0 was below the others.
As shown in
Figure 10, the highest flowering intensity is grouped from 30 dat onwards. There was also a higher initial soil availability of N (nitrate and ammonium) at the beginning of the cycle in 2020 (177 kg N/ha) compared to 2021 (149 kgN/ha). As for the difference in production between treatments, in 2020 there were only significant differences in N2, which was higher than the rest of the treatments. However, in 2021 N0 was significantly lower than N1, with no differences between the rest of the treatments.
The grouping of peppers destined for industry is an important aspect of reducing costs through mechanization. The reduction in N application resulted in a more concentrated and earlier production, with 41% of the total in the first harvest in N0 in 2020 and 57% in 2021. This yielded 10% more than the rest of the treatments in 2020 and 7% in 2021 (
Figure 10). As indicated in
Table 2, this also signifies a lower proportion of waste in the N0 treatments across both seasons (13% and 15%).
3.2.3. Nutritional Status and N Uptake
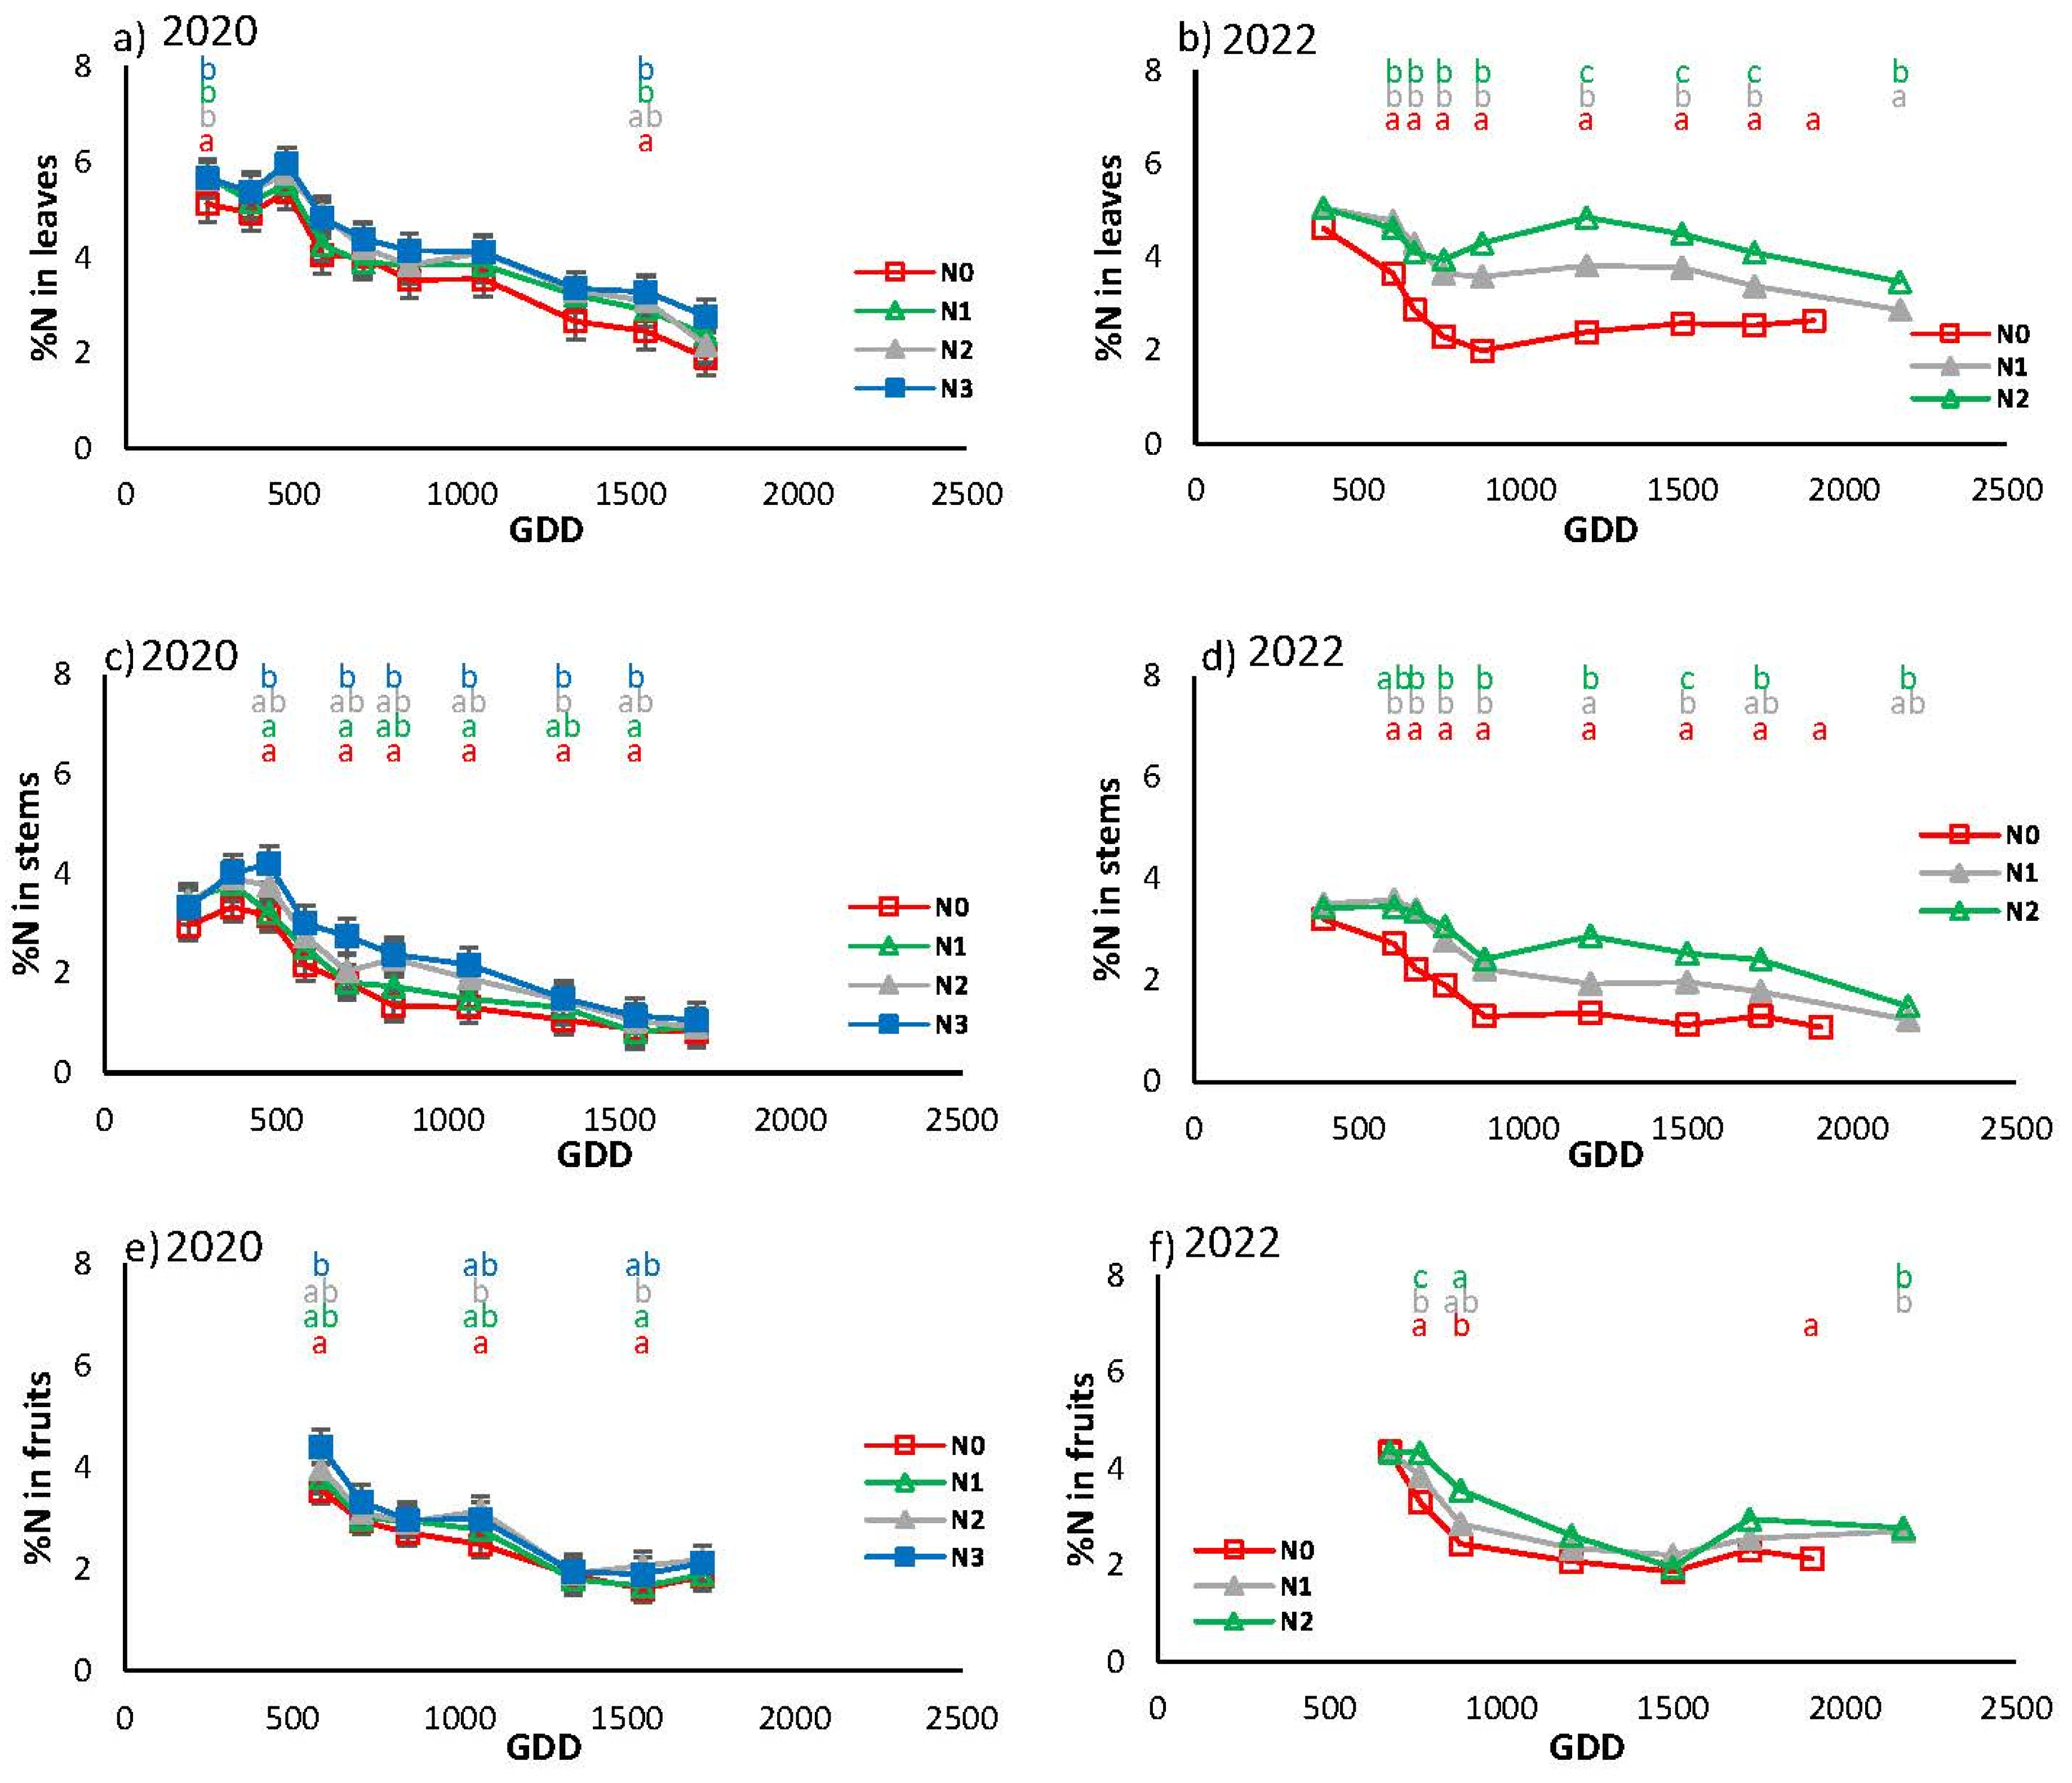
Figure 11 illustrates the seasonal evolution of N concentration in the diverse aerial organs over the two-year period of 2020 and 2022. In both cases, the evolution was characterized by a decrease in concentration in the three organs from GDD 500 to GDD 600, with higher levels observed in the leaves and lower in the fruits. The year 2020 began with higher N concentrations in the leaves than in 2022, while the values were similar in both years in the other organs. The greatest differences between treatments were observed in the stems of plants in 2020 and in the leaves in 2022. In 2020, the N0 treatment differed from the fertilized treatments, while in 2022, the three treatments differed from each other. In the year 2021, the treatments exhibited a similar trend to 2020. In all cases, the fruits were not particularly sensitive to the various fertilizer strategies.
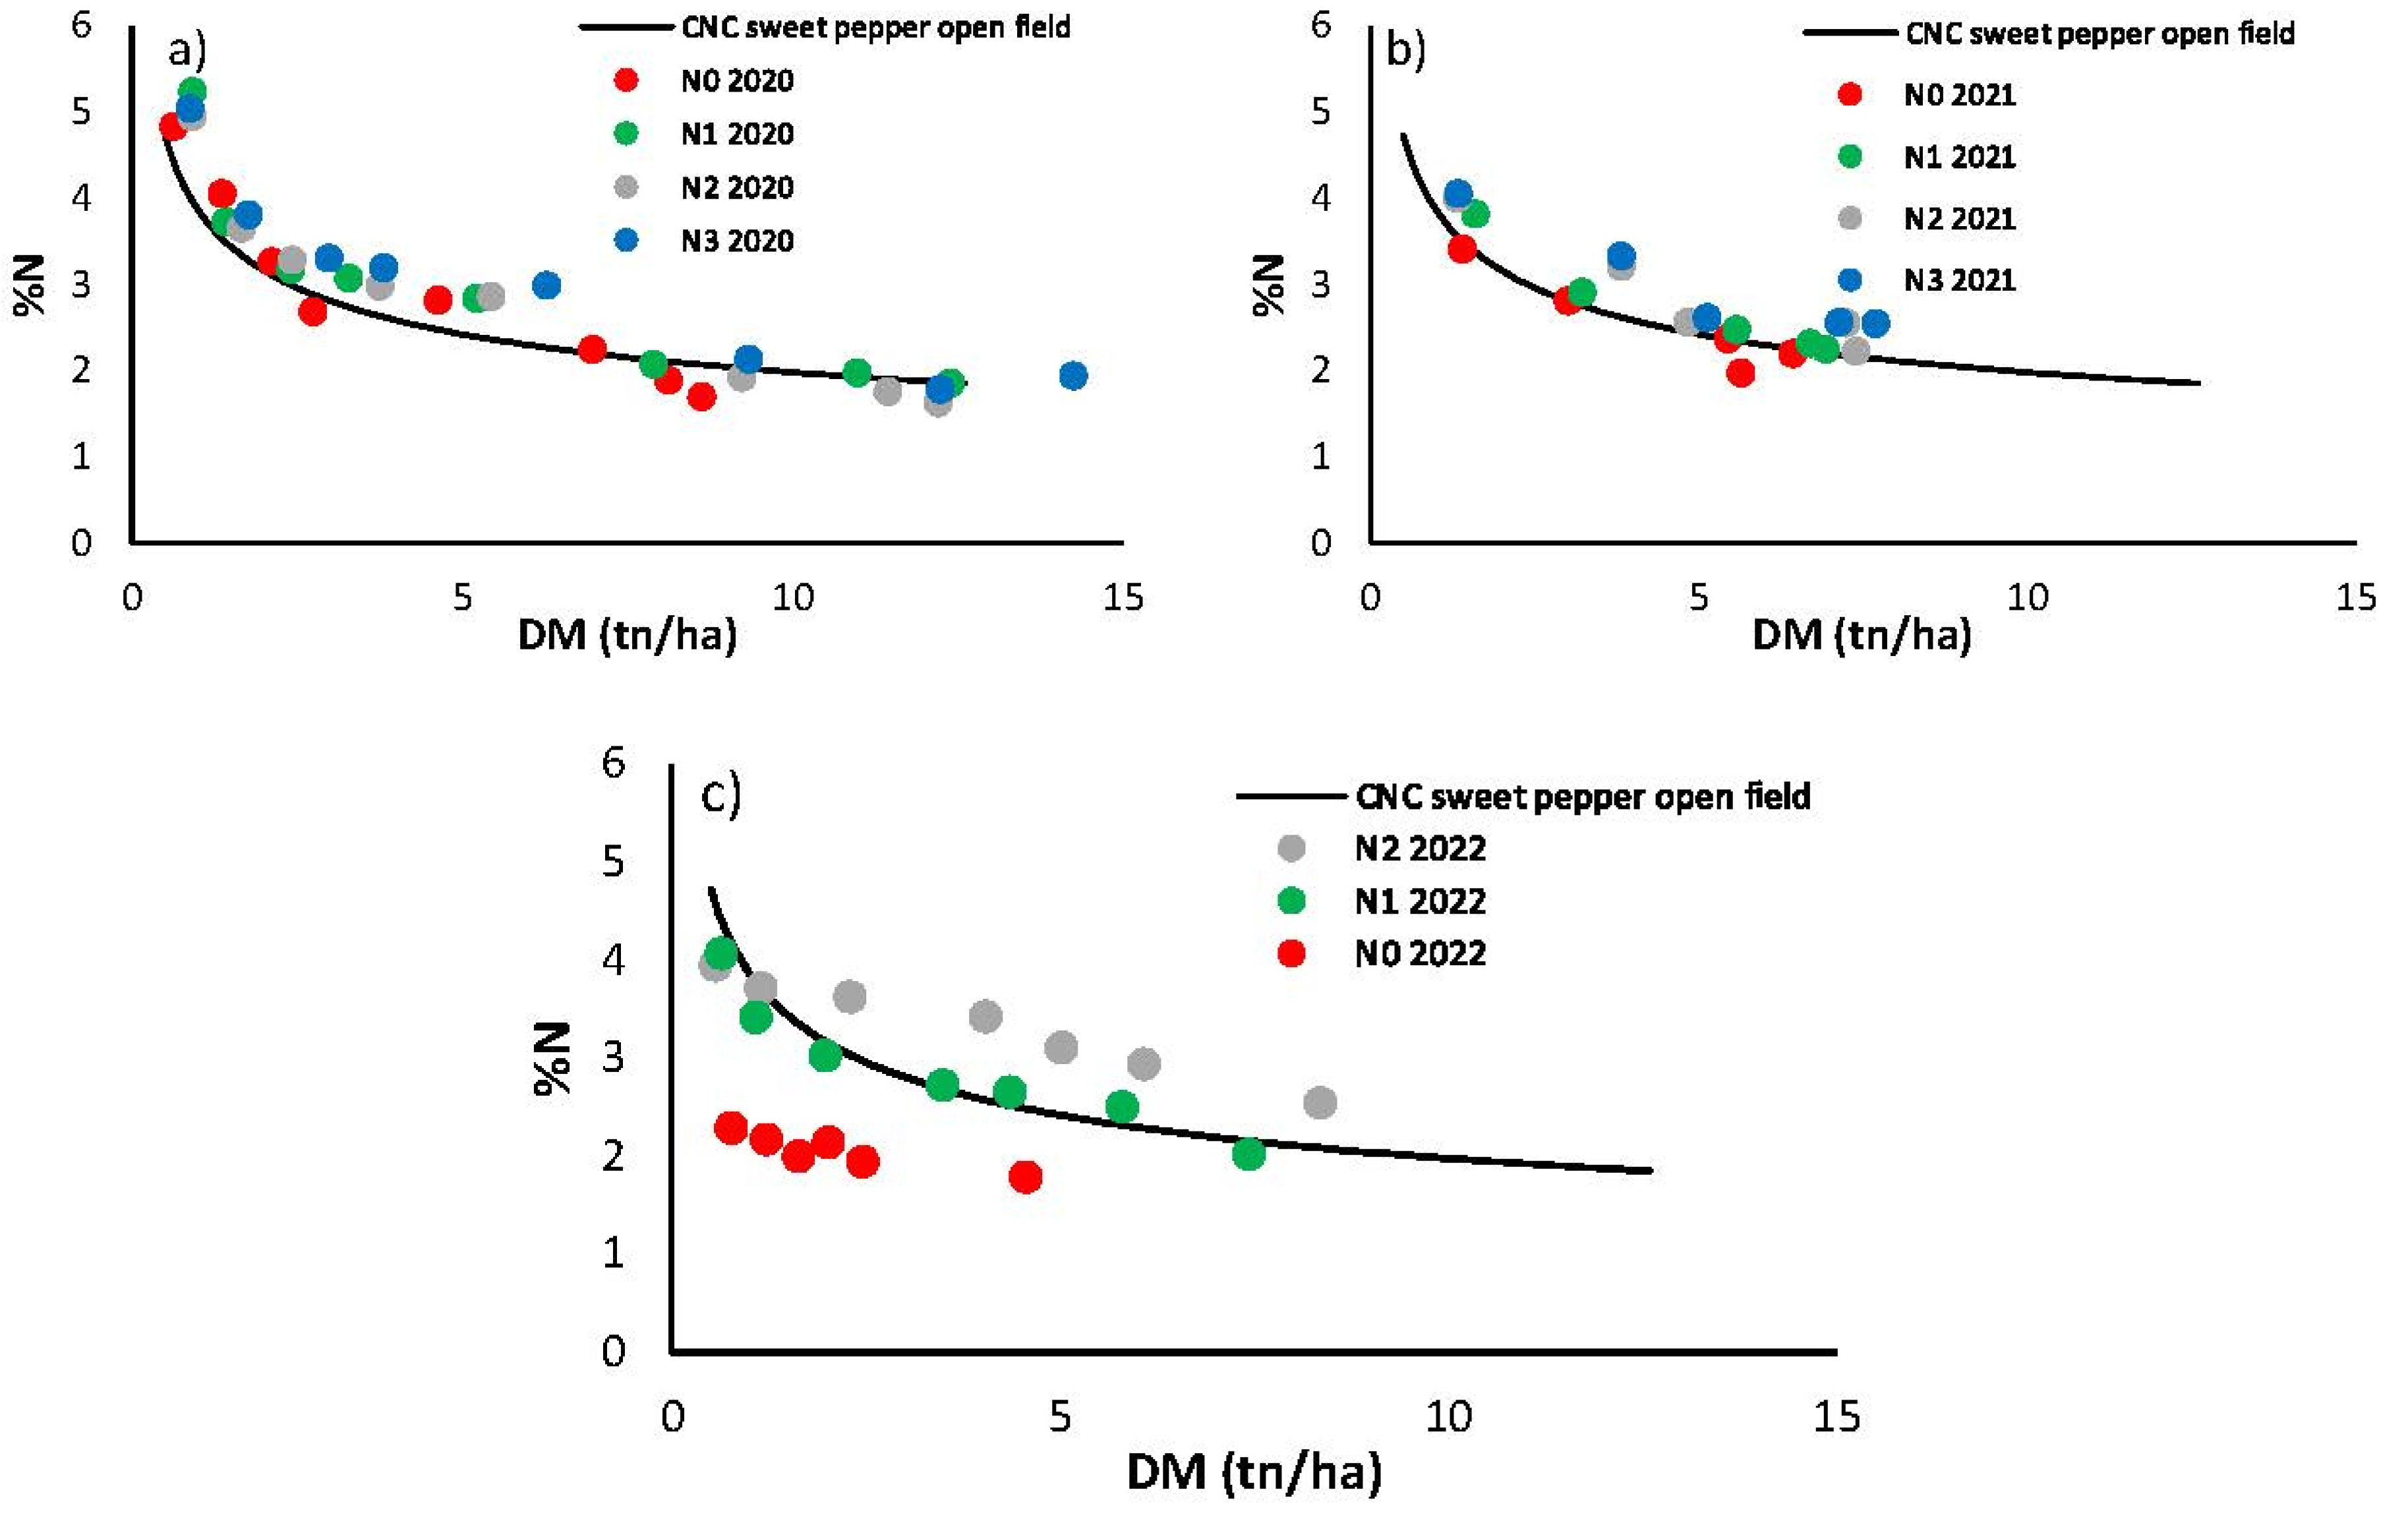
The relationship between %N and biomass produced by the different treatments in the three seasons is shown in
Figure 12. Overlaying the developed CNC, in 2020 all treatments follow the curve. In 2021, slight differences are observed between the N2 and N3 treatments compared to N1 and N0 at the beginning and end of the curve, with the largest differences being around 5 tn/ha. For 2022, there is a clear gradual difference between N0, N1 and N2. In this last season, N0 showed an N deficit and consequently a limitation of DM, N1 was close to the curve while N2 displayed an excessive N percentage showing what Zhang et al. (2008) described as ‘luxury’ N use. In any case, all treatments follow a clear trend throughout the dry matter generation process.
3.5.3. Crop N Uptake
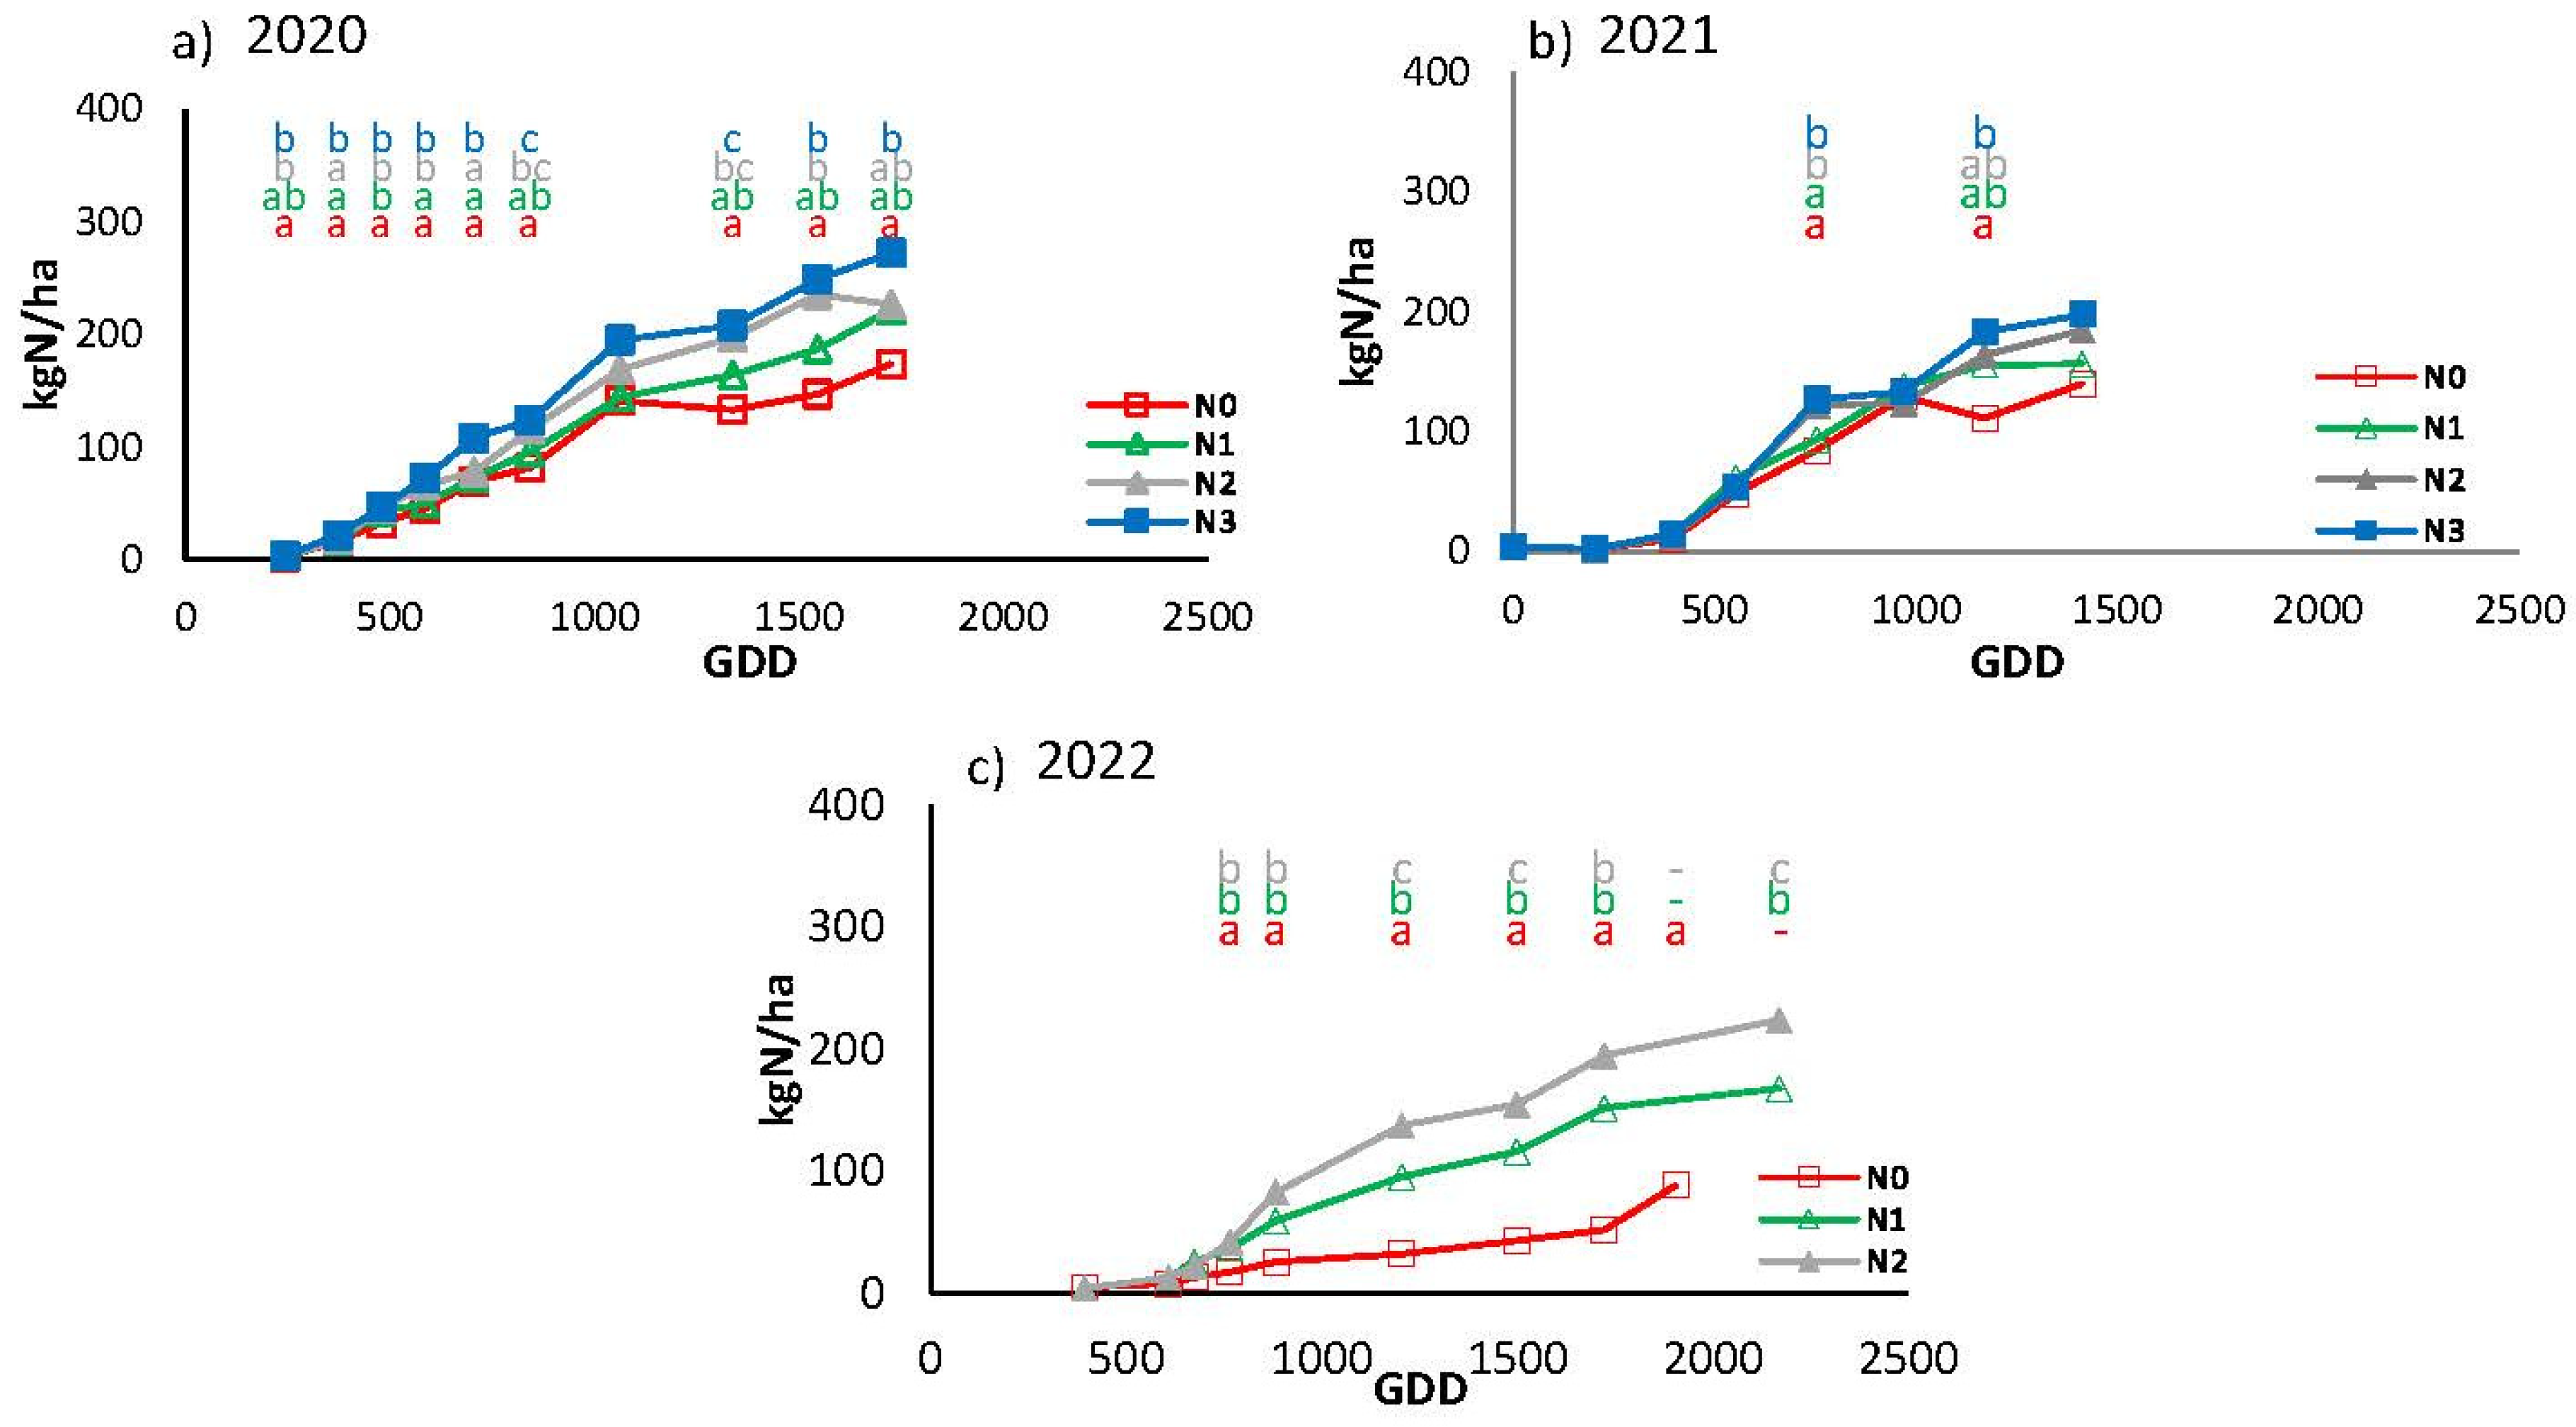
Over the three-year period, the seasonal N uptake pattern was closely correlated with above-ground biomass production (
Figure 13). The highest uptake was observed in the N3 treatment in 2020, with a total value of 272 kg N/ha. In 2021, the highest uptake was 197 kg N/ha, while in 2022 the value was 224 kg N/ha. At the opposite end of the spectrum, the lowest uptake was observed in the N0 treatment in 2022, with a rate of 89 kg N/ha. In 2020, there were notable discrepancies between the N0 and N3 treatments at various points throughout the cycle, apart from GDD 1063 when no differences were observed between any of the treatments. All treatments exhibit a consistent pattern of uptake throughout the cycle, with progressively higher values observed for N0, N1, N2, and N3, in that order. In the 2021 season, the only differences between N0 and N1 with respect to N2 and N3 were observed at GDD 754 and between N0 and N3 at GDD 1171. The largest differences between treatments were obtained in 2022 (
Figure 13c).
As illustrated in
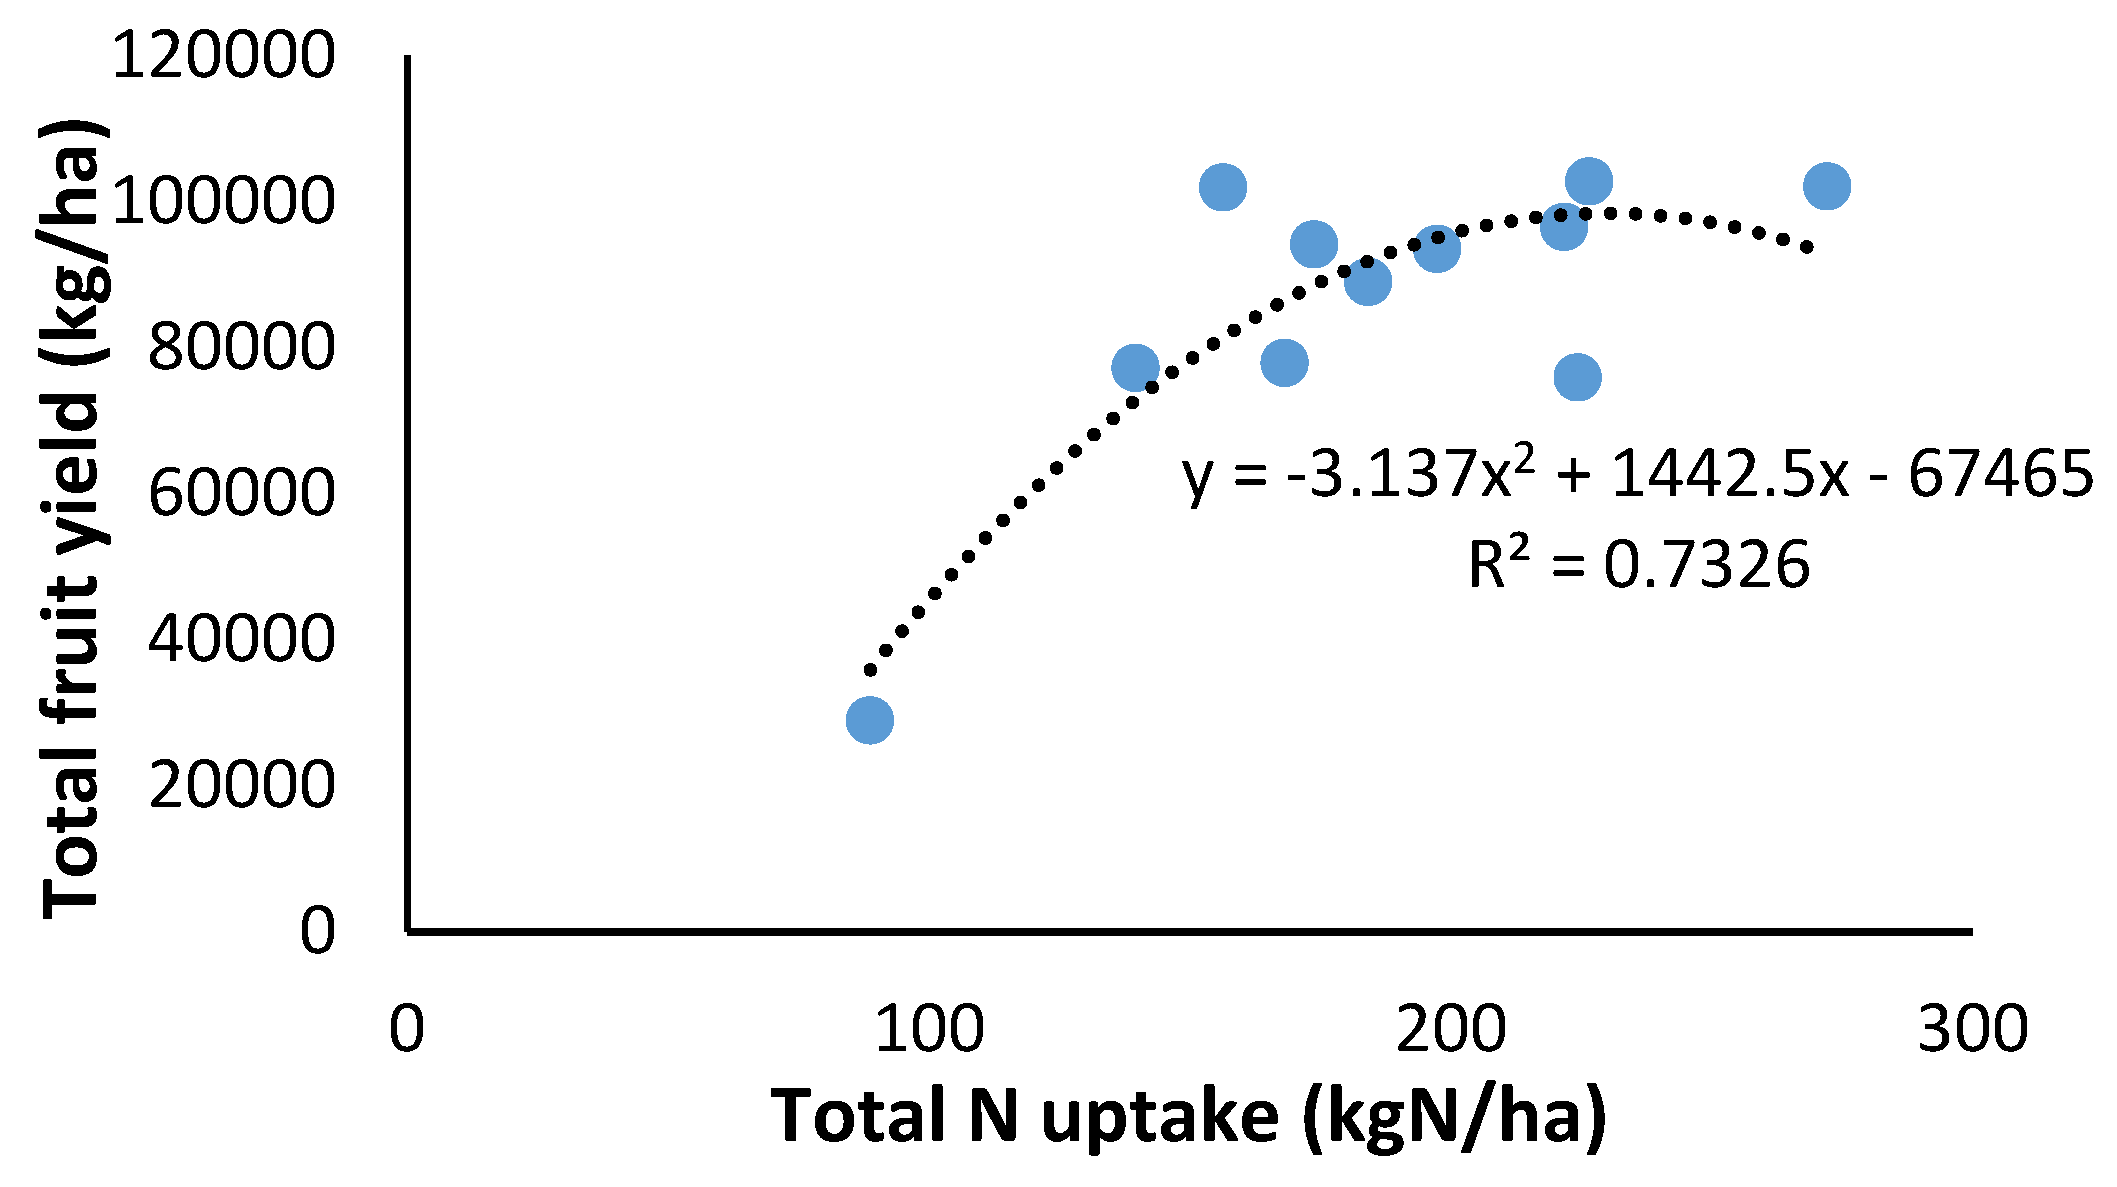
Figure 14, fruit production increases with N uptake. However, beyond an N application rate of 200 kgN/ha, the potential for further yield gains is limited under the conditions of this research.
4. Discussion
The initial section of this paper presents a series of relationships that describe the development pattern of an outdoor industrial sweet pepper crop, which are of interest for the purposes of crop modelling. Models have been developed for greenhouse pepper, including VegSyst (Gallardo et al., 2013), and glasshouse (Marcelis et al., 2006), as well as for other pepper varietals, such as chili peppers (Tang et al., 2023). However, no models have been developed for processing peppers grown in open fields. Given the changes in management and varietal type, it is necessary to adjust the models to ensure their continued efficacy. In this regard, Vegsyst has developed two versions of its model: one for greenhouse tomatoes (Gallardo et al., 2014) and another for outdoor processing tomatoes (Gimenez et al., 2019). The information presented here provides a foundation for making the requisite adjustments to ensure the applicability of pepper models to this variety in an open field setting.
Interception of Radiation and Crop Growth
The models provide information on crop development under optimal conditions. However, due to the multitude of factors that influence plant development, mainly in open field, deviations can occur that modify nutrient uptake. A strong correlation has been established between fi-PAR and fCC (R² = 0.99), which enables the monitoring of plant canopy development through remote sensing. This, in addition to the relationship between fi-PAR and DM, allows for the real-time estimation of aerial biomass production. The incorporation of this information into the development models provides a robust estimation of the nutrient uptake pattern, which can be utilized for fertilizer plan corrections.
The relationship between image analysis and the nutritional status of crops is a subject that has been explored in several studies. For example, Mercado-Luna et al. (2010) investigated the relationship between G/(R+G+B) and the N status of tomato crops, while Yuzhu et al. (2011) explored this relationship in pepper crops. The objective of this study is to utilize the images to quantify N uptake along the crop cycle, with a view to making adjustments to fertilization programs. In this regard, Lukia et al. (1999) employed image analysis to estimate the percentage of plant cover and biomass in wheat. However, no such correlation has been identified in the existing literature with regard to pepper. Therefore, we propose that the establishment of such robust relationships between diverse variables, as evidenced in this study, is advantageous for potential modeling in this crop, whether pertaining to irrigation, fertilization, image analysis, or other factors.
Critical N Dilution Curve
The acquisition of a valid CNC for a given crop is of significant interest, not only for the conversion of dry matter into N uptake under optimal conditions, but also for assessment of the crop’s nutritional status. In this study, the curve obtained under the specified experimental conditions was compared with that published by Rodríguez et al. (2020) for greenhouse bell pepper. The two curves exhibit a similar pattern. However, the percentages of N in dry matter are consistently lower throughout the cycle in open field conditions. This discrepancy may be attributed to differences in environmental conditions, management practices, and varietal types. In greenhouses, crops are subject to continuous harvesting, in contrast to outdoor cultivation which is more spaced. These harvesting practices may promote the continuous production of new photosynthetically active green tissue, thereby maintaining a relatively high N content throughout the greenhouse growing cycle. Another potential reason for this discrepancy is the greater availability of light in greenhouse cultivation, where plants are trellised, resulting in greater height growth and less plant compaction. In contrast, outdoor cultivation is characterized by a rapid reduction in light availability, which subsequently leads to a decline in photosynthesis and a rapid decrease in crop N content (Gastal & Lemaire, 2002). As described by Greenwood et al. (1990), Gastal & Lemaire (2002), Gilles Lemaire et al., (2007) and Seginer (2004), planting density has an impact on N dilution, which may have a comparable effect to that discussed above.
By combining the established relationship between fi-PAR, DM and the CNC, it is possible to derive the following relationship.:
This relationship allows for the monitoring of the minimum required percentage of nitrogen (%N) at each phase of the cycle using either drone flights or satellite images. This is made possible by the established correlation between fi-PAR and fCC. In addition, it would be possible to evaluate the fertilization requirements of the crop and the extent to which these have been met in line with N uptake. This may be accomplished by employing the aforementioned relationships through the fCC of the images, initially obtaining DM and subsequently %Ncrit, with N uptake.
The Impact of Nitrogen Fertilization on Crop Response
Crop performance differed significantly across the three years of the trial, with 2020 being the most productive, both in terms of total aerial biomass and yield. In 2020, the discrepancies between the experimental treatments with regard to biomass production were almost entirely mirrored in the yield of fruit, which remained relatively consistent despite the application of N fertilizer at rates ranging from 0 to 180 kg/ha of N. The mineral N present in the soil at the outset of the crop cycle was 177 kg/ha, and in conjunction with the mineralization of organic matter, it was sufficient to meet the N uptake, which ranged from 200 to 300 kg/ha. In the two subsequent years, the initial mineral N contents were 149 and 109 kg/ha, respectively, in 2021 and 2022. The greatest discrepancies in production between treatments were observed in 2022, when N0 exhibited overt indications of N deficiency and was the least productive. Notwithstanding the absence of N deficiency in the treatments in 2021 and 2022, their productivity remained inferior to that of the 2020 treatments. The initial leaf N concentration was lower in 2021 and 2022 than in 2020 (
Figure 11), despite the soil mineral N content being sufficient to meet plant needs at these early stages. As illustrated in
Figure 9, the highest percentage of dry matter corresponded to fruits, which represent the most significant yield component. The interannual differences in production and flower set, in addition to a longer harvesting period in 2020, were responsible for the observed variations. In 2022, the temperature was exceedingly high, occurring concurrently with the peak flowering period, which may have negatively impacted flowering and fruit set. As posited by Van Eerd (2007), the lack of yield response to N observed in sweet pepper trials conducted in disparate locations can be partially attributed to the prevailing hot and dry climatic conditions, wherein humidity, rather than N, constitutes the most limiting growth factor. The conditions under which this study was conducted are representative of those typically found in the region. The grouping of ripening is an important aspect for processing peppers to reduce harvesting costs. While the nitrogen-free treatment exhibited some advancement and greater clustering of fruit ripening, the differences observed between this treatment and the other treatments were minimal.
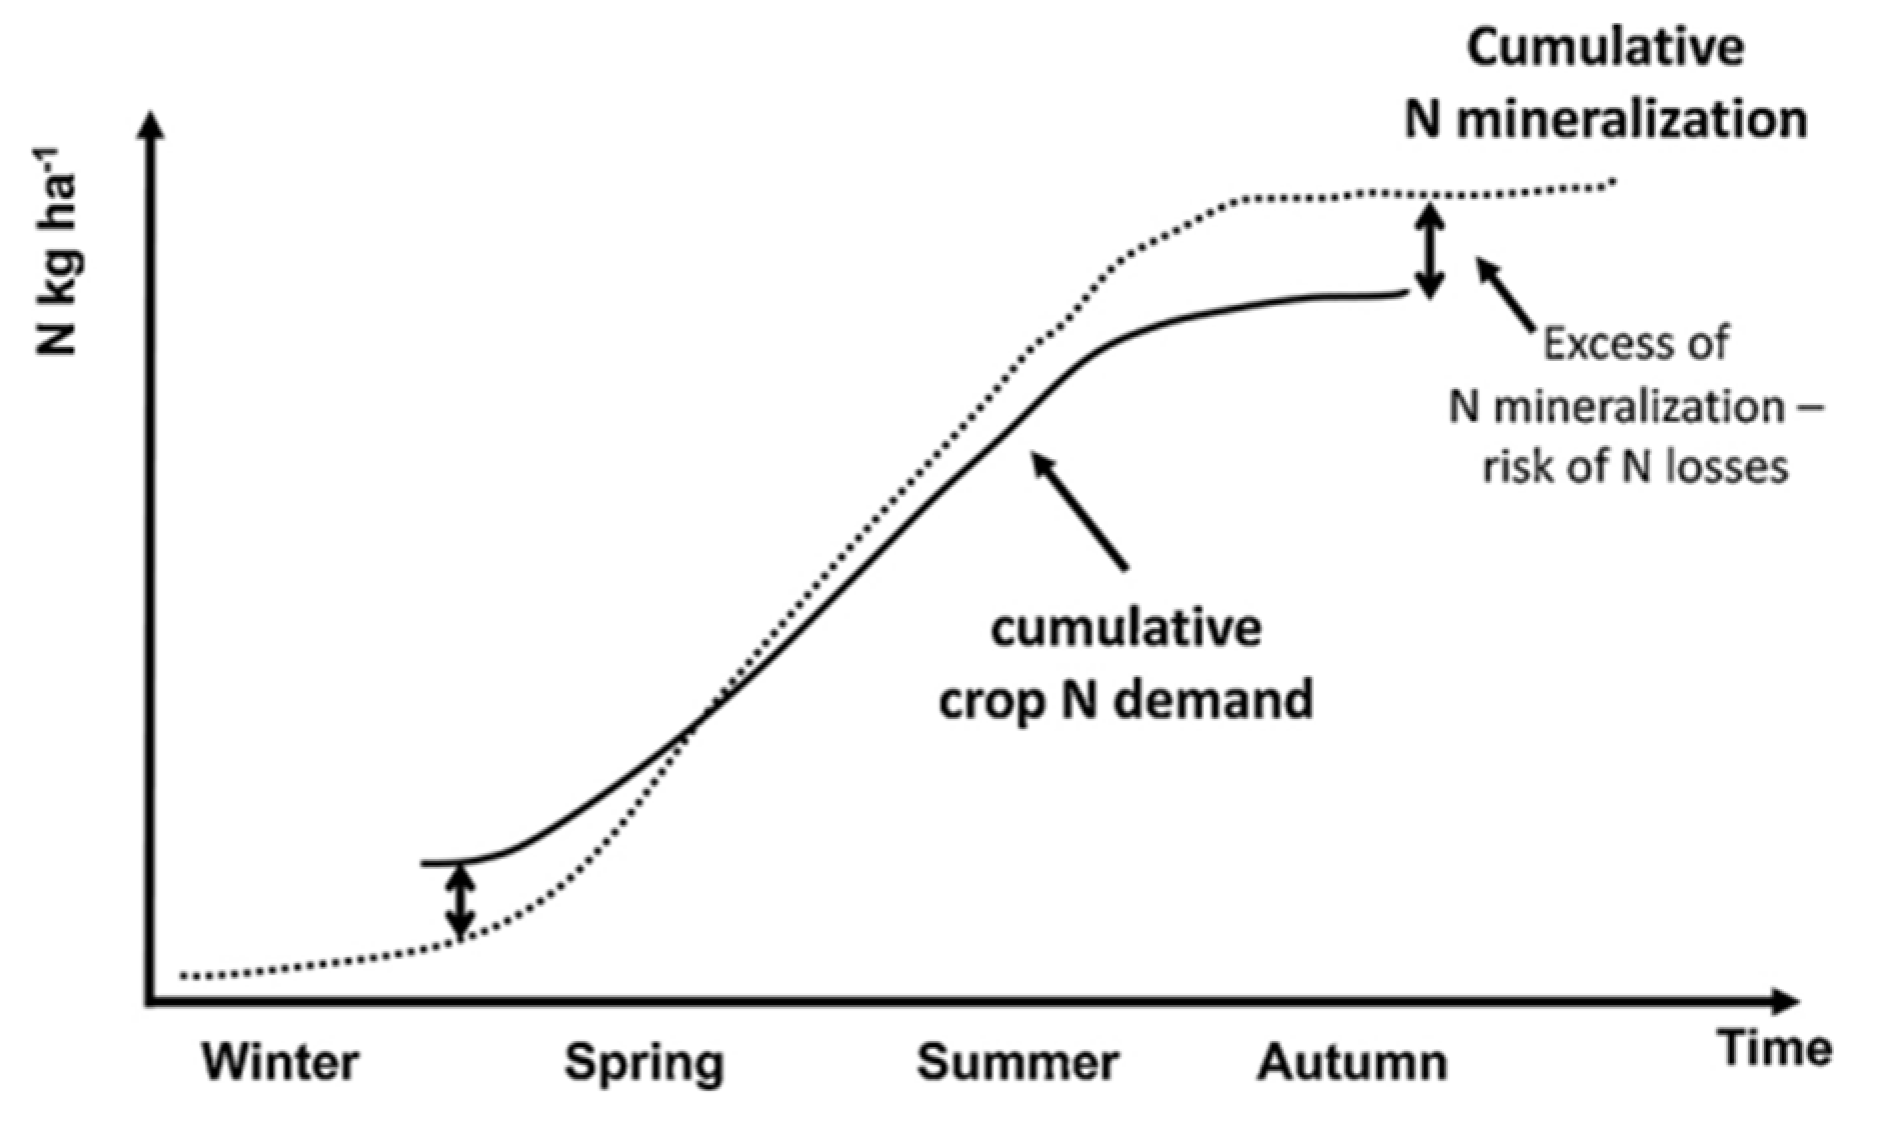
In the three-year trial period, the highest yields were obtained with N inputs equal to or less than 200 kgN/ha, which represents the maximum dose permitted in Extremadura by regulations for areas vulnerable to nitrate contamination (Directive 91/676/EEC, 1991). Some sources recommend higher doses for outdoor bell pepper cultivation, exceeding the aforementioned limit. For instance, Zhang et al. (2023) conducted experiments in China with an N input of 225 kgN/ha, while Kuşçu et al. (2016) sed 240 kgN/ha in Turkey. Hartz et al. (1993) applied up to 252 kgN/ha in California. Nevertheless, lower doses have also been identified, ranging from 125 to 150 kgN/ha (Kong et al., 2012; Saqib et al., 2023) with Sambo et al. (2004) proposing 120 kgN/ha in alignment with the findings of this study. These findings underscore the necessity of integrating the mineralization of plant debris into the fertilization plan, in addition to the mineral N applied at the outset of the crop cycle. Tei et al. (2020) highlighted this point by indicating, as can be seen in
Figure 15, that at the moment of transplanting a mineralization process is initiated which results in the excessive availability of mineralized N along the crop cycle, without the need to take advantage of the applications made.
Notwithstanding the fluctuations in yield observed in the course of the field experiments over time, the results consistently exceeded the regional average in Extremadura, which stands at approximately 45,000 kg/ha (MAPA, 2021). Moreover, these outcomes surpass the yield data documented by other researchers for industrial bell pepper cultivated under open-air conditions. In Turkey, the yield was 48,000 kg/ha (Kuşçu et al., 2016), while in China it was 46,540 kg/ha (Kong et al., 2012).
Crop N Uptake and Nutritional Status
The results obtained provide information of practical interest for the elaboration and readjustment of the N fertilization plan for an industrial bell pepper crop of this type. As illustrated in
Figure 14, maximum fruit production is achieved with inputs of 200 kgN/ha, with higher inputs not resulting in higher yields. The uptake pattern is marked by the evolution of the aerial biomass, which can be monitored by sensor-based techniques. Furthermore, the relationships obtained allow corrections to be made thanks to the modelling of industrial peppers grown in open fields.
A further aspect to consider in the context of fertilization plans is the characterization of nutritional status. In the case of N, foliar diagnosis requires specific observations. This element is subject to what is referred to as “luxury consumption” (Zhang et al., 2008). In 2022, the most notable contrasts between treatments were observed in various parameters measured. However, the discrepancies in foliar %N between N1 and N2 were not sustained in fruit production. Conversely, when comparing the seasonal evolution of these foliar concentrations in 2020 and 2022, it is challenging to propose valid reference levels for both years. A more reliable reference point is the critical curve, which was maintained by all treatments in the 2020 and 2021 trials. This is consistent with the observed evolution of the same. However, in 2022, the critical curve shows clear differences between treatments, indicating N0 as deficient and N2 as over-fertilized. The diagnostic system is valid for applications involving the production of 1 tn/ha of aerial dry matter (Justes et al., 1994; Ziadi et al., 2010).
5. Conclusions
This paper presents a set of relationships that characterize the seasonal evolution of an outdoor processing pepper crop. The relationships concern the vegetative development of the crop, the flowering and fruiting pattern, as well as the critical nitrogen curve. This information will be useful for the adaptation of simulation models as Vegsyst to outdoor processing pepper.
The productivity of the pepper crop under the experimental conditions displayed variability between years, as well as a differential response to the same increasing doses of N fertilizer, depending on the agro-climatic conditions and the initial availability of N in the soil.
The findings of this study indicate the need for a re-evaluation of annual fertilization plans in order to account for actual nutrient uptake by the plants. The critical nitrogen curve obtained has proven to be a reliable reference for the assessment of nutritional deficiencies, such as excess consumption of this element. The doses of nitrogen applied that obtained the best yield results were around 120 kg N/ha, much lower than those applied in the region of this study. Therefore, over-fertilization of the crop in this region is also evident.
Funding
This research was funded by Junta de Extremadura, grant number PD18069, by Ministerio de Ciencia, Innovación y Universidades, grant number RTI2018-095298 and PDC2022-133936-I00.
Acknowledgments
Eugenio Márquez is thanked for his technical work.
Conflicts of Interest
The authors declare no conflicts of interest.
References
- MAPA, 2018 Anuario de Estadística 2018. Ministerio de Agricultura, Pesca y Alimentación. Spanish National Goverment. Available online: https://www.mapa.gob.es/es/estadistica/temas/estadisticas-agrarias/agricultura/superficies-producciones-anuales-cultivos/ (accessed on 27 October 2021).
- Flores, P.; Castellar, I.; Hellín, P.; Fenoll, J.; Navarro, J. Response of Pepper Plants to Different Rates of Mineral Fertilizers after Soil Biofumigation and Solarization. J. Plant Nutr. 2007, 30, 367–379. [Google Scholar] [CrossRef]
- Medina-Lara, F.; Echevarría-Machado, I.; Pacheco-Arjona, R.; Ruiz-Lau, N.; Guzmán-Antonio, A.; Martinez-Estevez, M. Influence of Nitrogen and Potassium Fertilization on Fruiting and Capsaicin Content in Habanero Pepper (Capsicum chinense Jacq. ). HortScience 2008, 43, 1549–1554. [Google Scholar] [CrossRef]
- Yasuor, H.; Ben-Gal, A.; Yermiyahu, U.; Beit-Yannai, E.; Cohen, S. Nitrogen Management of Greenhouse Pepper Production: Agronomic, Nutritional, and Environmental Implications. HortScience 2013, 48, 1241–1249. [Google Scholar] [CrossRef]
- da Silva, J.M.; Fontes, P.C.R.; Milagres, C.d.C.; de Abreu, J.A.A. Yield and Nitrogen Use Efficiency of Bell Pepper Grown in SLAB Fertigated with Different Nitrogen Rates. J. Plant Nutr. 2020, 43, 2833–2843. [Google Scholar] [CrossRef]
- Grasso, R.; de Souza, R.; Peña-Fleitas, M.T.; Gallardo, M.; Thompson, R.B.; Padilla, F.M. Root and Crop Responses of Sweet Pepper (Capsicum Annuum) to Increasing N Fertilization. Sci. Hortic. (Amsterdam). 2020, 273. [Google Scholar] [CrossRef]
- Rodríguez, A.; Peña-Fleitas, M.T.; Gallardo, M.; de Souza, R.; Padilla, F.M.; Thompson, R.B. Sweet Pepper and Nitrogen Supply in Greenhouse Production: Critical Nitrogen Curve, Agronomic Responses and Risk of Nitrogen Loss. Eur. J. Agron. 2020, 117. [Google Scholar] [CrossRef]
- Saqib, M.; Anjum, M.A.; Hoogenboom, G. The Performance of Sweet Pepper Cultivars under Different Nitrogen Levels in a Semi-Arid Environment. J. Plant Nutr. 2023, 46, 984–995. [Google Scholar] [CrossRef]
- Sambo*, P.; Borsato, D.; Gianquinto, G. Effect of Nitrogen Fertilization on Yield and Canopy Reflectance of Pepper (Capsicum Annuum). HortScience 2004, 39, 871C–871. [Google Scholar] [CrossRef]
- Ladha, J.K.; Jat, M.L.; Stirling, C.M.; Chakraborty, D.; Pradhan, P.; Krupnik, T.J.; Sapkota, T.B.; Pathak, H.; Rana, D.S.; Tesfaye, K.; et al. Achieving the Sustainable Development Goals in Agriculture: The Crucial Role of Nitrogen in Cereal-Based Systems. Adv. Agron. 2020, 163, 39–116. [Google Scholar] [CrossRef]
- Evans, J.R.; Clarke, V.C. The Nitrogen Cost of Photosynthesis. J. Exp. Bot. 2019, 70, 7–15. [Google Scholar] [CrossRef]
- Ata-Ul-Karim, S.T.; Cang, L.; Wang, Y.; Zhou, D. Effects of Soil Properties, Nitrogen Application, Plant Phenology, and Their Interactions on Plant Uptake of Cadmium in Wheat. J. Hazard. Mater. 2020, 384. [Google Scholar] [CrossRef]
- Thompson, R.B.; Martínez-Gaitan, C.; Gallardo, M.; Giménez, C.; Fernández, M.D. Identification of Irrigation and N Management Practices That Contribute to Nitrate Leaching Loss from an Intensive Vegetable Production System by Use of a Comprehensive Survey. Agric. Water Manag. 2007, 89, 261–274. [Google Scholar] [CrossRef]
- Galloway, J. The Global Nitrogen Cycle: Changes and Consequences-All Databases; 1998; pp. 15–24.
- Li, X.; Ata-UI-Karim, S.T.; Li, Y.; Yuan, F.; Miao, Y.; Yoichiro, K.; Cheng, T.; Tang, L.; Tian, X.; Liu, X.; et al. Advances in the Estimations and Applications of Critical Nitrogen Dilution Curve and Nitrogen Nutrition Index of Major Cereal Crops. A Review. Comput. Electron. Agric. 2022, 197, 106998. [Google Scholar] [CrossRef]
- Vega-Castellote, M.; Pérez-Marín, D.; Torres, I.; Sánchez, M.T. Online NIRS Analysis for the Routine Assessment of the Nitrate Content in Spinach Plants in the Processing Industry Using Linear and Non-Linear Methods. LWT 2021, 151. [Google Scholar] [CrossRef]
- Jaworska, G. Content of Nitrates, Nitrites, and Oxalates in New Zealand Spinach. Food Chem. 2005, 89, 235–242. [Google Scholar] [CrossRef]
- Fereres, E.; Goldhamer, D.A.; Parsons, L.R. Irrigation Water Management of Horticultural Crops. HortScience 2003, 38, 1036–1042. [Google Scholar] [CrossRef]
- Neeteson, J.J. Look at It This Way. Outlook Agric. 1994, 23, 3–4. [Google Scholar] [CrossRef]
- Directive 91/676/EEC Directive 91/676/EEC of 12 December 1991 Concerning the Protection of Waters against Pollution Caused by Nitrates from Agricultural Sources. Off. J. L 1991, 375, 1–8.
- Thompson, R.B.; Incrocci, L.; van Ruijven, J.; Massa, D. Reducing Contamination of Water Bodies from European Vegetable Production Systems. Agric. Water Manag. 2020, 240. [Google Scholar] [CrossRef]
- Biernbaum, J.A. Root-Zone Management of Greenhouse Container-Grown Crops to Control Water and Fertilizer. undefined 1992, 2, 127–132. [Google Scholar] [CrossRef]
- Zhu, J.H.; Li, X.L.; Christie, P.; Li, J.L. Environmental Implications of Low Nitrogen Use Efficiency in Excessively Fertilized Hot Pepper (Capsicum Frutescens L.) Cropping Systems. Agric. Ecosyst. Environ. 2005, 111, 70–80. [Google Scholar] [CrossRef]
- Larsen, R. International Society for Horticultural Science. Section Vegetables.ISHS Working Group on Vegetable Nutrition and Fertilization. Proceedings of the IVth International Symposium on Ecologically Sound Fertilization Strategies for Field Vegetable Production. Malmö, September 22-25, 2008. 2010, 345.
- MacHet, J.M.; Dubrulle, P.; Damay, N.; Duval, R.; Julien, J.L.; Recous, S. A Dynamic Decision‐Making Tool for Calculating the Optimal Rates of N Application for 40 Annual Crops While Minimising the Residual Level of Mineral N at Harvest. Agronomy 2017, 7. [CrossRef]
- Feller, C. N-Expert – Fertiliser Recommendations for Field Vegetables Available online:. Available online: https://n-expert.igzev.de/ (accessed on 16 December 2022).
- Gallardo, M.; Fernández, M.D.; Giménez, C.; Padilla, F.M.; Thompson, R.B. Revised VegSyst Model to Calculate Dry Matter Production, Critical N Uptake and ETc of Several Vegetable Species Grown in Mediterranean Greenhouses. Agric. Syst. 2016, 146, 30–43. [Google Scholar] [CrossRef]
- Gallardo, M.; Thompson, R.B.; Giménez, C.; Padilla, F.M.; Stöckle, C.O. Prototype Decision Support System Based on the VegSyst Simulation Model to Calculate Crop N and Water Requirements for Tomato under Plastic Cover. Irrig. Sci. 2014, 32, 237–253. [Google Scholar] [CrossRef]
- Gallardo, M.; Fernández, M.D.; Giménez, C.; Padilla, F.M.; Thompson, R.B. Revised VegSyst Model to Calculate Dry Matter Production, Critical N Uptake and ETc of Several Vegetable Species Grown in Mediterranean Greenhouses. Agric. Syst. 2016, 146, 30–43. [Google Scholar] [CrossRef]
- Giménez, C.; Gallardo, M.; Martínez-Gaitán, C.; Stöckle, C.O.; Thompson, R.B.; Granados, M.R. VegSyst, a Simulation Model of Daily Crop Growth, Nitrogen Uptake and Evapotranspiration for Pepper Crops for Use in an on-Farm Decision Support System. Irrig. Sci. 2013, 31, 465–477. [Google Scholar] [CrossRef]
- Gallardo, M.; Gimenez, C.; Fernández, M.D.; Padilla, F.M.; Thompson, R.B. Use of the VegSyst Model to Calculate Crop N Uptake and Crop Evapotranspiration of Autumn- and Spring-Grown Cucumber in Mediterranean Greenhouses. Acta Hortic. 2017, 1154, 47–54. [Google Scholar] [CrossRef]
- Gallardo, M.; Giménez, C.; Martínez-Gaitán, C.; Stöckle, C.O.; Thompson, R.B.; Granados, M.R. Evaluation of the VegSyst Model with Muskmelon to Simulate Crop Growth, Nitrogen Uptake and Evapotranspiration. Agric. Water Manag. 2011, 101, 107–117. [Google Scholar] [CrossRef]
- Giménez, C.; Thompson, R.B.; Prieto, M.H.; Suárez-Rey, E.; Padilla, F.M.; Gallardo, M. Adaptation of the VegSyst Model to Outdoor Conditions for Leafy Vegetables and Processing Tomato. Agric. Syst. 2019, 171, 51–64. [Google Scholar] [CrossRef]
- Justes, E.; Mary, B.; Meynard, J.M.; Machet, J.M.; Thelier-Huche, L. Determination of a Critical Nitrogen Dilution Curve for Winter Wheat Crops. Ann. Bot. 1994, 74, 397–407. [Google Scholar] [CrossRef]
- HUANG, S.; MIAO, Y.; CAO, Q.; YAO, Y.; ZHAO, G.; YU, W.; SHEN, J.; YU, K.; BARETH, G. A New Critical Nitrogen Dilution Curve for Rice Nitrogen Status Diagnosis in Northeast China. Pedosphere 2018, 28, 814–822. [Google Scholar] [CrossRef]
- Song, L.; Wang, S.; Ye, W. Establishment and Application of Critical Nitrogen Dilution Curve for Rice Based on Leaf Dry Matter. Agronomy 2020, 10. [Google Scholar] [CrossRef]
- Yue, S.C.; Sun, F.L.; Meng, Q.F.; Zhao, R.F.; Li, F.; Chen, X.P.; Zhang, F.S.; Cui, Z.L. Validation of a Critical Nitrogen Curve for Summer Maize in the North China Plain. Pedosphere 2014, 24, 76–83. [Google Scholar] [CrossRef]
- Giletto, C.M.; Echeverría, H.E. Critical Nitrogen Dilution Curve for Processing Potato in Argentinean Humid Pampas. Am. J. Potato Res. 2012, 89, 102–110. [Google Scholar] [CrossRef]
- Ben Abdallah, F.; Olivier, M.; Goffart, J.P.; Minet, O. Establishing the Nitrogen Dilution Curve for Potato Cultivar Bintje in Belgium. Potato Res. 2016, 59, 241–258. [Google Scholar] [CrossRef]
- Tei, F.; Benincasa, P.; Guiducci, M. Critical Nitrogen Concentration in Processing Tomato. Eur. J. Agron. 2002, 18, 45–55. [Google Scholar] [CrossRef]
- Padilla, F.M.; Peña-Fleitas, M.T.; Gallardo, M.; Thompson, R.B. Threshold Values of Canopy Reflectance Indices and Chlorophyll Meter Readings for Optimal Nitrogen Nutrition of Tomato. Ann. Appl. Biol. 2015, 166, 271–285. [Google Scholar] [CrossRef]
- Padilla, F.M.; Peña-Fleitas, M.T.; Gallardo, M.; Thompson, R.B. Proximal Optical Sensing of Cucumber Crop N Status Using Chlorophyll Fluorescence Indices. Eur. J. Agron. 2016, 73, 83–97. [Google Scholar] [CrossRef]
- Survey Staff, S. Soil Taxonomy A Basic System of Soil Classification for Making and Interpreting Soil Surveys United States Department of Agriculture Natural Resources Conservation Service. 1999.
- Egli, D.B. Mechanisms Responsible for Soybean Yield Response to Equidistant Planting Patterns. Agron. J. 1994, 86, 1046–1049. [Google Scholar] [CrossRef]
- Board, J.E.; Kamal, M.; Harville, B.G. Temporal Importance of Greater Light Interception to Increased Yield in Narrow-Row Soybean. Agron. J. 1992, 84, 575–579. [Google Scholar] [CrossRef]
- Campillo, C.; Prieto, M.H.; Daza, C.; Moñino, M.J.; García, M.I. Using Digital Images to Characterize Canopy Coverage and Light Interception in a Processing Tomato Crop. HortScience 2008, 43, 1780–1786. [Google Scholar] [CrossRef]
- Rodríguez, A.; Peña-Fleitas, M.T.; Gallardo, M.; de Souza, R.; Padilla, F.M.; Thompson, R.B. Sweet Pepper and Nitrogen Supply in Greenhouse Production: Critical Nitrogen Curve, Agronomic Responses and Risk of Nitrogen Loss. Eur. J. Agron. 2020, 117, 126046. [Google Scholar] [CrossRef]
- Lacasa, J.; Hefley, T.J.; Otegui, M.E.; Ciampitti, I.A. A Practical Guide to Estimating the Light Extinction Coefficient with Nonlinear Models—a Case Study on Maize. Plant Methods 2021, 17. [Google Scholar] [CrossRef] [PubMed]
- Kiniry, J.; Johnson, M.V.; Mitchell, R.; Vogel, K.; Kaiser, J.; Bruckerhoff, S.; Cordsiemon, R. Switchgrass Leaf Area Index and Light Extinction Coefficients. Agron. J. 2011, 103, 119–122. [Google Scholar] [CrossRef]
- Greenwood, D.J.; Lemaire, G.; Gosse, G.; Cruz, P.; Draycott, A.; Neeteson, J.J. Decline in Percentage N of C3 and C4 Crops with Increasing Plant Mass. 1990, 425–436.
- Ziadi, N.; Bélanger, G.; Claessens, A.; Lefebvre, L.; Cambouris, A.N.; Tremblay, N.; Nolin, M.C.; Parent, L.É. Determination of a Critical Nitrogen Dilution Curve for Spring Wheat. Agron. J. 2010, 102, 241–250. [Google Scholar] [CrossRef]
- Sempere, A.; Oliver, J.; Ramos, C. Simple Determination of Nitrate in Soils by Second-Derivative Spectroscopy. J. Soil Sci. 1993, 44, 633–639. [Google Scholar] [CrossRef]
- Rhine, E.D.; Mulvaney, R.L.; Pratt, E.J.; Sims, G.K. Improving the Berthelot Reaction for Determining Ammonium in Soil Extracts and Water. Soil Sci. Soc. Am. J. 1998, 62, 473–480. [Google Scholar] [CrossRef]
- Marcelis, L.F.M.; Elings, A.; Dieleman, J.A.; De Visser, P.H.B.; Brajeul, E.; Bakker, M.J.; Heuvelink, E. Modelling Dry Matter Production and Partitioning in Sweet Pepper. Acta Hortic. 2006, 718, 121–128. [Google Scholar] [CrossRef]
- Lemaire, G.; Gastal, F. N Uptake and Distribution in Plant Canopies. Diagnosis Nitrogen Status Crop. 1997, 3–43. [Google Scholar] [CrossRef]
- Zhang, J.; Blackmer, A.M.; Ellsworth, J.W.; Kyveryga, P.M.; Blackmer, T.M.; Zhang, J.; Hwy, G. ; Blackmer, ; A M; Kyveryga, P. M.; Blackmer, T.M. Luxury Production of Leaf Chlorophyll and Mid-Season Recovery from Nitrogen Deficiencies in Corn. Wiley Online Libr. Zhang, AM Blackmer, JW Ellsworth, PM Kyveryga, TM BlackmerAgronomy Journal, 2008•Wiley Online Libr. 2008, 100, 658–664. [Google Scholar] [CrossRef]
- Gastal, F.; Lemaire, G. N Uptake and Distribution in Crops: An Agronomical and Ecophysiological Perspective. J. Exp. Bot. 2002, 53, 789–799. [Google Scholar] [CrossRef] [PubMed]
- Lemaire, G.; van Oosterom, E.; Sheehy, J.; Jeuffroy, M.H.; Massignam, A.; Rossato, L. Is Crop N Demand More Closely Related to Dry Matter Accumulation or Leaf Area Expansion during Vegetative Growth? F. Crop. Res. 2007, 100, 91–106. [Google Scholar] [CrossRef]
- Seginer, I. Plant Spacing Effect on the Nitrogen Concentration of a Crop. Eur. J. Agron. 2004, 21, 369–377. [Google Scholar] [CrossRef]
- Van Eerd, L.L. Evaluation of Different Nitrogen Use Efficiency Indices Using Field-Grown Green Bell Peppers (Capsicum annuum L.). 2007, 87, 565–569. [CrossRef]
- Kuşçu, H.; Turhan, A.; Özmen, N.; Aydınol, P.; Demir, A.O. Response of Red Pepper to Deficit Irrigation and Nitrogen Fertigation. Arch. Agron. Soil Sci. 2016, 62, 1396–1410. [Google Scholar] [CrossRef]
- Kong, Q.; Li, G.; Wang, Y.; Huo, H. Bell Pepper Response to Surface and Subsurface Drip Irrigation under Different Fertigation Levels. Irrig. Sci. 2012, 30, 233–245. [Google Scholar] [CrossRef]
- Tei, F.; De Neve, S.; de Haan, J.; Kristensen, H.L. Nitrogen Management of Vegetable Crops. Agric. Water Manag. 2020, 240. [Google Scholar] [CrossRef]
- MAPA, 2021 Anuario de Estadística 2021. Ministerio de Agricultura, Pesca y Alimentación. Spanish National Goverment. Available online: https://www.mapa.gob.es/es/estadistica/temas/publicaciones/anuario-de-estadistica/2021/default.aspx?parte=3&capitulo=07&grupo=6 (accessed on 4 September 2023).
Figure 1.
Zenithal photo of the crop performance ‘reclassification method’ of Campillo et al. (2008).
Figure 1.
Zenithal photo of the crop performance ‘reclassification method’ of Campillo et al. (2008).
Figure 2.
Seasonal evolution of cumulative dry matter (DM) as a function of growing degree days (GDD) under non-nitrogen limiting conditions for the years 2020, 2021 and 2022. Each point is the average of 4 measurements in the elementary replicate plots.
Figure 2.
Seasonal evolution of cumulative dry matter (DM) as a function of growing degree days (GDD) under non-nitrogen limiting conditions for the years 2020, 2021 and 2022. Each point is the average of 4 measurements in the elementary replicate plots.
Figure 3.
Relationship between the percentage of crop cover (fCC) and fraction of photosynthetically active radiation (PAR) intercepted by the vegetation cover (fi-PAR) obtained in the years 2020 and 2021. Each point corresponds to the measurements made on the same section of crop.
Figure 3.
Relationship between the percentage of crop cover (fCC) and fraction of photosynthetically active radiation (PAR) intercepted by the vegetation cover (fi-PAR) obtained in the years 2020 and 2021. Each point corresponds to the measurements made on the same section of crop.
Figure 4.
Evolution of fi-PAR along the crop cycle express in cumulative growing degree days (GDD) for 2020, 2021 and 2022 under non-nitrogen limiting conditions.
Figure 4.
Evolution of fi-PAR along the crop cycle express in cumulative growing degree days (GDD) for 2020, 2021 and 2022 under non-nitrogen limiting conditions.
Figure 5.
Relationship between cumulative dry matter (DM) along the crop cycle and the fraction of photosynthetically active radiation (PAR) intercepted by the crop (fi-PAR) for the years 2020, 2021 and 2022. Each point is the average of 4 measurements in the elementary replicate plots.
Figure 5.
Relationship between cumulative dry matter (DM) along the crop cycle and the fraction of photosynthetically active radiation (PAR) intercepted by the crop (fi-PAR) for the years 2020, 2021 and 2022. Each point is the average of 4 measurements in the elementary replicate plots.
Figure 6.
Critical N curve (CNC) for sweet pepper grown in open field using total crop N content and total DM (continuous black line), CNC for C3 crops of Lemaire & Gastal (1997) (dotted line), and CNC for greenhouse sweet pepper of Rodríguez et al. (2020) (dashed line).
Figure 6.
Critical N curve (CNC) for sweet pepper grown in open field using total crop N content and total DM (continuous black line), CNC for C3 crops of Lemaire & Gastal (1997) (dotted line), and CNC for greenhouse sweet pepper of Rodríguez et al. (2020) (dashed line).
Figure 7.
Evolution of the fraction of PAR intercepted by the crop (fi-PAR) for the different N treatments in 2020 (a), 2021 (b), and 2022 (c). Each point is the average of 4 measurements in the elementary replicate plots in each treatment. Letters indicate whether there are significant differences between treatments in each sample for P≤0.05. In samples where no letters appear there were no significant differences between treatments.
Figure 8.
Evolution of flower production expressed in dry matter (DM) for the different N treatments in the a) 2020 and b) 2021 seasons. Each point is the average of 4 measurements in the elementary replicate plots in each treatment. Letters indicate whether there are significant differences between treatments in each sample with P≤0.05. In samples where no letters appear there were no significant differences between treatments for P≤0.05.
Figure 9.
Total dry matter and fruit dry matter evolution in cumulative growing degree days (GDD) for the different treatments in a) 2020, b) 2021 and c) 2022. Each point is the average of 4 measurements in the elementary replicate plots in each treatment. Letters indicate whether there are significant differences between treatments in each sample with P≤0.05.
Figure 10.
Commercial production of seasons a) 2020, b) 2021 and c) 2022 per harvest for treatments. Black letters indicate whether there are significant differences in each individual harvest, red letters indicate significant differences in total yield.
Figure 10.
Commercial production of seasons a) 2020, b) 2021 and c) 2022 per harvest for treatments. Black letters indicate whether there are significant differences in each individual harvest, red letters indicate significant differences in total yield.
Figure 11.
Evolution of the %N in relation to cumulative growing degree days (GDD) for the different treatments and parts of the plant. a) and b) correspond to leaves in 2020 and 2022, respectively, c) and d) to stems in 2020 and 2022, respectively, and e) and f) to fruits in 2020 and 2022, respectively. Each point is the average of 4 measurements in the elementary replicate plots in each treatment. Letters indicate whether there are significant differences between treatments in each sample with P≤0.05.
Figure 12.
Percent of nitrogen (%N) in aerial dry matter against dry matter (DM) weight along the crop cycle in each treatment in 2020 (a), 2021 (b), and 2022 (c). Contrast of data obtained with the different treatments in the 2020 and 2021 season against the CNC generated in this work.
Figure 12.
Percent of nitrogen (%N) in aerial dry matter against dry matter (DM) weight along the crop cycle in each treatment in 2020 (a), 2021 (b), and 2022 (c). Contrast of data obtained with the different treatments in the 2020 and 2021 season against the CNC generated in this work.
Figure 13.
Seasonal evolution of nitrogen (N) uptake in cumulative growing degree days (GDD) for the different treatments in the year a) 2020, b) 2021 and c) 2022. Each point is the average of 4 measurements in the elementary replicate plots in each treatment.
Figure 13.
Seasonal evolution of nitrogen (N) uptake in cumulative growing degree days (GDD) for the different treatments in the year a) 2020, b) 2021 and c) 2022. Each point is the average of 4 measurements in the elementary replicate plots in each treatment.
Figure 14.
Relationship between total N uptake and total fresh fruit yield for the years 2020, 2021, 2022. Each point is the average of 4 measurements in the elementary replicate plots.
Figure 14.
Relationship between total N uptake and total fresh fruit yield for the years 2020, 2021, 2022. Each point is the average of 4 measurements in the elementary replicate plots.
Figure 15.
Increased mineralization throughout the year in response to crop N demand. Source: Tei et al. (2020).
Figure 15.
Increased mineralization throughout the year in response to crop N demand. Source: Tei et al. (2020).
Table 1.
2020, 2021 and 2022 climate data along the crop cycle of each season.
Table 1.
2020, 2021 and 2022 climate data along the crop cycle of each season.
| Months |
|
|
|
|
|
|
|
|
|
|
|
|
|
|
|
| |
Tª maximum (ºC) |
|
Tª minimum (ºC) |
|
R. humidity (%) |
|
Precipitation (mm) |
| |
2020 |
2021 |
2022 |
|
2020 |
2021 |
2022 |
|
2020 |
2021 |
2022 |
|
2020 |
2021 |
2022 |
| May |
34.6 |
34.1 |
37.6 |
|
10.1 |
8.7 |
9.9 |
|
58.3 |
55.8 |
52.6 |
|
0 |
0 |
0 |
| June |
38.6 |
36.1 |
41 |
|
9.6 |
8.7 |
10.7 |
|
56.9 |
56.9 |
52.5 |
|
0 |
28.5 |
0 |
| Jule |
41.1 |
40.3 |
44.4 |
|
12.4 |
11.6 |
14.1 |
|
47.7 |
52.8 |
43.8 |
|
10.3 |
0 |
0 |
| August |
39.2 |
42.8 |
40.7 |
|
11.9 |
12 |
22 |
|
52 |
51.5 |
49.3 |
|
0 |
1 |
0 |
| September |
36.7 |
37.9 |
31.7 |
|
12.5 |
14.9 |
14.4 |
|
44.7 |
60.7 |
55.4 |
|
0 |
51.5 |
0 |
Table 2.
The yield of fresh fruit produced over the three experimental years classified into commercial and total categories, together with the total number of fruits differentiated by treatments. The percentage of commercial fruit with respect to the total for each harvest is shown in brackets. Letters indicate whether there are significant differences between treatments in each sampling for P≤0.05.
| |
2020 |
2021 |
2022 |
| |
Commercial
(kg/ha) |
Total (kg/ha) |
Total no. fruit (nº/ha) |
Commercial (kg/ha) |
Total (kg/ha) |
Total no. fruit (nº/ha) |
Commercial (kg/ha) |
Total (kg/ha) |
Total no. fruit (nº/ha) |
| N0 |
80430 (87)ab
|
92273ab
|
788658 |
65224 (85)a
|
77169ª |
749213 |
25930 (90)a
|
28882 |
465838 |
| N1 |
71827 (83)a
|
86791ª |
672798 |
82134 (81)a
|
101921b
|
1158193 |
69740 (92)b
|
75853 |
566067 |
| N2 |
91567 (85)b
|
107599b
|
752440 |
72698 (82)a
|
88957ab
|
1186093 |
71838 (92)b
|
77854 |
564159 |
| N3 |
88670 (84)ab
|
106183ab
|
798368 |
75012 (80)a
|
93475ab
|
1154012 |
|
|
|
|
Disclaimer/Publisher’s Note: The statements, opinions and data contained in all publications are solely those of the individual author(s) and contributor(s) and not of MDPI and/or the editor(s). MDPI and/or the editor(s) disclaim responsibility for any injury to people or property resulting from any ideas, methods, instructions or products referred to in the content. |
© 2024 by the authors. Licensee MDPI, Basel, Switzerland. This article is an open access article distributed under the terms and conditions of the Creative Commons Attribution (CC BY) license (http://creativecommons.org/licenses/by/4.0/).
