Submitted:
19 September 2024
Posted:
19 September 2024
You are already at the latest version
Abstract
Keywords:
1. Introduction
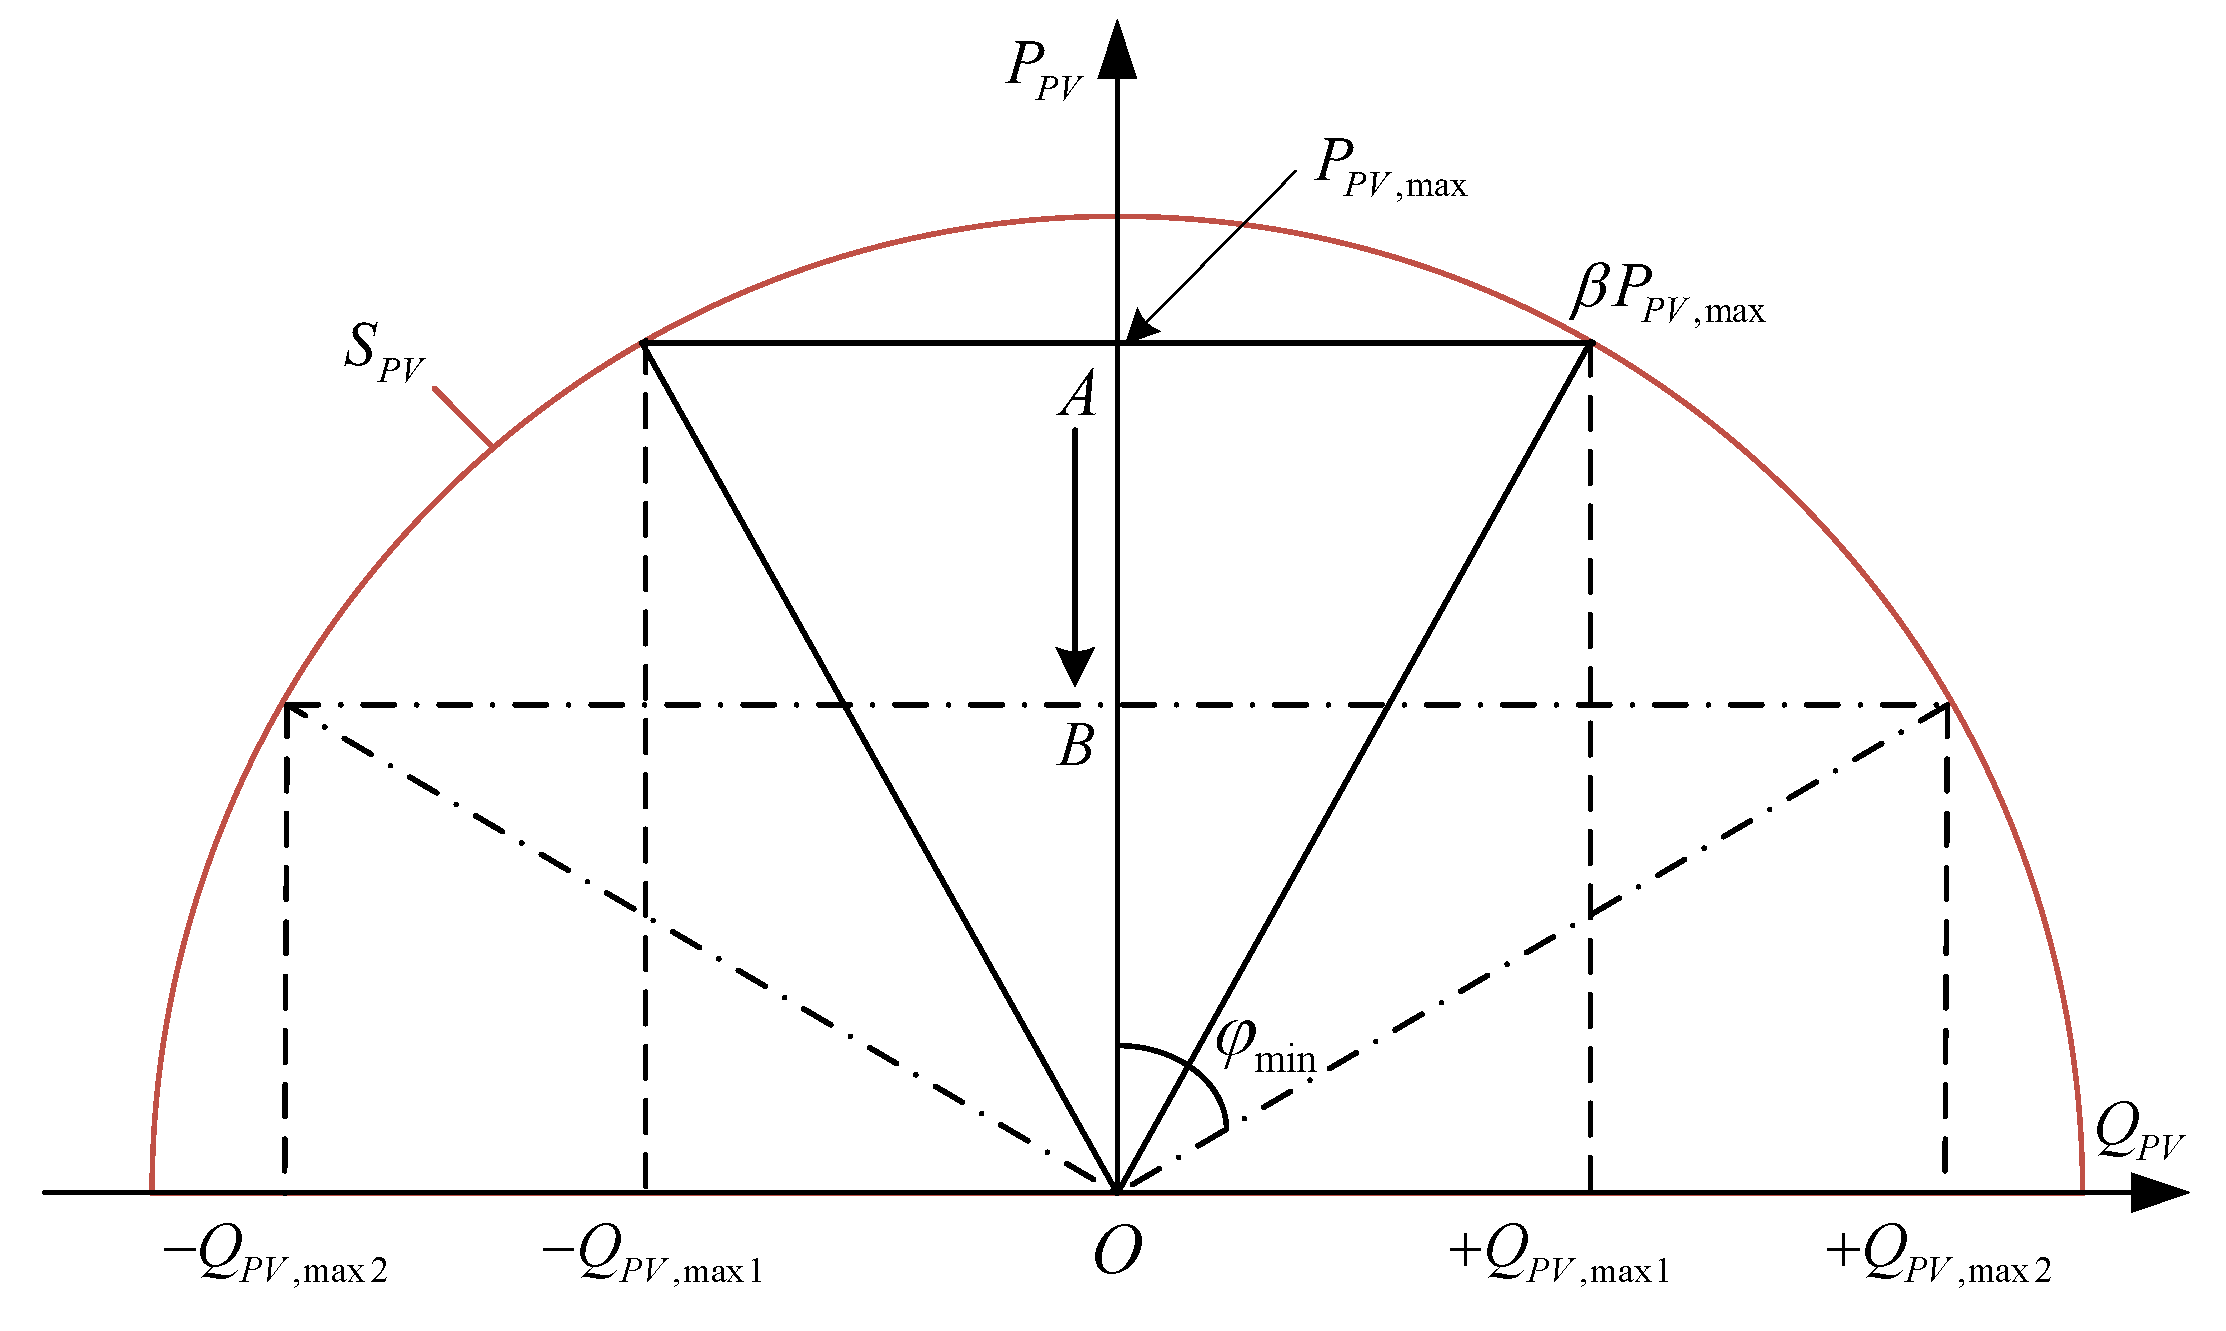
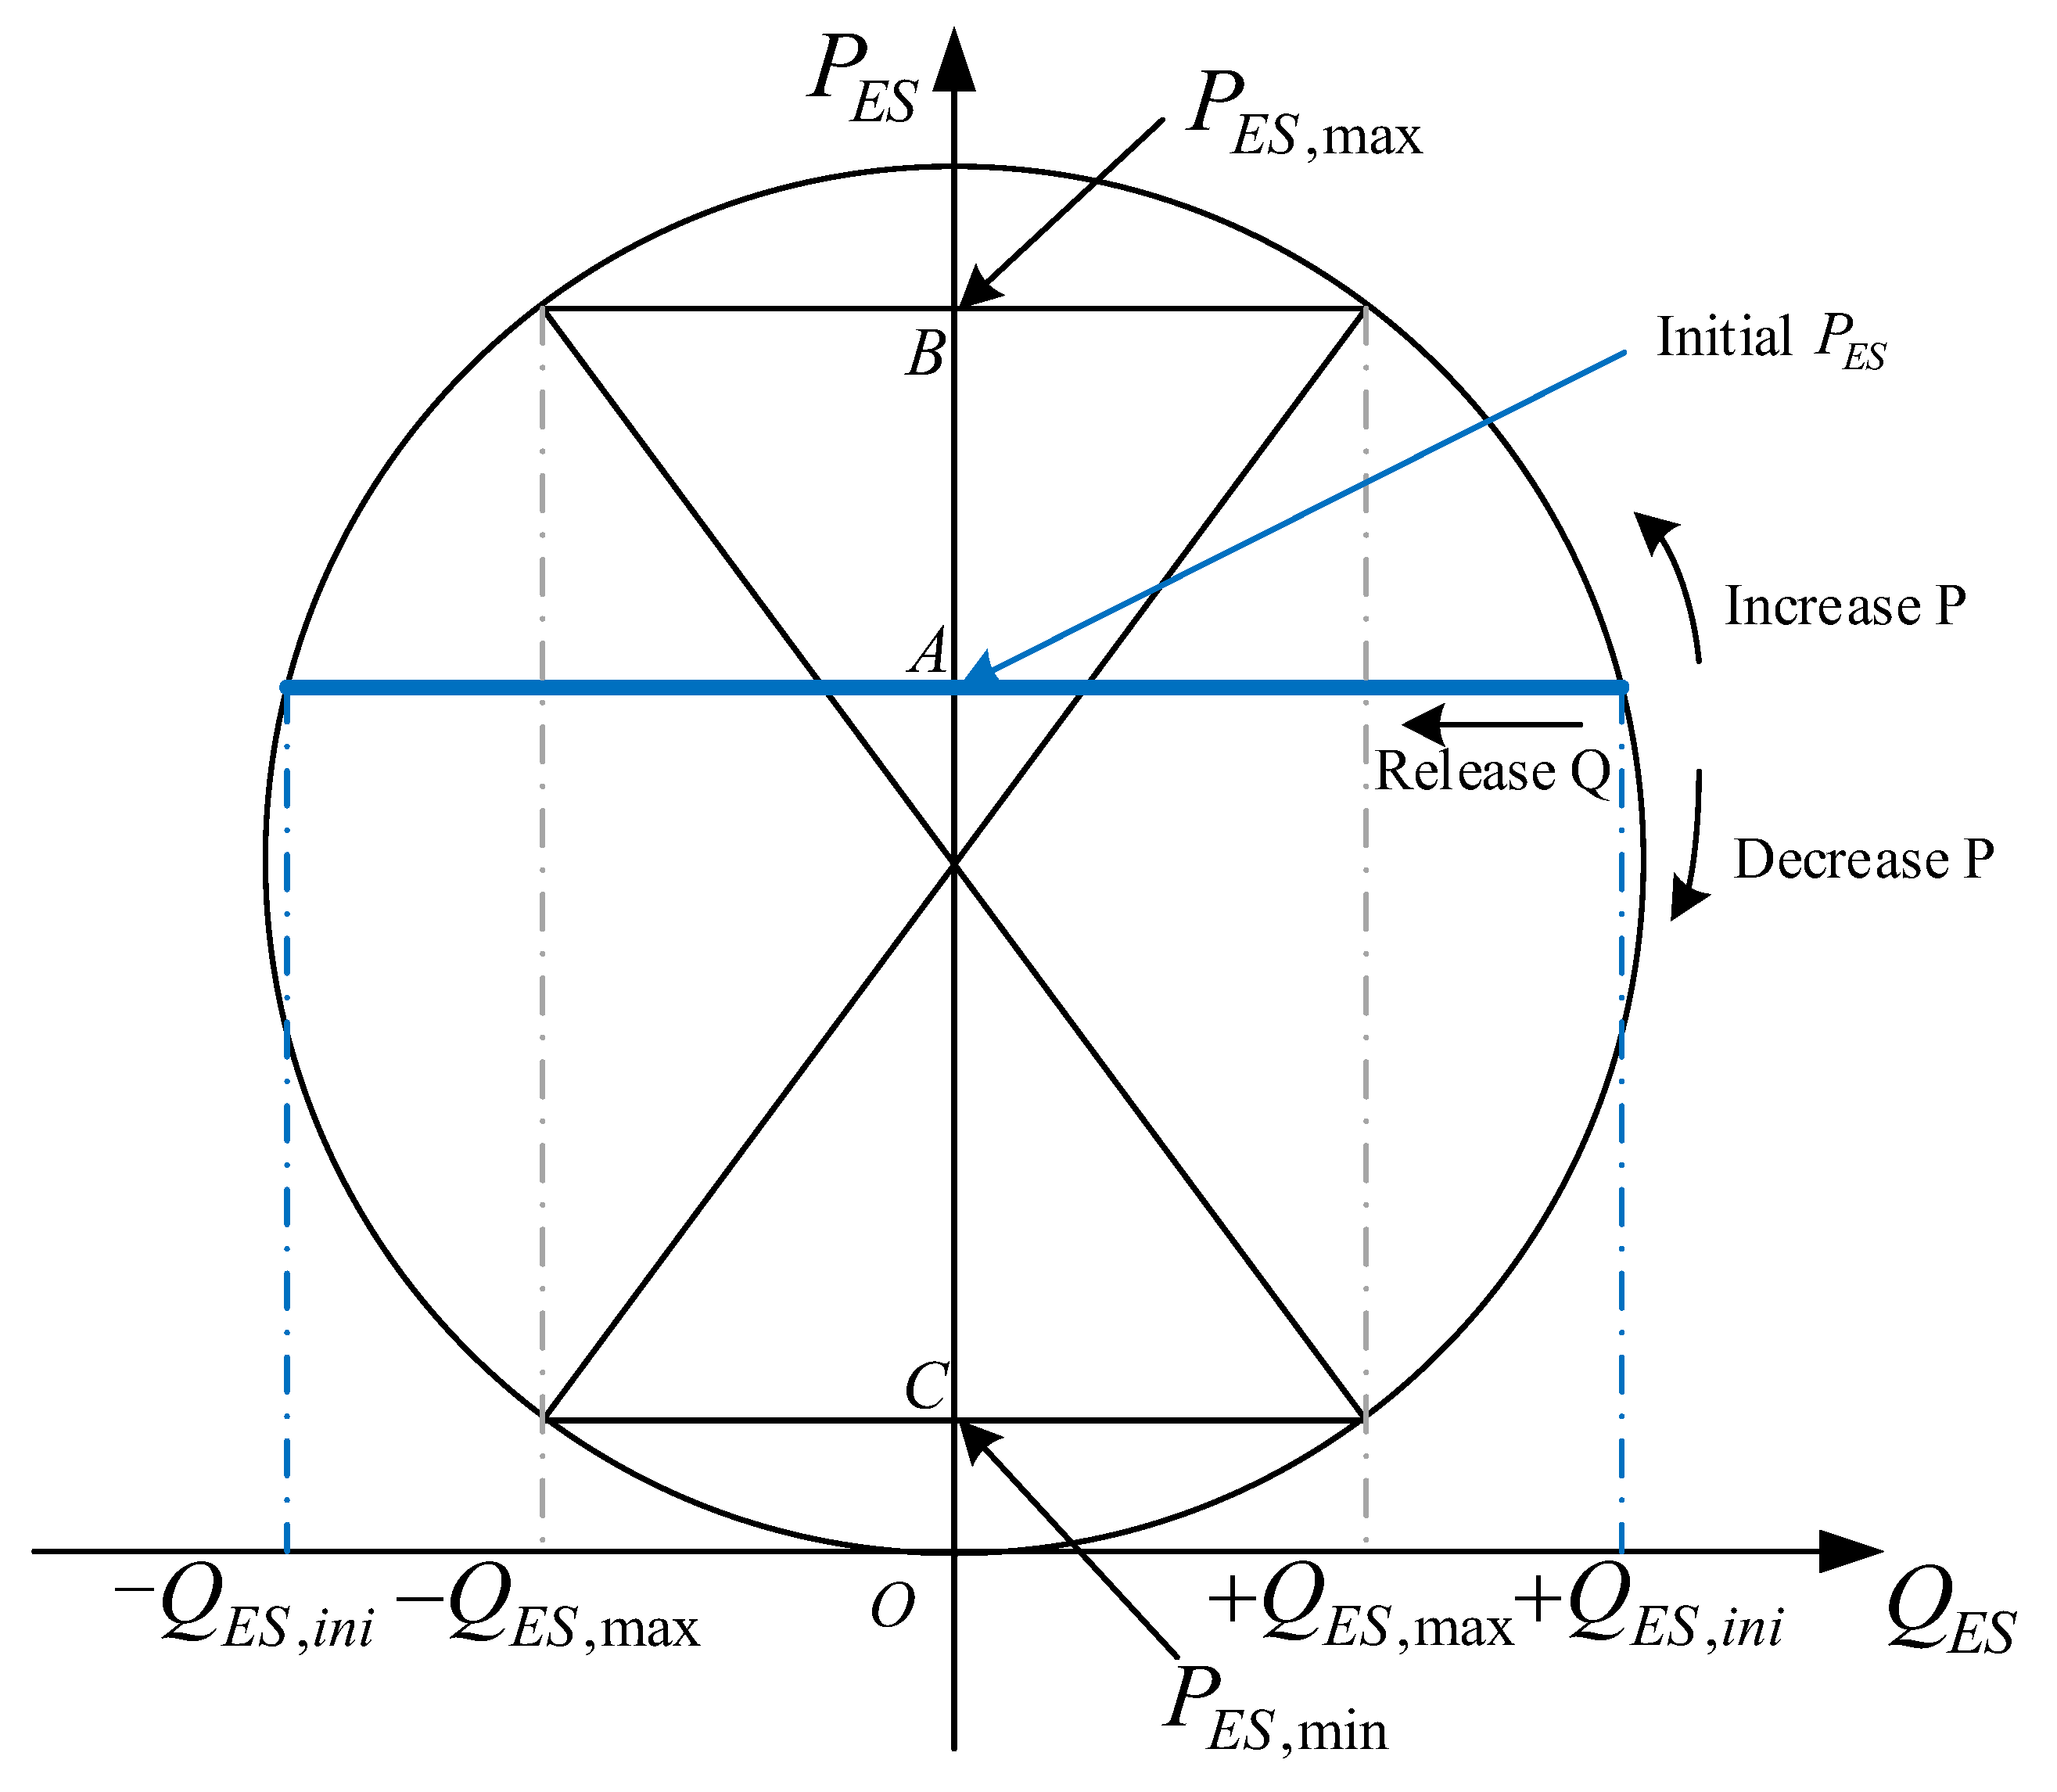
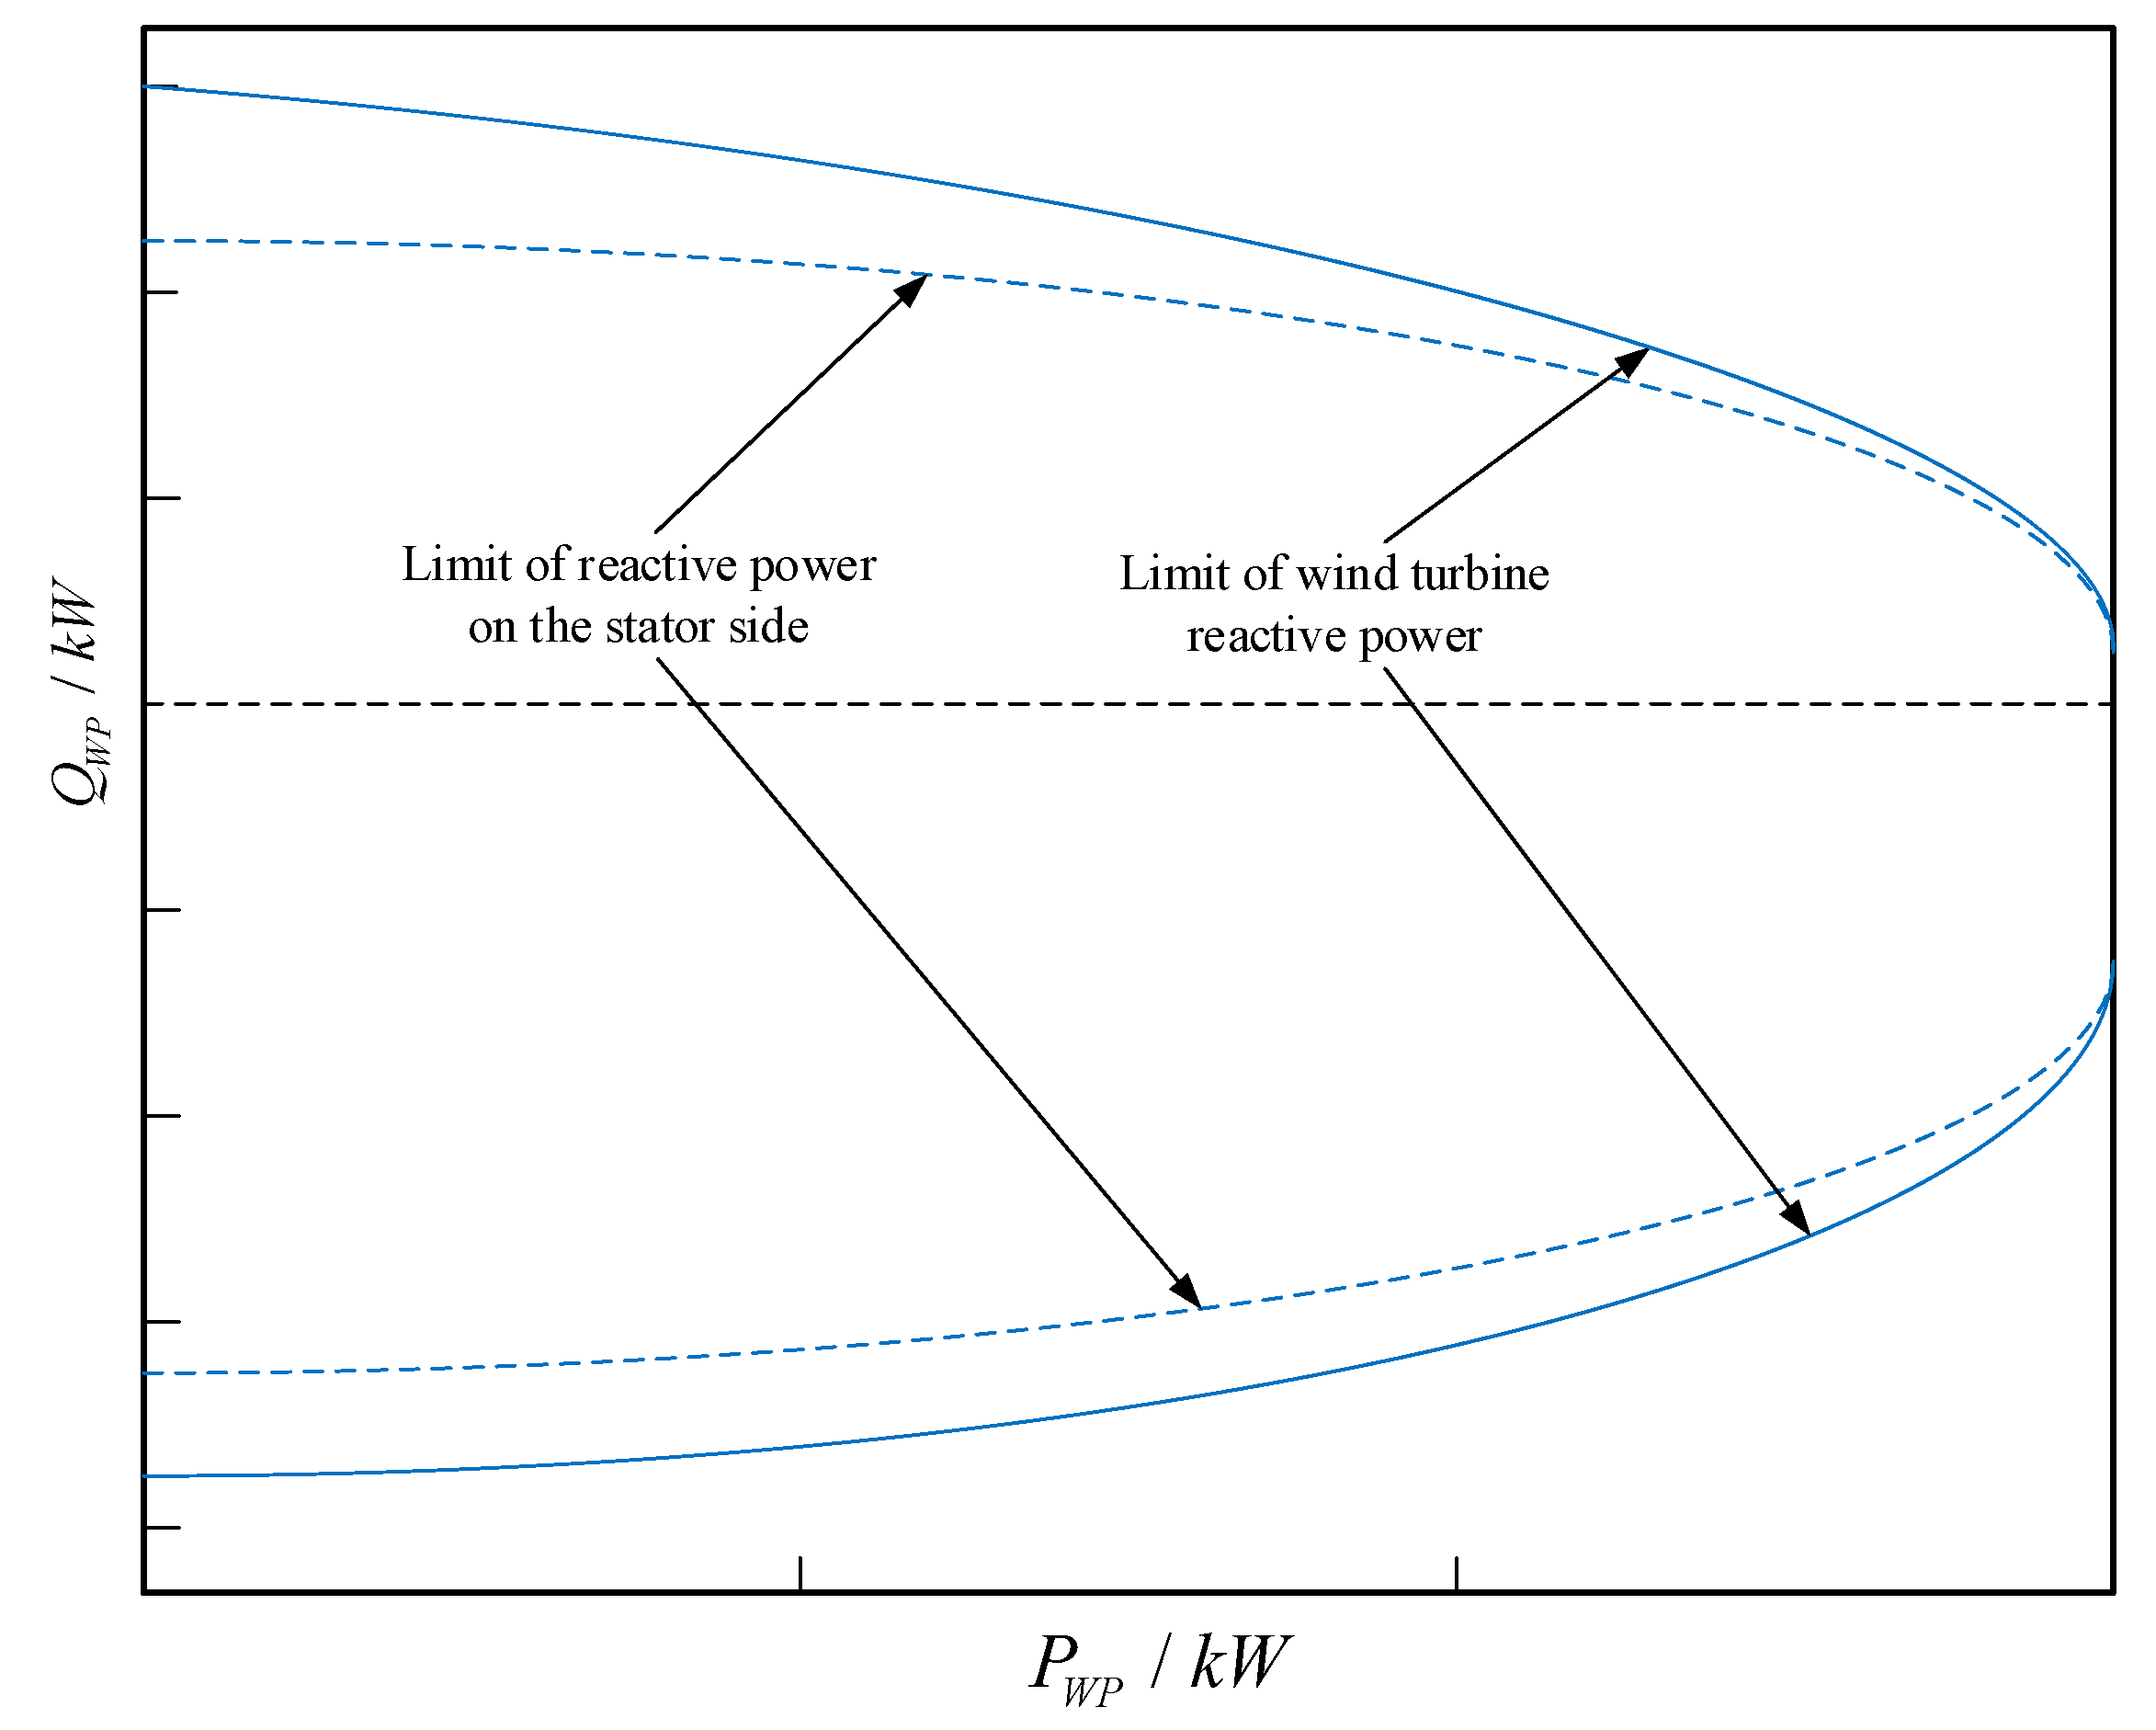
- The active-reactive joint voltage regulation mechanism of distributed photovoltaic inverters, doubly-fed wind turbines and distributed energy storage units is analyzed, based on which a day ahead, intraday and real-time multi-timescale distribution network reactive voltage optimization and regulation method is proposed. Firstly, for the day-ahead stage, the objective is to minimize the total system network loss and node voltage deviation based on short-term prediction of renewable outputs and loads, and the active-reactive resources of PV, WT and ES units are comprehensively utilized to regulate the voltage; and then for the intraday stage, considering the short-term prediction uncertainty, the results of the ultrashort-term power prediction are used to realize the rolling optimization of active and reactive compensation for each distributed resource, and dynamically adjusting active and reactive outputs of distributed resources in response to the dynamic adjustment of active and reactive power output of distributed resources to cope with power changes.
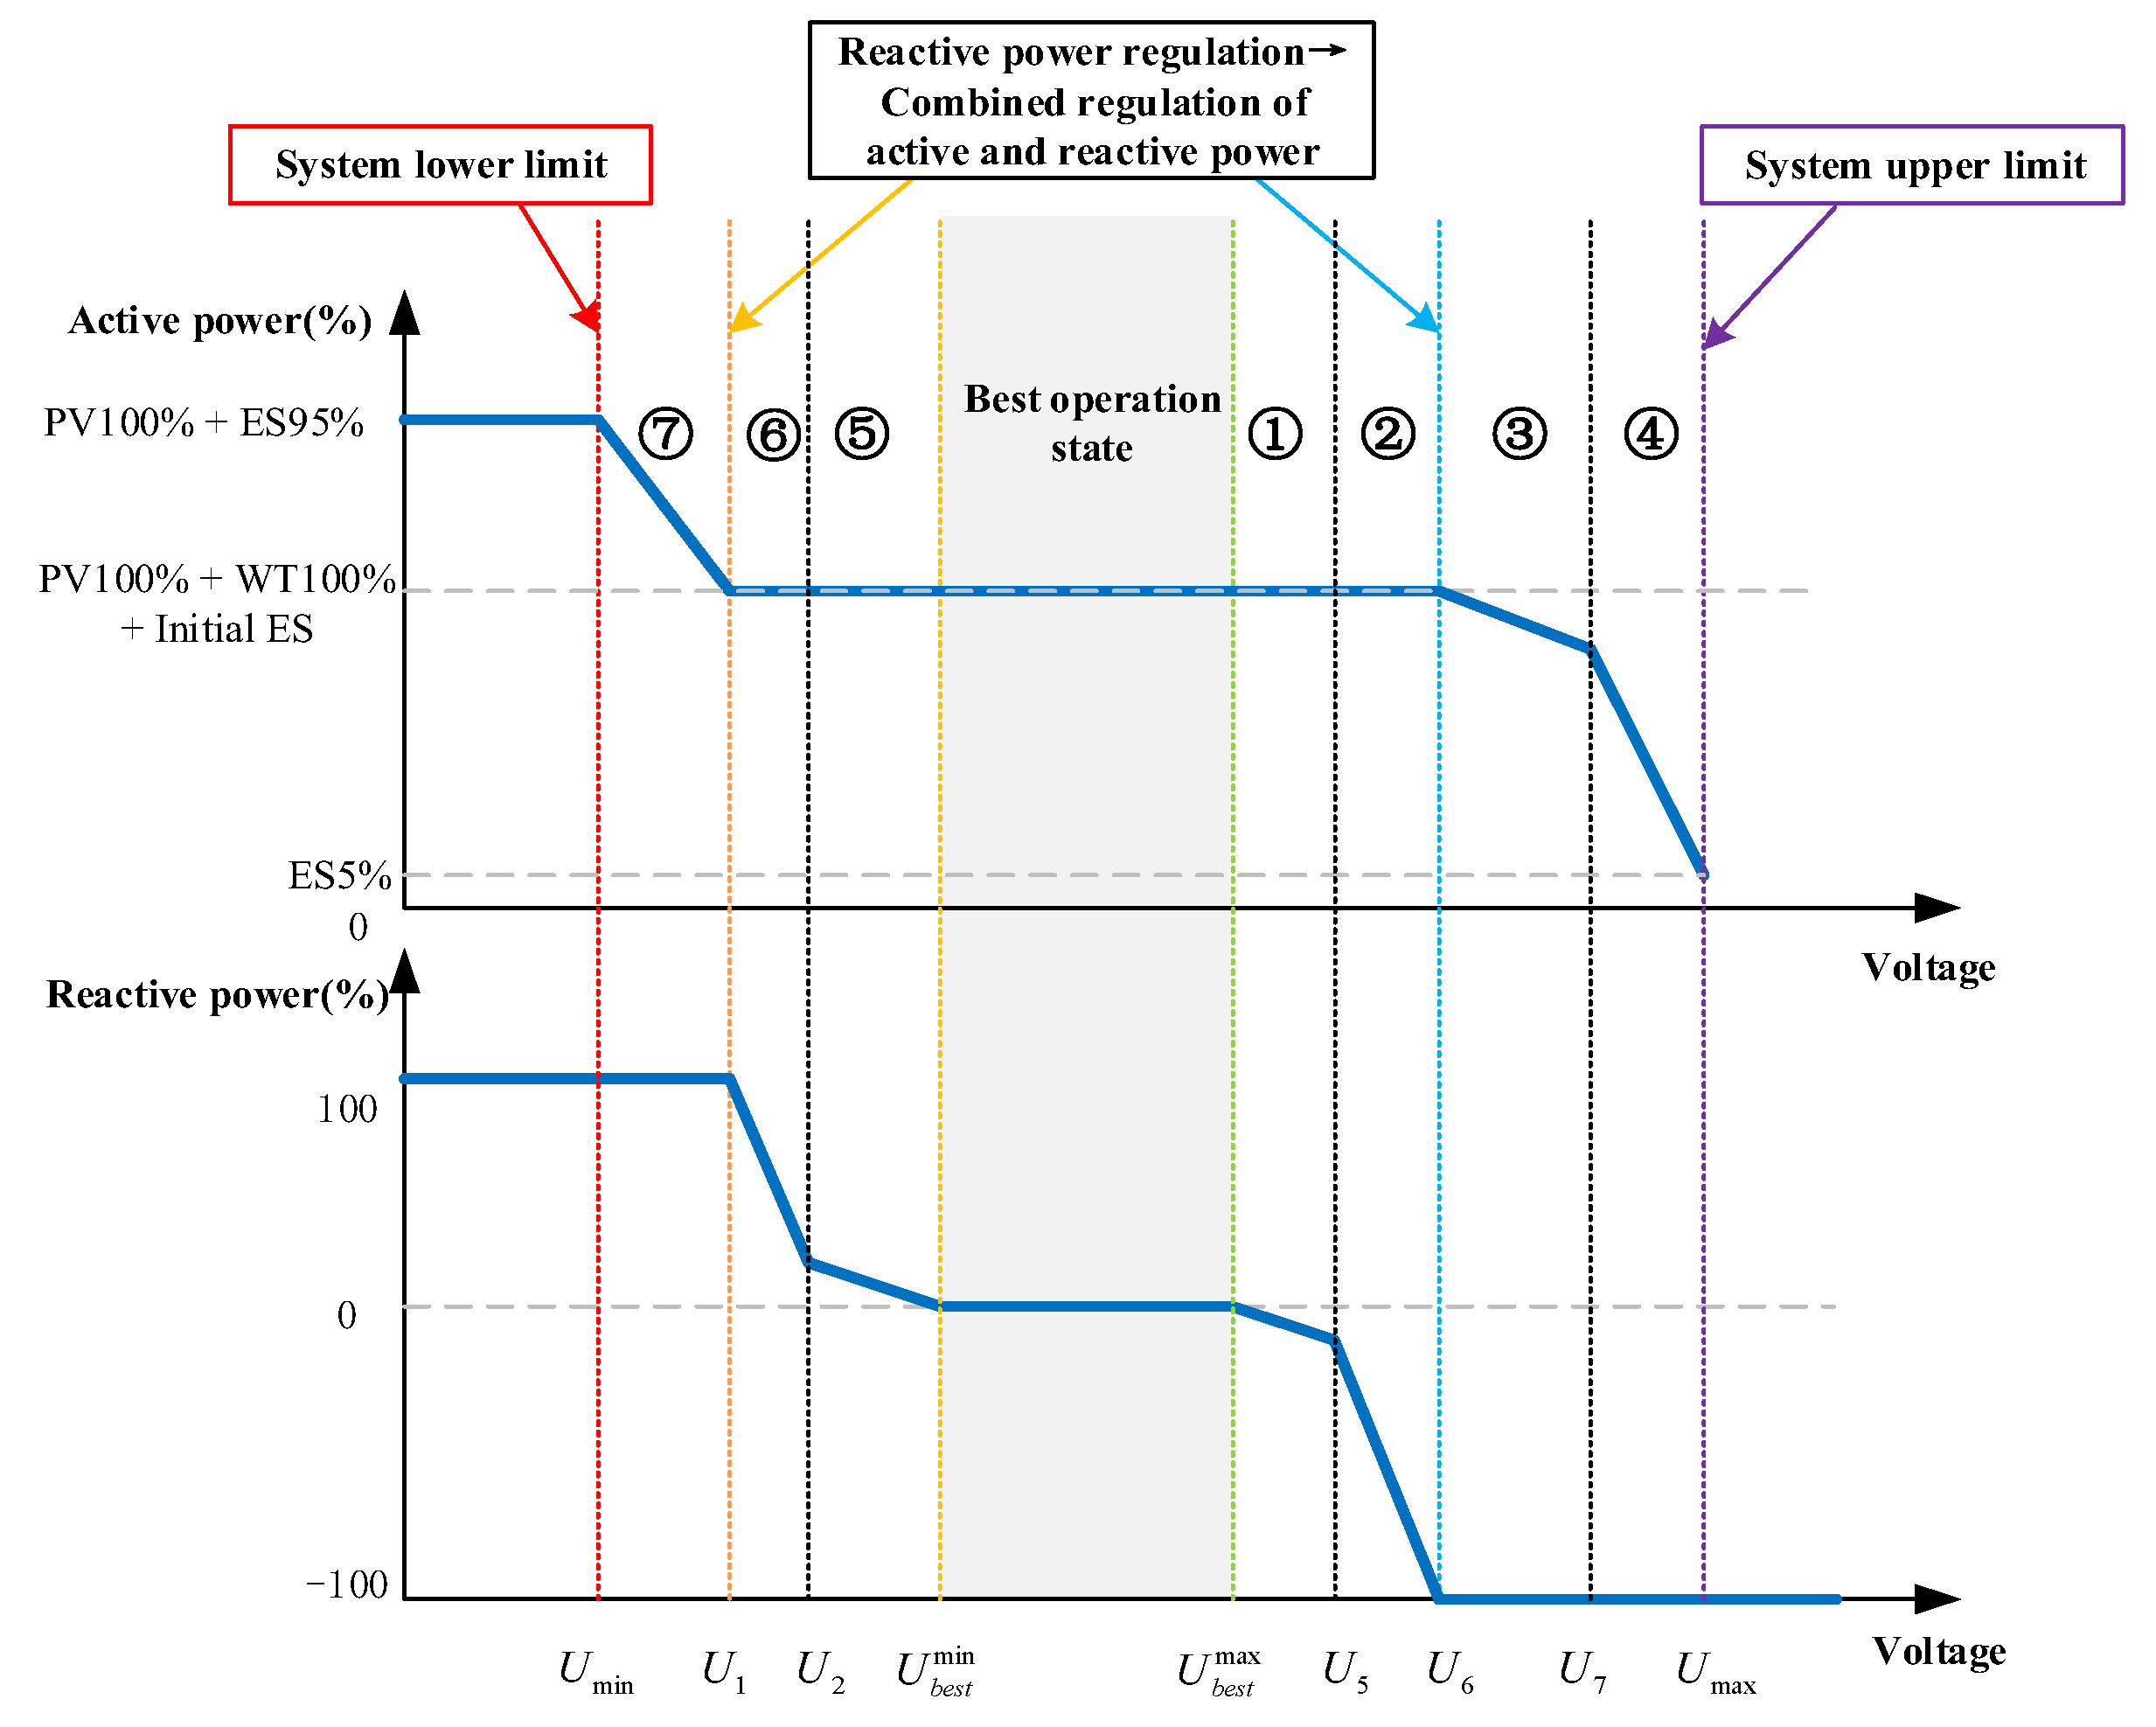
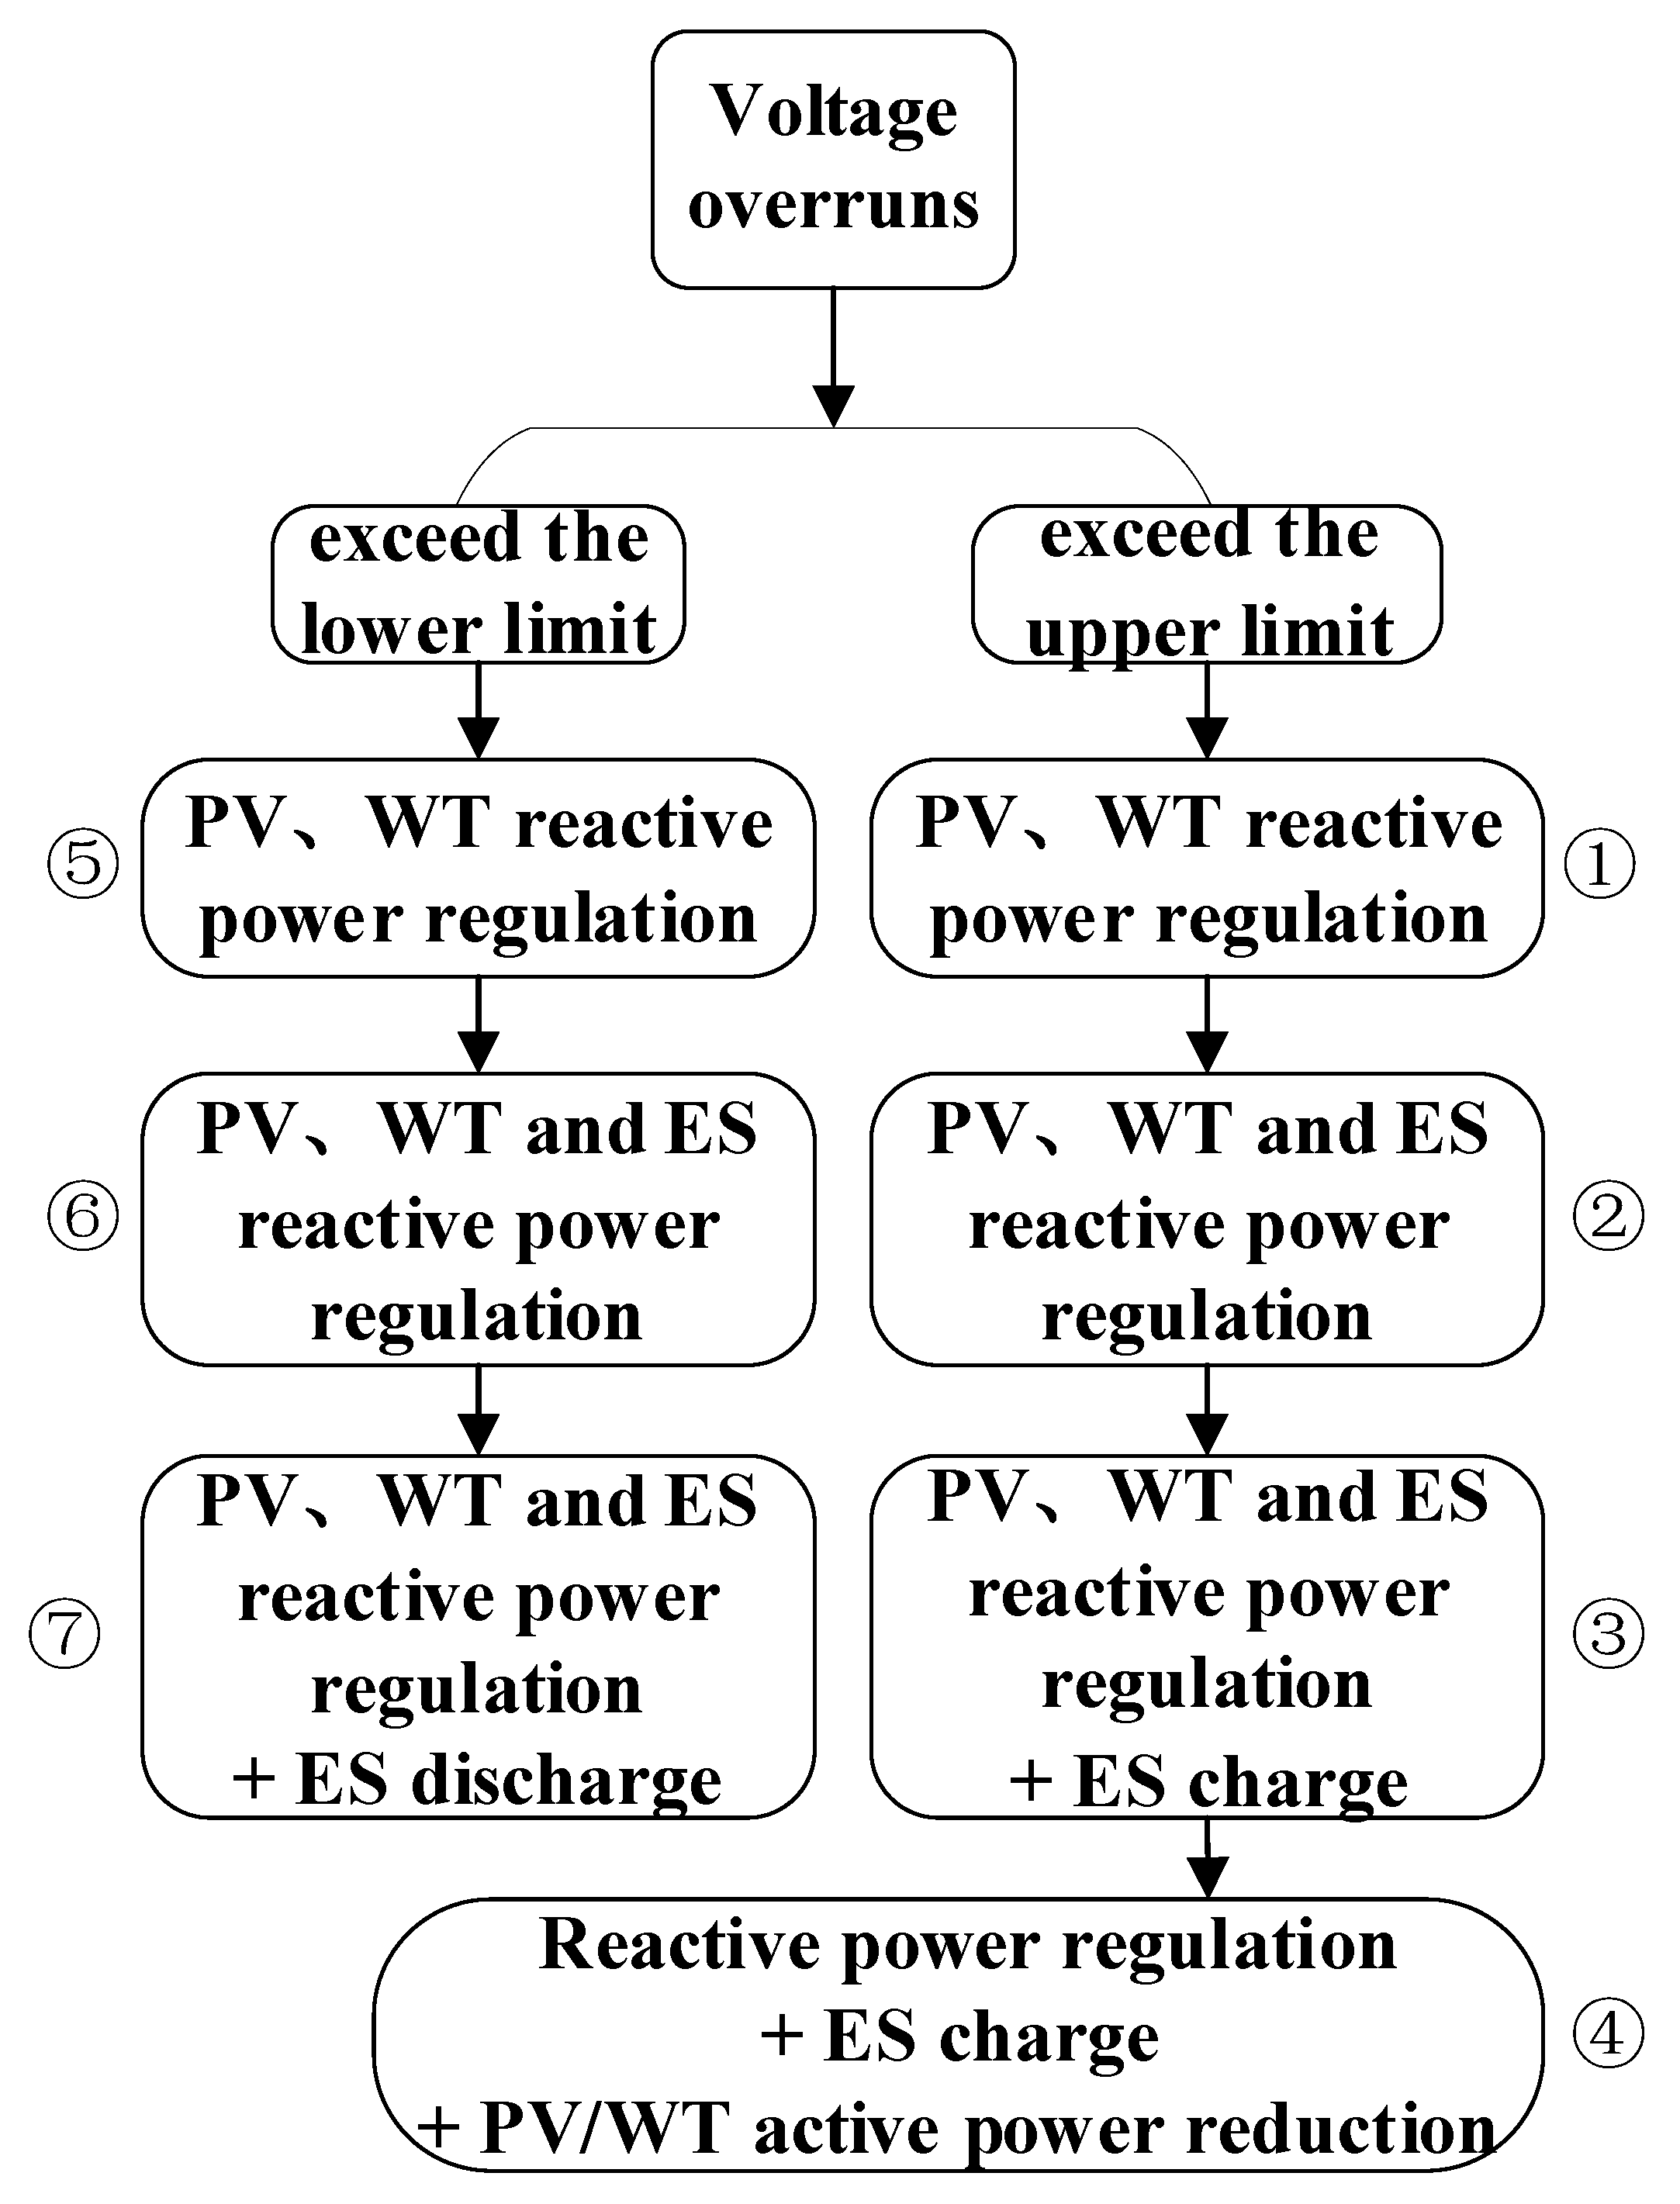
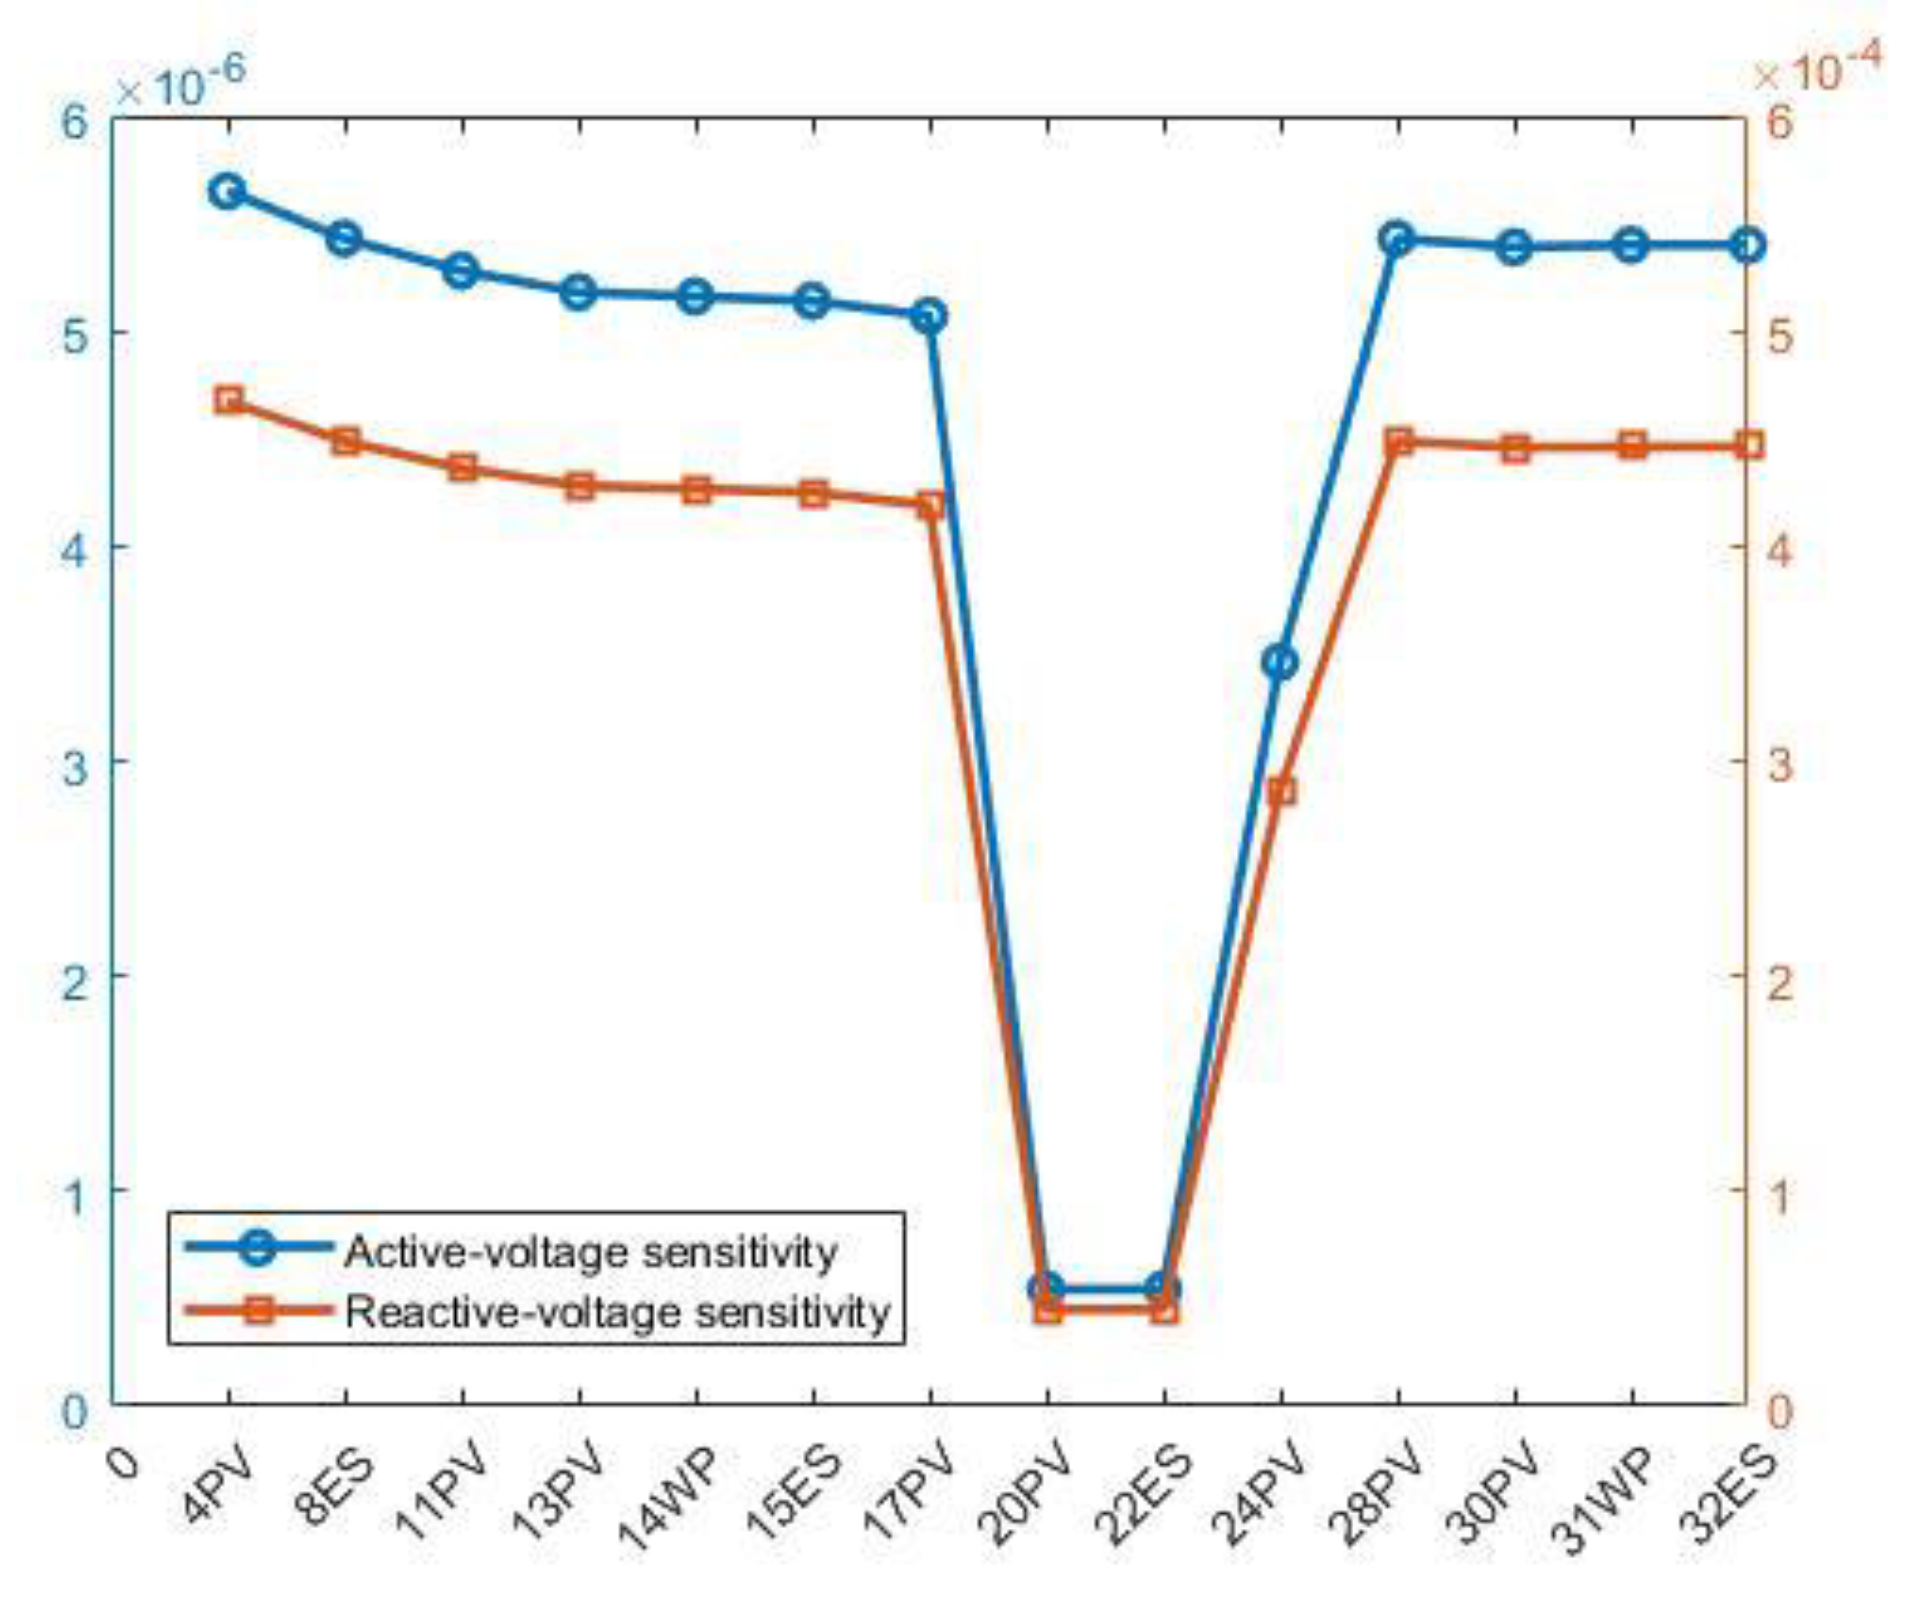
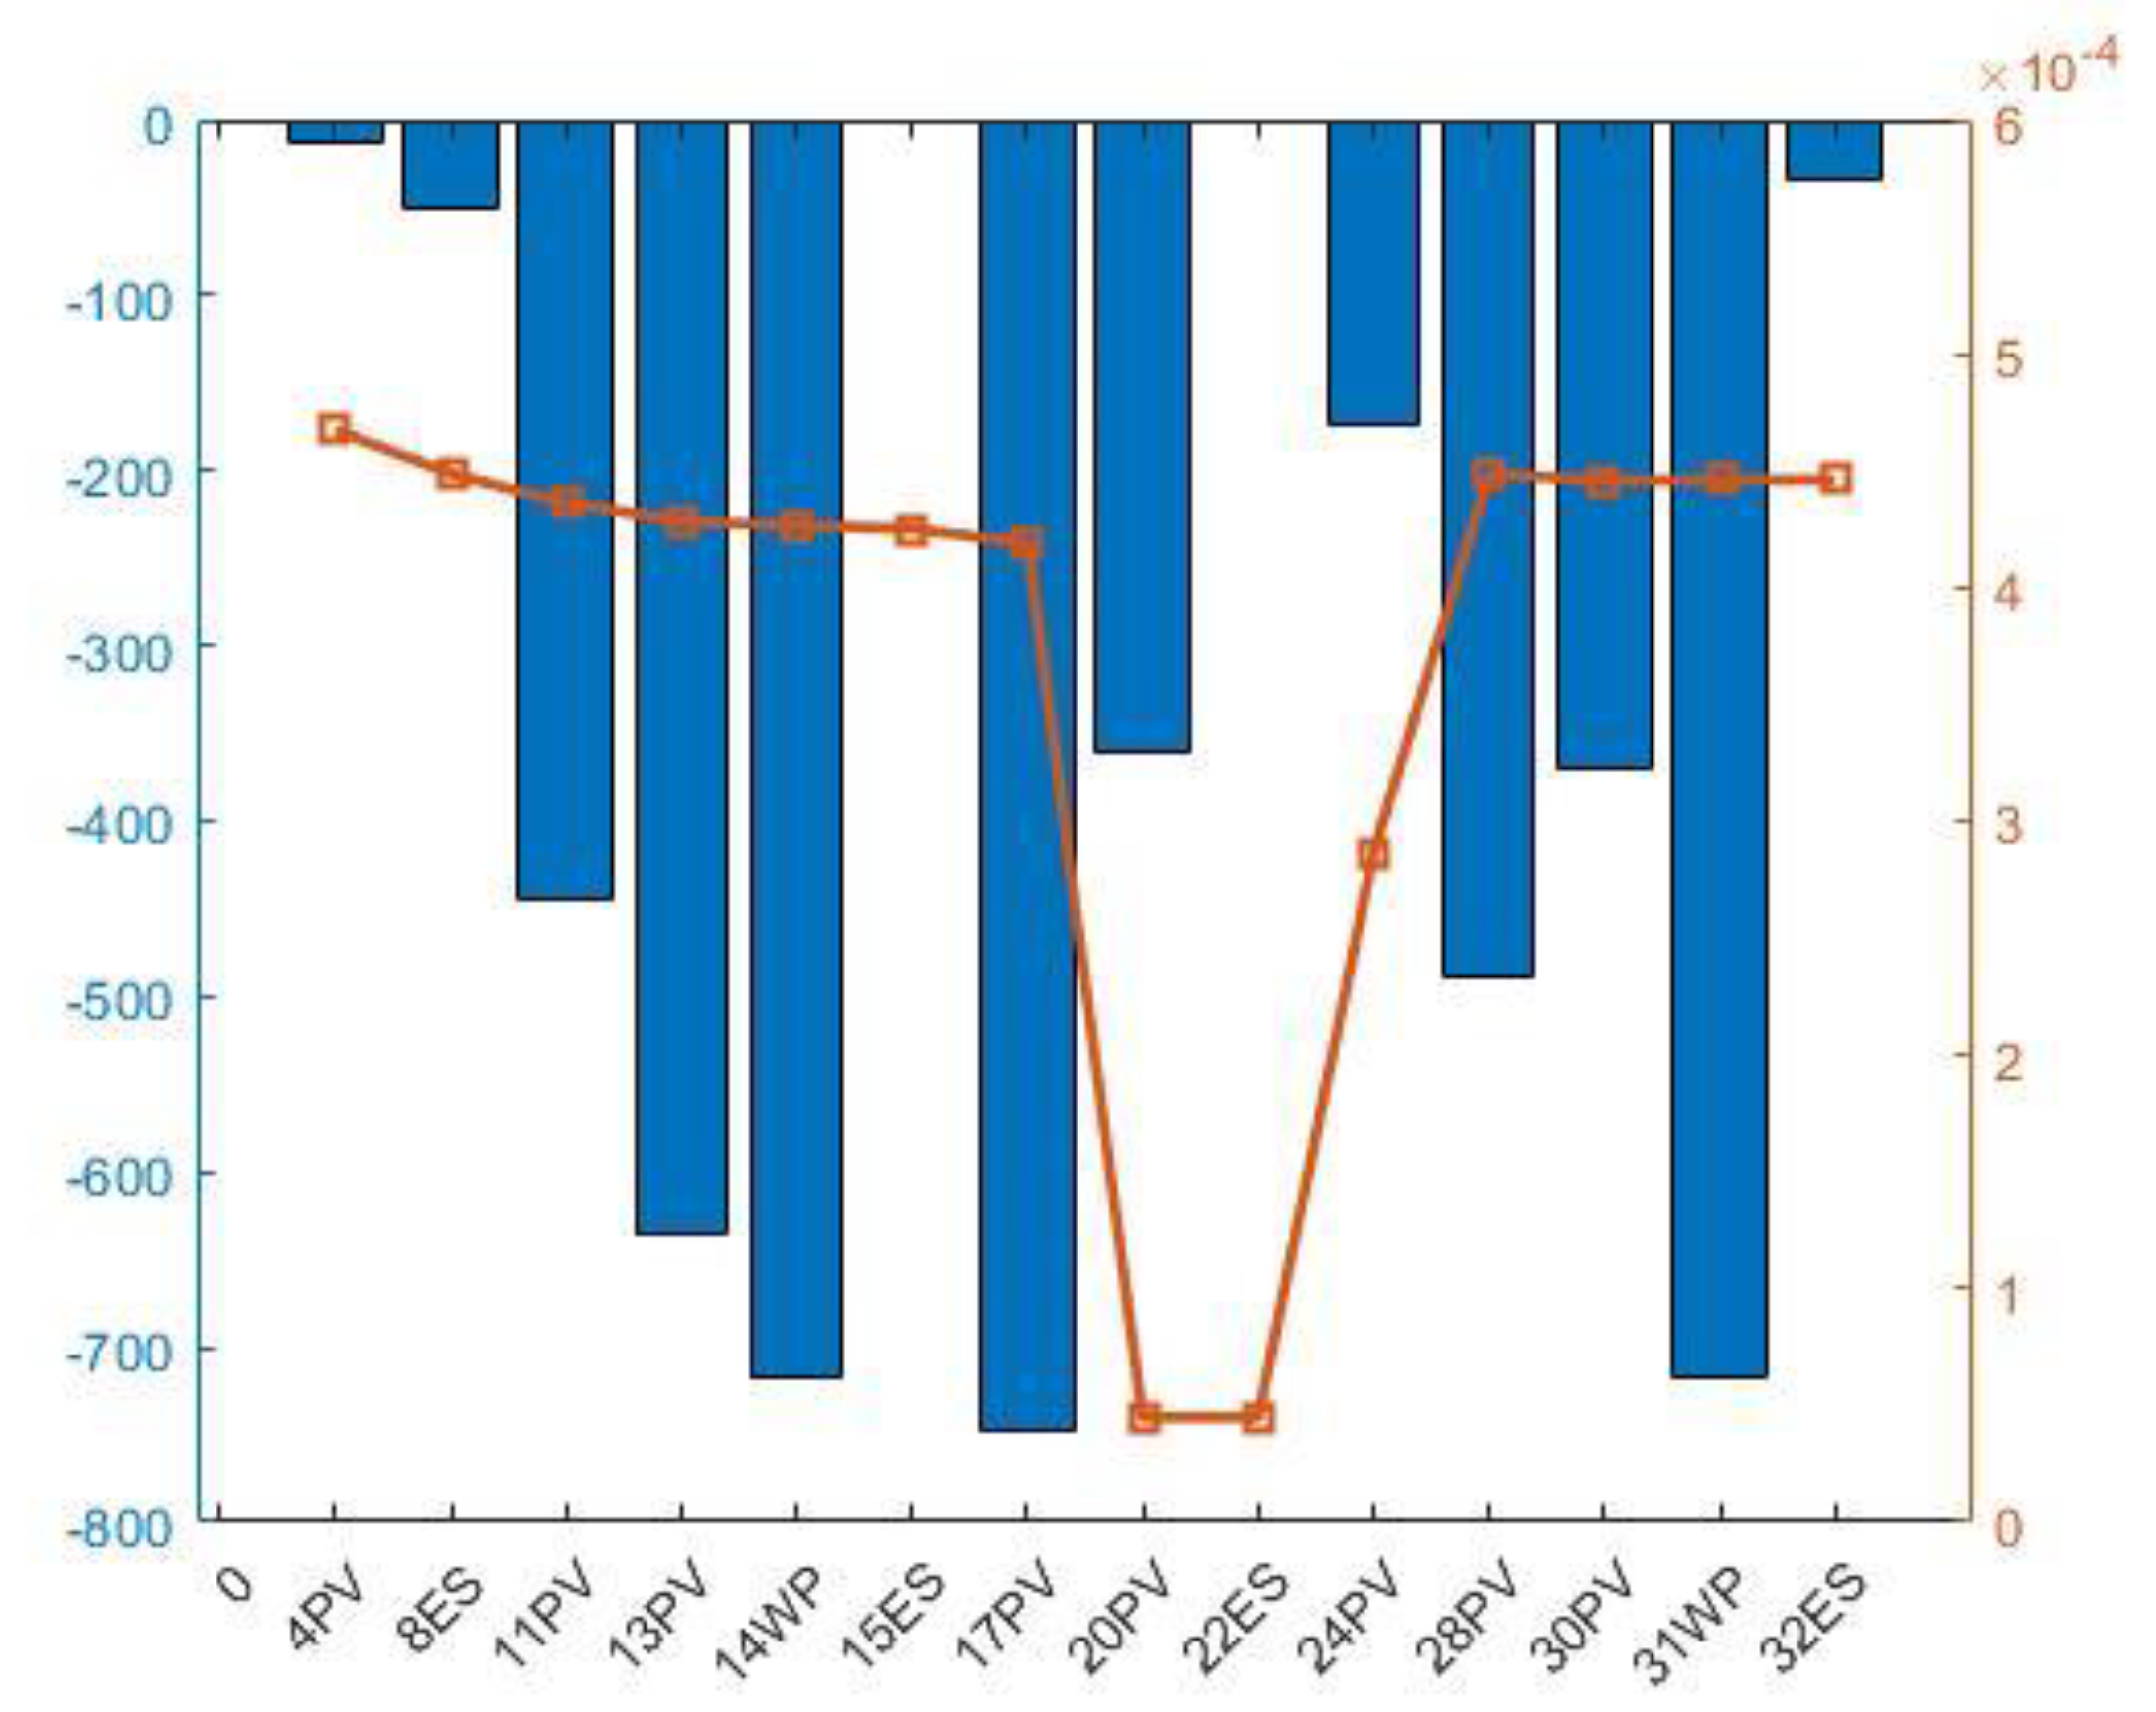
- In order to solve the short-term fluctuation and sudden overrun of voltage in the grid, an event-triggered real-time voltage zoning control strategy based on voltage sensitivity is proposed, which calculates the reactive-voltage sensitivity and active-voltage sensitivity between distributed resources and overrun nodes, and establishes the “active first, reactive later” distributed voltage zoning control strategy, and establishes the “active first, reactive later” distributed voltage zoning control strategy. The distributed resource partitioning control model of “active first - reactive second” is established, and the nodes with high sensitivity are prioritized to call the regulating resources to realize real-time fast voltage regulation.
2. Background: Distributed Resource Regulation Mechanism
2.1. PV Inverter Based Voltage Regulation Mechanism
2.2. Regulation Mechanism of ES
2.3. Voltage Regulation Mechanism of Doubly-Fed Wind Turbine
3. Proposed Scheme: Multi-Timescale Voltage Control Strategies for Distribution Networks
3.1. Multi-Timescale Reactive Power Control Scheme for Distribution Networks
3.3. Intra-Day Rolling Optimization Model
3.4. Real Time Control Model
4. Case Study
4.1. Basic Data
4.2. Day-Ahead Optimization Results Analysis
4.3. Intraday Optimization Results Analysis
4.4. Real-Time Control Results and Strategy Analysis
5. Conclusions
References
- X. Yang, C. Xu, Y. Zhang, W. Yao, J. Wen and S. Cheng, "Real-Time Coordinated Scheduling for ADNs With Soft Open Points and Charging Stations," in IEEE Transactions on Power Systems, vol. 36, no. 6, pp. 5486-5499, Nov. 2021. [CrossRef]
- Z. Tang, D. J. Hill and T. Liu, "Fast Distributed Reactive Power Control for Voltage Regulation in Distribution Networks," in IEEE Transactions on Power Systems, vol. 34, no. 1, pp. 802-805, Jan. 2019. [CrossRef]
- T. Stetz, F. Marten and M. Braun, "Improved Low Voltage Grid-Integration of Photovoltaic Systems in Germany", IEEE Trans. Sustainable Energy, vol. 4, no. 2, pp. 534-542, 2013.
- R. A. Shayani and M. A. G. d. Oliveira, "Photovoltaic Generation Penetration Limits in Radial Distribution Systems", IEEE Trans. Power Syst., vol. 26, no. 3, pp. 1625-1631, 2011.
- R. Tonkoski, L. A. C. Lopes and T. H. M. El-Fouly, "Coordinated Active Power Curtailment of Grid Connected PV Inverters for Overvoltage Prevention", IEEE Trans. Sustainable Energy, vol. 2, no. 2, pp. 139-147, 2011.
- X. Lu, K. W. Chan, S. Xia, X. Zhang, G. Wang and F. Li, "A model to mitigate forecast uncertainties in distribution systems using the temporal flexibility of EVAs", IEEE Trans. Power Syst., vol. 35, no. 3, pp. 2212-2221, May 2020.
- A. Ali, D. Raisz, K. Mahmoud and M. Lehtonen, "Optimal placement and sizing of uncertain PVs considering stochastic nature of PEVs", IEEE Trans. Sustain. Energy, vol. 11, no. 3, pp. 1647-1656, Jul. 2020.
- D. C. Jordan, K. Perry, R. White and C. Deline, "Extreme Weather and PV Performance," in IEEE Journal of Photovoltaics, vol. 13, no. 6, pp. 830-835, Nov. 2023. [CrossRef]
- A.M. A. Acuzar, I. P. E. Arguelles, J. C. S. Elisan, J. K. D. Gobenciong, A. M. Soriano and J. M. B. Rocamora, "Effects of weather and climate on renewable energy resources in a distributed generation system simulated in Visayas, Philippines," 2017IEEE 9th International Conference on Humanoid, Nanotechnology, Information Technology, Communication and Control, Environment and Management (HNICEM), Manila, Philippines, 2017, pp. 1-6. [CrossRef]
- S. Shivashankar, S. Mekhilef, H. Mokhlis and M. Karimi, "Mitigating methods of power fluctuation of photovoltaic (PV) sources – A review", Renewable Sustain. Energy Rev., vol. 59, pp. 1170-1184, 2016.
- A. Dubey, S. Santoso and M. P. Cloud, "Understanding the effects of electric vehicle charging on the distribution voltages", Proc. IEEE Power Energy Soc. General Meeting, pp. 1-5, 2013.
- C. Gao and M. A. Redfern, "Automatic Compensation Voltage Control strategy for on-load tap changer transformers with distributed generations," 2011 International Conference on Advanced Power System Automation and Protection, Beijing, China, 2011, pp. 737-741. [CrossRef]
- P. Penkey, H. Samkari, B. K. Johnson and H. L. Hess, "Voltage control by using capacitor banks and tap changing transformers in a renewable microgrid," 2017 IEEE Power & Energy Society Innovative Smart Grid Technologies Conference (ISGT), Washington, DC, USA, 2017, pp. 1-5. [CrossRef]
- S. Liemann, L. Robitzky and C. Rehtanz, "Impact of Varying Shares of Distributed Energy Resources on Voltage Stability in Electric PowerSystems," 2019 IEEE Milan PowerTech, Milan, Italy, 2019, pp. 1-6. [CrossRef]
- T. Van Cutsem and T. Weckesser, "Searching for plausible N-k contingencies endangering voltage stability", 2017 IEEE PES Innovative Smart Grid Technologies Conference Europe (ISGT-Europe), pp. 1-6, Sept. 2017.
- A. M. Amuna, R. Karandeh and V. Cecchi, "Voltage Regulation in Distribution Systems using Distributed Energy Resources," SoutheastCon 2021, Atlanta, GA, USA, 2021, pp. 1-7. [CrossRef]
- S. Xu, B. Cao, H. Hassan, G. Song and L. Chang, "Parabolic Droop Voltage Regulation by DER Inverter for Power System Support Functions," 2021 IEEE 12th International Symposium on Power Electronics for Distributed Generation Systems (PEDG), Chicago, IL, USA, 2021, pp. 1-5.
- G. Liu, O. Ceylan, Y. Xu and K. Tomsovic, "Optimal voltage regulation for unbalanced distribution networks considering distributed energy resources," 2015 IEEE Power & Energy Society General Meeting, Denver, CO, USA, 2015, pp. 1-5. [CrossRef]
- Y. -J. Liu, S. -C. Yang, W. -M. Liu, Y. -D. Lee and C. -C. Cheng, "Voltage Regulation of Distribution Feeders by Distributed Energy Resources Coordination Control in Microgrid," 2021 IEEE International Future Energy Electronics Conference (IFEEC), Taipei, Taiwan, 2021, pp. 1-6. [CrossRef]
- Chaoxian Lv, Kaiping Qu, Rui Liang, Guanyu Song,Multi-resource spatio-temporal coordinated voltage regulation for active distribution network with multiple integrated energy stations under uncertainties,Sustainable Energy, Grids and Networks,Volume 37,2024,101253,ISSN 2352-4677. [CrossRef]
- W. Huang and W. Zhang, "Research on Distributed WT Reactive Voltage Coordinated Control Strategy Connected to Distribution Network," 2021 4th International Conference on Energy, Electrical and Power Engineering (CEEPE), Chongqing, China, 2021, pp. 529-534. [CrossRef]
- B. Li et al., "Voltage Coordinated Control Strategy for Distribution Network With Controllable Devices Based on Different Time Response Scales," 2024 IEEE 7th International Electrical and Energy Conference (CIEEC), Harbin, China, 2024, pp. 4245-4252. [CrossRef]
- Q. Zhang, J. Shang, J. Wang and H. Liu, "Coordinated Day-ahead and Intra-day Operation of Distribution Networks Considering the Active Support of Distributed PV and ES System," 2023 IEEE 4th China International Youth Conference On Electrical Engineering (CIYCEE), Chengdu, China, 2023, pp. 1-6. [CrossRef]
- https://german.cri.cn/.
- Y. Shang, A. Tang, L. Ma and Z. Tong, "Hybrid Power Transformer Voltage Control Strategy for Grid-connected Photovoltaics," 2024 7th International Conference on Energy, Electrical and Power Engineering (CEEPE), Yangzhou, China, 2024, pp. 1432-1437. [CrossRef]
- H. Zhang, C. Xia, P. Peng, N. Chen and B. Gao, "Research on the Voltage Regulation Strategy of Photovoltaic Power Plant," 2018 China International Conference on Electricity Distribution (CICED), Tianjin, China, 2018, pp. 1620-1624. [CrossRef]
- M. He, K. Ji, J. Hou, T. Zhang and F. Xiao, "Study on the Participation Strategy of Multi-Energy Storage System Based on Battery Energy Storage in Grid Voltage Regulation," 2023 7th International Conference on Power and Energy Engineering (ICPEE), Chengdu, China, 2023, pp. 153-157. [CrossRef]
- X. Li, L. Wang, N. Yan and R. Ma, "Cooperative Dispatch of Distributed Energy Storage in Distribution Network With PV Generation Systems," in IEEE Transactions on Applied Superconductivity, vol. 31, no. 8, pp. 1-4, Nov. 2021, Art no. 0604304. [CrossRef]
- J. Kim, E. Muljadi, J. -W. Park and Y. C. Kang, "Flexible IQ–V Scheme of a DFIG for Rapid Voltage Regulation of a Wind Power Plant," in IEEE Transactions on Industrial Electronics, vol. 64, no. 11, pp. 8832-8842, Nov. 2017. [CrossRef]
- D. Mascarella, S. Li, G. Joos and P. Venne, "Reactive power coordination in DFIG based wind farms for voltage regulation & flicker mitigation," 2015 IEEE Power & Energy Society General Meeting, Denver, CO, USA, 2015, pp. 1-5. [CrossRef]
- H. Zhao, J. Yang, T. Li and X. Mei, "Coordinated Optimal Dispatching Method for Distributed Energy Storage and Distribution Network Under Multi-time Scale," 2023 3rd International Conference on Electrical Engineering and Mechatronics Technology (ICEEMT), Nanjing, China, 2023, pp. 403-406. [CrossRef]
- P. Li et al., "MPC-Based Local Voltage Control Strategy of DGs in Active Distribution Networks," in IEEE Transactions on Sustainable Energy, vol. 11, no. 4, pp. 2911-2921, Oct. 2020. [CrossRef]

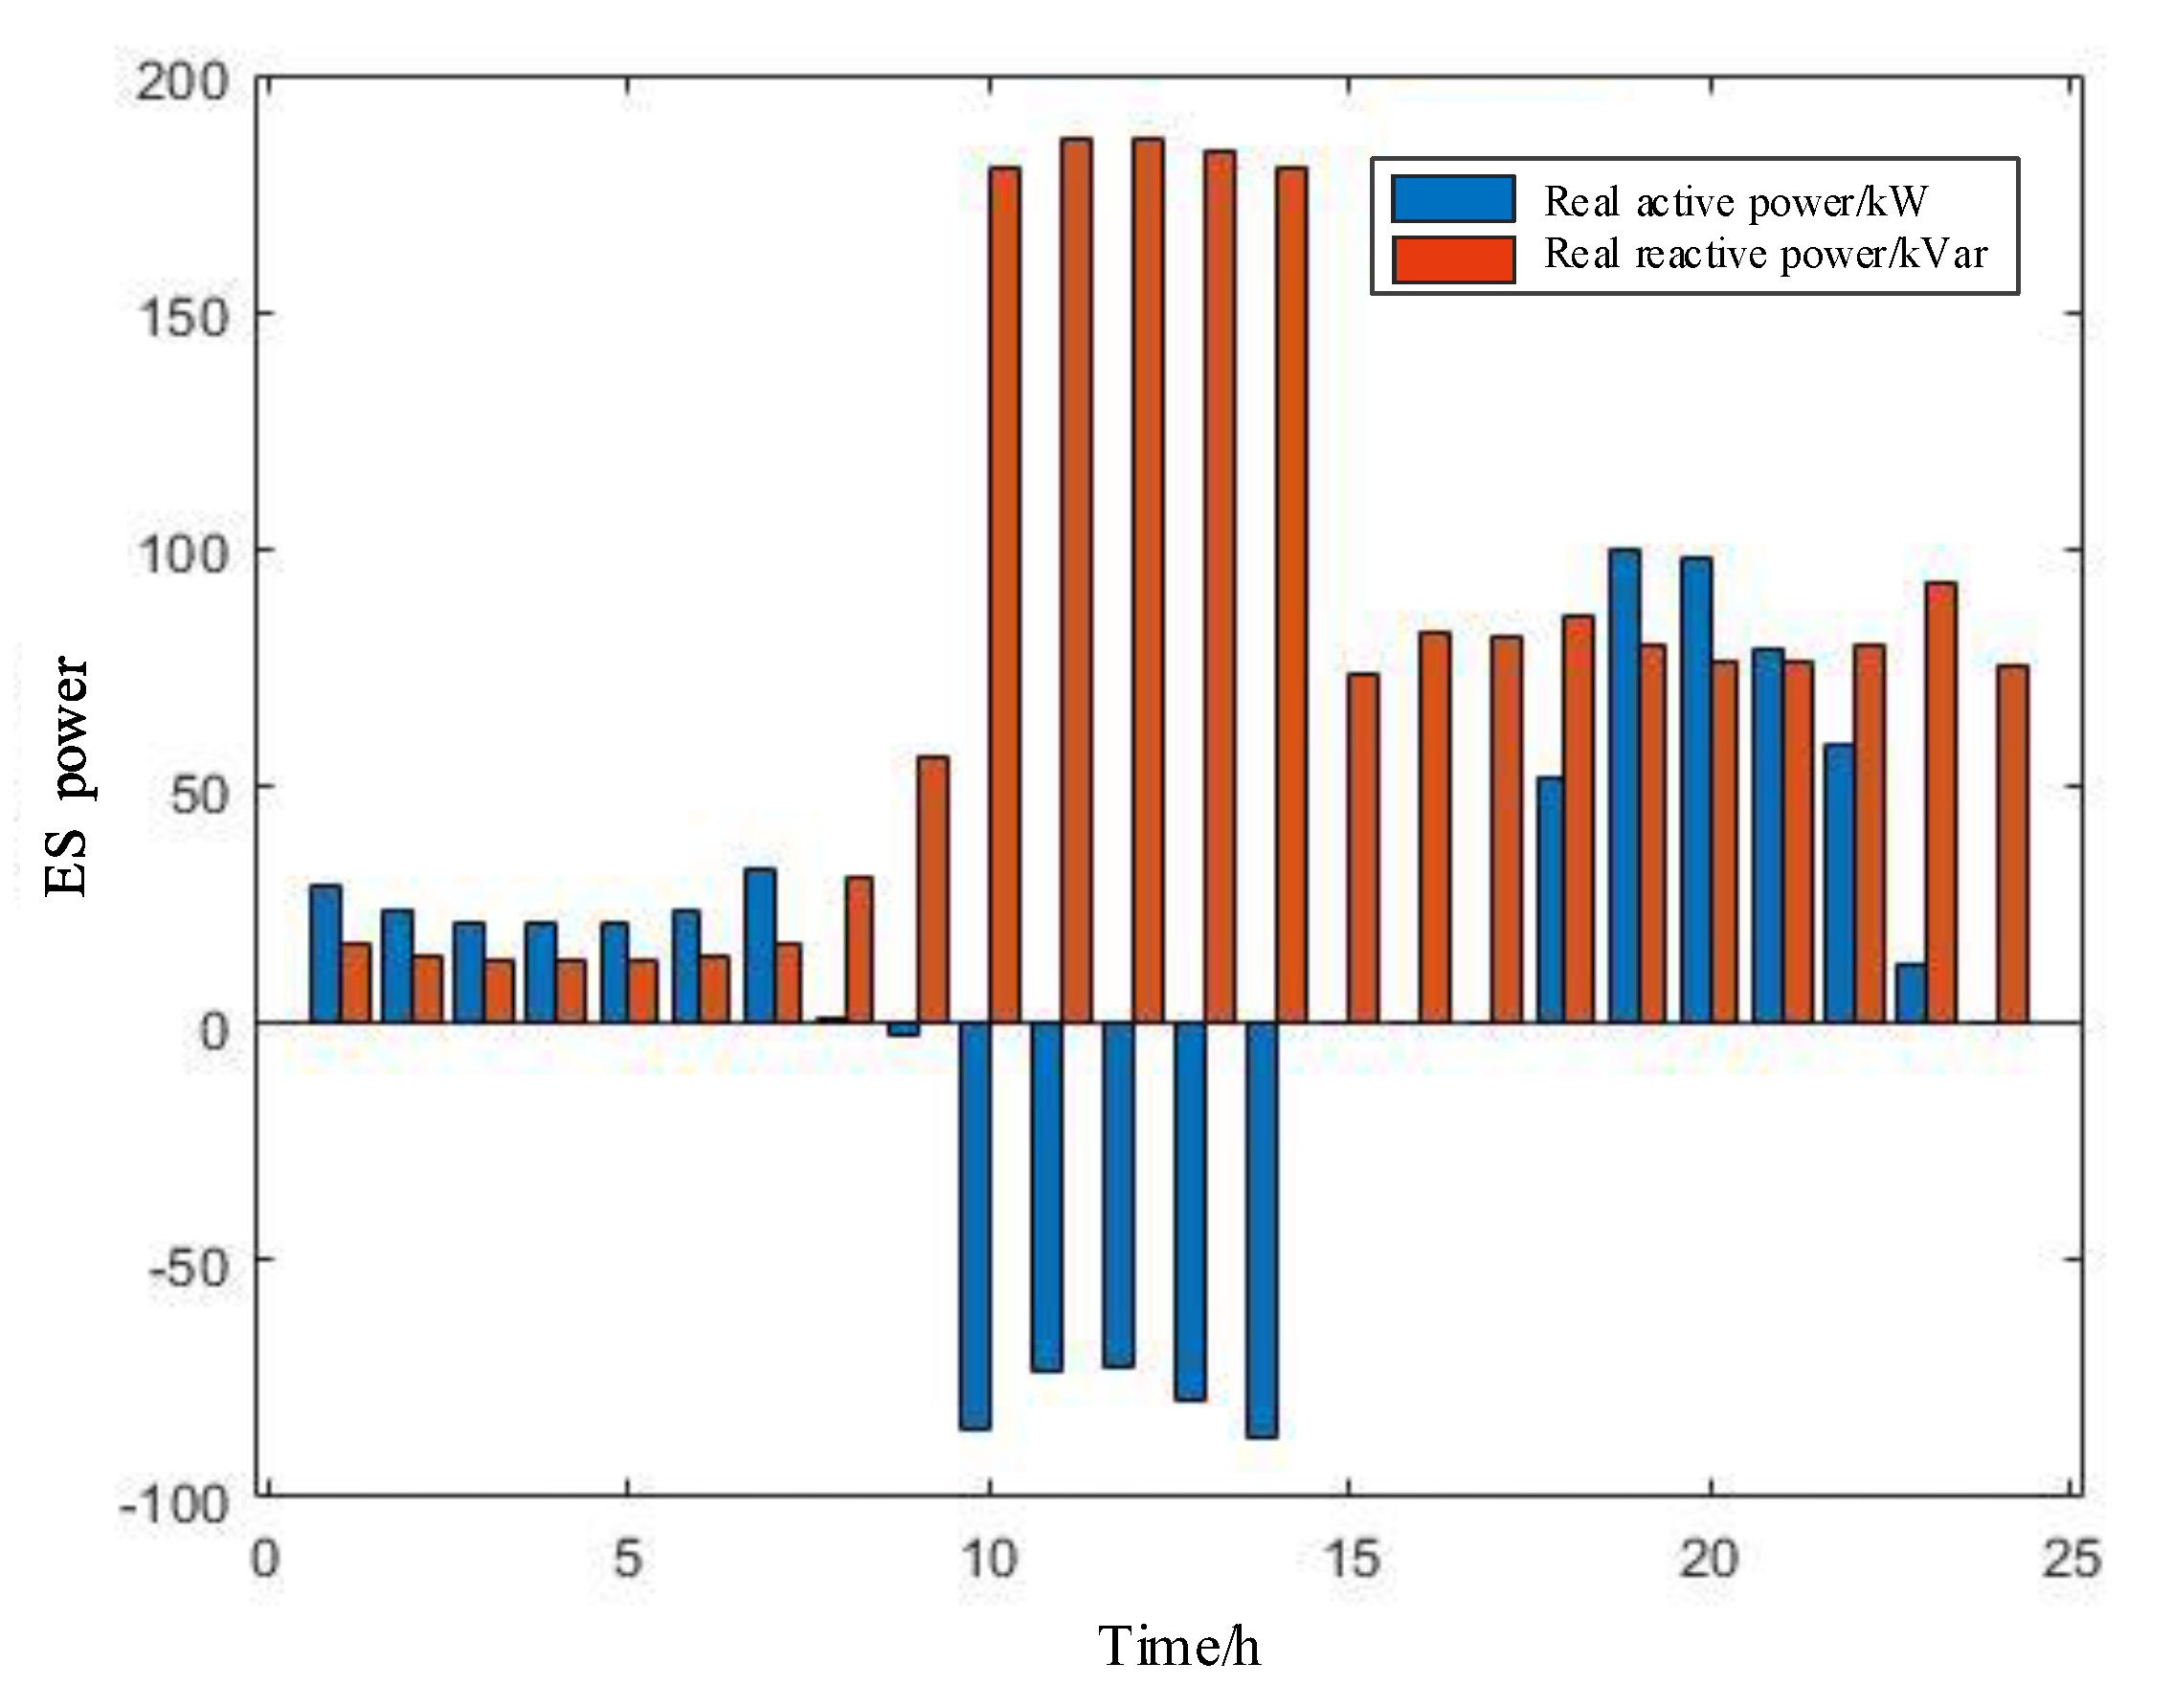
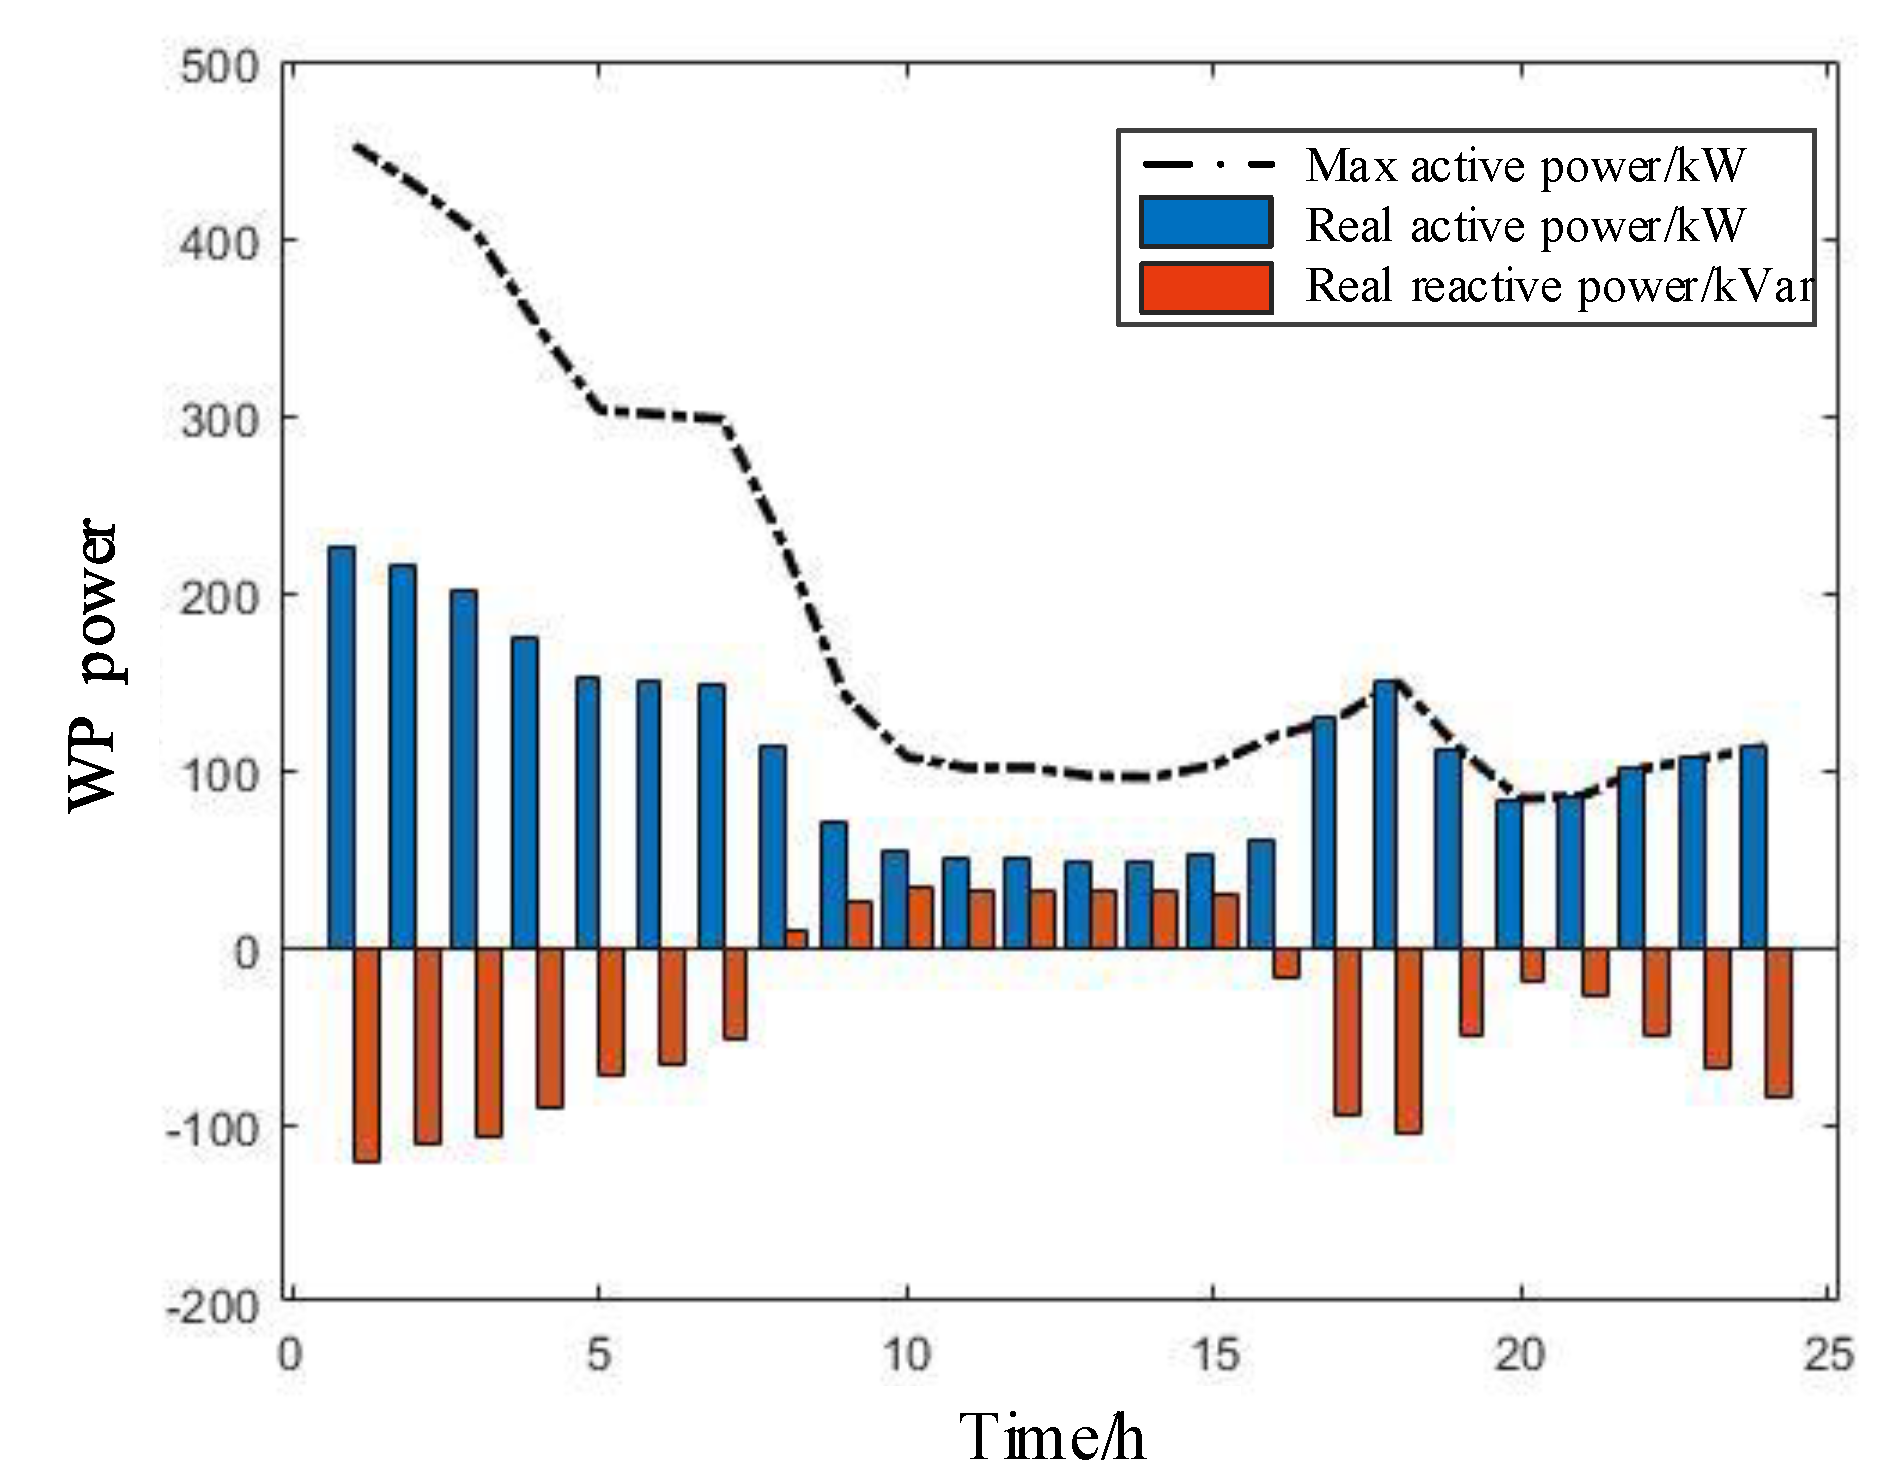
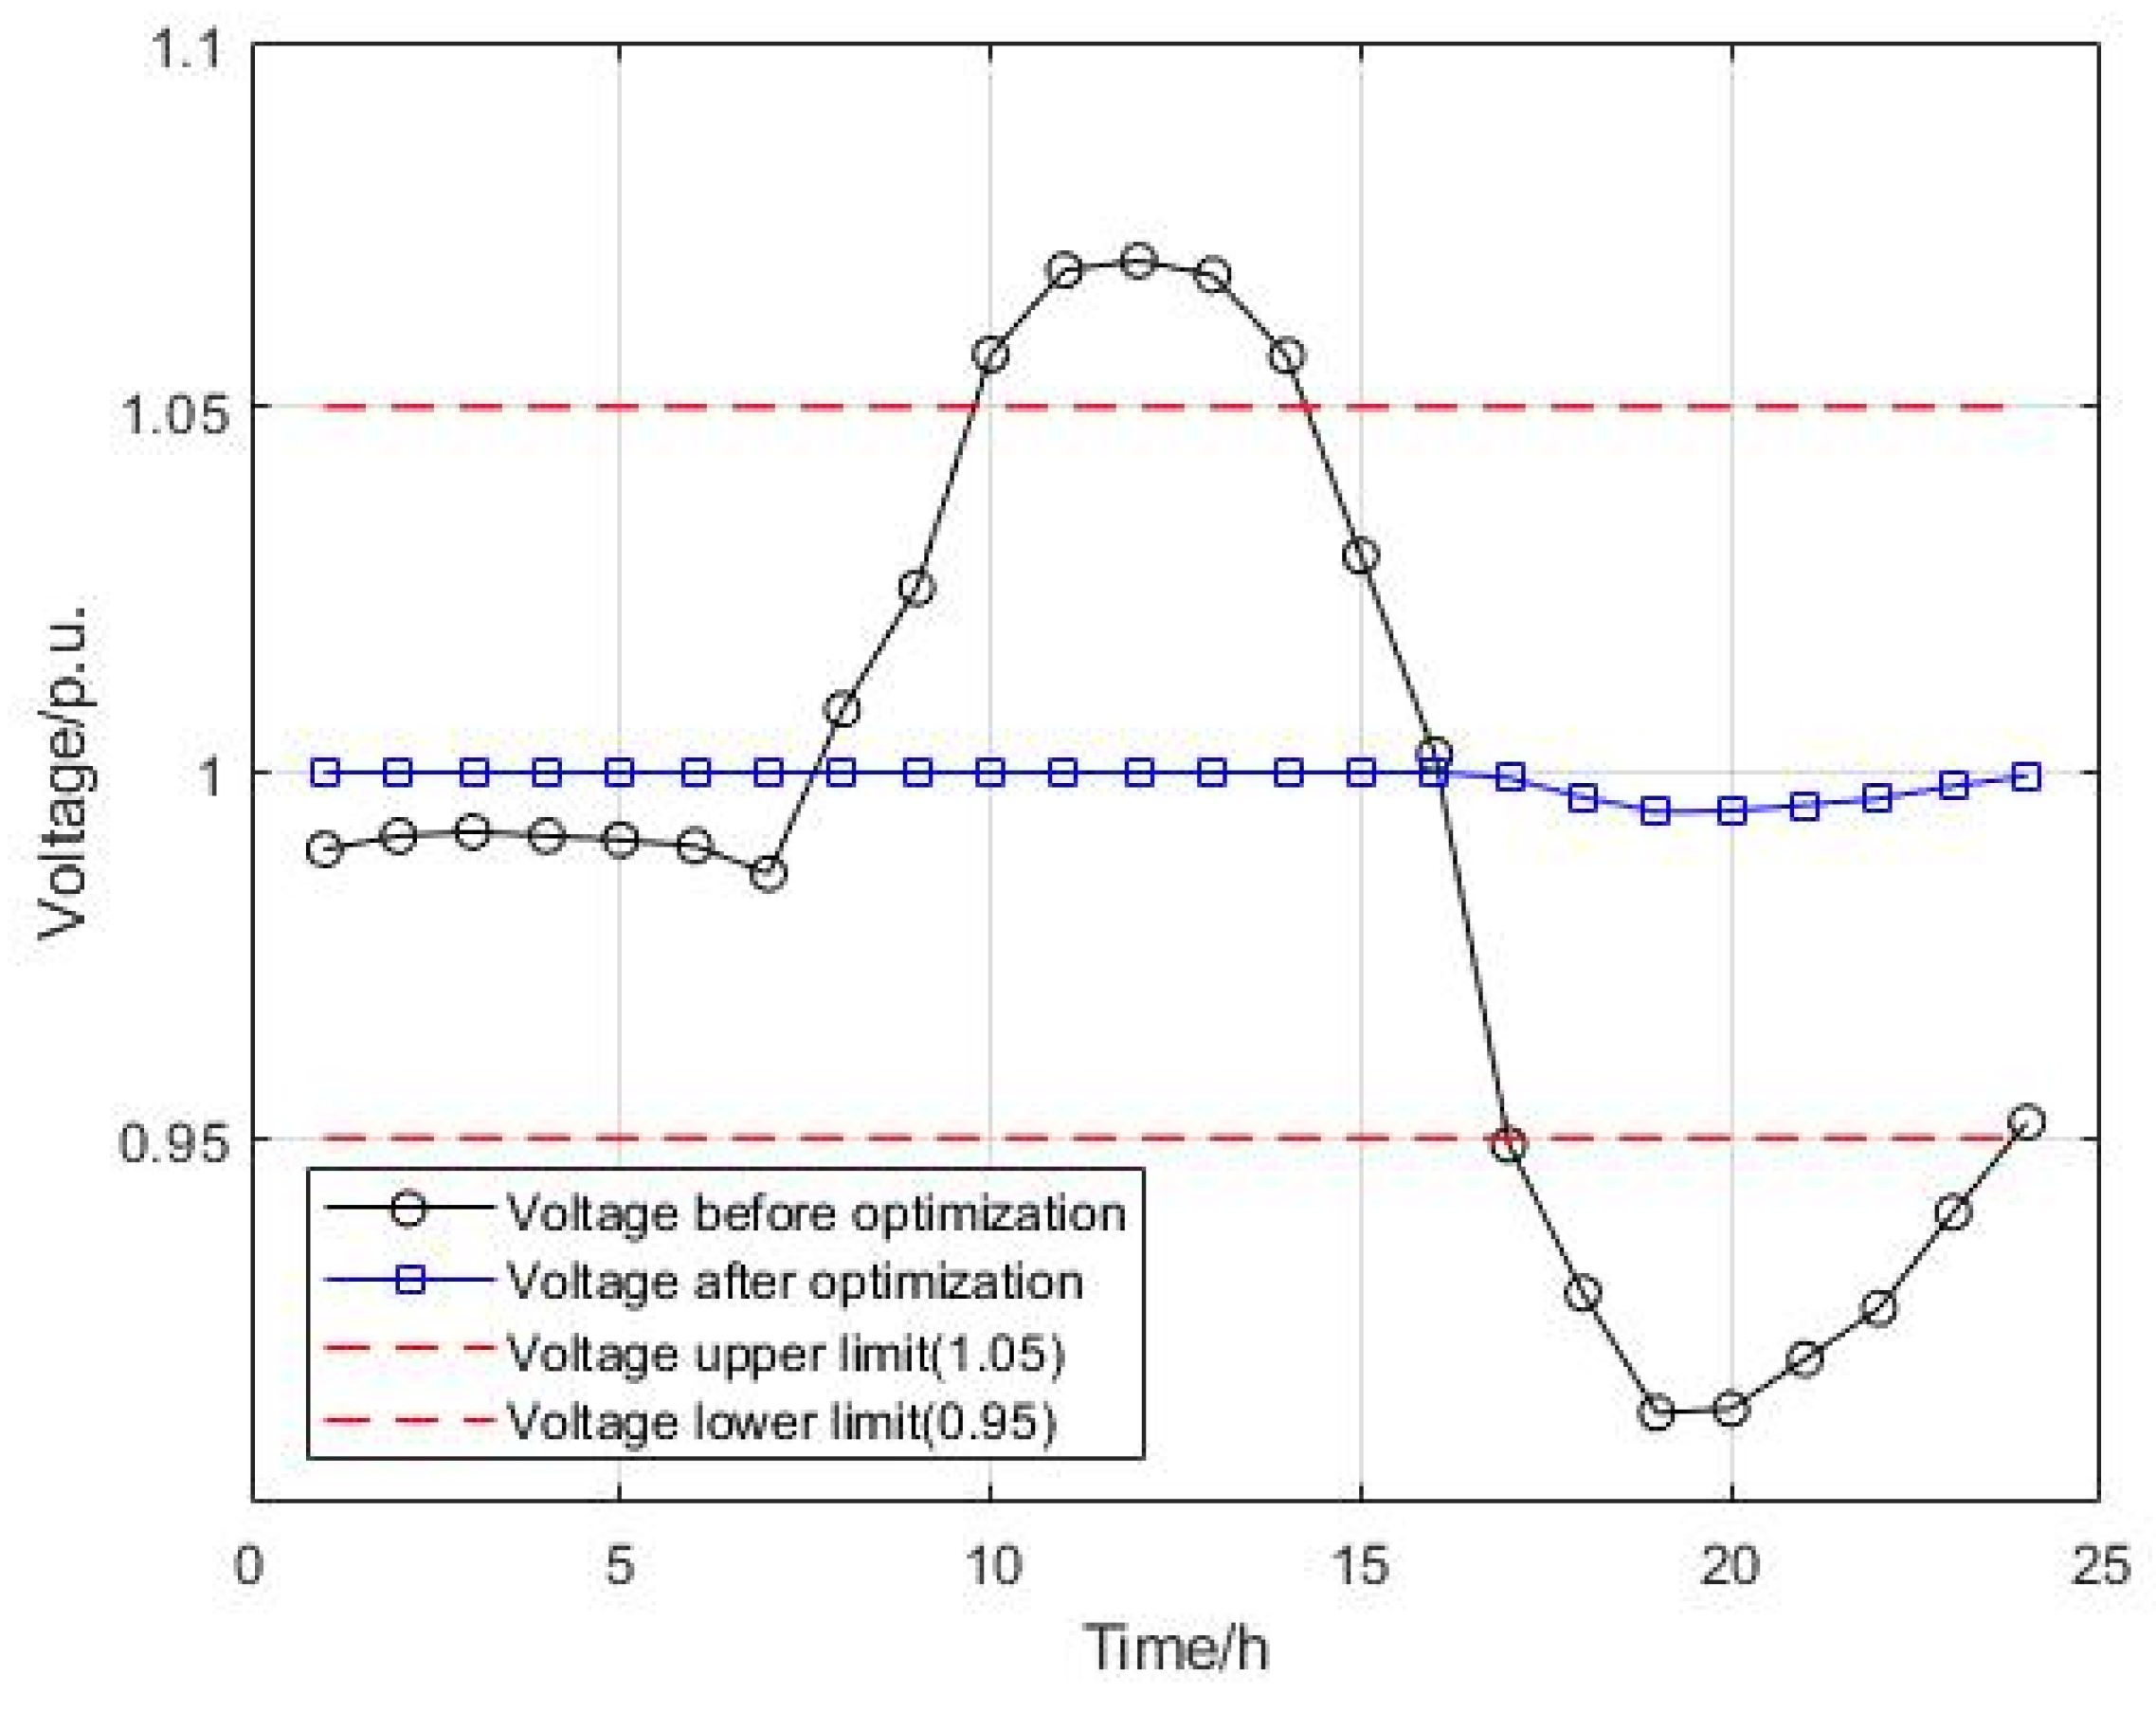
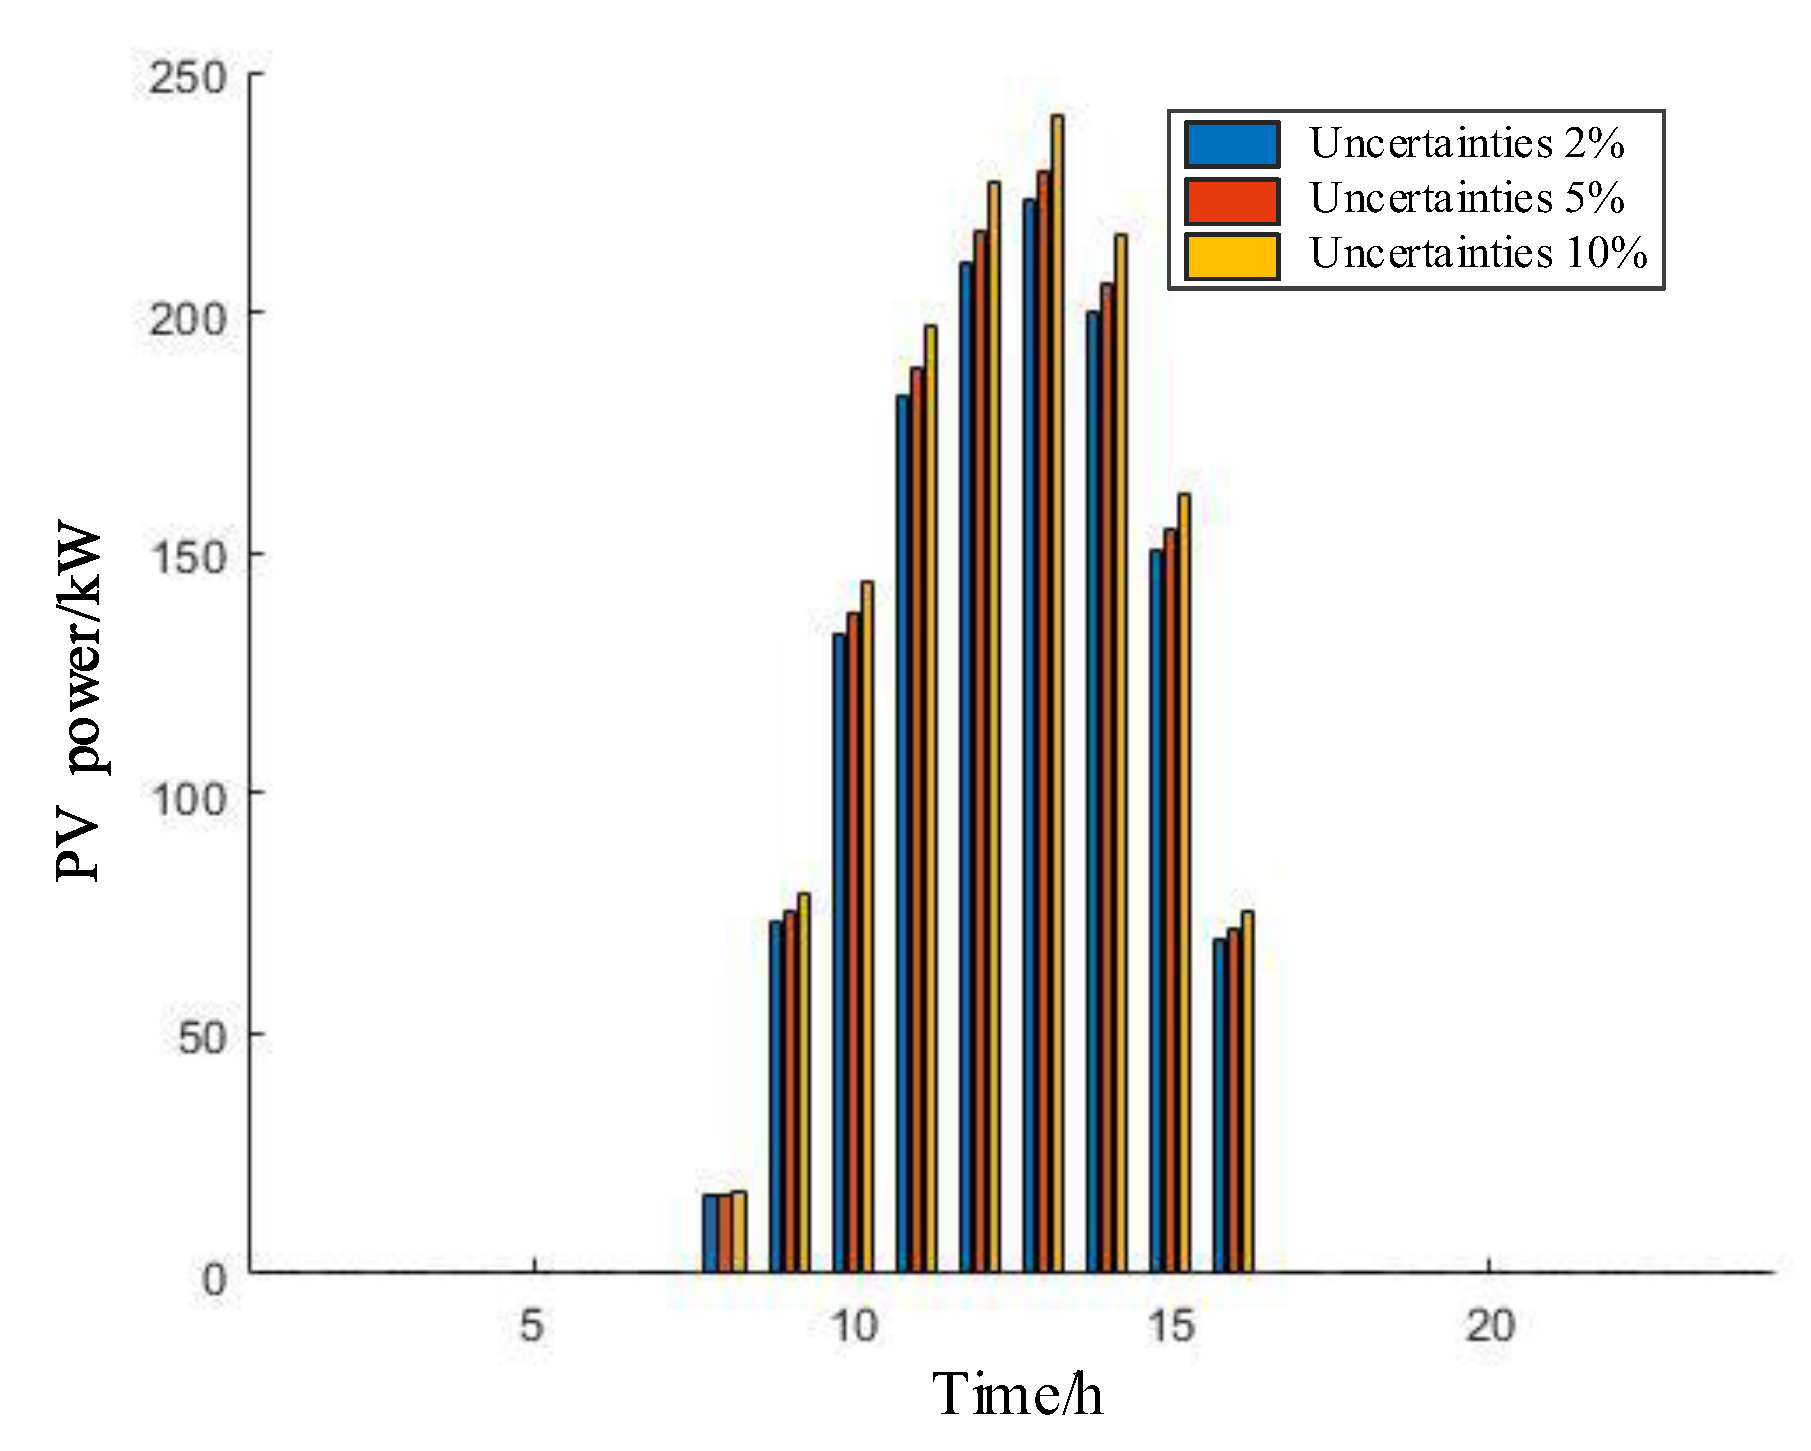
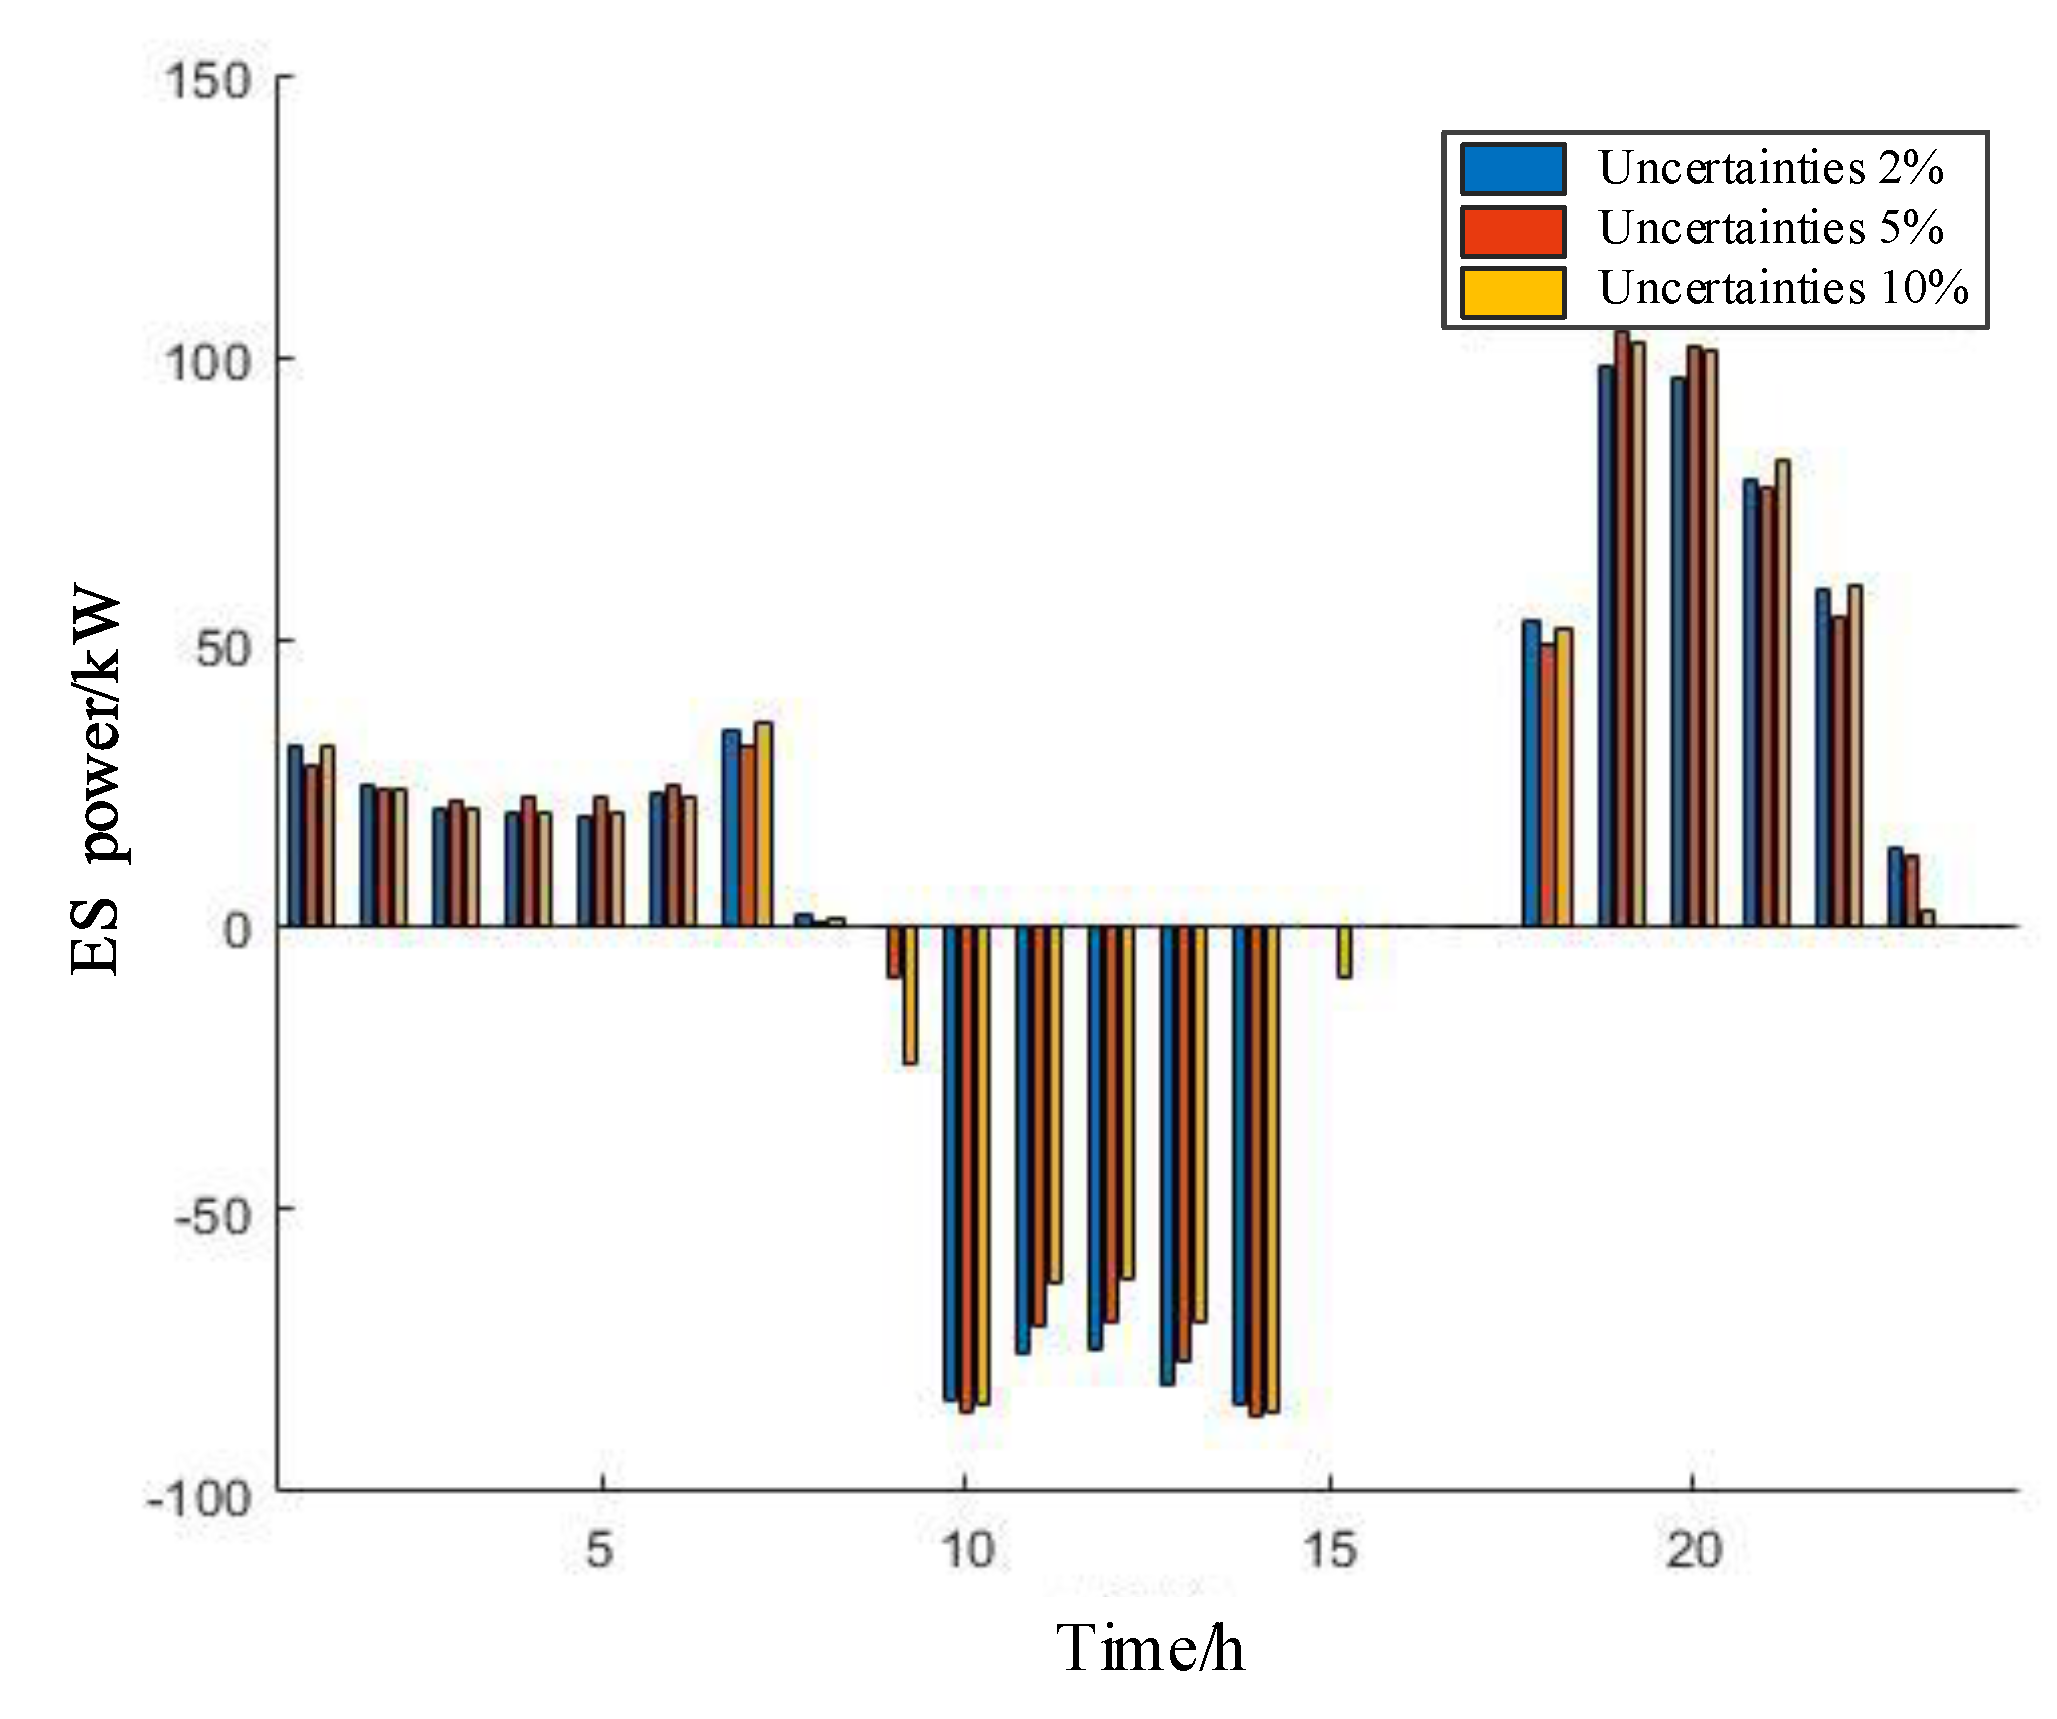
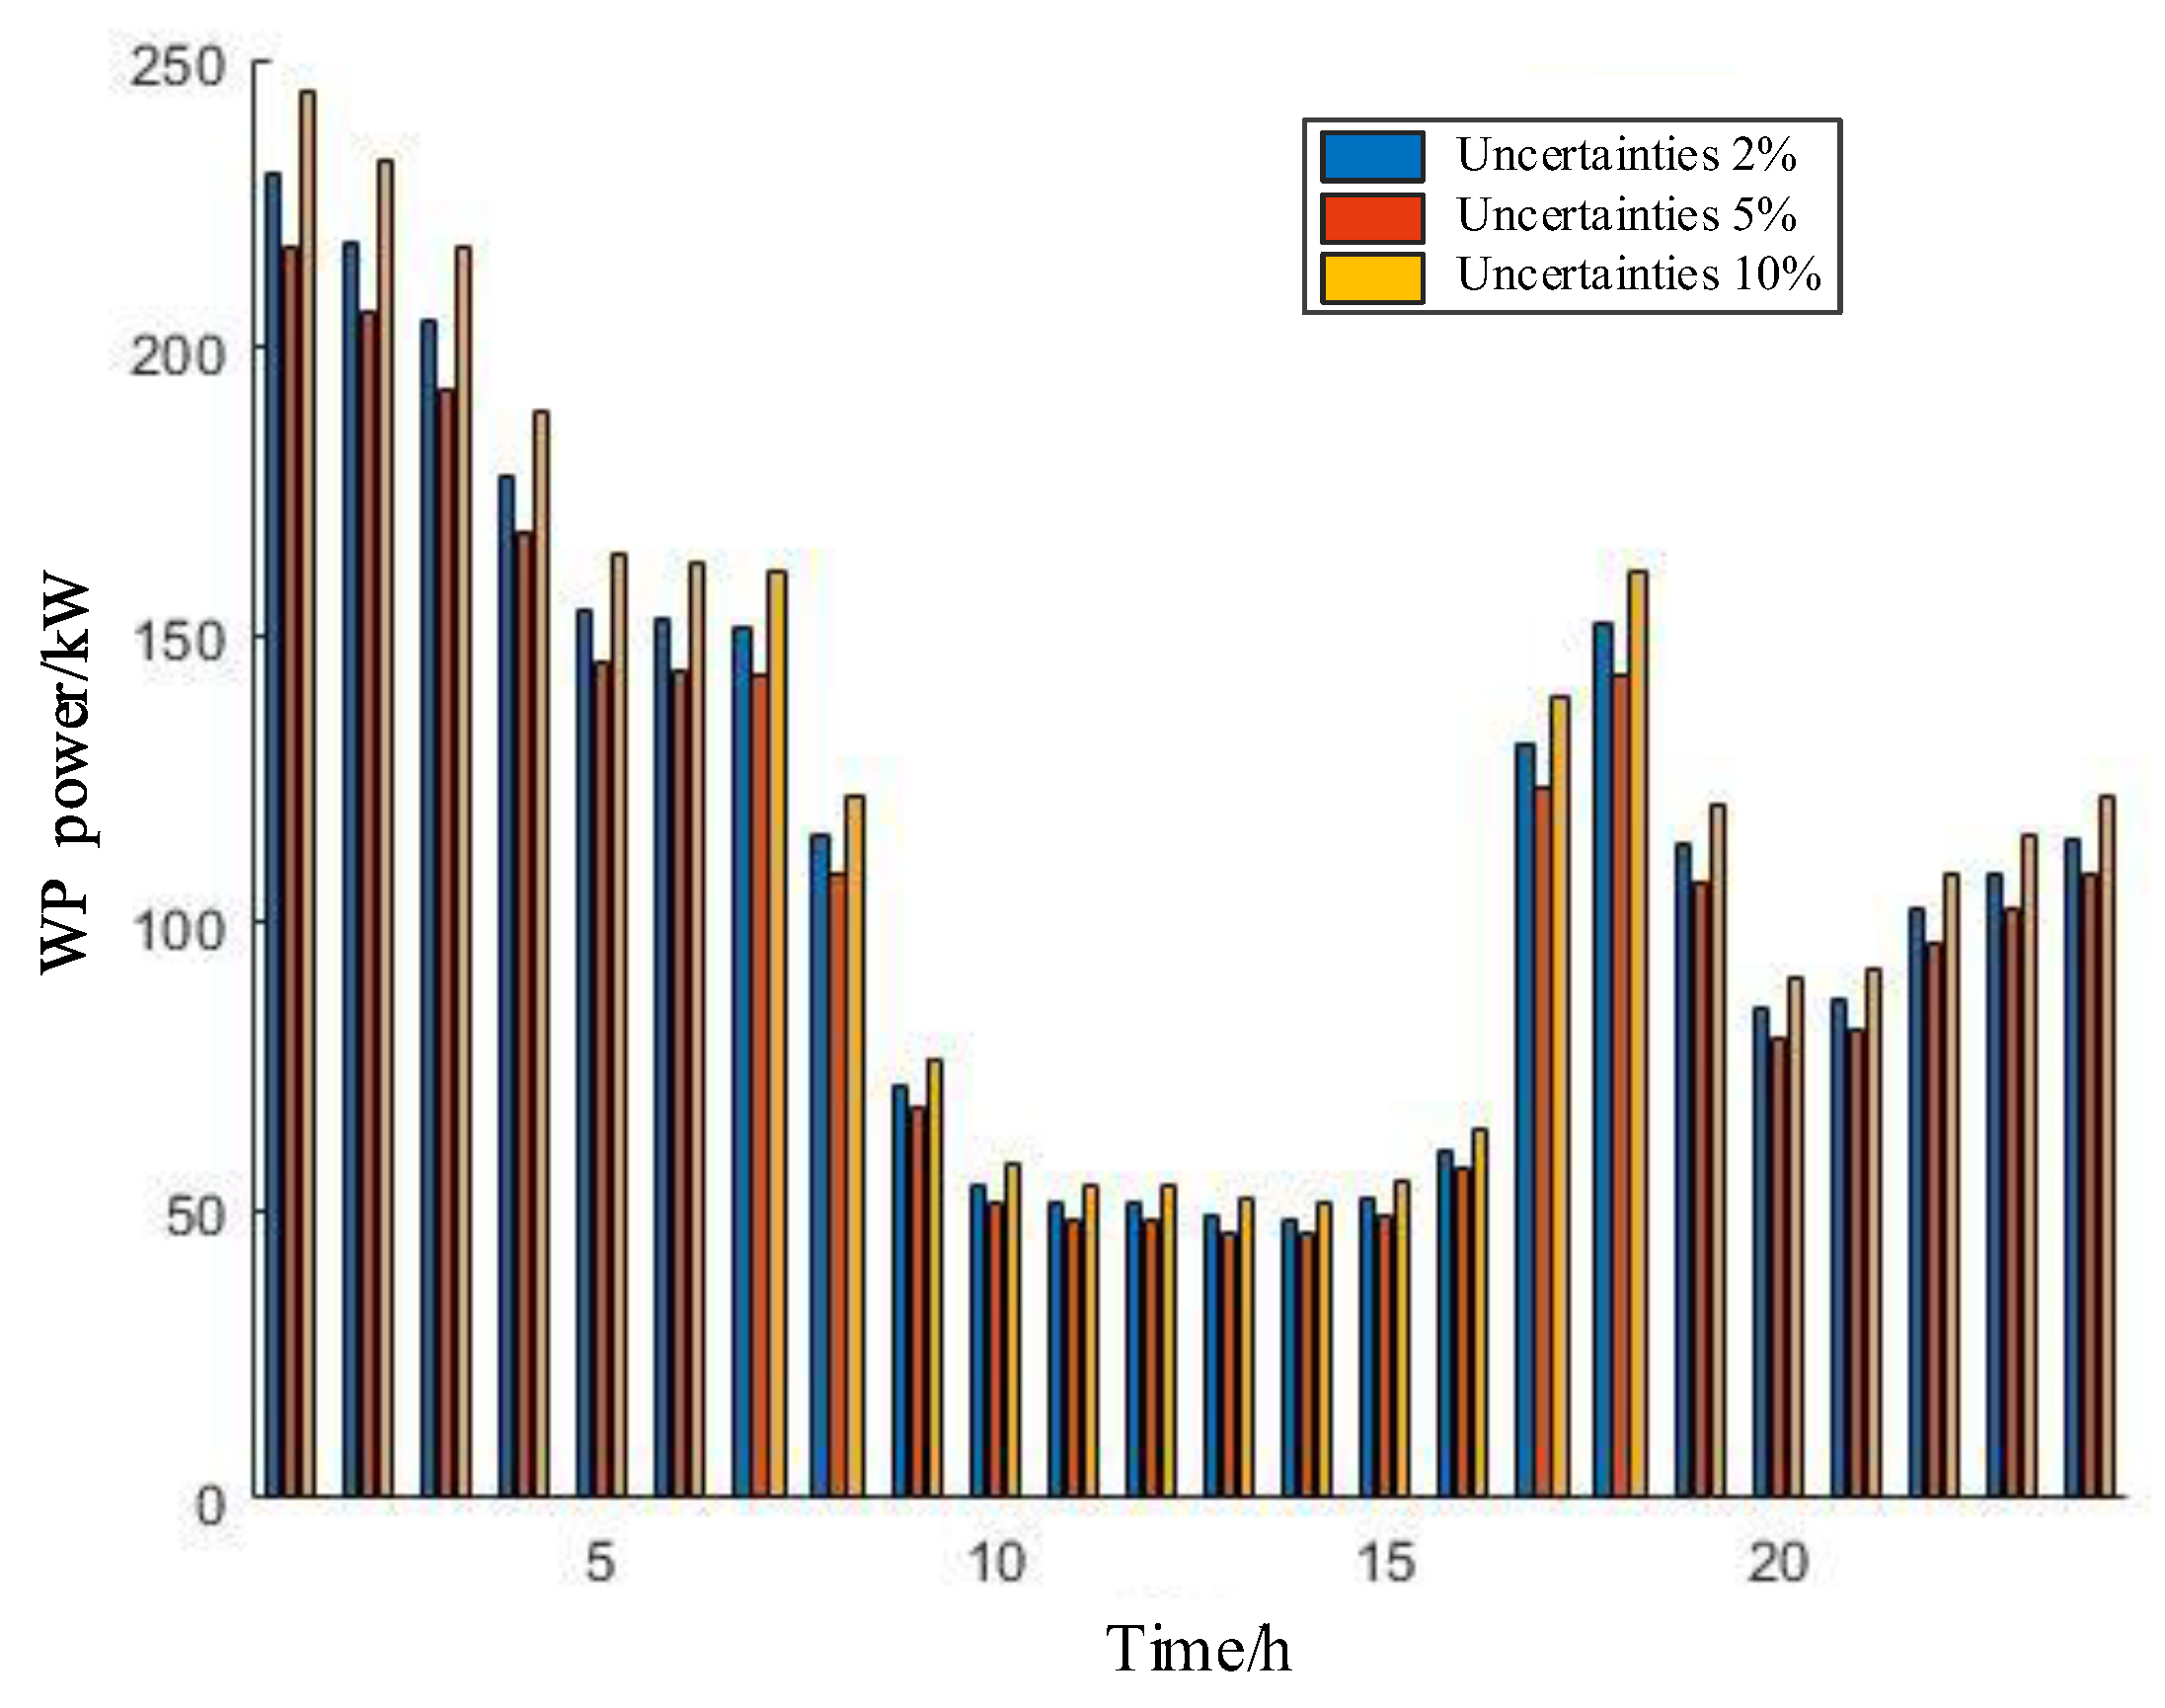
| Distributed resource | Access node | Capacity/kVA |
|---|---|---|
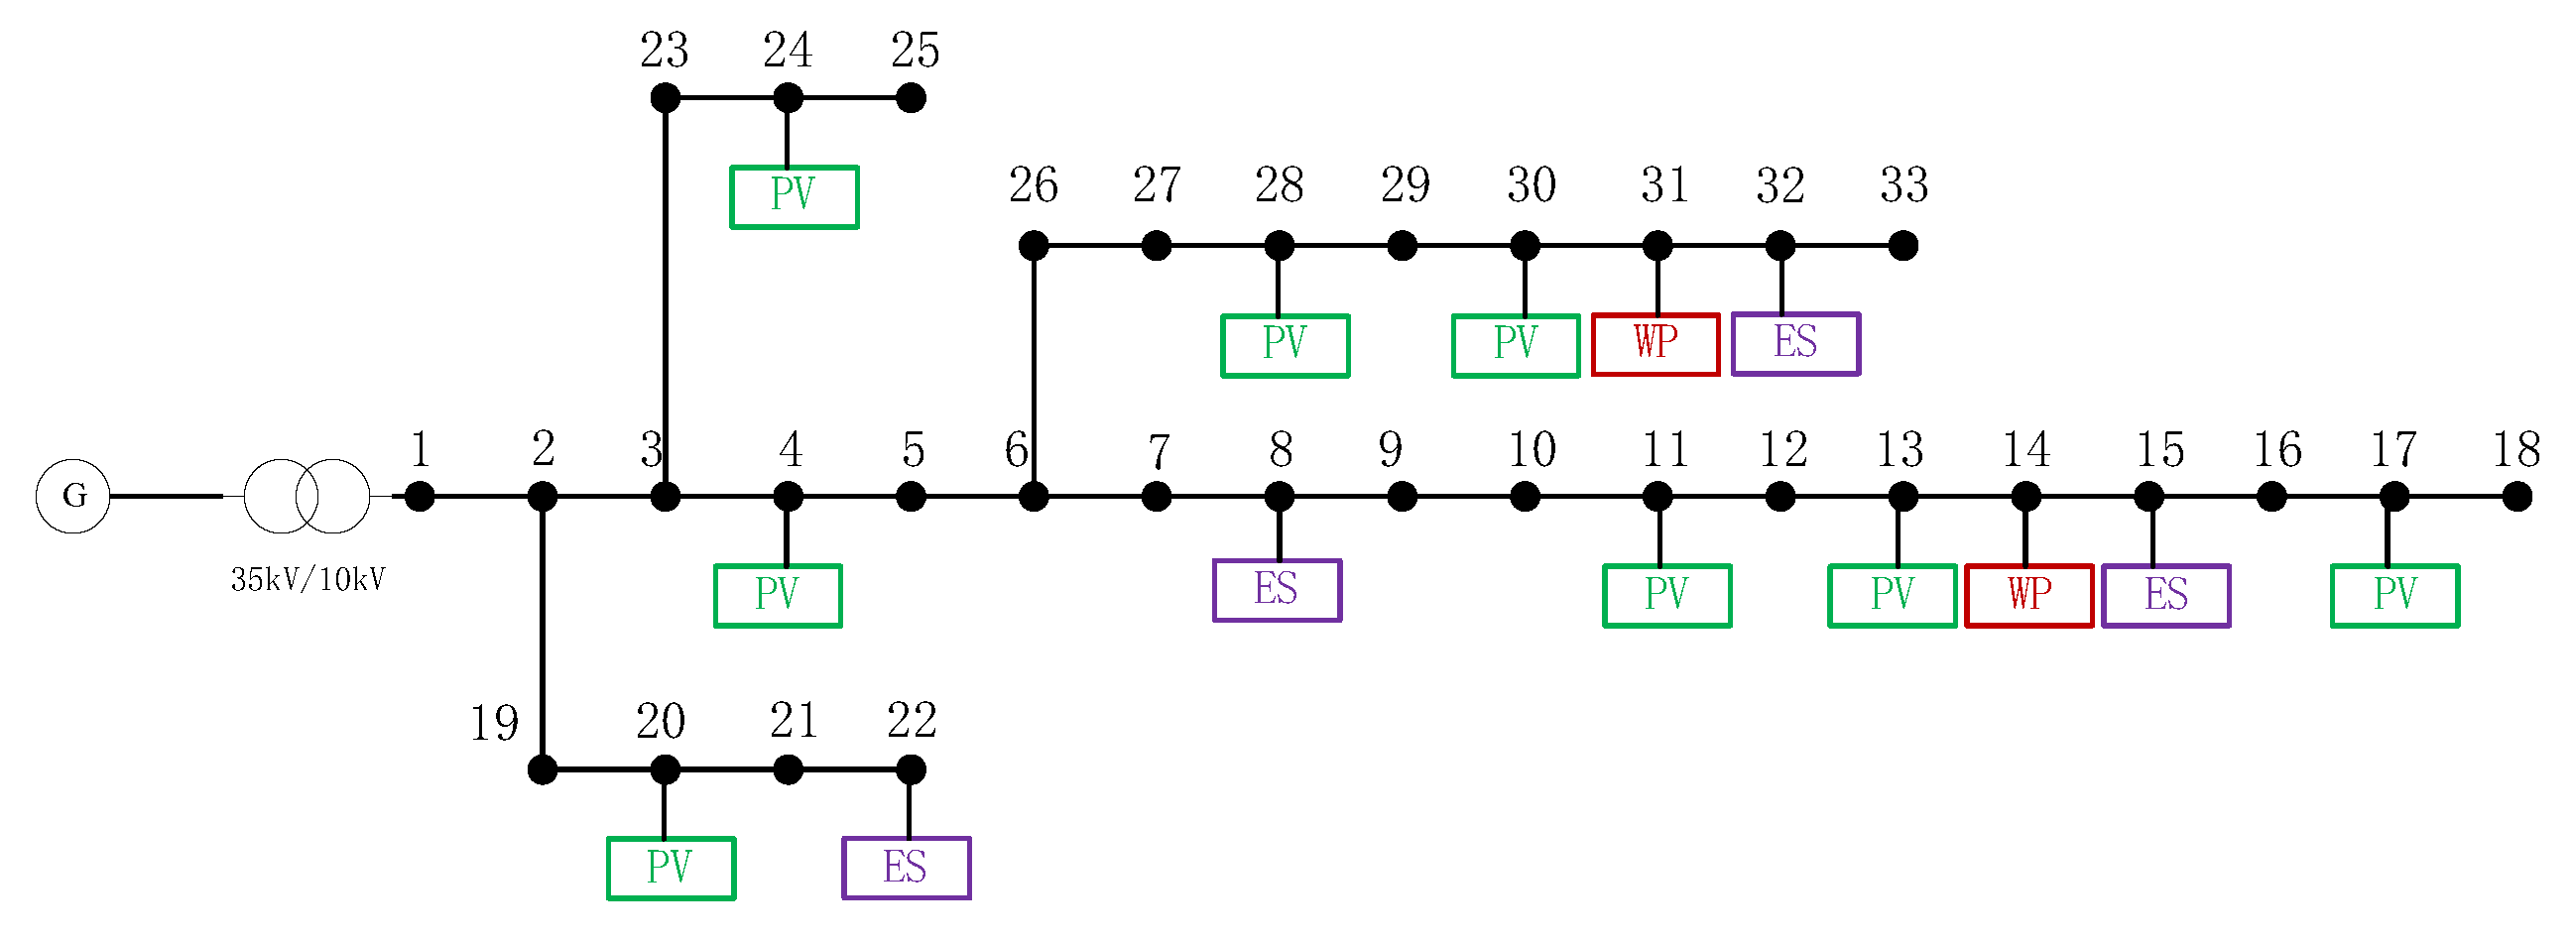
| PV | 4, 11, 24 | 500 |
| 13, 20, 30 | 800 | |
| 17, 28 | 1000 | |
| ES | 8, 15, 22, 32 | 200 |
| WT | 14, 31 | 750 |
| node | Predicted output/kW | Pre-calibration reactive power strategy/kVar | Pre-correction meritorious strategy/kW | Actual output/kW |
Post-calibration reactive power strategy /kVar |
Post-correction credit strategy /kW |
Inverter Configuration Capacity /kVA |
|---|---|---|---|---|---|---|---|
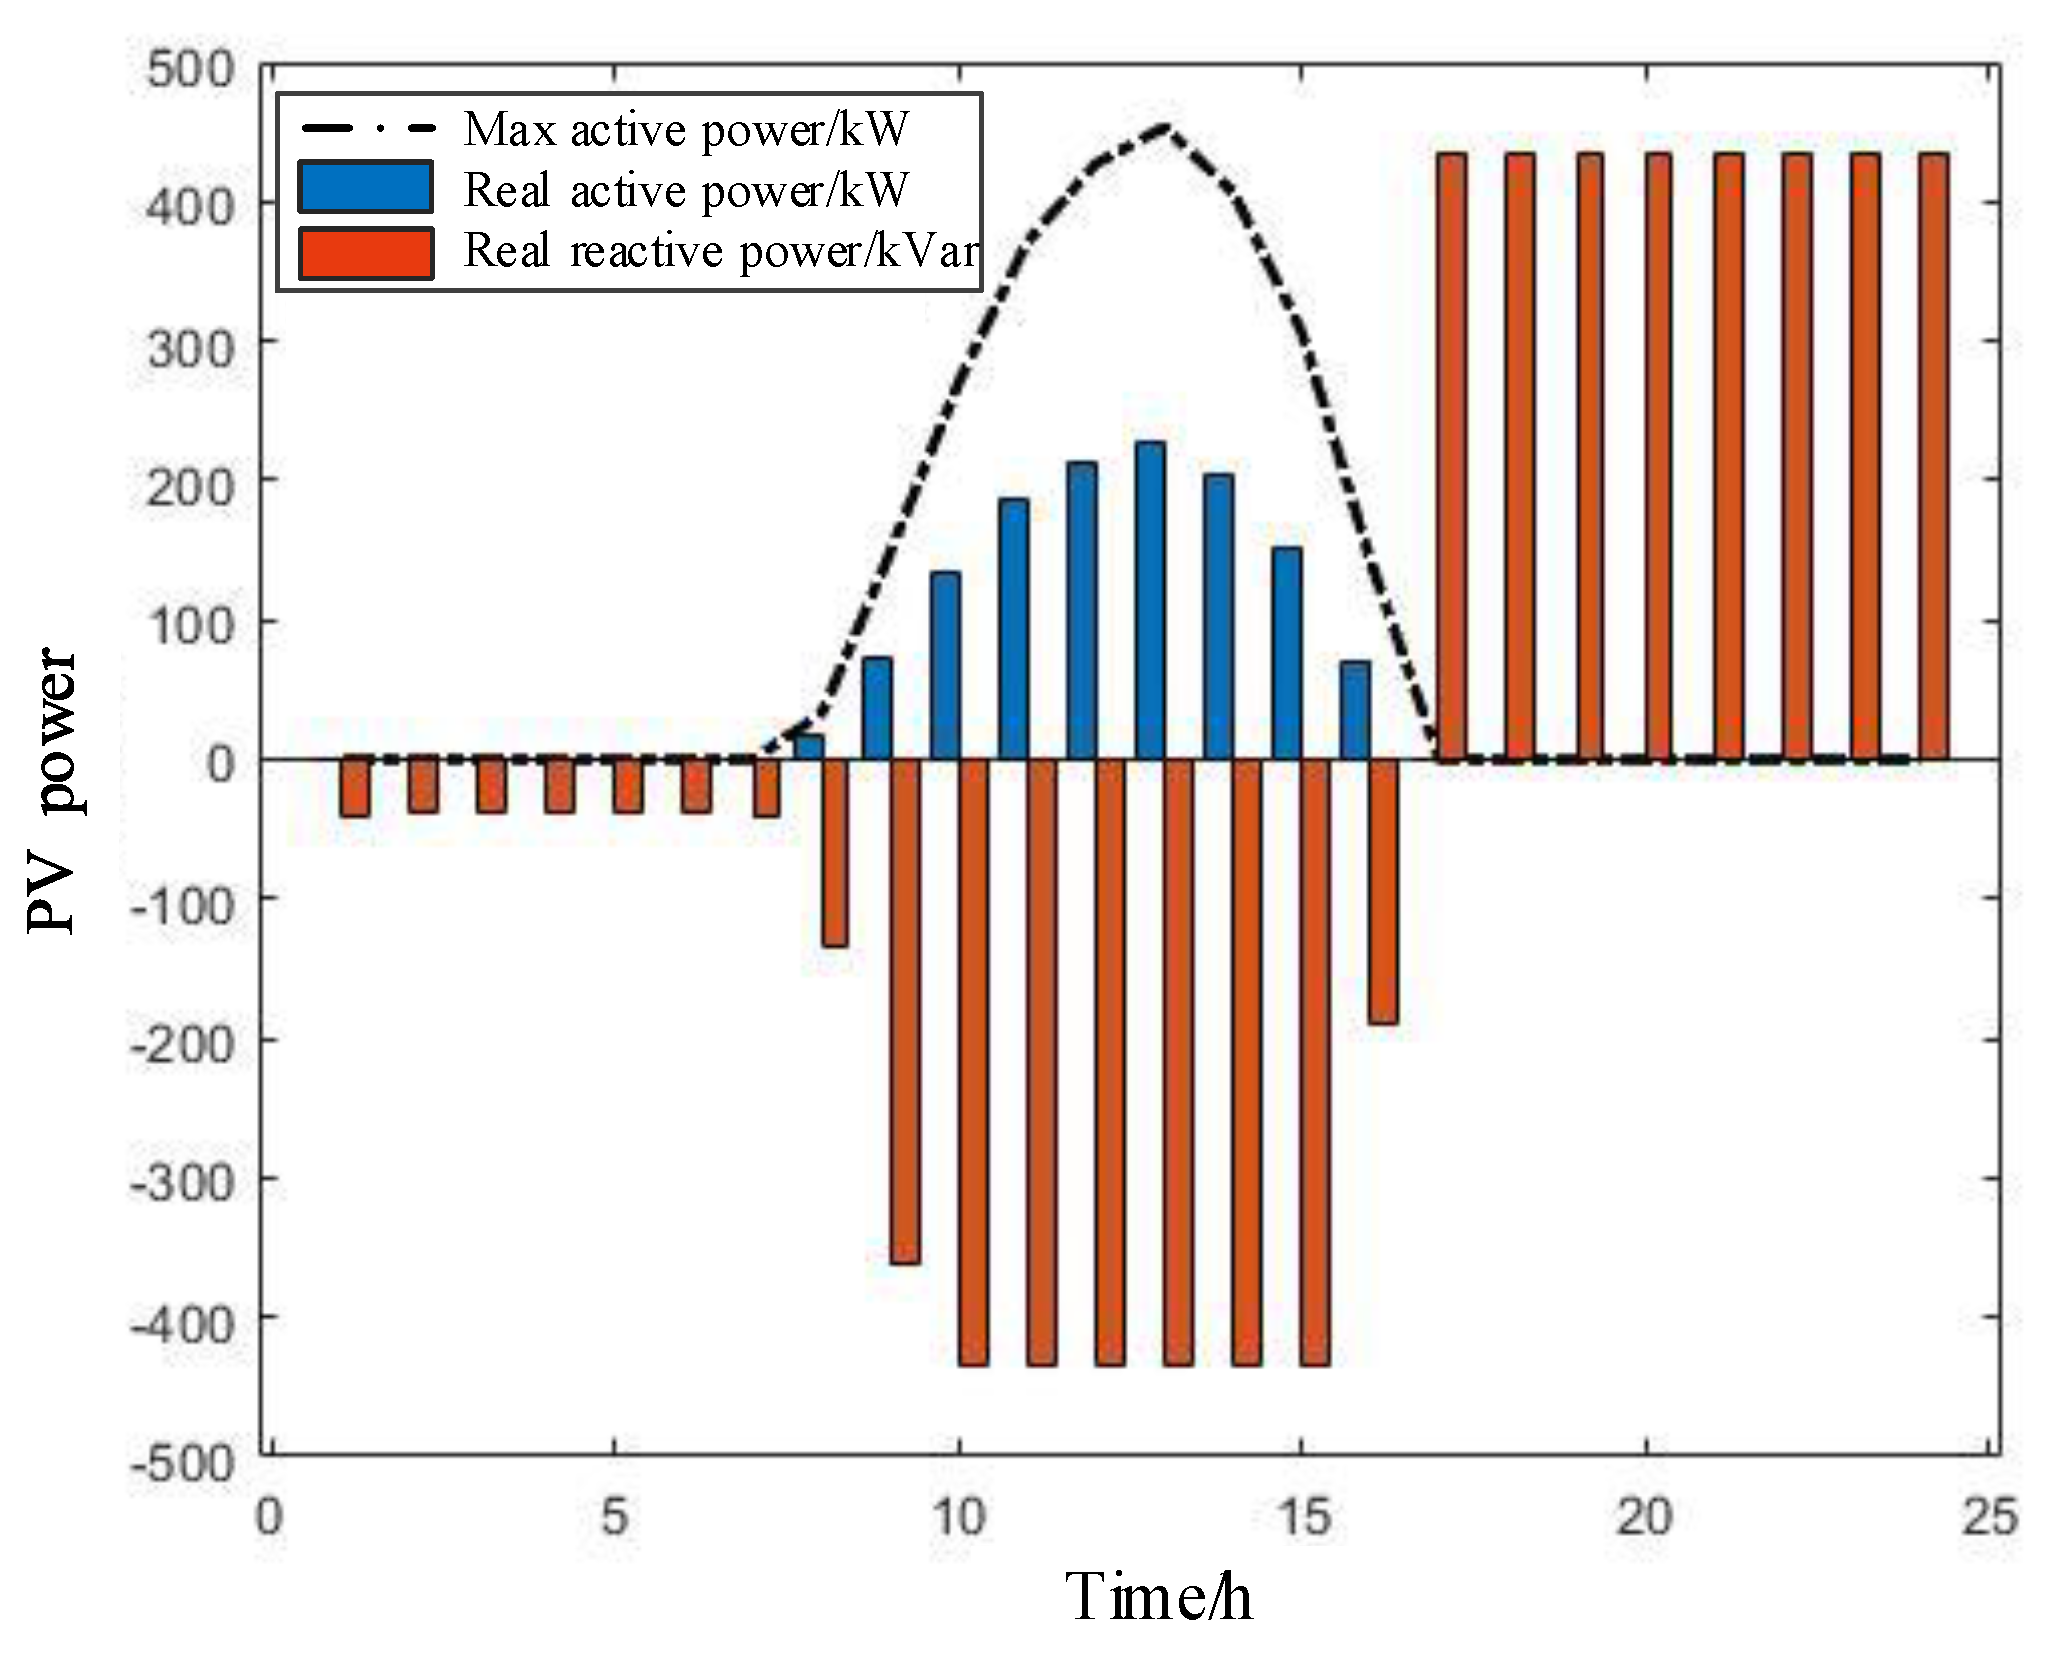
| 4 | 427.44 | -433 | 213.72 | 454.35 | -433.01 | 227.17 | 500 |
| 11 | 427.44 | 433 | 213.72 | 454.35 | 433.01 | 227.17 | 500 |
| 13 | 664.26 | -72.1 | 332.13 | 706.07 | -81.24 | 353.04 | 800 |
| 17 | 830.32 | -141.5 | 415.16 | 882.59 | -150.9 | 441.29 | 1000 |
| 20 | 664.26 | -332.85 | 332.13 | 706.07 | -356.7 | 353.04 | 800 |
| 24 | 427.44 | -254.4 | 213.72 | 454.35 | -271.43 | 227.17 | 500 |
| 28 | 830.32 | -392.88 | 415.16 | 882.59 | -408.91 | 441.29 | 1000 |
| 30 | 664.26 | -320.21 | 332.13 | 706.07 | -348.7 | 353.04 | 800 |
| 14 | 279.7 | 32.3895 | 50.6 | 299.4 | 29.9738 | 54.71 | 750 |
| 31 | 160 | 32.3874 | 50.6 | 156.9 | 29.9724 | 54.71 | 750 |
| 8 | - | 186.39 | -72.51 | - | -62.66 | 189.93 | 200 |
| 15 | - | 176.35 | -94.34 | - | -91.87 | 177.65 | 200 |
| 22 | - | 83.6 | -95.16 | - | -95.04 | 83.5 | 200 |
| 32 | - | 140.37 | -138.85 | - | -138.78 | 140.31 | 200 |
| Node | Post-calibration reactive power strategy /kVar |
Post-correction credit strategy /kW |
Inverter Configuration Capacity /kVA | Adjustable reactive power capacity/kVar |
Adjustable active capacity /kW |
|---|---|---|---|---|---|
| 4 | -433.01 | 227.17 | 500 | [-12.4,878.42] | 227.17 |
| 11 | 433.01 | 227.17 | 500 | [-878.42,12.4] | 227.17 |
| 13 | -81.24 | 353.04 | 800 | [-636.65,799.13] | 353.04 |
| 17 | -150.9 | 441.29 | 1000 | [-746.46,1048.26] | 441.29 |
| 20 | -356.7 | 353.04 | 800 | [-361.19,1074.59] | 353.04 |
| 24 | -271.43 | 227.17 | 500 | [-173.98,716.84] | 227.17 |
| 28 | -408.91 | 441.29 | 1000 | [-488.45,1306.27] | 441.29 |
| 30 | -348.7 | 353.04 | 800 | [-369.19,1066.59] | 353.04 |
| 14 | 29.9738 | 54.71 | 750 | [-778,718] | 54.71 |
| 31 | 29.9724 | 54.71 | 750 | [-778,718] | 54.71 |
| 8 | -62.66 | 189.93 | 200 | [-110.54,235.86] | 100 |
| 15 | -91.87 | 177.65 | 200 | [-81.34,265.07] | 100 |
| 22 | -95.04 | 83.5 | 200 | [-78.16,268.24] | 100 |
| 32 | -138.78 | 140.31 | 200 | [-34.42,311.98] | 100 |
Disclaimer/Publisher’s Note: The statements, opinions and data contained in all publications are solely those of the individual author(s) and contributor(s) and not of MDPI and/or the editor(s). MDPI and/or the editor(s) disclaim responsibility for any injury to people or property resulting from any ideas, methods, instructions or products referred to in the content. |
© 2024 by the authors. Licensee MDPI, Basel, Switzerland. This article is an open access article distributed under the terms and conditions of the Creative Commons Attribution (CC BY) license (https://creativecommons.org/licenses/by/4.0/).


