1. Introduction
Sedimentary exhalative deposits are highly significant deposit types, yielding substantial quantities of base metals, non-ferrous metals, precious metals, and rare metals. In recent years, numerous scholars have employed diverse research methods to conduct extensive studies on typical representative jet-sedimentary polymetallic deposits and have attained favorable outcomes [
1,
2,
3,
4,
5,
6,
7,
8]. Nevertheless, the majority of scholars have initiated their studies of the target area through geological or geochemical approaches. However, relatively few investigations have been conducted on the comprehensive physical exploration of sedimentary exhalative deposit polymetallic ore zones. Consequently, this paper selects the Huaniushan lead-zinc-silver polymetallic deposit as a typical exemplar of jet-sedimentary polymetallic deposits to explore its exploration methods and technologies.
The Huaniushan lead-zinc-silver polymetallic mining area is situated at the junction of Gansu and Xinjiang. After several decades of mining, it has been proven that the mine’s resources are depleted, thereby making the search for minerals in the deep sections of the mining area and its periphery the primary focus. Simultaneously, with the advancement of a new round of mineral exploration efforts, many scholars have redirected their attention to this region. Yang et al. contend that there was a disparity in the past understanding of the ore-forming type of the Huaniushan lead-zinc polymetallic mining area. They further ascertained that the mining area is a jet-sedimentary deposit by utilizing various geophysical data and assert that mineral exploration should concentrate on the contact zone between metamorphic fine-grained clastic rocks and carbonate rocks [
9]. The majority of research on the Huaniushan lead-zinc polymetallic mining area pertains to geological or geochemical aspects [
10,
11], with a limited amount of physical exploration work. Moreover, the physical exploration efforts are primarily one-dimensional and two-dimensional, with a single physical exploration method being the main approach, and comprehensive three-dimensional physical exploration work is relatively scarce. Gong et al. employed the time domain induced polarization (TDIP) to undertake three-dimensional detection of the lead-zinc-silver polymetallic ore area in Huaniushan [
12], obtaining three-dimensional electrical results of the area and determining the direction of ore search; Gu et al. explored the Huaniushan polymetallic mining area using a high-power step device. Starting from horizontal power supply, vertical power supply, and horizontal and vertical bidirectional power supply, they performed three-dimensional inversion on the data to obtain a detailed three-dimensional electrical structure of the mining area. Finally, they provided the selection of relevant detection methods based on the detection requirements [
13].
In this paper, from the perspective of comprehensive physical exploration methods, relevant exploration is carried out in the Huaniushan lead-zinc-silver polymetallic mining area. By utilizing the comprehensive physical exploration data for three-dimensional inversion, in combination with the geological data of the mining area and drilling data, the metallogenic parts of the mining area and the direction of mineral discovery are analyzed, thereby providing favorable foundations for future resource evaluation.
2. Geological and Geophysical Characteristics of the Huaniushan Lead-Zinc-Silver Polymetallic Deposits
2.1. Geological Features
The geotectonic position of the study area is within the Central Asian Orogenic Belt. It is situated in the docking zone of the three major plates, namely the Siberia Craton, the Tarim Craton, and the North China Craton. It is located at the northern edge of the Tarim landmass, to the south of the Liuyuan-Daqiishan Fault, and in the interface zone between the Huaniushan Island Arc and the Dunhuang Block (
Figure 1a). The main tectonic lines in this area are oriented nearly east-west, but locally, they can deviate towards the NNW along the strike, forming some arcuate tectonic lines (
Figure 1b,c).
As depicted in
Figure 1d, the study area primarily consists of Jixian System rock formations. The second lithologic section, Phyllite and carbonaceous slate, is situated on the northern side, while the third lithologic section, Phyllite and marble, is on the southern side. The contact zone between Phyllite and marble on the northern side is where the No. 1 ore belt is located. The second ore zone is situated in the southeastern corner of the study area, at the transition between the second lithologic section of the chimney and the third lithologic section of dacite interbedded with the chimney. The fractures developed in the study area include the near-south-south oriented Huaheitan-Shuangfengshan Fracture (F
3) (
Figure 1d), which is also the main fracture under investigation in this paper. In this fracture, fault breccias and mylonite are filled. The section is relatively straight, but the strike of some segments varies significantly. Some sections of the fracture are filled with intrusive veins and branches, which control the spatial distribution of the ore body. The magmatic activities in the mine field are intense and frequent, with a substantial number of early and middle Variscan and Indosinian period intrusions into the area. However, the Indosinian period granite is regarded as the main research focus as it has the closest association with the mineralization.
2.2. Geophysical Characteristics
In the Huaniushan lead-zinc-silver polymetallic mine area, the physical statistics are grounded on the principle of primarily collecting physical specimens from drill cores and mine specimens, with surface specimens as a supplement. The availability of core in the mine area was verified according to the distribution of drill holes. Eventually, the core specimens from 18 drill holes in the work area were identified and collected. The principle of core physical property collection is based on the collected drill hole histograms. One rock and ore physical property specimen is taken for every 5 - 10 metres of the layer, and the mineral-bearing sections are collected in an encrypted manner. Generally, 5-cm-long core columns are collected and processed into standard physical property samples. The statistical analysis of the average value of each physical property parameter is presented in
Table 1. There are significant differences in density, magnetisation, resistivity and polarisation between strata and rocks.
3. Characterization of Gravity Magnetic Anomalies
3.1. Residual Bouguer Gravity Anomaly
To visually present the point arrangement of the gravity and magnetic exploration method on the geological map, the points are integrated with the geological map. In the exploration area of the study region, the gravity and magnetic points overlap. The designed gravity and magnetic survey covers an area of 10 km
2, with 54 survey lines. The direction of the survey lines is 16° northeast, the line spacing is 100 meters, the point spacing is 50 meters, and the number of gravity and magnetic measurement points is 1,403, totaling 2,806 gravity and magnetic points. The serial number of survey lines increases from west to east, and the serial number of measurement points increases from south to north. The layout area of the measurement points is shown in
Figure 1(d).
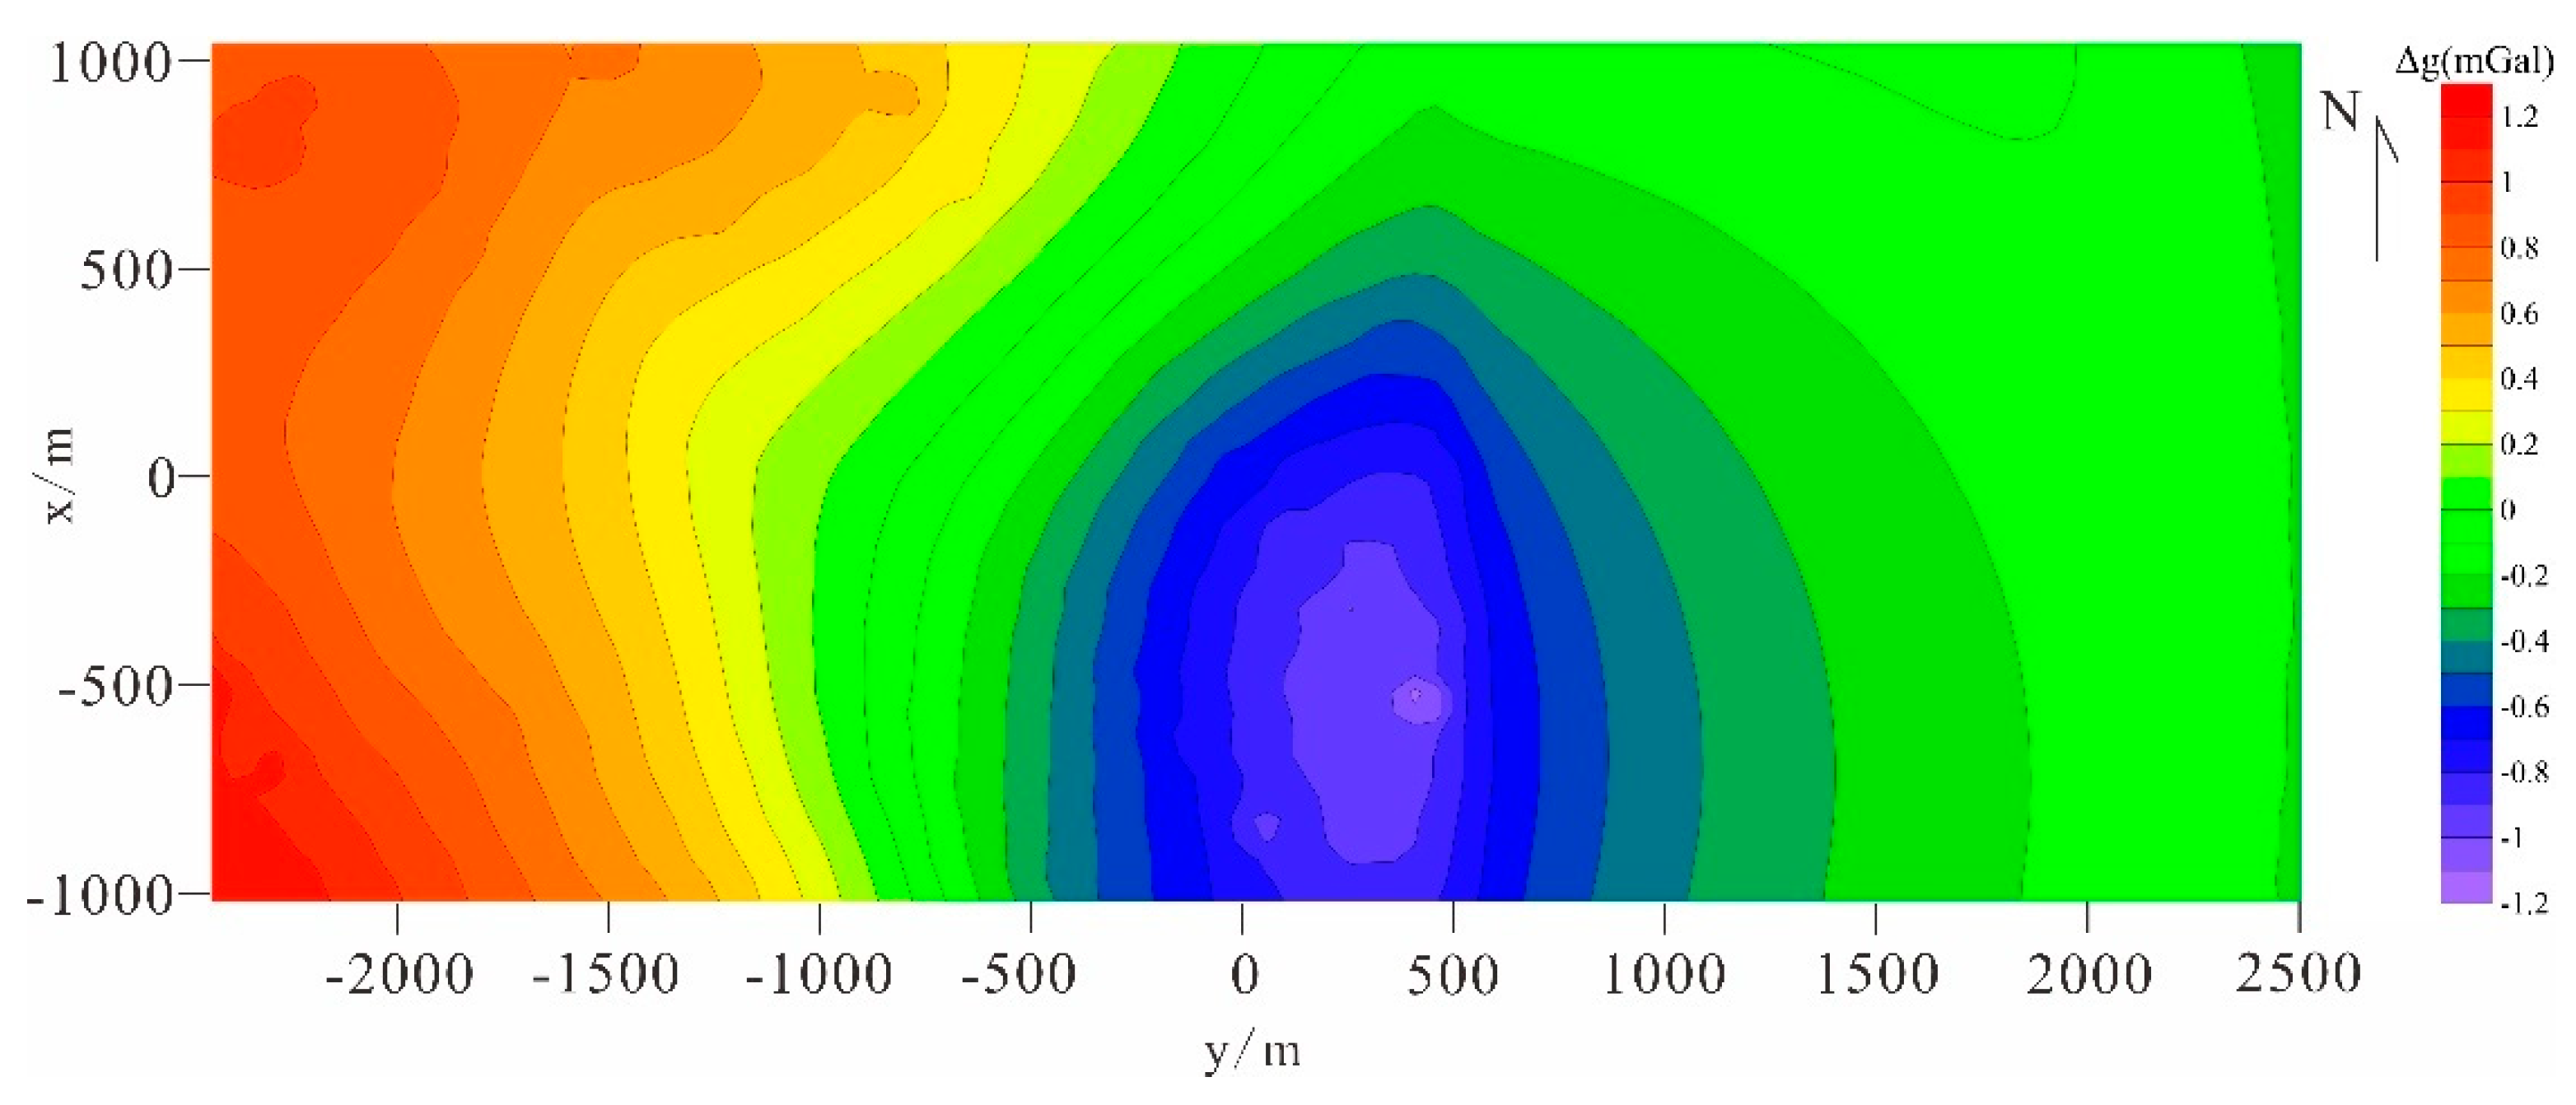
Based on the residual Bouguer anomaly of gravity in the Huaniushan lead-zinc-silver polymetallic deposit (
Figure 2), there are high gravity anomalies in the western part of the area, low gravity anomalies in the central part, and medium-low gravity anomalies in the eastern part. Combined with the geological characteristics of the study area and the actual field conditions, the weathering of granite has led to low values of the Bouguer gravity anomaly in the central portion of the study area.
3.2. Magnetic Anomaly
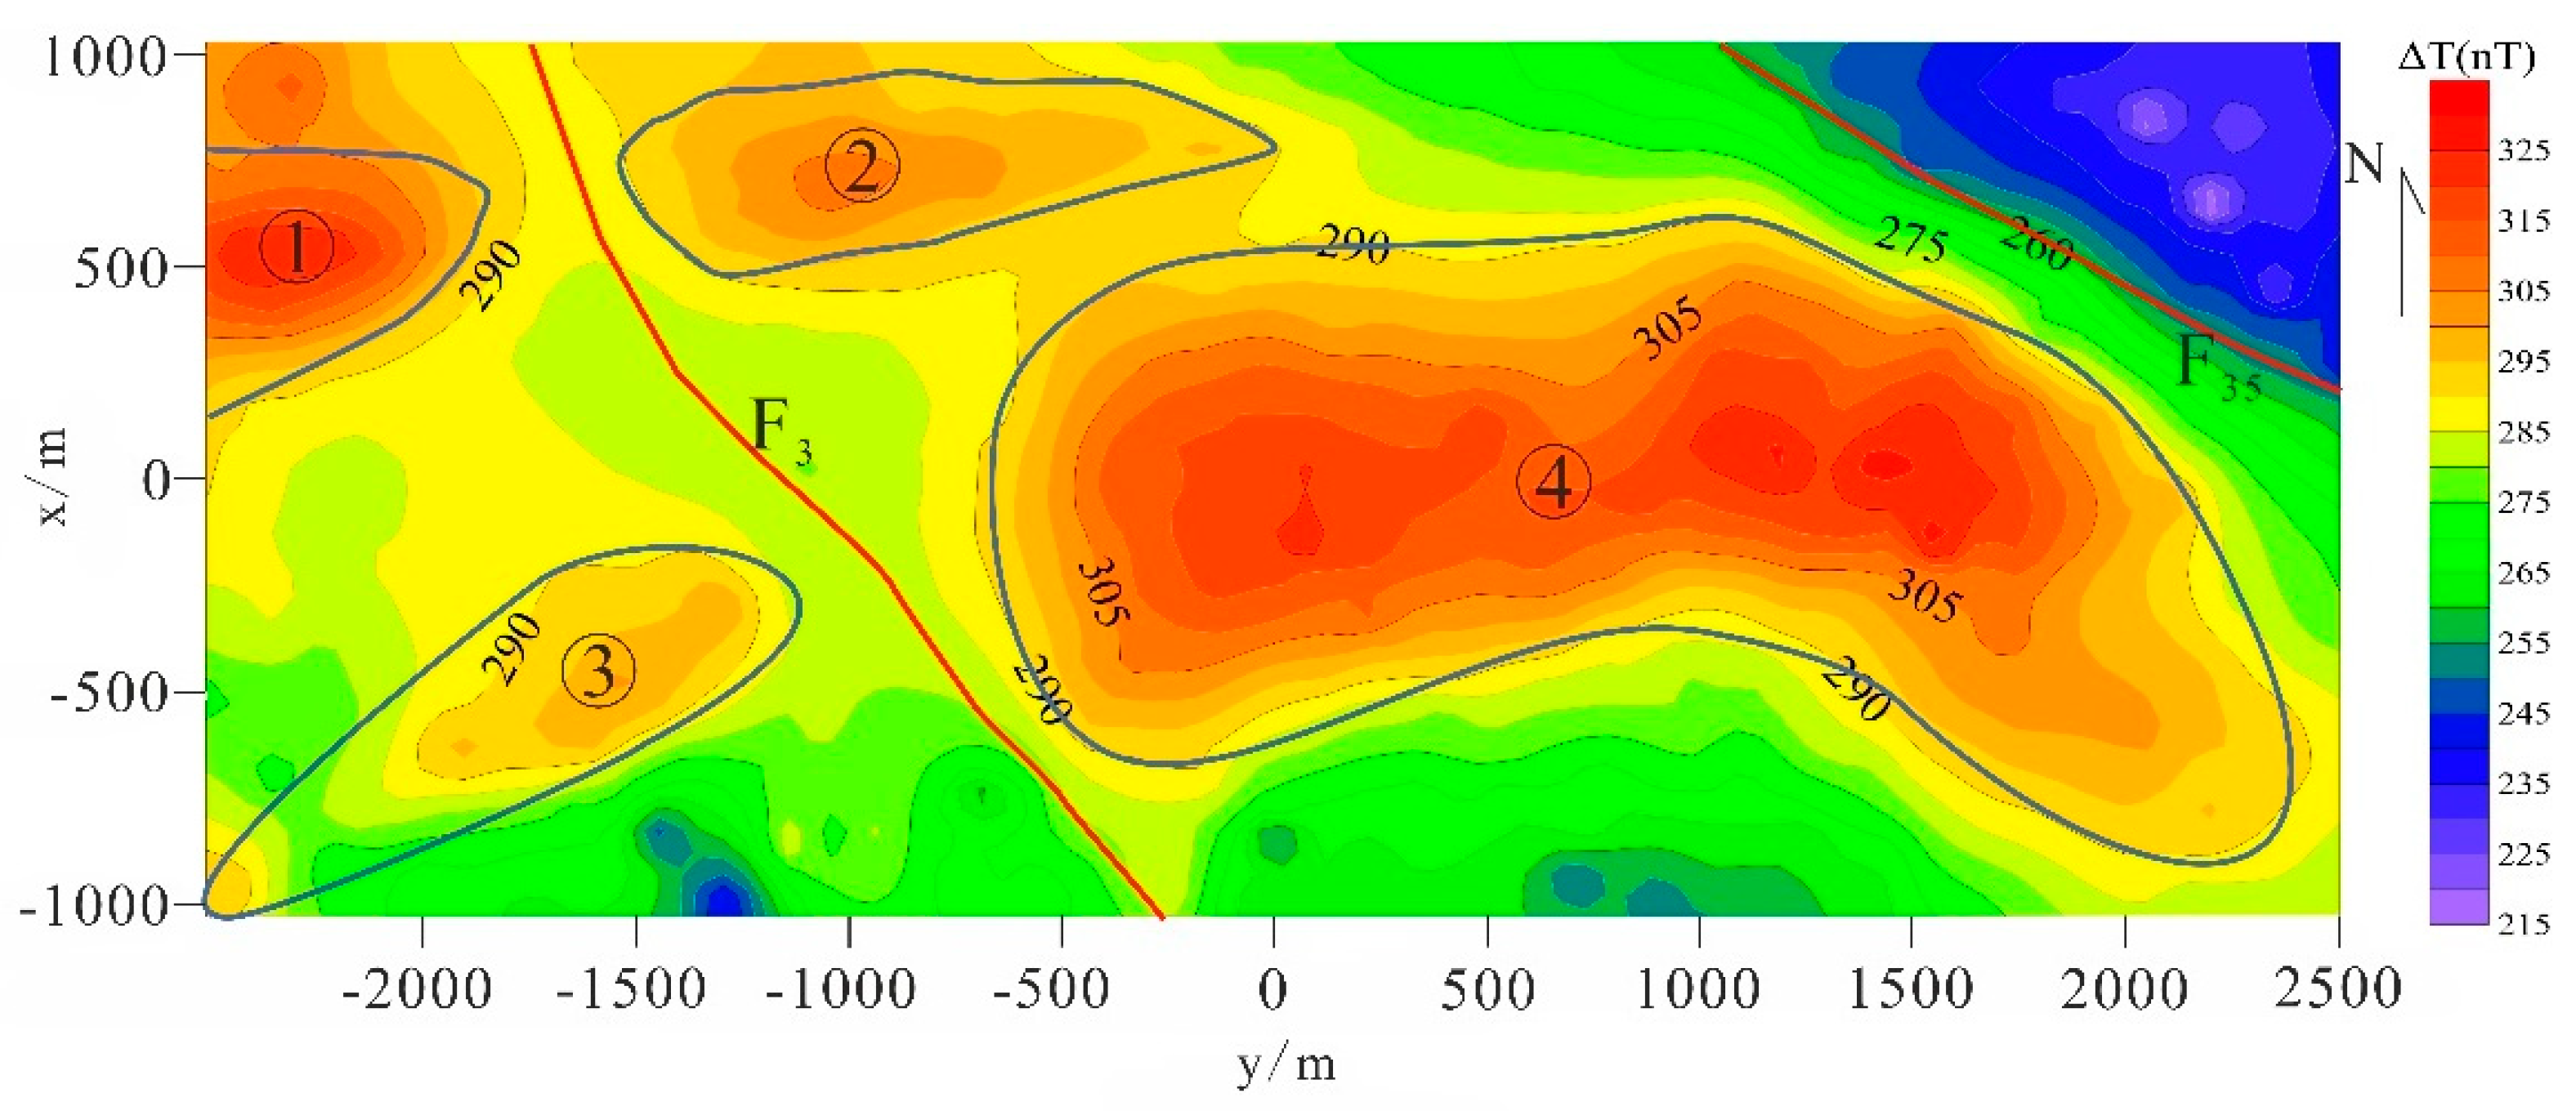
Based on the contour map of magnetic anomaly (
Figure 3) and in combination with the geological data of the study area, the magnetic anomalies in the study area can be divided into four high magnetic anomaly areas (numbered ①, ②, ③, and ④). There is a transition zone of magnetic anomalies between areas ①, ③ and ②, ④.The anomalous transition zone between them is speculated to be the location of the fault F
3. In the northeastern of the study area, there is a distinct high-low magnetic transition zone. It is presumed that this zone is the location of the fracture F
35.
4. Characterization of TDIP Data
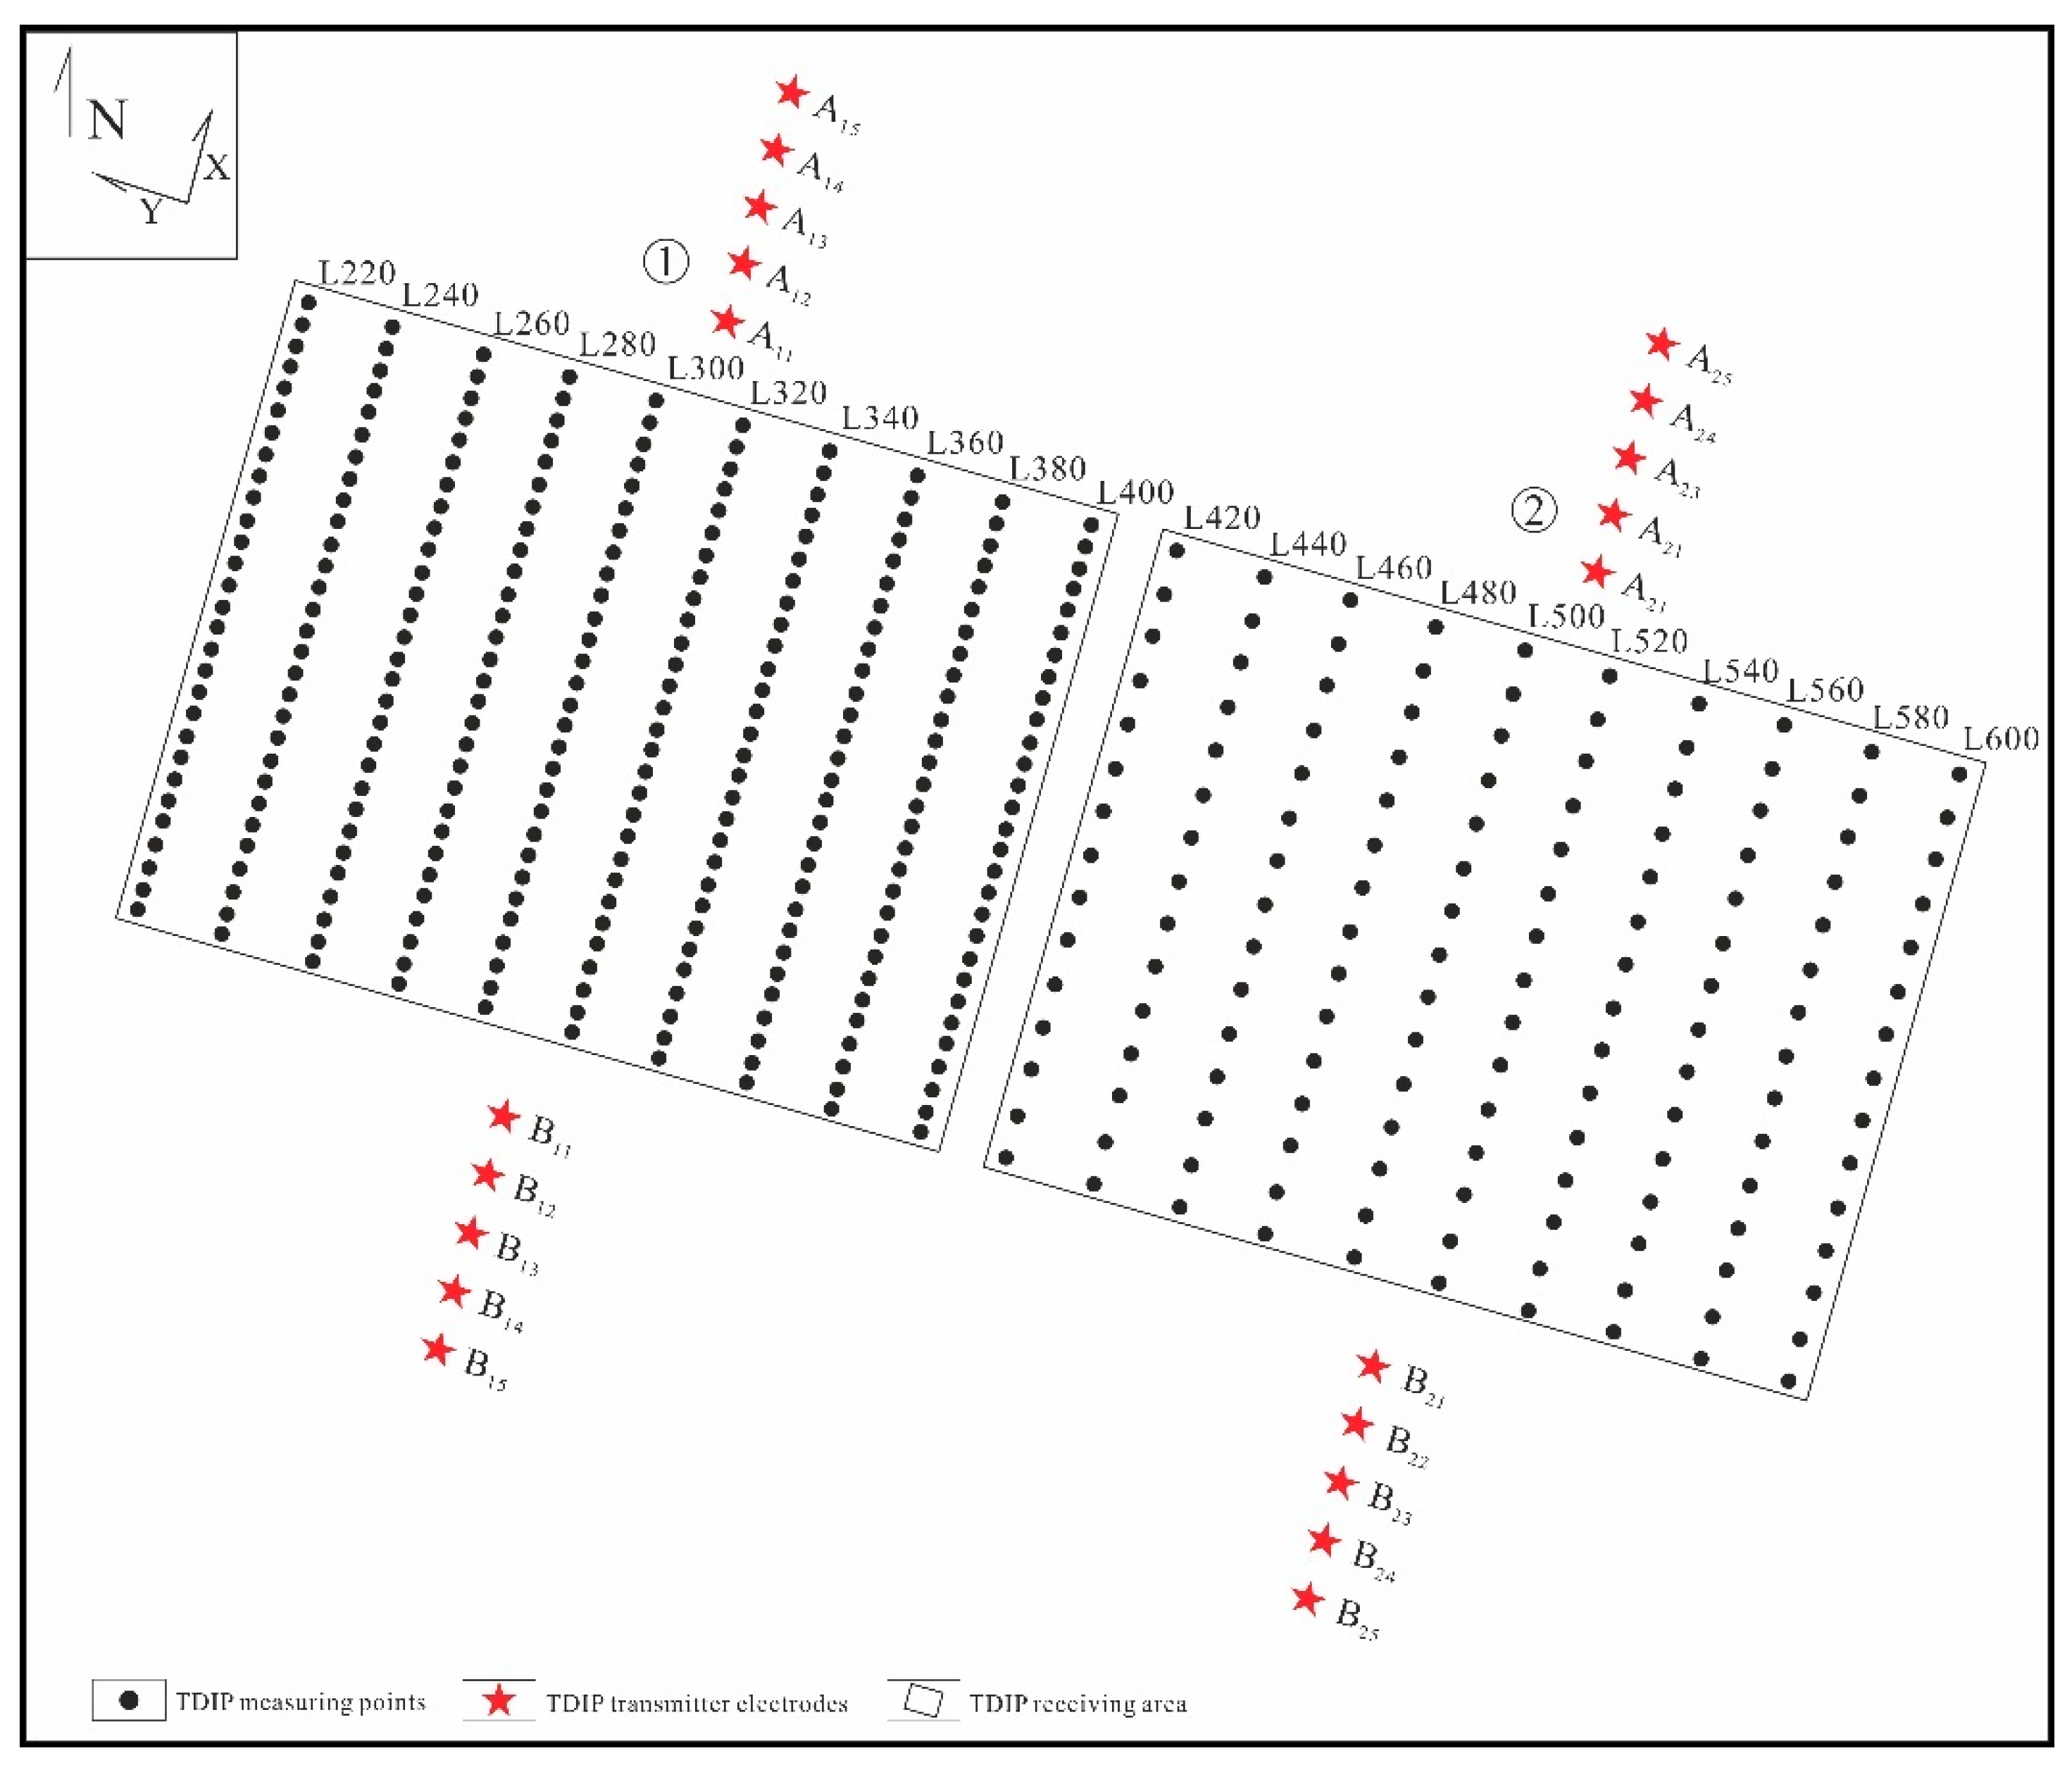
In the field, the excitation data were collected using a multi-group electrode spacing middle ladder device. In the schematic diagram of the device (
Figure 4), there are five groups of supply electrode spacings. Specifically, A
11B
11 = A
21B
21 = 2000 m, A
12B
12 = A
22B
22 = 2500 m, A
13B
13 = A
23B
23 = 3000 m, A
14B
14 = A
24B
24 = 3500 m, and A
15B
15 = A
25B
25 = 4000 m. A total of 20 survey lines are arranged in the study area with a line spacing of 200 m. Among them, the first 10 survey lines (L220 - L400) have a point spacing of 50 m, while the last 10 survey lines (L420 - L600) have a point spacing of 100 m. The total number of survey points with 5 groups of different power supply pole spacings is 1700.
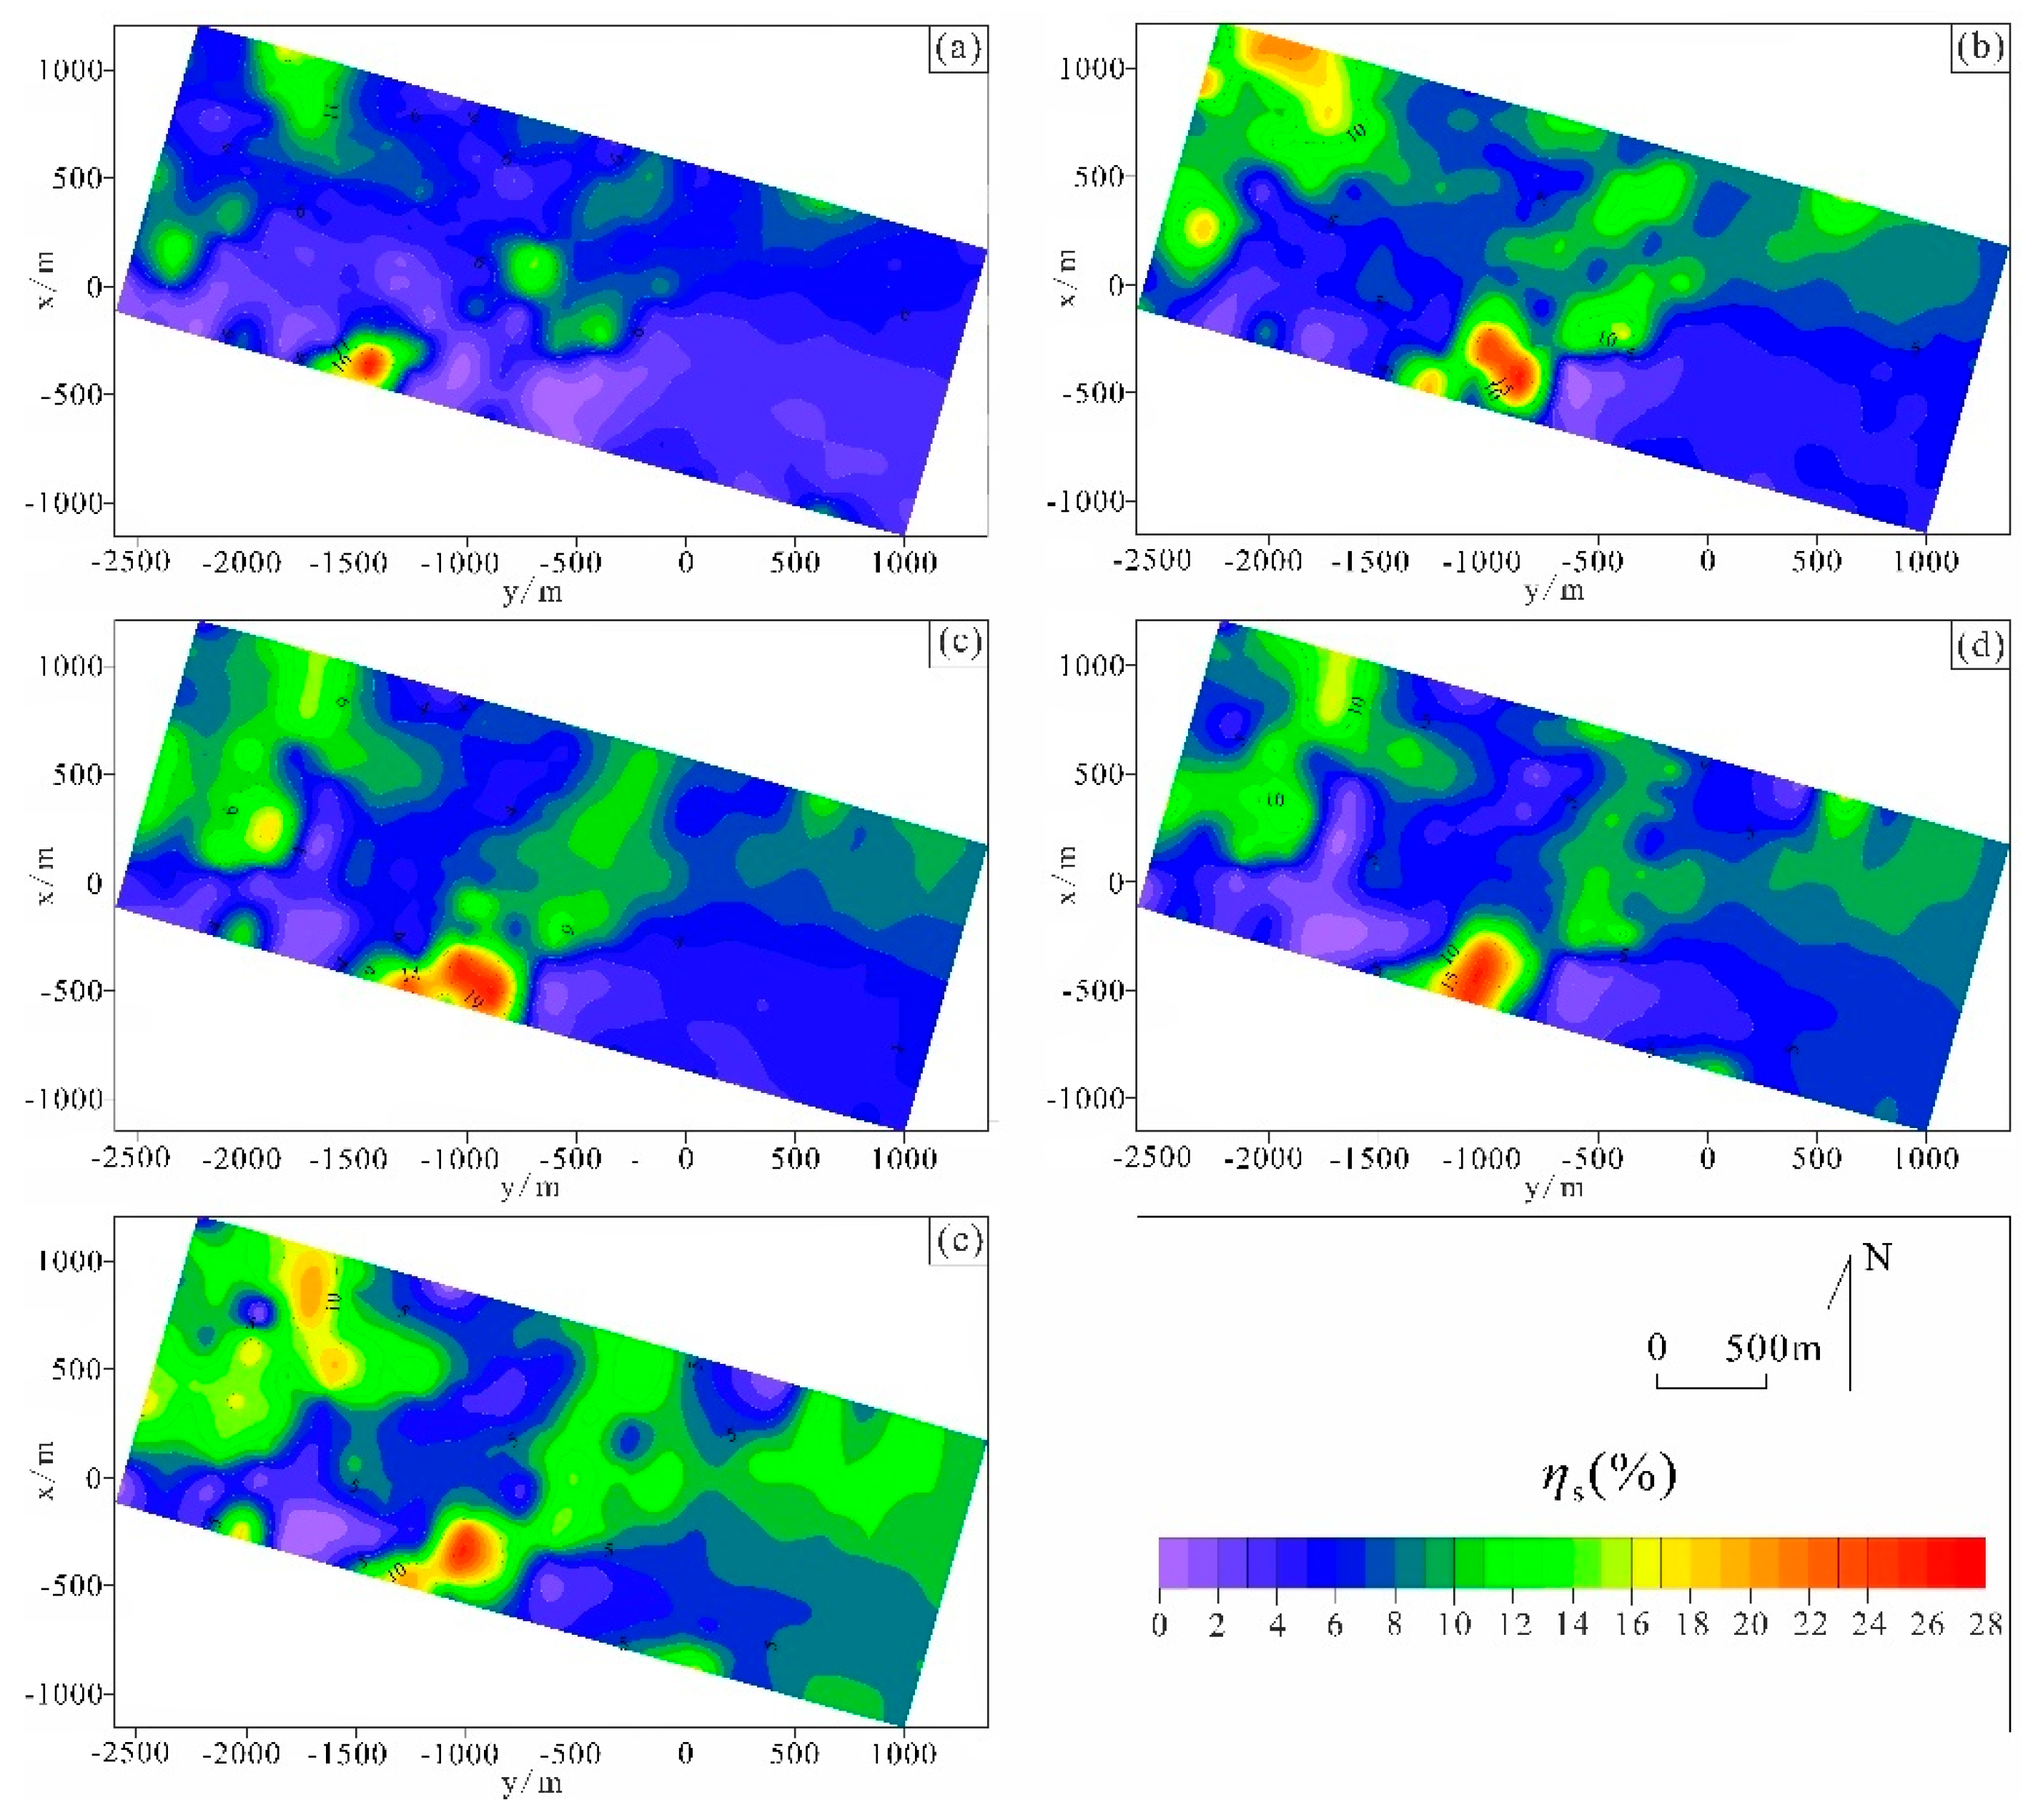
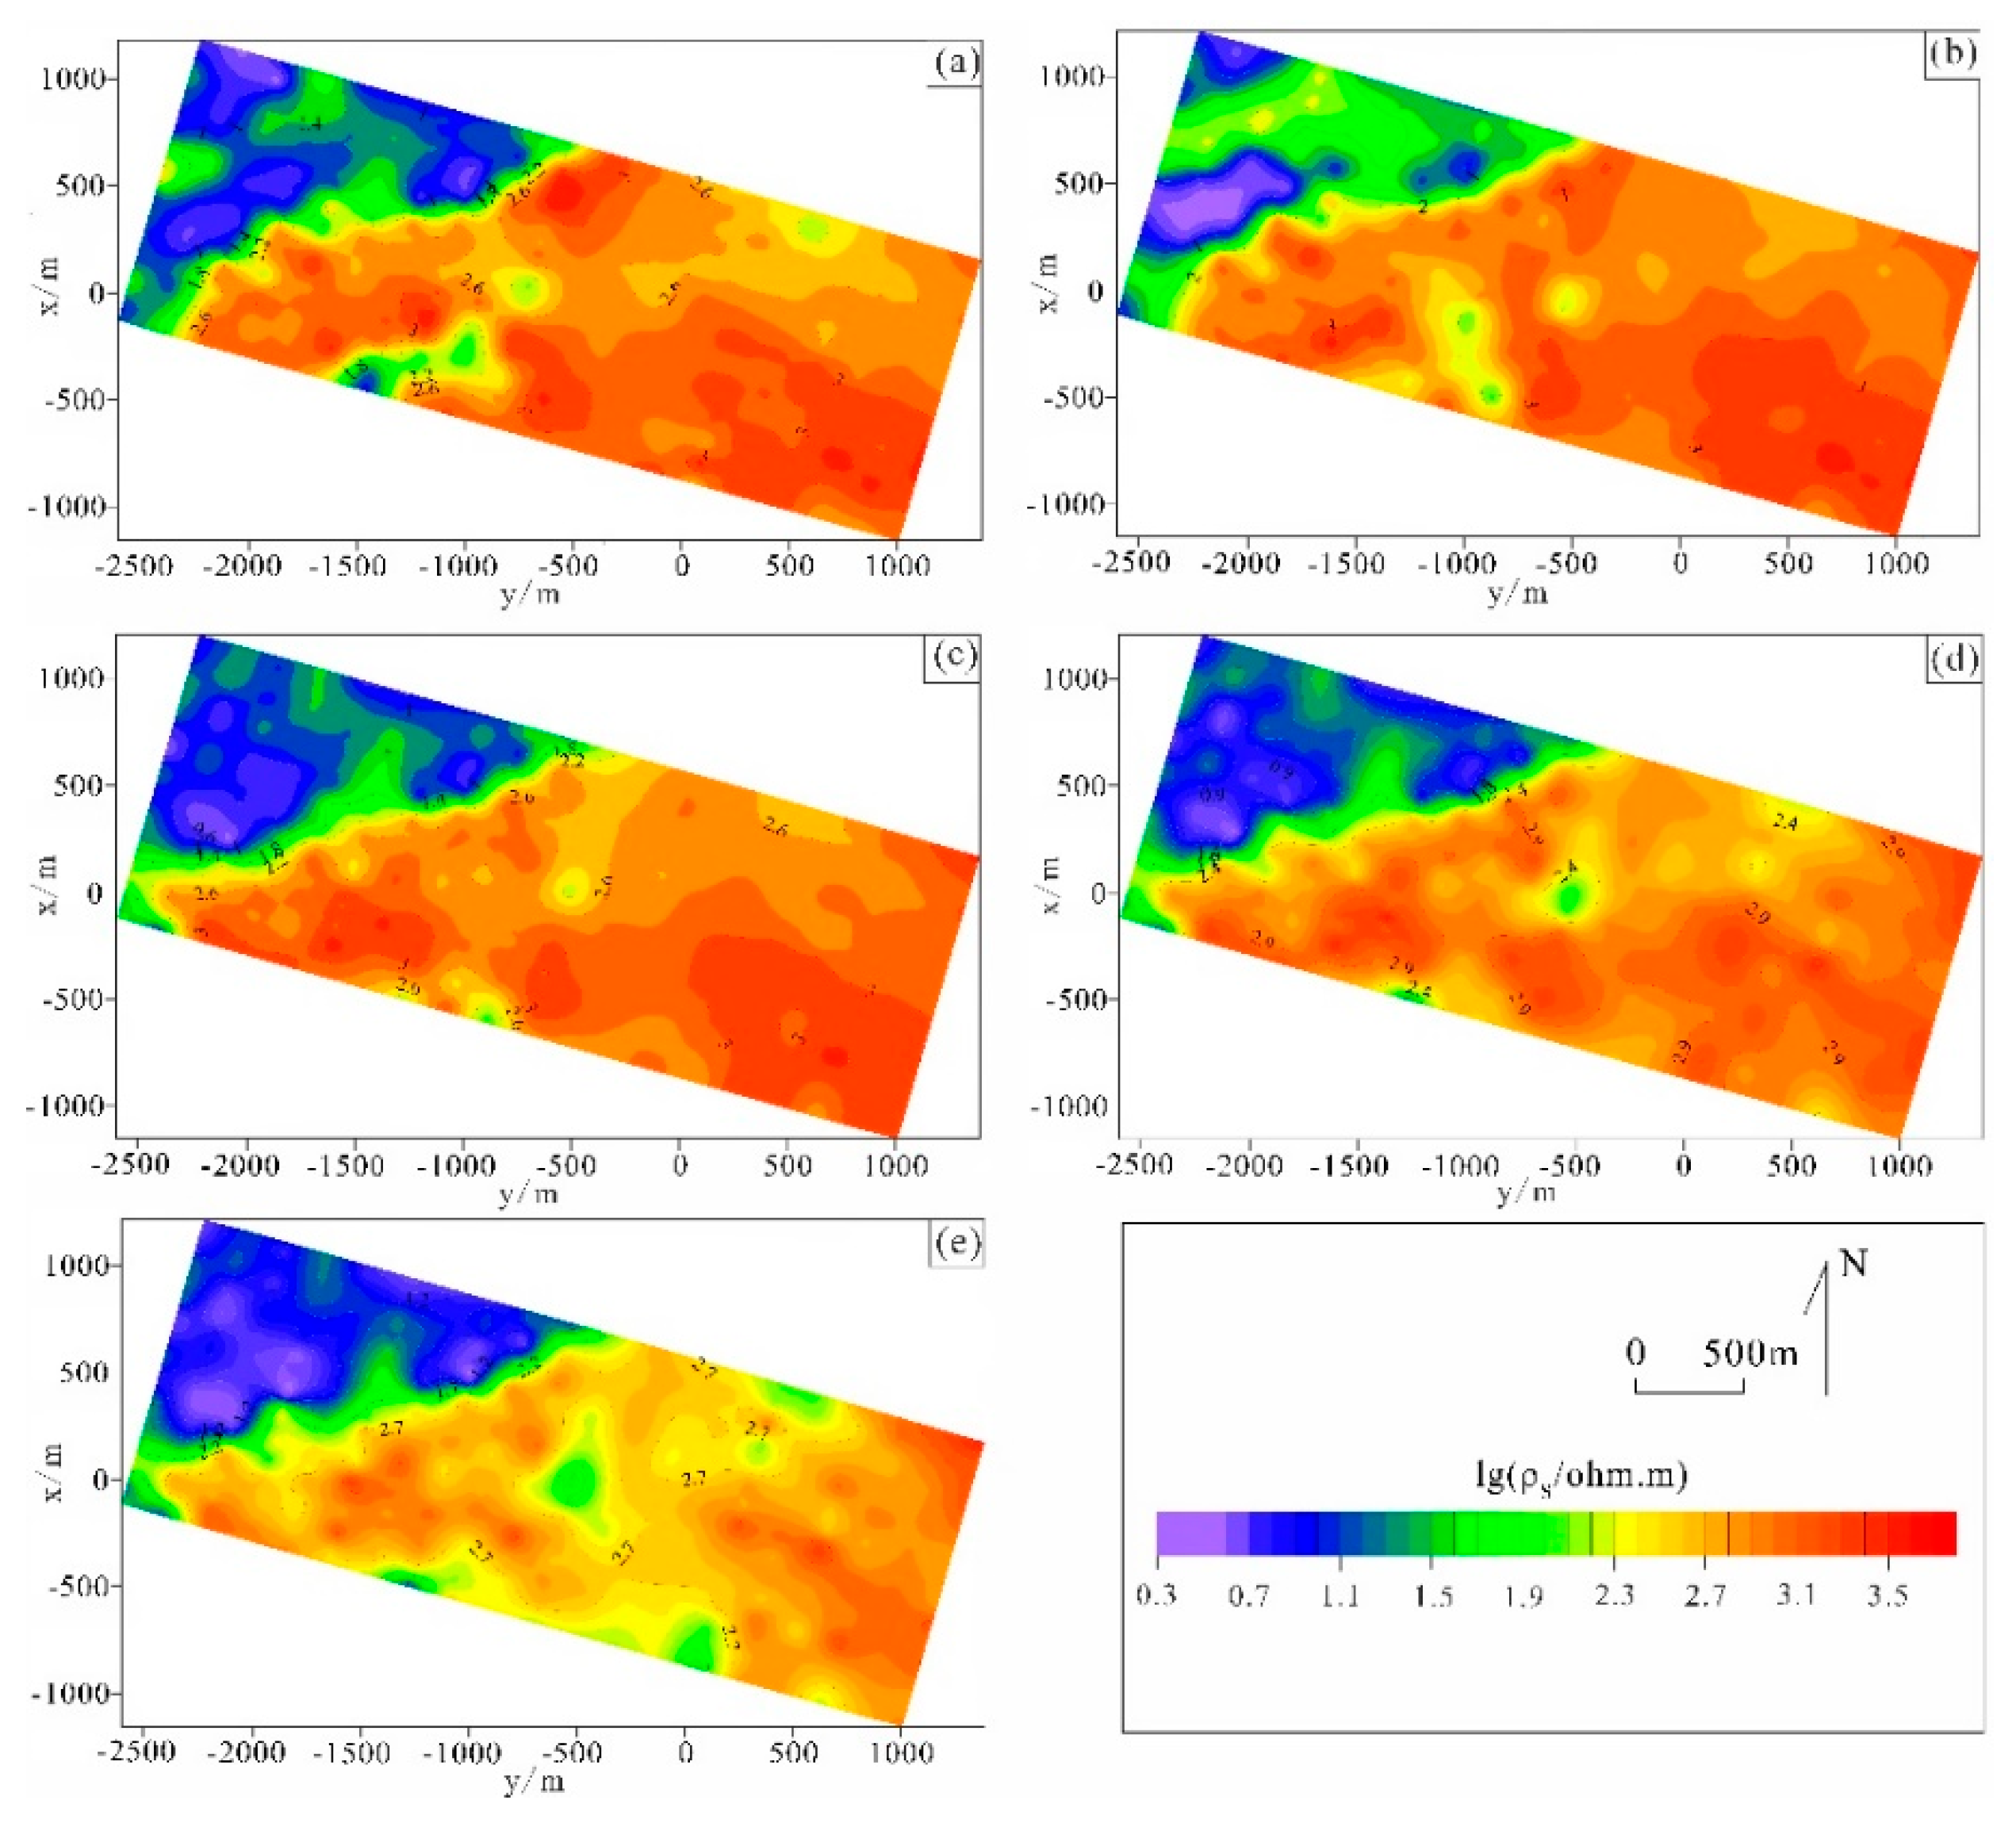
The distribution characteristics of the apparent polarisation rate under multiple polar distances (
Figure 5) indicate that the background field values of the apparent polarisation rate in the survey area are generally low (< 6%) and stable. Additionally, the apparent polarisation rate values in the western part of the survey area are higher than those in the eastern part. The morphology of the anomalous areas in the survey area with different polar distances is more or less the same. However, with the increase of polar distances, the detection depth increases, and the display of the high-appearance polarisation area becomes more evident. The distribution of the apparent resistivity at different polar distances (
Figure 6) reveals that the apparent resistivity in the western part of the area is lower than that in the eastern part, and the pattern of the apparent resistivity at different polar distances in the survey area varies significantly.
A comparison of
Figure 5 and
Figure 6 shows that the high apparent polarisation anomalies within the mine correspond to low and low-medium apparent resistivities, in combination with the relevant geological and physical data from the survey area. The analysis demonstrates that high-power TDIP can better reflect the electrical characteristics of lithology. In the northwest of the survey area (near the No. 1 ore belt), a large area of carbonaceous phyllite is distributed, and its position is basically consistent with the apparent resistance information. In the middle of the survey area (near the No. 2 ore belt), there is a high consistency in the position of the iron-manganese cap and the lead-zinc mineralization body. Simultaneously, according to the mineralization law of the survey area, it can be observed that the contact zone between the marble and phyllite is the main occurrence location of the ore body in the survey area. From the apparent resistance information, the positions of the intermediate and low resistance junctions displayed in the middle are also essentially consistent.
5. Three-Dimensional Inversion Interpretation of Gravity, Magnetic and TDIP Data
5.1. Three-Dimensional Inversion Methods
The objective function used for the 3D inversion in this paper is as follows:
In Equation (1), is the data item, is the model item and is the regularization factor.
In the three-dimensional geophysical inversions, typically, the number of observation data is smaller than that of model elements. To accelerate the three-dimensional inversion speed, the conjugate gradient method is employed in this paper to solve the objective function of the gravity and magnetic inversions, and the TDIP data is computed with the incomplete Gauss-Newton inversion [
18,
19,
20,
21,
22,
23,
24,
25,
26].
5.2. 3D Inversion of Gravity Data
In the three-dimensional inversion of physical properties of gravity data, perform 5 inversion iterations and regularization factor of 1.
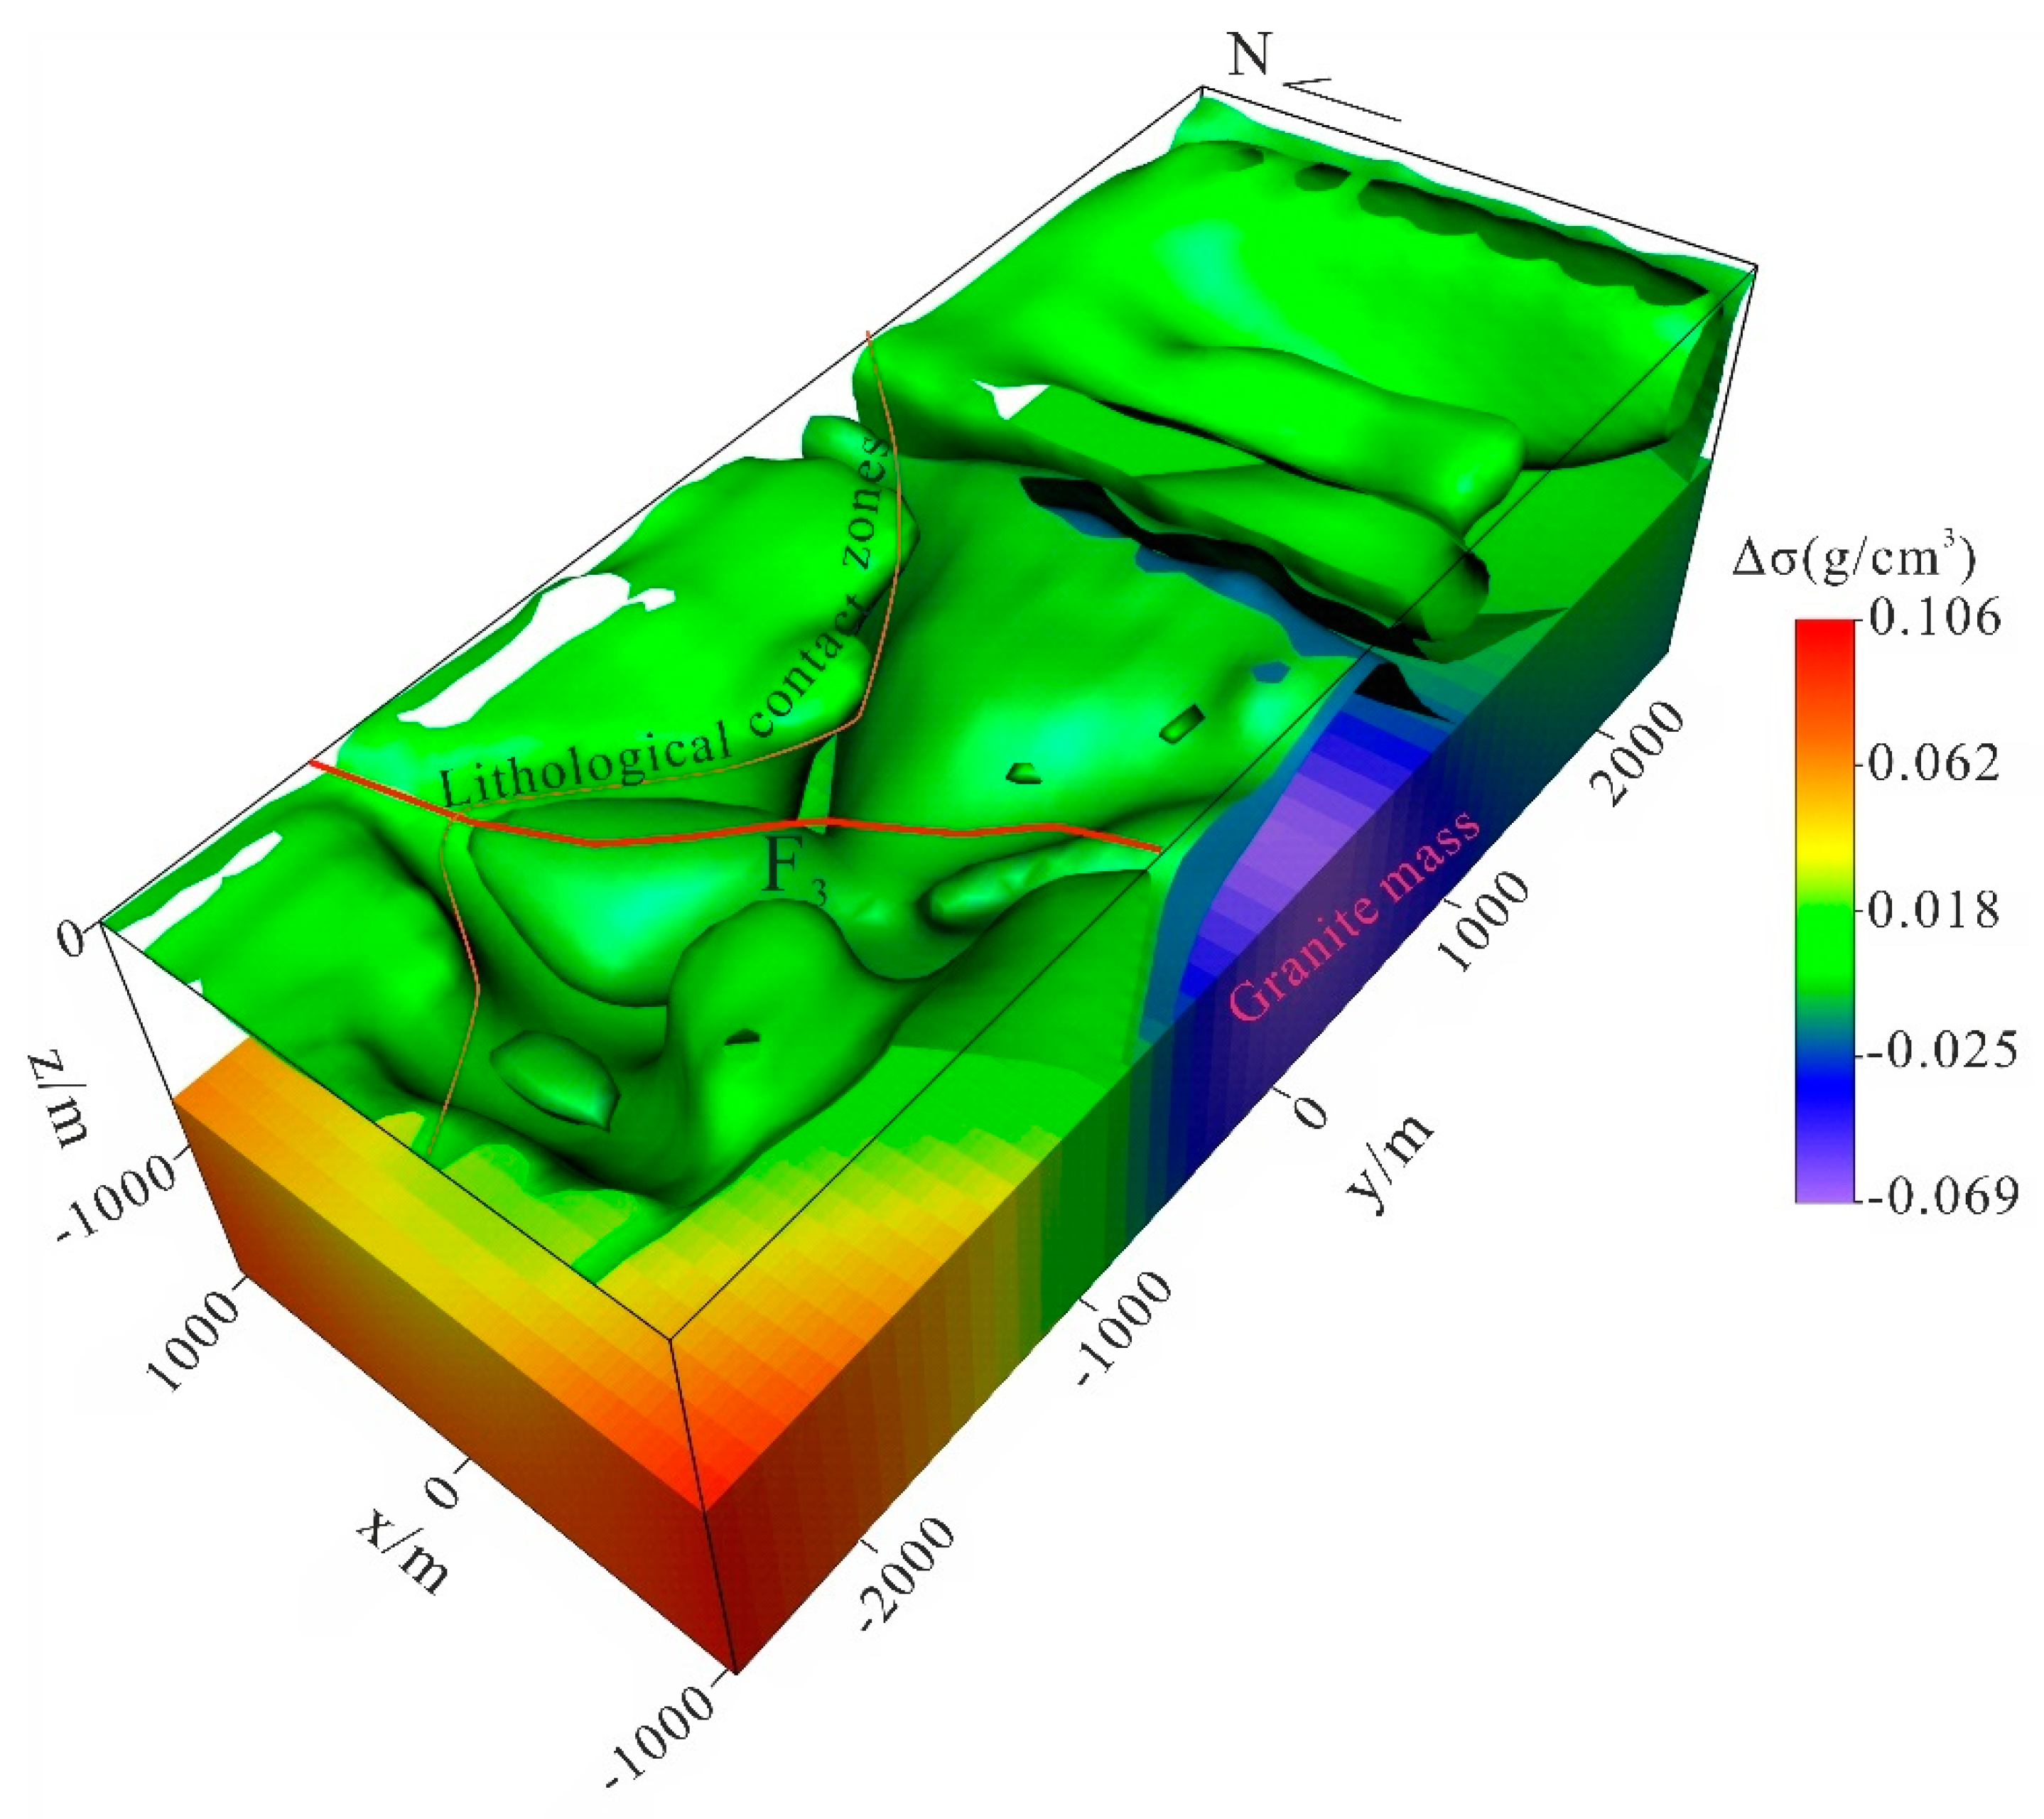
The three-dimensional inversion of the residual Bouguer anomaly of gravity in the study area is presented in
Figure 7. The distribution of the remaining density features is high in the west, low in the centre, and in between in the east, which is essentially consistent with the distribution of the residual Bouguer anomaly of gravity. The high values in the west are in the intersection zone between granite and marble, and it is inferred that the anomalies are caused by mineral-bearing rock masses. The gravity field of granite is the lowest in the study area, and the density of granite is lower than that of Phyllite and marble. This may be attributed to the weathering of granite bodies, resulting in a lower density. Thus, it is initially concluded that the low value of gravity in the central part of the survey area is caused by the weathering of Indosinian granite after its intrusion. In the northwestern part of the study area, the second lithological section of the Jixian Pingtoushan Formation Phyllite, the gravity 3D inversion is more effective in identifying the interface between Phyllite and marble, and it can basically show the known fracture F3 in the study area in the gravity 3D inversion. However, the ability to delineate the eastern flanks in the gravity 3D inversion maps is not satisfactory, which is likely due to the small density difference in the eastern flanks of the study area.
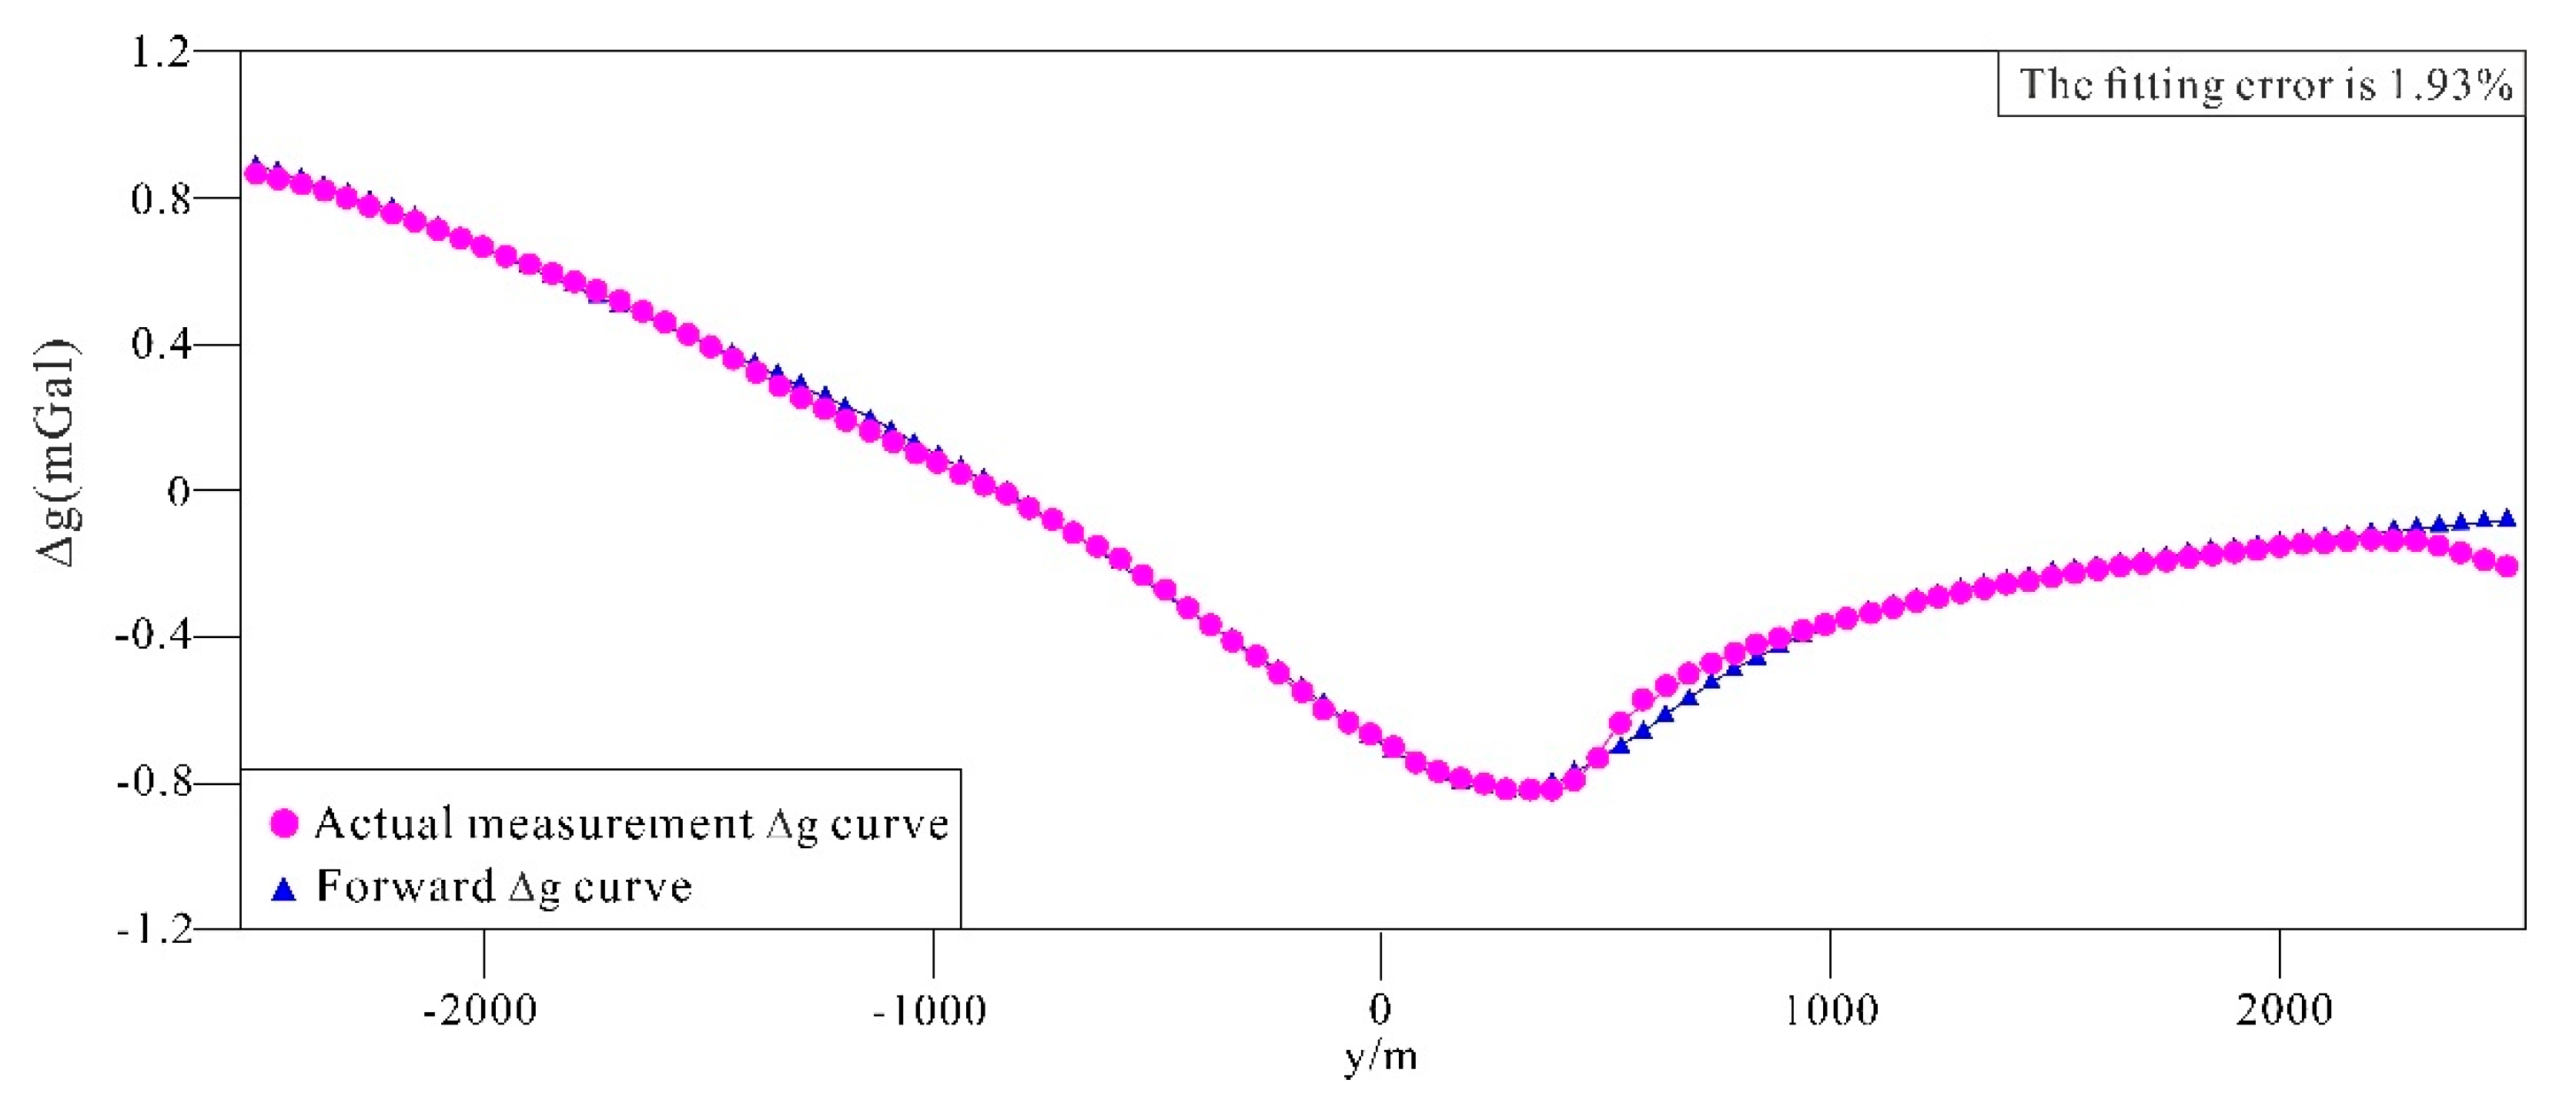
Figure 8 shows the measured and forward ∆g fitted profile curves at x = 0 m for the gravity 3D inversion, and the difference between the two fits is 1.93%, indicating a good match.
5.3. 3D Inversion of Magnetic Data
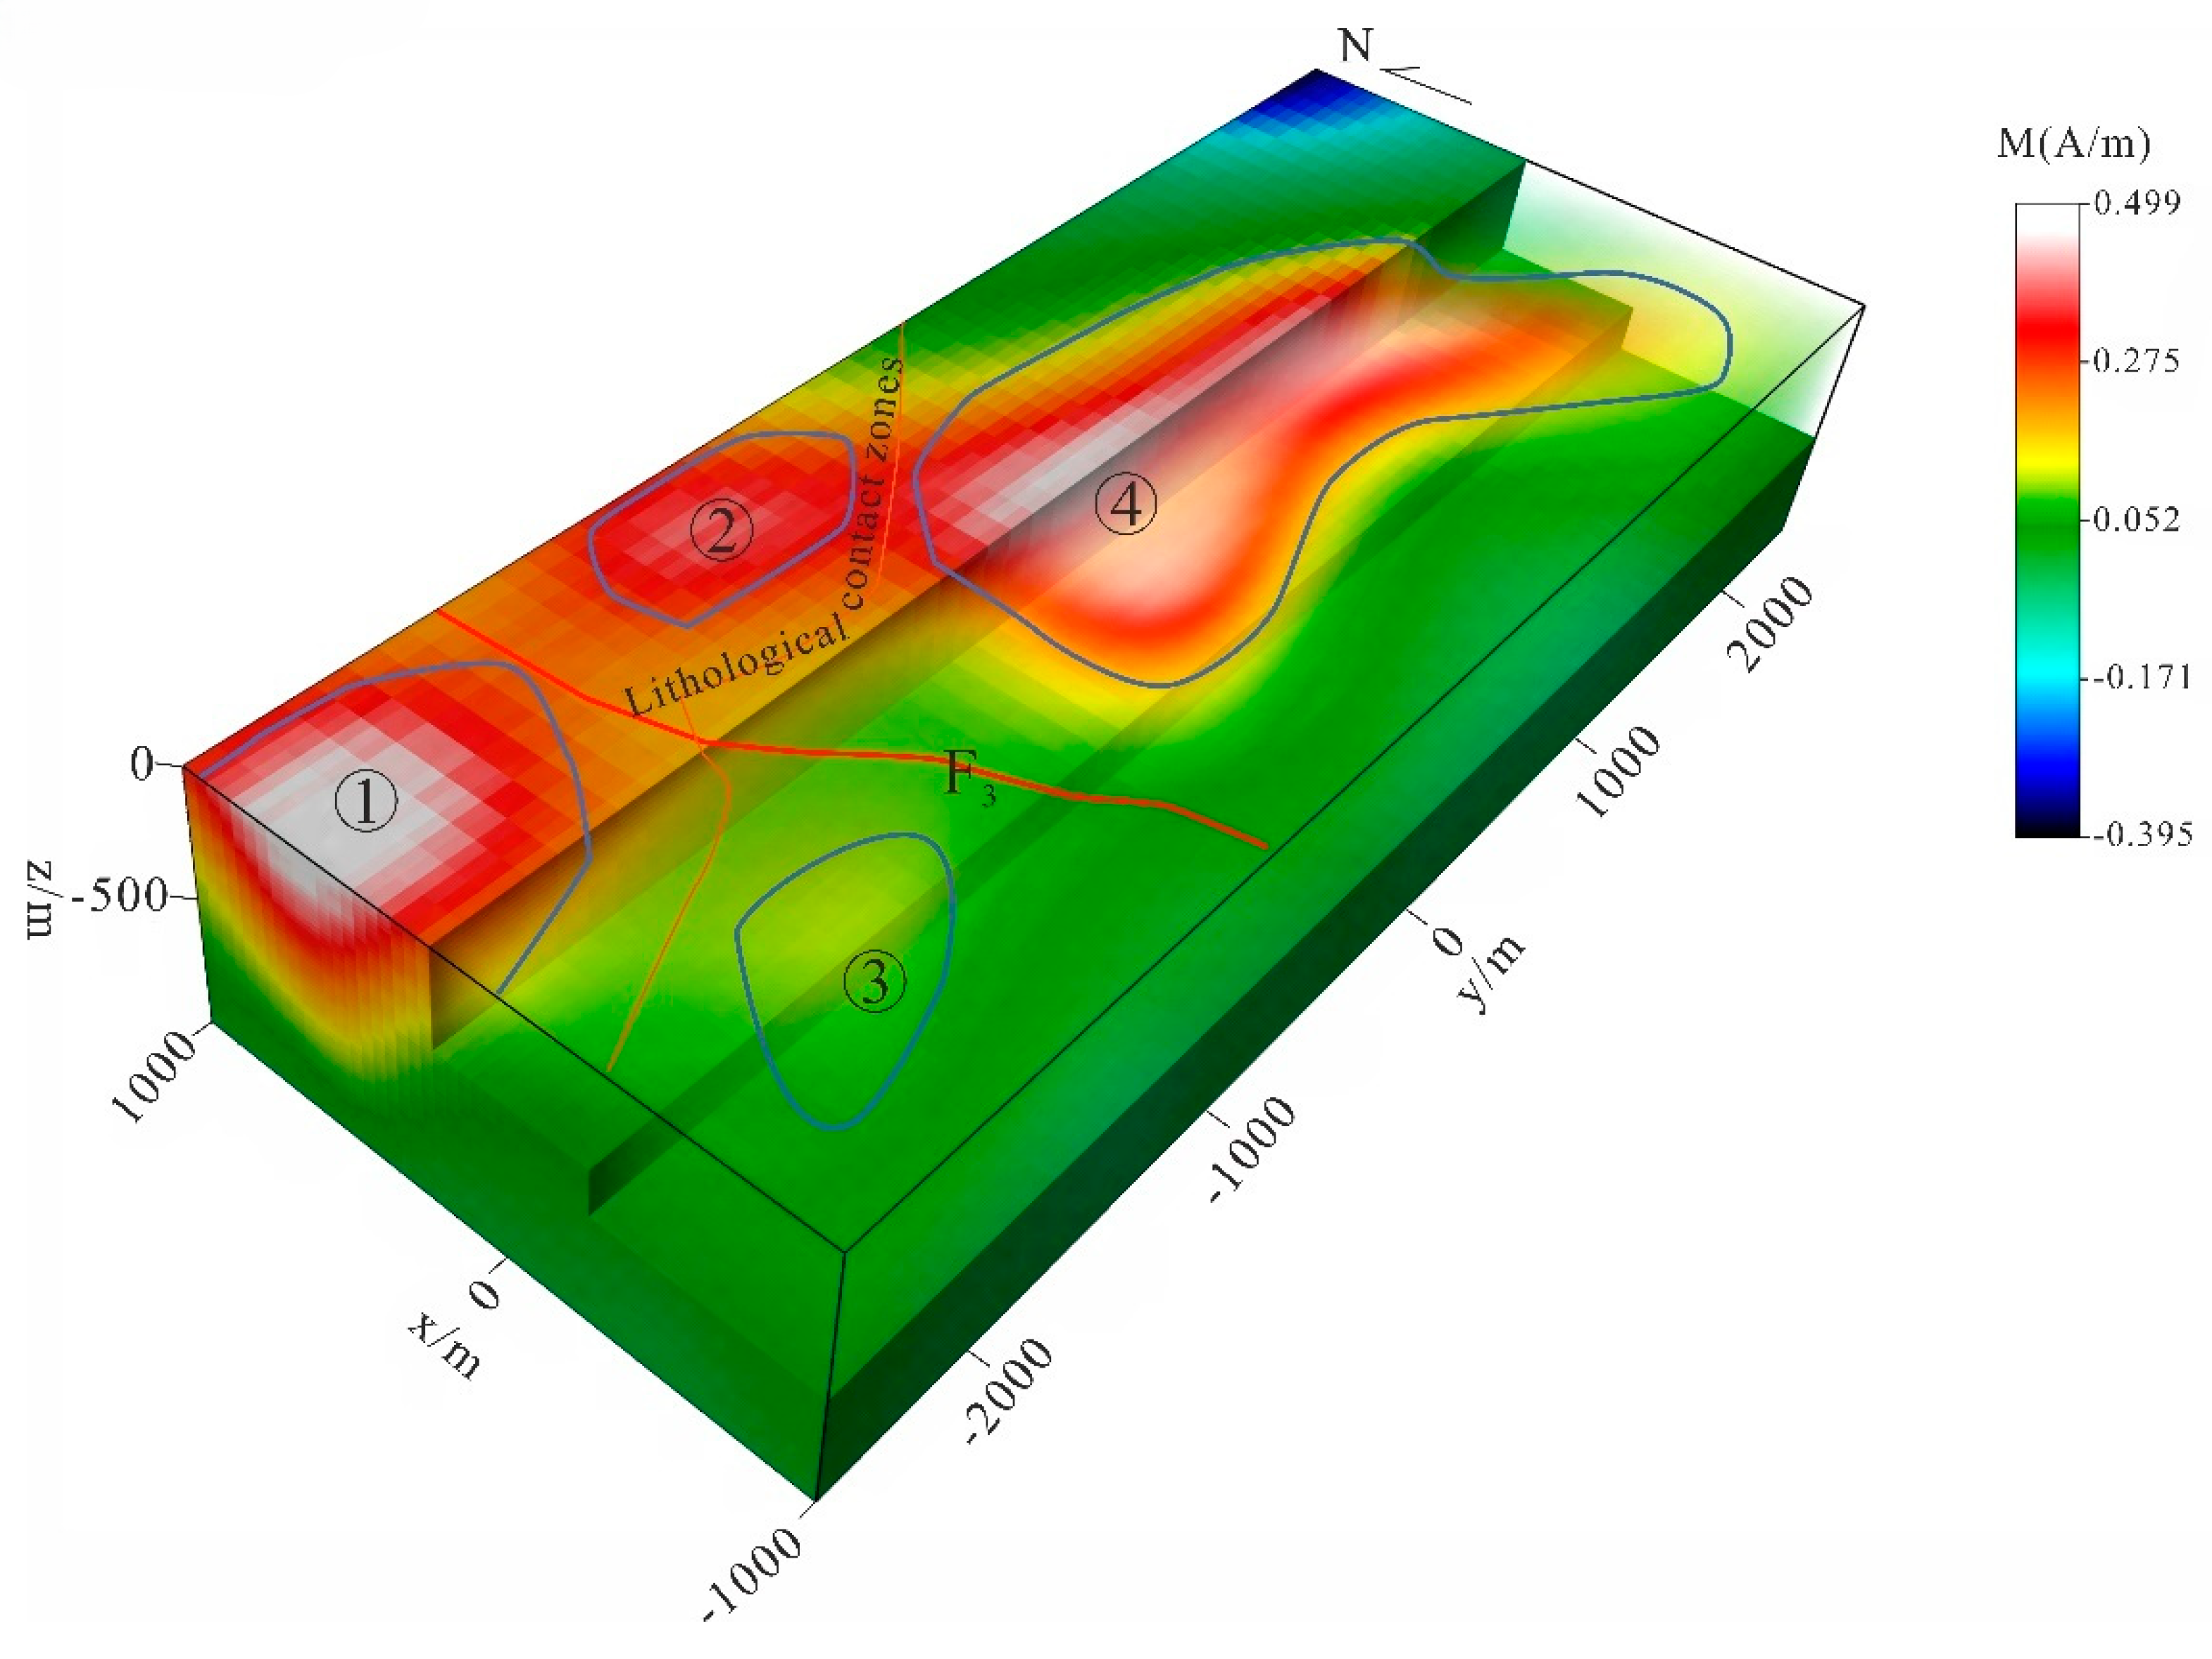
In the three-dimensional inversion of physical properties of magnetic data, we perform 5 inversion iterations and regularization factor of 1. According to the 3D inversion magnetization intensity model of the study area (
Figure 9), four anomalous zones with high value anomalies are delineated, and all these four anomalous zones have a magnetization intensity higher than 0.052 A/m. The anomaly area of No. ① is not closed, presumably caused by the granite body on the south side of the F
3 fault. No. ② is in the shape of a flat circle, with an east-west length of approximately 1,500 m and a north-south width of about 200 m. It is located in the veins of dacite and granite porphyry on the east side of the F
3 fault. No. ③ is in the shape of a strip, extending northeastward, with a length of about 1,300 m and a width of approximately 200 m. It is presumed to be caused by a granite body and is on the south side of the F3 fault. No. ④ has a near east-westward extension, with an east-west length of about 1,500 m and a north-south width of about 800 m. The anomaly No. ④ extends in the east-west direction, with a length of approximately 2,500 m and a width of about 800 m from north to south. It is presumed to be caused by the Indosinian granite.
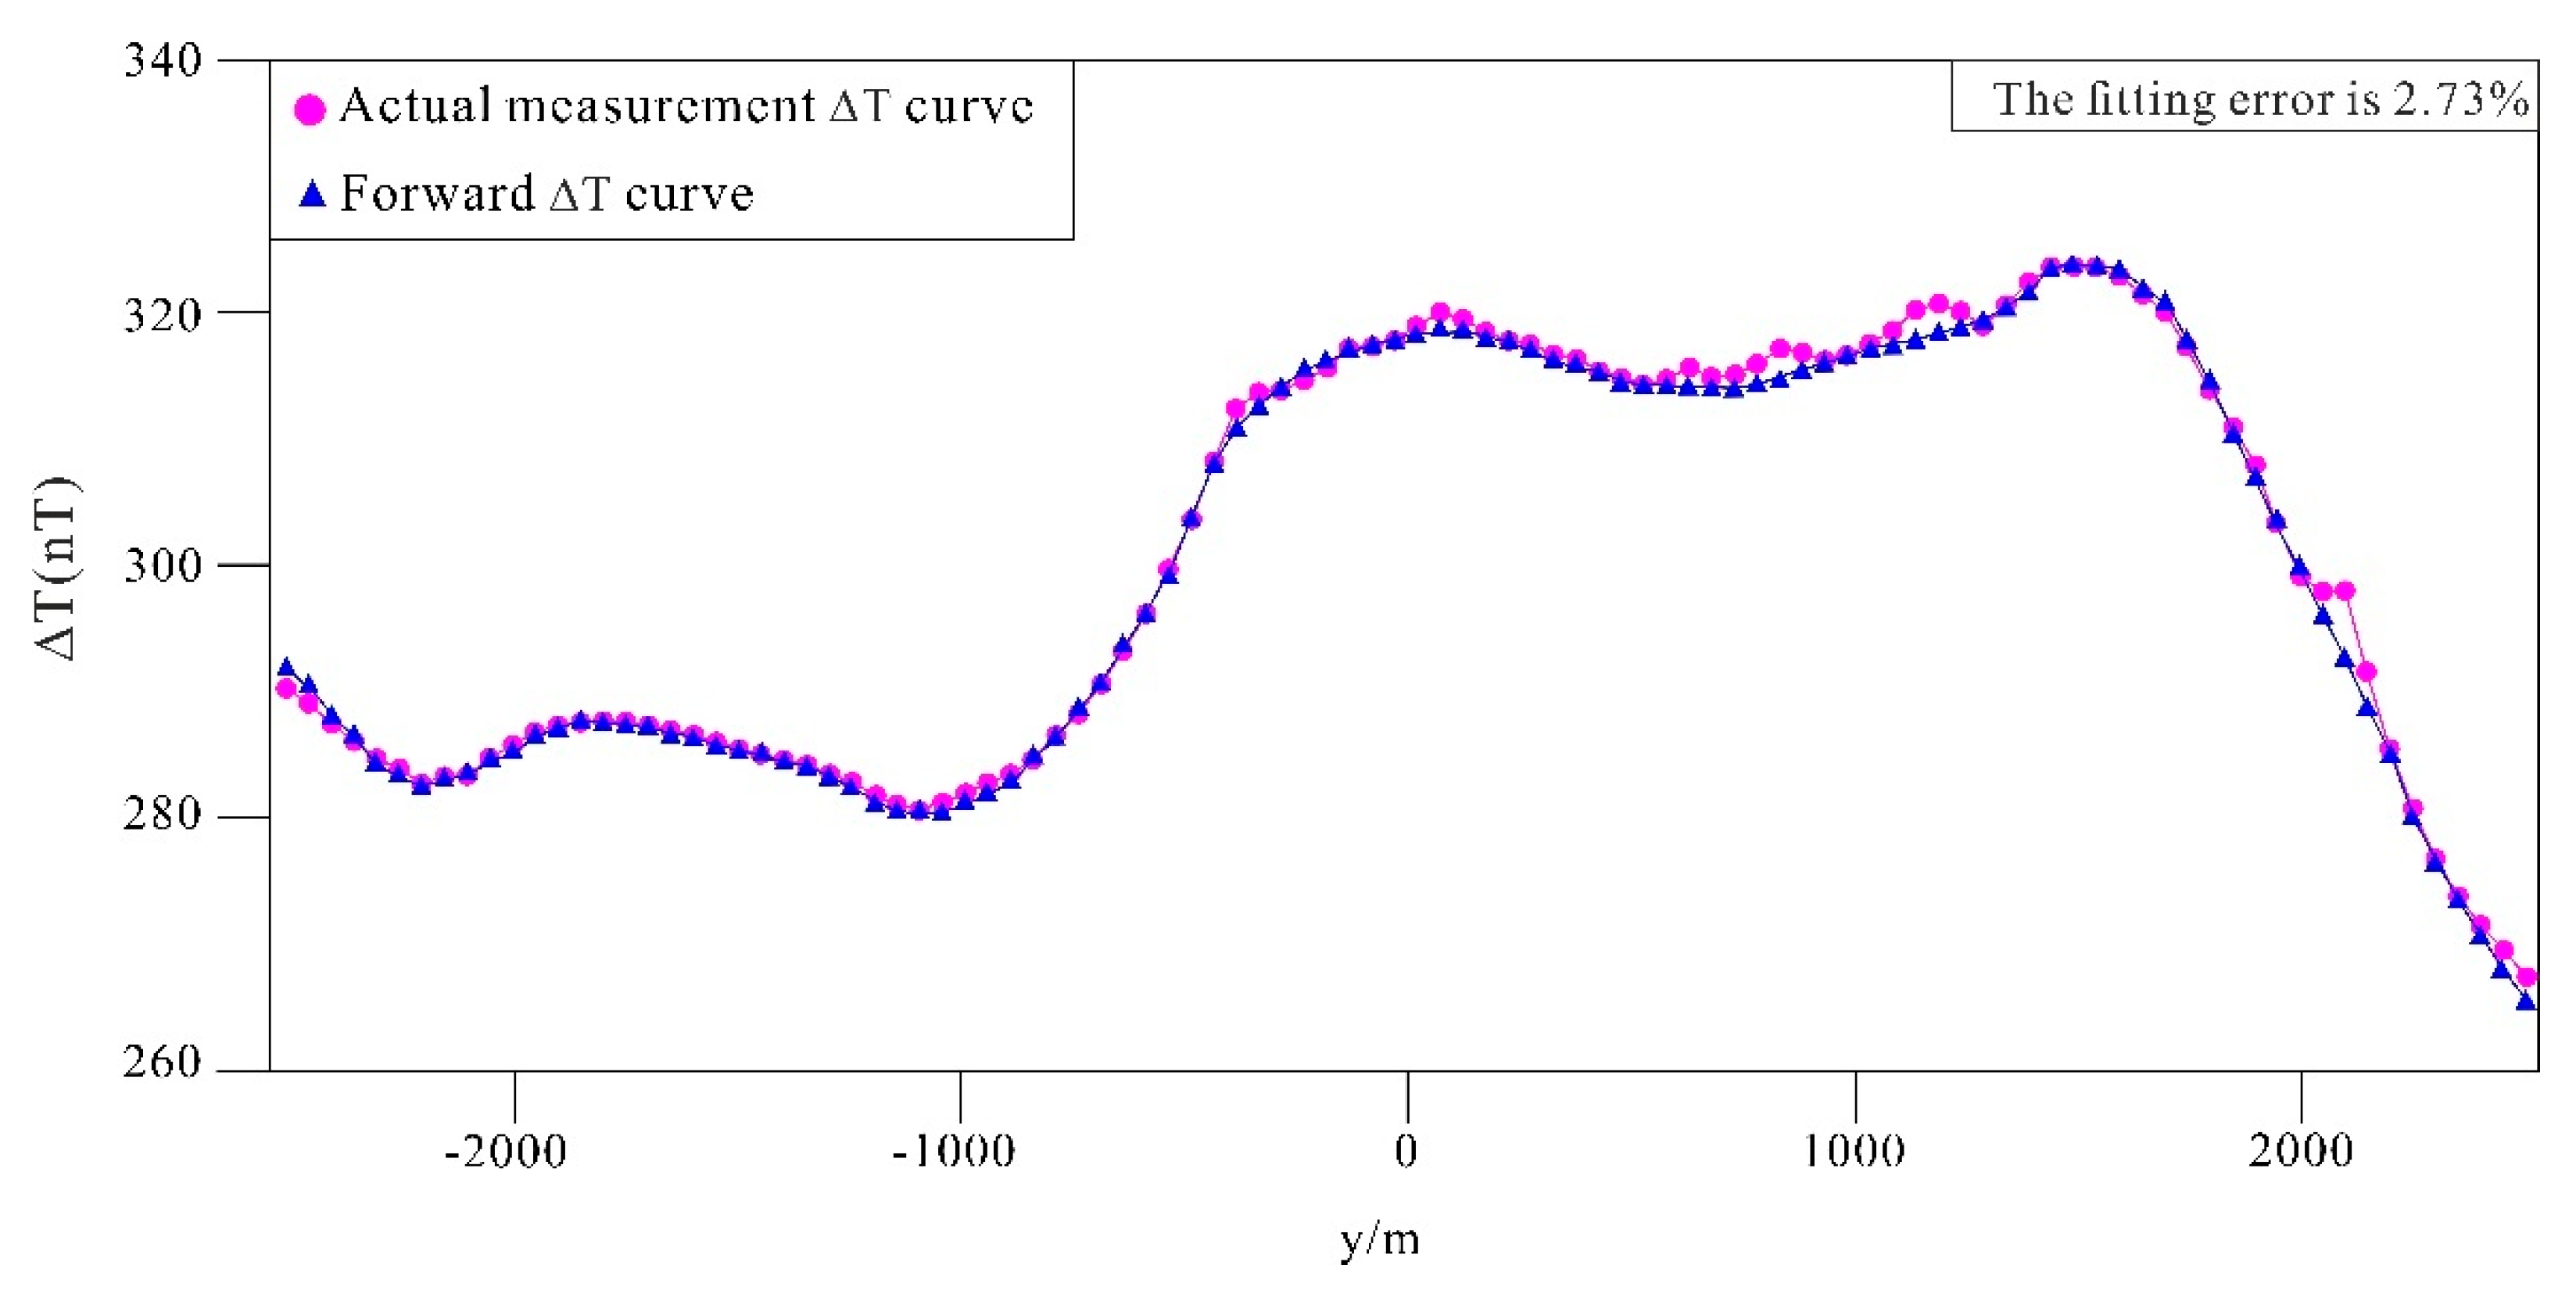
Figure 10 shows the actual measurement and forward ∆T fitted profile curves at x = 0 m for the magnetic method 3D inversion, with a high fitting error of 2.73%.
5.4. 3D Inversion of TDIP Data
In the TDIP 3D inversion process, the inversion parameters were selected as follows: a regularization factor of 5 and 5 iterations of the inversion.
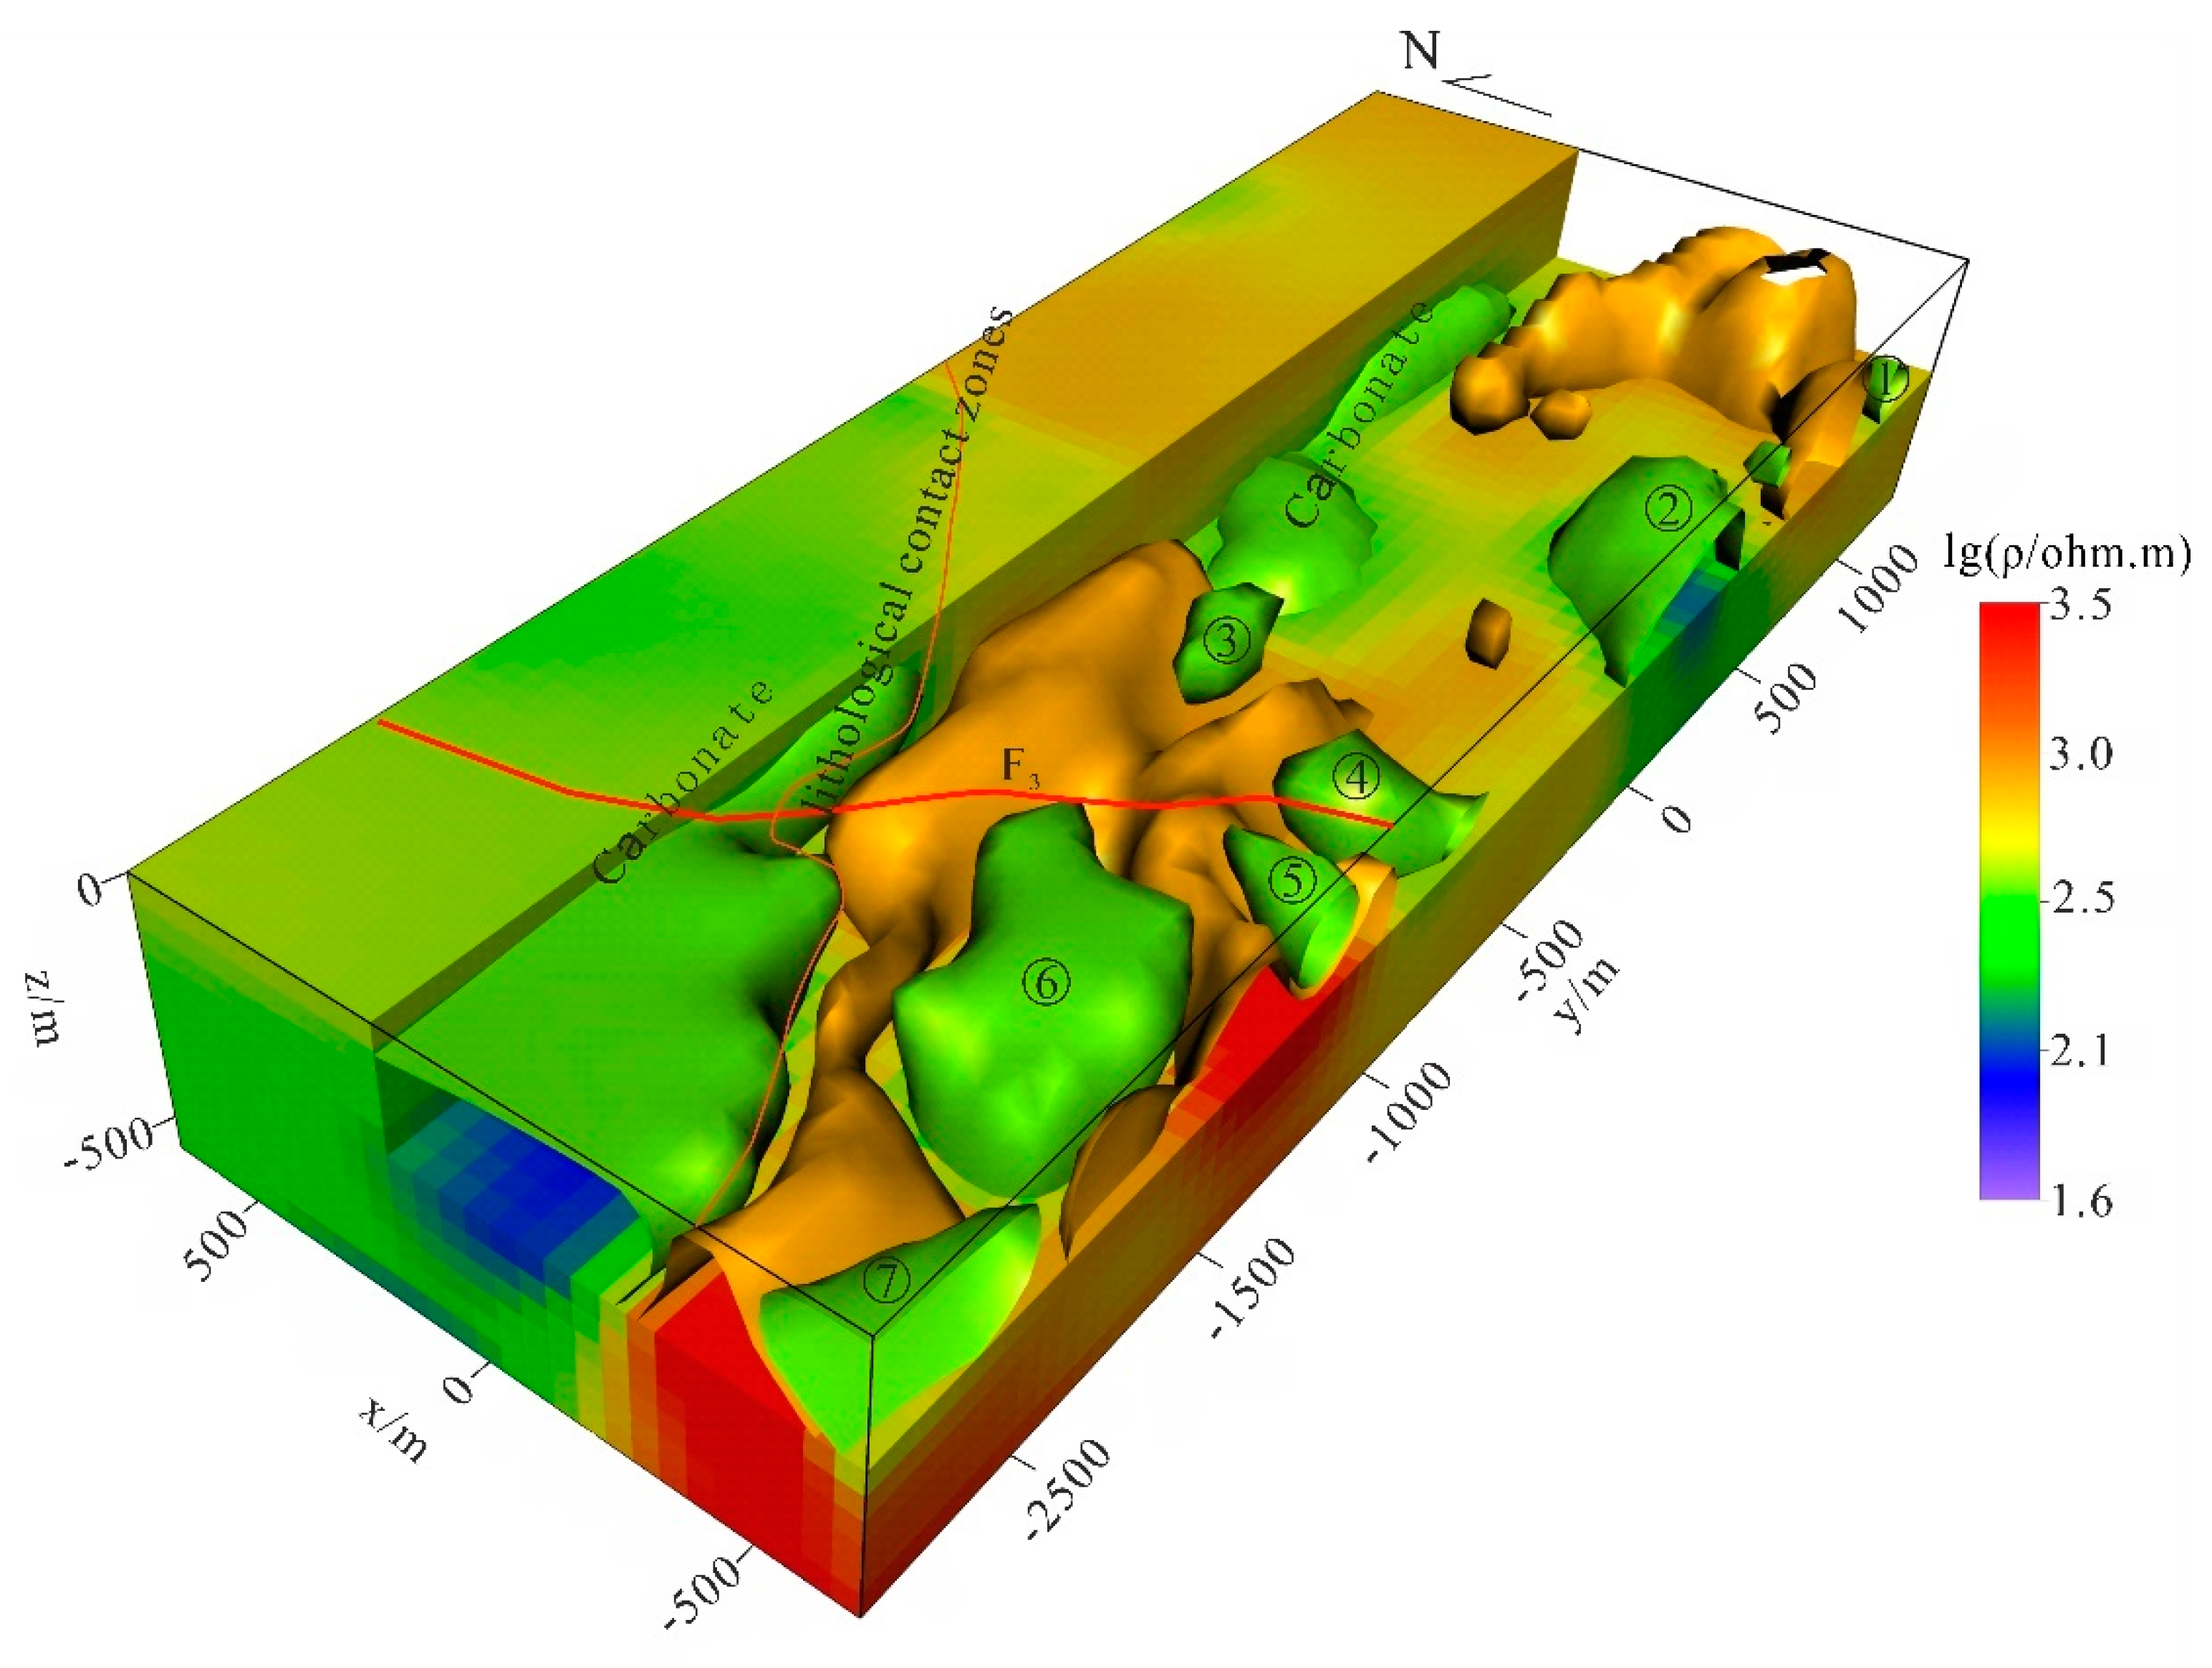
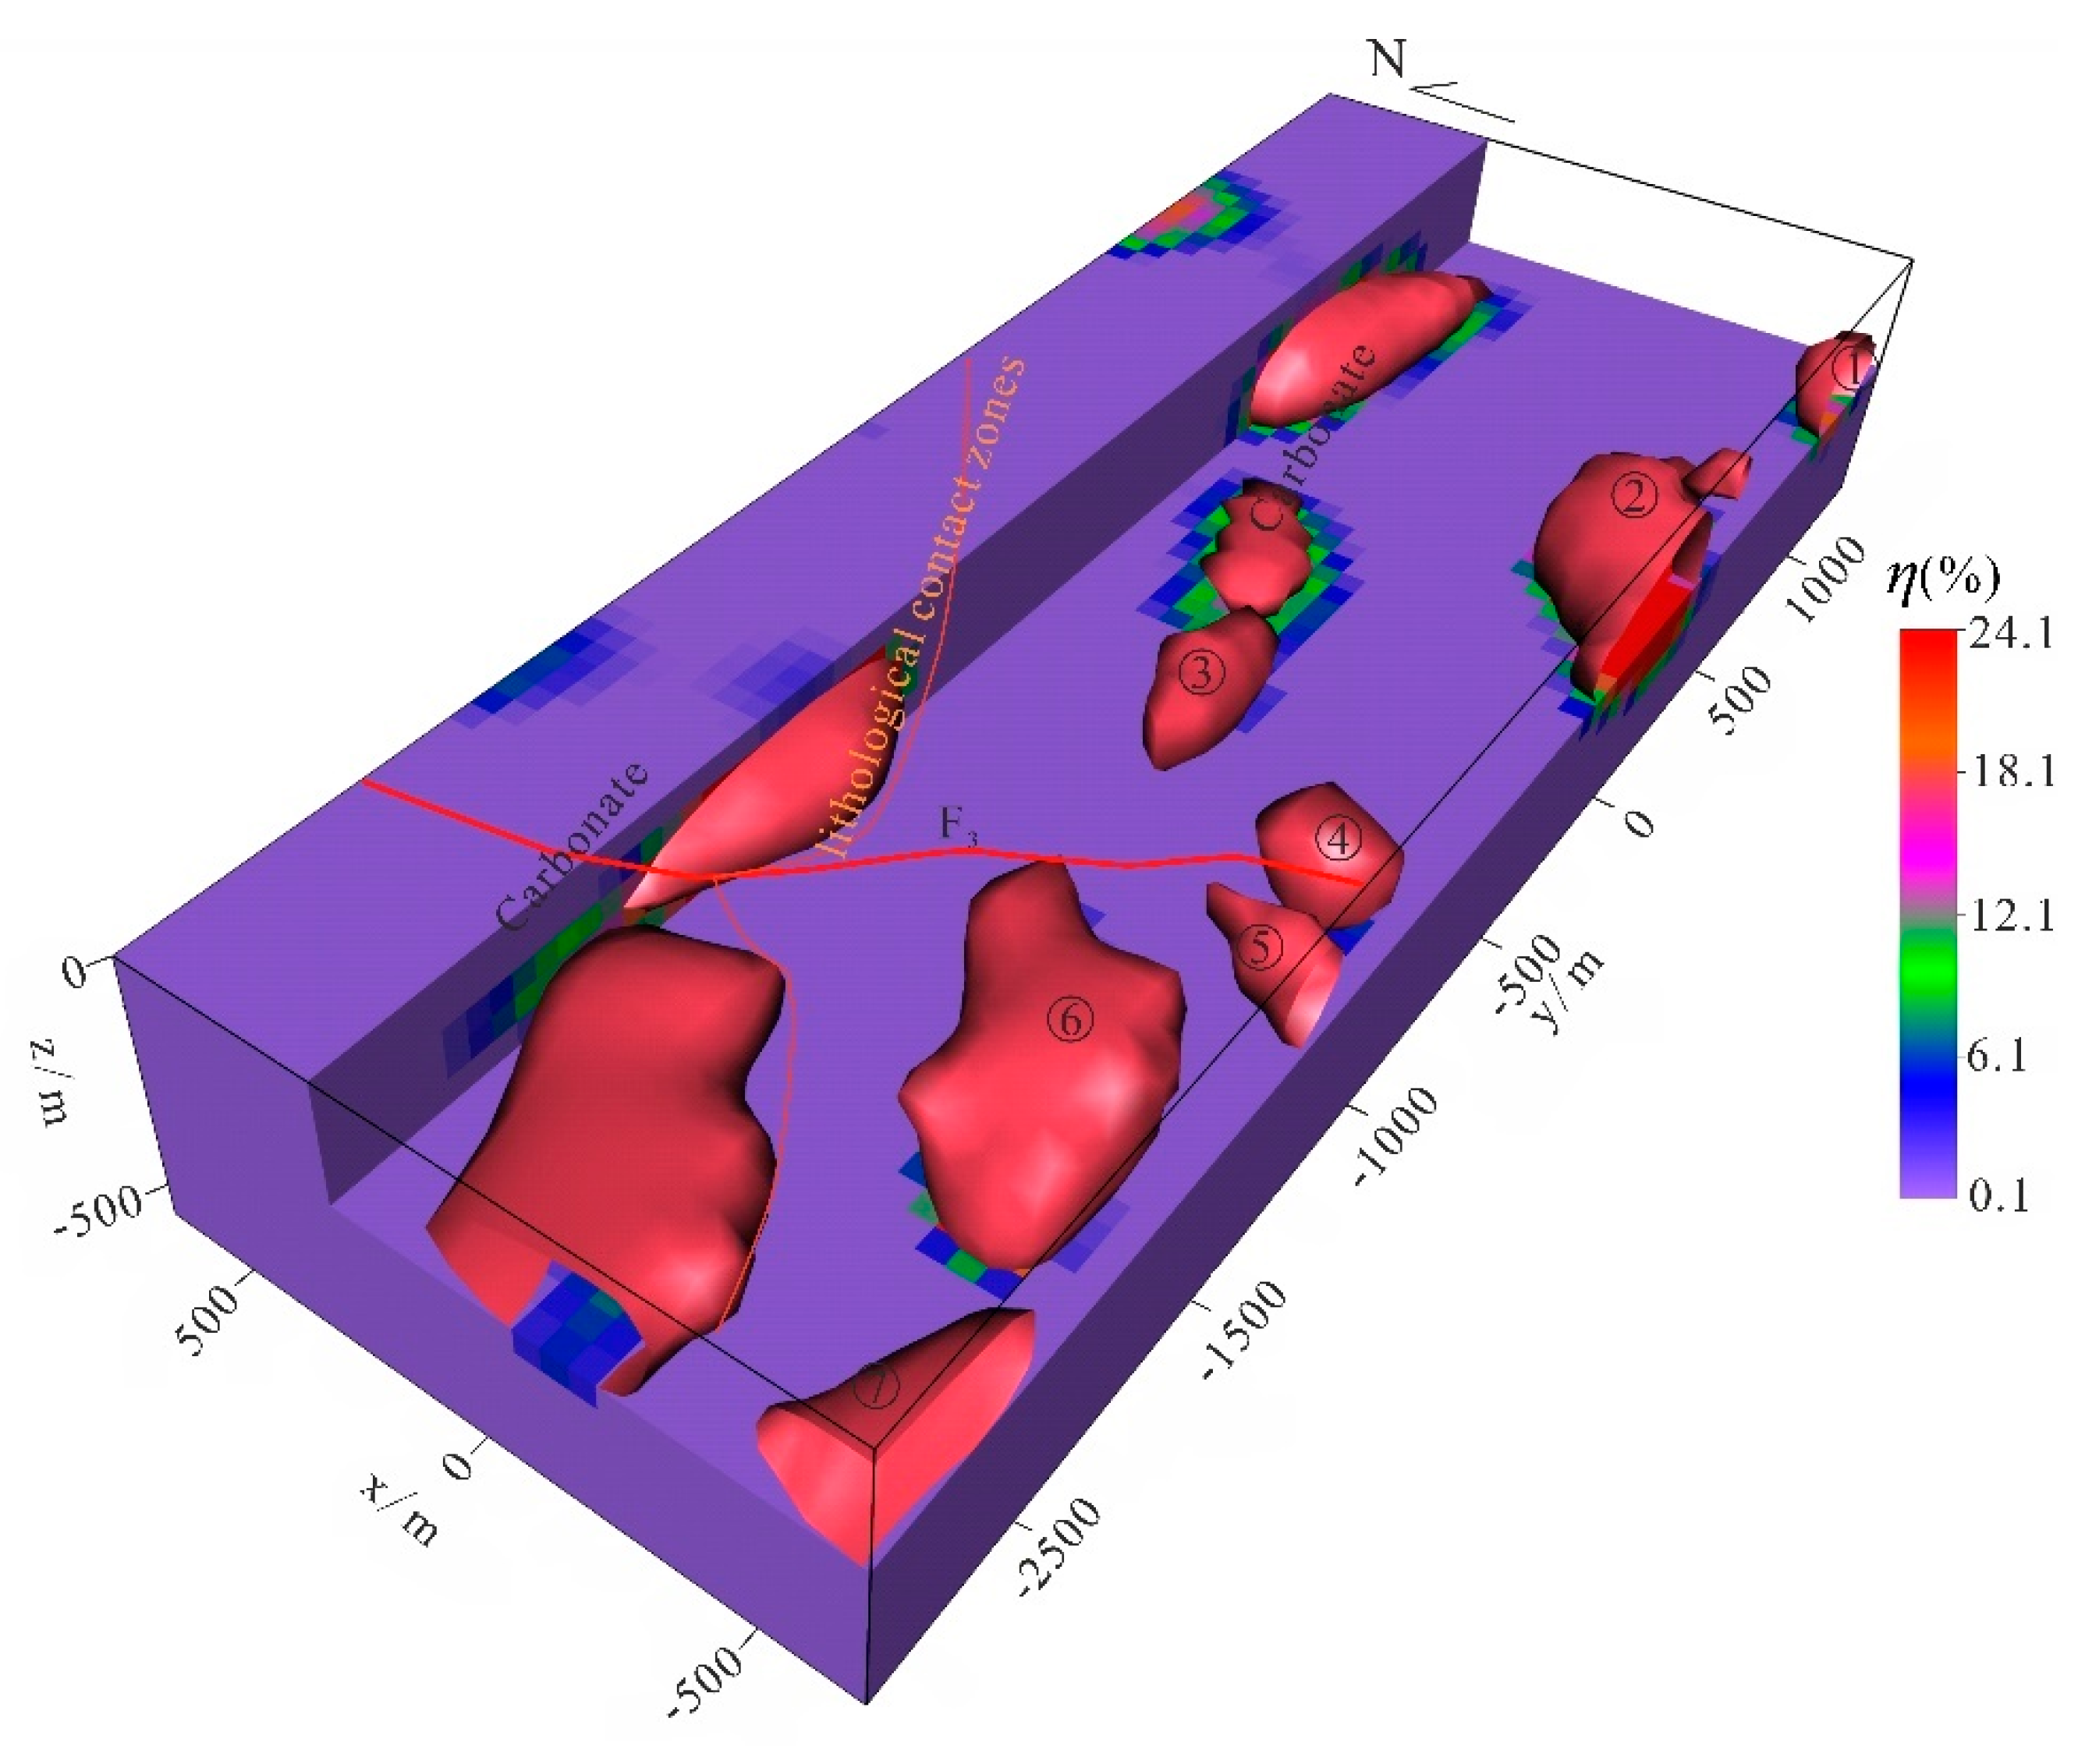
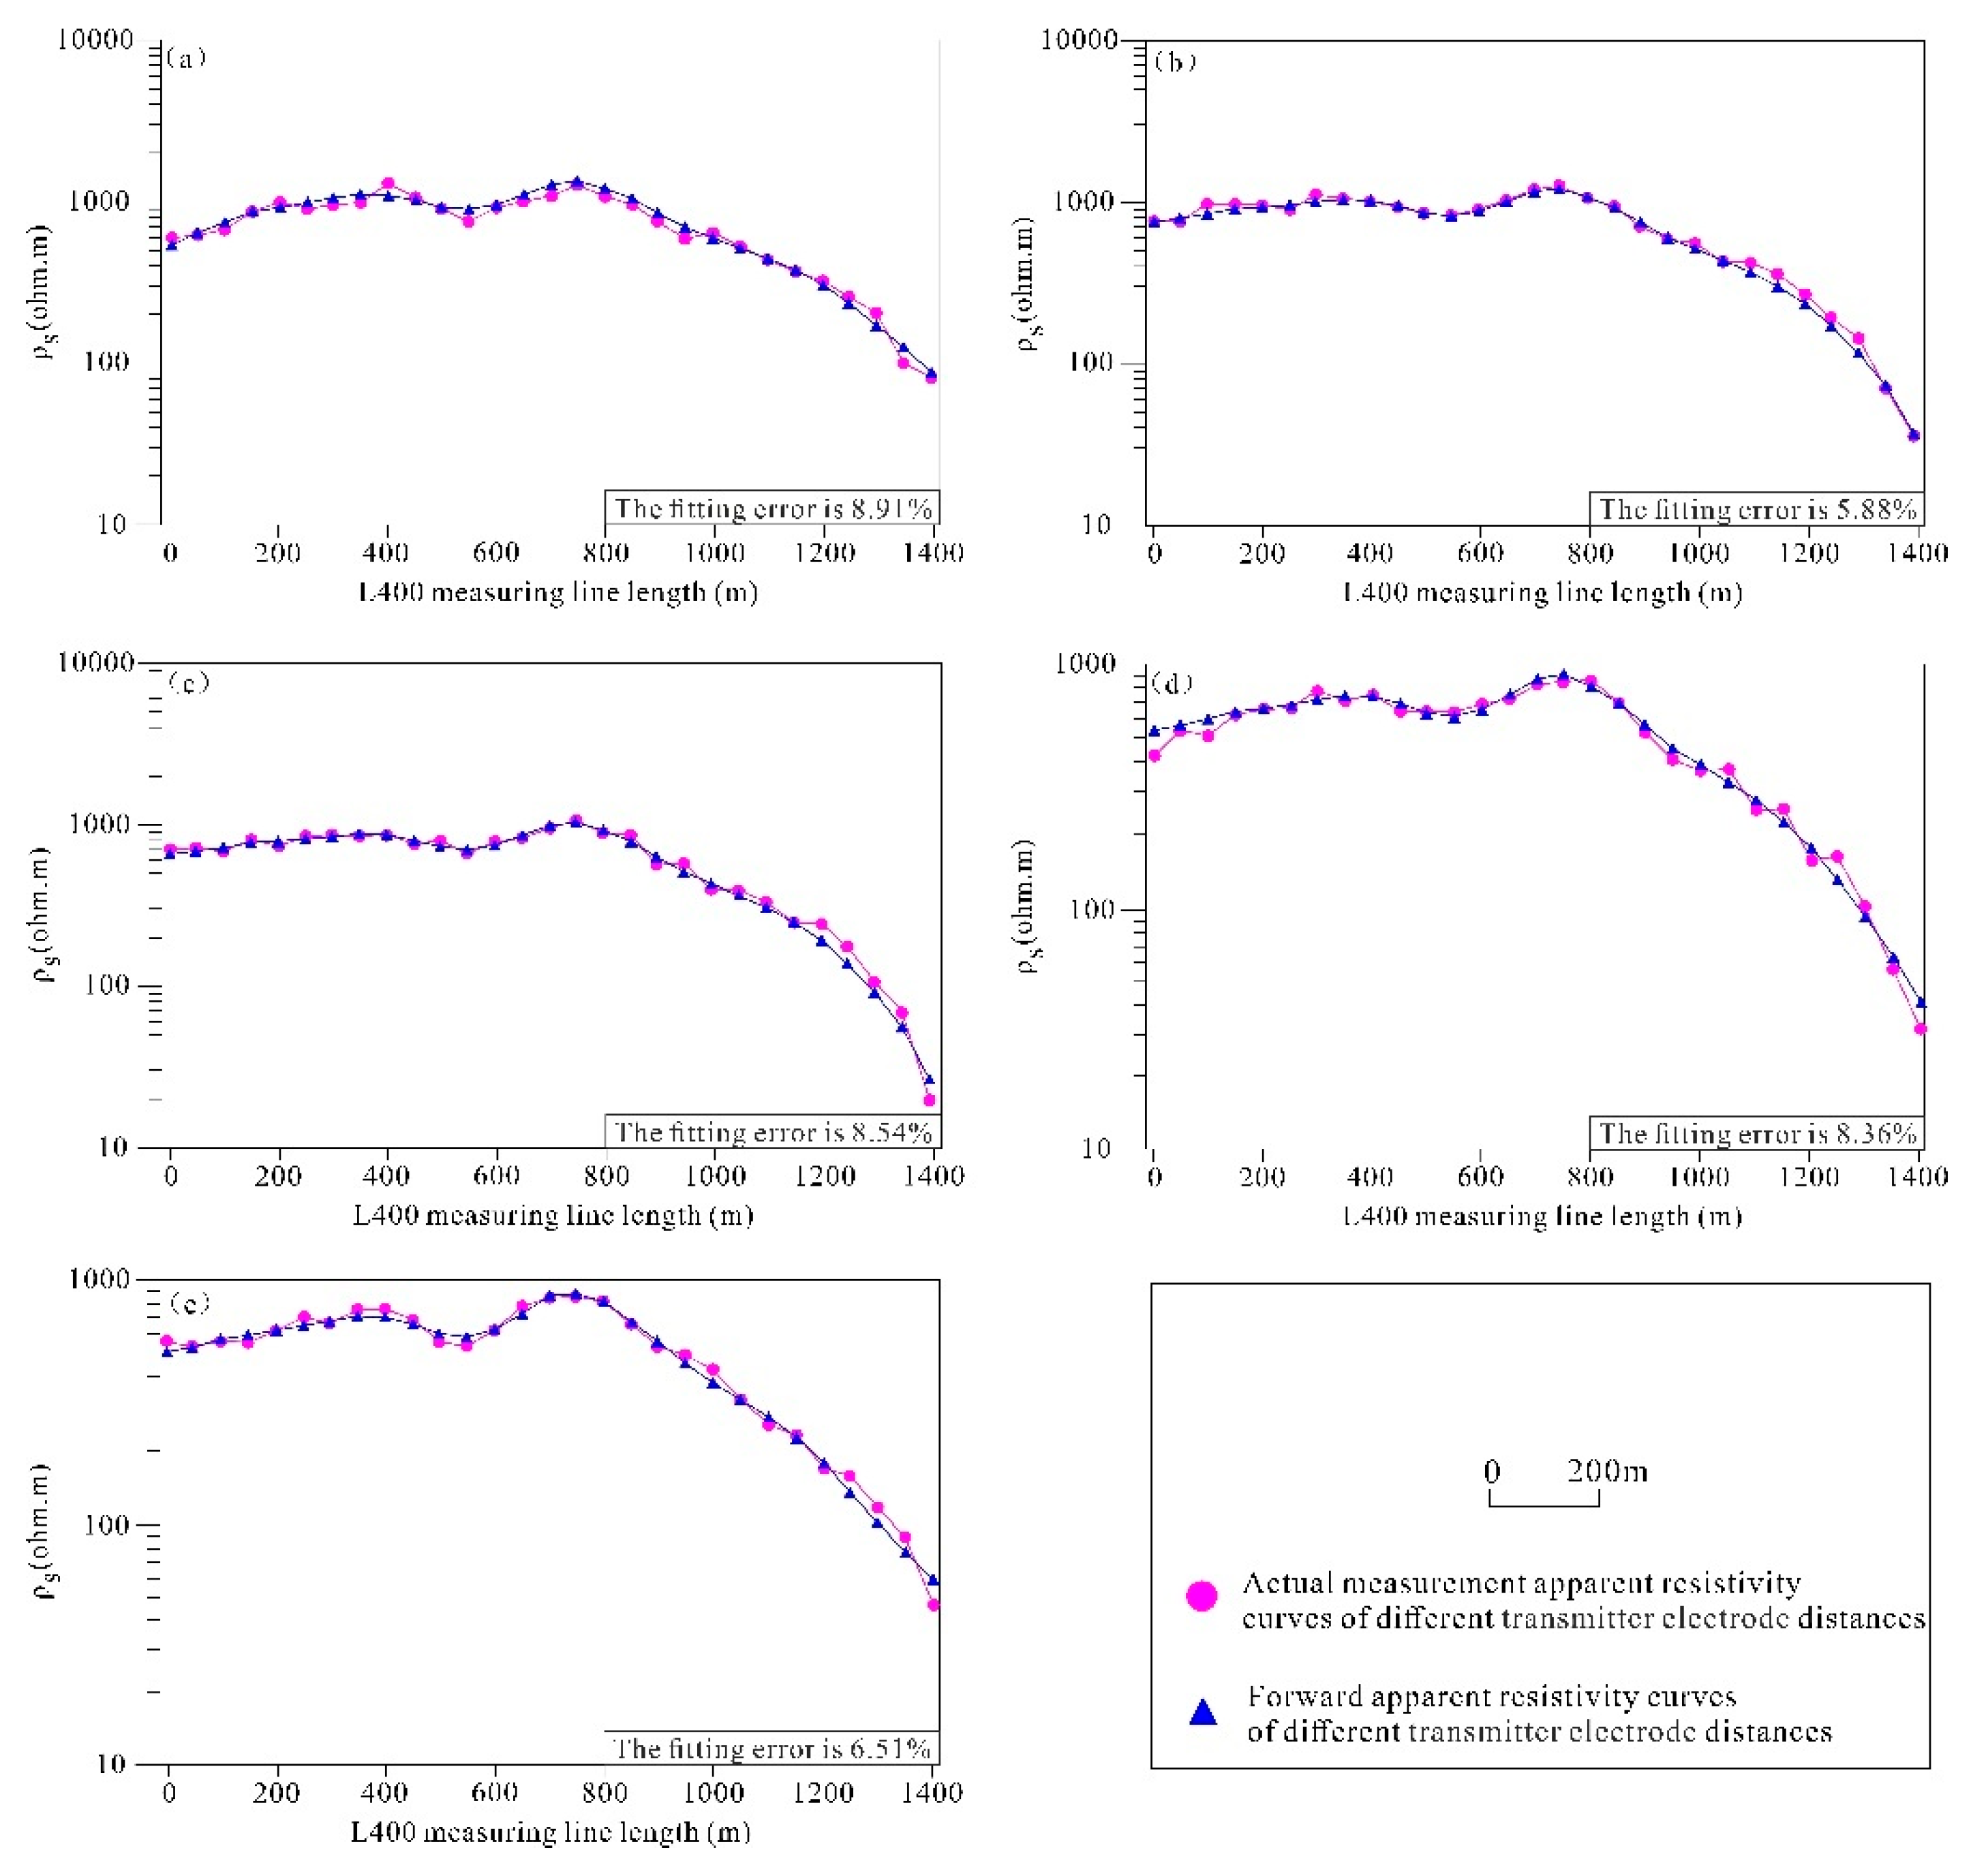
The resistivity 3D inversion model, polarizability 3D inversion model, and the fitted curves of the measured and normalized apparent resistivity of the L400 line at different pole spacings in the study area are presented in Figs. 11 to 13. In
Figure 11, the value of the low-resistance contour is 380 ohm.m (light greenish-yellow body), and in
Figure 12, the value of the high-polarizability contour is 17.2%. It can be observed that the differences between the measured and forward apparent resistivity of the L400 line at different pole spacings in
Figure 13 profile curve fitting are all within the range of 5% to 9%, indicating a good fit. Combined with the relevant geological data, it is evident that a large area of carbonaceous slate exists in the northwestern and north-central parts of the study area, which exhibits more disturbances in terms of excitation anomalies. It can also be seen that the resistivity parameter model and the polarization parameter model show a high similarity in the two diagrams, and the low-resistance anomalies possess the characteristics of a high polarization rate. To avoid the influence of carbonaceous slate in the geological interpretation process, the model can be divided into seven low-resistance and high-polarization anomalies (①, ②, ③, ④, ⑤, ⑥, ⑦).
By analyzing the data, it can be determined that anomalies ① to ⑦ are low-resistance and high-polarization anomalies. Among them, anomalies ①, ②, ⑤, and ⑦ are unclosed, while anomalies ③, ④, and ⑥ are closed. Additionally, anomalies ④ and ⑤ are located at the southern edge of the fracture, and the fracture passes through both of these anomalies. The ② and ⑥ low-resistance anomalies are of a large scale and are situated in the distribution area of granite, hornblende, and marble, which are presumed to be anomalies caused by concealed sulphides. The NW and north-central carbonaceous slates are characterized by similar low-resistance and high-polarization anomalies. The strike position of the F3 rupture from the NW is clearly shown in the TDIP 3D sounding results.
6. Construct the 3D Geological-Geophysical Model Based on the Results of 3D Inversion of Gravity, Magnetic and TDIP Data
The results of the three-dimensional inversions of gravity, magnetic , and electricity in the study area reveal that all three geophysical exploration methods have a good ability to identify fractures in the area. Gravity exploration is particularly effective in recognizing the rock body lattice framework, fractures, and lithological contact zones. Electrical exploration is capable of depicting fractures, lithological contact zones, and ore bodies. Magnetism exploration mainly conducts a high-magnetic-assisted delineation of the inferred potential metallogenic parts.
According to the geological map (
Figure 1(d)), the Huahetan-Shuangfengshan fracture (F
3) is situated in the western part of the study area, with a northwest strike, traversing the entire study area, and is the main fracture under investigation. In terms of the magnetic characteristics of the study area, this fracture appears as a weak magnetic anomaly zone (
Figure 3). It can also be identified on the residual density feature (
Figure 7), as well as the lithological contact zone between the kilomagnetite and the dacite in the study area. The electrical information(
Figure 11 and
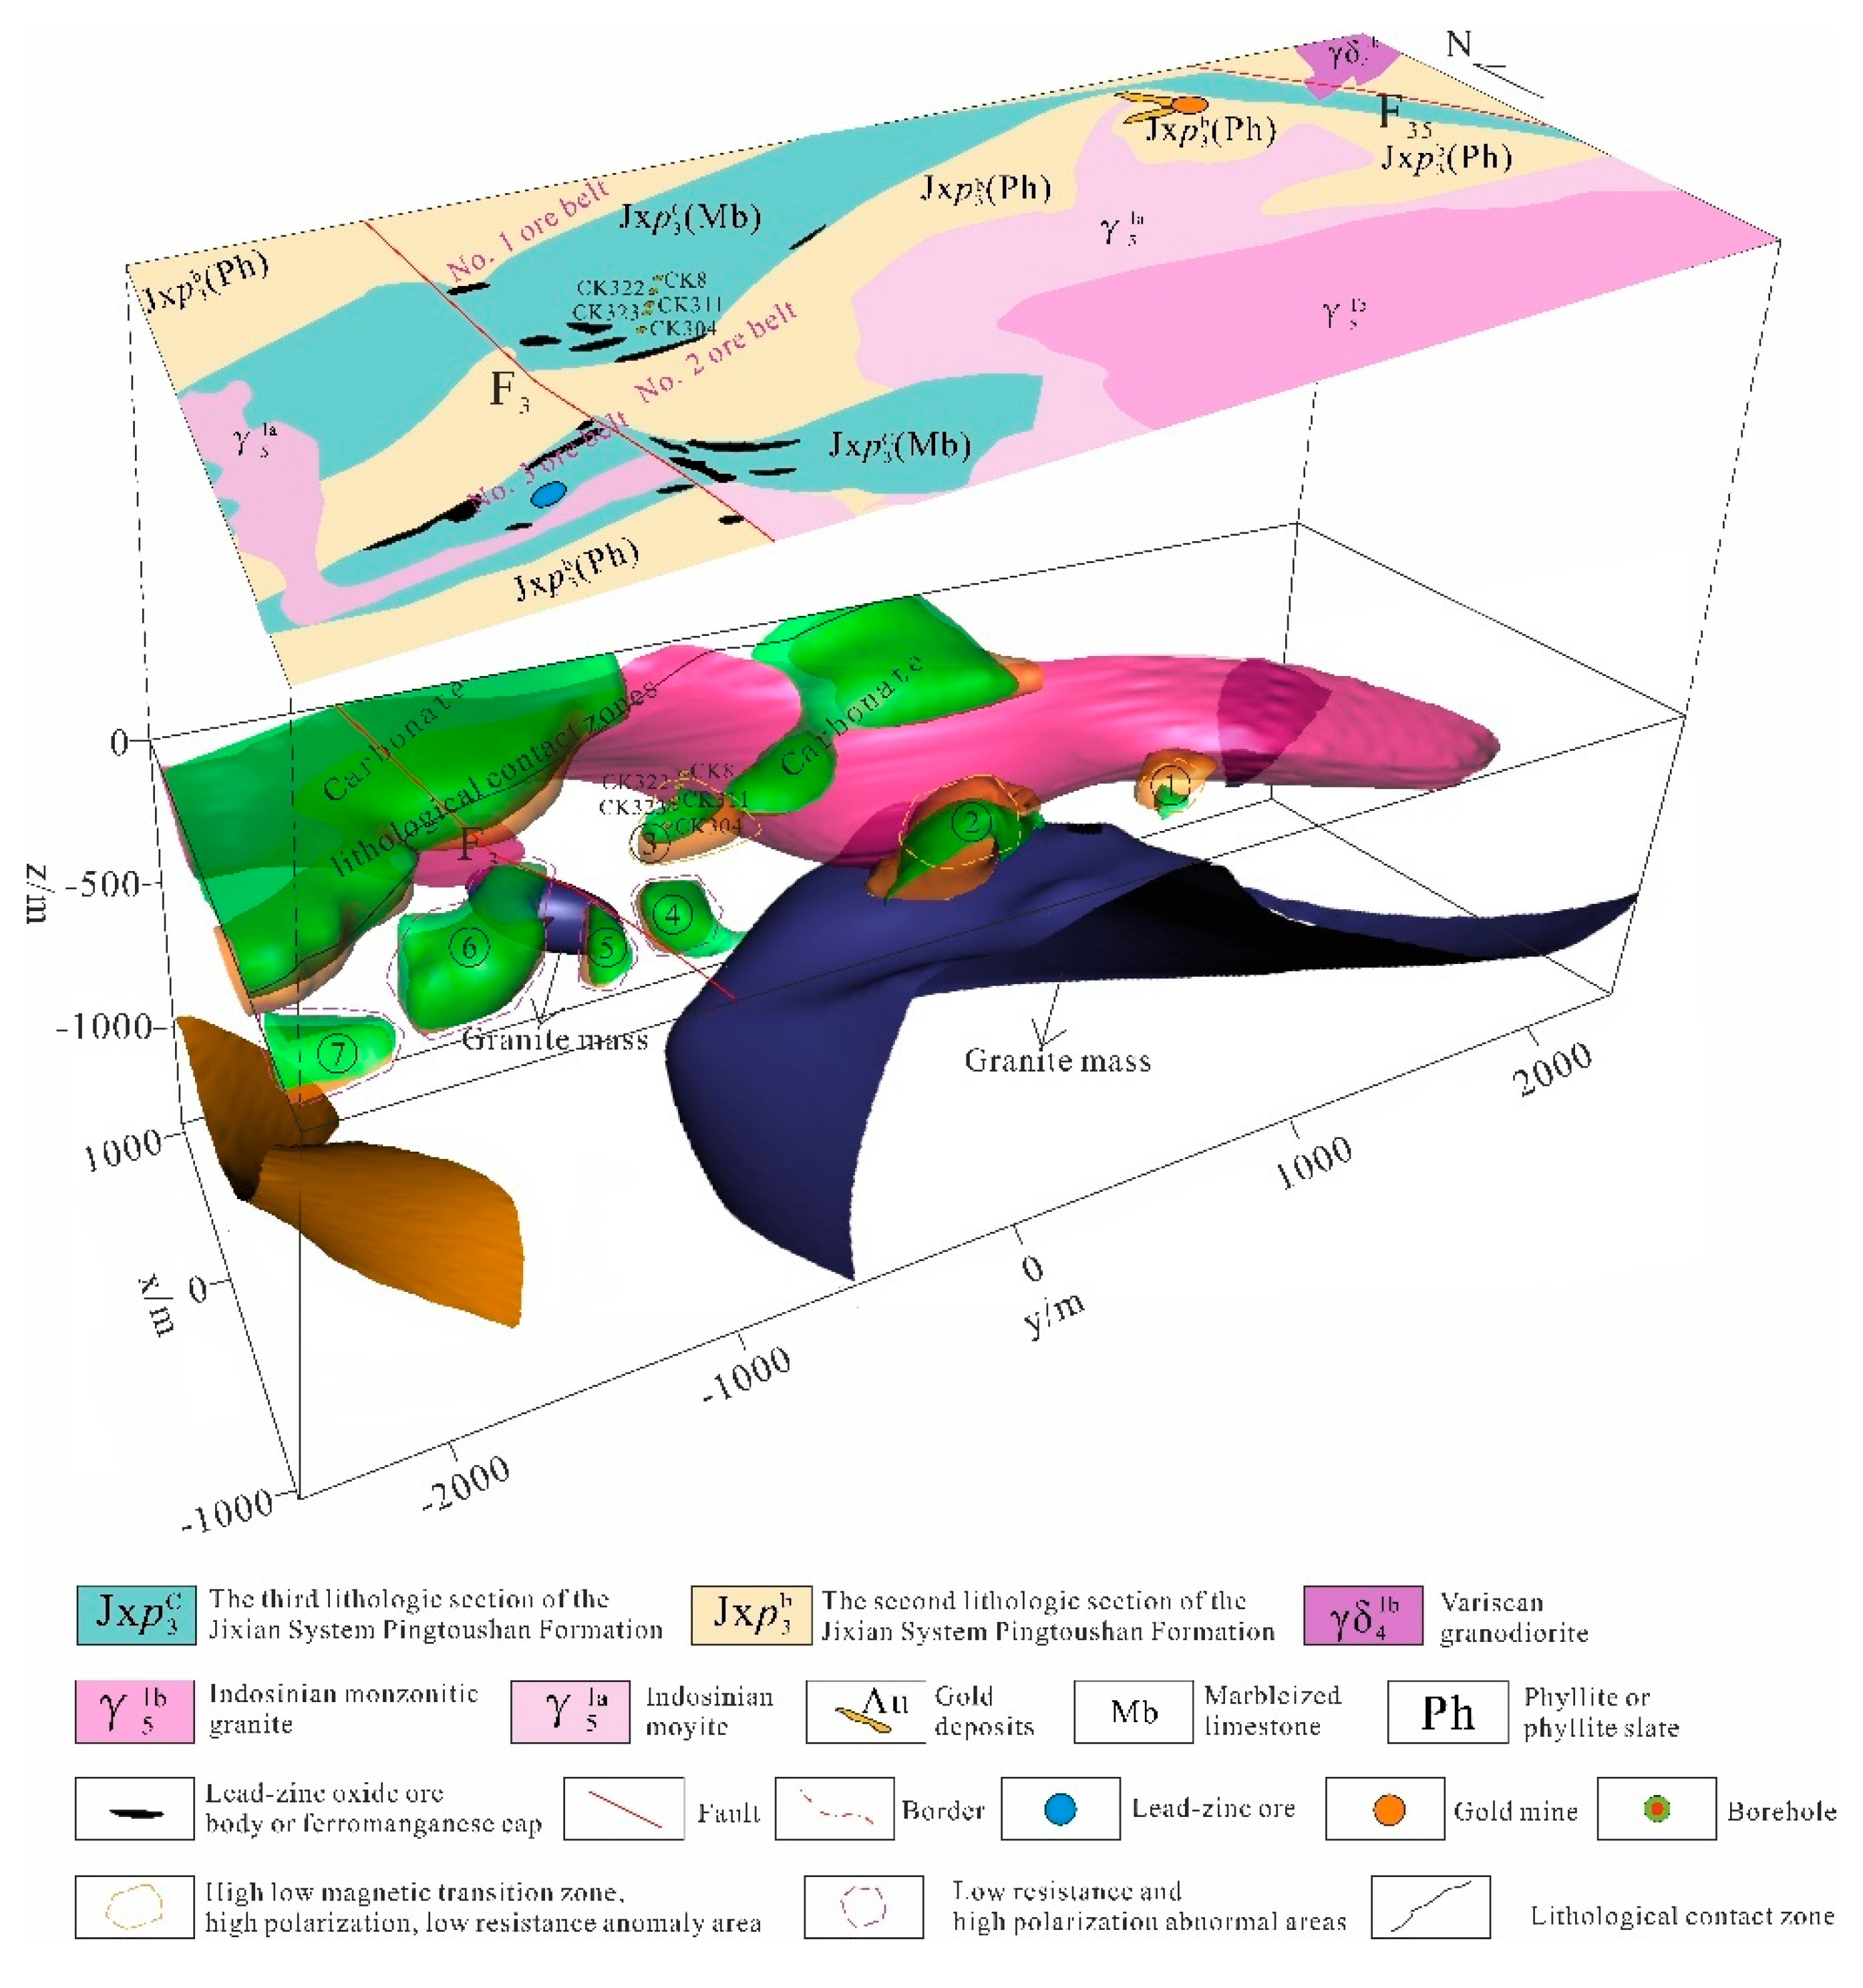
Figure 12) of the study area clearly indicates the presence of this fracture, while the identification of the lithological contact zone between the carbonaceous slate kilomagnetite and the dacite in the northwestern part of the study area is more prominent. In conclusion, the three exploration methods have complementary advantages, with varying degrees of capability in depicting fractures, lithological contact zones, ore bodies, and rock intrusion features. The 3D geological-geophysical model of the study area is constructed by integrating the results of the gravimetric, magnetoelectric 3D inversions with the geological data (
Figure 14).
Based on the three-dimensional geological-geophysical model of the study area, there are three anomalies (No. ①, ②, and ③) in the study area with high and low magnetic transition zones, high polarization, and low resistance. When combined with the geological map, these anomalies are all located in the contact area of the rock body or the tectonic development area. The remaining four anomalies in the low-resistance, high-polarization region are independent (No. ④, ⑤, ⑥, and ⑦), and are presumed to be potential mineralization anomalies. In the south-central part of the mine area, there is a low-density granite intrusive rock body. Considering the relevant information, it is hypothesized that the low density is attributed to late weathering. Additionally, there is an independent granite rock body in the west-central part of the mine area, which is presumed to be the result of the inflow of a large granite body in the south-central part of the mine area along the fracture F3 during its intrusion, forming an independent rock mass.
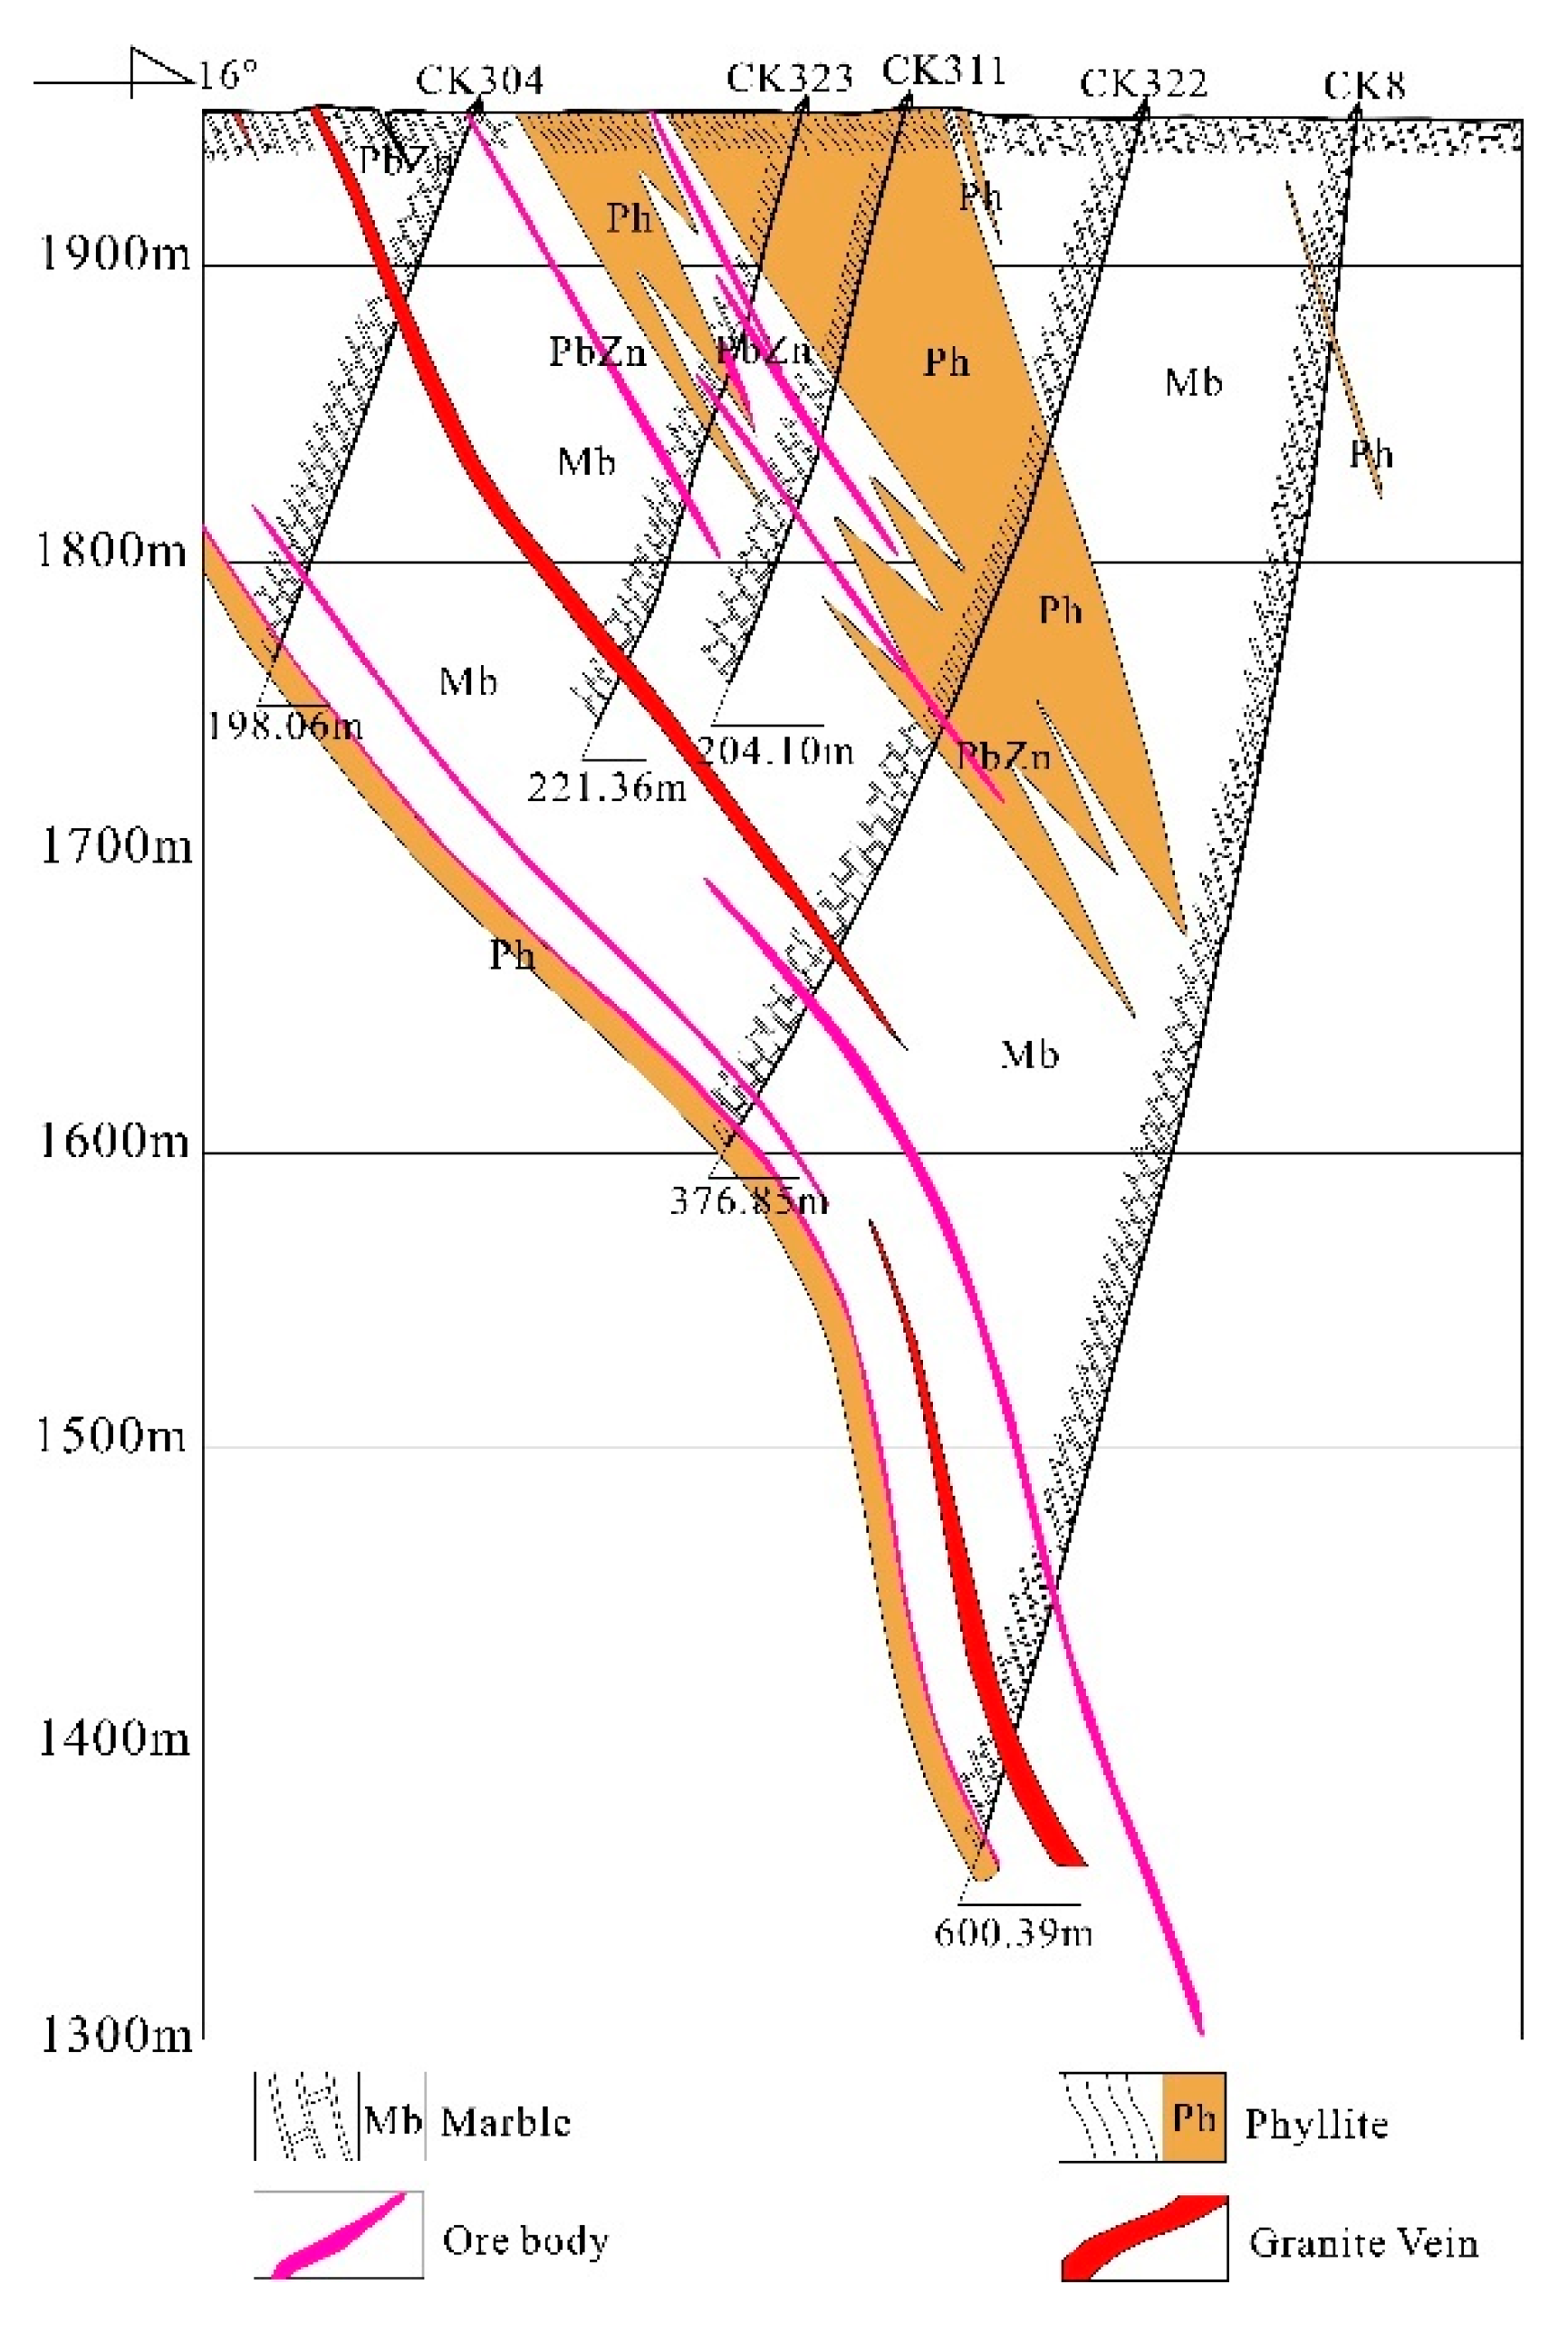
To verify the circled anomaly area, the drill holes corresponding to anomaly No. ③, namely CK304, CK323, CK311, CK322, and CK8, are located on the L400 line (shown in
Figure 1(d)). By integrating the geological and drilling data of the study area, it can be observed that the five holes, CK304, CK323, CK311, CK322, and CK8, have encountered ore along the L400 line (shown in
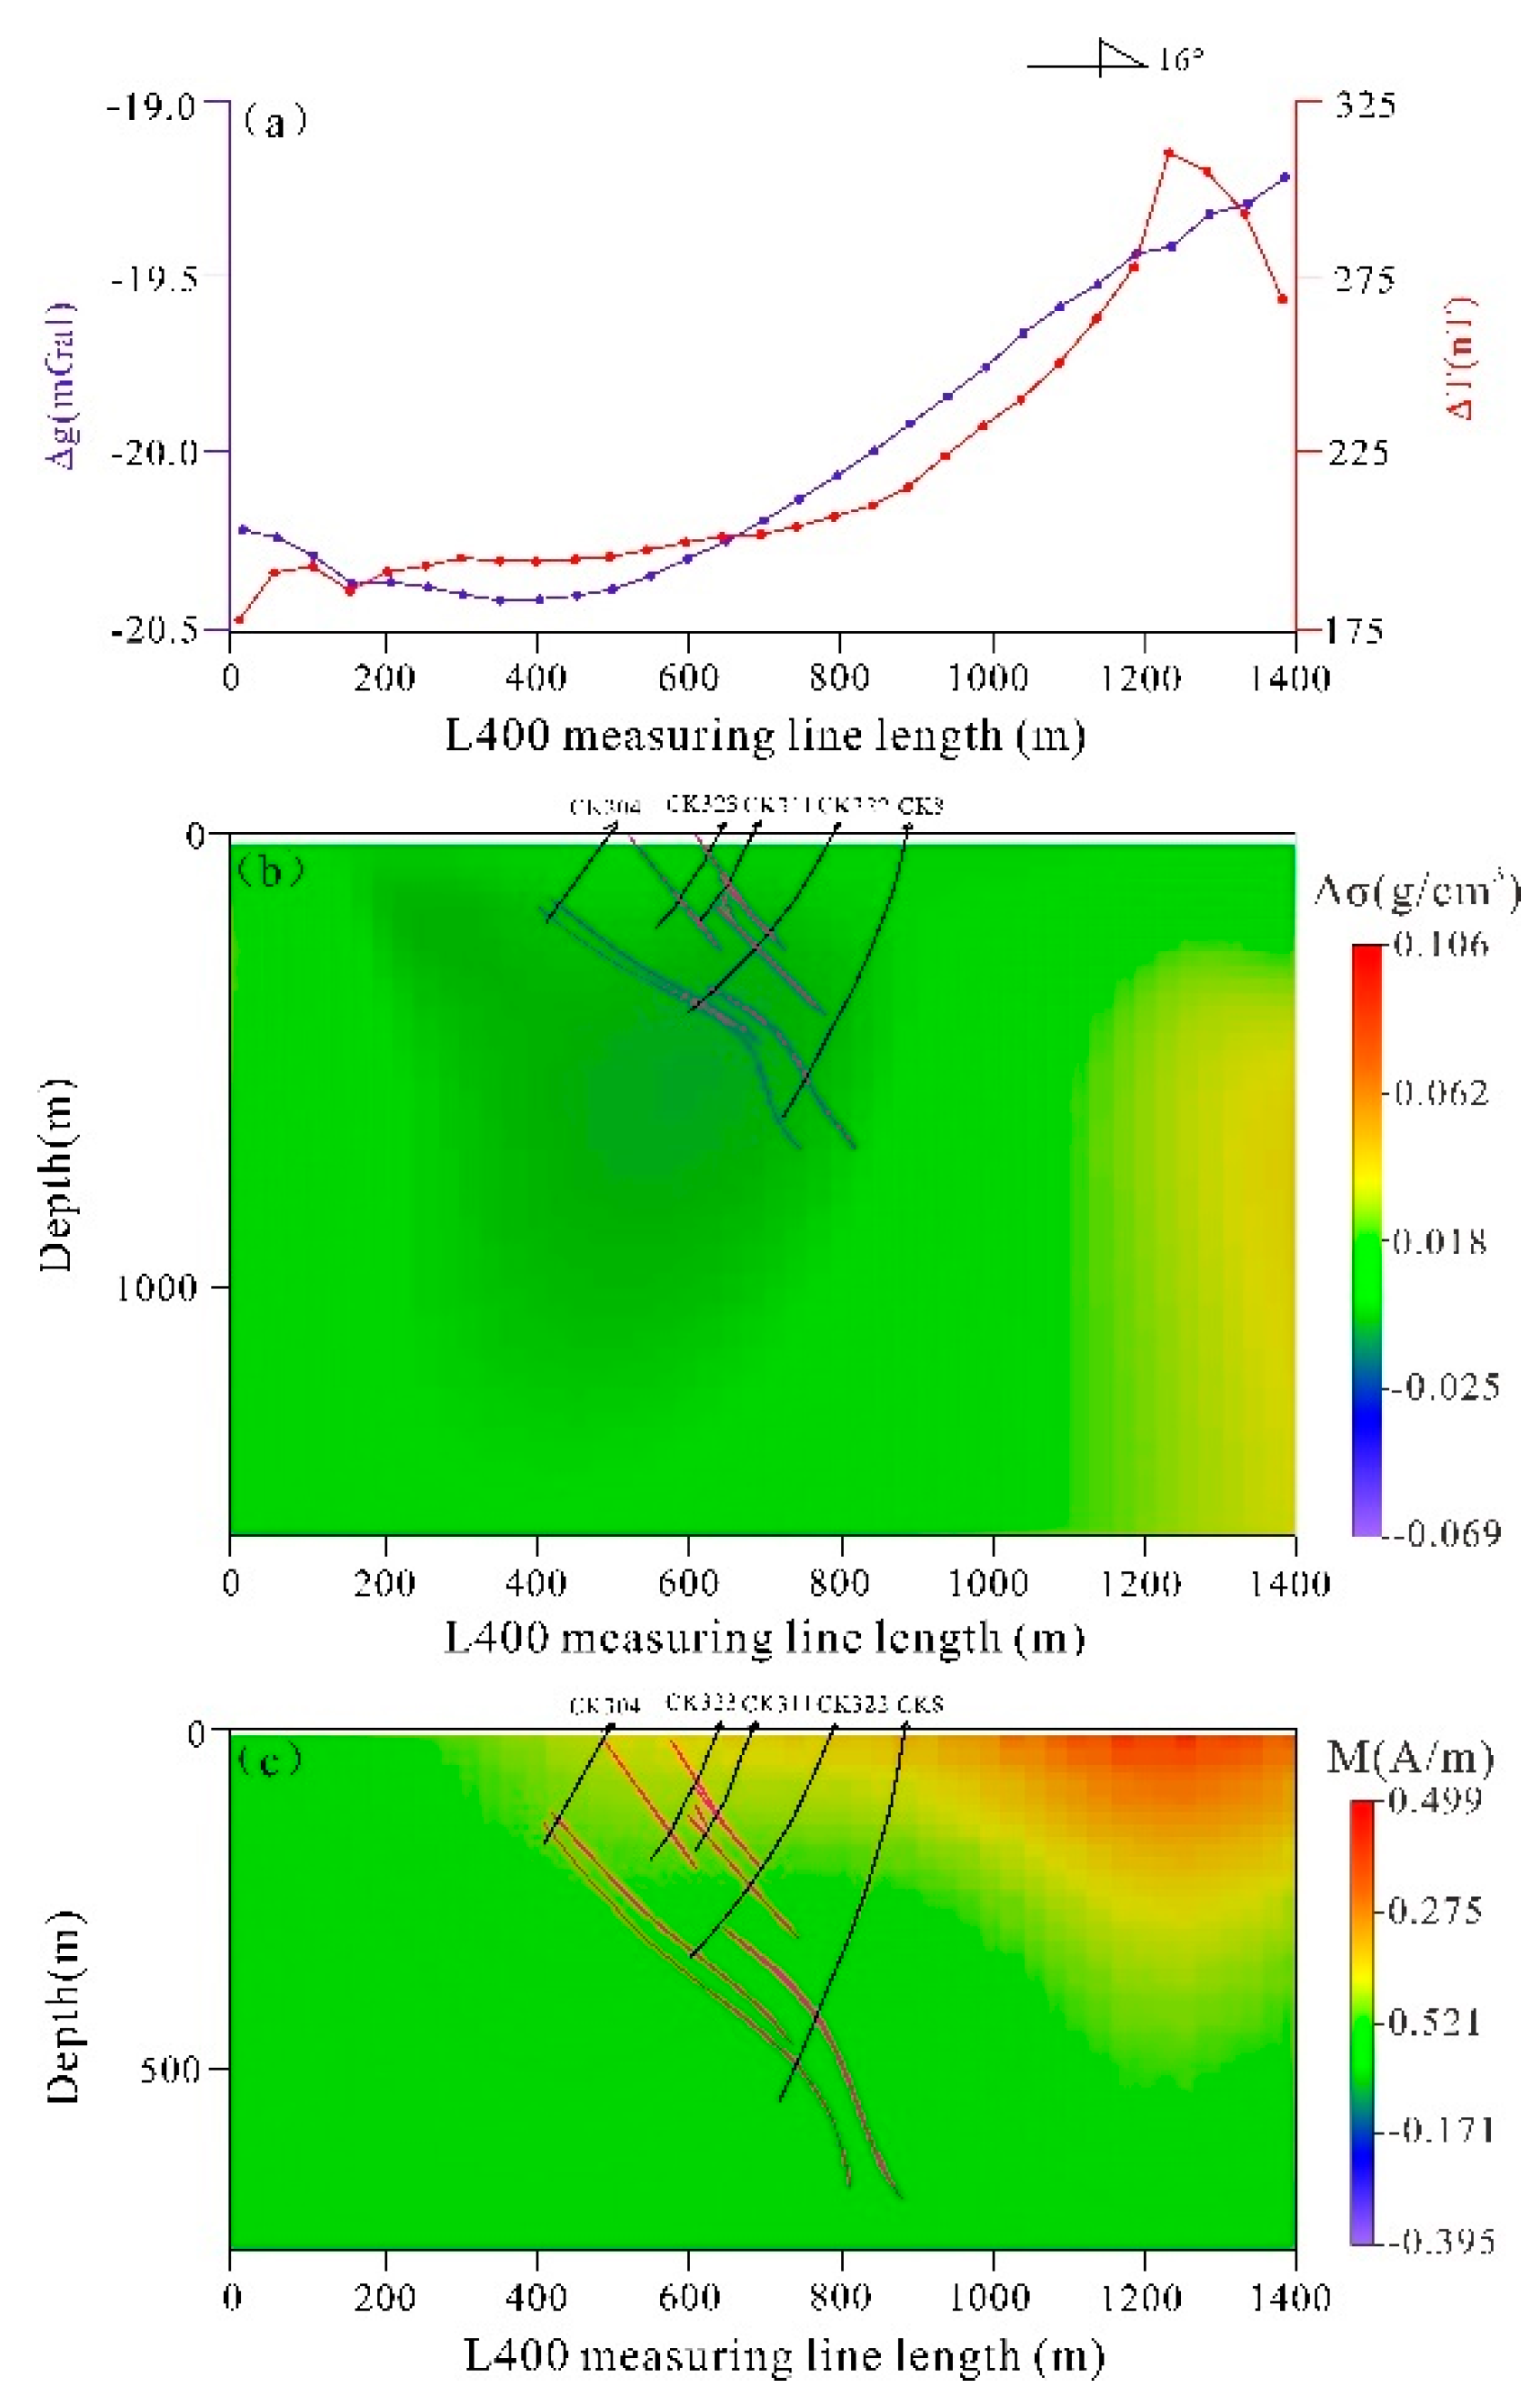
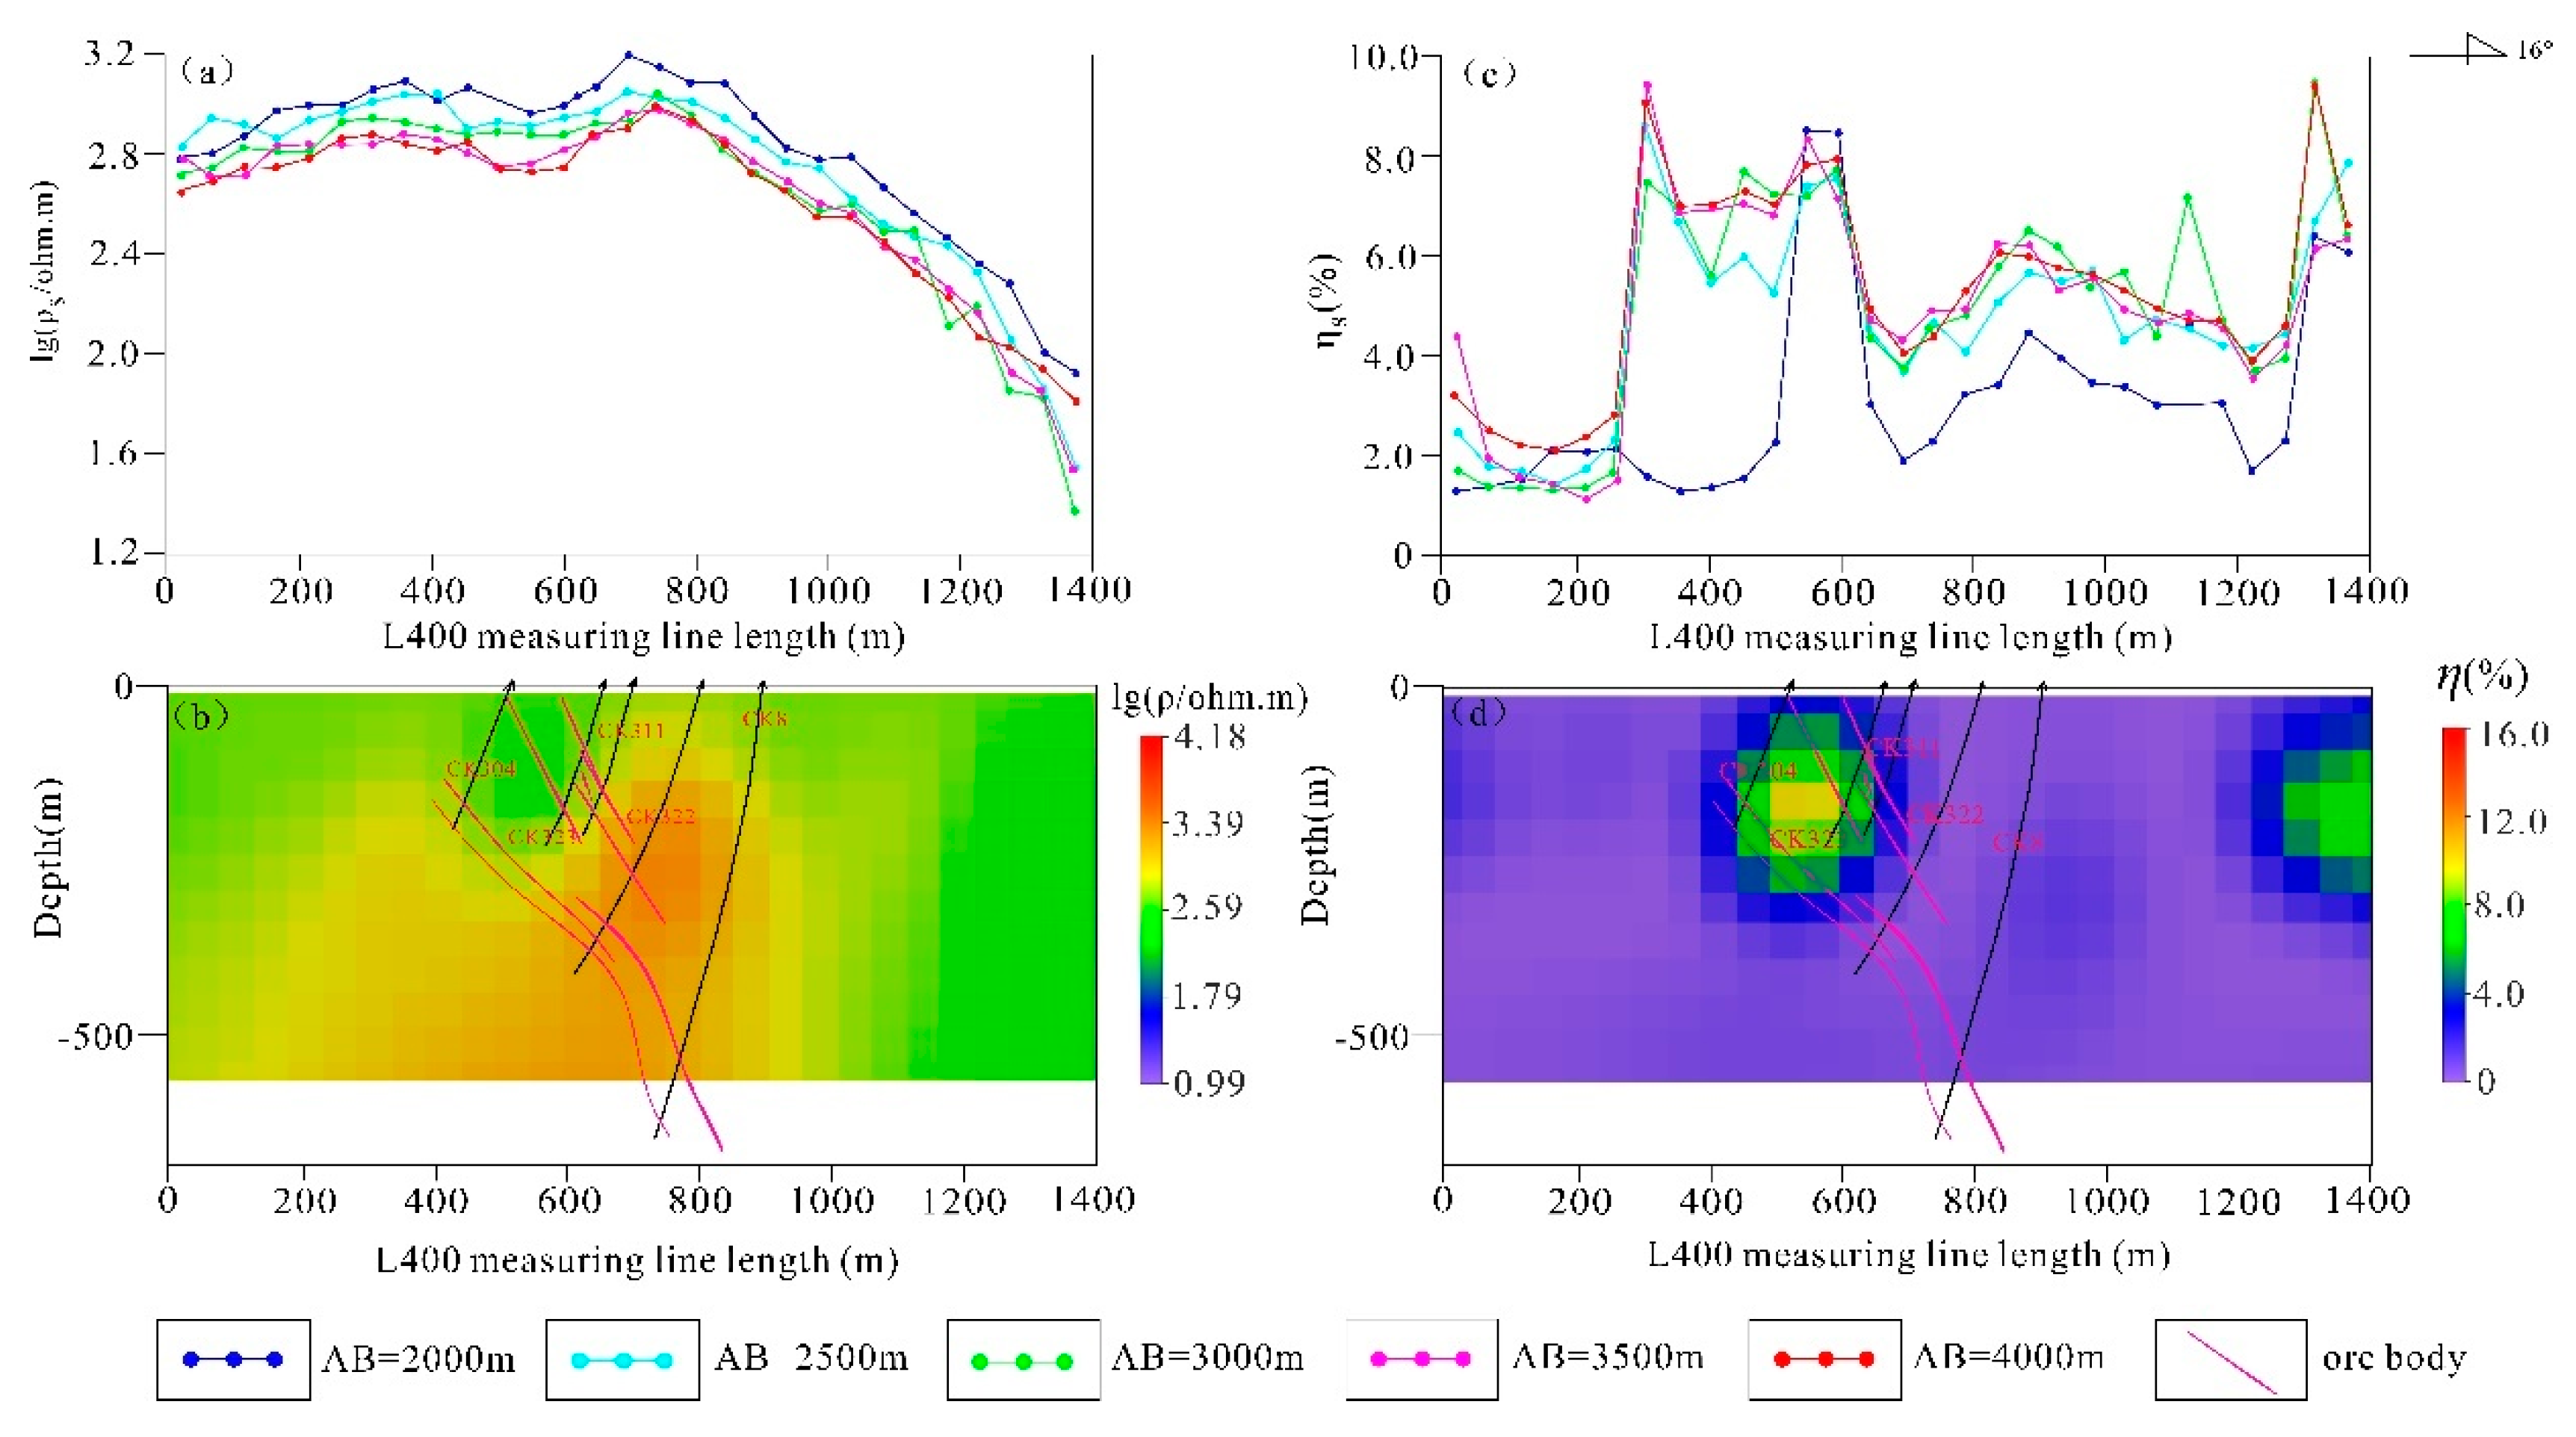
Figure 15). The integrated interpretation of the measured data and the inversion of the points on the L400 line where the drill holes are located is presented in the diagrams (
Figure 16 and
Figure 17).
Figure 16 shows the gravity and magnetic measured data curves corresponding to the five drill holes (
Figure 16(a)), the inversion profiles of the gravity data on the L400 line (
Figure 16(b)), and the inversion profiles of the magnetometry data on the L400 line (
Figure 16(c)), indicating that the five holes are situated in the high/low magnetism and the high/low residual density zone.
From the measured TDIP apparent resistivity profiles with different polar distances at L400 (
Figure 17(a)) and the TDIP apparent polarization profiles with different polar distances at L400 (
Figure 17(c)), it can be seen that the apparent resistivity and apparent polarization profiles at different polar distances at L400 exhibit the same trend, essentially reflecting the electrical characteristics of the profile at L400. From the L400 line inversion resistivity section (
Figure 17(b)) and the L400 line inversion polarization section (
Figure 17(d)), it can be observed that the low-resistance and high-polarization zones at the locations of the five holes can be clearly identified, presenting an obvious feature of low resistance and high polarization. In summary, the locations of the drill holes on the L400 line are characterized by high and low magnetic transitions, high polarization, and low to medium resistance, which is in perfect accordance with the anomalous area (numbered ③ in
Figure 14).
7. Conclusions
The relevant conclusions derived from the research in this paper are as follows:
(1) The geological structure of the Huaniushan mining area is intricate. A single exploration method is incapable of effectively exploring the basic structure of the mining area. However, the combination of heavy magnetic and electrical exploration methods along with three-dimensional inversion can effectively identify the tectonics, rock body, and ore body distribution in the mining area. The extensive heavy magnetic sweeping work can better discern the basic structure of the mine area and the lithological contact zones. Unlike the traditional middle ladder device, the high-power multi-group pole pitch TDIP employed in this paper can efficiently and rapidly acquire electrical information in arid, Gobi, and other environmentally challenging areas. This method highlights the high-polarized and low-resistance areas of the Huaniushan mine. Nevertheless, there are extensive carbonaceous slate areas in the northwestern and northeastern parts of the mine area, which interfere with the TDIP and require effective evaluation in conjunction with geological information.
(2) Based on the results of the gravimetric, magnetic, and electrical 3D inversion, the inversion results of the three exploration methods show varying degrees of response to the main fracture in the fracture detection area, namely the Huahaitan-Shuangfengshan Fracture (F3). The gravity and electrical methods respond more effectively to the lithological contact zone than the magnetic method, and the electrical method shows the best response to the ore body. According to the information from drill holes CK304, CK323, CK311, CK322, and CK8, the anomaly area of No. ③ has already revealed ore, presenting a characteristic of high magnetic, high polarization, and low resistance anomaly. Hence, it is hypothesized that the other two similar anomalies (No. ① and ②) are also mineralization sites. Additionally, the areas of high polarization and low resistance anomalies (No. ④, ⑤, ⑥, and ⑦) are independent anomalies without the influence of carbonaceous slate, and are thus assumed to be favorable mineralization sites in the mine.
(3) The three-dimensional mineralization model of the Huaniushan mine is presented. Ore exploration should focus on the lithological contact zone, fractures, and the contact zone between granite intrusion and marble and dacite. Ore exploration is marked by the high-magnetism-low-magnetism transition zone, medium-low-resistance transition zone, and high-density-low-density transition zone. Simultaneously, attention should be paid to the parts of the transition zone featuring a high-magnetism-high-polarity-low-resistance-high-density-low-density transition zone. The ore exploration direction is towards the northwest of the Huaheitan - Shuangfengshan Fracture (F3) and the contact zone of marble and dacite lithology as the key area. The application of comprehensive physical exploration methods in combination with the geological conditions of the deep part of the Huaniushan mining area and the periphery of the veins holds a certain potential for mineral discovery.
Author Contributions
Conceptualization, S. J. W., G. W. G., Y. W. and X. G. N.; methodology, G. W. G.; software, Y. W.; validation, L. Z., Z. H. X., H. Y. H., Y. J. W., X. L. L. and L. C.; formal analysis, Z. H. X.; investigation, G. W. G.; resources, G. W. G. and Y. W.; data curation, S. J. W., G. W. G. and Y. W.; writing—original draft preparation, S. J. W., G. W. G. and X. G. N.; writing—review and editing, Y. W., L. Z., Z. H. X., H. Y. H., Y. J. W., X. L. L. and L. C.; visualization, S. J. W., G. W. G. and Y. W.; supervision, Z. H. X. and H. Y. H.; project administration, S. J. W. and G. W. G.; funding acquisition, S. J. W., G. W. G., Y. W and X. G. N. All authors have read and agreed to the published version of the manuscript.
Funding
Innovative Ability Training Project for Postgraduate Students in Hebei Province (CXZZSS2023184); Central University Innovation Team Project (ZY20215108); Science and Technology Research Project of Higher Education Institutions in Hebei Province (ZC2022056 and ZC2021213); The Science and Technology Support Project of Langfang City (2023013184); Funds for central government to guide local scientific and technological development(2023ZY0036); National Major Scientific Instruments and Equipment Development Special Projects (2011YQ050060).
Data Availability Statement
Data will be provided by authors in case of request.
Conflicts of Interest
The authors declare no conflict of interest.
References
- Cugerone, A.; Oliot, E.; Chauvet, A. et al. Structural Control on the Formation of Pb-Zn Deposits: An Example from the Pyrenean Axial Zone. Minerals, 2018, 8, 489. [CrossRef]
- Wilkinson, J.J. Sediment-Hosted Zinc-Lead Mineralization: Processes and perspectives. Treatise Geochem, 2013, 13, 219–249.
- Bois, J.P.; Pouit, G. Les minéralisations de Zn (Pb) de l’anticlinorium de Pierrefitte: Un exemple de gisements hydrothermaux et sédimentaires associés au volcanisme dans le Paléozoïque des Pyrénées centrales. Bureau Rech. Geol. Min, 1976, 6, 543–567. (In French).
- Pouit, G.; Fortuné, J.-P. Métallogénie comparée des Pyrénées et du Sud du Massif-central. In Proceedings of the 26ème Congrès Géologique International, Paris, France, 7–17 July 1980; p. 61. (In French).
- Wei, C.; Huang, Z.; Yan, Z.; et al. Trace Element Contents in Sphalerite from the Nayongzhi Zn-Pb Deposit, Northwestern Guizhou, China: Insights into Incorporation Mechanisms, Metallogenic Temperature and Ore Genesis. Minerals, 2018, 8, 490. [CrossRef]
- Yesares, L.; Drummond, D.A.; Hollis, S.P. et al. Coupling Mineralogy, Textures, Stable and Radiogenic Isotopes in Identifying Ore-Forming Processes in Irish-Type Carbonate-Hosted Zn–Pb Deposits. Minerals, 2019, 9, 335. [CrossRef]
- Staude, S., Raisch, D., Markl, G. Sulfide anatexis during high-grade metamorphism: a case study from the Bodenmais SEDEX deposit, Germany. Mineralium Deposita, 2023, 58(5): 987-1003. [CrossRef]
- Jiang, Y.; Cui, Y.; Nian, H.; et al. The Origin of the Caiyuanzi Pb–Zn Deposit in SE Yunnan Province, China: Constraints from In Situ S and Pb Isotopes. Minerals, 2023, 13, 238.
- Yang, J. G., Zhai, J. Y., Yang, H. W., et al. Metallotectonics and Prospection of the Huaniushan Exhalogene Gold-Silver-Lead-Zinc Deposit in Beishan, Gansu Province. Geotectonica Et Metallogenia, 2010, 34(02), 246-254. (In Chinese).
- Fan, Y., Wan, Y., Wang, H., et al. Application of an airborne hyper-spectral survey system CASI/SASI in the gold-silver-lead-zinc ore district of Huaniushan, Gansu, China. Geologia Croatica 2021, 74(1): 73-83. [CrossRef]
- Zhu, J., Lü, X., Cao, X., et al. U-Pb zircon geochronology, geochemistry and kinetics of the Huaniushan A-type granite in Northwest China. Chinese Journal of Geochemistry, 2012, 31: 85-94. (In Chinese). [CrossRef]
- Gong, S. P., Yang, Y. B., Lin, P. R., et al. Three-dimensional electrical exploration methods for the map of polymetallic targets in Gansu Province, China. Geophysical Prospecting, 2019, 67(7): 1929-1947. [CrossRef]
- Gu, G. W., Wang, S. J. Li, T. L., et al. Influence of different power supply direction excitation on three-dimensiona induced polarization exploration effect with the similar central gradient array. Journal of Jilin University(Earth Science Edition) 2024, 54(01):292-309. (In Chinese).
- Xiao, W. J., Huang, B. C., Han, C. M., et al. A review of the western part of the Altaids:A key to understanding the architecture of accretionary orogens. Gondwana Research, 2010. 18(2-3): 253-273. [CrossRef]
- Wang, C. Y., Wang, Q. S, Shu, S. P., et al. Temporal and Spatial Evolution of Ore-Forming Fluid and Metallogenic Mechanism in the Jinwozi Gold Deposit,Beishan Metallogenic Belt. Diqiu Kexue - Zhongguo Dizhi Daxue Xuebao/Earth Science - Journal of China University of Geosciences, 2018, 43(9):3126-3140.
- Song, G. R. ,Zhai, X. W., Wang, E. T., et al. Properties of Ore-forming Fluids and Genesis of the Huaniushan Gold Deposit in the Gansu Province. Gold Science and Technology 2023, 31(06):873-887. (In Chinese).
- Zhang, Z. H., Zhang, j., Guo, Y. Z., et al. Integration and Application of New Technology of Physical and Chemical Prospecting for Typical Ore Deposits in Liuyuan Area, Gansu. Institute of Geophysical and Geochemical Exploration, Chinese Academy of Geological Sciences, 2014.
- Li, Y. and Oldenburg, D. W. 3-D inversion of magnetic data. Geophysics, 1996, 61(2): 394-408. [CrossRef]
- Li, Y. and Oldenburg, D. W. Joint inversion of surface and three-component borehole magnetic data. Geophysics, 2000, 65(2): 540-552. [CrossRef]
- Pilkington M. 3-D magnetic imaging using conjugate gradients. Geophysics, 1997, 62(4): 1132-1142. [CrossRef]
- Li, Y. and Oldenburg, D. W. Fast inversion of large-scale magnetic data using wavelet transforms and a logarithmic barrier method. Geophysical journal international, 2003, 152(2): 251-265. [CrossRef]
- Li, Y. and Oldenburg, D. W. ,3-D inversion of gravity data].Geophysics, 1998, 63(1): 109-117. [CrossRef]
- Tikhonov, A. N. On Determining Electric Characteristics of the Deep Layers of the Earth’s Crust. Doklady Akademiinauk SSSR,1950, 73(2): 295-297.
- Tikhonov, A. N, Arsenin V Y. SolutionofIll - Posed Problem. Washington: W H WinstonandSons, 1977.
- Wu, X. P. Rapid 3-D inversion of induced polarization data using conjugate gradient method. Coal Geology & Exploration, 2004, 32(5): 62-64.(In Chinese).
- Ruan B. Y., Murakami Y., Xu, S. H. Least Souare 2-D Inversion Method for Induced Polarization Data. Eaeth Science-Journal of China University of Geosciences, 1999, 24(6): 619-624.(In Chinese).
Figure 1.
Schematic diagram of the tectonic location of the Beishan orogenic belt (Based on Yang et al., 2010, Xiao et al., 2010; Wang et al., 2018; Song et al., 2023) [
9,
14,
15,
16]. It encompasses: (a) The geotectonic location map of the Beishan orogenic belt; (b) The fault distribution map of the Huaniushan lead-zinc-silver polymetallic deposit; (c) The geological sketch map of the Beishan area; (d) The geological map of the study area.
Figure 2.
Contour map of the residual bouguer anomaly of gravity in the Huaniushan lead-zinc-silver polymetallic deposit.
Figure 2.
Contour map of the residual bouguer anomaly of gravity in the Huaniushan lead-zinc-silver polymetallic deposit.
Figure 3.
Contour map of magnetic anomalies in the Huaniushan lead-zinc-silver polymetallic deposit.
Figure 3.
Contour map of magnetic anomalies in the Huaniushan lead-zinc-silver polymetallic deposit.
Figure 4.
TDIP probe layout of the Huaniushan lead-zinc-silver polymetallic deposit.
Figure 4.
TDIP probe layout of the Huaniushan lead-zinc-silver polymetallic deposit.
Figure 5.
Contour map of apparent polarization rate at various supply pole distances for the TDIP at the Huaniushan lead-zinc-silver polymetallic deposit. (a) AB = 2000 m; (b) AB = 2500 m; (c) AB = 3000 m; (d) AB = 3500 m; (e) AB = 4000 m.
Figure 5.
Contour map of apparent polarization rate at various supply pole distances for the TDIP at the Huaniushan lead-zinc-silver polymetallic deposit. (a) AB = 2000 m; (b) AB = 2500 m; (c) AB = 3000 m; (d) AB = 3500 m; (e) AB = 4000 m.
Figure 6.
Contour map of apparent resistivity at various power supply pole distances for the TDIP at the Huaniushan lead-zinc-silver polymetallic deposit. (a) AB = 2000 m; (b) AB = 2500 m; (c) AB = 3000 m; (d) AB = 3500 m; (e) AB = 4000 m.
Figure 6.
Contour map of apparent resistivity at various power supply pole distances for the TDIP at the Huaniushan lead-zinc-silver polymetallic deposit. (a) AB = 2000 m; (b) AB = 2500 m; (c) AB = 3000 m; (d) AB = 3500 m; (e) AB = 4000 m.
Figure 7.
3D inverse density model of the Huaniushan lead-zinc-silver polymetallic deposit.
Figure 7.
3D inverse density model of the Huaniushan lead-zinc-silver polymetallic deposit.
Figure 8.
Measured and forward ∆g fitted profile curves at x = 0 m for the gravitational 3d inversion model.
Figure 8.
Measured and forward ∆g fitted profile curves at x = 0 m for the gravitational 3d inversion model.
Figure 9.
3D inversion magnetization intensity model of the Huaniushan lead-zinc-silver polymetallic deposit.
Figure 9.
3D inversion magnetization intensity model of the Huaniushan lead-zinc-silver polymetallic deposit.
Figure 10.
Actual measurement and forward ∆T fitted profile curves at x = 0 m for the magnetic 3d inversion model.
Figure 10.
Actual measurement and forward ∆T fitted profile curves at x = 0 m for the magnetic 3d inversion model.
Figure 11.
3D inverse resistivity model of the Huaniushan lead-zinc-silver polymetallic deposit.
Figure 11.
3D inverse resistivity model of the Huaniushan lead-zinc-silver polymetallic deposit.
Figure 12.
3D inverse polarization rate model for the Huaniushan lead-zinc-silver polymetallic deposit.
Figure 12.
3D inverse polarization rate model for the Huaniushan lead-zinc-silver polymetallic deposit.
Figure 13.
Measured and forward apparent resistivity fitted profile curves of the tdip in the study area for different pole spacings of the L400 line: (a) AB = 2000 m; (b) AB = 2500 m; (c) AB = 3000 m; (d) AB = 3500 m; (e) AB = 4000 m.
Figure 13.
Measured and forward apparent resistivity fitted profile curves of the tdip in the study area for different pole spacings of the L400 line: (a) AB = 2000 m; (b) AB = 2500 m; (c) AB = 3000 m; (d) AB = 3500 m; (e) AB = 4000 m.
Figure 14.
Three-dimensional geological-geophysical model of the Huaniushan lead-zinc-silver polymetallic deposit.
Figure 14.
Three-dimensional geological-geophysical model of the Huaniushan lead-zinc-silver polymetallic deposit.
Figure 15.
Integrated geological and borehole interpretation profile of the L400 in the Huaniushan lead-zinc-silver polymetallic deposit (Modified from Yang et al., 2011).
Figure 15.
Integrated geological and borehole interpretation profile of the L400 in the Huaniushan lead-zinc-silver polymetallic deposit (Modified from Yang et al., 2011).
Figure 16.
Comprehensive profile of the L400 with gravity and magnetic exploration in the Huaniushan lead-zinc-silver polymetallic deposit. (a) Measured gravity and magnetic profile curve of the L400 line; (b) Gravity inversion profile of the L400 line; (c) Magnetic inversion profile of the L400 line. (The pink color indicates the ore body).
Figure 17.
Comprehensive TDIP exploration profile of the L400 in the Huaniushan lead-zinc-silver polymetallic deposit. (a) TDIP apparent resistivity profile curves of the L400 line measured at various polar distances; (b) Inverted resistivity section of the L400 line; (c) TDIP apparent polarizability profile curves of the L400 line measured at different polar distances; (d) Inverse polarizability cross-section of the L400 line. (The ore body is represented by the pink color).
Table 1.
Statistics of the mean values of the physical parameters of the surveyed geological targets [
17].
Table 1.
Statistics of the mean values of the physical parameters of the surveyed geological targets [
17].
| Target body |
Density
(g/cm3) |
Magnetic susceptibility(×10−6SI) |
Remanent
magnetization(×10−3A/m) |
Resistivity
(ohm.m) |
Polarization
(%) |
| Quantity |
Mean |
Quantity |
Mean |
Quantity |
Mean |
Quantity |
Mean |
Quantity |
Mean |
| Stratum |
564 |
2.741 |
567 |
245.3 |
567 |
19 |
481 |
707 |
478 |
4.0 |
| Rock mass |
184 |
2.629 |
183 |
1075 |
183 |
13 |
172 |
1257 |
172 |
1.0 |
| Carbonaceous-free formation |
445 |
2.733 |
446 |
218 |
446 |
6 |
373 |
1318 |
370 |
1.8 |
| Mineralization |
538 |
2.766 |
542 |
596 |
542 |
25 |
455 |
805 |
452 |
4.0 |
| Alteration |
93 |
2.785 |
92 |
610 |
92 |
10 |
82 |
2504 |
81 |
1.0 |
| Carbonaceous formation |
119 |
2.770 |
119 |
6084 |
119 |
1162 |
108 |
82 |
108 |
64.5 |
| Ore |
106 |
4.502 |
106 |
15118 |
106 |
913 |
102 |
24 |
102 |
68.3 |
|
Disclaimer/Publisher’s Note: The statements, opinions and data contained in all publications are solely those of the individual author(s) and contributor(s) and not of MDPI and/or the editor(s). MDPI and/or the editor(s) disclaim responsibility for any injury to people or property resulting from any ideas, methods, instructions or products referred to in the content. |
© 2024 by the authors. Licensee MDPI, Basel, Switzerland. This article is an open access article distributed under the terms and conditions of the Creative Commons Attribution (CC BY) license (http://creativecommons.org/licenses/by/4.0/).

