Preprint
Review

Optical Coherent Tomography Four Optical Couplers and Attenuator Balance System

Altmetrics

Downloads

64

Views

31

Comments

0

This version is not peer-reviewed

Submitted:

19 September 2024

Posted:

20 September 2024

You are already at the latest version

Alerts
Abstract
Optical Coherence Tomography (OCT) is a non-invasive diagnostic technique that renders an in vivo cross-sectional view of the retina. OCT utilizes a concept known as interferometry to create a cross-sectional map of the retina that is accurate to within at least 10-15 microns. Due to the transparency of the eye, OCT has gained wide popularity as an ophthalmic diagnostic tool. The OCT pictures of the retina are classified into “AMD, CNV, DRUSEN, DMR, DR, MH, CSR, and Normal Eye” using a lightweight deep neural network. There are two types of FD-OCT – swept-source OCT (SS-OCT) and spectral-domain OCT (SD-OCT) – both of which acquire spectral interferograms which are then Fourier transformed to obtain an axial scan of reflectance amplitude versus depth. Normal OCT features show a clear and defined retinal structure. The random forest algorithm is a robust ML algorithm that can be used to classify OCT images into four classes: choroidal neovascularization (CNV), deep margin elevation (DME), drusen, and normal. OCT (Optical coherent tomography) is an imaging method used to generate a picture of the back of the eyes and retinas. By using an interferometer, part of the light is directed to the sample and another portion is sent to a reference arm with a well-known length. Interferometers merge two or more sources of light to create interference patterns. We split the light into two beams that travel different optical paths and are combined to produce interference. Optical coherent tomography (OCT) generates sub-surface images of translucent or opaque materials at a resolution equivalent to a low power microscope. OCT build up clear 3D images of thick samples by rejecting background signals whilst collecting light directly reflected from a surface of interest. OCT systems use broadband sources and split light in a fiber coupler, first on a direct reference mirror, and as the sample is being measured. Balanced OCT systems can include additional attenuators at the detector arm to improve the detection efficiency.
Keywords: 
Subject: Physical Sciences  -   Optics and Photonics

1. Introduction

In this article, we discuss the optical coherent tomography four optical couplers and attenuator balance system. Optical coherence tomography (OCT) is a technique for obtaining sub – surface images of translucent or opaque materials of a resolution equivalent to a low – power microscope. Through the use of an interferometer, part of the light is directed to the sample and another portion is sent to a reference arm with a well-known length. OCT is analogous to an ultra sound scan, using light instead of sound waves. There are three main OCT technologies: Time domain, Spectral domain and Swept source OCT. Time domain OCT is a two dimensional imaging method based on low coherence interferometry that noninvasively produces cross sectional retinal images. By using time domain OCT, we can quantify the thickness of the retina and its different layers. The spectral domain OCT (SD – OCT) is a reliable, noninvasive, trans pupillary technique that provides high resolution cross sectional images of the retina and the optic nerve head by using a principle analogous to B – scan ultrasound [1,2]. In time domain OCT, the depth information of the retina is collected as a function of time by moving the reference mirror. In contrast, the reference mirror in spectral domain OCT is stationary. The light spectrum from the interferometer is detected by a spectrometer. Time domain OCT provides a large amount of data, but spectral domain affords exponentially more data because of its dramatically decreased acquisition times. Swept source OCT enables us to previously visualize choroidal structure and produces a broad bandwidth in an optical setup which helps to obtain the optical reflections required for imaging the structure. A basic OCT system consists of a simple Michelson interferometer in both a bulk optic or fiber optic version. The benefits of OCT systems come across the fact that they use light waves to take cross-section pictures of the retina. With OCT, our ophthalmologist can see each of the retina’s distinctive layers. This allows the ophthalmologist to map and measure their thickness. These measurements help with medical diagnosis.

2. OCT System Coherence, Interference and Noises

A basic OCT system consists of a simple Michelson interferometer in both a bulk optic or fiber optic version. There is source light (1) which is split in a fiber coupler. One part of the light is directed at a reference mirror (2) and the other part at the sample (3) being measured. The light reflected back from the sample (4) and reference arm (5) then pass through the beam splitter again (6) and is collected by the detector (Figure 1).
Signals are detected when the optical path length in the sample and reference arm are within the coherence length of the source. A difference in the refractive index in the sample causes light to be reflected and the detector to detect the interference signal. Moving the fiber over the sample in two transverse directions produces a 3D image. The detector detects interference signals if the difference in the refractive index in the sample causes light to be reflected. In any OCT system noise is a crucial parameter when designing the system to achieve high resolution and large penetration depths. There are two types of OCT systems, unbalanced and balanced systems. An unbalanced OCT system contains a Michelson interferometer and the coherent part of the power backscattered from the sample is impinging on the detector. The balanced OCT system can be seen as an extension of the unbalanced system. There is double detection due to two more beam splitters. Balanced systems can have an additional beam splitter for power [3,4]. In our OCT we are dealing with the coherence properties of light. We consider light as electromagnetic radiation E = E 0 e i ( k r ω t + ϕ ) . It is wave trains with different lifetime, where the average lifetime is τ 0 (coherence time). The wave trains are characterized by light production as random processes with different phases. The source of light produces light with frequencies ω within a specific frequency spectrum. Fourier domain gives Δ ω = 2 π τ 0 , where, Δ ω is the spectral line width. If our source is broadband then Δ ω value big and the coherence time τ 0 is short. The coherence length ( l t ) for the wave train is defined as l t = c τ 0 where c is the speed of the wave. Inserting the expression for coherence time τ 0 for the coherence length gives l t = c 2 π Δ ω   ;   Δ v = Δ ω 2 π where v is the optical frequency and v 0 = c λ 0 . By using differential approximation Δ d we get Δ v Δ λ | d v d λ | = c λ 2 , where Δ λ represents the linewidth and λ 0 is the center wavelength ( l t λ 0 2 Δ λ ). OCT systems include an interferometer which merges, in our case, two sources of light to create an interference signal. We know that a difference in refractive index in the sample causes the light to reflect and the detector detects an interference signal. We consider two sources of light E 1 ( r , t ) and E 2 ( r , t ) which are from the same source and travel different paths. The beams meet at point P which represents the detector. One beam travels an extra time τ and the field at point P (detector) is E p ( t ) = E 1 ( r , t ) + E 2 ( r , t + τ ) .
For E 1 ( r , t ) = E 01 e i ( k r ω t + ϕ ) and E 2 ( r , t ) = E 02 e i ( k r ω ( t + τ ) + ϕ ) we get E p ( t ) = E 01 e i ω t + E 02 e i ω ( t + τ ) for r = 0   ;   ϕ = 0 . The Poynting vector (electric and magnetic fields at point P) is S = ε 0 c 2 E p × B p . The power unit area (irradiance) I p is measured by a detector at P and it is a time average of S equals to I p = | S | = ε 0 c 2 | E p × B p | . If fields E and B are orthogonal then | E | = c | B | . This gives
I p = ε 0 c | E p | 2 = ε 0 c E p E p *
I p = ε 0 c | E 1 | 2 + | E 2 | 2 + E 1 E 2 * + E 2 E 1 *
The irradiances of the beams are I 1 and I 2 then
I p = I 1 + I 2 + 2 Re E 1 ( t ) E 2 * ( t + τ )
If the two beams have the same polarization the dot product maximizes E 1 ( t ) E 2 * ( t + τ ) = E 1 ( t ) E 2 * ( t + τ ) . We define correlation function Γ 12 ( τ ) and a normalized correlation function γ 12 ( τ ) .
Γ 12 ( τ ) = E 1 ( t ) E 2 * ( t + τ )   ;   γ 12 ( τ ) = Γ 12 ( τ ) I 1 I 2
I p = I 1 + I 2 + 2 I 1 I 2 Re [ Γ 12 ( τ ) ]
We define S ( v ) as a normalized power spectral density of the light source and define the normalized correlation function γ 12 ( τ ) as γ 12 ( τ ) = 0 S ( v ) e i 2 π v τ d v . The complex degree of the normalized correlation function γ 12 ( τ ) is a Fourier transform of the power spectrum. For power spectral densities (PSD) even function of v v 0 , we have complex coherence real valued factor γ 12 ( τ ) = γ 12 ( τ ) e i 2 π v 0 τ .
The power unit area (irradiance) I p can be expressed as
I p = I 1 + I 2 + 2 I 1 I 2 γ 12 ( τ ) cos ( 2 π v 0 τ )
The intensity I p varies sinusoidal with τ (beam extra time parameter) and is modulated by the envelope function γ 12 , a normalized correlation function. The envelope function γ 12 is determined by the Fourier transform of the spectrum. If we define τ 0 as a constant coherence time then for a harmonic wave with frequency ω 0 we get Re [ γ 12 ( τ ) ] = ( 1 τ τ 0 ) cos ( ω 0 τ ) for τ τ 0 and the power unit area (irradiance) I p is
I p = I 1 + I 2 + 2 I 1 I 2 ( 1 τ τ 0 ) cos ( ω 0 τ )
We define Δ l as the difference in optical path lengths for the two beams, λ 0 is the wavelength of the waves, then the wave number is k 0 = 2 π λ and τ = Δ l c , l t is the coherence length ( l t = τ 0 c ). The power unit area (irradiance) I p is
I p = I 1 + I 2 + 2 I 1 I 2 ( 1 Δ l l t ) cos ( k 0 Δ l )
For τ > τ 0 the interference term vanishes (random phase variations cancel out) and the power unit area (irradiance) I p is I p = k = 1 2 I k . For 1 Δ l l t > 0 exists Δ l l t < 1 Δ l < l t . It is the condition for observing interference fringes in the OCT system detector unit ( Δ l < l t ). We define γ 12 ( τ ) = 1 Δ l l t for constant coherence time τ 0 . Optical coherence tomography (OCT) is susceptible to coherent noise. The speckle noise deteriorates the contrast and fine structure of OCT images. It imposes significant limitations on the diagnostic capability of OCT. The SNR in OCT systems is defined as the ratio of the average signal intensity to the standard deviation of the noise intensity. In our OCT system, the measured signal contains noise ( I s m e a s ). If we define the signal as current ( I s r e a l ) then I s m e a s = I s r e a l + I n o i s e , I s r e a l is the true signal and I n o i s e is defined the noise signal as current. We know that any constant property of noise in OCT systems does not affect the qualitative property of the image. If we assume the noise is random then the time average of the noise must be zero ( random   noise   signal = 0 ). We measure the noise in root mean square standard deviation ( σ ) or mean square variance ( σ 2 ). For OCT systems the noise current signal is σ i 2 = I n o i s e 2 . We measure the noise N times in our OCT system, I n o i s e , n is the nth noise measurement then σ i 2 = 1 N n = 1 N ( I n o i s e , n ) 2 . To obtain a good image of the object using our OCT system, high contrast is needed to distinguish different features. If the optical path difference (OPD) between the mirror and the object of interest is zero then the OCT detection system generates a signal current I s , max [5,6]. If the optical path difference (OPD) increases above the coherent length ( OPD l t ) then the detector no longer measures the true signal ( I s r e a l ) but the noise σ i 2 inherent in the system. We can achieve high contrast in our OCT system if the signal current is dominant compared to the noise. The definition of SNR in OCT systems is SNR = I s 2 σ i 2 . The maximum interference signal ( I s , max ) indicates the location of the change in the refractive index in the medium, SNR = I s , max 2 σ i 2 . The SNR expression in dB is SNR = 10 log 10 [ I s , max 2 σ i 2 ] . The total OCT system detector photocurrent variance is a summation of three independent terms σ r e 2 , σ s h 2 , and σ e x 2 , σ i 2 = σ r e 2 + σ s h 2 + σ e x 2 where σ r e 2 is the receiver noise, σ s h 2 is the photon shot noise, and σ e x 2 is the excess intensity noise. The detector signal photocurrent ( I s ) is the coherent part of the signal backscattered from the sample and it is given by
I s = 2 ρ P r P s γ 12 ( τ ) cos ( 2 π v 0 τ ) , where ρ is the detector responsivity, P r is the power impinging on the photodetector reflected from the mirror and P s is the coherent portion of the power incident on the photodetector backscattered from the sample. The maximum function value ( I s , max ) is for τ = 0 then the maximum squared signal photocurrent in a OCT system single detector is defined as I s , max 2 = 4 ρ 2 P r P s . If we use an OCT balanced system, for the balanced receiver the total photocurrent is the sum of the photocurrent in each detector and the maximum squared signal photocurrent is I s , max 2 = 16 ρ 2 P r P s . We define the OCT system receiver noise as the noise in the detector. The receiver noise consists of shot noise, thermal noise, amplifier noise and temperature noise. The shot noise is caused by the background light and the dark current in the OCT system detector. It is a small noise compared to other noises and can be neglected. The thermal noise terms ( σ t h 2 ) come from the random thermal motion of electrons in a conductor and it is expressed as σ t h 2 = 4 1 R e f f k B T B where k B is Boltzmann’s constant, T is the temperature in Kelvin, B is the detection bandwidth, and R e f f is the effective load resistance. The temperature noise ( Δ Φ t e m p 2 ) is produced by the random fluctuations in temperature due to the statistical nature of heat transfer between the OCT detector and its environment. The temperature noise is expressed as the mean square radiant power fluctuations Δ Φ t e m p 2 = 4 k B T 2 K B ; K = 4 ε σ T 3 A , where ε is the permeability, σ is the Stefan – Boltzmann’s constant, and A is the OCT detector area. The amplifier noise is given by σ a m p 2 = 4 1 R e f f G 2 k B ( T A + T D ) B , where G is the gain of the amplifier, T A is the amplifier noise temperature, T D is the noise temperature of the detector load resistance. Photon shot noise is arising from the signal caused by quantization of the light. The random arrival photons are detected as noise ( σ s h 2 ) and is expressed as σ s h 2 = 2 q I d c B , where q is the electron charge ( q = 1.60217663   ×   10 19 coulombs), I d c is the mean detector photocurrent and it is given by I d c = ρ ( P r + P x ) , ρ is the detector responsivity, P r is the power impinging on the photodetector reflected from the mirror, P x is the power of the incoherent light backscattered from the sample and arriving the OCT detector. The excess intensity noise caused from the time fluctuations of the intensity and is expressed by σ e x 2 = ( 1 + V 2 ) I d c 2 B 1 Δ v , where V is the source degree of polarization, Δ v is the effective linewidth of the source, Δ v = c Δ λ λ 0 2 π 2 ln ( 2 ) , where Δ λ is the FWHM (Full Width at Half Maximum) wavelength bandwidth of the spectrum. In the case we don’t neglect the shot noise then we get the total photocurrent variance which constructed from three elements:
Receiver noise ( σ r e 2 ), photon shot noise ( σ s h 2 ), and excess noise ( σ e x 2 ). The outcome is the OCT detector total photocurrent variance σ i 2 = σ r e 2 + σ s h 2 + σ e x 2 . It is also the OCT balanced system total photocurrent variance ( σ i 2 = σ r e 2 + σ s h 2 + σ e x 2 ).

3. OCT Unbalanced System

The unbalanced OCT system contains a Michelson interferometer and the coherent part of the power backscattered from the sample is impinging on the detector.
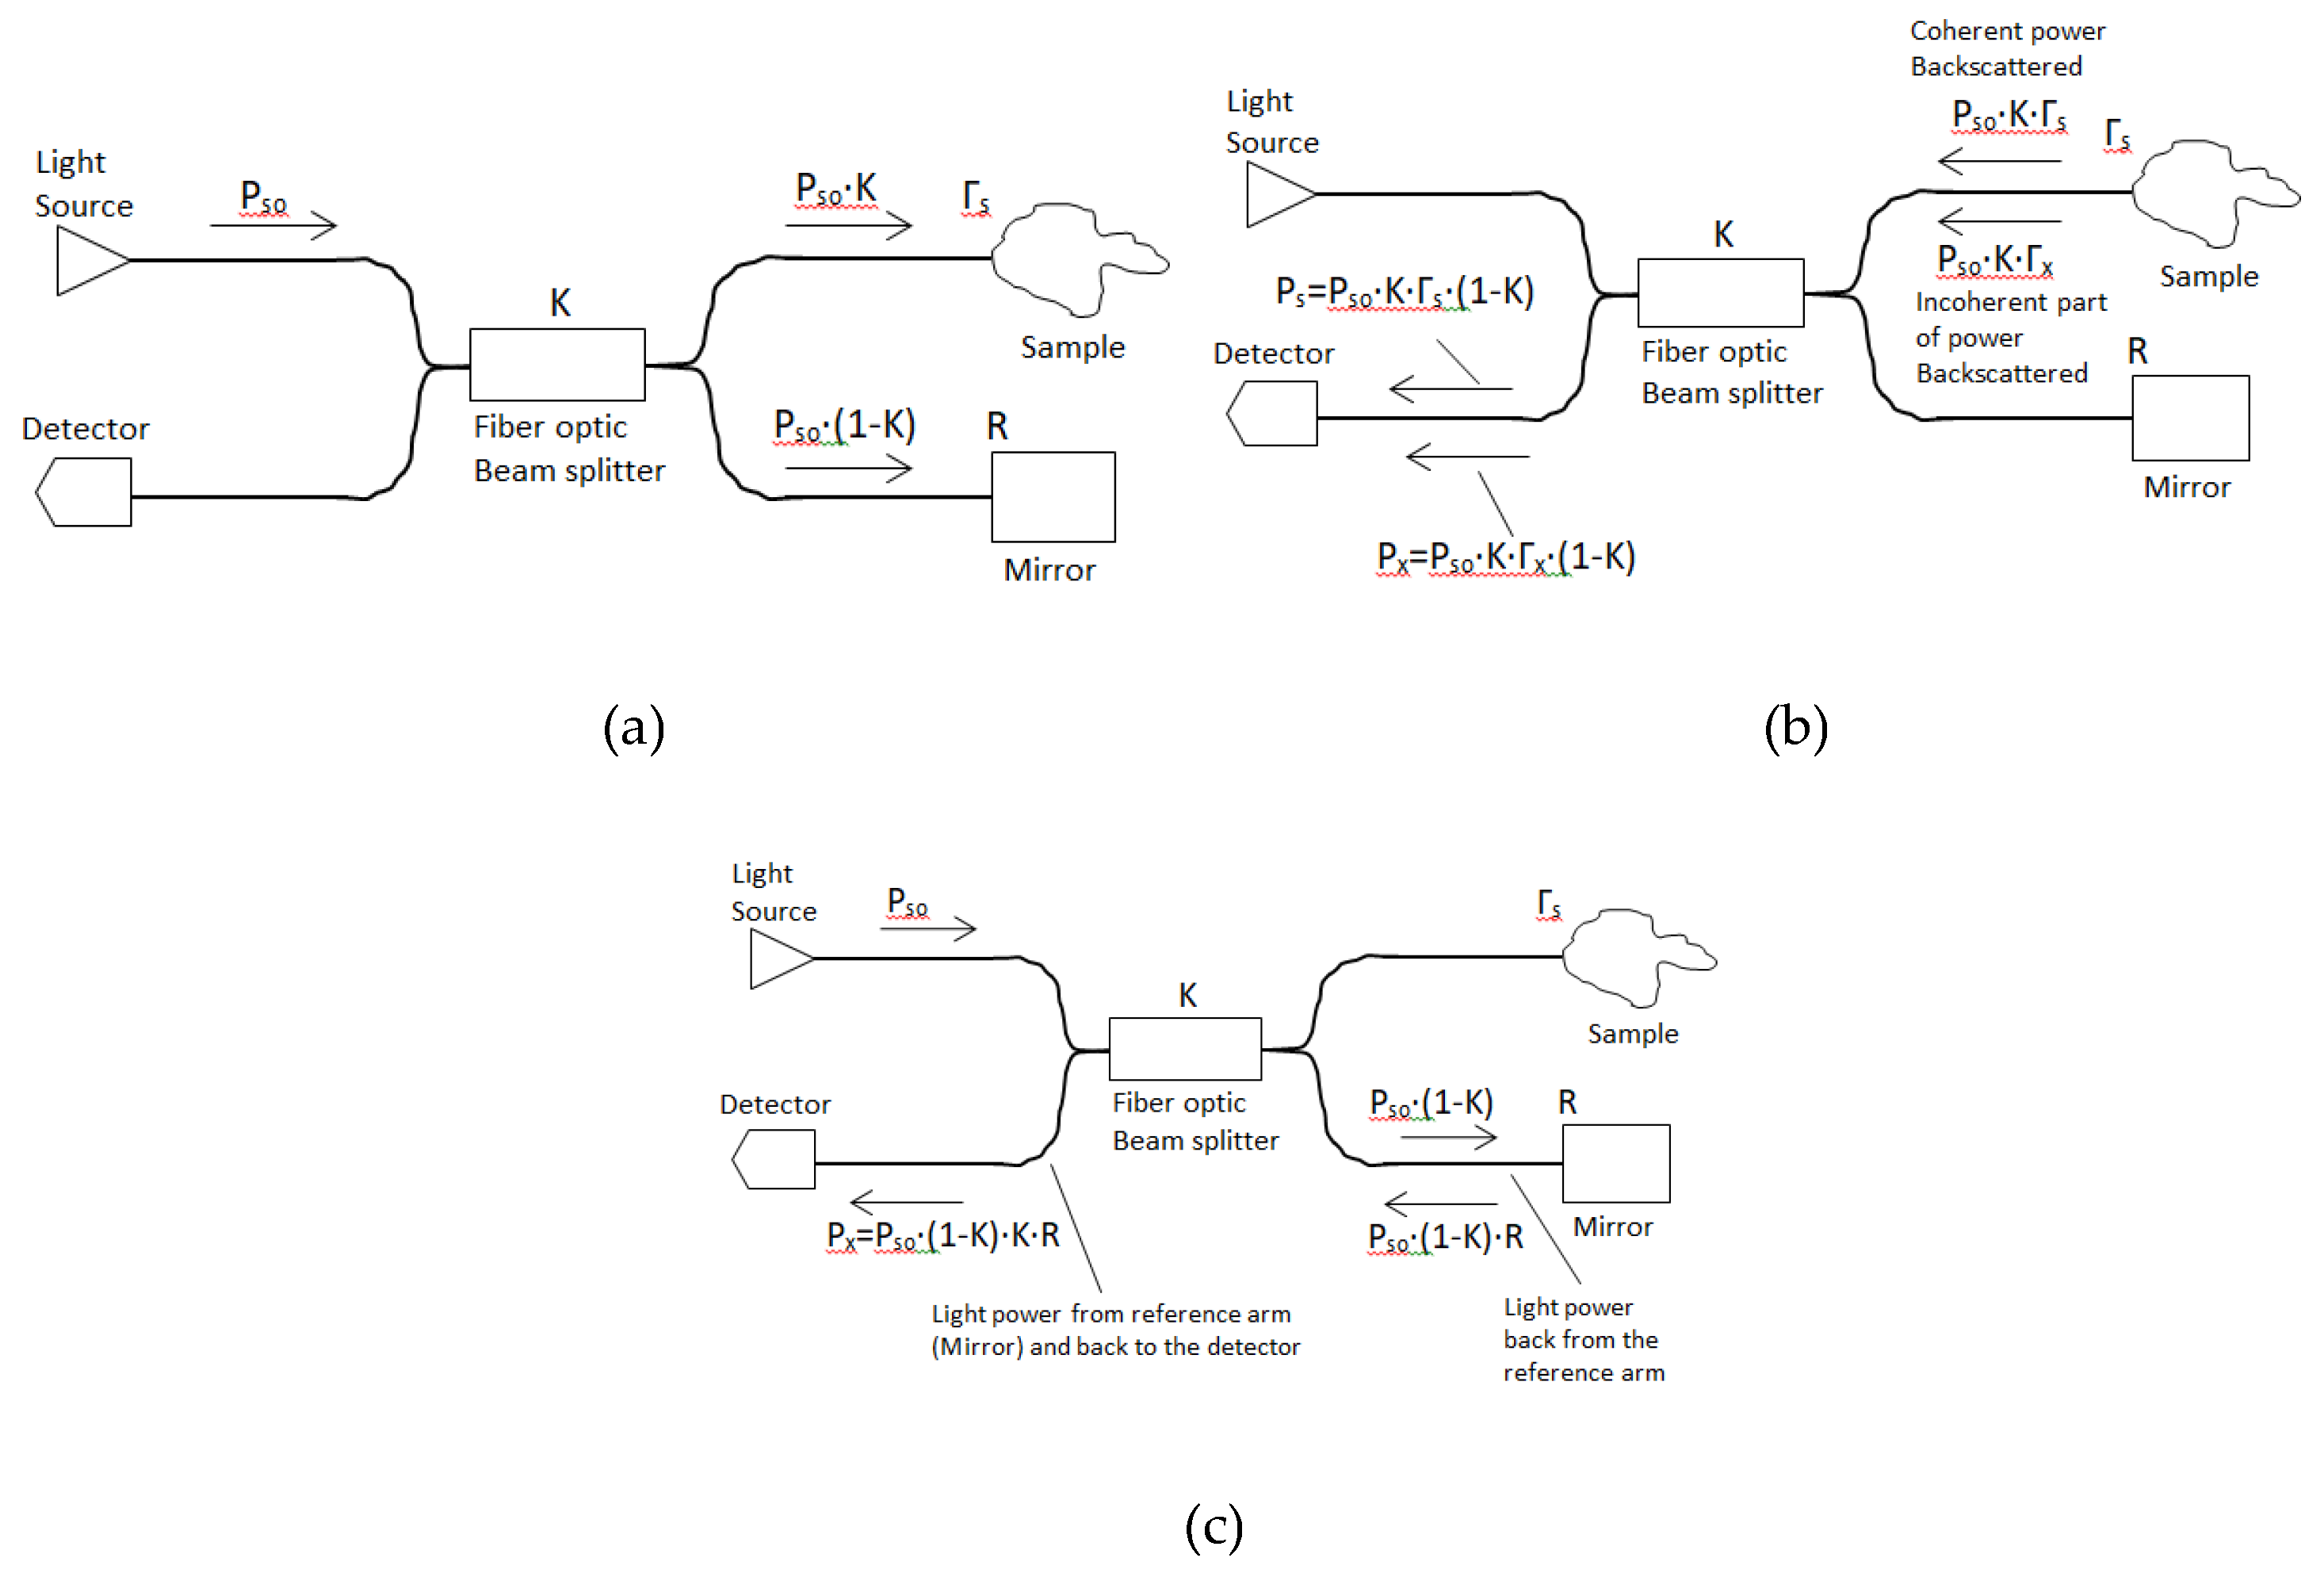
Unbalanced OCT configurations have optimized reference arm attenuation. The decision as to which type of OCT system to use (unbalanced or balanced) is dependent on the receiver noise, the fiber optic end reflection R, and the power to the object. There are many parameters to consider including the confocal optical sectioning interval of the OCT system. The interferometer is implemented by a fiber coupler whose operation is based on splitting an incident light beam into two parts. Then, the beams are recombined together to create an interference pattern which recovers information about the inspected object. In Michelson interferometers the reference beam is reflected by a fixed mirror, while the sensing beam is reflected by a moving mirror. The interference pattern enables recovery of the displacement of the mirror, as each interference fringe corresponds to a λ 2 displacement, where λ is the wavelength of the used light source. The Michelson interferometer is implemented in our OCT system by fiber optic (FO) beam splitter/combiner. The coherent part of the power backscattered from the tissue sample and impinging on the detector is P s , and given by P s = P s o K ( 1 K ) Γ s , where K is the splitting ratio and P s o is the power of light from the source light. Γ s is the reflection coefficient of the sample (fraction of the backscattered light) and is coherent with the reference light. The incoherent light part of the power backscattered from the sample and arriving at the detector is P x , P x = P s o K ( 1 K ) Γ x where Γ x is the reflection coefficient of the tissue sample (fraction of backscattered light), and is incoherent with the reference light [7,8]. The ongoing power in OCT systems after the fiber optic beam splitter is presented in Figure 2a and the back power light from the sample tissue after reflection back to the detector is presented in Figure 2b.
The light power from the reference arm (with mirror) is measured at the detector, P r , and is equal to P r = P s o ( 1 K ) K R , where R is the mirror reflectivity. The light power split by the fiber optic beam splitter to the reference arm (mirror) and back to the detector is presented Figure 2c.
Since the shot noise is σ s h 2 = 2 q I d c B , for our unbalanced OCT system I d c = ρ ( P r + P x ) , then σ s h 2 = 2 q ρ ( P r + P x ) B . The excess intensity noise is σ e x 2 = ( 1 + V 2 ) I d c 2 B 1 Δ v . The receiver (detector) noise for an OCT unbalanced or balanced system is σ r e 2 = ( 3 p A / H z ) 2 B . The optimal splitting ratio ( K ) is achieved by derivative P s K = 0 , then P s K = P s o Γ s ( 1 2 K ) and K = 1 2 to maximize the power ( P s ). The power from the reference arm (mirror), P r , gives the same result. Both power from the sample and reference pass the coupler once in each direction.

4. OCT Balanced System

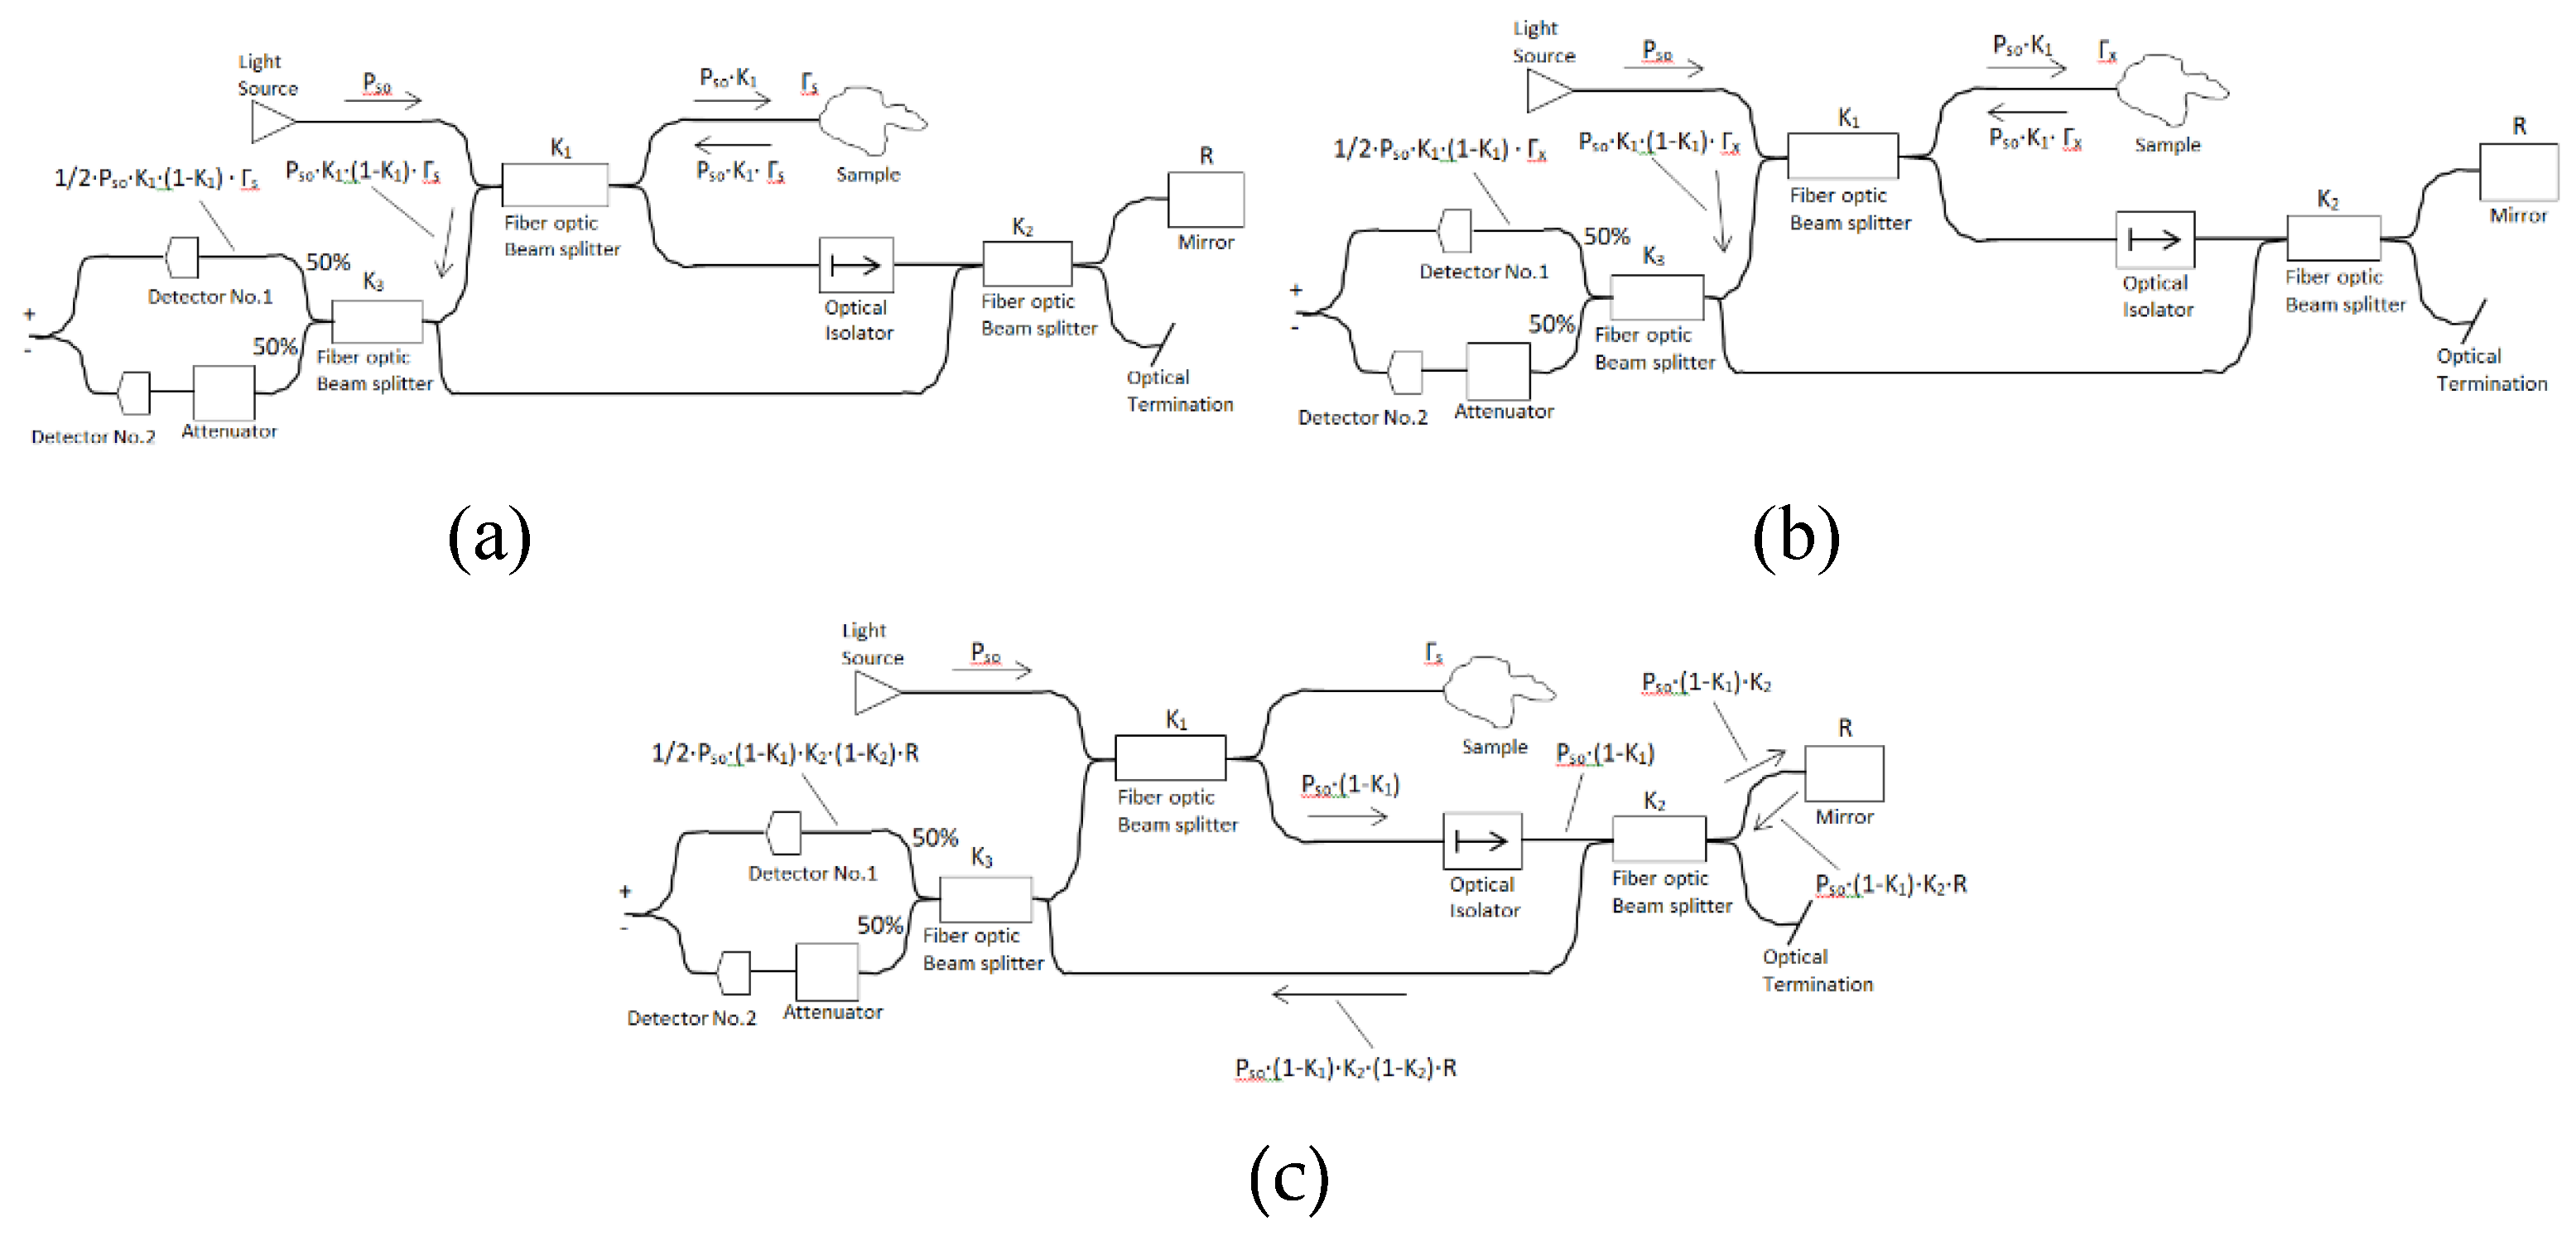
The improved OCT systems are balanced systems which contain additional elements. Namely, two more beam splitters for double detection. The OCT system SNR value can be improved by implementing a balanced detection scheme. It reduces any common mode noise which originated from the reference and sample arms. All OCT balanced systems beam splitters split beams (laser beams) into two beams. They typically come in the form of a reflective device which split beams into exactly 50/50, with half of the beam being transmitted through the splitter and the other half reflected. The OCT balanced system includes three beam splitters ( K 1 , K 2 , and K 3 ), optical isolator (device that allows light to propagate through it in one direction only), end mirror (R), sample, and two detectors (one with attenuator in front). P s is the coherent part of the optical power backscattered from the tissue sample and detected by the detector. The expression for P s is P s = 1 2 P s o K 1 ( 1 K 1 ) Γ s where P s o is the power of light from the source light and Γ s is the reflection coefficient of the sample (coherent with the reference light). The 1 2 number comes from the fact that the beam splitter K 3 transfers only half of the optical power to optical detector No.1 (Figure 3a).
P x is the incoherent light part of the power backscattered from the sample and arriving at the detector. The expression for P x is P x = 1 2 P s o K 1 ( 1 K 1 ) Γ x Where, P s o is the power of light from the source light and Γ x is the reflection coefficient of the tissue sample, incoherent with the reference light (Figure 3b).
P r is the power from the reference arm (mirror) and it passes through beam splitters K 1 and K 2 , back to the detector through beam splitter K 3 , R is the mirror reflectivity. The expression for P r is P r = 1 2 P s o ( 1 K 1 ) K 2 ( 1 K 2 ) R (Figure 3c).
We use an optical isolator between beam splitters K 1 and K 2 to avoid power back from the mirror arriving at beam splitter K 1 which would cause additional shot and beat noises. The pre factor 50% is the splitting ratio K 3 and is chosen to assure that the noise intensity is suppressed. The shot noise in our system is
σ s h 2 = 4 q I d c B = 4 q ρ ( P r + P x ) B   ;   I d c = ρ ( P r + P x )
σ s h 2 = 2 q ρ ( 1 K 1 ) P s o [ K 2 ( 1 K 2 ) R + K 1 Γ x ] B
The beat noise in our system is
σ b e 2 = 8 ( 1 + V 2 ) ρ 2 P r P x B 1 Δ v
σ b e 2 = 2 ( 1 + V 2 ) ρ 2 P s o 2 ( 1 K 1 ) 2 K 1 K 2 ( 1 K 2 ) R Γ x B 1 Δ v
Beat noise is a spontaneous signal emission and it is generated by mixing between the optical signal and ASE noise. Amplified Spontaneous Emission (ASE) produced by spontaneous emission that has been optically amplified by the process of stimulated emission in a gain medium. It is inherent in the field of random processes. There is attenuation in OCT systems, which is related to the absorption by the tissue. Attenuation decreases the signal intensity when passing through the tissue due to absorption by the tissue [9,10]. The attenuation determines the penetration depth of the optical signal into the tissue. High attenuation tissues have very low penetration depth and poor visibility of deeper structures.
The optical signal passes the attenuator before arriving at optical detector No.2. It can improve the detection efficiency; the common-mode rejection is maximized when the power in the reference input of the detector is two times that in the signal input. p i n is the input optical power to the attenuator and p o u t is the output optical power of the attenuator. The ratio ξ = p i n p o u t   ;   p i n > p o u t , ξ is defined as the ratio of the power of two signals p i n and p o u t . The attenuation in dB is A attn ( dB ) = 10 log 10 ( ξ ) . The Attenuation factor (AF) is defined as AF = 1 ξ and 0 < AF < 1 . By adding an attenuator to our system the photo current ( I s ) is replaced by
I s = 2 ( 1 + d ) ρ P s P r γ 12 ( τ ) cos ( 2 π v 0 τ )
I s = ( 1 + d ) ρ P s o ( 1 K 1 ) K 1 K 2 ( 1 K 2 ) Γ s R γ 12 ( τ ) cos ( 2 π v 0 τ )
Where d is the attenuation factor, the maximum squared value for photocurrent is I s , max 2 = 4 ( 1 + d ) 2 ρ 2 P s P r . We know that the condition for observing interference fringes in the OCT system detector unit ( Δ l < l t ), where γ 12 ( τ ) = 1 Δ l l t and the maximum squared value for photocurrent is accepter for Δ l l t then γ 12 ( τ ) 1 . The shot noise is
σ s h 2 = ( 1 + d ) 2 q ρ ( P r + P x ) B , the beat noise is
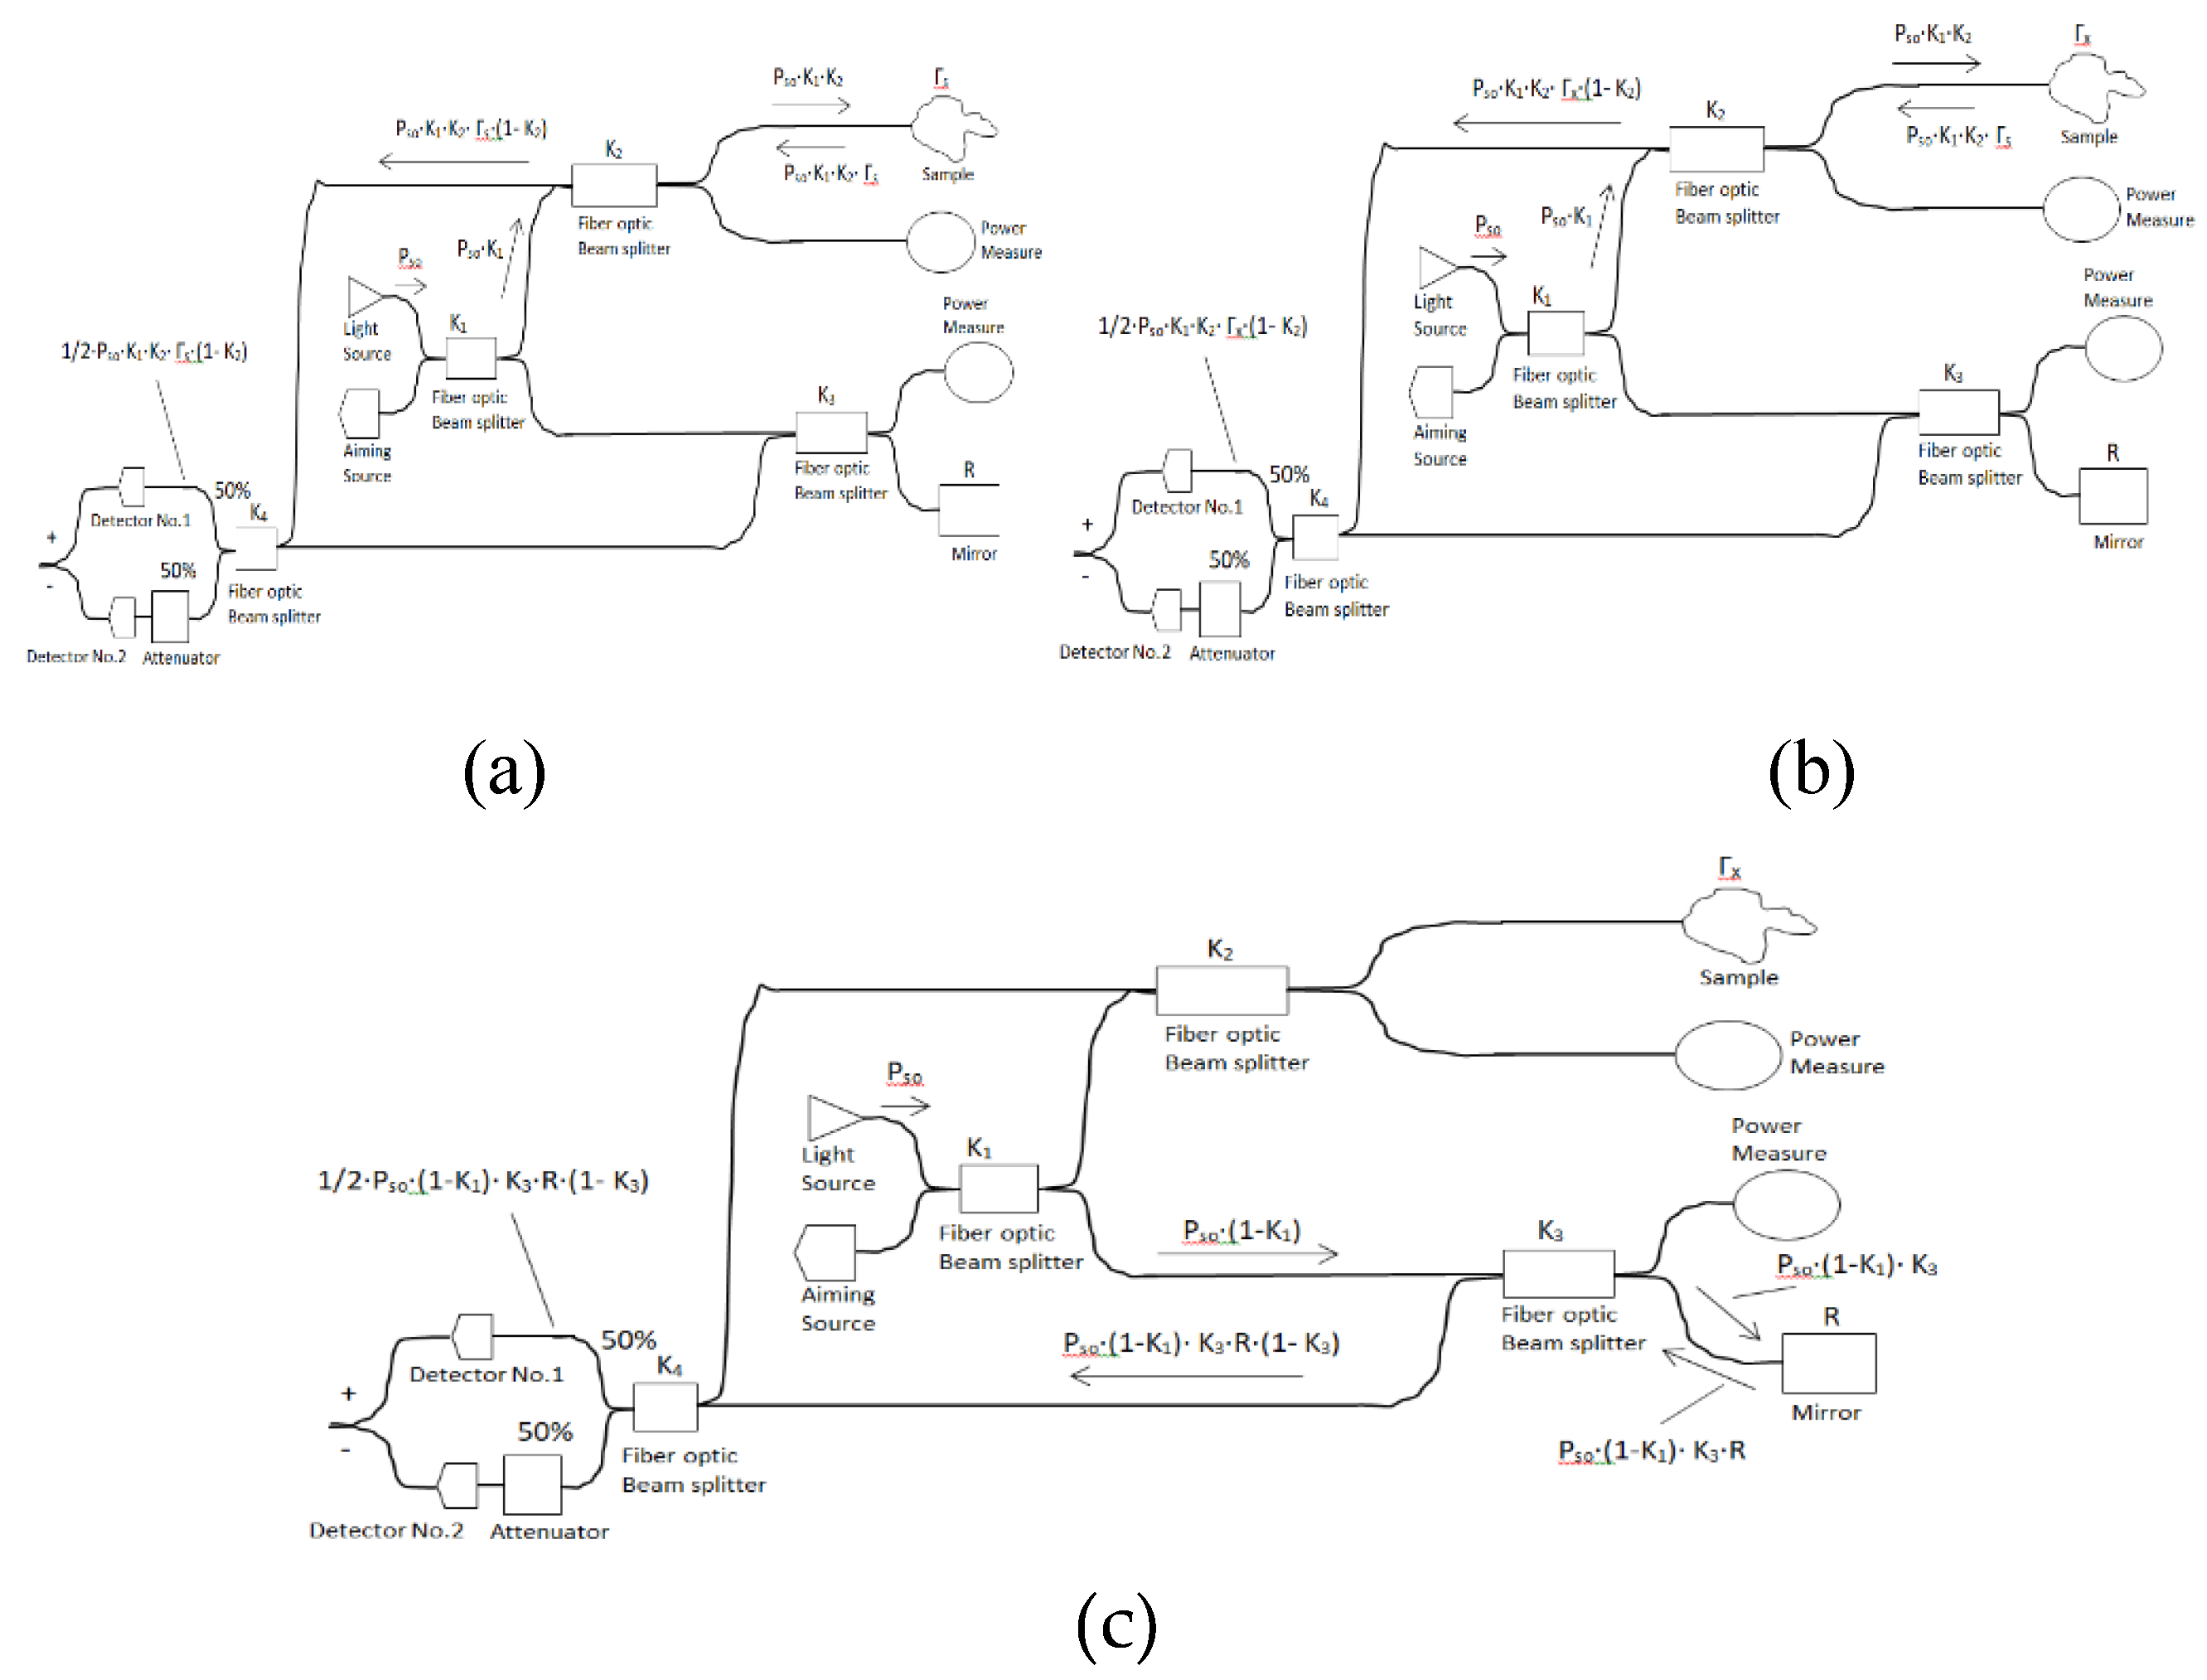
σ b e 2 = ( 1 + d ) 2 2 ( 1 + V 2 ) ρ 2 P r P x B 1 Δ v . Another type of balanced system has four beam splitters which entails an additional loss of power. We have the benefit that the length of the reference and sample arms is the same. The sample arm focuses into the tissue being observed, and the reference arm reflects back from a flat optical mirror. We take the beam splitter coefficient K 4 as 50% in our four beam splitters architecture. The coherent part of optical power backscattered from the tissue sample and detected by the detector is P s and equal to P s = 1 2 P s o K 1 K 2 ( 1 K 2 ) Γ s (Figure 4a).
The incoherent part of optical power backscattered from the tissue sample and detected by the detector is P x and equal to P s = 1 2 P s o K 1 K 2 ( 1 K 2 ) Γ x (Figure 4b).
The back power light from the reference arm (mirror) is first transmitted from the source ( P s o ), passing the first beam splitter ( K 1 ), then the third beam splitter ( K 3 ), and back to fourth beam splitter ( K 4 = 50 % ) before detection by the photodetector. The power from the reference arm (mirror) which heats the detector is P r , P r = 1 2 P s o ( 1 K 1 ) K 3 R ( 1   K 3 ) (Figure 4c)

5. OCT Balanced System Four Beam Splitters and attenuator Numerical simulation

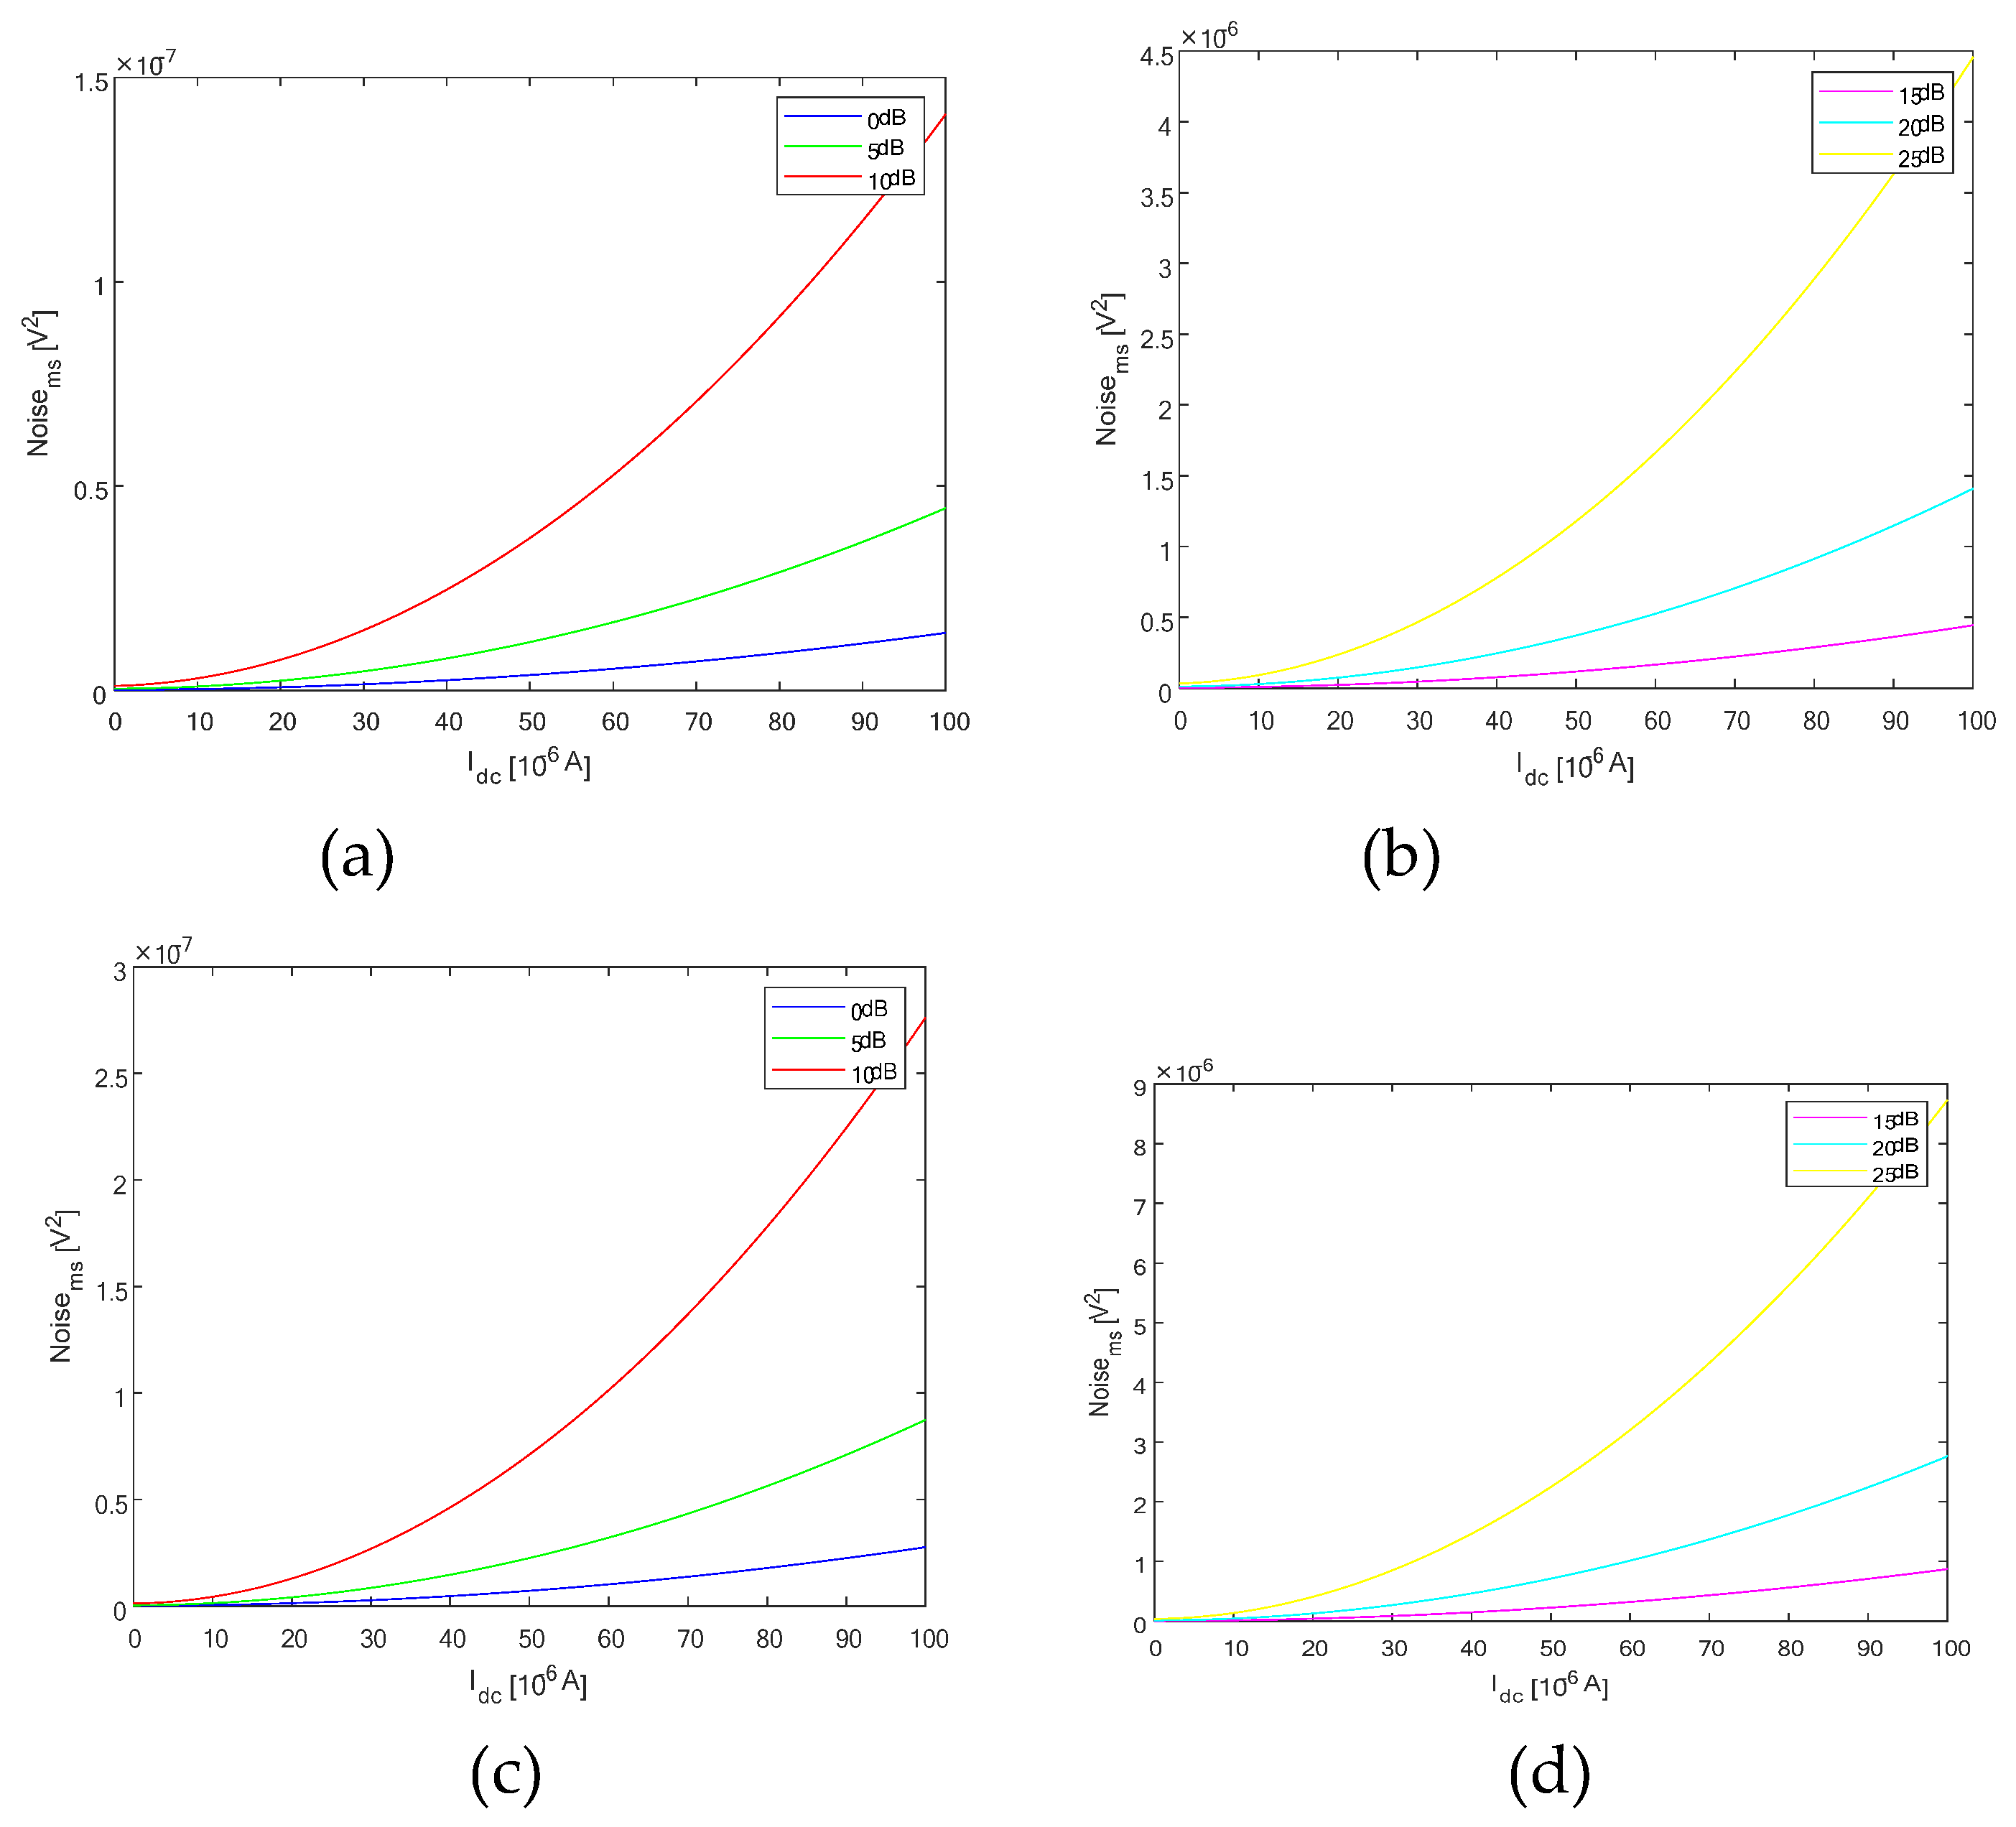
The OCT balanced system is constructed from light source power ( P s o ), sample tissue, four beam splitters ( K 1 , K 2 , K 3 , and K 4 ), attenuator, aiming source unit, mirror ( R ), two power measure units, and two detectors. The light source is SuperLum with optical bandwidth equal to 60 nm ( Δ λ = 60 × 10 6   m ). SuperLum is a powerful light source based on a super luminescent diode (SLD). SLD is a semiconductor emitter combining the high brightness of laser diodes with a broad spectrum of LEDs. SLD light sources can fit many applications based on low coherence measurements, spectroscopy, low speckle illumination, and others [11,12]. The optical detector electrical detection bandwidth is equal to 10 kHz ( b = 10 × 10 3   Hz ). The optical detector electrical detection bandwidth ( b ) is a measure of how fast the photodetector can respond to a series of incident light pulses. The enhanced intensity noise spectrum from the receiver electrical bandwidth is the cause of system performance degradation. We analyzed our system for different degree of polarization of the source. The noise is measured for I d c varying from 0 to 100 uA in steps of 0.5uA. The m define the type of couplers/splitter where used m/(100-m) couplers/splitter, and in our case is equal to 50%. For a 50/50 coupler we get I r = I x = 1 2 I d c . The attenuator before the optical detector has attenuation of 6 dB, the optical power attenuation A attn ( dB ) is equal to A attn ( dB ) = 10 log 10 ( P s P d ) , where ξ = P s P d , P s is attenuator unit input power and P d is attenuator unit output power P s > P d . The attenuator factor (AF) is defined as A F = P D P S = 1 ξ , equal for 6dB attenuation to 0.2512 (d=0.2512). The detector responsivity ( ρ ) is taken as one ( ρ = 1 ). The detector responsivity is a measure of input/output gain of the detector in a Fiber optic (FO) system, and is a measure of photocurrent responsivity per incident unit of optical power [A/watt]. Commercial manufactures of optical detectors give plots of detector responsivity as a function of wavelength. The estimated impedance factor (converting system current to voltage) is taken as 0.035 V/A. The noise of I d c (mean detector photocurrent) is calculated and equal to 6 dB (0.2512) attenuation in our OCT balanced system and is equal to σ i 2 = σ r e 2 + σ s h 2 + σ e x 2   ;   σ e x 2 = σ b e 2 which is a summation of three terms σ r e 2 (receiver noise), σ s h 2 (photon shot noise) and σ b e 2 (beat noise). The related equations are σ r e 2 = ( 3 p A / H z ) 2 b where 3 p A / H z = 3 × 10 12 , b is electrical detection bandwidth ( b = 10   kHz ), ρ = 1 A/watt, q = 1.6 × 10 19 coulomb , σ s h 2 = ( 1 + d ) 2 q ρ ( I r + I x ) b , σ b e 2 = 4 ( 1 + d ) ( 1 + V 2 ) ρ 2 I r I x b 1 Δ v . The amplification of our system affects the final noise, for amplification of 0dB, 5dB, 10dB, 15dB, 20dB, and 25dB, the calculated noise is multiplied by the appropriate amplification factor A amp - dB = 10 [ A amp - factor 10 ] . The calculated noise is also multiplied by the impedance factor (0.035 V/A) [13,14]. For our OCT balanced system four beam splitter and attenuator, plots of noise as a function of Idc (unpolarized), at amplifications of 0dB, 5dB, and 10dB are presented (Figure 5a).
For our OCT balanced system four beam splitter and attenuator, plots of noise as a function of Idc (unpolarized), at amplifications of 15dB, 20dB, and 25dB are presented (5b).
The OCT balanced system four beam splitter and attenuator Noise vs Idc (polarized), amplification 0dB, 5dB, and 10dB is presented (Figure 5c).
For our OCT balanced system four beam splitter and attenuator, plots of noise as a function of Idc (polarized), at amplifications of 15dB, 20dB, and 25dB are presented (Figure 5d).
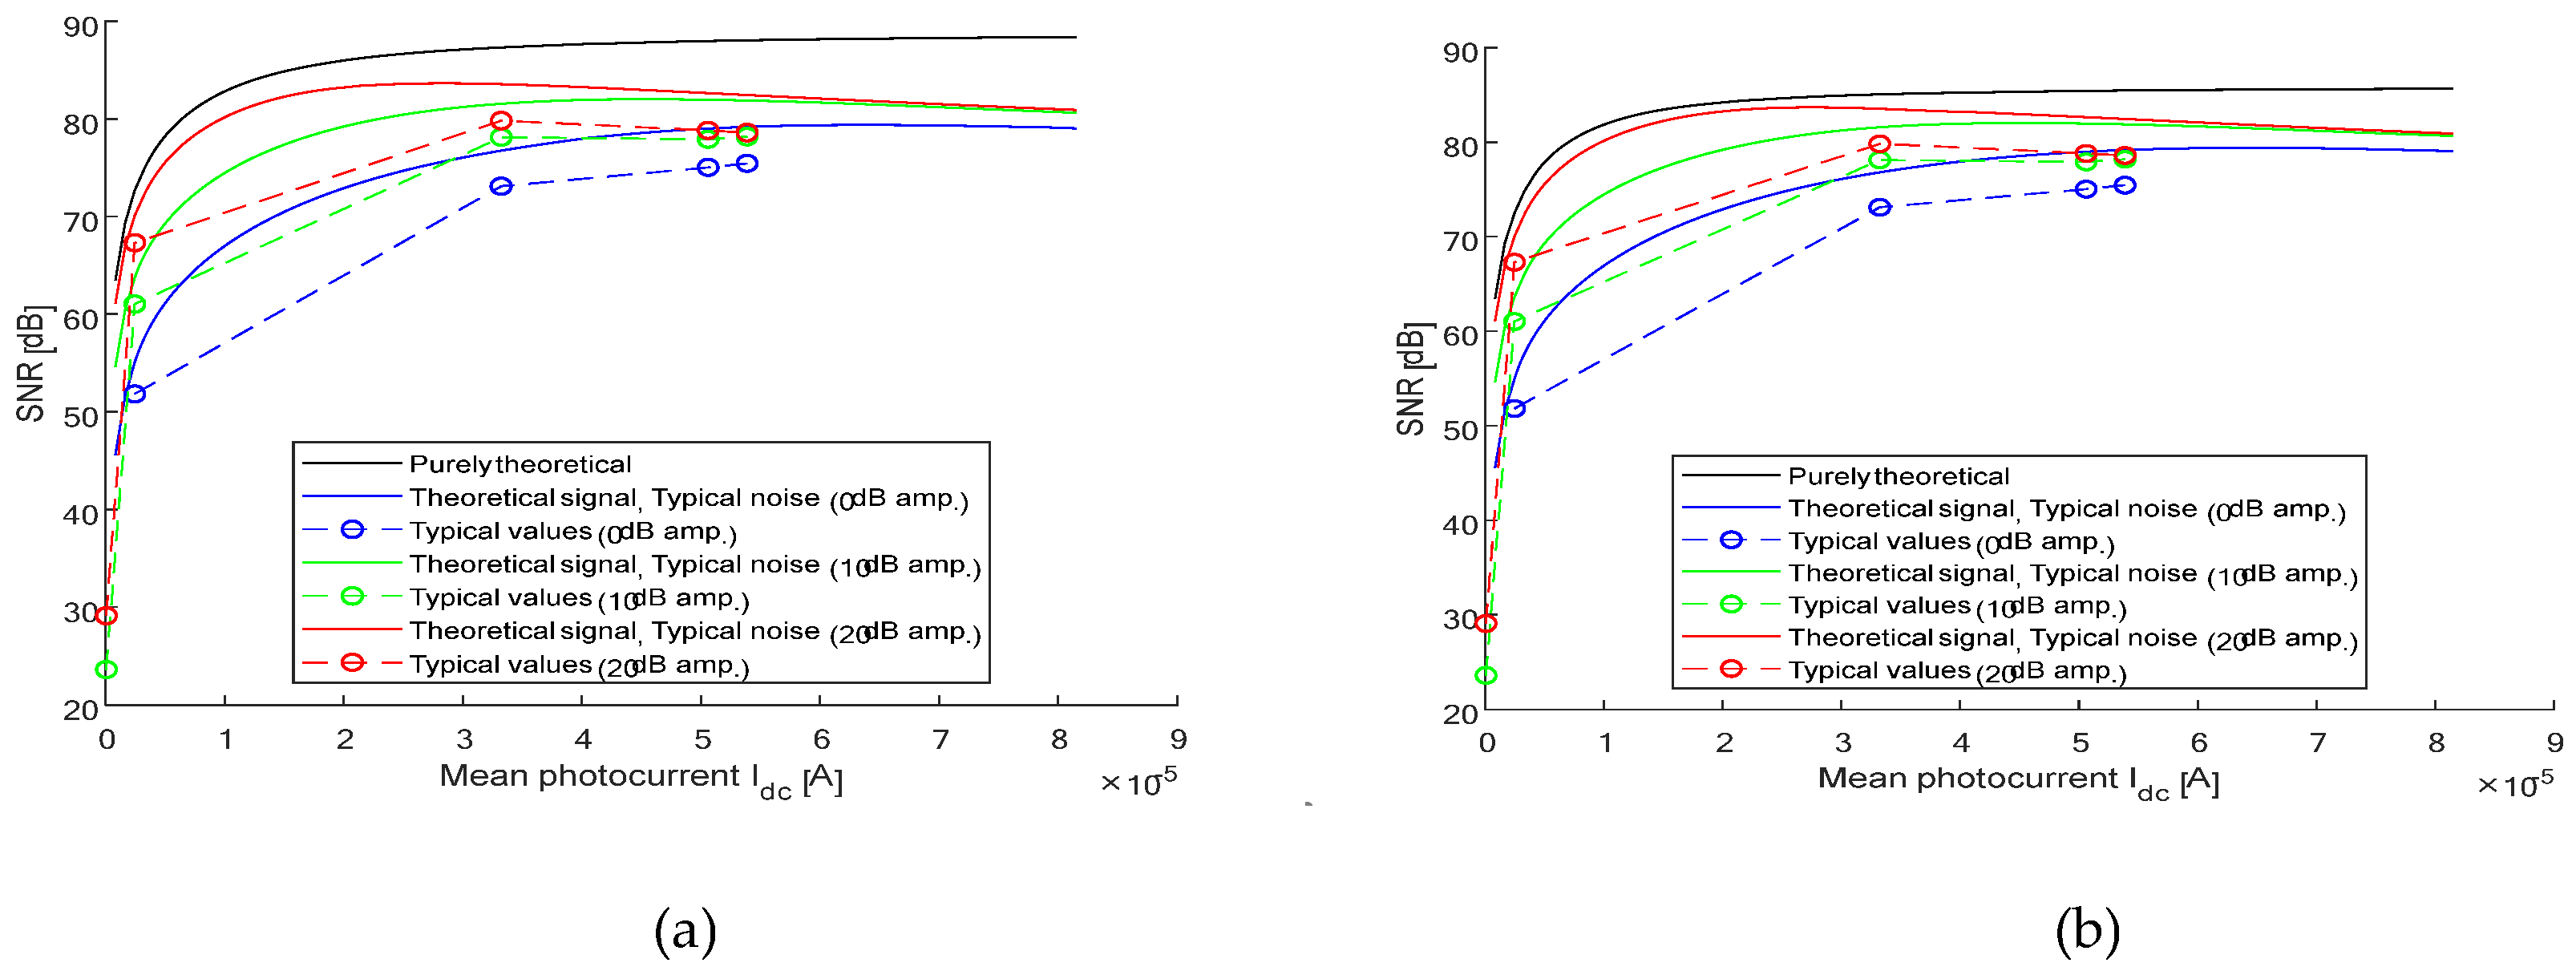
We plot the function (SNR vs I d c ) for our four splitter OCT system, with 6dB attenuation, amplification values are 0 dB, 10 dB, and 20 dB. It is achieved by using (1) pure theoretical formulas, (2) theoretical calculated I s with typical noise values, and (3) by using only typical noise values. It is performed for an unpolarized light source v = 0 and polarized light source v = 1 . First we choose the attenuation of our system as 6 dB (0.02512) and then set the parameters to fit a 3rd order polynomial (three amplifications, 0 dB, 10 dB, and 20 dB). The SNR as a function of I d c is plotted where the light source power ( P s o ) is set from the initial value P s o _ i n i t to a final value of 100 P s o _ i n i t . The initial value of the light source power is 9.4 x 10⁻⁶ watt ( P s o _ i n i t = 9.4 × 10 6 ). The receiver responsivity is equal to one ( ρ = 1 ), the beam splitters parameters have lower value ( K 1 = 0.3 , K 2 = 0.3 , K 3 = 0.3 , and K 4 = 0.5 ). The estimated sample reflection coefficients are and [15,16]. The mirror reflectivity is 0.6 ( R = 0.6 ). The FWHM wavelength bandwidth of the source is 62 × 10 9   m ( Δ λ = 62   nm ). The optical bandwidth of the source is calculated by using the formula Δ ν c Δ λ λ 2 π 2 log ( 2 ) , where λ is the light source wavelength and it equals 1545 nm ( 1545 × 10 9   m ),is the speed of light in a vacuum, and Δ v is the optical bandwidth of the light source. The electrical detection bandwidth is equal to 30 kHz ( b = 30 × 10 3   Hz ). The receiver noise is set to the level of noise equivalent power (NEP) and is equal to 3 × 10 12 . The calculated system parameters for different values of light source power P s o are P r , P s , and P x . The estimated impedance for converting current to voltage ( I V ) in the optical detector is 0.0467 x 10⁶ V/A. The detector responsivity ( ρ ) is equal to one. In our theoretical calculations of I d c , we define the level of I d c = 65   uA as there is no typical data above that value, then turn the domain light source power ( P s o ) down. The OCT balanced system four beam splitter and attenuator, plot of SNR as a function of I d c for unpolarized light source v = 0 is presented (Figure 6a).
The OCT balanced system, four beam splitter and attenuator SNR as a function I d c for a polarized light source v = 1 is also presented (Figure 6b).
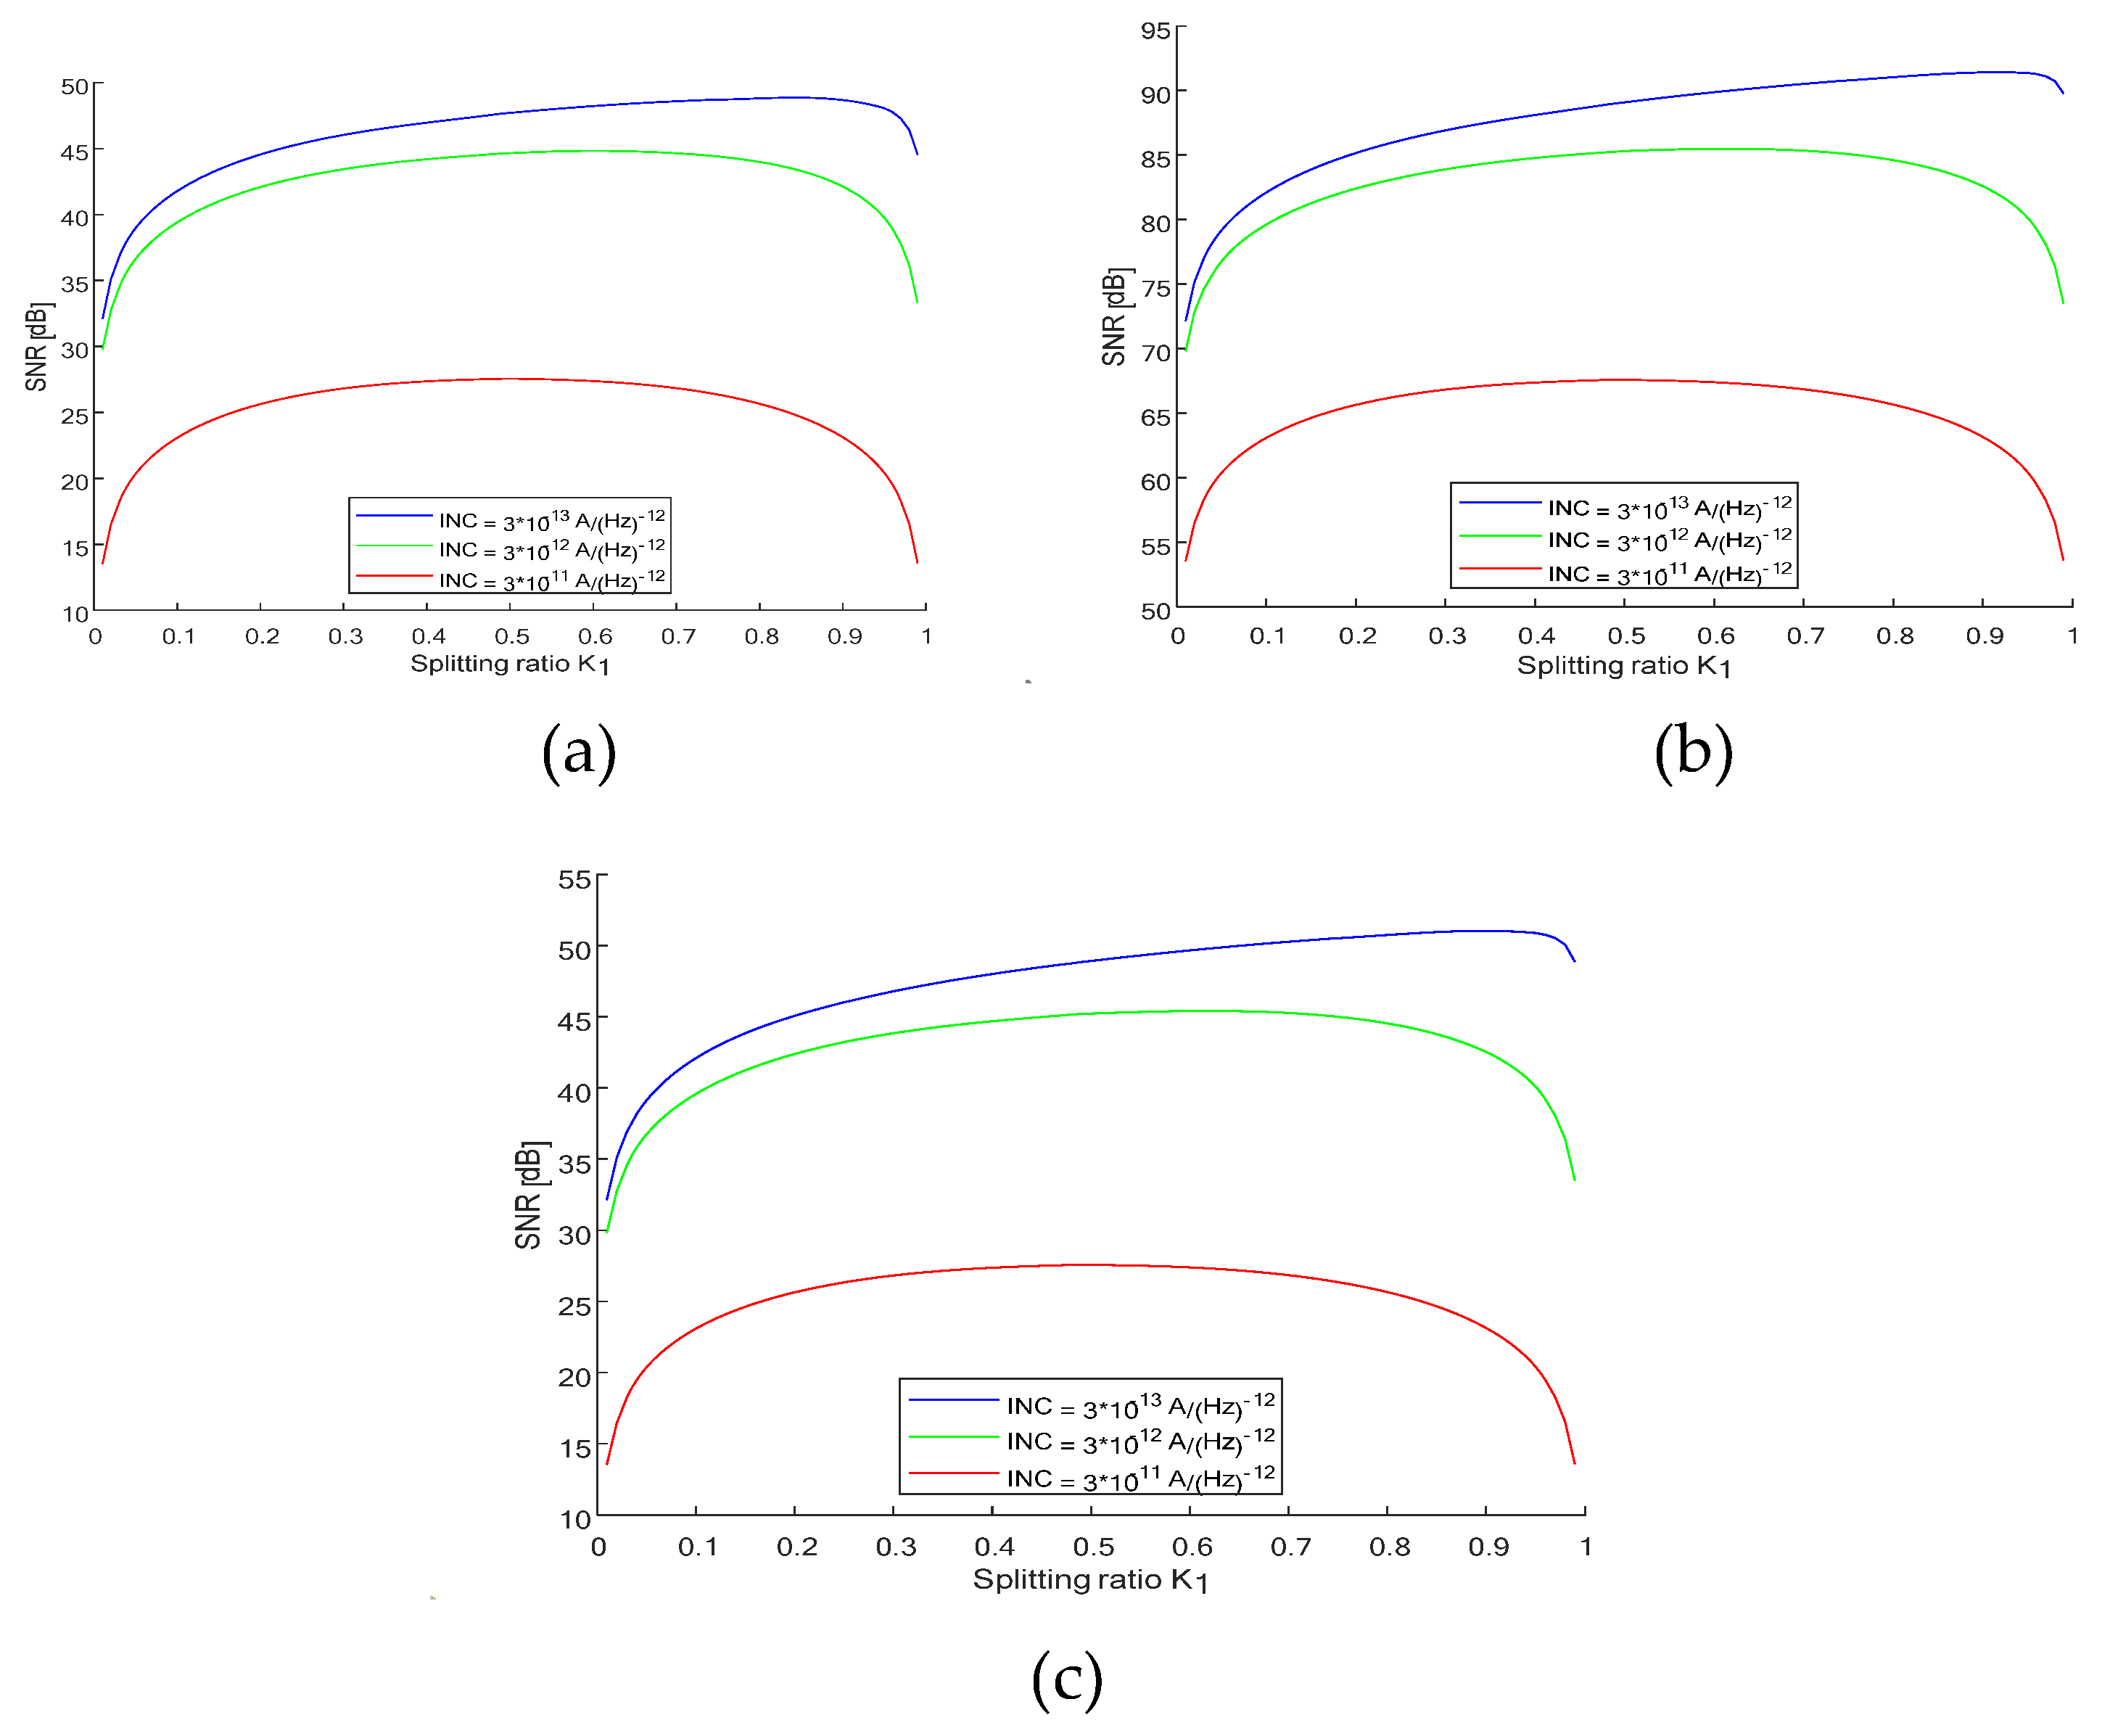
Our OCT balanced system includes four beam splitters, with attenuator, beam splitters (coupling splitting ratio coefficients (K1, K2, K3, and K4 (K4=0.5)), sample and mirror. We plot the graph of SNR (dB) vs splitting ration K1 for different values of NEP [ A Hz ], noise equivalent power ( 3 × 10 13 A Hz , 3 × 10 12 A Hz , and 3 × 10 11 A Hz ). The system attenuation is 6 dB (0.2512), and the detector responsivity is one ( ρ = 1 A W ). The light source power is 0.1mW ( P s o = 1 × 10 4 ). We calculate the maximum SNR value and the optimal K1 beam splitter value. The mirror reflectivity is set to 0.3 ( R = 0.3 ). The optimal splitting ratio K1 is determined by σ r e which approximated by NEP value. The graphs are plotted for three cases, (1) Γ s = 1 × 10 6 , Γ x = 0.01 , Γ s < Γ x (2) Γ s = 0.01 , Γ x = 1 × 10 6 , Γ s > Γ x , and (3) Γ s = 1 × 10 6 , Γ x = 1 × 10 3 , Γ s < Γ x . Couplers splitting ratio is set to 0.3 (K1=0.3, K2=0.3). The FWHM bandwidth of the light source is set to 62nm ( Δ λ = 62 × 10 9   m ) which fit SuperLum source. The optical bandwidth of the light source ( Δ v ) expression is Δ v c Δ λ λ 2 π 2 log ( 2 ) , whereis the speed of light in vacuum, Δ λ is the FWHM wavelength bandwidth of the source ( Δ λ = 62   nm ), and λ is the light source wavelength ( λ = 1545   nm ) [17,18]. The electrical detection bandwidth is 10 kHz ( b = 10 × 10 3   Hz ). The polarization coefficient of the light source is set to zero ( v = 0 ), unpolarized. The K1 beam splitter value is changed from 1% to 99% and we calculate parameters P r , P s , P x and I s for each specific value of K1. Idc value, noise, and SNR are calculated for each K1 beam splitter. We create a linearly spaced vector of splitting factor K 1 , the row vector K 1 of 99 points linearly spaced between 0.01 to 99, including 0.01 and 99. We get the maximum SNR value and the optimal K 1 value for three cases. (1) Γ s = 1 × 10 6 , Γ x = 0.01 , SNRmax = 48.8269 and K1_opt = 83 (Figure 7a) (2) Γ s = 0.01 , Γ x = 1 × 10 6 , SNRmax = 91.4207 and K1_opt = 92 (Figure 7b), and (3) Γ s = 1 × 10 6 , Γ x = 1 × 10 3 , SNRmax = 51.0380 and K1_opt = 91 (Figure 7c). The expressions for noise and SNR as a function ofK1are
noise ( K 1 ) = 2 q I d c b + 2 ( 1 + d ) 2 ( 1 + v 2 ) ρ 2 P r P x b Δ v + ( N E P ) 2 b
S N R ( K 1 ) = 10 log 10 [ I s ( K 1 ) noise ( K 1 ) ]
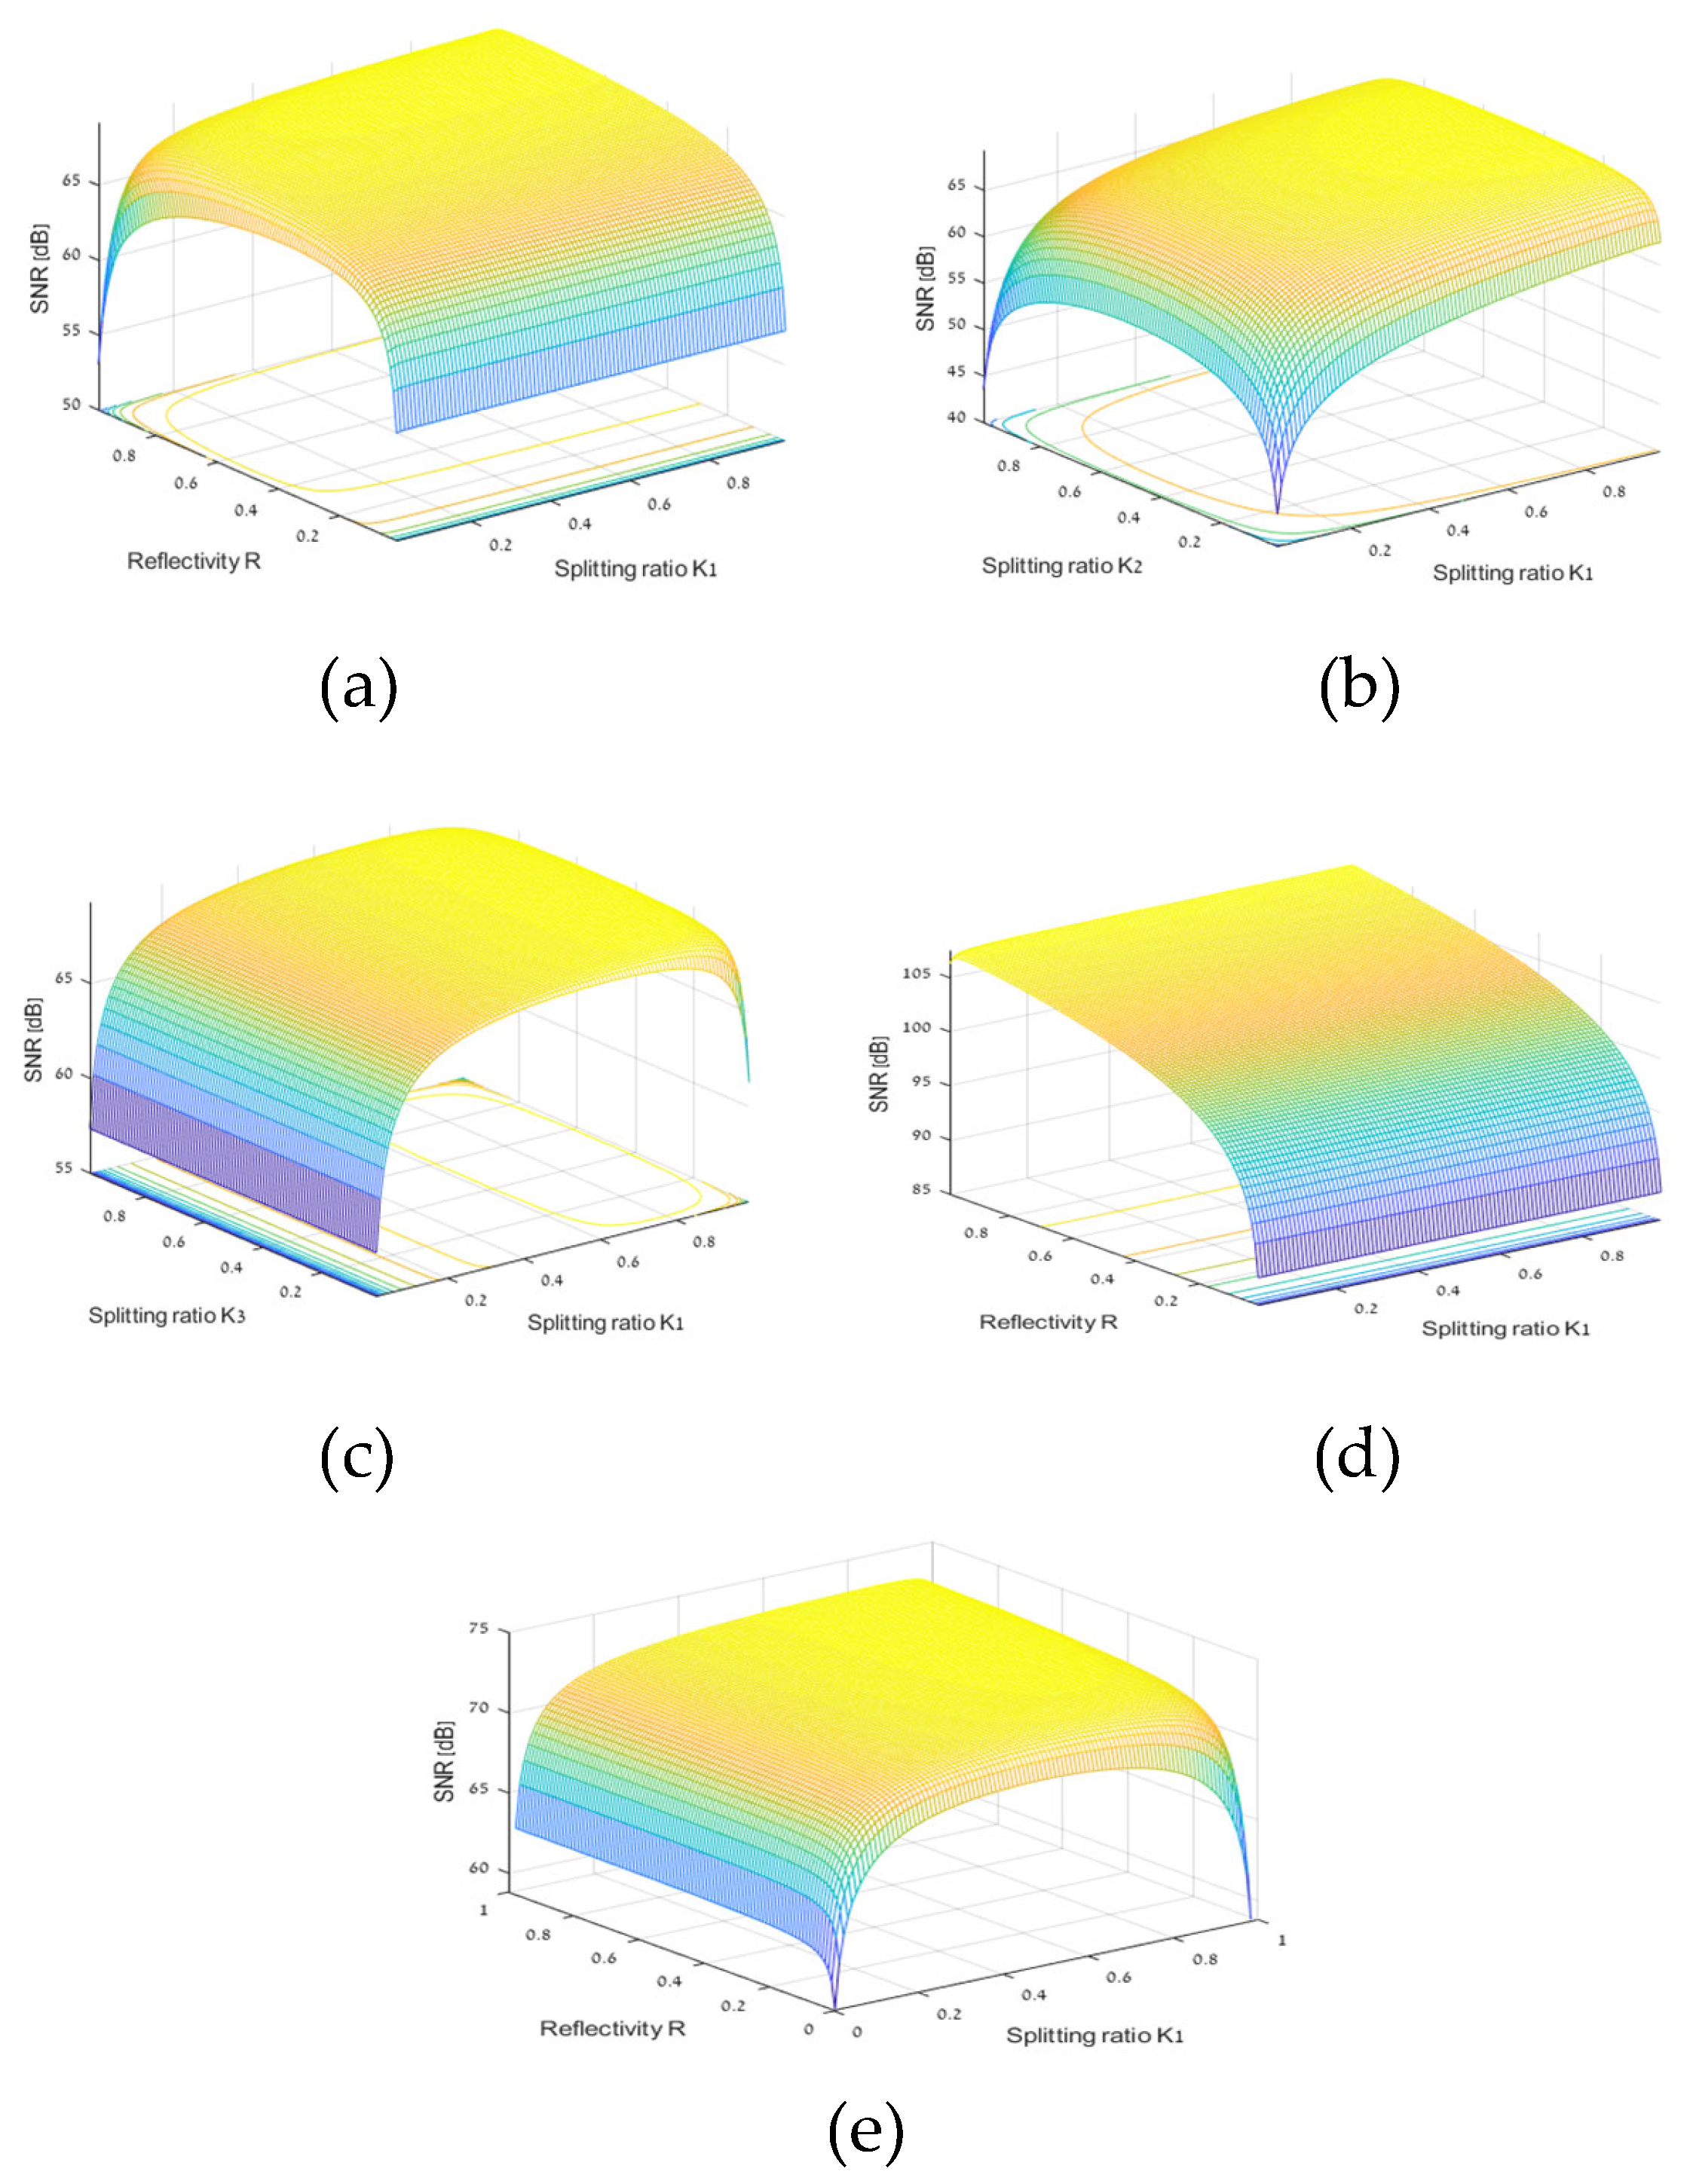
We plot 3D graphs of SNR as a function of mirror reflectivity (R) and K1 splitting ratio for our OCT balanced system with four splitters and attenuator.. The overall system parameters are as follow: d = 0.1 (10 dB) attenuator, detector responsivity ( ρ = 0.1 ), light source power P s o = 10   mW ( 10 × 10 3   W ), noise equivalent power (NEP) is 3 × 10 14   A Hz , reflection coefficients Γ s = 0.0001   ;   Γ x = 0.01 , couplers splitting ratio K 2 = 0.5 , K 3 = 0.9 , FWHM wavelength bandwidth of the source Δ λ = 62   nm ( 62 × 10 9   m ). The optical bandwidth of the source Δ v is calculated by the formula Δ ν = c Δ λ λ 2 π 2 log ( 2 ) , c is the speed of light in vacuum, λ is the light source wavelength λ = 1345   nm . The electrical detection bandwidth is b = 30   kHz ( 30 × 10 3   m ). The polarization coefficient is set to zero ( v = 0 ), un polarized. We change R and K 1 values between 1% and 99%, and calculate the system parameters P r , P s , P x , I s ( R , K 1 ) , I d c , noise, and SNR ( R ,   K 1 ) , (Figure 8a). We calculate the maximum SNR value and the optimal R and K 1 values ( SNR max = 69.18   dB , K 1 o p t = 86 , and R o p t = 99 ) [19,20].
We get our OCT balanced system four beam splitter and Attenuator, SNR (dB) as a function of splitting ratios K1, K2 for Γ s = 0.0001   ;   Γ x = 0.01 , R = 70 % , ρ = 0.1 , d = 0.1   b = 30   kHz , ratios K1 , K2 is changed between 1% to 99%, v = 0 , and K 3 = 0.5 , NEP = 0.013 × 10 14   A Hz , Δ λ = 62   nm , and K 3 = 0.5 , P s o = 10   mW (Figure 8b), ( SNR max = 69.25   dB , K 1 o p t = 50 , and K 2 o p t = 89 ).
We get our OCT balanced system with four beam splitter and Attenuator, SNR (dB) as a function of splitting ratios K1, K3 for Γ s = 0.0001   ;   Γ x = 0.01 , R = 70 % , ρ = 0.1 , b = 30   kHz , ratios K1 , K3 is changed between 1% to 99%, v = 0 , and K 2 = 0.5 ,.., d = 0.1 , Δ λ = 62   nm , and P s o = 10   mW (Figure 8c), ( SNR max = 69.25   dB , K 1 o p t = 50 , and K 3 o p t = 89 ) [21,22].
We get our OCT balanced system four beam splitter and attenuator SNR (dB) as a function of splitting ratios K1 , R for Γ s = 0.1   ;   Γ x = 0.00001 , ρ = 0.1 , d = 0.1 , b = 30   kHz , ratios K1 , R is changed between 1% to 99%, v = 0 , K 2 = 0.5 , K 3 = 0.9 , NEP = 3 × 10 14   A Hz , Δ λ = 62   nm , P s o = 10   mW (Figure 8d), ( SNR max = 107.49   dB , K 1 o p t = 99 , and R o p t = 99 ).
We get our OCT balanced system four beam splitter and attenuator SNR (dB) as a function of splitting ratios K1 , R for Γ s = 0.0001   ;   Γ x = 0.01 , ρ = 1 , d = 0.353 , b = 10   kHz , ratios K1 , R is changed between 1% to 99%, v = 0 , K 2 = 0.5 , K 3 = 0.5 , NEP = 3 × 10 12   A Hz , Δ λ = 62   nm , P s o = 1   mW (Figure 8e), ( SNR max = 73.08   dB , K 1 o p t = 86 , and R o p t = 99 ).

6. Discussion

OCT main strength consists of the real-time three-dimensional visualization of tissue structure and function without the necessity for a sample biopsy. High resolution, fast image acquisition, improved image quality, artifact reduction, and versatility have made OCT an innovative imaging device over time. SD OCT Offers True Advantages; the technology is the speed of data acquisition, which facilitates an increased number of lines that scan the retina. The major advantage of OCT over the ophthalmoscopic examination in vitreoretinal disease management is the ability to determine three-dimensional relationships between the vitreous, the retina, and extra retinal membranes. Because OCT utilizes light waves (unlike ultrasound which uses sound waves) media opacities can interfere with optimal imaging. As a result, the OCT will be limited in the setting of vitreous hemorrhage, dense cataracts, or corneal opacities. There are two main inter ferometrics which relate to OCT systems, one is Time domain (TD-OCT) and Fourier domain (FD-OCT). Additionally we can use swept source OCT the depth profile through spectral information [23,24]. OCT systems can be recorded by Rx unit (detector) and it happens during a complete travel of the reference mirror. It is a depth scan. The OTC image is constructed by translating the sample beam across the sample surface. Then, a scan is recorded at each position of the beam. The optical beam splitter (OCT system) splits light into two paths (reference and sample arms) then it reflects and combines at the detector point. There are polarized beam splitters and non – polarizing beam splitters. Beam splitters can operate properly only with a finite number of incident angles. Usually, a non – polarizing beam splitter will split the beam in a 50/50 ratio. Non – polarizing beam splitters divide light by wavelength while a polarizing beam splitter splits the incident beam into two separate beams of different linear polarization. When inspecting OCT imaging in terms of living tissues, there are two basic optical properties: scattering and absorption which are characterized by absorption and scattering coefficients. The echoes of light from the tissue and reference arm are combined at the fiber coupler. The limitation we face in OCT systems are related mainly to the tissue penetration depth. In OCT systems it is beneficial to use SuperLum SLD, Super luminescent diodes as light source (good resolution and no side lobs). We are interested mainly on OCT system SNR as a function of mean photocurrent in the detector. The SNR is estimated in a OCT balanced system and it is dependent on coupling ratios ( K 1 , K 2 , K 3 , and K 4 ), four optical couplers. There are optimal values of coupling ratio for maximum value of SNR. The OCT balanced system splitting ratio of (x/y) can be different than 50/50 which gives improved SNR value. The OCT system noise is dominant for low light power intensities (no amplification) and it is high at high amplification. OCT balanced system four splitters and attenuator, the SNR for different values of mirror reflection (R) and coupling ratios ( K 1 , K 2 , K 3 , and K 4 ) shows optimum SNR value for specific parameters values.

Conclusions

The choice of a balanced optical coherence tomography (OCT) configuration versus an unbalanced OCT configuration with optimized reference-arm attenuation is a critical decision when we want to use OCT system and part of that is the number of optical couplers in the system. The choice depends on the receiver noise, the fiber-end reflection R, and the power to the object. OCT is used to investigate biological tissue an equivalent R′ can be evaluated as the compound reflected light from tissue. An additional parameter has to be considered, the confocal optical sectioning interval of the OCT system. OCT system SNR gives a measure of the contrast attainable with a given system. The operational OCT system will be used to image actual biological samples. Images are recorded with different sources and different system designs to examine the influence of the system on the finished results. The investigation of OCT system involved OCT system coherence inspection, interference and noises [25]. The OCT unbalanced system has a few topological structures which are differentiated by the number of fiber optic beam splitter units and optical isolators. Mirrors and power measure units are also important units in our OCT system. The beam splitter parameter value is very important for the OCT system dynamical behavior. The OCT system balanced system is targeted to different medical tasks and inspection of SNR behavior for different values of beam units splitting ratios and mirror reflectivity is important. The OCT success and there is rapid transition from research into clinical setting for both OCT unbalanced system and OCT balanced system. OCT had demonstrated the ability to render images with high resolution. The OCT imaging light influence level is low enough so it used in sensitive tissue locales. The OCT imaging method is render depth – resolved structural images of the target. The tissue structural arrangement through birefringence OCT and the spatial distribution of specific contrast agents is done through molecular contrast OCT. We can detect glaucoma by using optical coherence tomography (OCT) and making routine clinical decisions. The fact is that OCT has significant improvements in image quality, speed and resolution, and it is essential diagnostic tool for various ocular pathologies. The different types of OCT technology able us to implement it to wide medical cases and technological aspects.

References

  1. A. Gh. Podoleanu, Optical coherence tomography, Journal of Microscopy, 2012.
  2. David Huang, Eric A. Swanson, Charles P. Lin, Joel S. Schuman, William G. Stinson, Warren Chang, Michael R. Hee, Thomas Flotte, Kenton Gregory, and James G. Fujimoto, Optical coherence tomography, Science, Vol. 254, Issue. 5035, pp. 1178 – 1181, 1991.
  3. A. Gh Podoleanu, Optical coherence tomography, British Journal of Radiology, Vol. 78, No. 935, 2014.
  4. E. Regar, J. A. Schaar, E. Mont, R. Virmani, P. W. Serruys, Optical coherence tomography, Cardiovascular Radiation Medicine, Vol. 4, Issue. 4, pp. 198 – 204, 2003.
  5. A. F. Fercher, W. Drexler, C. K. Hitzenberger and T. Lasser, Optical coherence tomography – principles and applications, Reports on Progress in Physics, Vol. 66, No. 2, 2003. [CrossRef]
  6. Wolfgang Drexler, James G. Fujimoto, Optical coherence tomography, technology and applications, 2008 th edition.
  7. J. M. Schmitt, Optical coherence tomography (OCT): a review, IEEE Journal of Selected topics in quantum electronics, Vol. 5, Issue. 4, pp. 1205 – 1215, 1999.
  8. A. F. Fercher, C. K. Hitzenberger, Chapter 4 – Optical coherence tomography, Progress in Optics, Vol. 44, pp. 215 – 302, 2002.
  9. P. H. Tomlins and R. K. Wang, Theory, developments and applications of optical coherence tomography, Journal of Physics D: Applied Physics, 38, pp. 2519 – 2535, 2005. [CrossRef]
  10. U. Morgner, W. Drexler, F. X. Kartner, X. D. Li, C. Pitris, E. P. Ippen, and J. G. Fujimoto, Spectroscopic optical coherence tomography, Optics Letters, Vol. 25, Issue. 2, pp. 111 – 113, 2000.
  11. Wolfgang Drexler and James G. Fujimoto, State – of – the – art retinal optical coherence tomography, Progress in Retinal and Eye Research, Vol. 27, Issue. 1, pp. 45 – 88, 2008.
  12. Adrian Bradu and Adrian Gh. Podoleanu, Fourier domain optical coherence tomography system with balance detection, Optics Express, Vol. 20, Issue. 16, pp. 17522 – 17538, 2012. [CrossRef]
  13. Wen – Chuan Kuo, Chih – Ming Lai, Yi – Shiang Huang, Cheng – Yi Chang, and Yue – Ming Kuo, Balanced detection of spectral domain optical coherence tomography, Optics express, Vol. 21, Issue. 16, pp. 19280 – 19291, 2013.
  14. Min Gyu Hyeon, Hyung – Jin Kim, Beop – Min Kim, and Tae Joong Eom, Spectral domain optical coherence tomography with balanced detection using single line – scan camera and optical delay line, Vol. 23, Issue. 18, pp. 23079 – 23091, 2015.
  15. Carla Carmelo and Adrian Gh. Podoleanu, Limitation of the achievable signal – to – noise ratio in optical coherence tomography due to mismatch of the balanced receiver, Applied Optics, Vol. 43, Issue. 25, pp. 4802 – 4815, 2004.
  16. Nestor Uribe – Patarroyo, Sahar Hosseinzadeh Kassani, Martin Villiger, and Brett E. Bouma, Robust wavenumber and dispersion calibration for Fourier – domain optical coherence tomography, Optics Express, Vol. 26, Issue. 7, pp. 9081 – 9094, 2018.
  17. En Bo, Xinyu Liu, Linbo Liu, Signal – to – noise ratio enhanced spectral domain optical coherence tomography with dual detection, Procedia Engineering, Vol. 140, pp. 140 – 143, Elsevier, 2016.
  18. B. I. Akca, B. Povazay, A. Alex, K. Worhoff, R. M. de Ridder, W. Drexler, and M. Pollnau, Miniature spectrometer and beam splitter for an optical coherence tomography on a silicon chip, Optics Express, Vol. 21, Issue. 14, pp. 16648 – 16656, 2013. [CrossRef]
  19. Andrew M. Rollins and Joseph A. Izatt, Optimal interferometer designs for optical coherence tomography, Optics Letters, Vol. 24, Issue. 21, pp. 1484 – 1486, 1999. [CrossRef]
  20. Mark C. Booth, Bahaa E. A, Saleh, Malvin Carl Teich, Polarization – sensitive quantum optical coherence tomography, Optics Communications, Vol. 248, pp. 2542 – 2549, Issue 10 – 11, 2011.
  21. Choma, M.A.; Sarunic, M.V.; Yang, C.; Izatt, J.A. Sensitivity advantage of swept-source and Fourier-domain optical coherence tomography. Opt. Express 2003, 11, 2183–2189. [CrossRef]
  22. Hsieh, Y.-S.; Ho, Y.-C.; Lee, S.-Y.; Chuang, C.-C.; Tsai, J.-c.; Lin, K.-F.; Sun, C.-W. Dental Optical Coherence Tomography. Sensors 2013, 13, 8928–8949. [CrossRef]
  23. Mehreen, A.; Duker, J.S. Optical coherence tomography–current and future applications, Curr. Opin. Ophthalmol. 2013, 24, 213–221.
  24. Cogliati, A.; Canavesi, C.; Hayes, A.; Tankam, P.; Duma, V.-F.; Santhanam, A.; Thompson, K.P.; Rolland, J.P. MEMS-based handheld scanning probe for distortion-free images in Gabor-Domain Optical Coherence Microscopy. Opt. Express 2016, 24, 13365–13374.
  25. Drexler, W.; Liu, M.; Kumar, A.; Kamali, T.; Unterhuber, A.; Leitgeb, R.A. Optical coherence tomography today: Speed, con-trast, and multimodality. J. Biomed. Opt. 2014, 19, 071412. [CrossRef]
  26. Zahid Yaqoob, Jigang Wu, and Changhuei Yang, Spectral domain optical coherence tomography: a better OCT imaging strategy, Bio Techniques 39:S6-S13, 2005. [CrossRef]
Figure 1. OCT basic system diagram.
Preprints 118661 g001
Figure 2. a Ongoing power in OCT system after fiber optic beam splitter (unbalanced system) b Back power light from the sample tissue after reflection and back to the detector. c Back power light from the reference arm (mirror). Split by FO and detect by the detector.
Preprints 118661 g002
Figure 3. a Ongoing and back power light from the sample tissue after reflection, detects by the detector No.1 (coherent part) b Ongoing and back power light from the sample tissue after reflection, detects by the detector No.1 (incoherent part) Back power light from the reference arm (mirror)pass two beam splitters and detect by the detector.
Preprints 118661 g003
Figure 4. a Ongoing and back power light from the sample tissue after reflection, detects by the detector No.1 (coherent part), OCT balanced system with four beam splitters and attenuator. b Ongoing and back power light from the sample tissue.after reflection, detects by the detector No.1 (incoherent part), OCT balanced system with four beam splitters and attenuator. c Back power light from the reference arm (mirror) pass two beam splitters and detect by the detector, OCT balanced system with four beam splitters and attenuator.
Preprints 118661 g004
Figure 5. a OCT balanced system four beam splitter and attenuator noise as a function of Idc (unpolarized), amplification.0dB, 5dB, and 10dB. b OCT balanced system four beam splitter and attenuator. Noise vs Idc (unpolarized), amplification 15dB, 20dB, and 25dB. c OCT balanced system four beam splitter and attenuator noise as a fucntion of Idc (polarized), amplification 0dB, 5dB, and 10dB. d OCT balanced system four beam splitter and attenuator noise as a function of Idc (polarized), amplification 15dB, 20dB,and 25dB.
Preprints 118661 g005
Figure 6. a OCT balanced system four beam splitter and attenuator SNR as a function of I d c for unpolarized light source ( v = 0 ). b OCT balanced system four beam splitter and attenuator SNR as a function of I d c for a polarized light source ( v = 1 ).
Preprints 118661 g006
Figure 7. a OCT balanced system four beam splitter and Attenuator SNR (dB) as a function of splitting ratio K1 for Γ s = 1 × 10 6 , Γ x = 0.01 . b OCT balanced system four beam splitter and Attenuator SNR (dB) as a function of splitting ratio K1 for Γ s = 0.01 , Γ x = 1 × 10 6 . c OCT balanced system four beam splitter and Attenuator SNR (dB) as a function of splitting ratio K1 for Γ s = 1 × 10 6 , Γ x = 1 × 10 3 .
Preprints 118661 g007
Figure 8. a OCT balanced system four beam splitter and Attenuator SNR (dB) as a function of splitting ratio K1 and mirror reflectivity R for Γ s = 0.0001   ;   Γ x = 0.01 . 8b OCT balanced system four beam splitter and Attenuator SNR (dB) as a function of splitting ratios K1 and K2 for Γ s = 0.0001 ;   Γ x = 0.01 . c OCT balanced system four beam splitter and Attenuator SNR (dB) as a function of splitting ratios K1 and K3 for Γ s = 0.0001 ;   Γ x = 0.01 . d OCT balanced system four beam splitter and Attenuator SNR (dB) as a function of splitting ratio K1 and mirror reflectivity R for Γ s = 0.1 ;   Γ x = 0.00001 . e OCT balanced system four beam splitter and Attenuator SNR (dB) as a function of splitting ratio K1 and mirror reflectivity R for Γ s = 0.0001 ;   Γ x = 0.01 .
Preprints 118661 g008
Disclaimer/Publisher’s Note: The statements, opinions and data contained in all publications are solely those of the individual author(s) and contributor(s) and not of MDPI and/or the editor(s). MDPI and/or the editor(s) disclaim responsibility for any injury to people or property resulting from any ideas, methods, instructions or products referred to in the content.
Copyright: This open access article is published under a Creative Commons CC BY 4.0 license, which permit the free download, distribution, and reuse, provided that the author and preprint are cited in any reuse.
Prerpints.org logo

Preprints.org is a free preprint server supported by MDPI in Basel, Switzerland.

Subscribe

© 2024 MDPI (Basel, Switzerland) unless otherwise stated