1. Introduction
Particulate air pollution is one of the global environmental pollutants [
1]. Particulate matter and the substances it contains are a strong stress factor for living organisms [
2]. At the cell level, many stress factors, including pollutants, have common effects such as oxidative stress and the formation of harmful to cells reactive oxygen species (ROS), reactive nitrogen species (RNS), and reactive sulfur species (RSS) [
3,
4]. Detailed analysis of various dust fractions shows that the list of harmful components for living organisms is very long. These include organic and inorganic components of origin, for example PAHs, organic and elemental carbon, alkanes, organic acids, ROS, RNS, and heavy metals are considered key components of PM that induce the generation of hydroxyl radicals (•OH) in Fenton-like reactions [
5,
6,
7]. Recent studies indicate that a new type of pollutant, environmentally persistent free radicals (EPFRs), mainly from fossil fuel combustion and automobile exhaust emissions, should be added to this list [
8,
9,
10,
11]. Fossil fuel combustion, vehicle-related emissions, and industry are the primary sources of EPFRs, and they can be formed in the atmosphere as a result of oxidative reactions [
12,
13]. These are long-lived radicals that are ubiquitous in the environment, capable of producing harmful ROS species, which negatively affect the functioning of not only living organisms but also ecosystems [
14,
15,
16,
17]. Gehling et al. (2014) reported that one EPFR generates an average of 10 hydroxy radicals [
18]. The radical content of plants can be investigated indirectly by methods based on the reduction of metal ions to ions of lower oxidation and the scavenging phenomenon of free stable radicals (FR) [
19,
20,
21], or directly by FR content using the electron paramagnetic resonance method (EPR) [
22]. The EPR method shows high efficiency and sensitivity in the study of FR in plants formed under the influence of air pollution, it is possible to measure the absolute number of spins and identify ROS forms, it has been described in many articles from which we have cited only a few [
15,
17,
23,
24,
25,
26]. The method does not require time-consuming preparation of material for analysis; the amount of material does not need to be large (a few milligrams).
In proceeding with the research presented here, it was assumed, as [
20], that the FR content of dandelions will be correlated with particulate air pollution. In areas with heavy traffic, particulate pollution will increase and the plants that grow there, responding to this stress factor, will manifest an increase in the FR content. Recent studies by Vejerano and Ahn [
23] show that the FR present in leaves are also biogenic in nature. Due to the highest chlorophyll content and the intense photosynthetic process that occurs here, they are the place in the plant where the most FR are naturally formed. Analysis of the number and type of EPFRs and comparisons of the FR content in different dandelion organs were used to confirm their thesis.
2. Results
2.1. Particulate Air Pollution
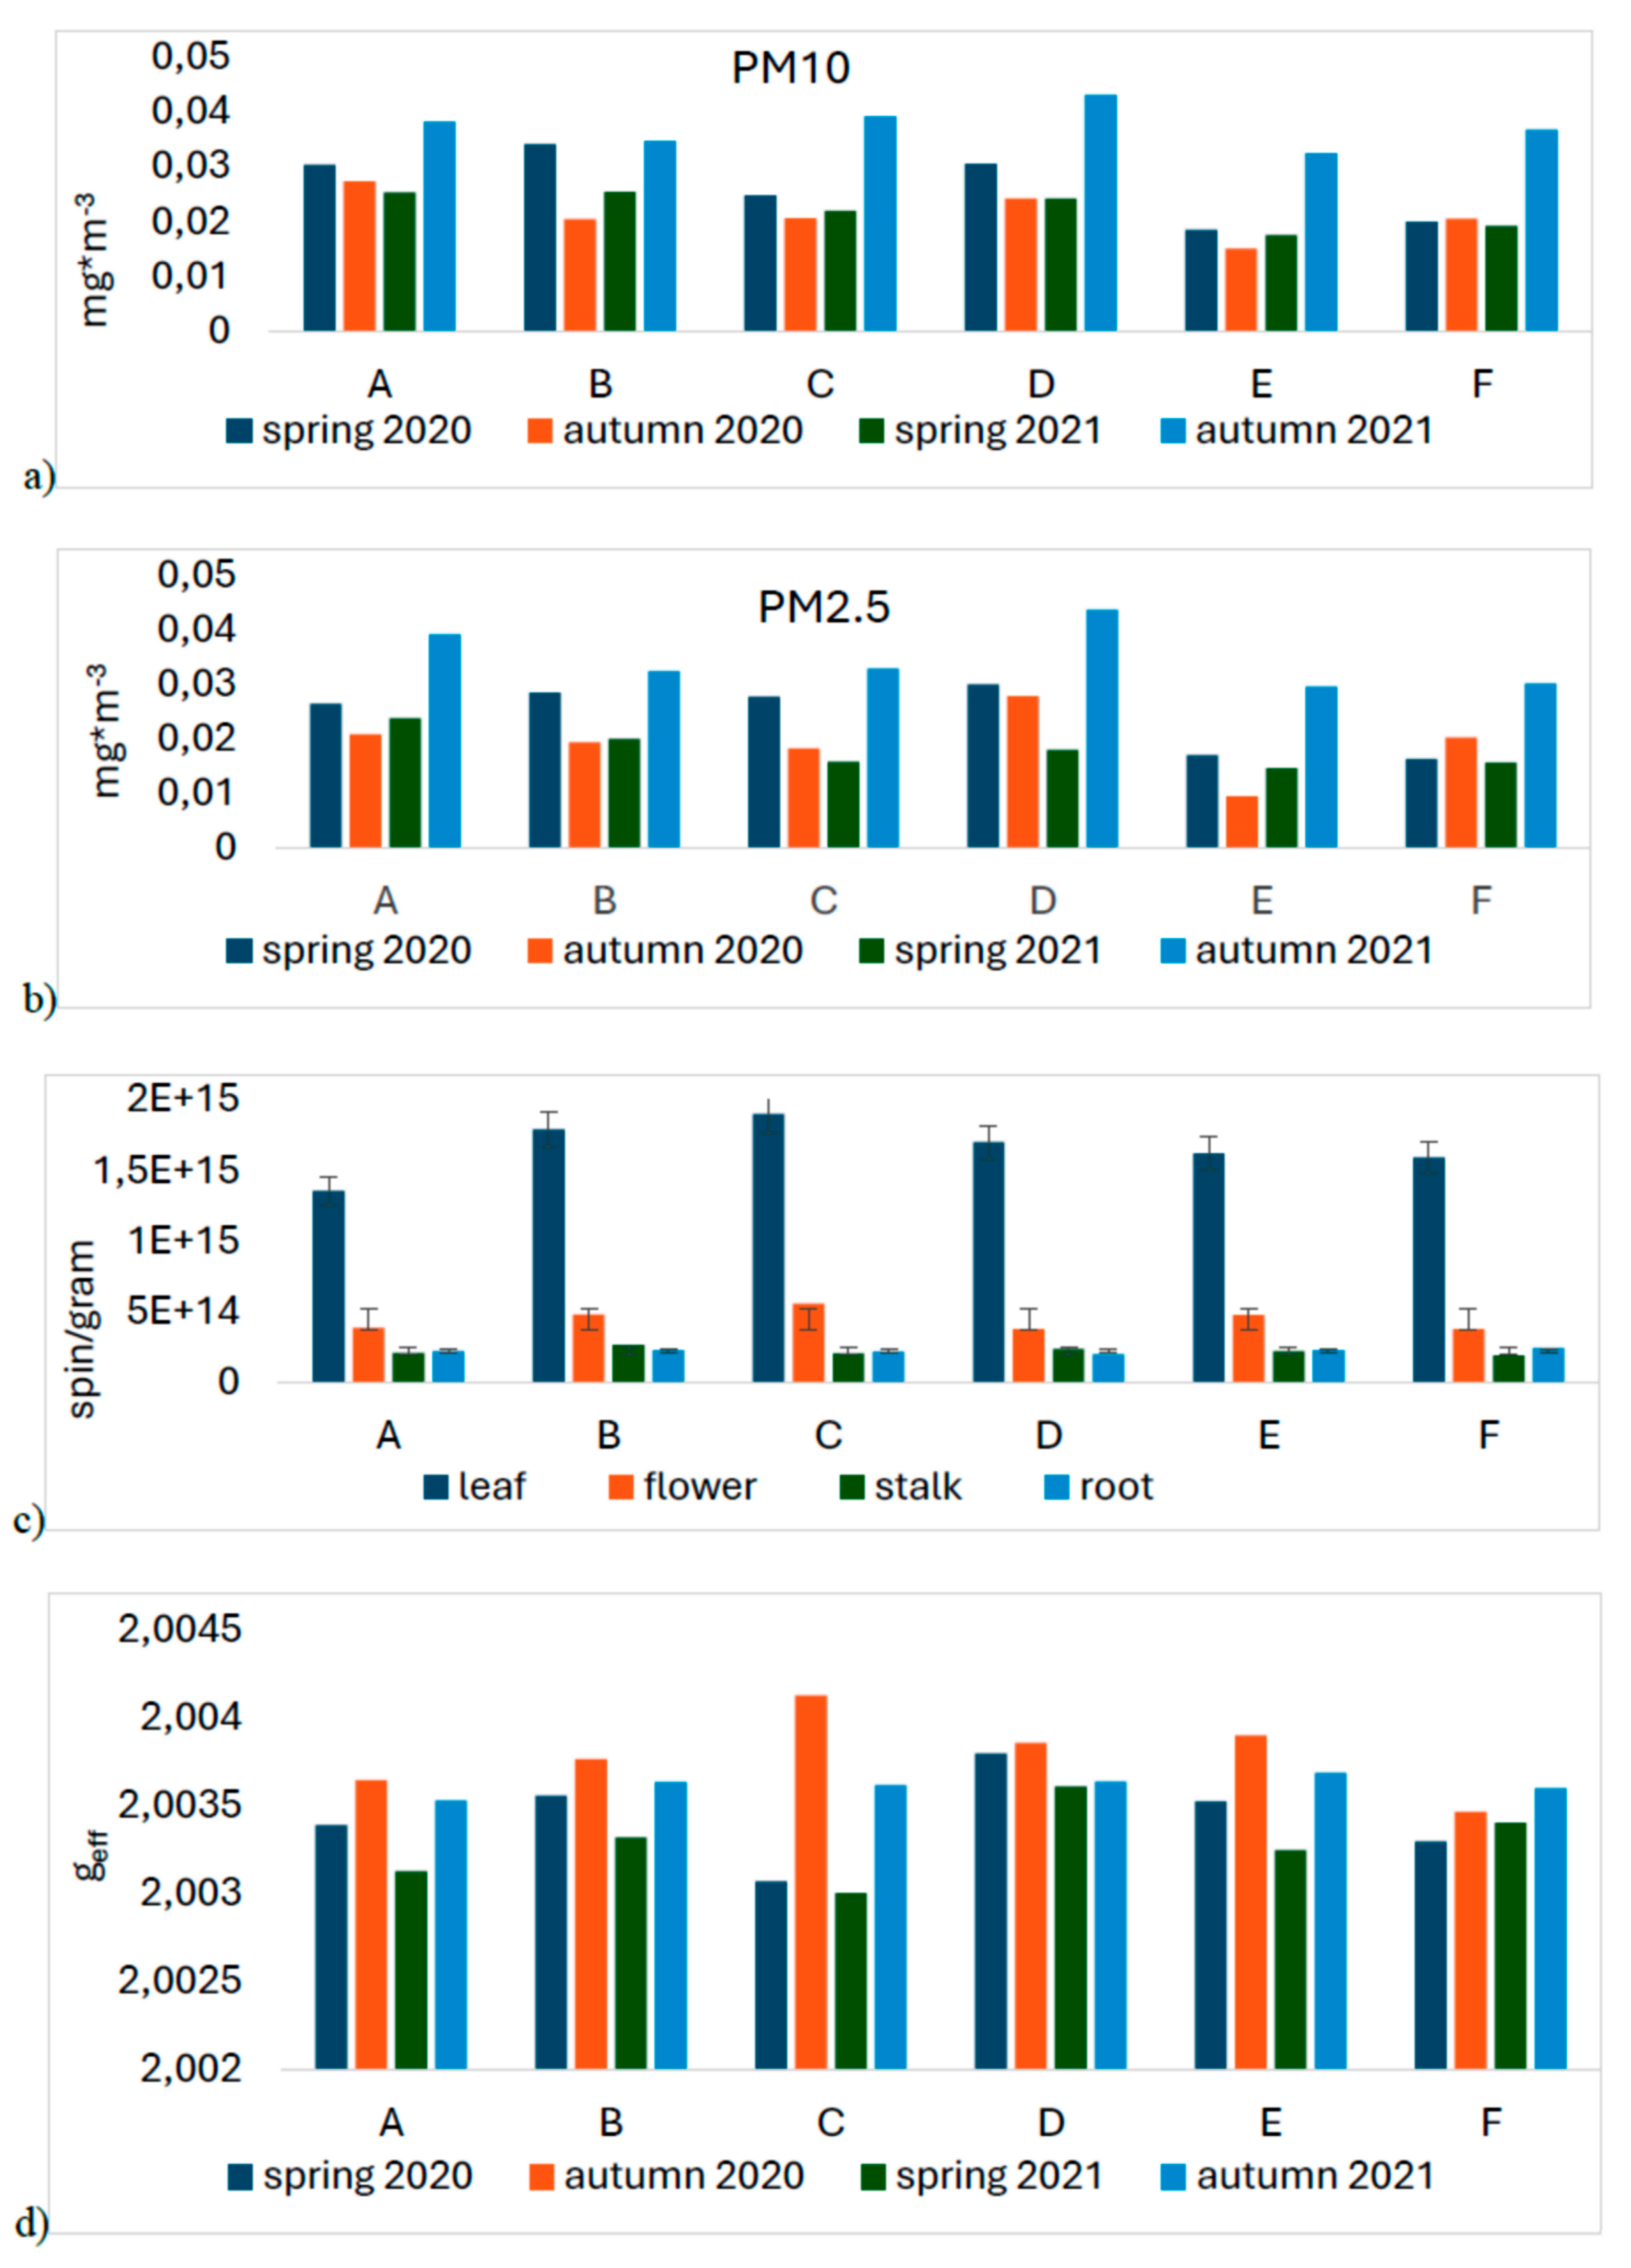
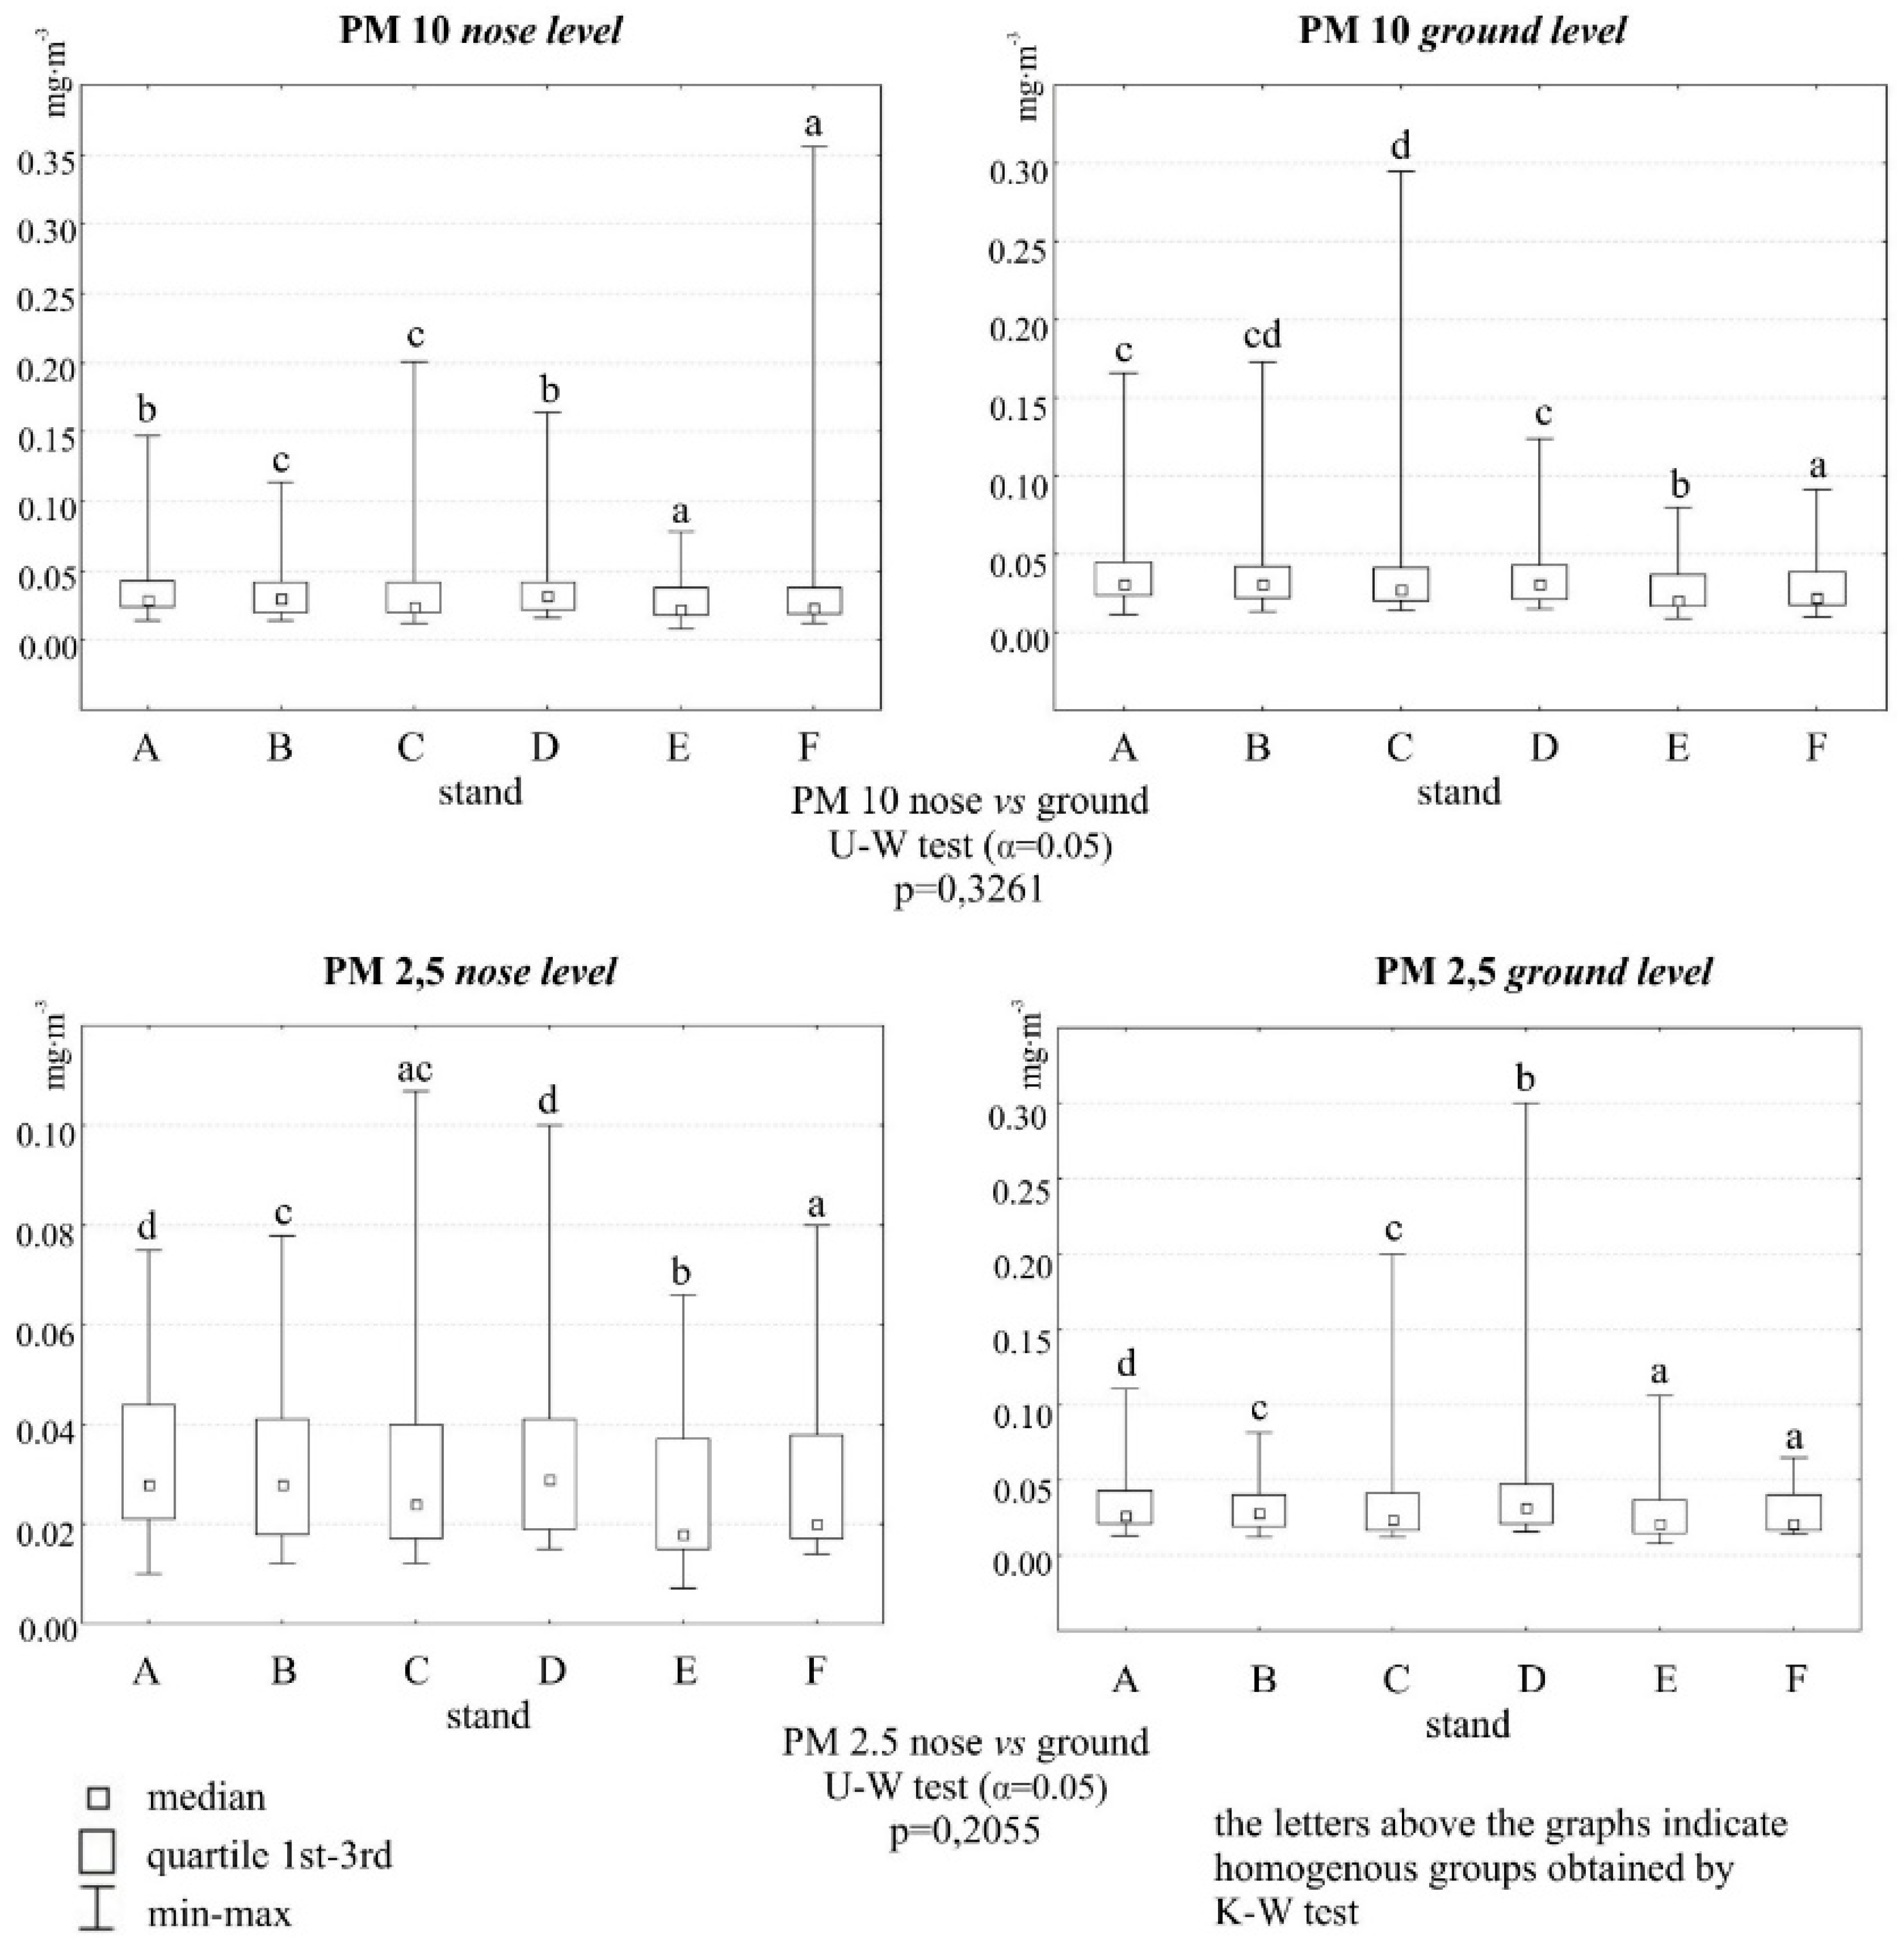
The sites were characterized by low concentrations of particulate matter, especially sites E and F, which were meant as a control. Although the measurement was temporary and the results cannot be related to the daily average critical values reported for these pollutants by the WHO, it can be assumed that the average concentrations of PM10 and PM2.5 at all sites were low. Exceedances of the WHO norms, for PM10 did not occur and for PM2.5 were rare. The altitude at which the particles were measured was not significant. The time of year was a clearly differentiating parameter. Whatever the location of the test sites, the highest dust pollution (both fractions) was found in fall 2021 (
Figure 1a,b and
Figure 2).
2.2. EPR analyses of dandelion
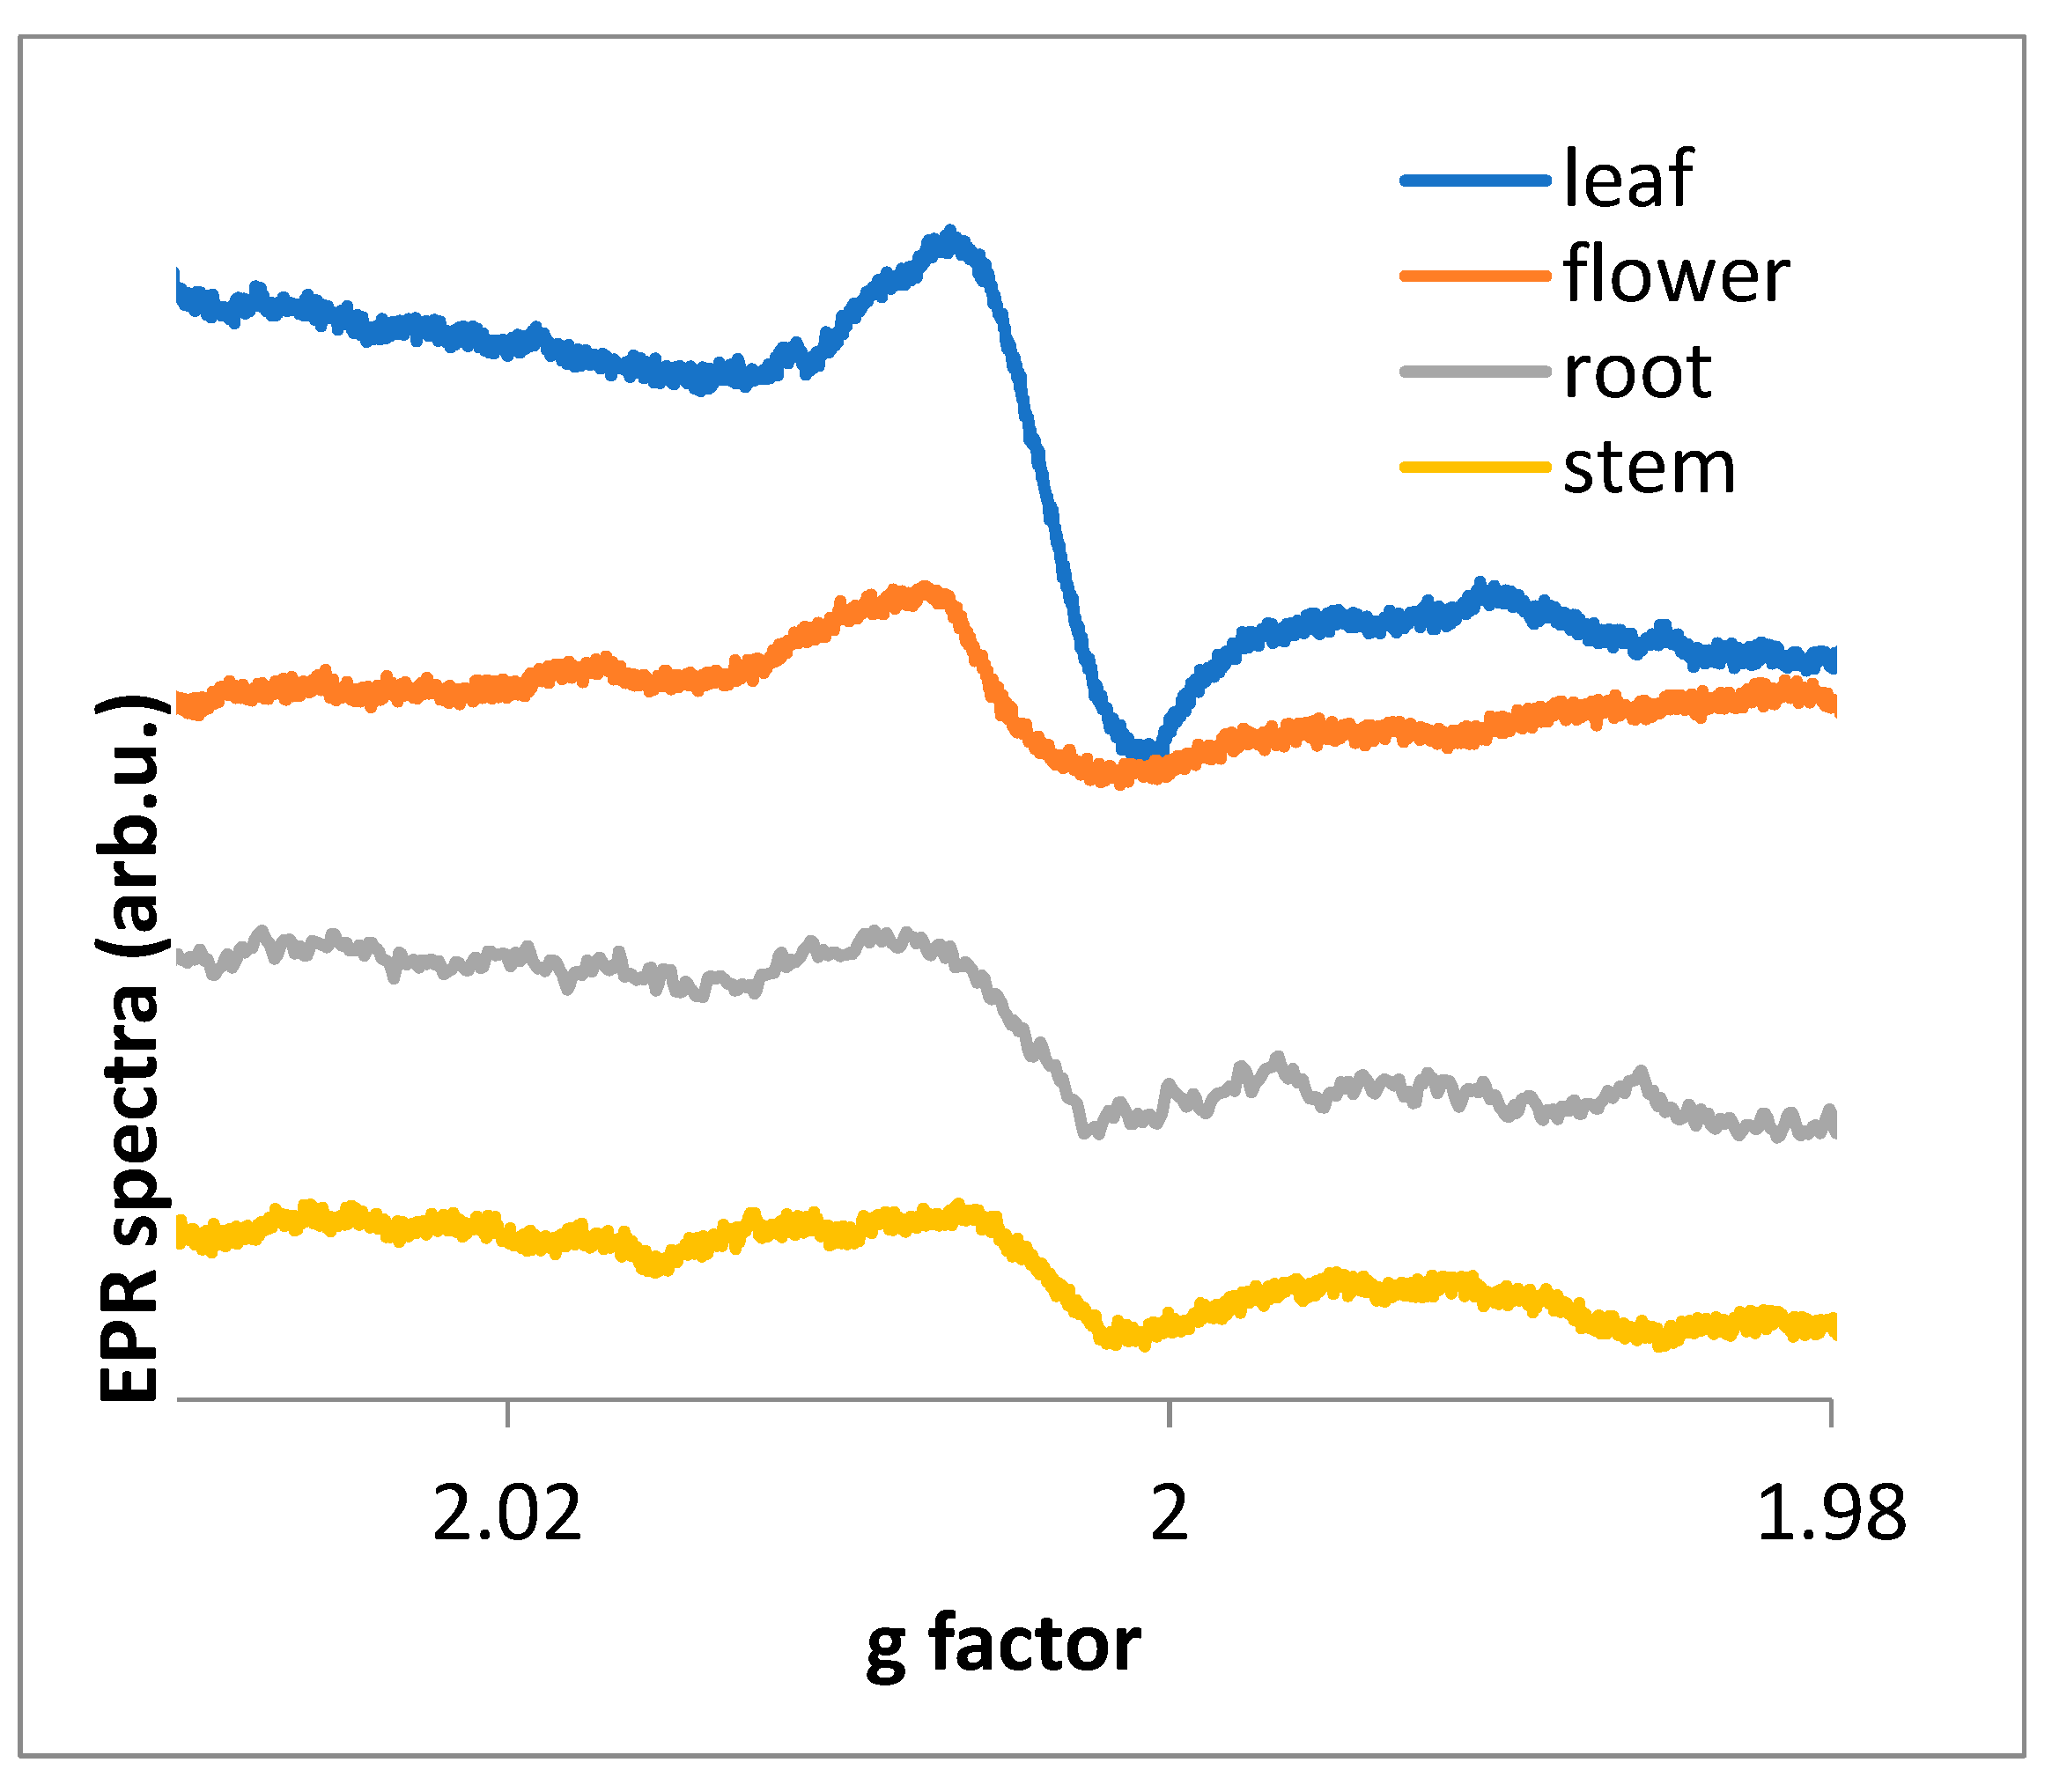
EPR spectra were measured for four parts of the plant (
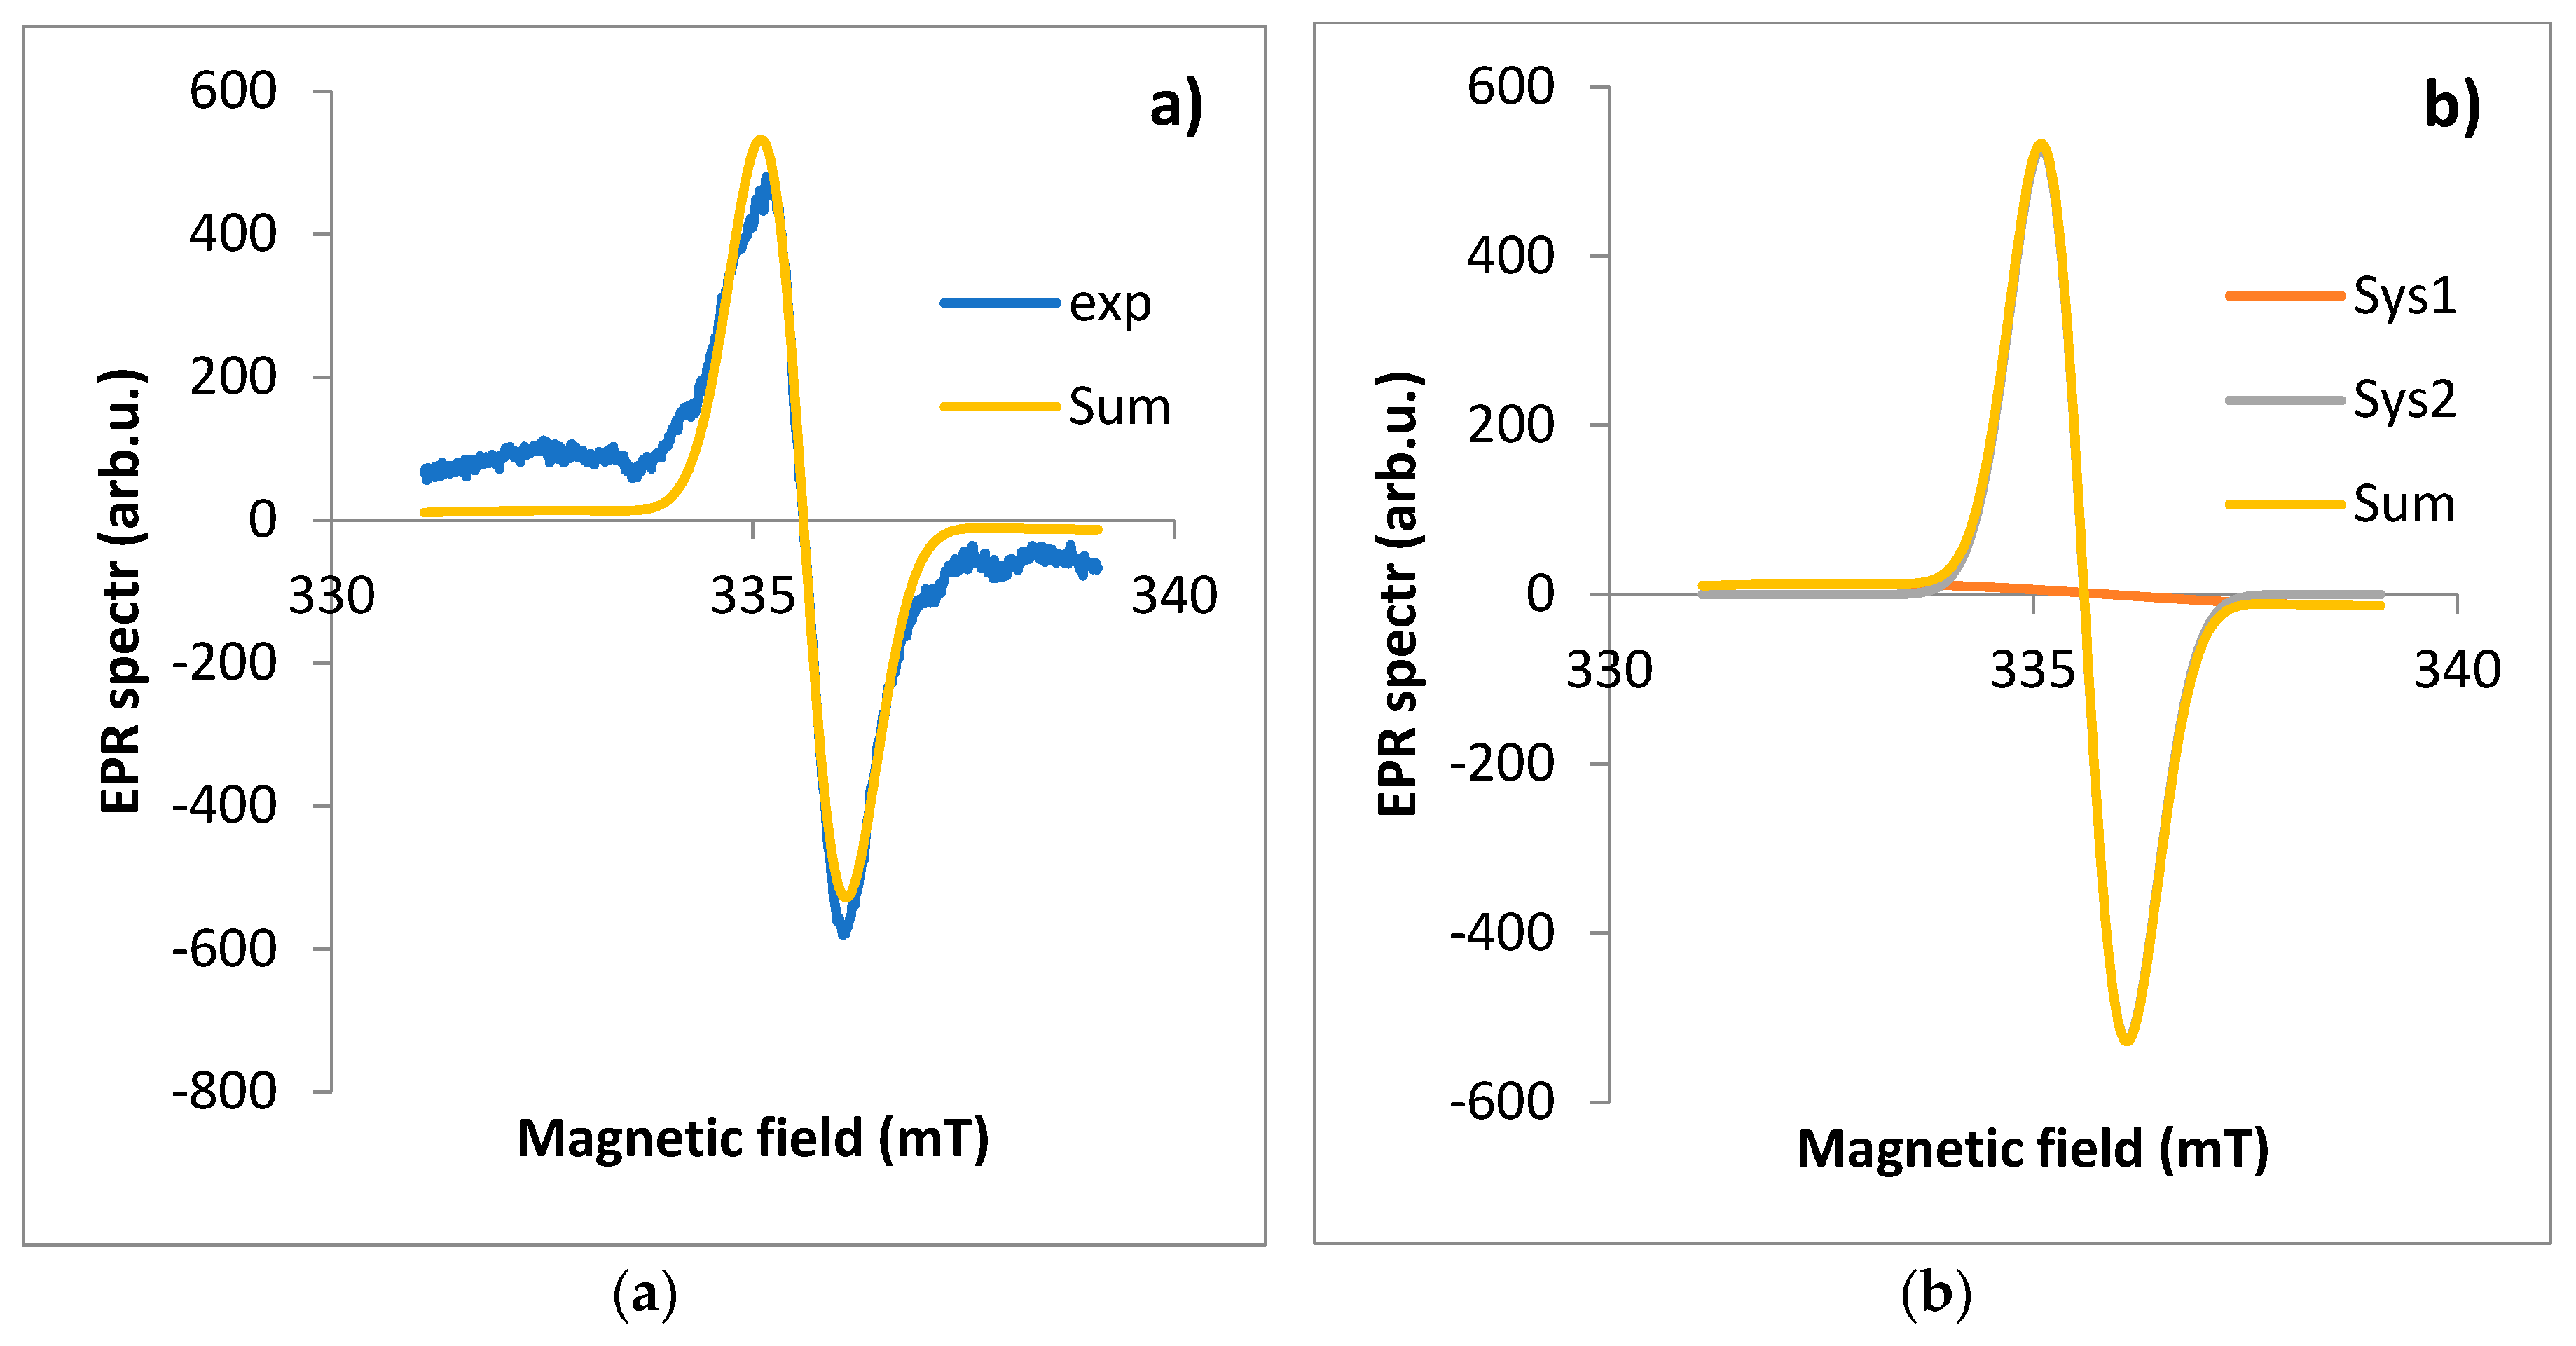
Figure 3). The observed line is a composite of at least two lines. Two components of the EPR line were extracted using EasySpin software (version 5.2.35). The most characteristic EPR spectra of each part from a single plant (17.04.2020, site No. D1) were selected for analysis. In the first step, the experimental spectrum was “fit” to two EPR lines. The results are shown in
Table 1.
The A component is characterized by a much higher intensity of the EPR line than the B component. The component of the spectrum (A) with a value of g
eff < 2.003 is a signal from carbon from air pollutants (based on the literature [
15], while the other component (B) is from all other radicals of various origins (including C and C+O). The A lwpp values for the leaf are significantly higher than for the other parts of the plant. The total intensity of the A component corresponding to the dust-derived radicals (A weight) is 6.58 times higher than for the B component. For the other plant organs, the intensities of the two components are similar (
Table 1). It was also found that for a leaf harvested in spring, the g
eff values are similar and significantly lower than for leaves harvested in autumn. We note that for the other organs the proportion of A/B components = 1, while for the leaf this ratio is 6.58. Example results of EPR spectrum fit for the other parts of the plant are shown in
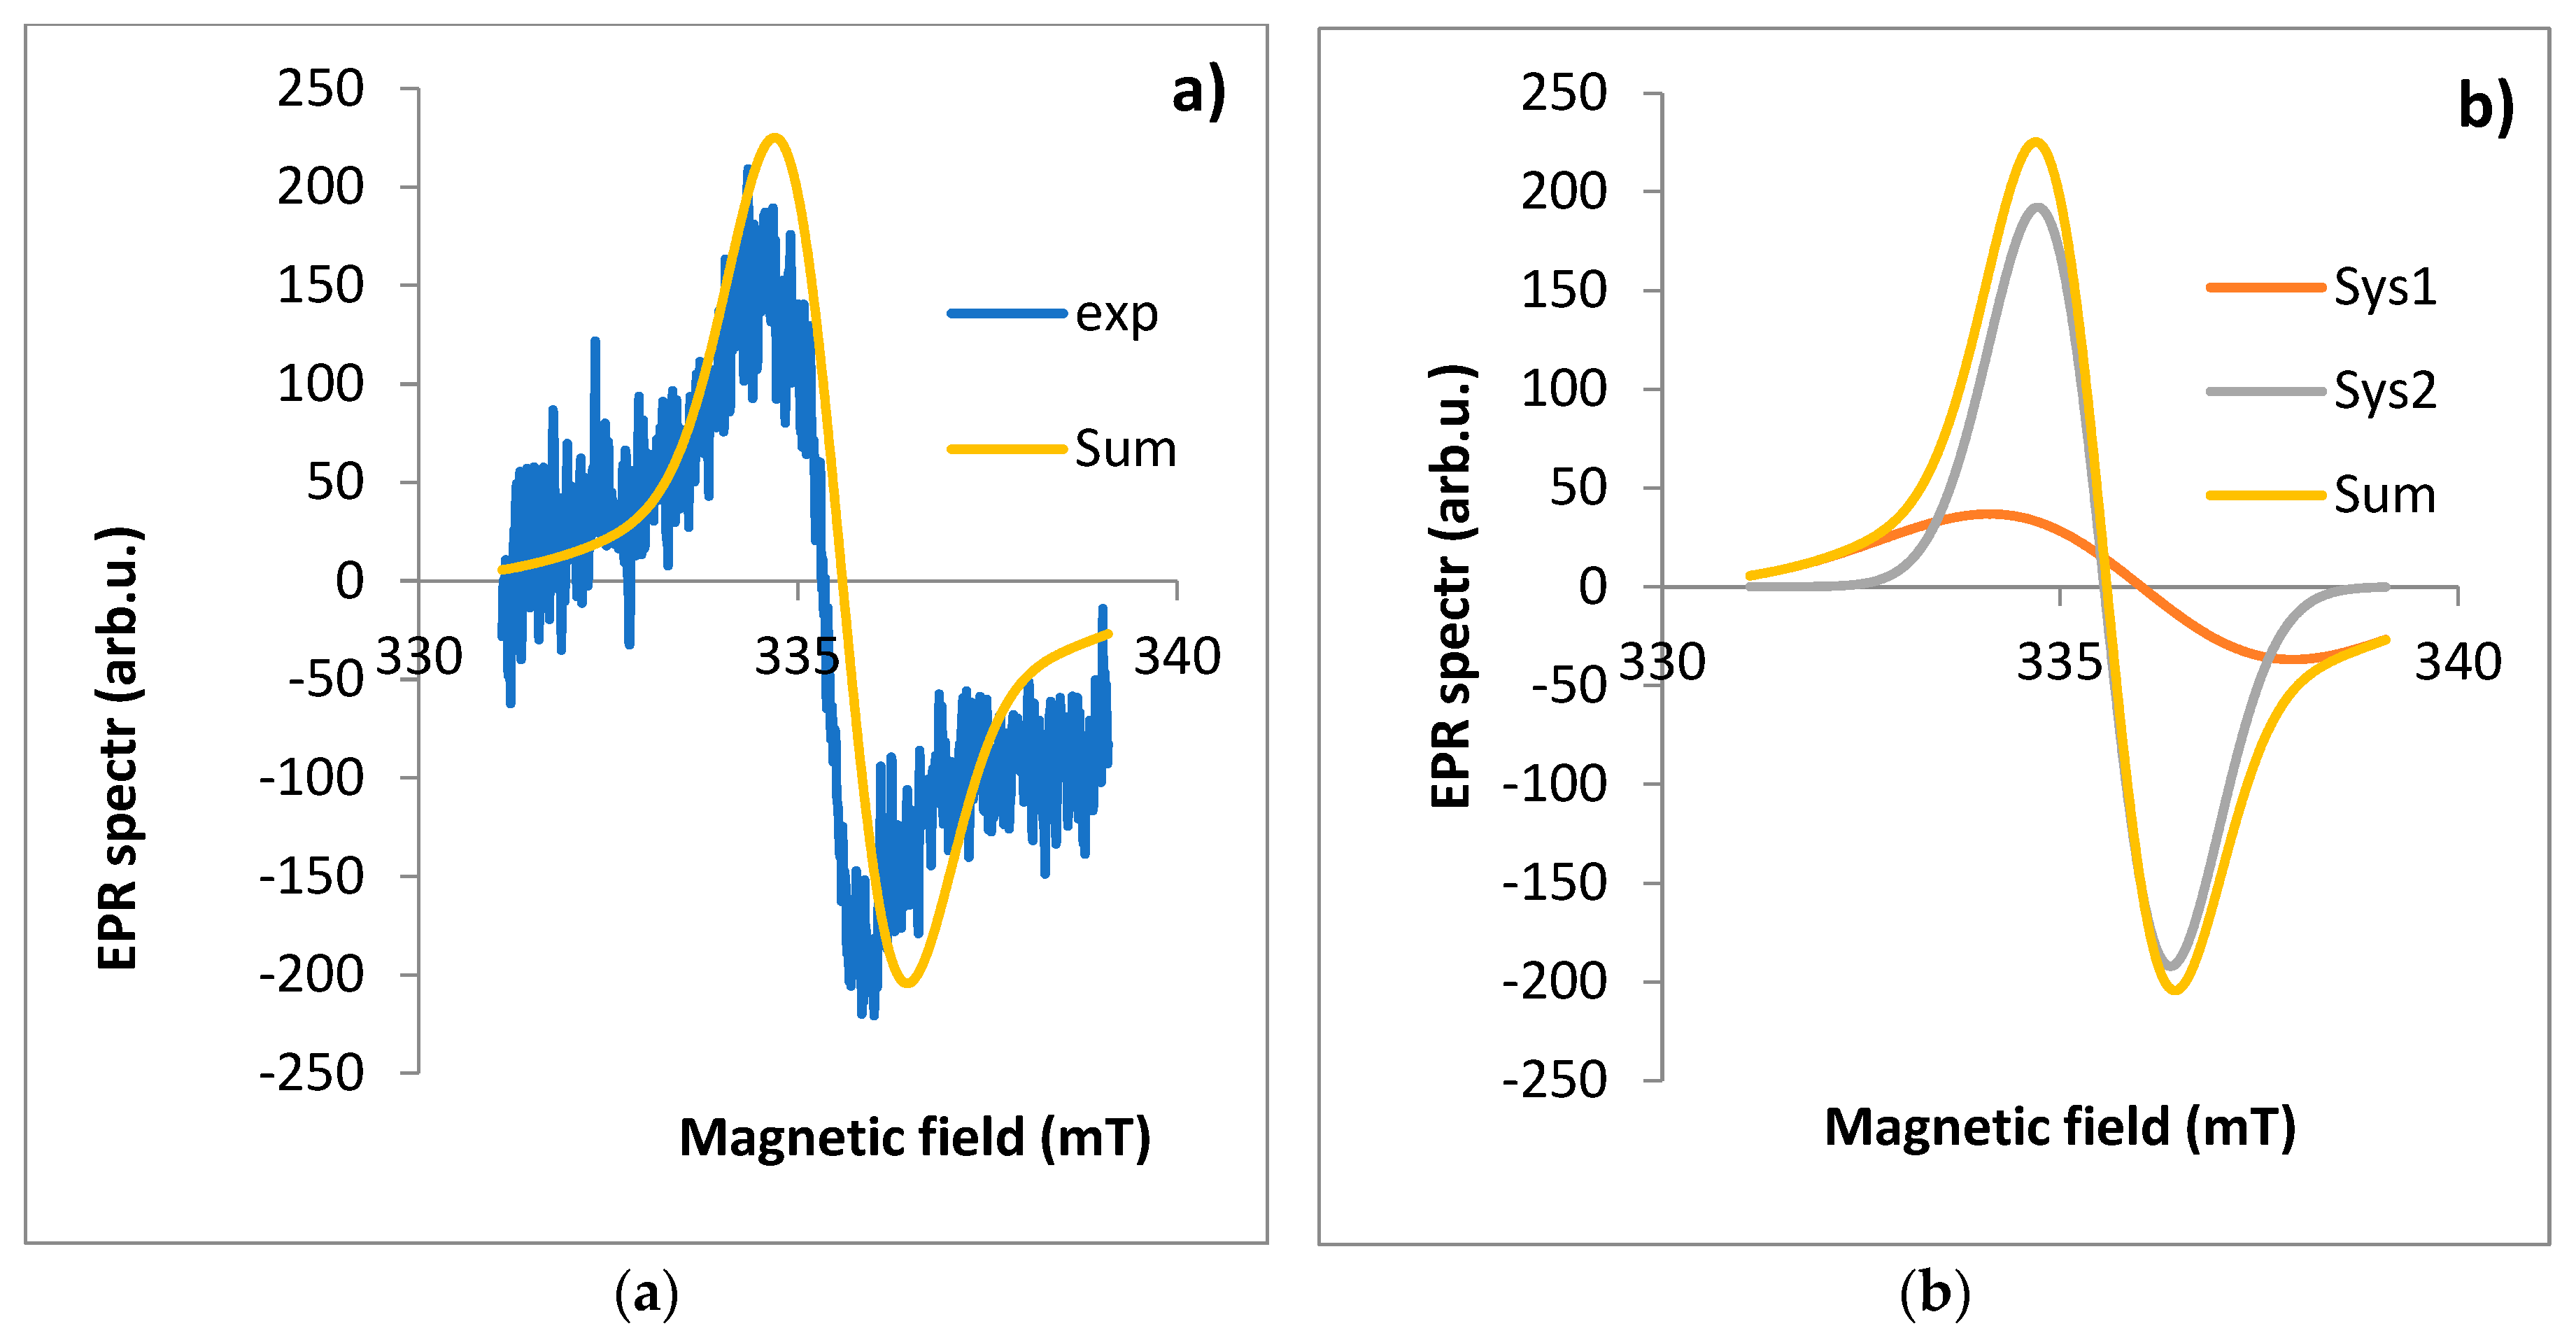
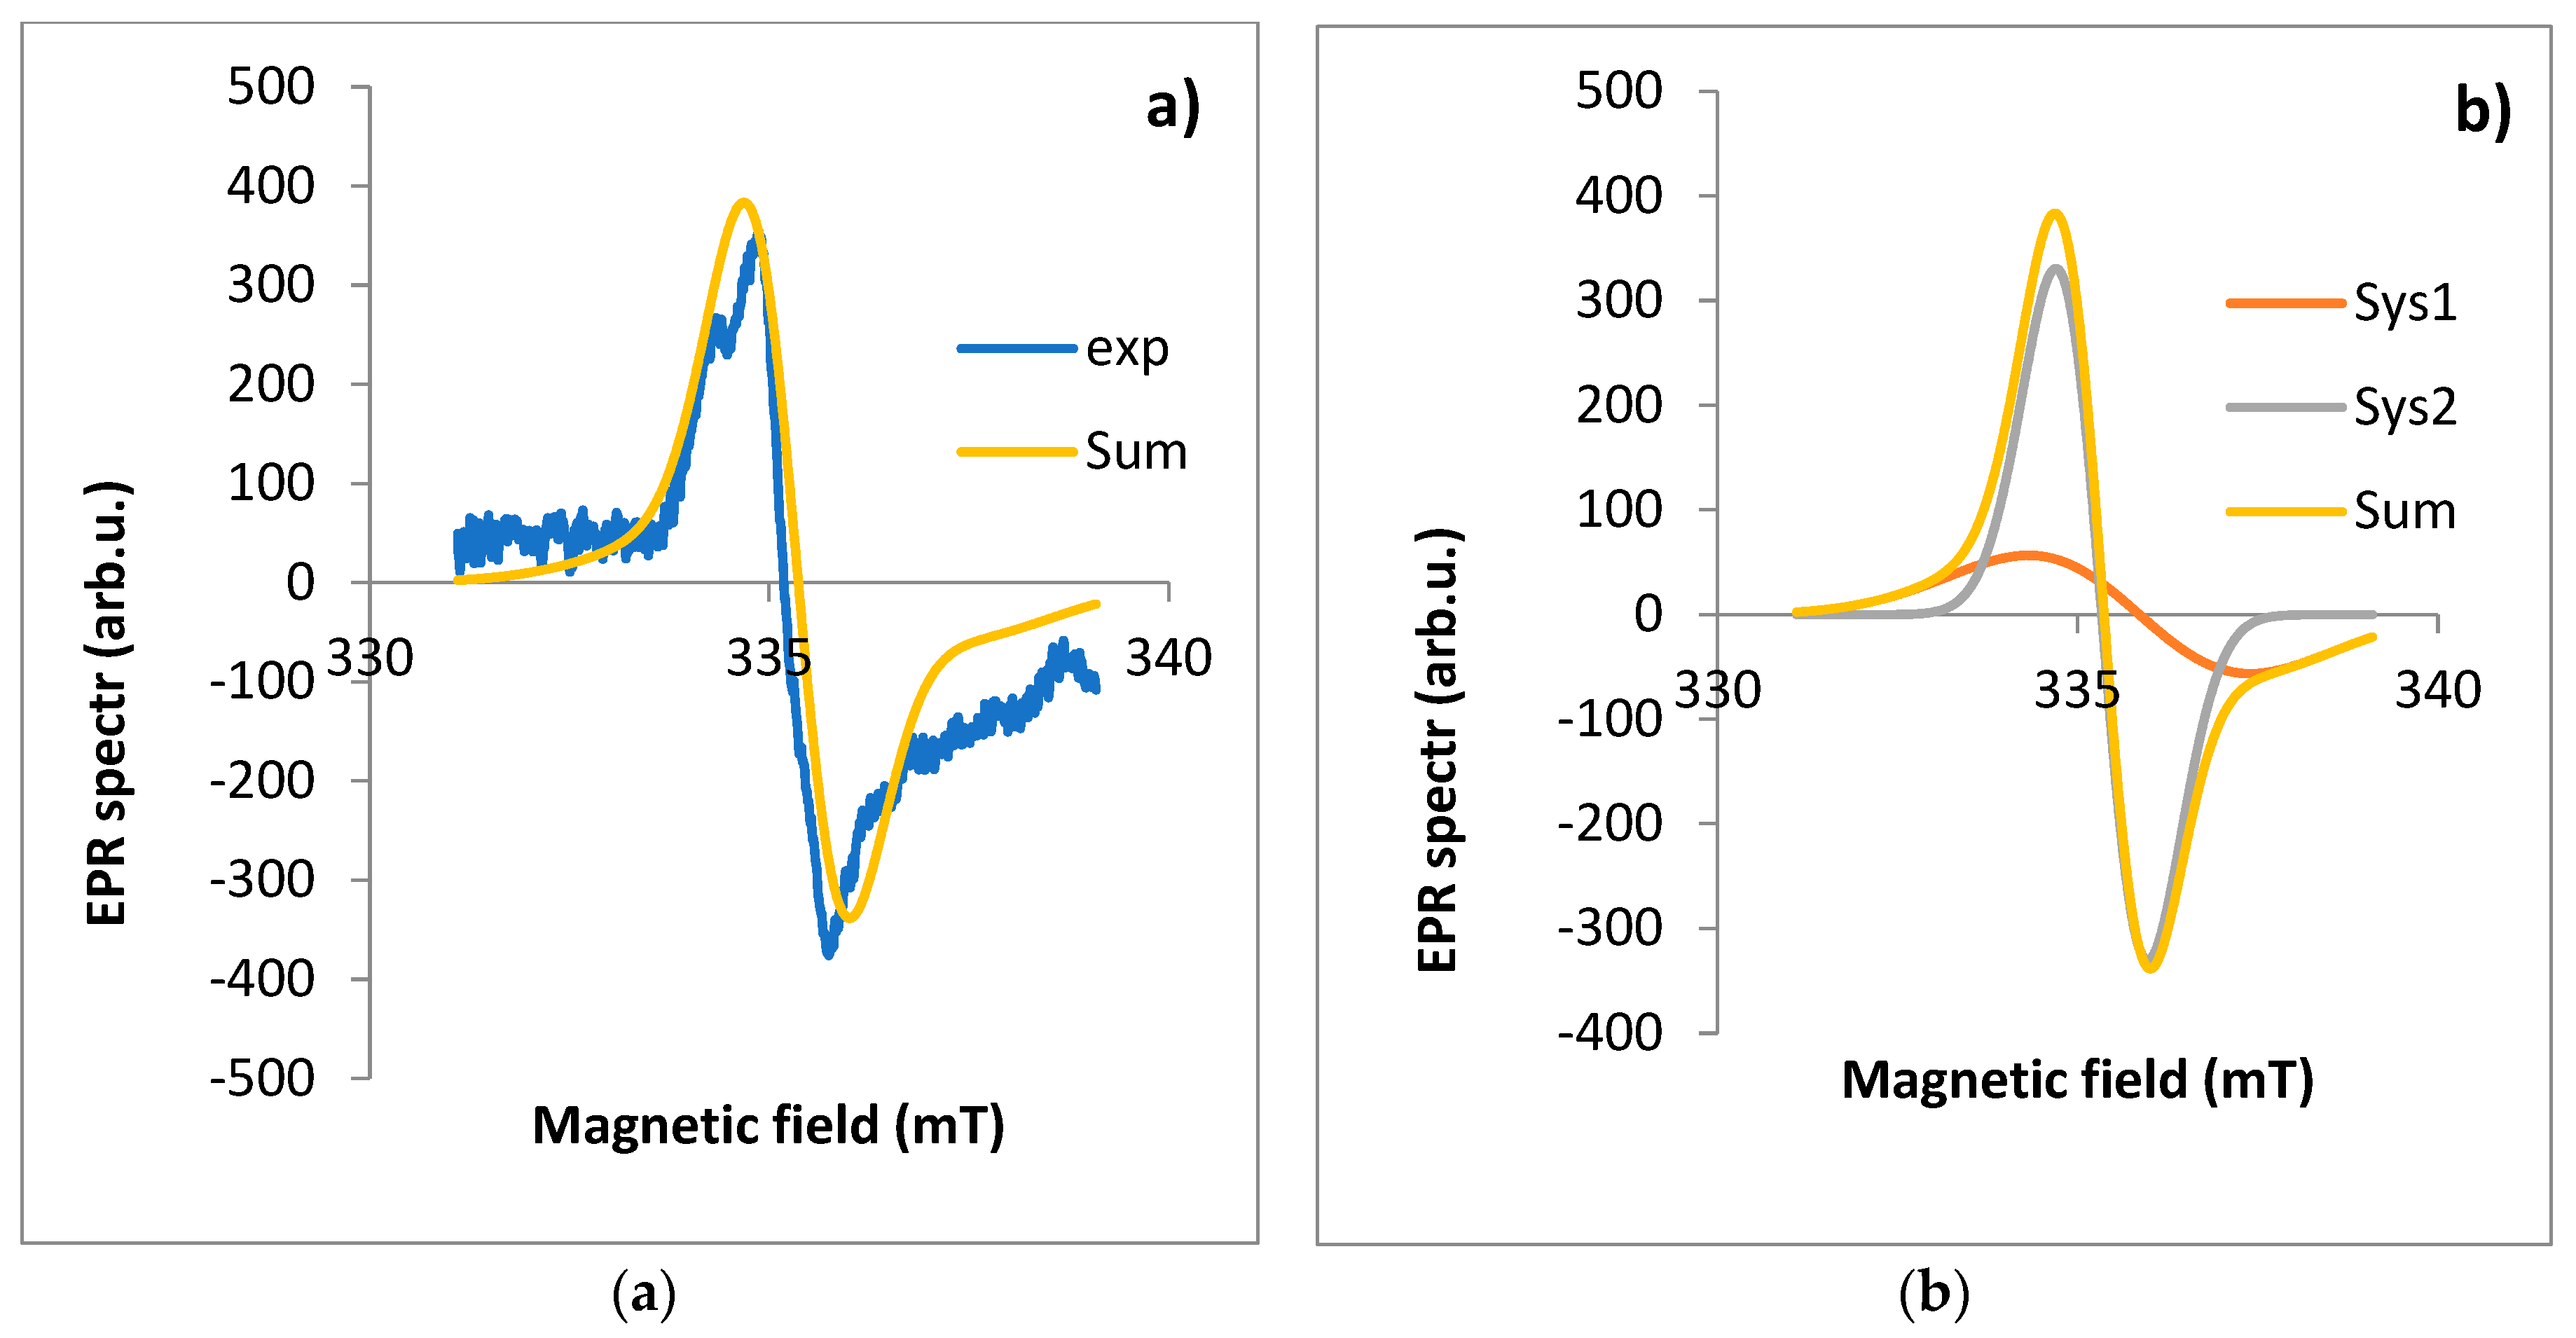
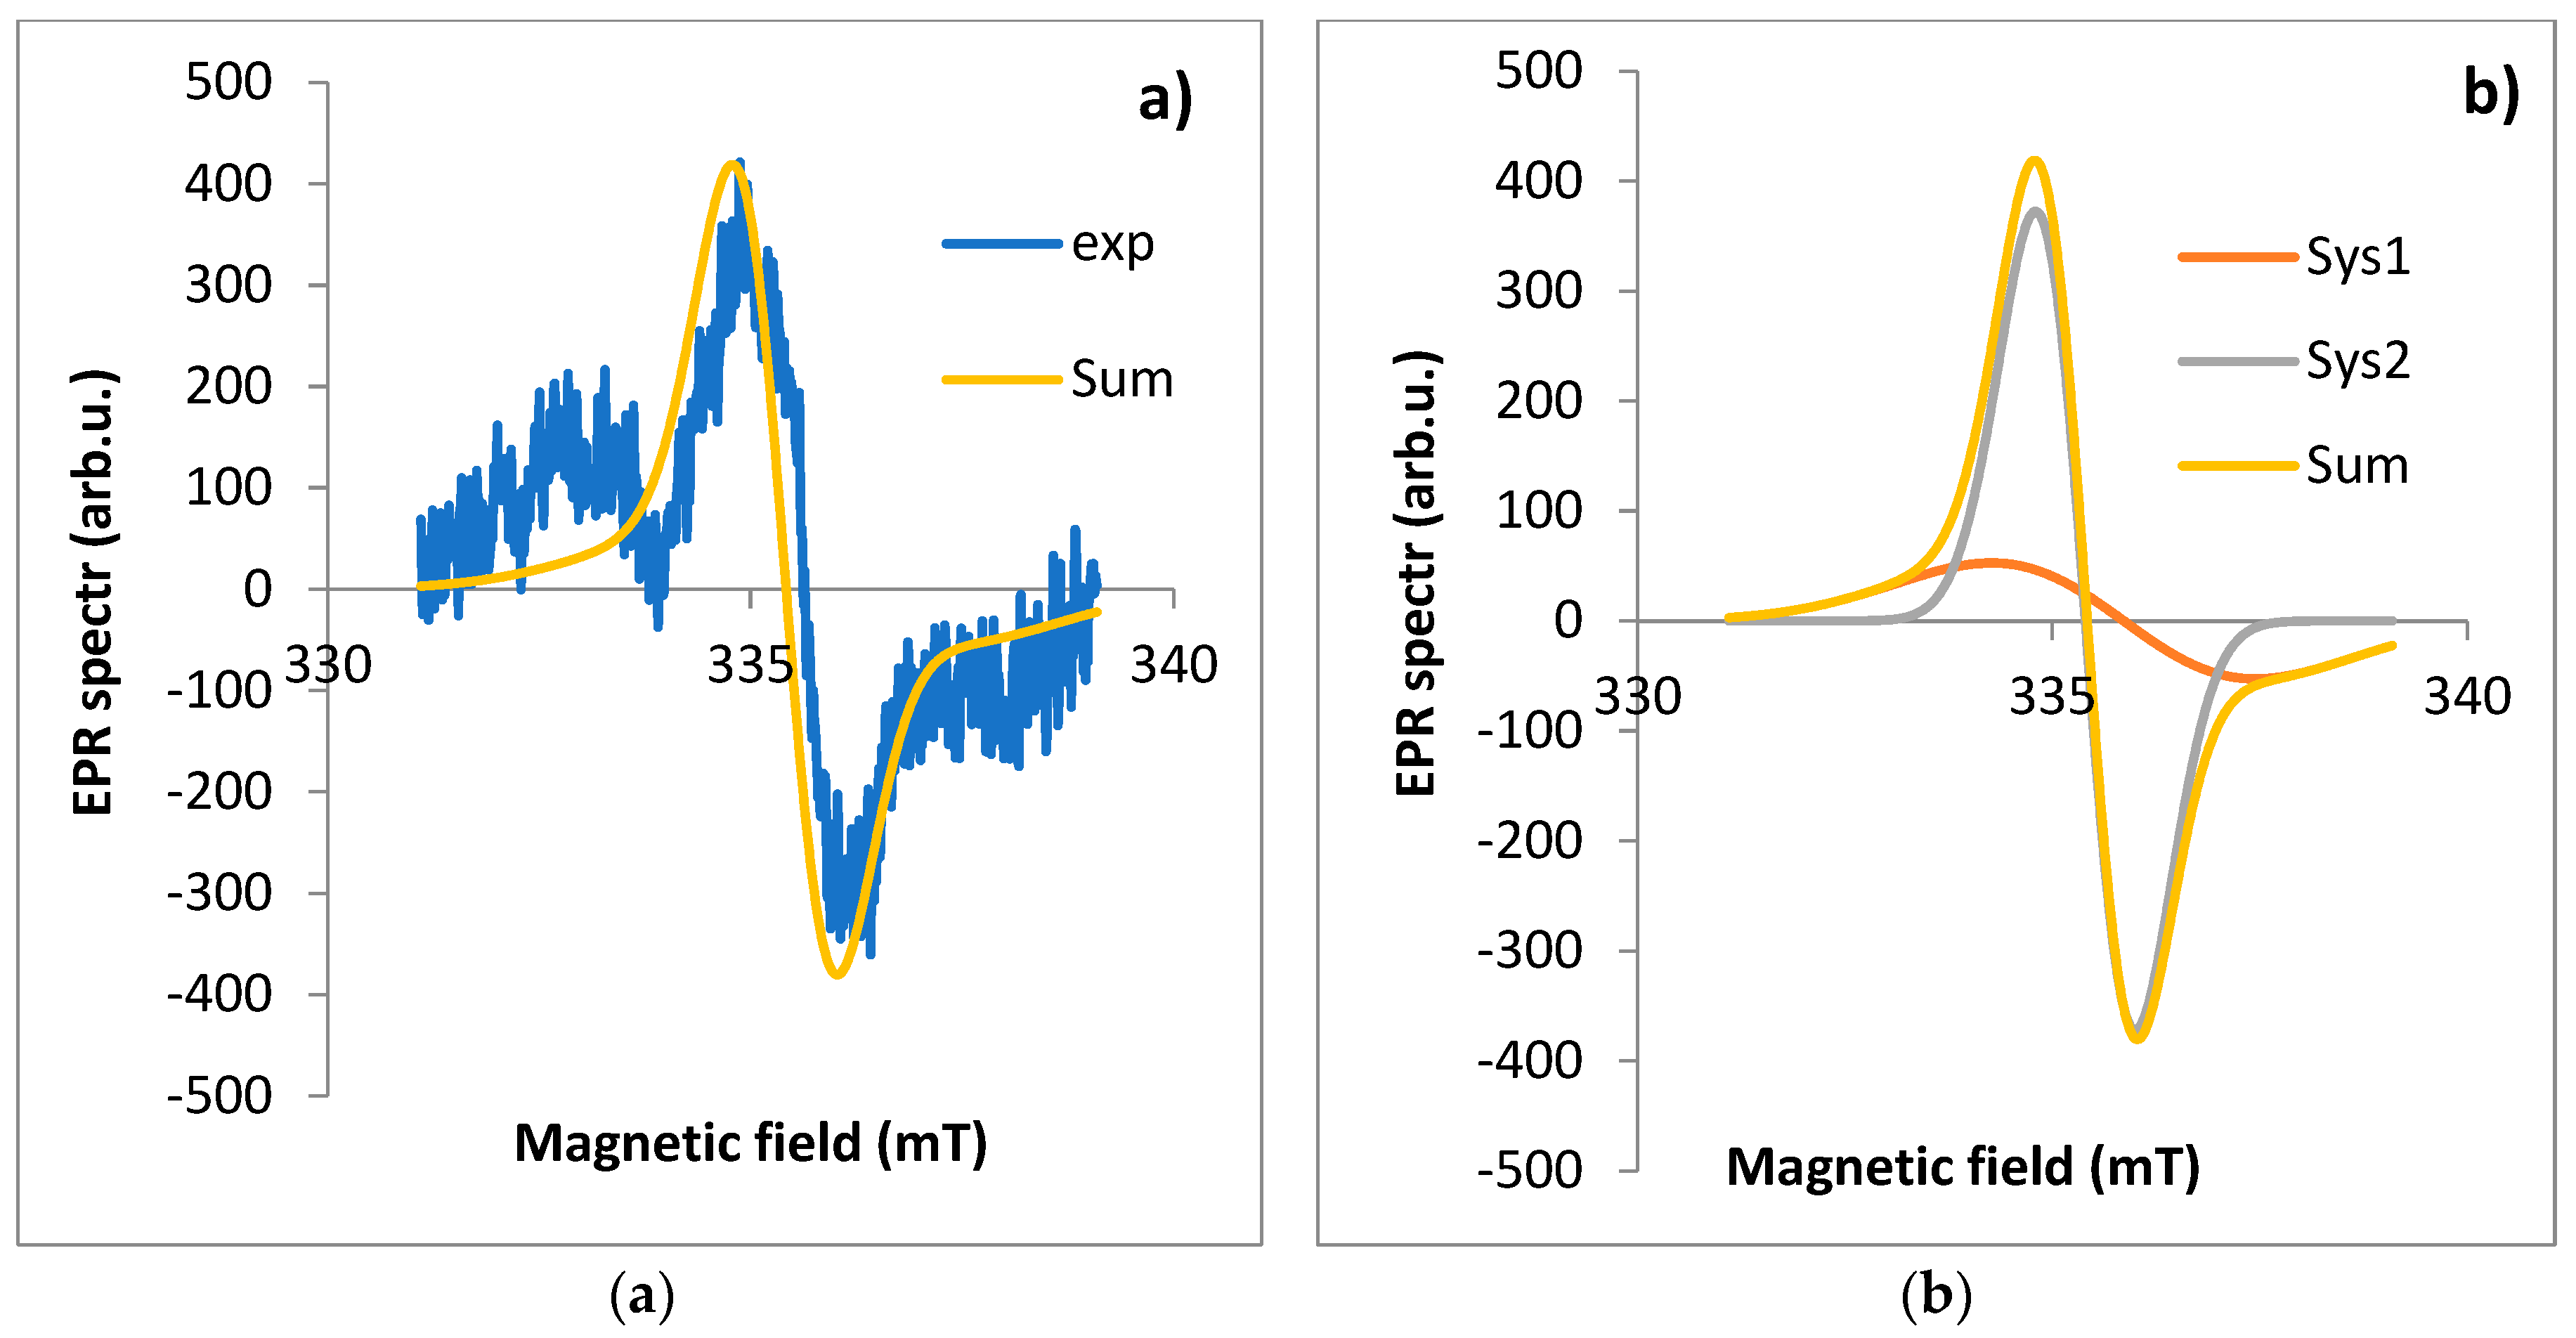
Figure 4,
Figure 5,
Figure 6 and
Figure 7 part a.
The second step of the analysis was to simulate the full EPR spectrum with its components to verify the parameters of the EPR spectra obtained by fitting.
Figure 4,
Figure 5,
Figure 6 and
Figure 7 show the theoretical spectra for components A and B and the full theoretical spectrum.
Based on the EPR results obtained (
Table 1) and described in the literature, a relationship was observed between the value of g
eff and the type of radical, in a given part of the plant. Generally, the values of the g
eff factor < 2.0030 are associated with C-centered radicals, the range 2.0030-2.0040 is associated with a mixture of O- and C-centered radicals, and >2.0040 are associated with O-centered radicals [
26]. The fit results obtained indicate that component A is characterized by a value of g
eff < 2.003, which indicates a radical C, while component B is associated with oxygen and carbon radicals. In the root, flower stalk, and inflorescence, C and O-type radicals are equally present, while in the leaf, C-type radicals strongly dominate.
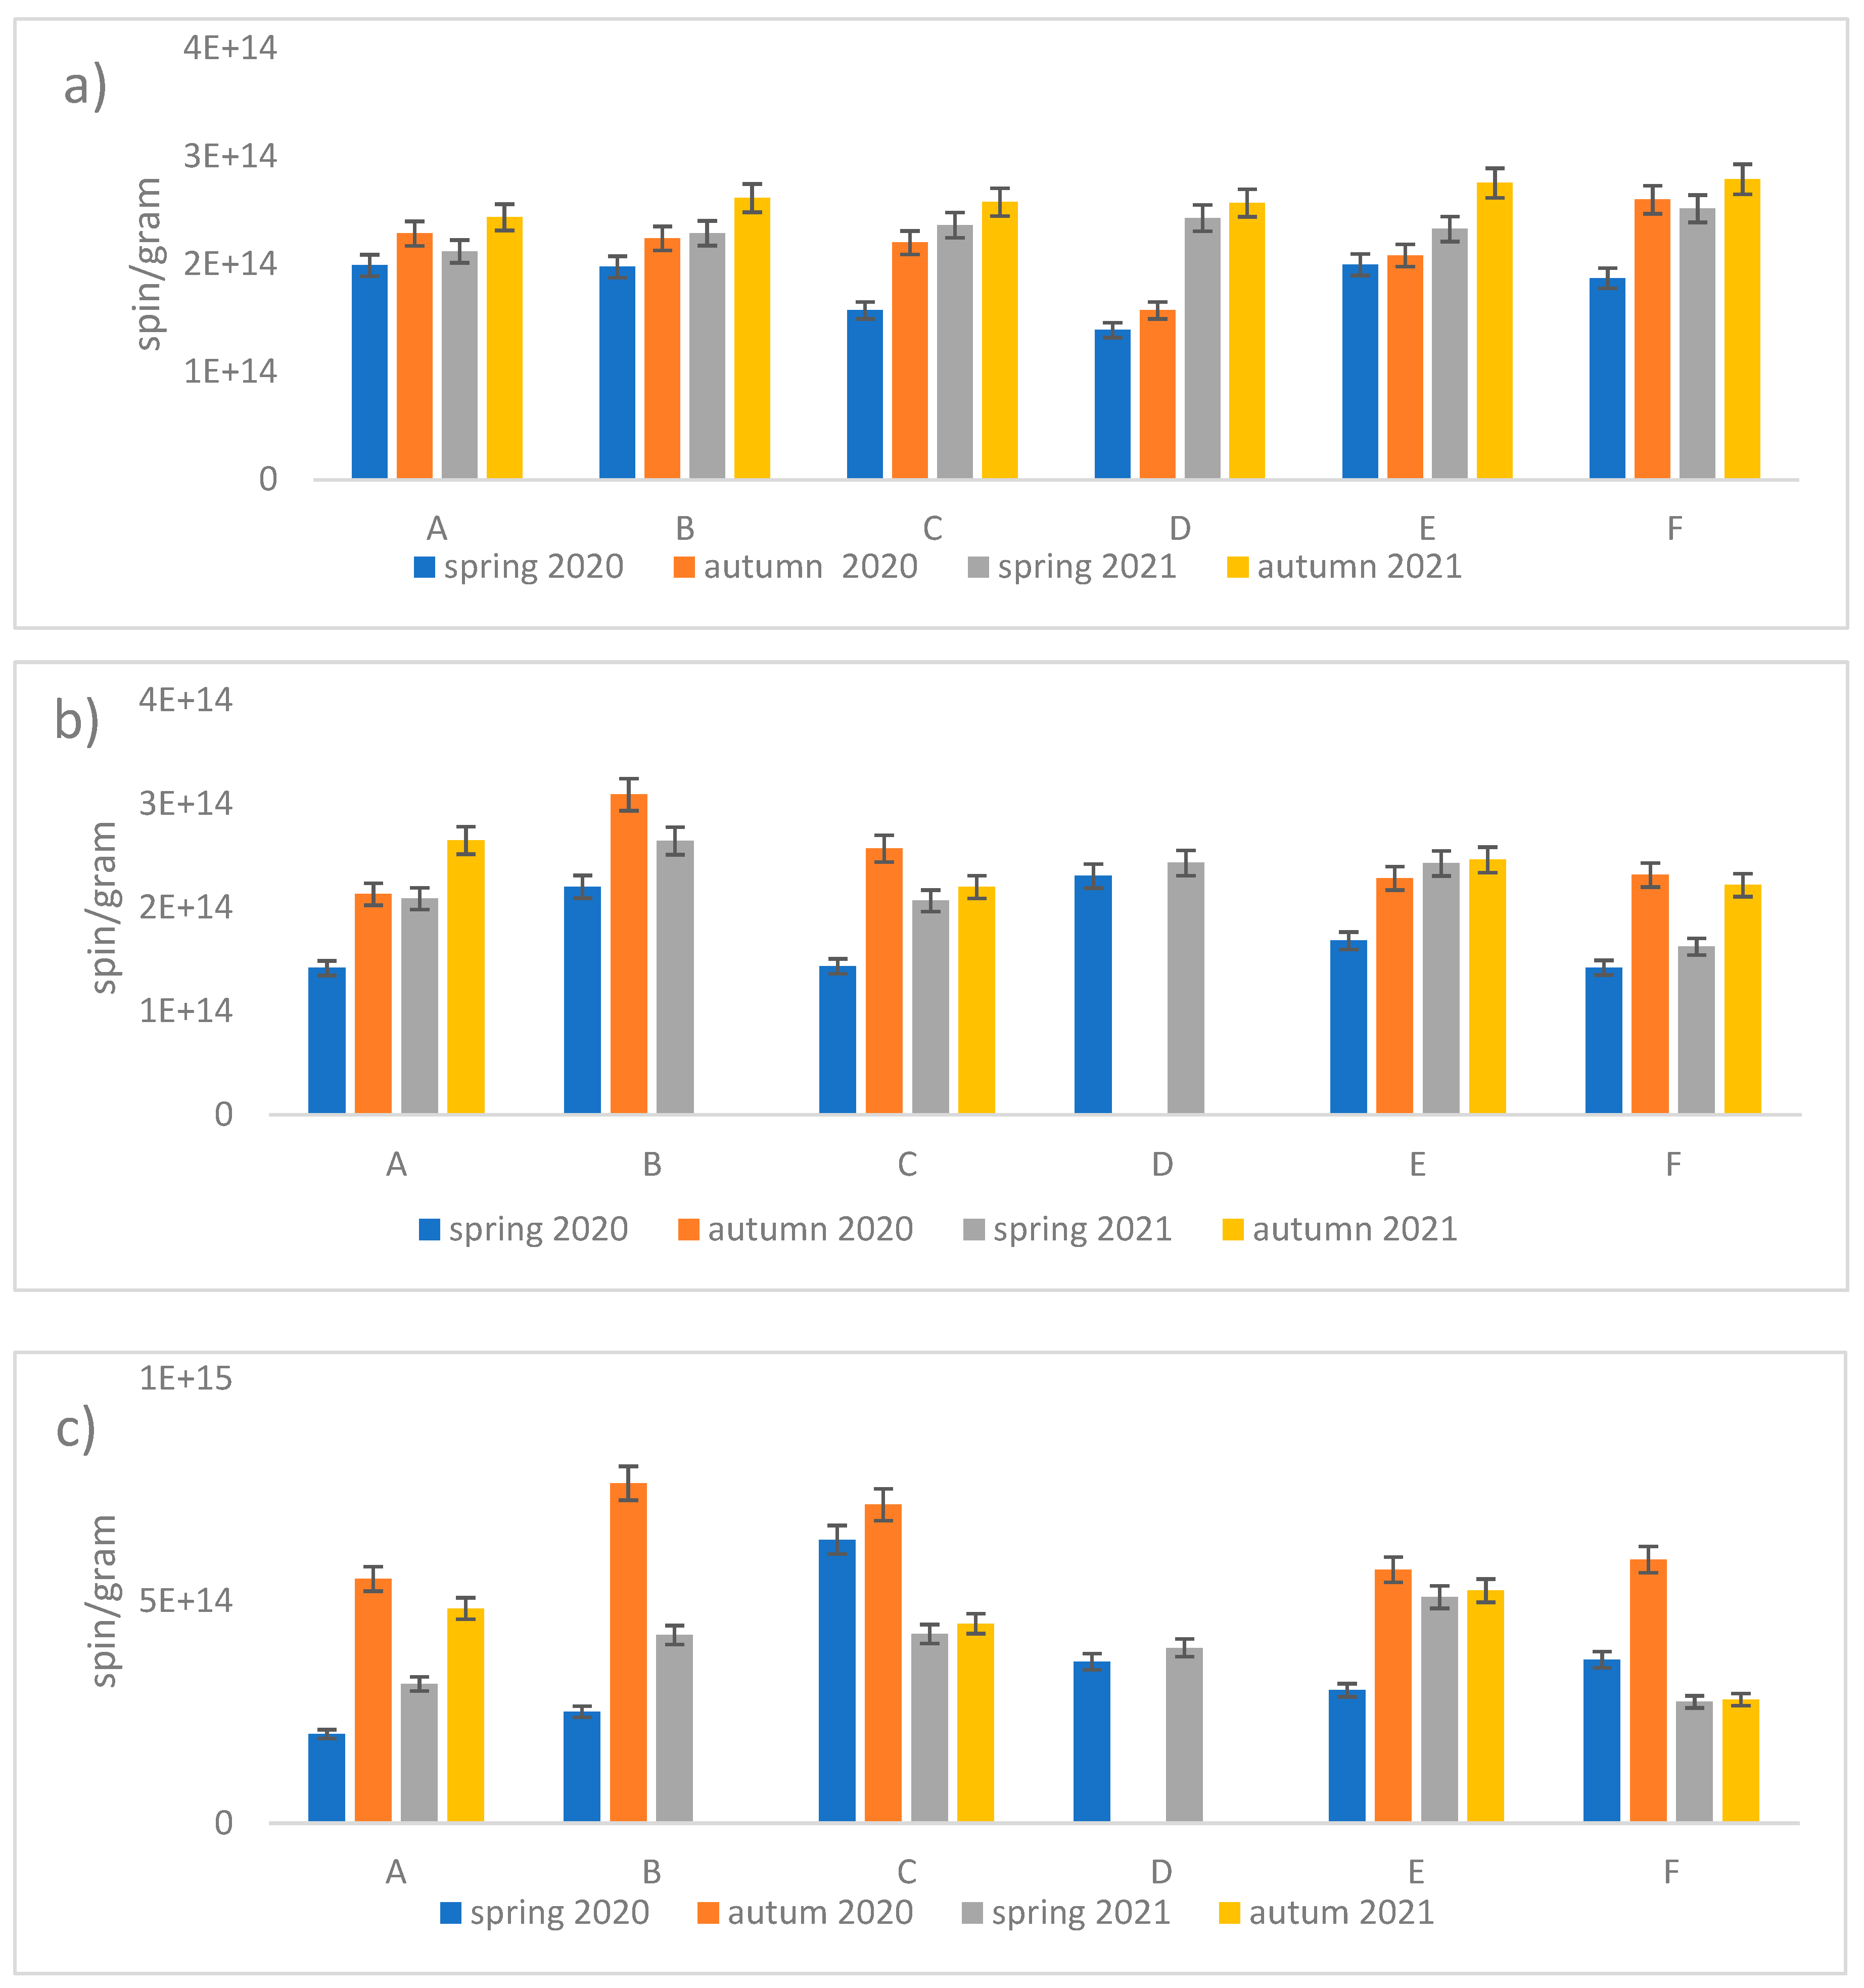
Measurements of the absolute number of spins were made for all parts of the plants for each location and season. Leaves had the highest FR content of 1.8×10¹⁵ spin/g. Inflorescences were the second most abundant organ in terms of FR at 5×10¹⁴ spin/g.
Analyzing the results for the root and the flower stalk, we note slight differences with a slight trend indicating a higher value of radicals measured in autumn in both series. However, for inflorescence and leaf, the differences are much larger and indicate a much greater increase in the number of radicals in autumn. Additionally, we note that in autumn 2020 the highest radical values of the entire range of tests were obtained (
Figure 1c and
Figure 8).
We note that in the case of the root there is practically no correlation, for the stem we can see a slightly higher value for position B and D compared to the others. For the flower, we note that site C has the highest value of EPFRs, while the results for B and D may have more errors due to the smaller number of flowers included in the study. The EPFR results for the leaf also show the highest value for site C followed by B and D with the lowest value for site A (
Figure 1c and
Figure 8).
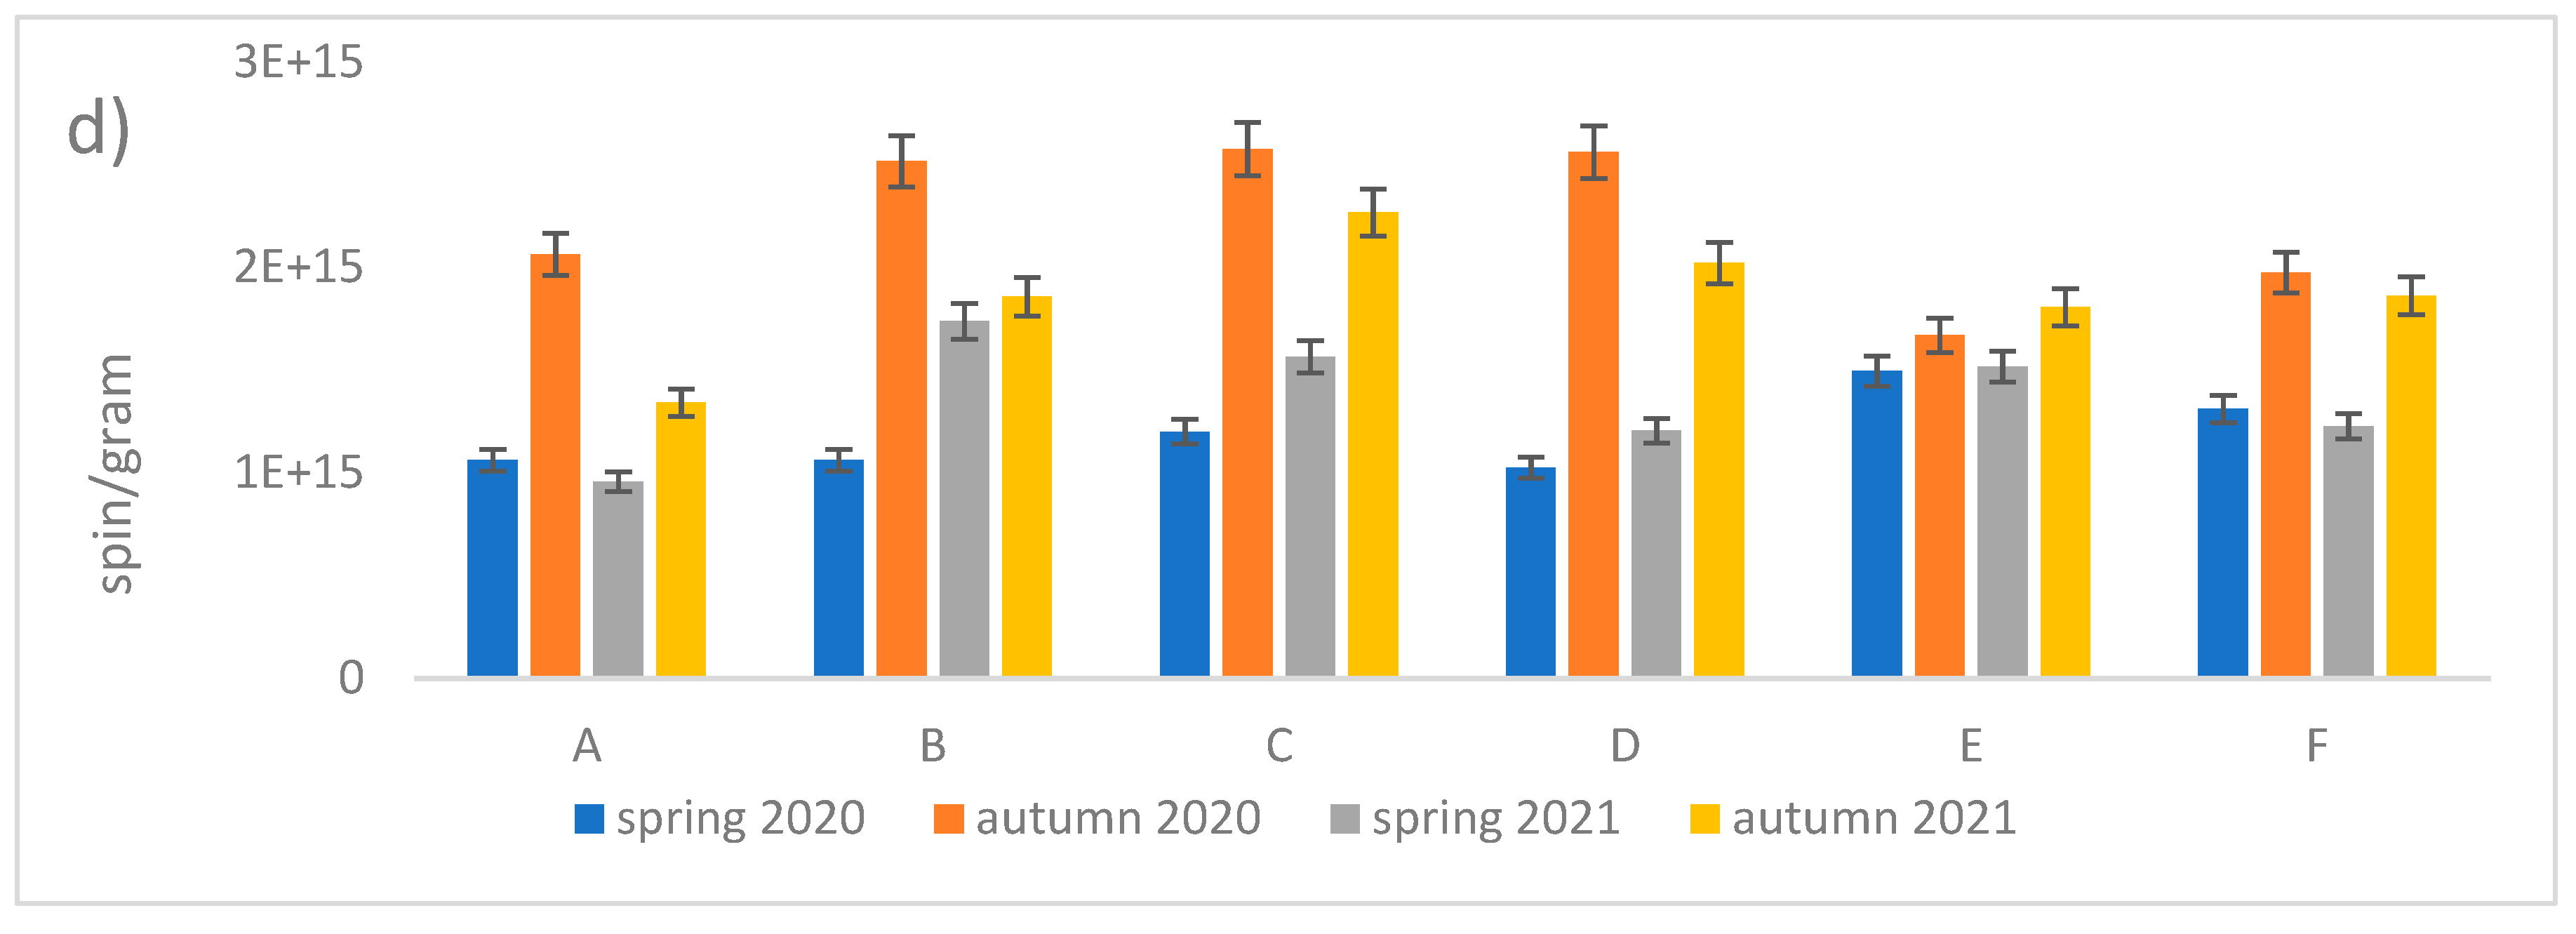
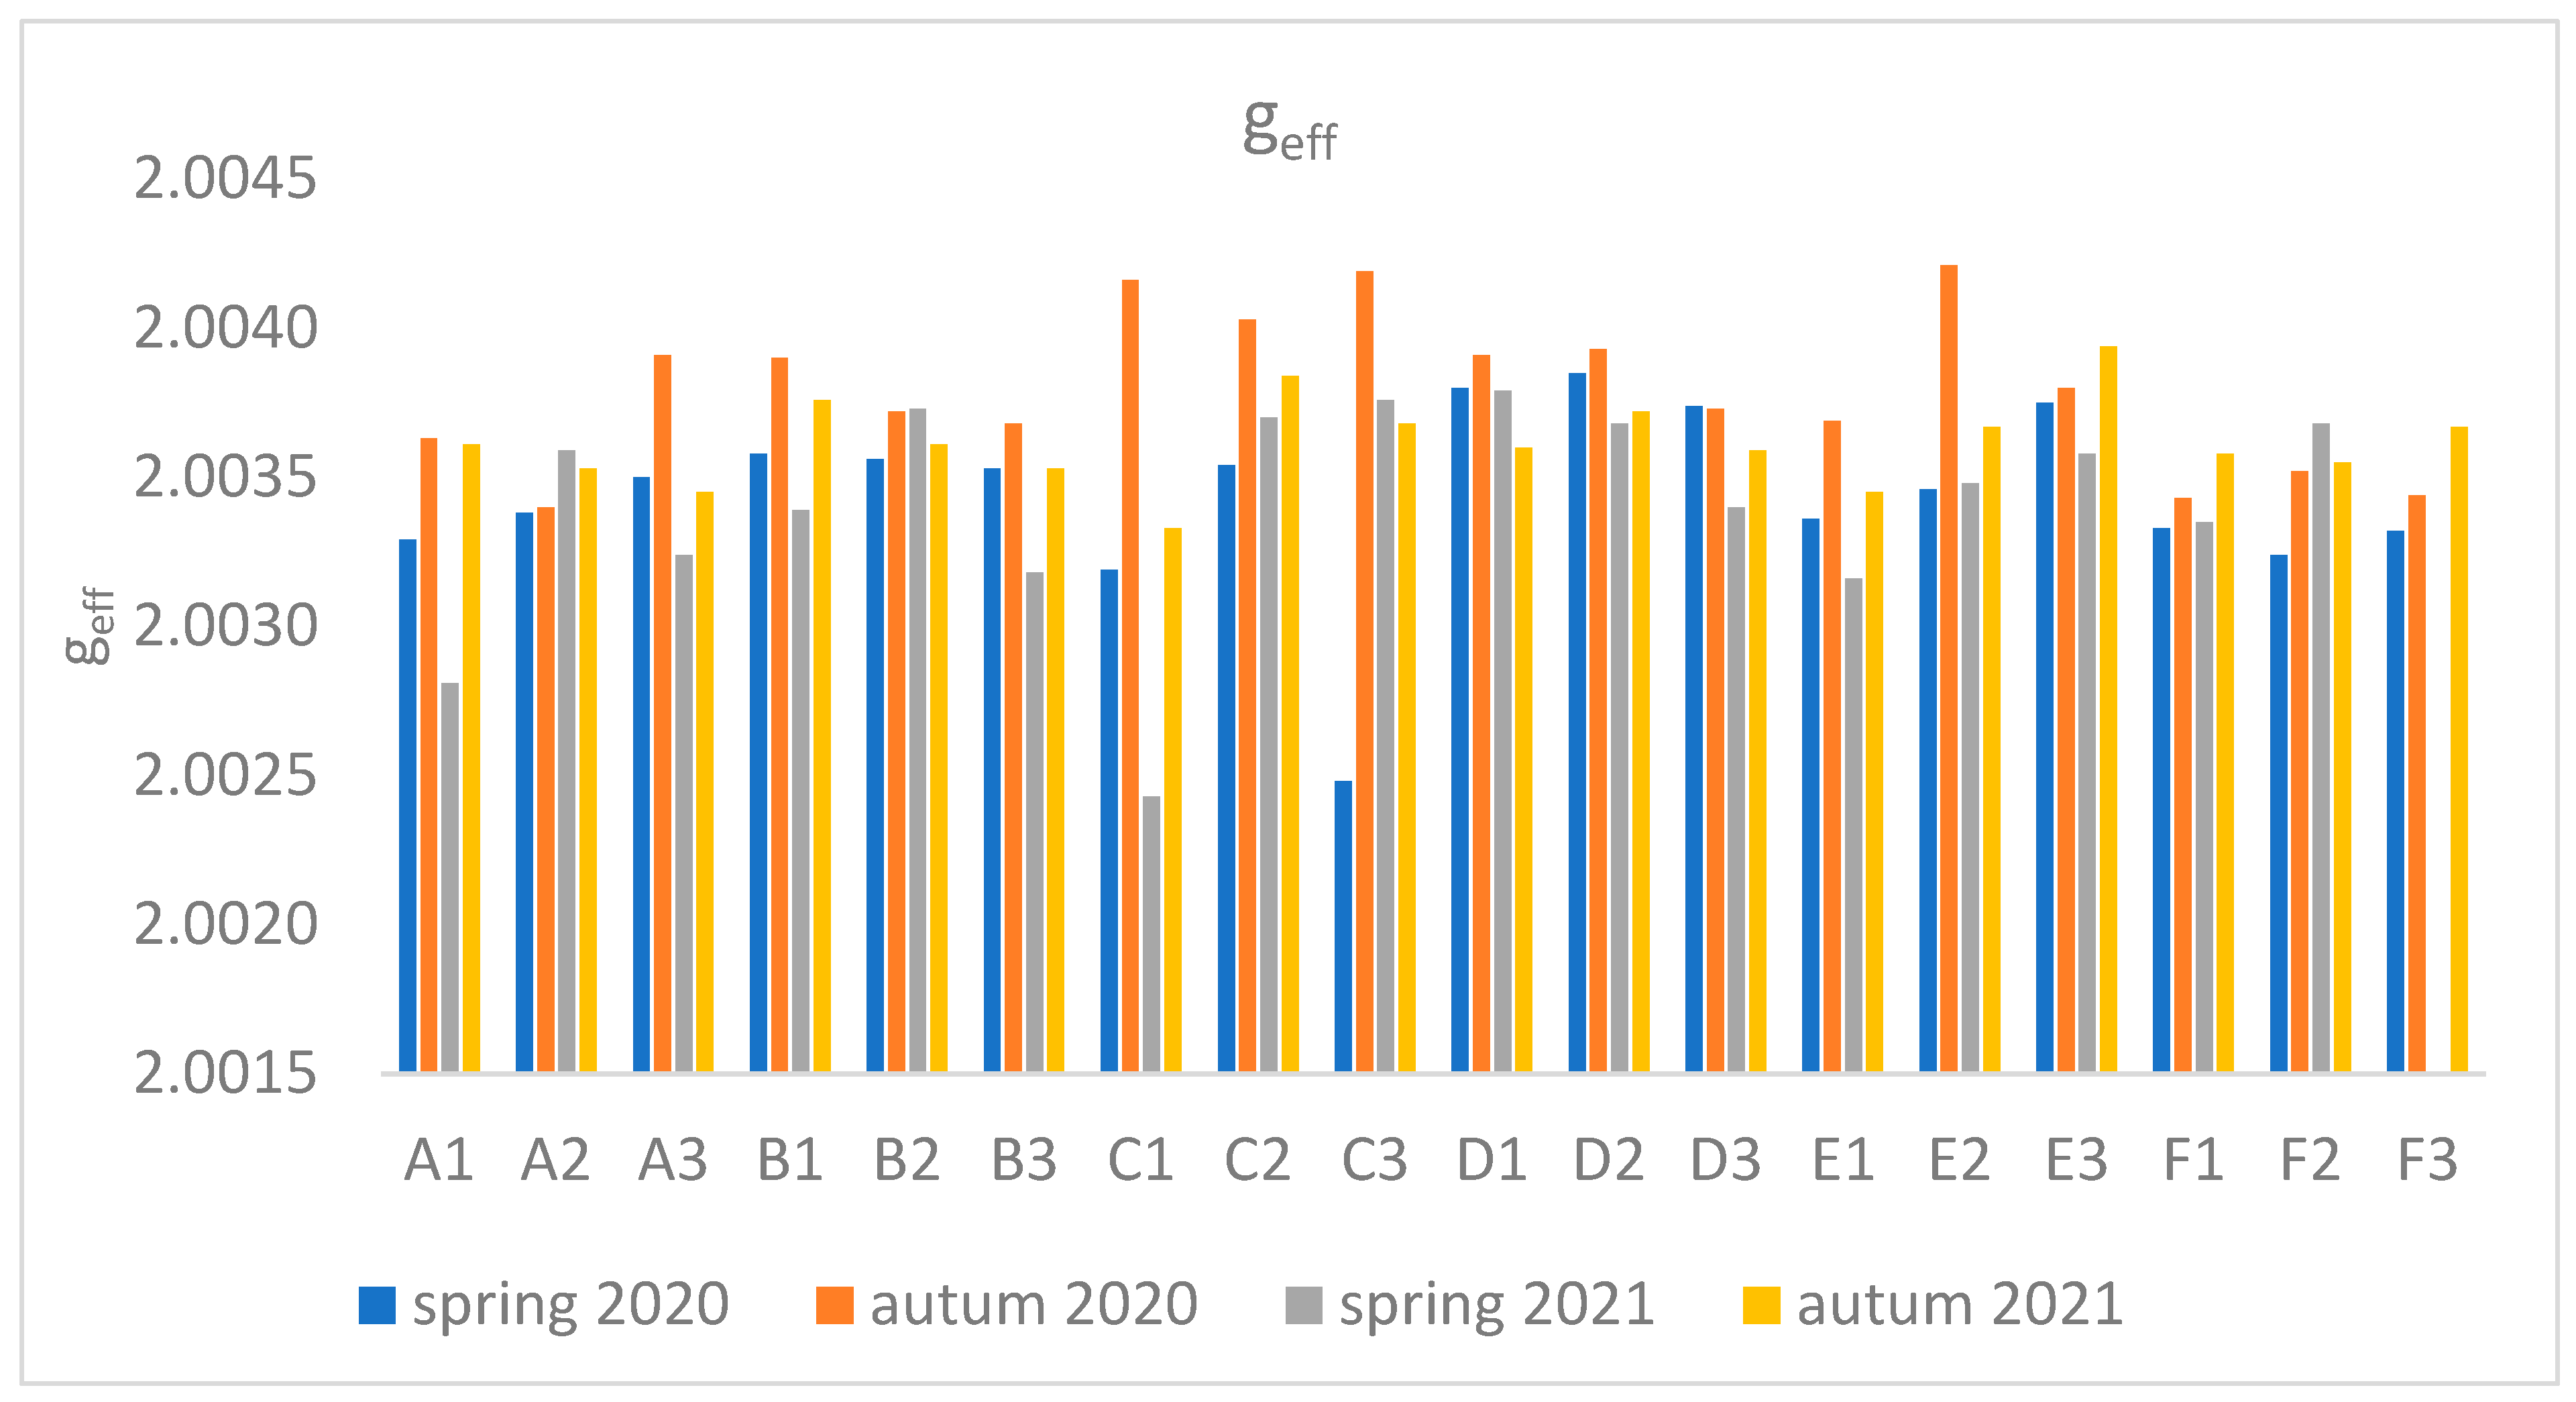
A detailed analysis of the mean values of g
eff was performed for leaves (see
Figure 1d and
Figure 9). The obtained values show large differences. The linear analyses presented in
Table 1 reveal that both C and O radicals are present in the leaves, but the proportion of the former is much higher. Furthermore, with increasing g
eff values, there is an increase in the number of oxygen radicals, whose origin of which can be linked to EPFRs and other environmental factors.
Analyzing the results of EPFR measurements taking into account the number of spins, the geff value, and air pollution, we notice regularities. For autumn 2020, the largest geff values were obtained (an increase in O radicals), an increase in radicals compared to spring 2020. The air pollution measurements for spring and autumn 2021 agree quite well with the EPFR measurements for flowers. This can be explained by the relatively short lifespan of the flower compared to the leaf, and for air pollution measurements on the day the sample is collected, the flower will be most suitable for short-term pollution measurements. For long-term averaged measurements of air pollution, the leaf will be the best. Measurements of environmental factors, averaged air temperatures and average temperatures near the ground and sunshine were carried out, and the results are shown in the supplement. We obtain a good correlation between average temperature, temperature at ground level, and the total number of fragrant radicals. Sunshine, on the other hand, agrees only for the 2021 seasons.
3. Discussion
Free radicals are ubiquitous in nature. They are formed under the influence of solar radiation, UV radiation, ionizing radiation, electrical discharges. However, combustion processes (of anthropogenic and natural origin), and traffic-related pollution, are sources of persistent long-lived free radicals (EPFRs). The study of FR content, in particular EPFR, by EPR is not very common and comprehensive, as they highlighted in their literature review Xu et al. [
13]. Studies on the content of FR by EPR are not very common. High values (10
18-10
20 spin/g) are recorded in, for example, biocarbons or particulate matter. Plants under stress are characterized by an elevated FR content (10
16-10
18 spin/g) [
12,
13,
27,
28]. Vejerano and Ahn [
23] estimated the content of persistent biogenic free radicals at the level of 10
15-10
16 spin/g. while demonstrating that the needles contained less FR then the leaves of broadleaf trees. Comparison of the data presented in the literature with those obtained from the study indicates that the number of FR present in various dandelion organs at 10
14-10
15 spin/g is a low value. The observed differences between sites, seasons, and organs prompt the search for probable causes. Although the sites where the plants were collected differed in terms of PM pollution and traffic intensity, no simple link was shown between the content in FR and these variables. Leaves collected from the most trafficked site (A), located at the southern end of the city, contained relatively low levels of FR, whereas site C, located furthest north with much lower trafficking, had high levels of FR. It seems that the city ventilation factor is important and, in Rzeszow, the ventilation from the southeast sector is dominant. The important factor is also building structure in the city. Site B is located within a compact urban fabric conducive to the accumulation of pollutants, hence the stronger response of plants growing here to stress than at site D, where, despite the highest traffic load, due to the open space, pollutants can be blown in the northern and eastern directions. Reference sites E and F lie away from the main traffic routes, but the number of FR, including those of carbon origin recorded in the spring, was not at all the lowest. Other causes should be sought. During the heating season (spring campaigns 2000 and 2021), low emission pollution from single-family houses located in close proximity to site E could have been a serious stress factor. The study indicates that season is a clearly discriminating factor in the results. At each site, the number of FR was higher during the measurements in early autumn. In addition to radicals of carbon origin, we find those of oxygen origin. Temperature stress and atmospheric photochemical processes may be the cause of their formation [
12]. Insolation, UV radiation and ozone in the air positive correlate with the radical concentrations [
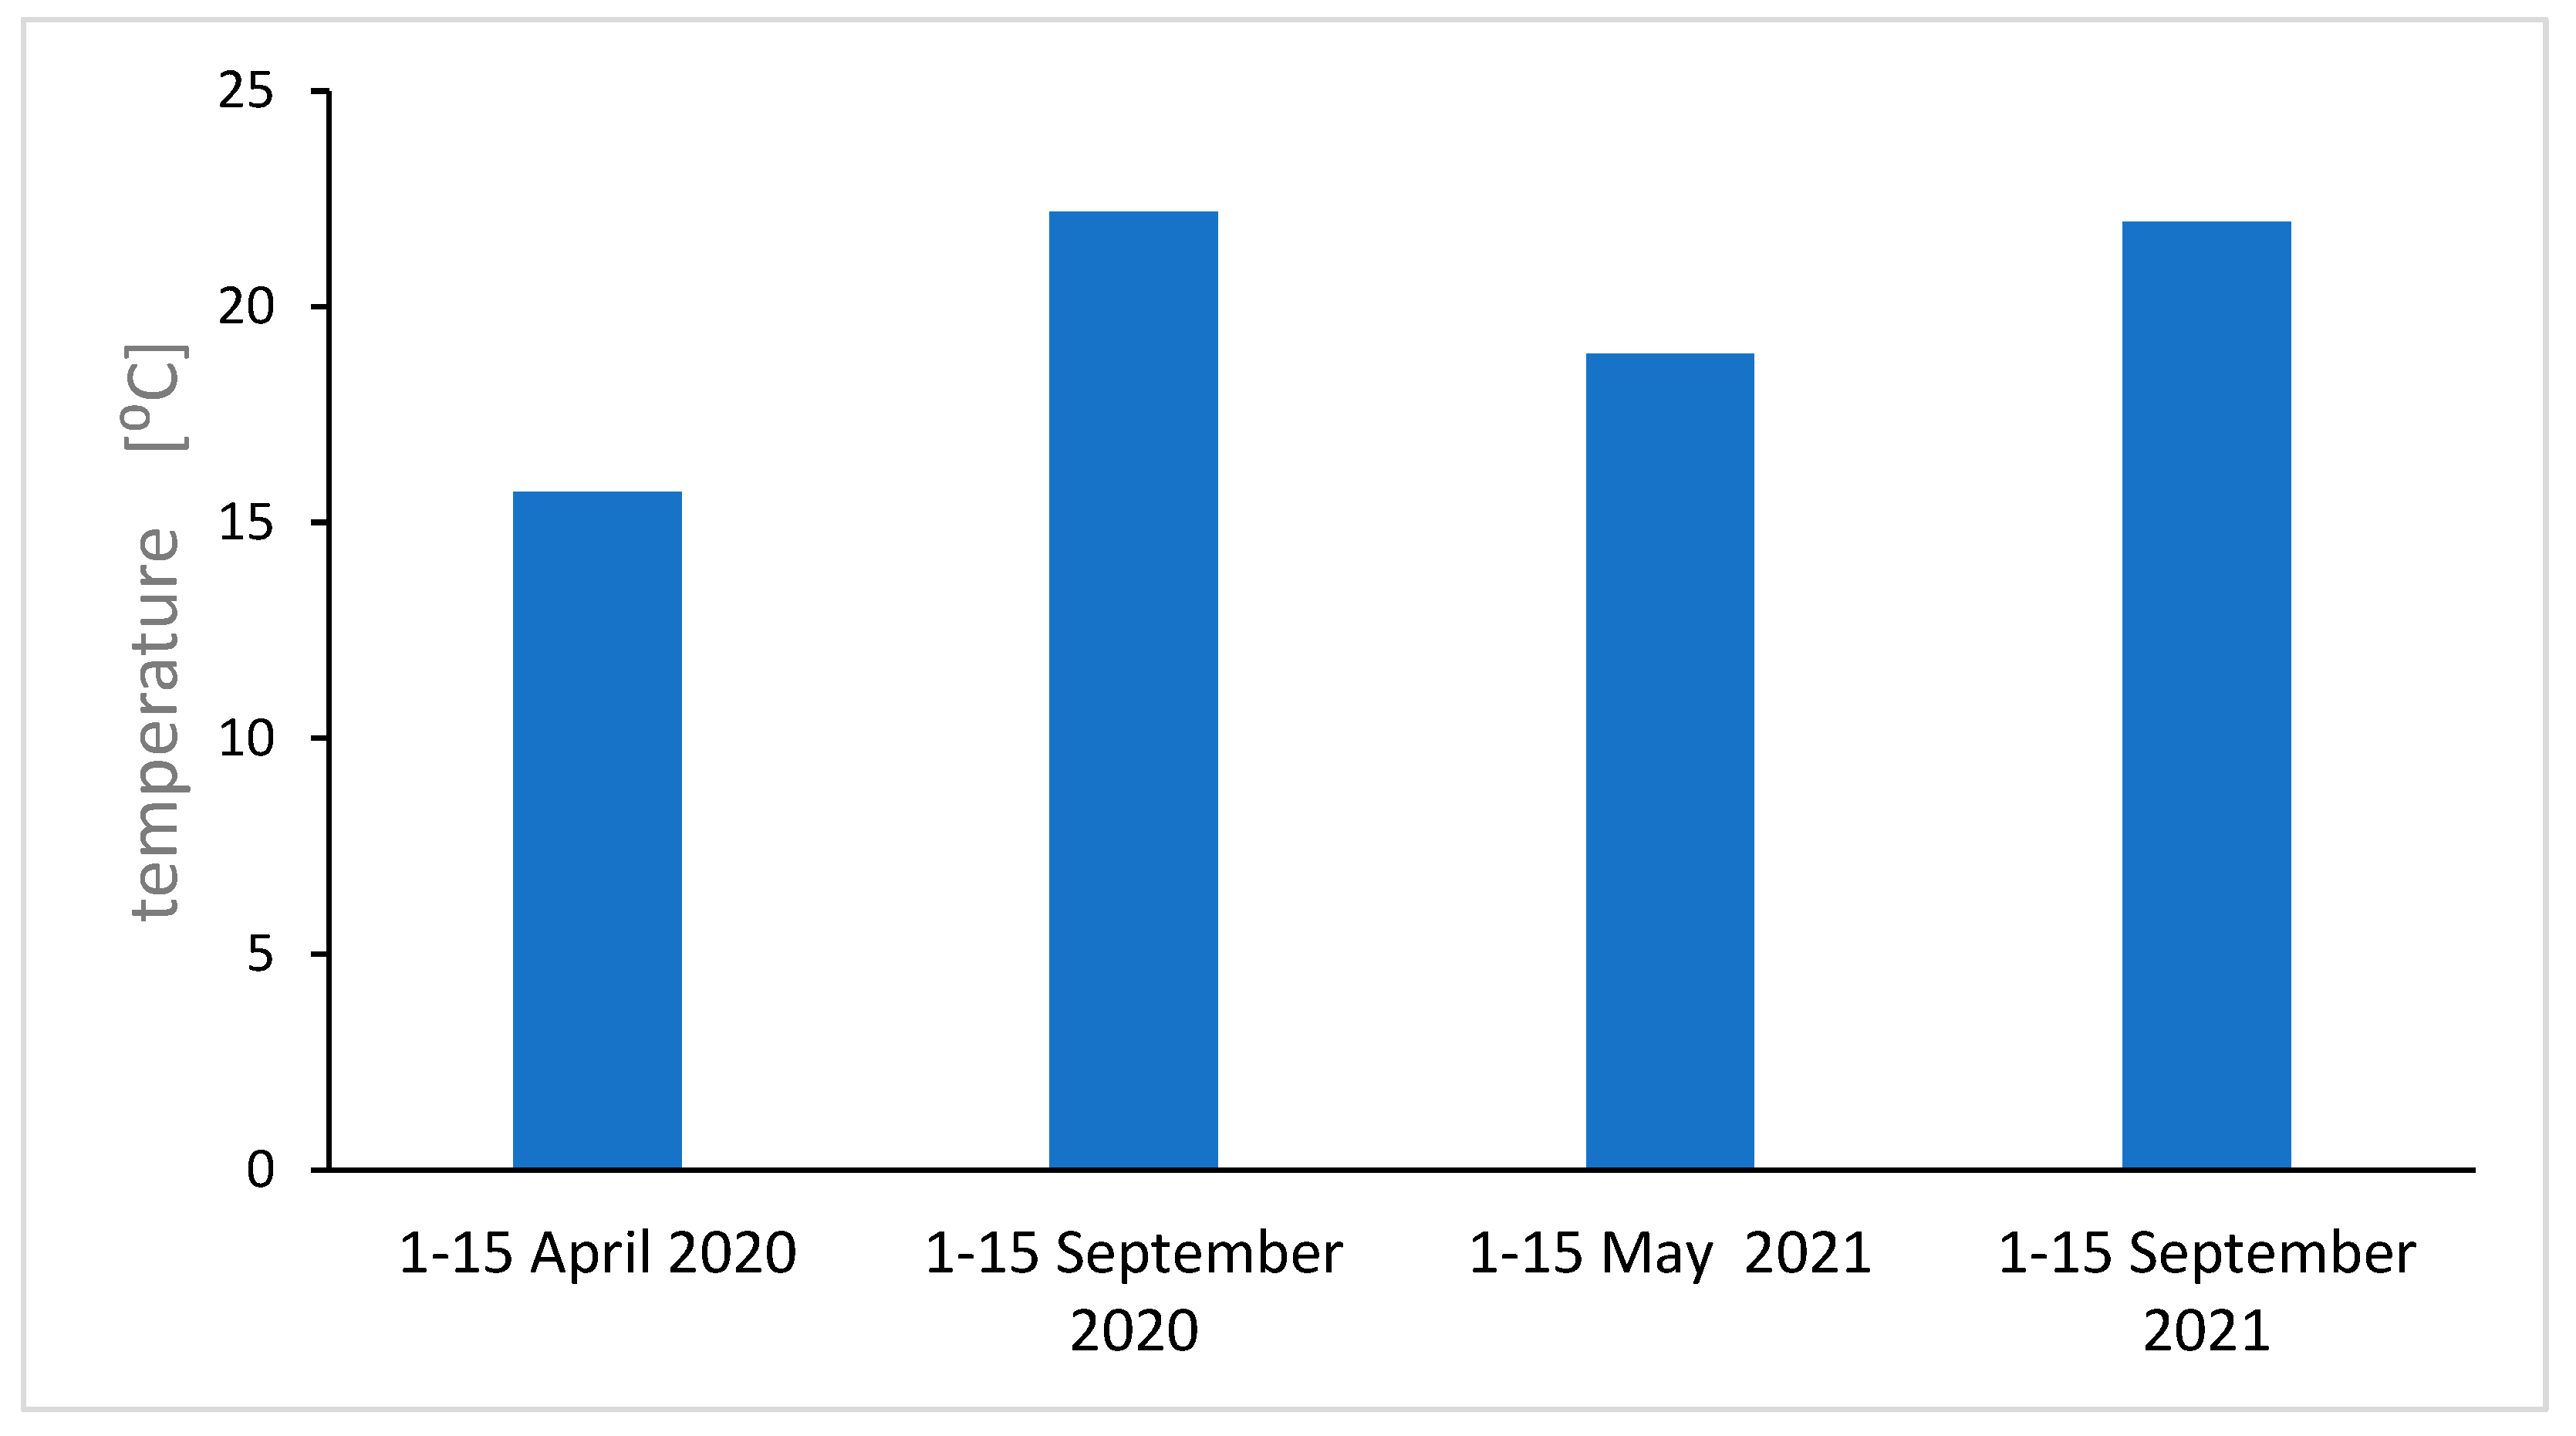
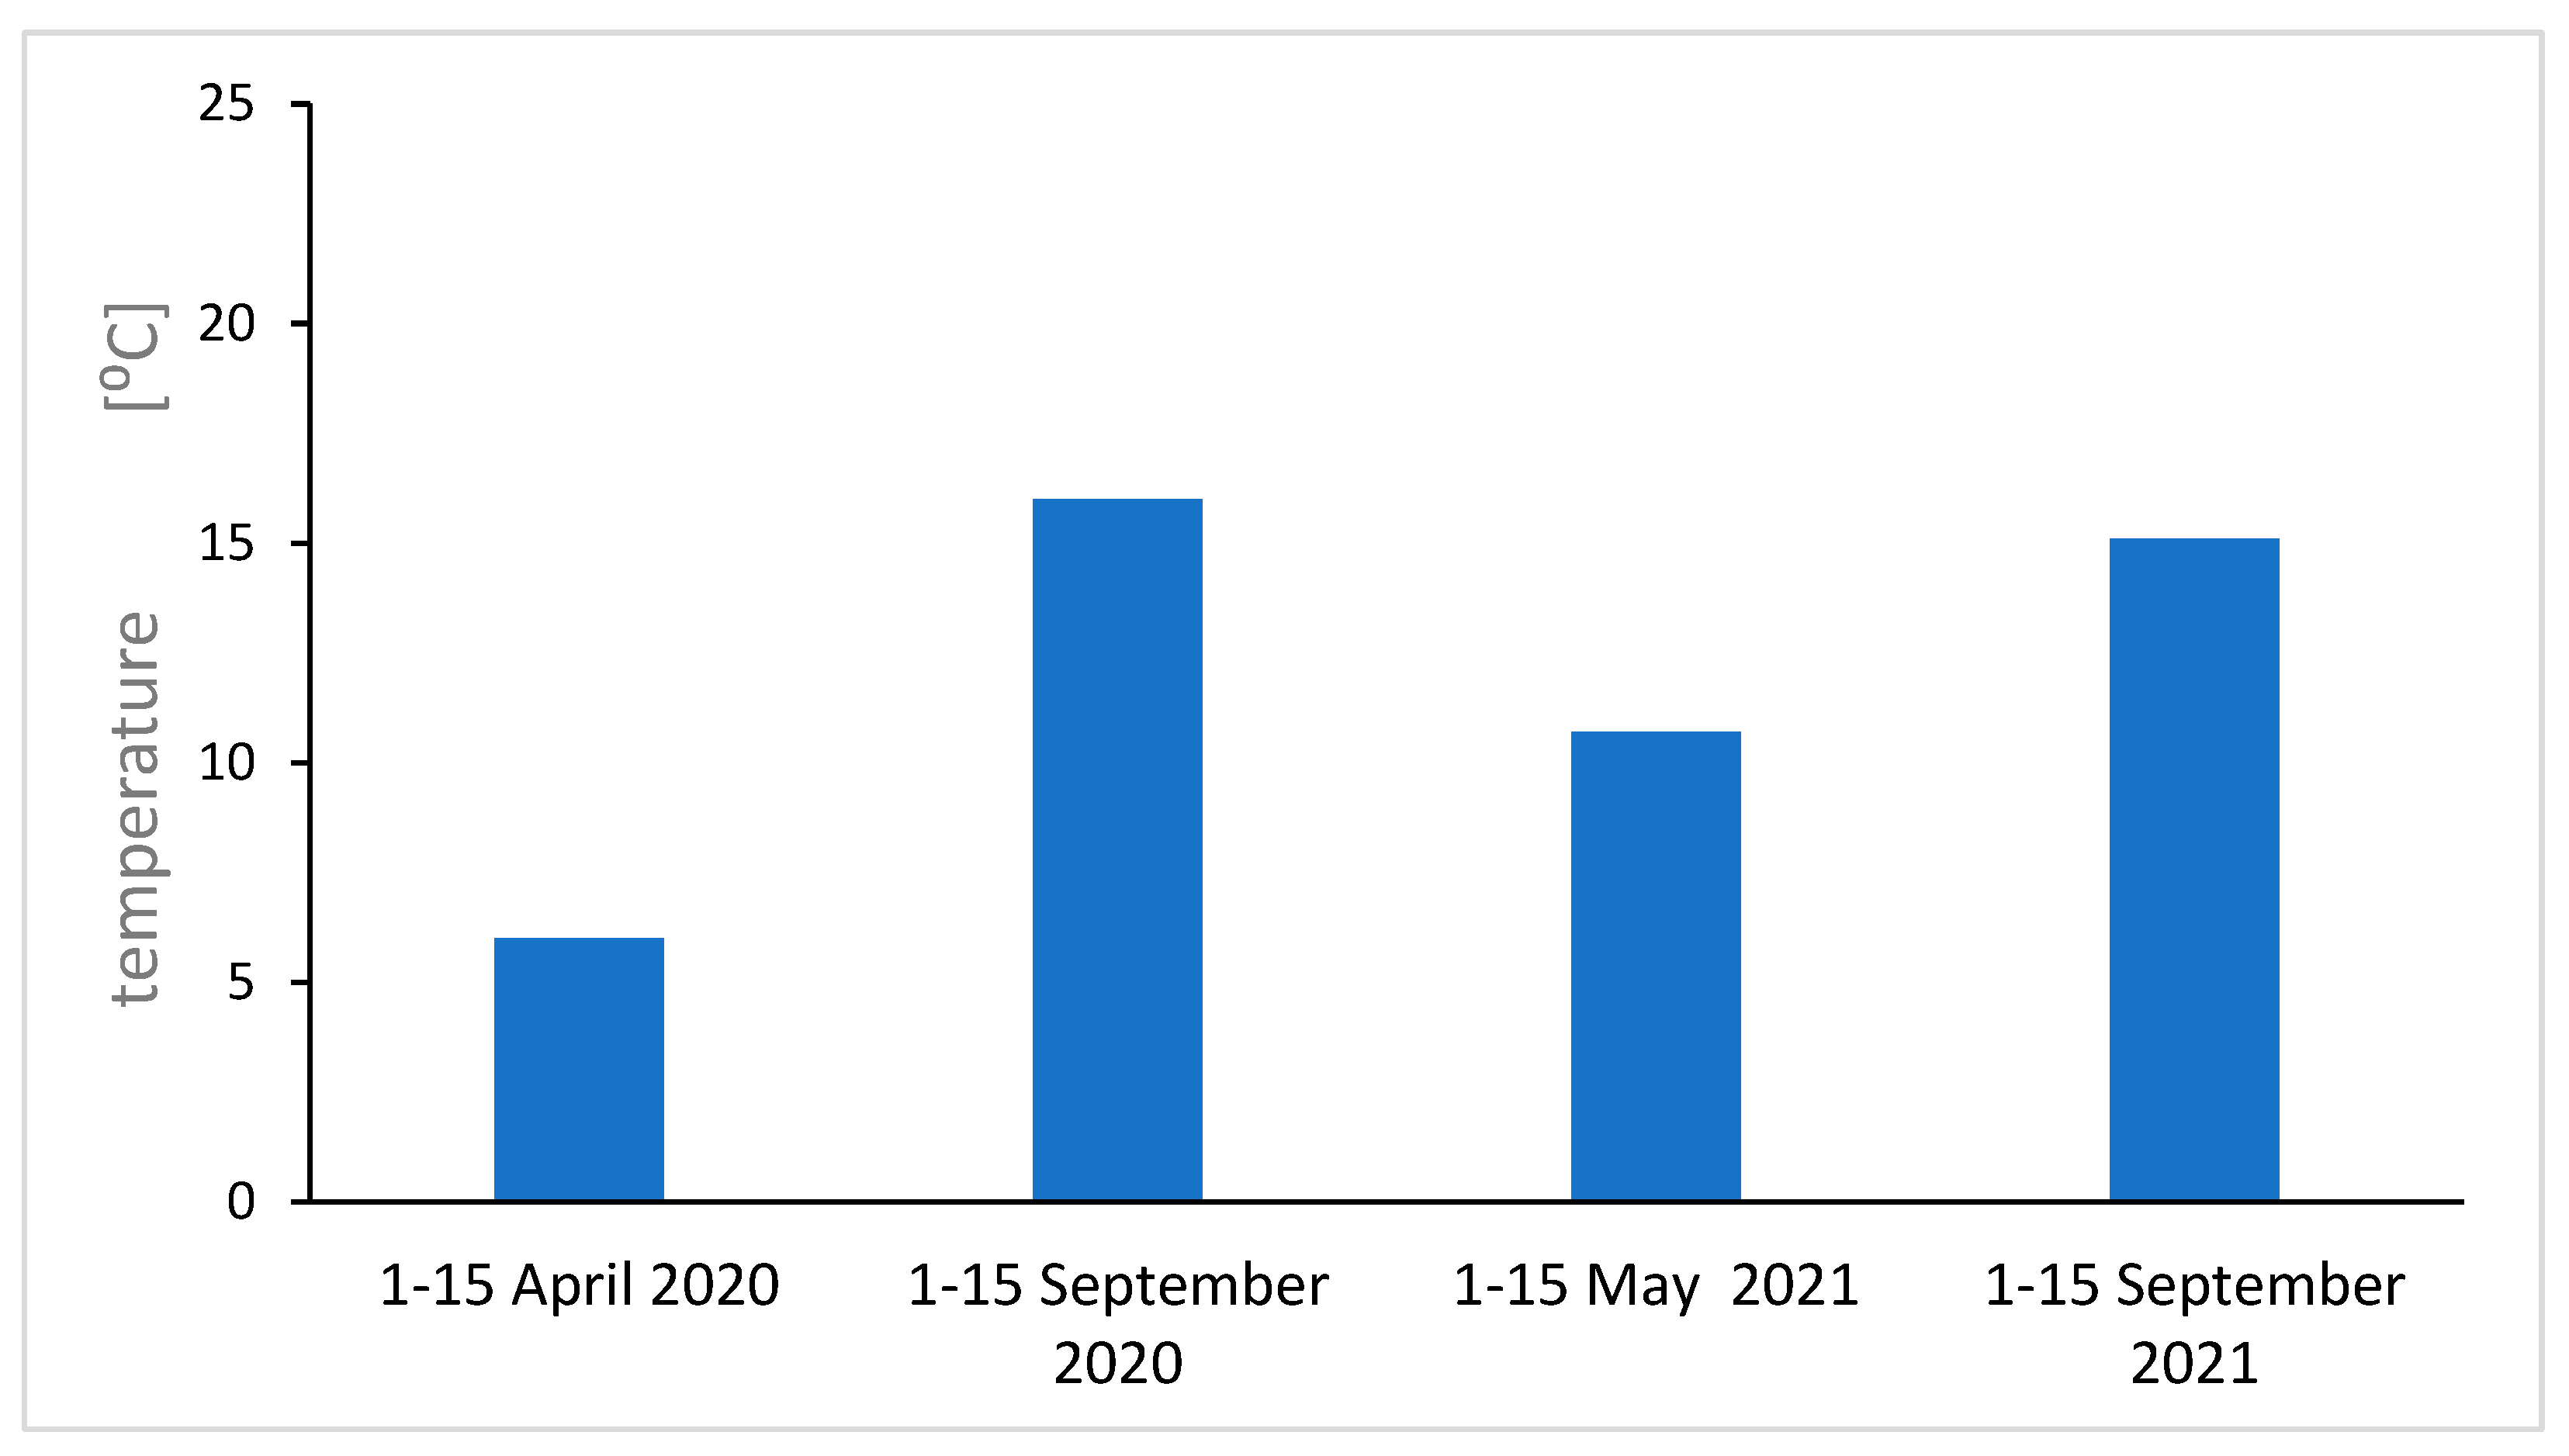
18]. In the study area in September, the air and ground temperature was clearly higher than in spring (see
Figure 10 and
Figure 11), the sun then operates strongly and longer.
The study confirms reports by other authors [
13,
29] that the leaf is the organ where the content of FR is high and of various origins. Photosynthesis and respiration, which occur most intensively a in the leaf, produce FR of biogenic origin [
13,
29,
30]. Furthermore, leaves lives longer than other organs and are more exposed to pollution and long-term exposure to sun, which causes formation of FR. As a result of the analysis, two components of the EPR specta were obtained; the first (A) with a g
eff value < 2.003 is a signal of carbon from air pollution (based on the literature [
5,
7]), while the second component comes from other radicals mainly of oxygen O and carbon C origin. For the parts of the plant, the A/B is 1 (
Table 1), while in the leaf we observe more than 6 times more C-type radicals associated with EPFRs than the others. It was also observed that for the EPR spectra of the leaf in spring, we have a lower value of g
eff while in autumn we observe an increase, probably this is related to the higher amount of oxygen O and carbon C free radicals. The FR concentrations in tree leaves [
27], which are similar to those in herabaceous dandenlion leaves and one order of magnitude higher than the concentrations in other dandelion organs (10
14 spins/g). Thus, our research confirms reports of other authors [
27] that the leaf is the organ in which the content of free radicals is high and has various origins, both exogenous and endogenous.
4. Materials and Methods
4.1. Materials
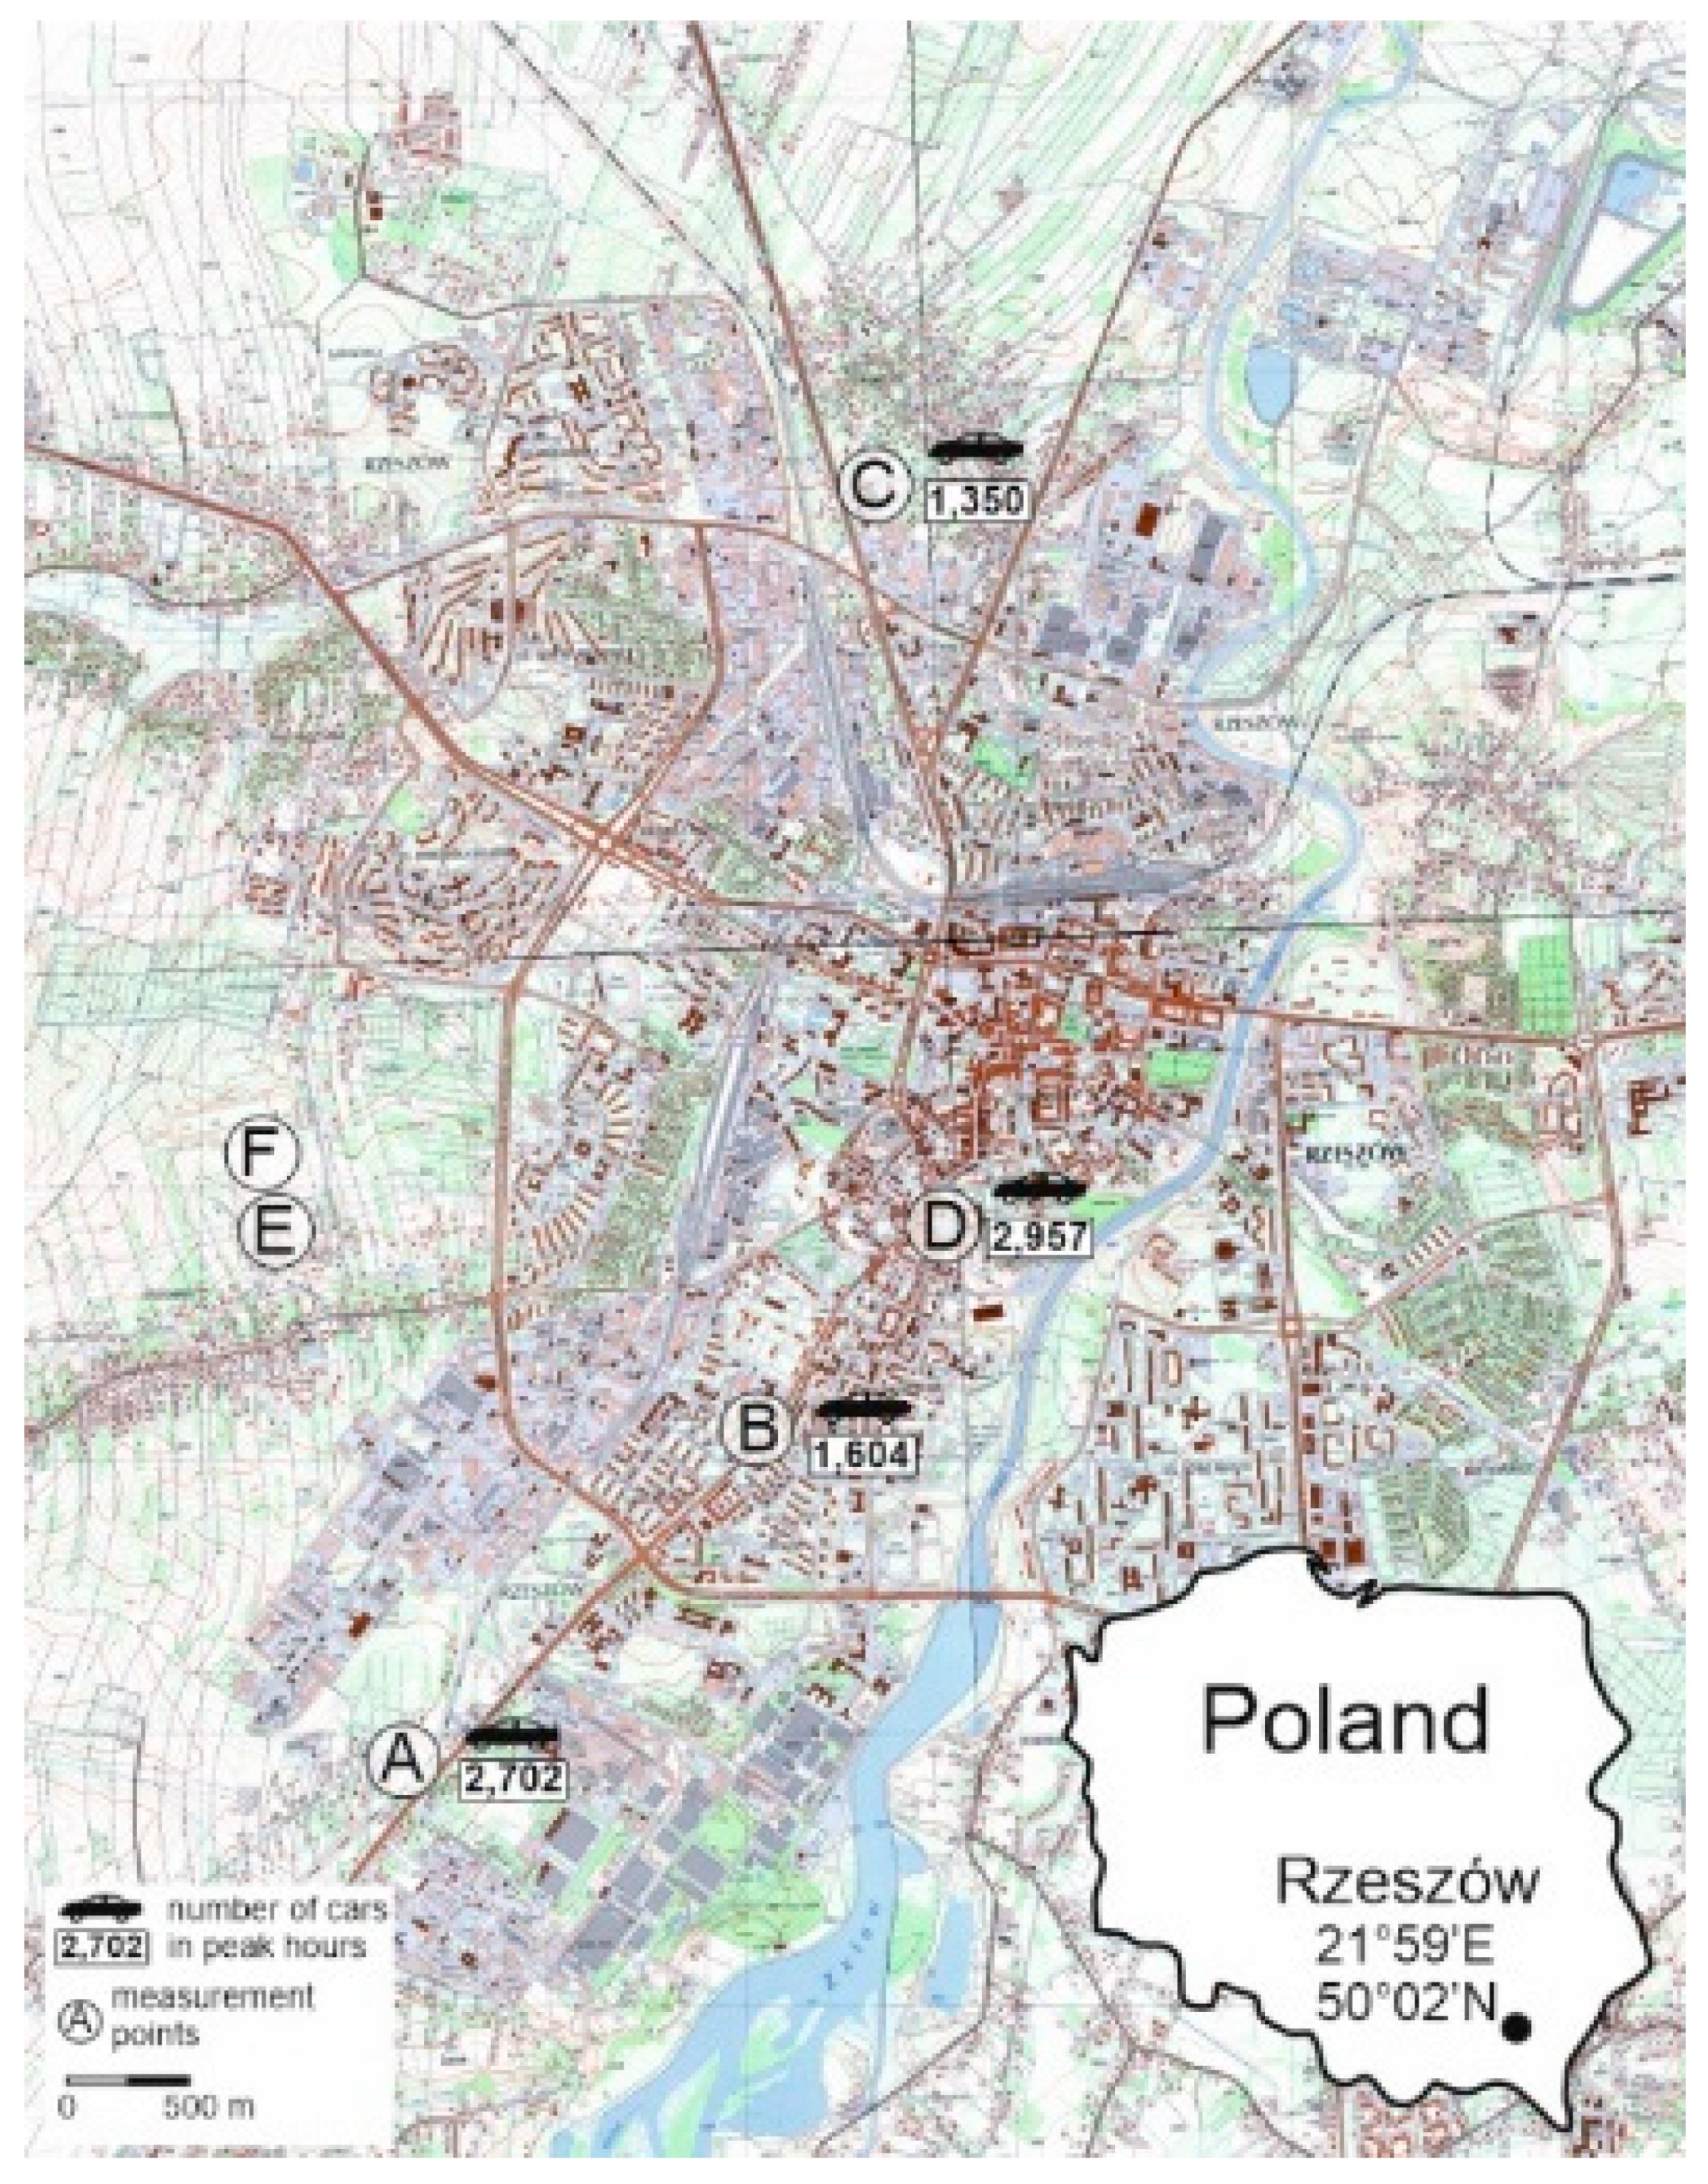
The study was carried out in 2020 and 2021 in Rzeszów (SE Poland). The axis of the city is the Wisłok River, which organizes both the urban fabric and the main traffic arteries that run from SW to NE Six test sites were designated within the city. Stations A-D were located along the main thoroughfares that run from SW to NE and then to N, which is in line with the prevailing wind direction, sites E and F were outside of this transect, in a relatively less urbanized area with less traffic intensity (
Figure 1).
The model organism in the study was a perennial plant Taraxacum sect. Taraxacum considered as a good bioindicator of air pollution [
20,
31,
32,
33,
34]. The material used for the study was roots, leaves, flower stalks, and inflorescences. They were collected during 2 spring and 2 fall campaigns (04/17/2020, 09/17/2020, 05/12/2021, 09/15/2021). At each site, 3 plants growing relatively close to each other were sampled each time. Each sample was packaged separately, labeled, then transferred to the laboratory, and stored in the freezer until measurement.
Figure 12.
Location of the study area, street symbols: A – Podkarpacka; B- Dabrowskiego; C- Warszawska; D- Śreniawitów; E – Staroniwa; F- Strzelnica (number of cars - the average value of the number of conventional vehicles per hour, calculated from the two peak hours of traffic in the Rzeszów Functional Area, i.e., 7-8 a.m. and 3-4 p.m; calculated on the basis of data included in the report: Raport częściowy nr 4. Badania natężenia ruchu drogowego. Politechnika Rzeszowska, Rzeszow, Poland (2023).
4.2. Methods
4.2.1. Measurement of Air Pollution and Meteorological Elements
This is e During sampling, the air pollution of particulate matter with PM10 and PM2.5 fractions was measured using a DustTrak II analyzer. Measurements were carried out at ground level and at a height of about 1.5 m between 12 am and 3 pm. In addition, basic meteorological parameters were measured at the place where the biological material was collected: temperature, humidity, and wind speed.
4.2.2. Electron Paramagnetic Resonance
The collected material was dried at room temperature before EPR measurements; the removal of water significantly improves the sensitivity and tuning of the EPR spectrometer. Then 20 mg of each sample was weighed in a quartz capillary, which was placed in the resonance chamber of the spectrometer. For measurements, a Bruker FT-EPR ELEXSYS E580 spectrometer (Bruker Analytische Messtechnik, Rheinstetten, Germany) was used. The spectrometer operated at X-band (~ 9.4GHz). The following settings were used: central field, 3351.00 G; modulation amplitude, 1 G; modulation frequency, 100 kHz; microwave power, 94.64 mW; power attenuation 2.0 dB; scan range, 80 G; conversion time, 25 ms; and sweep time, 25.6 s. The spectra were recorded in 1024 channels using the Xepr 2.6b.74 software. The signal was integrated twice to determine its area and concentration of the radicals.
Author Contributions
Conceptualization, I.K., I.S. and A.Ć.; methodology, I.K., I.S., A.Ć. and K.K.; software, B.C.; validation, I.S., B.C., A.Ć., K.K., I.K.; formal analysis, I.S. and I.K.; investigation, A.Ć., K.K., I.K.; resources, A.Ć., K.K., I.K.; data curation, I.S., B.C. and I.K.; writing—original draft preparation, B.C. and I.K.; writing—review and editing, I.S., B.C. and I.K.; visualization, I.S., B.C., A.Ć., K.K., I.K.; supervision, I.S. and I.K.; project administration, I.K.; funding acquisition, I.K. All authors have read and agreed to the published version of the manuscript.
Funding
This research was supported by the Minister of Science of the Republic of Poland under the Programme „Regional initiative of excellence”. Agreement No. RID/SP/0010/2024/1.
Institutional Review Board Statement
Not applicable.
Informed Consent Statement
Not applicable.
Data Availability Statement
Dataset available on request from the authors
Conflicts of Interest
The authors declare no conflicts of interest.
References
- Balakrishna, S.; Saravia, J.; Thevenot, P.; Ahlert, T.; Lominiki, S.; Dellinger, B.; Cormier, S.A. Environmentally Persistent Free Radicals Induce Airway Hyperresponsiveness in Neonatal Rat Lungs. Part Fibre Toxicol 2011, 8. [Google Scholar] [CrossRef] [PubMed]
- Lim, S.S.; Vos, T.; Flaxman, A.D.; Danaei, G.; Shibuya, K.; Adair-Rohani, H.; Amann, M.; Anderson, H.R.; Andrews, K.G.; Aryee, M.; et al. A Comparative Risk Assessment of Burden of Disease and Injury Attributable to 67 Risk Factors and Risk Factor Clusters in 21 Regions, 1990-2010: A Systematic Analysis for the Global Burden of Disease Study 2010. The Lancet 2012, 380, 2224–2260. [Google Scholar] [CrossRef] [PubMed]
- del Río, L.A. ROS and RNS in Plant Physiology: An Overview. J Exp Bot 2015, 66, 2827–2837. [Google Scholar] [CrossRef] [PubMed]
- Rai, K.K.; Kaushik, P. Free Radicals Mediated Redox Signaling in Plant Stress Tolerance. Life 2023, 13, 204. [Google Scholar] [CrossRef]
- Ainur, D.; Chen, Q.; Wang, Y.; Li, H.; Lin, H.; Ma, X.; Xu, X. Pollution Characteristics and Sources of Environmentally Persistent Free Radicals and Oxidation Potential in Fine Particulate Matter Related to City Lockdown (CLD) in Xi’an, China. Environ Res 2022, 210. [Google Scholar] [CrossRef]
- Sigmund, G.; Santín, C.; Pignitter, M.; Tepe, N.; Doerr, S.H.; Hofmann, T. Environmentally Persistent Free Radicals Are Ubiquitous in Wildfire Charcoals and Remain Stable for Years. Commun Earth Environ 2021, 2. [Google Scholar] [CrossRef]
- Ruan, X.; Sun, Y.; Du, W.; Tang, Y.; Liu, Q.; Zhang, Z.; Doherty, W.; Frost, R.L.; Qian, G.; Tsang, D.C.W. Formation, Characteristics, and Applications of Environmentally Persistent Free Radicals in Biochars: A Review. Bioresour Technol 2019, 281, 457–468. [Google Scholar] [CrossRef]
- Oyana, T.J.; Lomnicki, S.M.; Guo, C.; Cormier, S.A. A Scalable Field Study Protocol and Rationale for Passive Ambient Air Sampling: A Spatial Phytosampling for Leaf Data Collection. Environ Sci Technol 2017, 51, 10663–10673. [Google Scholar] [CrossRef]
- Vejerano, E.P.; Rao, G.; Khachatryan, L.; Cormier, S.A.; Lomnicki, S. Environmentally Persistent Free Radicals: Insights on a New Class of Pollutants. Environ Sci Technol 2018, 52, 2468–2481. [Google Scholar] [CrossRef]
- Chen, Q.; Sun, H.; Wang, M.; Mu, Z.; Wang, Y.; Li, Y.; Wang, Y.; Zhang, L.; Zhang, Z. Dominant Fraction of EPFRs from Nonsolvent-Extractable Organic Matter in Fine Particulates over Xi’an, China. Environ Sci Technol 2018, 52, 9646–9655. [Google Scholar] [CrossRef]
- Pan, B.; Li, H.; Lang, D.; Xing, B. Environmentally Persistent Free Radicals: Occurrence, Formation Mechanisms and Implications. Environmental Pollution 2019, 248, 320–331. [Google Scholar] [CrossRef] [PubMed]
- Chen, Q.; Sun, H.; Wang, M.; Mu, Z.; Wang, Y.; Li, Y.; Wang, Y.; Zhang, L.; Zhang, Z. Dominant Fraction of EPFRs from Nonsolvent-Extractable Organic Matter in Fine Particulates over Xi’an, China. Environ Sci Technol 2018, 52, 9646–9655. [Google Scholar] [CrossRef] [PubMed]
- Xu, M.; Wu, T.; Tang, Y.-T.; Chen, T.; Khachatryan, L.; Iyer, P.R.; Guo, D.; Chen, A.; Lyu, M.; Li, J.; et al. Environmentally Persistent Free Radicals in PM2.5: A Review. Waste Dispos Sustain Energy 2019, 1, 177–197. [Google Scholar] [CrossRef]
- Dellinger, B.; Pryor, W.A.; Cueto, R.; Squadrito, G.L.; Hegde, V.; Deutsch, W.A. Role of Free Radicals in the Toxicity of Airborne Fine Particulate Matter. Chem Res Toxicol 2001, 14, 1371–1377. [Google Scholar] [CrossRef]
- Xu, M.; Wu, T.; Tang, Y.-T.; Chen, T.; Khachatryan, L.; Iyer, P.R.; Guo, D.; Chen, A.; Lyu, M.; Li, J.; et al. Environmentally Persistent Free Radicals in PM2.5: A Review. Waste Dispos Sustain Energy 2019, 1, 177–197. [Google Scholar] [CrossRef]
- Odinga, E.S.; Waigi, M.G.; Gudda, F.O.; Wang, J.; Yang, B.; Hu, X.; Li, S.; Gao, Y. Occurrence, Formation, Environmental Fate and Risks of Environmentally Persistent Free Radicals in Biochars. Environ Int 2020, 134, 105172. [Google Scholar] [CrossRef]
- Yang, L.; Liu, G.; Zheng, M.; Jin, R.; Zhu, Q.; Zhao, Y.; Wu, X.; Xu, Y. Highly Elevated Levels and Particle-Size Distributions of Environmentally Persistent Free Radicals in Haze-Associated Atmosphere. Environ Sci Technol 2017, 51, 7936–7944. [Google Scholar] [CrossRef] [PubMed]
- Gehling, W.; Dellinger, B. Environmentally Persistent Free Radicals and Their Lifetimes in PM 2.5. Environ Sci Technol 2013, 47, 8172–8178. [Google Scholar] [CrossRef]
- Savinov, A.B.; Kurganova, L.N.; Shekunov, Y.I. Lipid Peroxidation Rates in Taraxacum Officinale Wigg. and Vicia Cracca L. from Biotopes with Different Levels of Soil Pollution with Heavy Metals. Russ J Ecol 2007, 38, 174–180. [Google Scholar] [CrossRef]
- Bretzel, F.; Benvenuti, S.; Pistelli, L. Metal Contamination in Urban Street Sediment in Pisa (Italy) Can Affect the Production of Antioxidant Metabolites in Taraxacum Officinale Weber. Environmental Science and Pollution Research 2014, 21, 2325–2333. [Google Scholar] [CrossRef]
- Makuch-Pietraś, I.; Grabek-Lejko, D.; Górka, A.; Kasprzyk, I. Antioxidant Activities in Relation to the Transport of Heavy Metals from the Soil to Different Parts of Betula Pendula (Roth.). J Biol Eng 2023, 17, 19. [Google Scholar] [CrossRef] [PubMed]
- Filek, M.; Łabanowska, M.; Kurdziel, M.; Sieprawska, A. Electron Paramagnetic Resonance (EPR) Spectroscopy in Studies of the Protective Effects of 24-Epibrasinoide and Selenium against Zearalenone-Stimulation of the Oxidative Stress in Germinating Grains of Wheat. Toxins (Basel) 2017, 9. [Google Scholar] [CrossRef]
- Vejerano, E.P.; Ahn, J. Leaves Are a Source of Biogenic Persistent Free Radicals. Environ Sci Technol Lett 2023, 10, 662–667. [Google Scholar] [CrossRef]
- Ainur, D.; Chen, Q.; Wang, Y.; Li, H.; Lin, H.; Ma, X.; Xu, X. Pollution Characteristics and Sources of Environmentally Persistent Free Radicals and Oxidation Potential in Fine Particulate Matter Related to City Lockdown (CLD) in Xi’an, China. Environ Res 2022, 210. [Google Scholar] [CrossRef]
- Sigmund, G.; Santín, C.; Pignitter, M.; Tepe, N.; Doerr, S.H.; Hofmann, T. Environmentally Persistent Free Radicals Are Ubiquitous in Wildfire Charcoals and Remain Stable for Years. Commun Earth Environ 2021, 2. [Google Scholar] [CrossRef]
- Ruan, X.; Sun, Y.; Du, W.; Tang, Y.; Liu, Q.; Zhang, Z.; Doherty, W.; Frost, R.L.; Qian, G.; Tsang, D.C.W. Formation, Characteristics, and Applications of Environmentally Persistent Free Radicals in Biochars: A Review. Bioresour Technol 2019, 281, 457–468. [Google Scholar] [CrossRef] [PubMed]
- Vejerano, E.P.; Rao, G.; Khachatryan, L.; Cormier, S.A.; Lomnicki, S. Environmentally Persistent Free Radicals: Insights on a New Class of Pollutants. Environ Sci Technol 2018, 52, 2468–2481. [Google Scholar] [CrossRef]
- Odinga, E.S.; Waigi, M.G.; Gudda, F.O.; Wang, J.; Yang, B.; Hu, X.; Li, S.; Gao, Y. Occurrence, Formation, Environmental Fate and Risks of Environmentally Persistent Free Radicals in Biochars. Environ Int 2020, 134, 105172. [Google Scholar] [CrossRef]
- Vejerano, E.P.; Ahn, J. Leaves Are a Source of Biogenic Persistent Free Radicals. Environ Sci Technol Lett 2023, 10, 662–667. [Google Scholar] [CrossRef]
- Rochaix, J.-D. Regulation of Photosynthetic Electron Transport. Biochimica et Biophysica Acta (BBA) - Bioenergetics 2011, 1807, 375–383. [Google Scholar] [CrossRef]
- Degórska, A. An Assessment of Urban Habitat Contamination with Selected Heavy Metals within the City of Katowice Using the Common Dandelion ( Taraxacum Officinale Web.) as a Bioindicator. Environmental & Socio-economic Studies 2013, 1, 29–40. [Google Scholar] [CrossRef]
- Giacomino, A.; Malandrino, M.; Colombo, M.L.; Miaglia, S.; Maimone, P.; Blancato, S.; Conca, E.; Abollino, O. Metal Content in Dandelion (Taraxacum Officinale) Leaves: Influence of Vehicular Traffic and Safety upon Consumption as Food. J Chem 2016, 2016. [Google Scholar] [CrossRef]
- Ianovici, N. Taraxacum Officinale (Asteraceae) in the Urban Environment: Seasonal Fluctuations of Plant Traits and Their Relationship with Meteorological Factors. Acta Agrobot 2016, 69. [Google Scholar] [CrossRef]
- Chemerys, I.; Myslyuk, O.; Chemerys, V. Effect of Vehicle Emissions on the Morphological and Physiological Changes of Taraxacum Officinale Web. Ukr J Ecol 2020, 10, 7–17. [Google Scholar] [CrossRef]
Figure 1.
a) Values of average air pollution PM10 and b) PM2.5 measured at two heights on the days of collecting plant material; c) values of spin/g count for the dandelion organs depending on the site; d) mean geff values for the leaf for the site and collection periods.
Figure 1.
a) Values of average air pollution PM10 and b) PM2.5 measured at two heights on the days of collecting plant material; c) values of spin/g count for the dandelion organs depending on the site; d) mean geff values for the leaf for the site and collection periods.
Figure 2.
Concentrations of PM10 and PM2.5 [mg·m-3] at two heights at 6 sites., street symbols: A – Podkarpacka; B- Dabrowskiego; C- Warszawska; D- Śreniawitów; E – Staroniwa; F- Strzelnica.
Figure 2.
Concentrations of PM10 and PM2.5 [mg·m-3] at two heights at 6 sites., street symbols: A – Podkarpacka; B- Dabrowskiego; C- Warszawska; D- Śreniawitów; E – Staroniwa; F- Strzelnica.
Figure 3.
The g factor dependences of EPR spectra for different parts of the plant, root, stem, flower, and leaf.
Figure 3.
The g factor dependences of EPR spectra for different parts of the plant, root, stem, flower, and leaf.
Figure 4.
EPR spectrum for leaf: a) exp - experimental spectra, Sum - theoretical spectra, b) Sys1 - EPR spectrum for first component, Sys2 - EPR spectrum for the second component of the EPR spectrum fitted using the EasySpin software.
Figure 4.
EPR spectrum for leaf: a) exp - experimental spectra, Sum - theoretical spectra, b) Sys1 - EPR spectrum for first component, Sys2 - EPR spectrum for the second component of the EPR spectrum fitted using the EasySpin software.
Figure 5.
EPR spectrum for stem: a) exp - experimental spectra, Sum - theoretical spectra, b) Sys1 - EPR spectrum for first component, Sys2 - EPR spectrum for the second component of the EPR spectrum fitted using the EasySpin software.
Figure 5.
EPR spectrum for stem: a) exp - experimental spectra, Sum - theoretical spectra, b) Sys1 - EPR spectrum for first component, Sys2 - EPR spectrum for the second component of the EPR spectrum fitted using the EasySpin software.
Figure 6.
EPR spectrum for flower: a) exp - experimental spectra, Sum - theoretical spectra, b) Sys1 - EPR spectrum for first component, Sys2 - EPR spectrum for the second component of the EPR spectrum fitted using the EasySpin software.
Figure 6.
EPR spectrum for flower: a) exp - experimental spectra, Sum - theoretical spectra, b) Sys1 - EPR spectrum for first component, Sys2 - EPR spectrum for the second component of the EPR spectrum fitted using the EasySpin software.
Figure 7.
EPR spectrum for root: a) exp - experimental spectra, Sum - theoretical spectra, b) Sys1 - EPR spectrum for first component, Sys2 - EPR spectrum for the second component of the EPR spectrum fitted using the EasySpin software.
Figure 7.
EPR spectrum for root: a) exp - experimental spectra, Sum - theoretical spectra, b) Sys1 - EPR spectrum for first component, Sys2 - EPR spectrum for the second component of the EPR spectrum fitted using the EasySpin software.
Figure 8.
Values of spin/g count for the dandelion organs a) root, b) stalk, c) flower, d) leaf, depending on the site and season.
Figure 8.
Values of spin/g count for the dandelion organs a) root, b) stalk, c) flower, d) leaf, depending on the site and season.
Figure 9.
Effective g values for leaf depending on the location (all measurements) and season.
Figure 9.
Effective g values for leaf depending on the location (all measurements) and season.
Figure 10.
Average maximum air temperature in individual season.
Figure 10.
Average maximum air temperature in individual season.
Figure 11.
Average maximum air temperature at ground level in individual season.
Figure 11.
Average maximum air temperature at ground level in individual season.
Table 1.
Parameters of the experimental “fit” of the spectrum of two EPR lines: A - parameters for the 1st component of the EPR spectrum, B - parameters for the 2nd component, compared with the experimental data for one plant from site D1.
Table 1.
Parameters of the experimental “fit” of the spectrum of two EPR lines: A - parameters for the 1st component of the EPR spectrum, B - parameters for the 2nd component, compared with the experimental data for one plant from site D1.
| EPR line components |
|
Flower |
Stalk |
Root |
Leaf |
| Experimental line |
Intensity [arb. unit] |
0.223 |
0.112 |
0.124 |
1.332 |
| Experimental line |
geff
|
2.0040 |
2.0038 |
2.0039 |
2.0038 |
| A |
G |
2.0025 |
2.0015 |
2.0025 |
2.0021 |
| A |
lwpp [mT] |
3.0804 |
3.8110 |
3.1860 |
6.3861 |
| A |
weight |
1 |
1 |
1 |
6.58 |
| B |
g |
2.0056 |
2.0043 |
2.0052 |
2.0040 |
| B |
lwpp [mT] |
1.2740 |
1.6700 |
1.2000 |
1.0082 |
| B |
weight |
1 |
1 |
1 |
1 |
|
Disclaimer/Publisher’s Note: The statements, opinions and data contained in all publications are solely those of the individual author(s) and contributor(s) and not of MDPI and/or the editor(s). MDPI and/or the editor(s) disclaim responsibility for any injury to people or property resulting from any ideas, methods, instructions or products referred to in the content. |
© 2024 by the authors. Licensee MDPI, Basel, Switzerland. This article is an open access article distributed under the terms and conditions of the Creative Commons Attribution (CC BY) license (http://creativecommons.org/licenses/by/4.0/).

