1. Introduction
The current rate of global warming is the highest ever recorded, leading to significant changes in weather patterns and disrupting the balance of natural ecosystems. Consequently, we are witnessing more severe storms, increased droughts, rising sea levels, reduced food availability, and escalating poverty and displacement [
1]. The use of ordinary Portland cement (OPC) in the construction industry contributes to 5%-8% of global carbon emissions, driven by the annual production of 1.6 billion tons of OPC. Alkali-activated concrete (AAC) offers an alternative, produced by combining an aluminosilicate source with an alkaline solution and aggregates. The binder matrix in AAC, commonly referred to as alkali-activated material (AAM) or geopolymer, has demonstrated considerable potential as a low-CO
2 alternative to OPC, with reductions in greenhouse gas emissions reported to be as high as 80% [
2].
Despite its environmental advantages, AAC has not been widely adopted, primarily due to the variability in its properties, which stems from the diverse range of available aluminosilicate sources and alkali activators. Furthermore, the body of knowledge regarding the structural performance of full-scale reinforced AAC elements is limited, especially concerning their mechanical performance during or after exposure to fire. This paper aims to address this gap by reporting on the flexural performance of reinforced alkali-activated concrete slabs made with ferronickel slag as the aluminosilicate source, both in unfired and fired states. For comparison, slabs made of conventional concrete using ordinary Portland cement (referred to as ‘OPC slabs’ hereafter) with similar compressive strength were also produced.
Ferronickel slag (FNS), a siliceous and iron-rich aluminosilicate, has previously been used to produce binders with high compressive strength (120 MPa) [
3] and coatings with high thermal insulation properties [
4]. These characteristics suggest its potential for high-temperature applications in concrete production. With an annual production of approximately 2 million tons as of 2022 , only 20-30% of FNS is currently reused, with the remainder disposed of in landfills or the sea, incurring costs of around €650,000 per year (as of 2007) [
5]. In this study, ground ferronickel slag (GFNS) was used as the primary aluminosilicate source for the alkali-activated binder, while unprocessed FNS was utilized as a fine aggregate to maximize material utilization and reduce dependence on natural resources—a critical concern given the unsustainable rate of natural sand consumption, which has tripled in recent decades [
6].
Previous studies have addressed the possible application of AAC concrete for casting reinforced d slabs. Nagan and Mohana [
7] studied the flexural behavior of steel mesh reinforced slabs (fly ash based) and compared them to OPC equivalents. The authors found the cracking, yielding, and ultimate load to be higher than the corresponding OPC slabs. The slabs also showed higher ductility (26%). Sarker and Mcbeath [
8] compared the residual-to-original compressive strength ratios of geopolymer and OPC reinforced concrete panels and found the ratio to be higher for AAM (61% to 71%) than the OPC equivalent (50% – 53%), indicating superior fire endurance for the AAM elements. By the time this paper was written no prior studies have investigated the post-fire flexural behavior of alkali-activated ferronickel slag slabs. A 2018 review by Ma et al. [
9] highlighted the need for experimental research on large-scale structural components made from aluminosilicate sources other than fly ash, underscoring a significant gap in the current knowledge. This study contributes to filling this gap by providing new insights into the post-fire flexural performance of AAC slabs.
In this study, four large-scale concrete slabs were produced: two with ferronickel slag-based alkali-activated concrete (FNS AAC) with a compressive strength of 75 MPa after 28 days, and two with high-strength OPC-based ready-mix concrete (referred to as ‘OPC-concrete’). For each type of concrete, one slab served as a control (unfired) specimen, while the other was subjected to a thermal load following the ISO 834 [
10] cellulosic fire curve for 2 hours. The slabs were then tested under four-point bending, and load versus mid-span displacement curves were generated for all specimens. The results showed that while the AAM slabs exhibited lower stiffness than the OPC slabs at ambient temperature, they retained greater stiffness and ductility after thermal load exposure.
2. Materials and Methods
2.1. Raw Materials
Ferronickel slag was selected as the primary aluminosilicate source for binder production in this study. The slag was sourced from the General Mining and Metallurgical Company SA (“Larco”) based in Larissa, Greece. In addition to being used as a binder component, the slag was also utilized as a fine aggregate after being sieved to a diameter of less than 4 mm. The grinding process was conducted using a ball mill, resulting in a final product with a d50 of 8.36 μm. Silica fume (SF), with a d50 of 12.87 μm, was also incorporated into the mixture. Particle sizes were measured using laser diffraction with a Malvern Mastersizer 2000. The chemical composition of both FNS and SF is detailed in
Table 1, with elements identified through X-ray fluorescence (XRF) analysis.
The alkaline solution was prepared using potassium silicate (KS) with a modulus of 1.6 (90% purity) in the form of a proprietary solution named Geosil
® 14517. This solution was supplied in 30-liter plastic containers, containing 45% KS and 55% water. The steel reinforcement for the slabs consisted of steel rebars classified as B500C. Locally available olivine aggregate (OA) was chosen as the coarse aggregate. Olivine was selected over traditional aggregates due to its high resistance to elevated temperatures, as demonstrated in high-temperature applications in Greece, such as the production of fire-resistant bricks, furnace coatings, and fire-resistant shotcrete [
11]. The olivine aggregates were sourced from a quarry in Ptolemaida, northern Greece, and were provided in two size ranges: 4-8 mm and 8-16 mm, with no additional sieving required.
1.2. Slabs Construction
Four slabs measuring 2.1 m × 0.9 m (plan view) with a thickness of 0.18 m were constructed. The slabs were reinforced with 10 mm nominal diameter rebars, spaced at 100 mm intervals. Transverse reinforcement was spaced approximately 450 mm apart. Plastic spacers were employed to maintain a cover distance of 25 mm. The mix design for the ferronickel slag-based alkali-activated concrete (FNS AAC) was developed by the authors in a previous dedicated study [
12] . The proportions of ingredients used in the FNS-AAC mix are detailed in
Table 2.
The chemical activator solution, consisting of water, KS, and KOH, was prepared one day before slab casting. Water and Geosil 14517 were mixed in a plastic container, followed by the gradual addition of KOH pellets, which were vigorously mixed to prevent settling. Slabs were cast indoors using wooden, leak-proof formworks. For the FNS-AAC slabs, a continuous batch process was employed to avoid cold joints. Dry ingredients were initially mixed for 20 seconds in a pan-type electric mixer before adding the chemical solution. After 20 seconds of hand mixing to prevent splashing, the concrete was mechanically mixed for 5 minutes, interrupted to scrape the pan, then mixed for another 5 minutes. Prior to casting, the workability of the mix was assessed by the slump test. The latter resulted in a 200 mm slump. For the OPC slabs, a high-strength (C55/67) ready mix concrete was employed. Fresh concrete in all slabs was consolidated using an electric vibrator. The FNS-AAC slabs were covered with a plastic film to hinder moisture loss and were allowed to cure for 14 days. The OPC slabs were cured under wet burlaps for the same time span. Following this period, all slabs were uncovered and left to dry for 90 days. Ambient conditions during curing and drying were 15°C ± 5°C and 65% relative humidity (on average).
2.3. Concrete Characterization Tests
In order to assess the strength and deformation characteristics of both types of concrete at the time of slab testing, a number of specimens were cast and kept adjacent to the slabs, receiving identical curing conditions. For each concrete type, nine specimens were produced: three cubes (150 mm side) and six cylinders (150 mm diameter × 300 mm height), with three cylinders designated for compressive tests and three for splitting tensile tests. During the FNC AAC mix design, additional cubes were produced to assess: (i) The strength evolution of FNS-AAC over time (compression tests conducted at 7, 14, 28, and 90 days); (ii) Its residual 28-day compressive strength after exposure to temperatures of 400 °C, 600 °C, 800 °C, and 1000 °C.
Thermal exposure involved the use of a 500 mm³ electrical oven with a maximum heating capacity of 1100 °C. The thermal exposure protocol consisted of a heating ramp of 5 °C/min up to the target temperature, followed by a 2-hour constant temperature step at the target temperature. Subsequently, an uncontrolled cooling phase was initiated with the furnace shutter closed. Heated specimens were tested 24 hours after the onset of the cooling ramp.
Compression and splitting tensile tests were carried out according to EN 12390-3 [
13] and EN 12390-6 [
14], respectively. The initial modulus of elasticity, defined as the tangent modulus of elasticity at the origin of the stress-strain diagram in compression, was measured using strain gauges placed along the height of compressed cylinders.
2.4. Heating Regime and Instrumentation of the Fire Tests
The slabs were placed on the top opening of a vertical furnace capable of reproducing the standard temperature-time cellulosic fire curve specified in ISO 834 [
10] using twelve gas-nozzle mix burners. The slabs were exposed to this standard fire curve for two hours, followed by a natural cooling phase. The two-hour time limit was selected to prevent the bottom steel rebars from reaching temperatures above the 500°C - 600°C range.
The clear opening at the top of the furnace measured 3.0 m × 1.2 m. To accommodate the difference in dimensions, a concrete ring beam was manufactured and placed on top of the furnace, serving as support for the slabs. The internal opening of the ring measured 2.1 m × 0.8 m, which determined the fire-exposed area of the slabs. Mineral wool was placed between the ring and the slab, as well as between the ring and the furnace, to prevent leakage of hot gases.
The temperature of the slabs was monitored at five positions and at four depths at each position, resulting in a total of twenty sensors (type K thermocouples) per slab. The five measuring positions, shown in
Figure 1a, were marked as center (“C”), northwest (“NW”), northeast (“NE”), southwest (“SW”), and southeast (“SE”). These positions were selected based on the guidelines of EN 1363-1 [
15] for recording the average temperature of the unexposed face of a specimen.
The slab thickness was divided into four 45 mm thick zones (
Figure 1b). At each of the five positions, four thermocouples were placed at the center of each zone. The distance of each sensor from the bottom (exposed) face of the specimen is shown in
Figure 1b. The recordings from each sensor at a given position were used to construct the temperature profile for that position as a function of time. By averaging the recordings from each zone, an average temperature profile was determined for each fire-exposed slab.
The sensors were fixed in the specimens by drilling 6 mm wide holes from the top face of the slabs. Before inserting the thermocouples, 1 mL of thin cement paste was injected at the bottom of the holes to ensure contact between the sensor tips and the hole bottoms. After insertion, the tops of the holes were sealed with mineral wool to prevent heat escape. The temperature of the exposed face of the slab was recorded by the internal thermocouples of the furnace, which confirmed that the standard fire curve was followed well across the entire volume of the furnace.
2.5. Four-Point Bending Tests
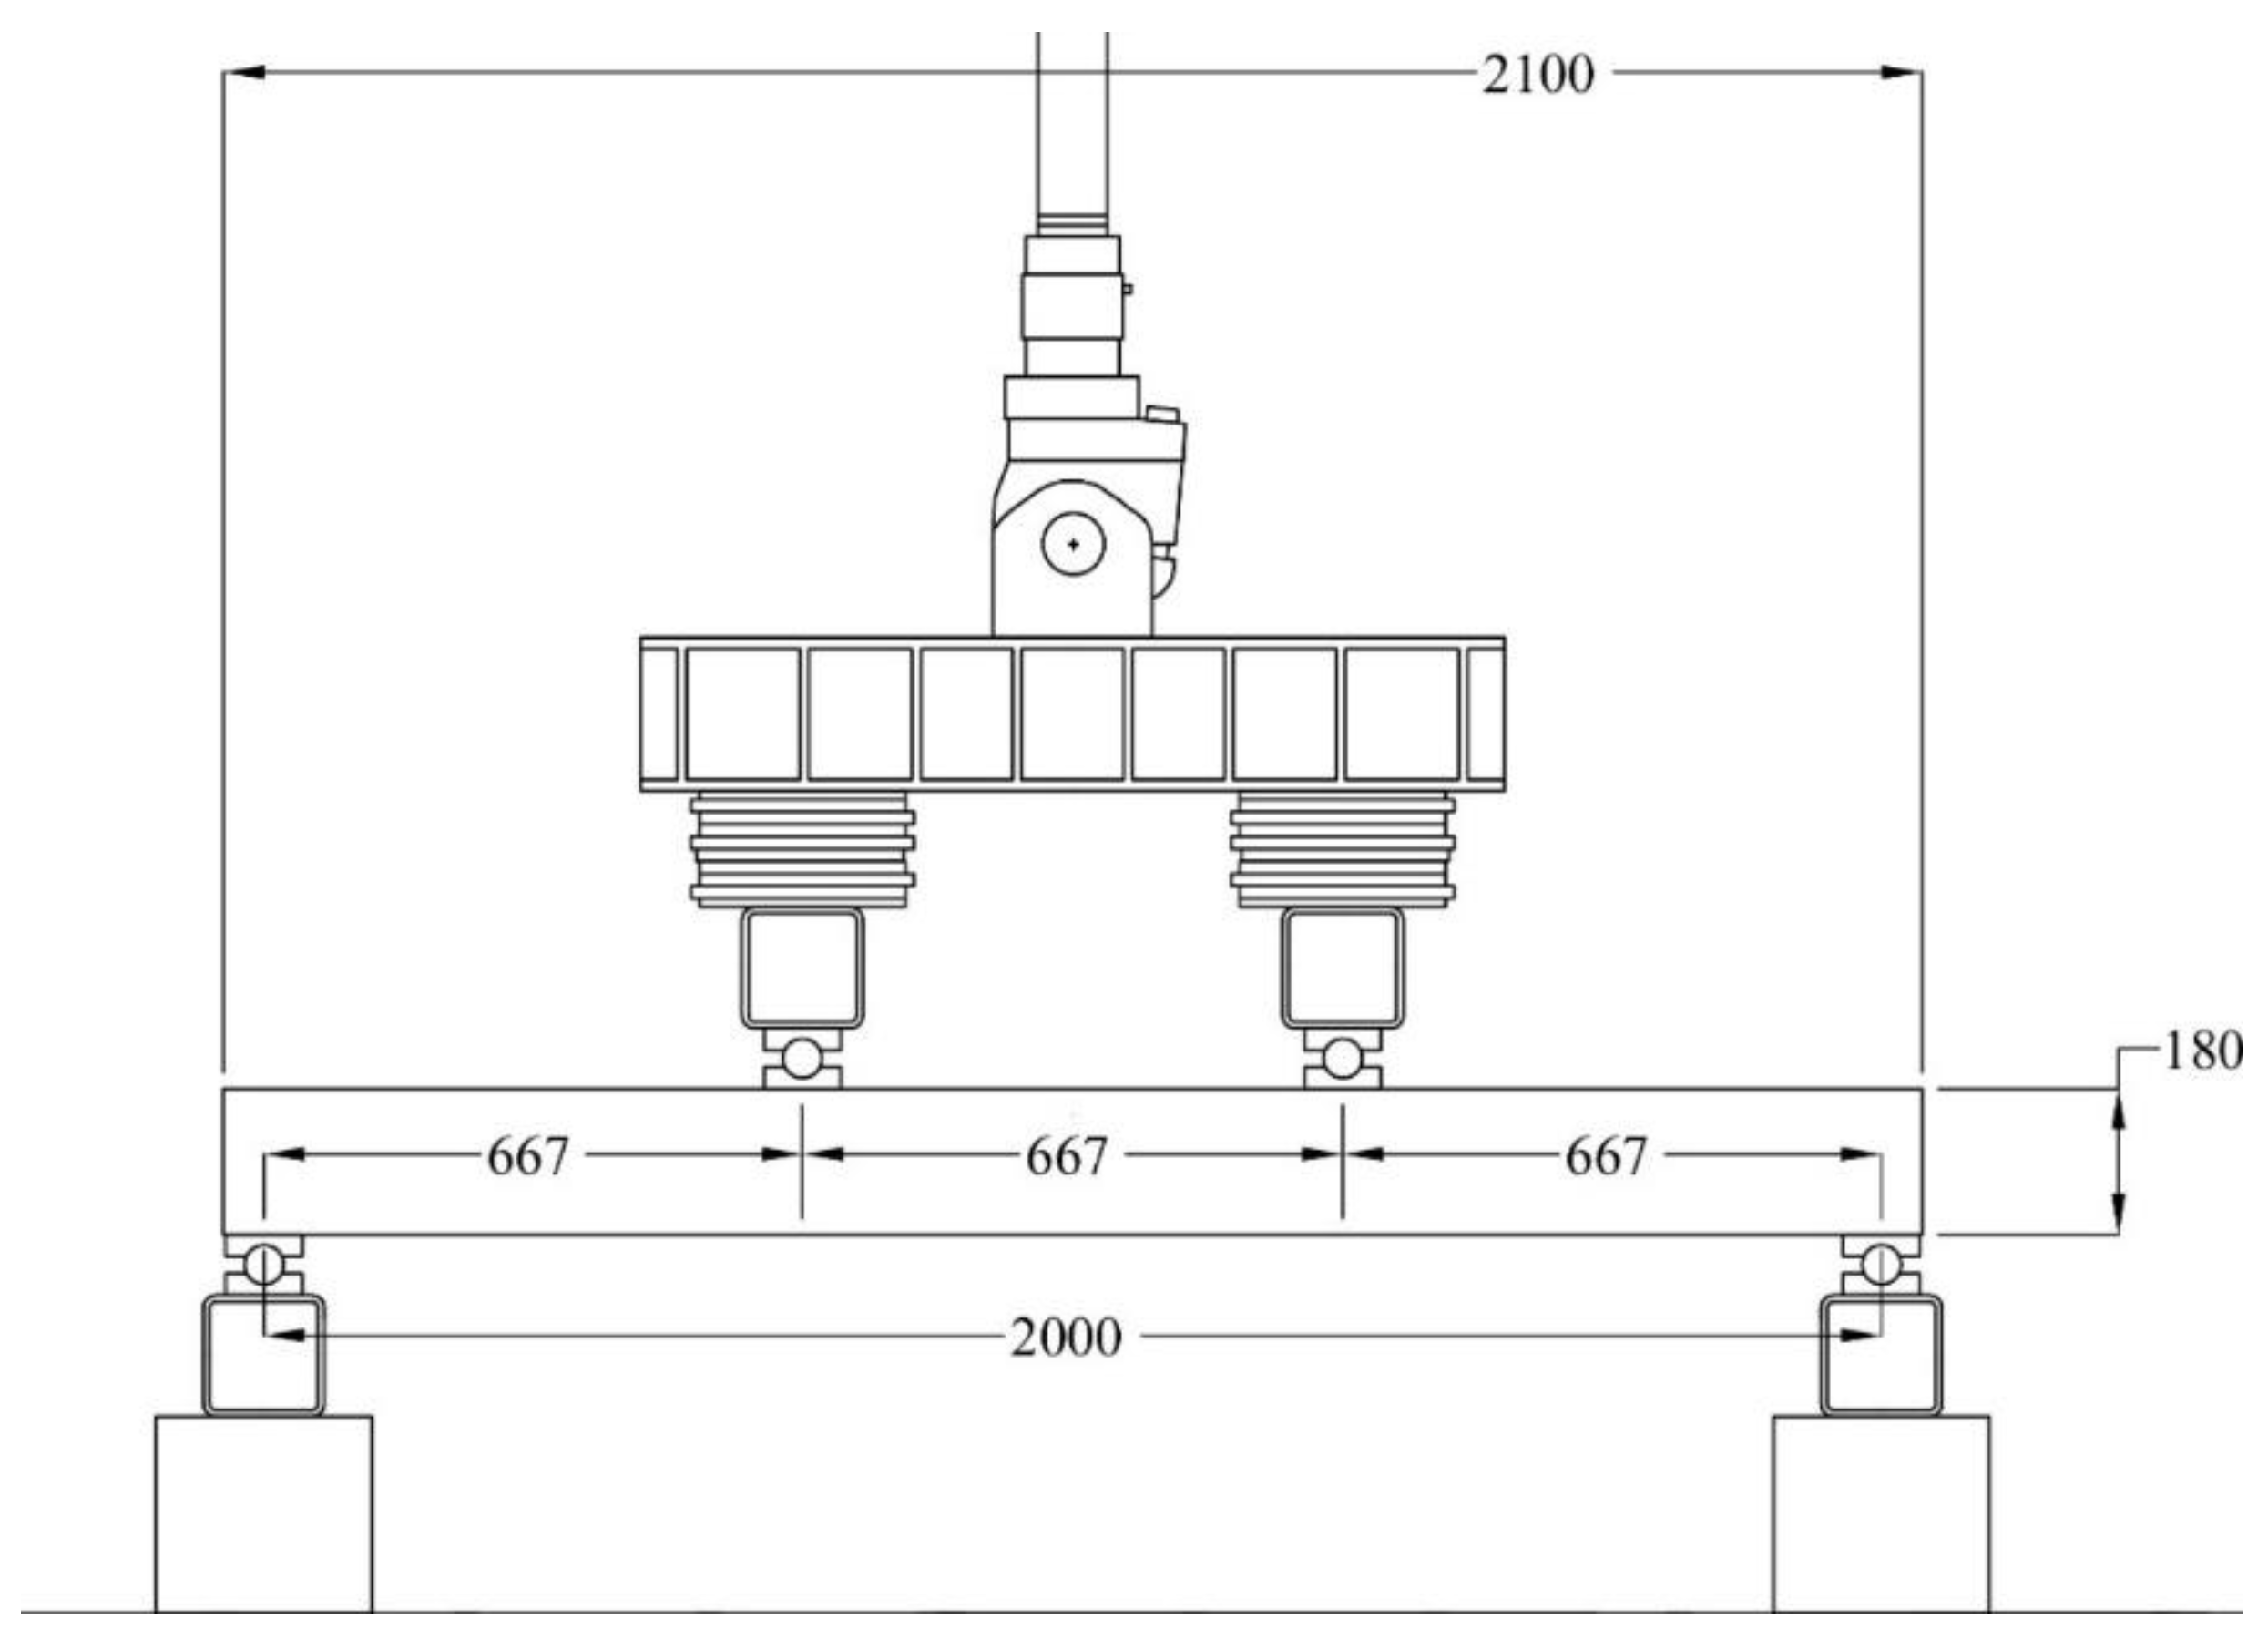
The four-point bending tests of the slabs were conducted approximately seven days after fire exposure. The test apparatus was designed to ensure simply-supported conditions for the slabs. Load application points were positioned 665 mm from the supports towards the center, with the distance between supports being 2000 mm (see
Figure 2). A servo-hydraulic piston with a capacity of 500 kN applied the load, which was transferred to the specimen via a set of steel beams (a stiff spreader beam acting against two hollow-core beams). To allow rotation of the specimen about the loading lines, a set of hinges was placed between the hollow-core beams and the specimens.
All slabs were tested monotonically in a displacement-controlled mode at a rate of 0.08 mm/sec. The deflection at mid-span was measured using a video-extensometer system. A fully computerized data acquisition system recorded data from the load cell, the actuator’s displacement transducer, and the video-extensometer. From these measurements, load versus mid-span displacement curves were obtained for each test.
2.6. Mercury Intrusion Porosimetry
The porosity of samples was analyzed using Mercury Intrusion Porosimetry (MIP) tests. Prior to analysis, specimens were crushed into 10 mm pieces and immersed in isopropanol for two days to halt the hydration process. These preserved specimens were then dried at 35 °C and stored under vacuum at ambient temperatures for one week.
MIP measurements were carried out using an AutoPore V (Micrometrics, UK) porosimeter. Pieces of approximately 10 mm were selected to provide a total charge of 2.2 ± 0.2 g. The mercury/material contact angle was set to 130°. The analysis was conducted with a gradual reduction of pressure (up to 50 µHg), and a surface tension of mercury of 0.485 N/m was used in the calculations. Pore size and volume were measured at 60,000 psi.
2.7. Scanning Electron Microscopy
Secondary electron (SE) and backscatter electron (BSE) images of both precursor powder particles and hardened paste products were obtained using a Hitachi TM3030 (Hitachi, Japan) scanning electron microscope. This microscope was coupled with QUANTAX 70 (Bruker, Germany) energy-dispersive spectroscopy (EDS) software for elemental analysis.
Hardened concrete fragments were prepared for microscopy by mounting in epoxy resin, curing overnight, and demolding. The samples were then polished using silicon carbide (SiC) paper in ascending grits. Prior to SEM analysis, the polished samples were carbon coated.
3. Results and Discussion
3.1. Concrete Characterization
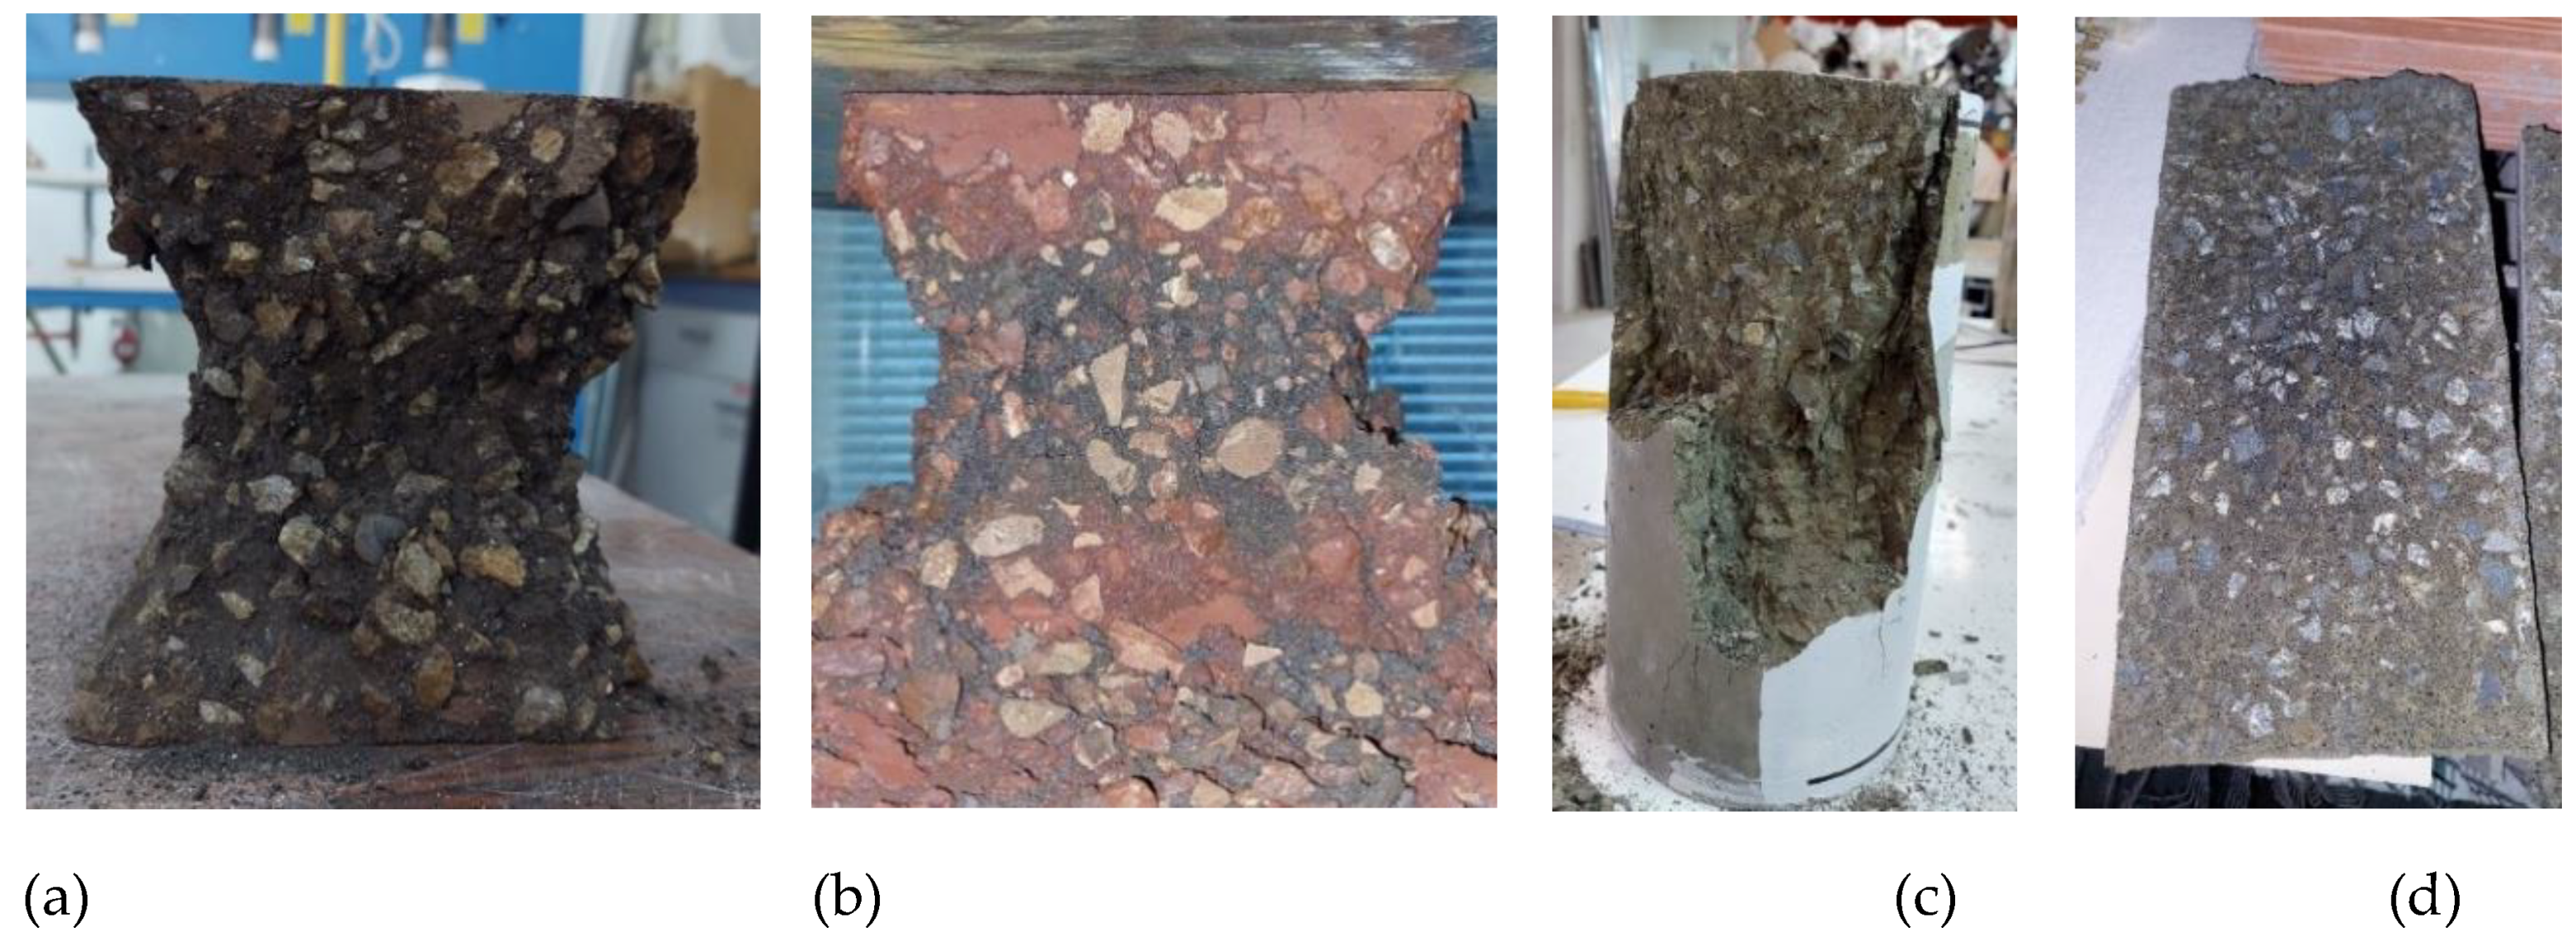
Figure 3 illustrates the post-failure shapes of the FNS-AAC samples, which include cubes and cylinders. For the cubes, both unfired and fired (refer to
Figure 2a,b, respectively), the failure under compression exhibited an hourglass-shaped core. Similarly, the cylinders (
Figure 3c) displayed a conical fracture pattern. The FNS-AAC cylinders subjected to splitting tensile tests failed in a brittle manner, characterized by a single fracture plane beneath the loading line (
Figure 3d). These observed failure modes in the FNS-AAC specimens closely resemble those typically seen in conventional concrete. A summary of all material characterization test results for both types of concrete used in this study is presented in
Table 3.
The compressive strength results confirmed that the strength of the ordered ready-mix concrete was comparable to that of the FNS AAC. The compressive strength of the cylinders was found to be significantly lower than that of the cubes in both types of concrete. While the cylinder-to-cube compressive strength ratio was expected to be 0.8 or higher, it was found to be 0.64 and 0.69 for FNS-AAC and OPC concrete, respectively. Although similar ratios have been reported for concretes in this strength class [
16]
. Due to the challenges encountered during the capping process, there may have been an uneven distribution of compressive stress, which could have influenced the results and contributed to the lower-than-expected strength ratios.
It is noteworthy that there was a significant difference between the moduli of elasticity of FNS-AAC and OPC concrete, with values of 23.2 GPa and 32.6 GPa, respectively. The modulus of elasticity for OPC concrete aligns with values reported in the literature for high-strength concrete. In contrast, the value of 23.2 GPa for FNS-AAC suggests that it is a much “softer” concrete. Since the volumetric aggregate ratios for both types of concrete are nearly identical, and the moduli of elasticity for limestone and olivine aggregates are 65 [
17] and 125 GPa [
18], respectively (based on nanoindentation tests), it is hypothesized that the difference in the moduli of elasticity between the two concretes is due to differences in the deformation characteristics of the FNS and OPC matrices, which, in turn, can be attributed to microstructural differences. Indeed, a previous study [
19] reported a significantly lower elastic modulus for alkali-activated binders when compared to OPC specimens of the same compressive strength.
The density of the OPC-based mix was typical for this type of concrete. However, the FNS-based mix can be classified as a heavyweight concrete due to the higher density of both the FNS sand and the olivine coarse aggregates (approximately 2750 kg/m³ and 3300 kg/m³, respectively) compared to that of limestone sand and gravel (2600 kg/m³). This characteristic might limit the use of FNS-AAC in areas with high seismic risk. As expected, the moisture content of the CC (conventional concrete based on ordinary Portland cement) was higher (27.3%) than that of the FNS AAC.
The color of conventional concrete surfaces changes as the exposure temperature increases, a phenomenon that also occurs in FNS-AAC (see
Figure 4) and other alkali-activated products. This color change is typically attributed to the oxidation of iron species [
20,
21,
22] which, as noted in
Table 1, are abundant in the GFNS matrix. Additionally, the color change serves as an indicator of changes in the mineral phases within the concrete as the temperature rises.
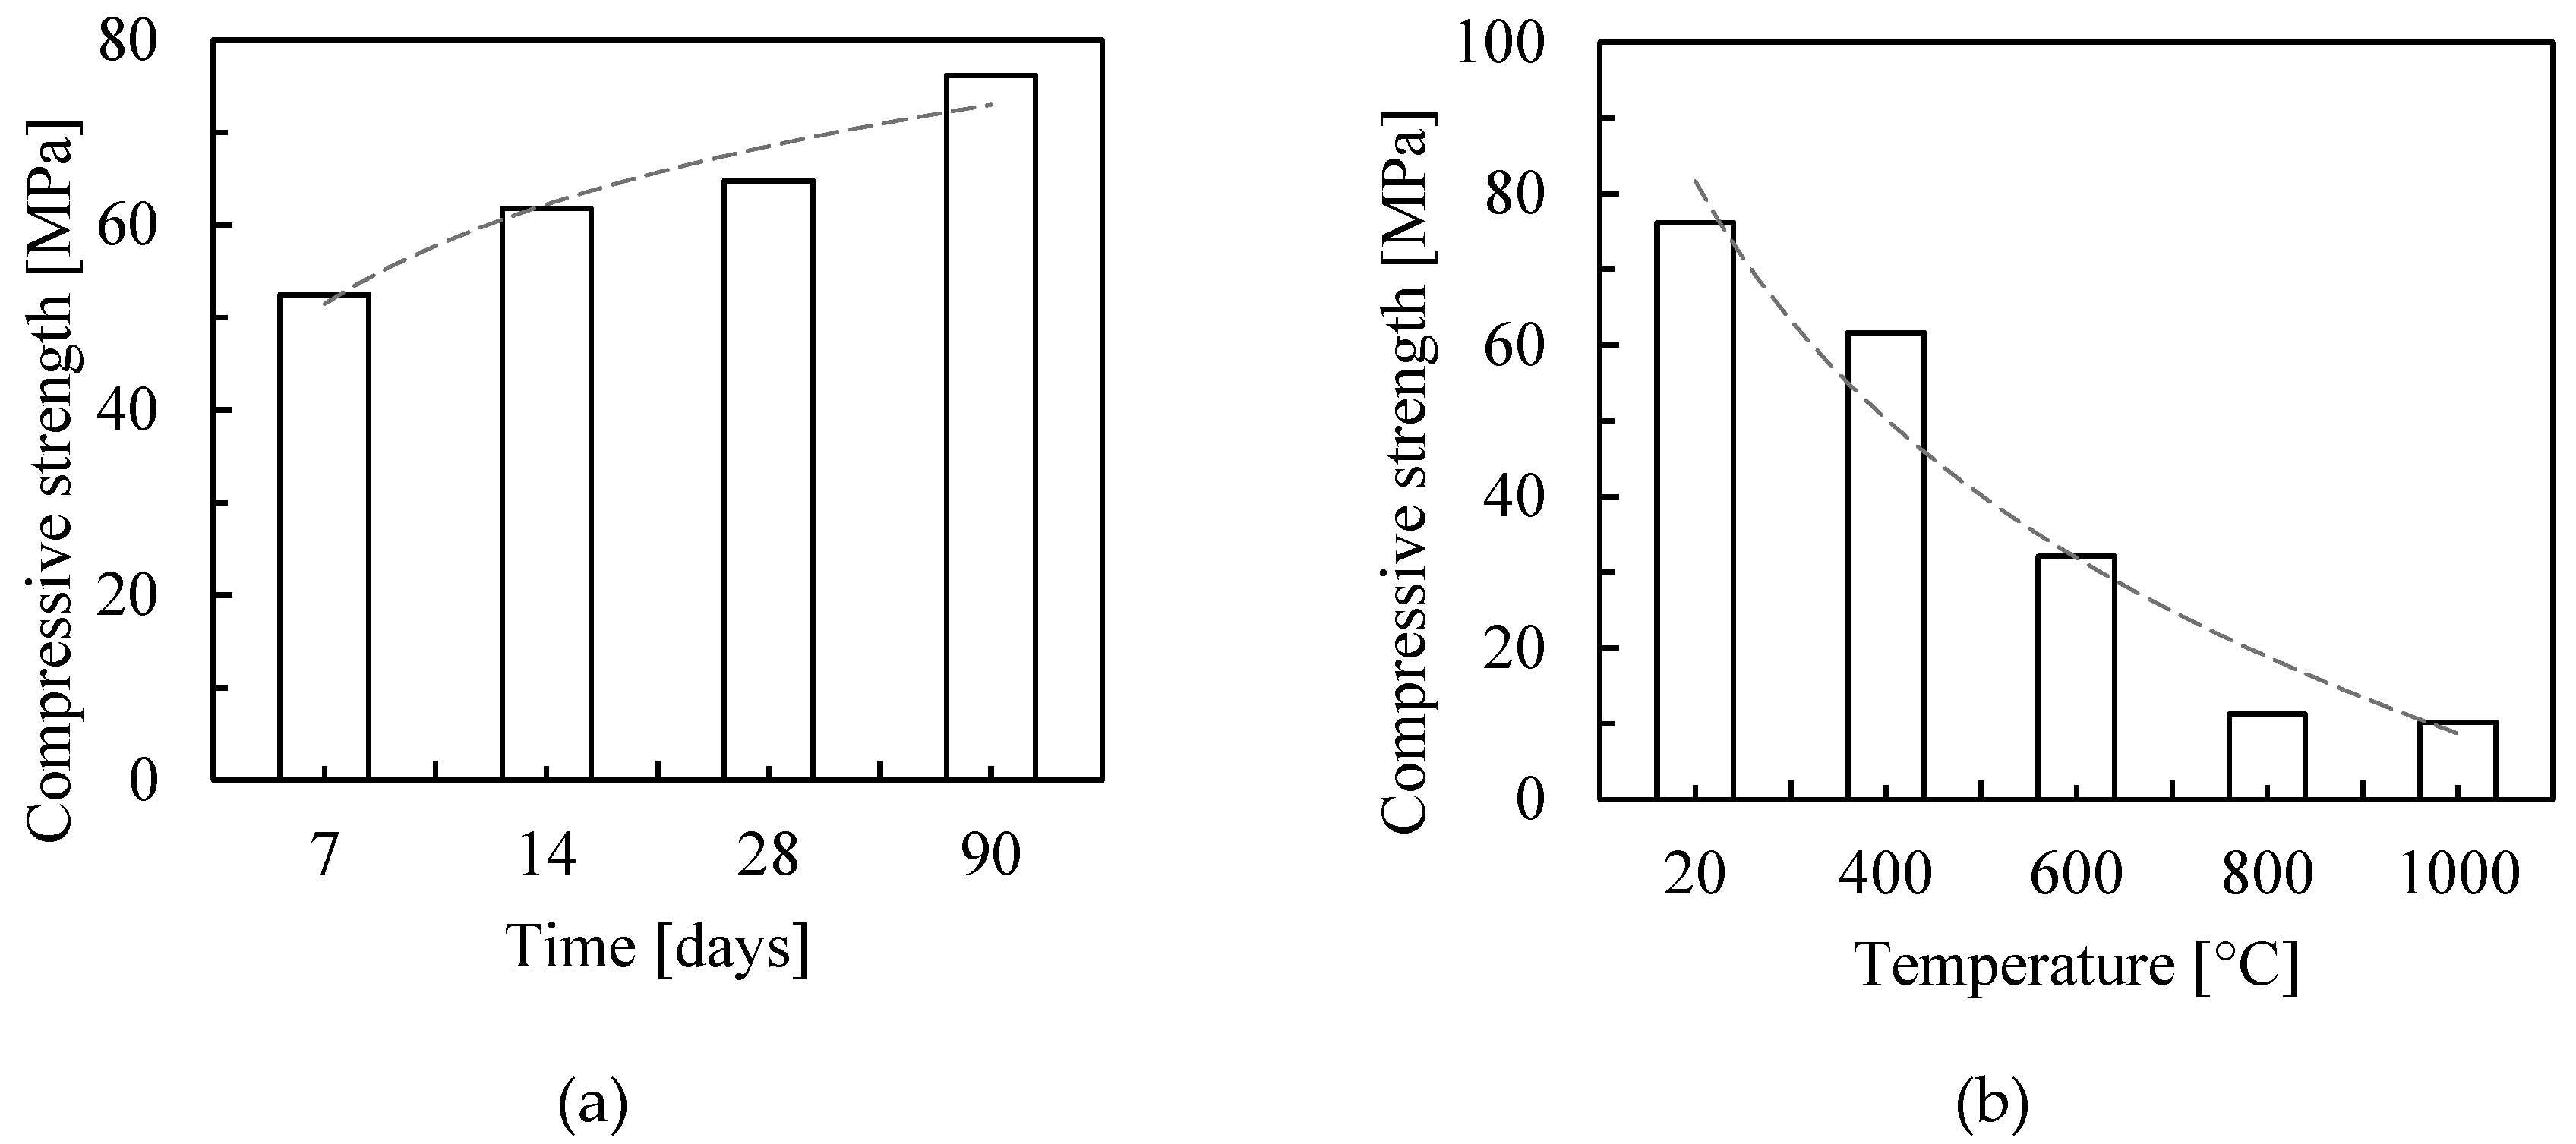
Figure 5a shows the strength evolution of FNS-AAC over time, with nearly 70% of the 90-day compressive strength being achieved within the first 7 days.
Figure 5b illustrates the residual compressive strength of FNS-AAC as a function of exposure temperature, revealing a logarithmic decrease in residual strength with increasing temperature. The rate of strength deterioration appears to significantly decrease between 800 °C and 1000 °C, suggesting the stability of the mineral phases within this temperature range. The primary cause of strength loss at high temperatures is likely the thermal incompatibility between the aggregates and the matrix [
24,
25,
26]. As the aggregates expand at elevated temperatures while the matrix shrinks, tensile stresses are induced in the matrix. Additionally, the release of water from the porous network likely caused further damage to the GFNS concrete matrix as both physical and chemical water were expelled.
3.2. Fire Tests Observations
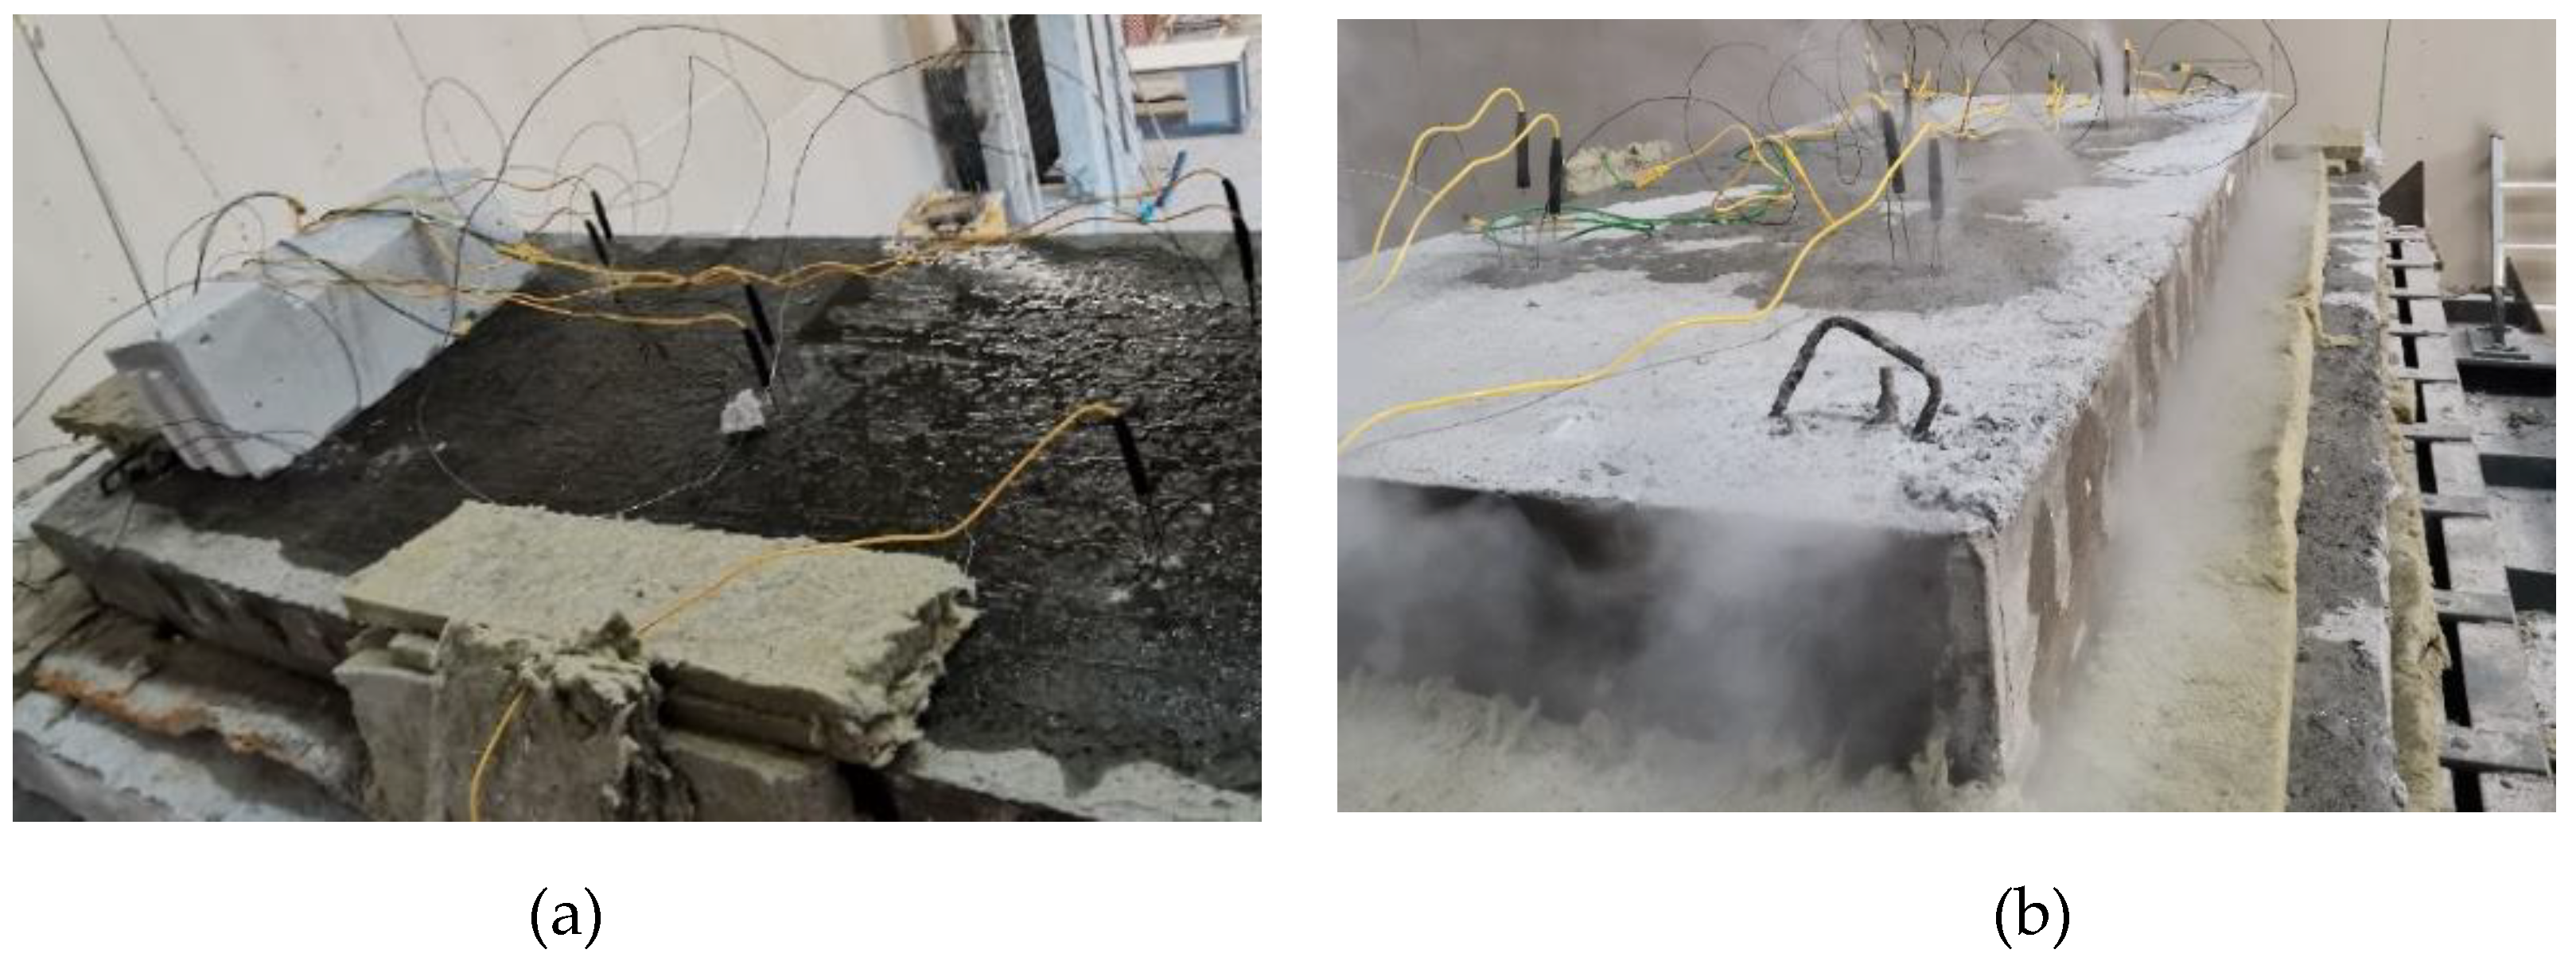
During the fire exposure of the slabs, a significant amount of vapor was observed escaping from their unexposed surfaces and sides. Vapor condensation on the top surfaces of both the FNS-AAC and OPC slabs is shown in
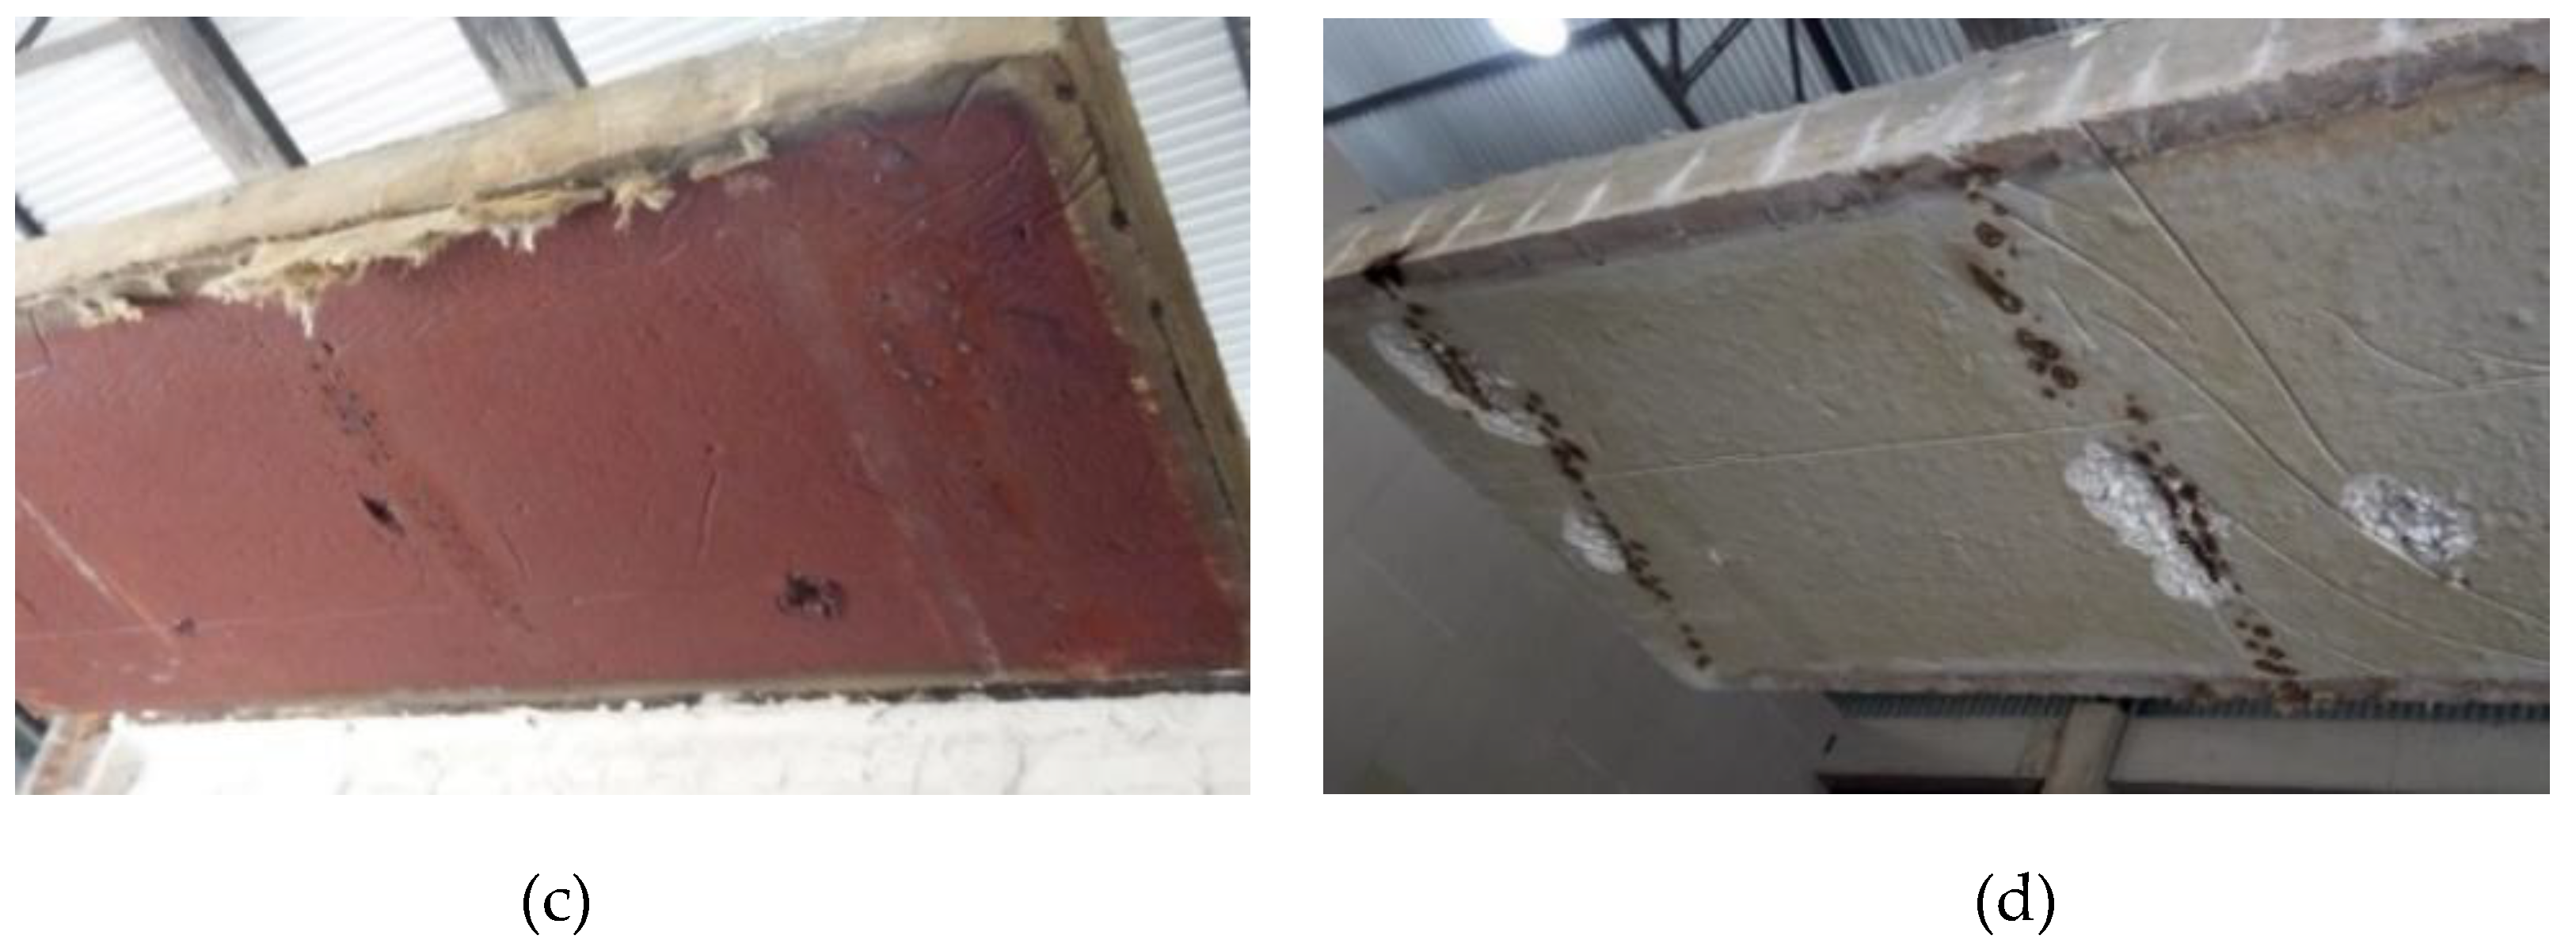
Figure 6a,b, respectively. After the fire exposure campaigns were completed and the slabs had cooled to room temperature, they were removed from the furnace. The FNS-AAC slab exhibited no spalling. The fire-exposed side of the slab had turned red (
Figure 6c), similar to the cubes exposed to 1000°C (see
Figure 4e). A visual inspection revealed that the conventional concrete slab experienced minor spalling, localized at the areas around the rebar spacers (see
Figure 6d). The exposed face of the OPC slab turned a whitish-gray color. The maximum depth of the spalled material was less than 20 mm, which ensured that the rebars were not exposed. By the time the OPC slab was mechanically tested, the entire fire-exposed surface had lost 10-20 mm of friable, burnt concrete. However, this loss did not affect the slab’s flexural capacity, as will be discussed further on. Finally, thin flexural cracks were visible on the sides of both slabs (visible in
Figure 6b), made apparent by water streaks that formed during the fire exposure. These cracks likely resulted from differential heating, which caused a flexural stress characterized by tension due to thermal expansion at the bottom section.
Figure 7a presents the temperature recordings from inside the furnace (furnace control) and from four depth points at the central measuring position (“C”) for both fire-exposed slabs, recorded throughout the firing session (120 minutes) and part of the cooling phase (approximately 30 minutes).
Figure 7b illustrates the depthwise profile of the maximum recorded temperatures for each slab, averaged across all five measurements per zone. The temperature differences between the two specimens are relatively small, with the GFNS slab showing slightly lower temperature readings. This reduction in temperature is likely due to the decreased thermal conductivity resulting from the introduction of FNS sand aggregate. Saha et al. [
26] observed a 50% reduction in thermal conductivity when natural sand was replaced with ferronickel slag, supporting the theory that the ferronickel slag used as fine aggregate in this FNS-AAC slab has led to a decrease in thermal conductivity. The implications of this finding could include the development of high fire-resistant walls, coatings, bricks, and other construction materials.
3.3. Porosity Evolution with Heat Treatment
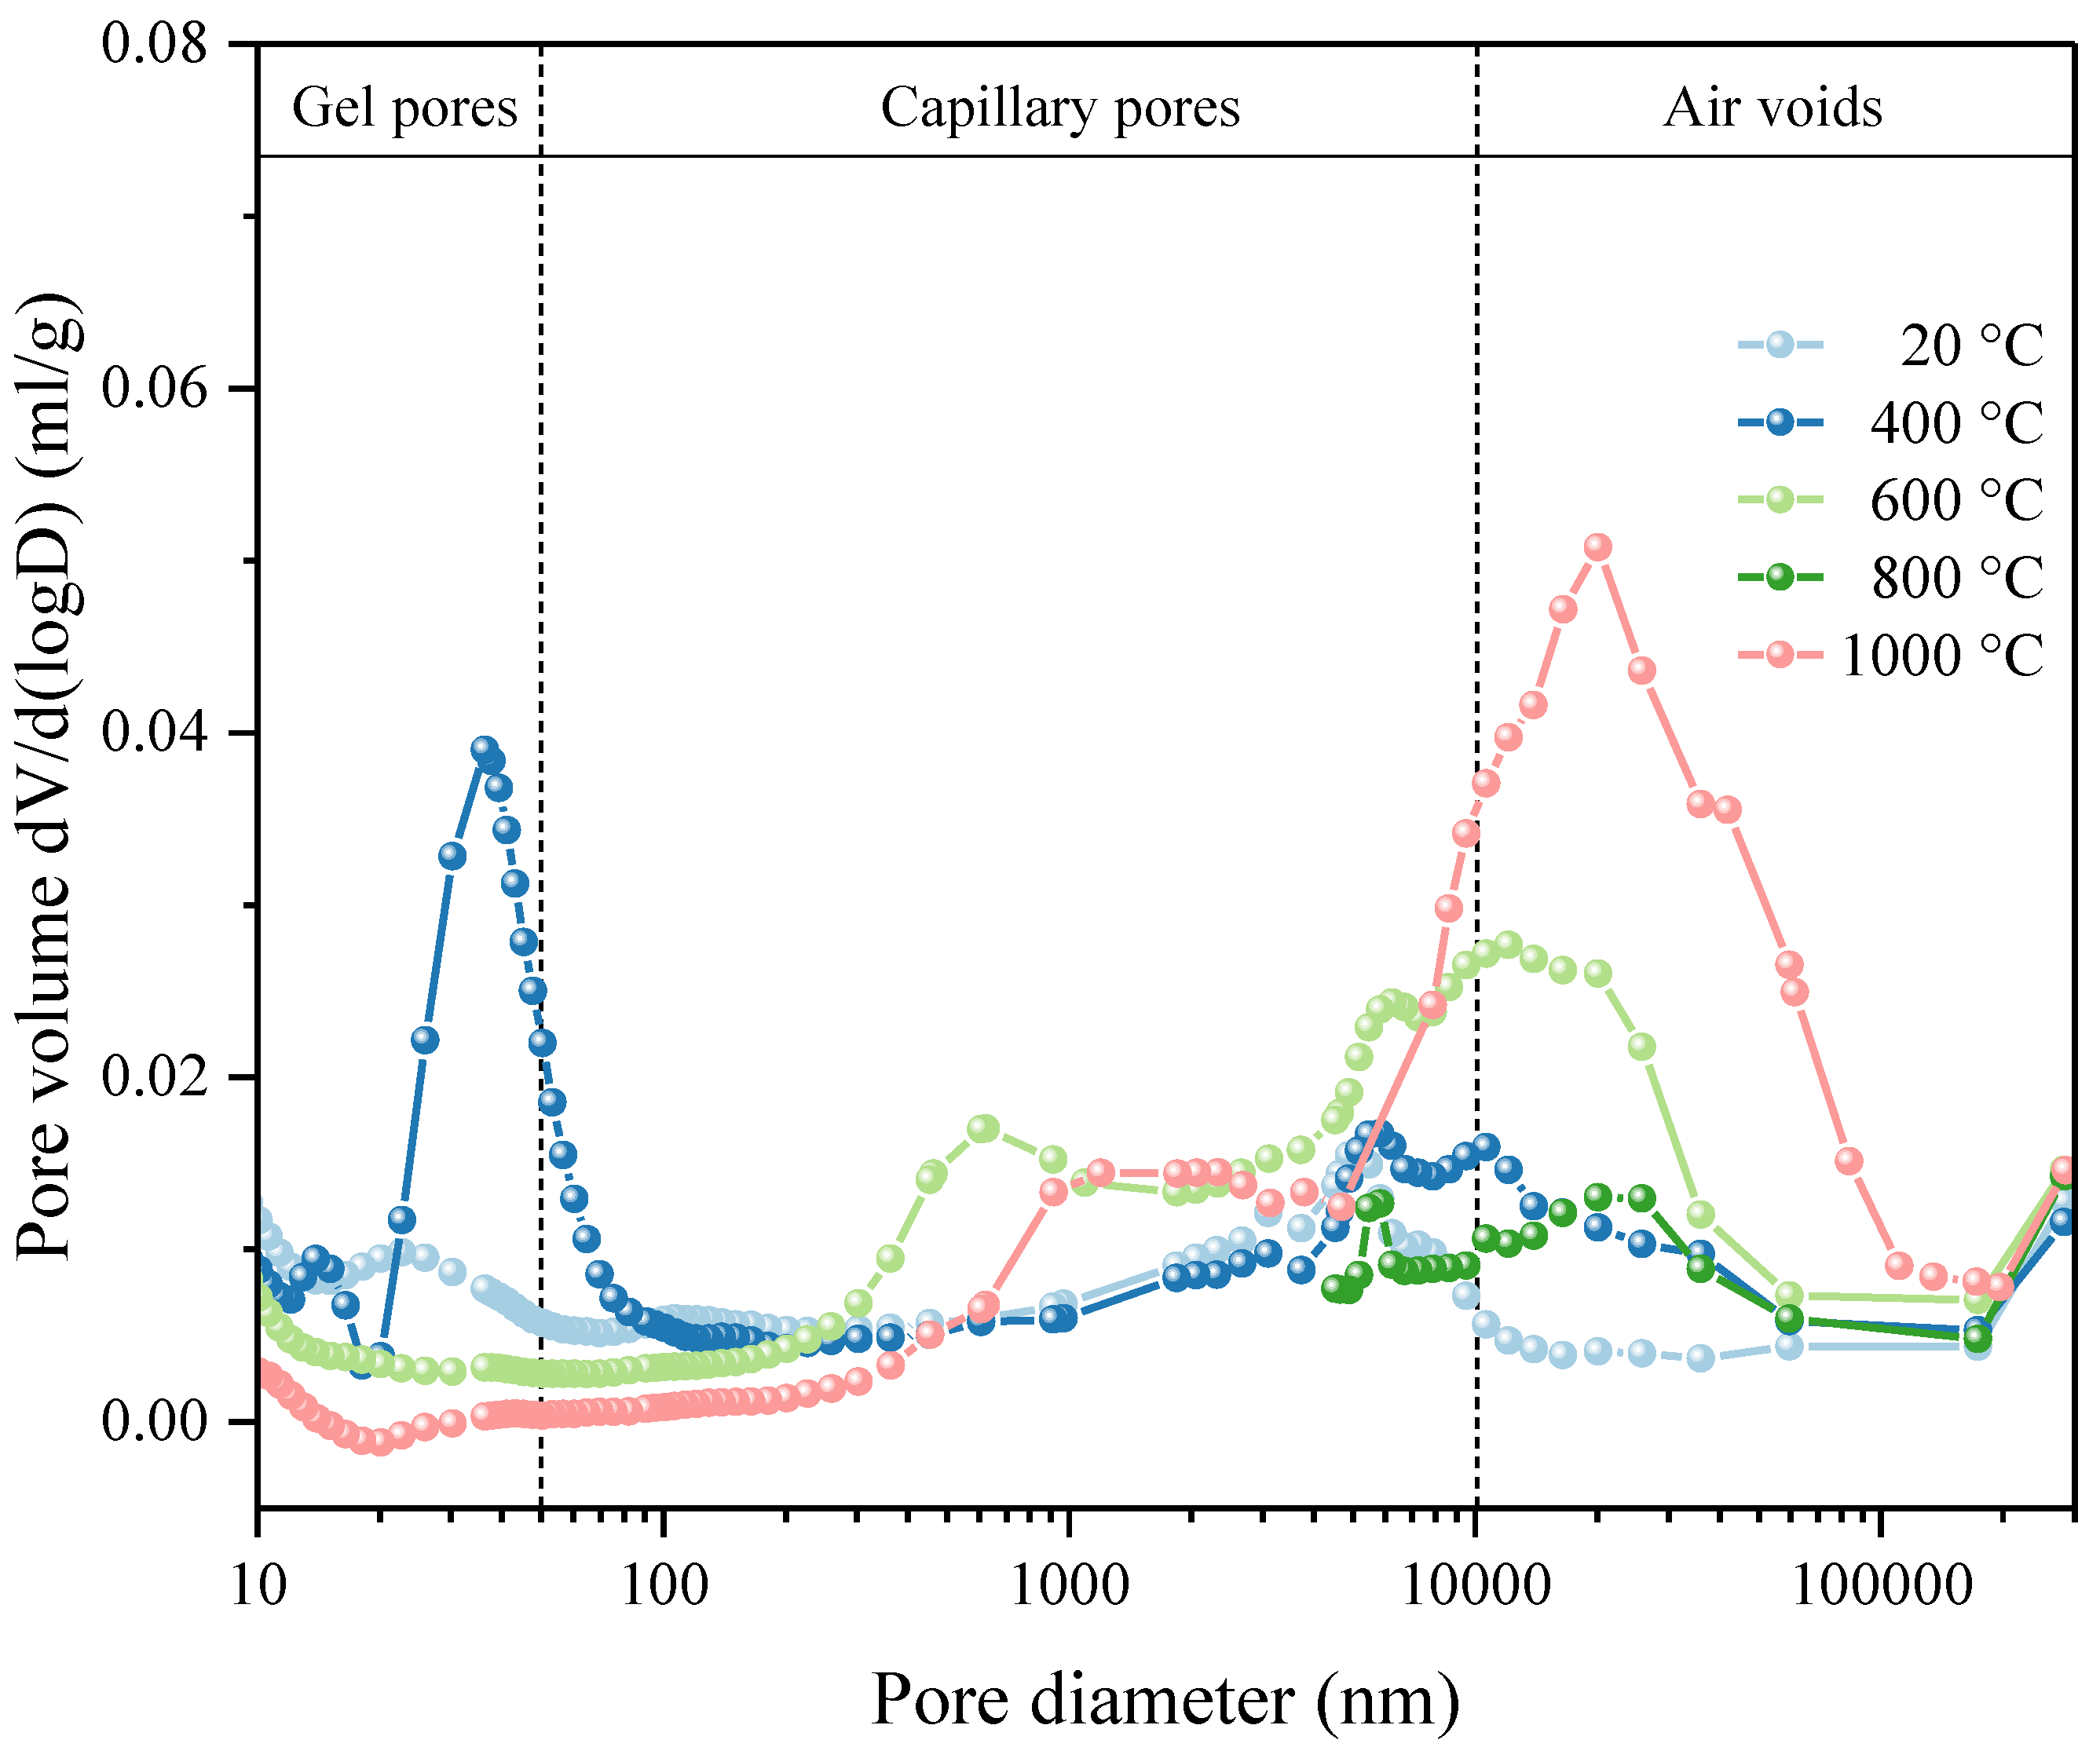
The pore size distributions of both the ambient (20°C) and heat-treated mixtures are shown in
Figure 8. The small partial peak (~10 nm) observed within the gel pore region of 10-50 nm corresponds to pores formed within the matrix during the polycondensation reaction. Larger pores, ranging from 50 nm to 10 µm, appear as capillary pores originating from the pore solution. Pores larger than 10 µm are considered trapped air voids introduced during mixing [
27]. All specimens exhibit distinct pore features across these three categories.
Heat treatment at 400°C results in a significant increase in nanoscale gel porosity toward the upper limit of the range, manifesting as the coalescence of smaller nanoscale pores. The evaporation and migration of the gel solution lead to the collapse of the porous gel structure, volumetric contraction, and microcracks, likely contributing to the deterioration of the concrete’s mechanical properties. At 600°C, the pore volume peak within the 10-50 nm range disappeared entirely, suggesting the significant expulsion of gaseous species within the gel microstructure and concurrent densification of the matrix. The increase in the capillary pore fraction indicates that trapped gaseous species are becoming increasingly concentrated as larger pore features, supporting the general shift in pore size with rising temperature.
The specimen heated to 800°C showed increased porosity due to the thermal decomposition of the matrix gel phase [
28], similar to the well-documented behavior of C-S-H decomposition with temperature [
30,
31]. Further heating to 1000°C resulted in additional densification of the decomposition products of the gel phase, yielding a dense microstructure with large, stable voids greater than 10 µm within the matrix.
3.4. Backscatter Electron Images of Heat-Treated Specimens
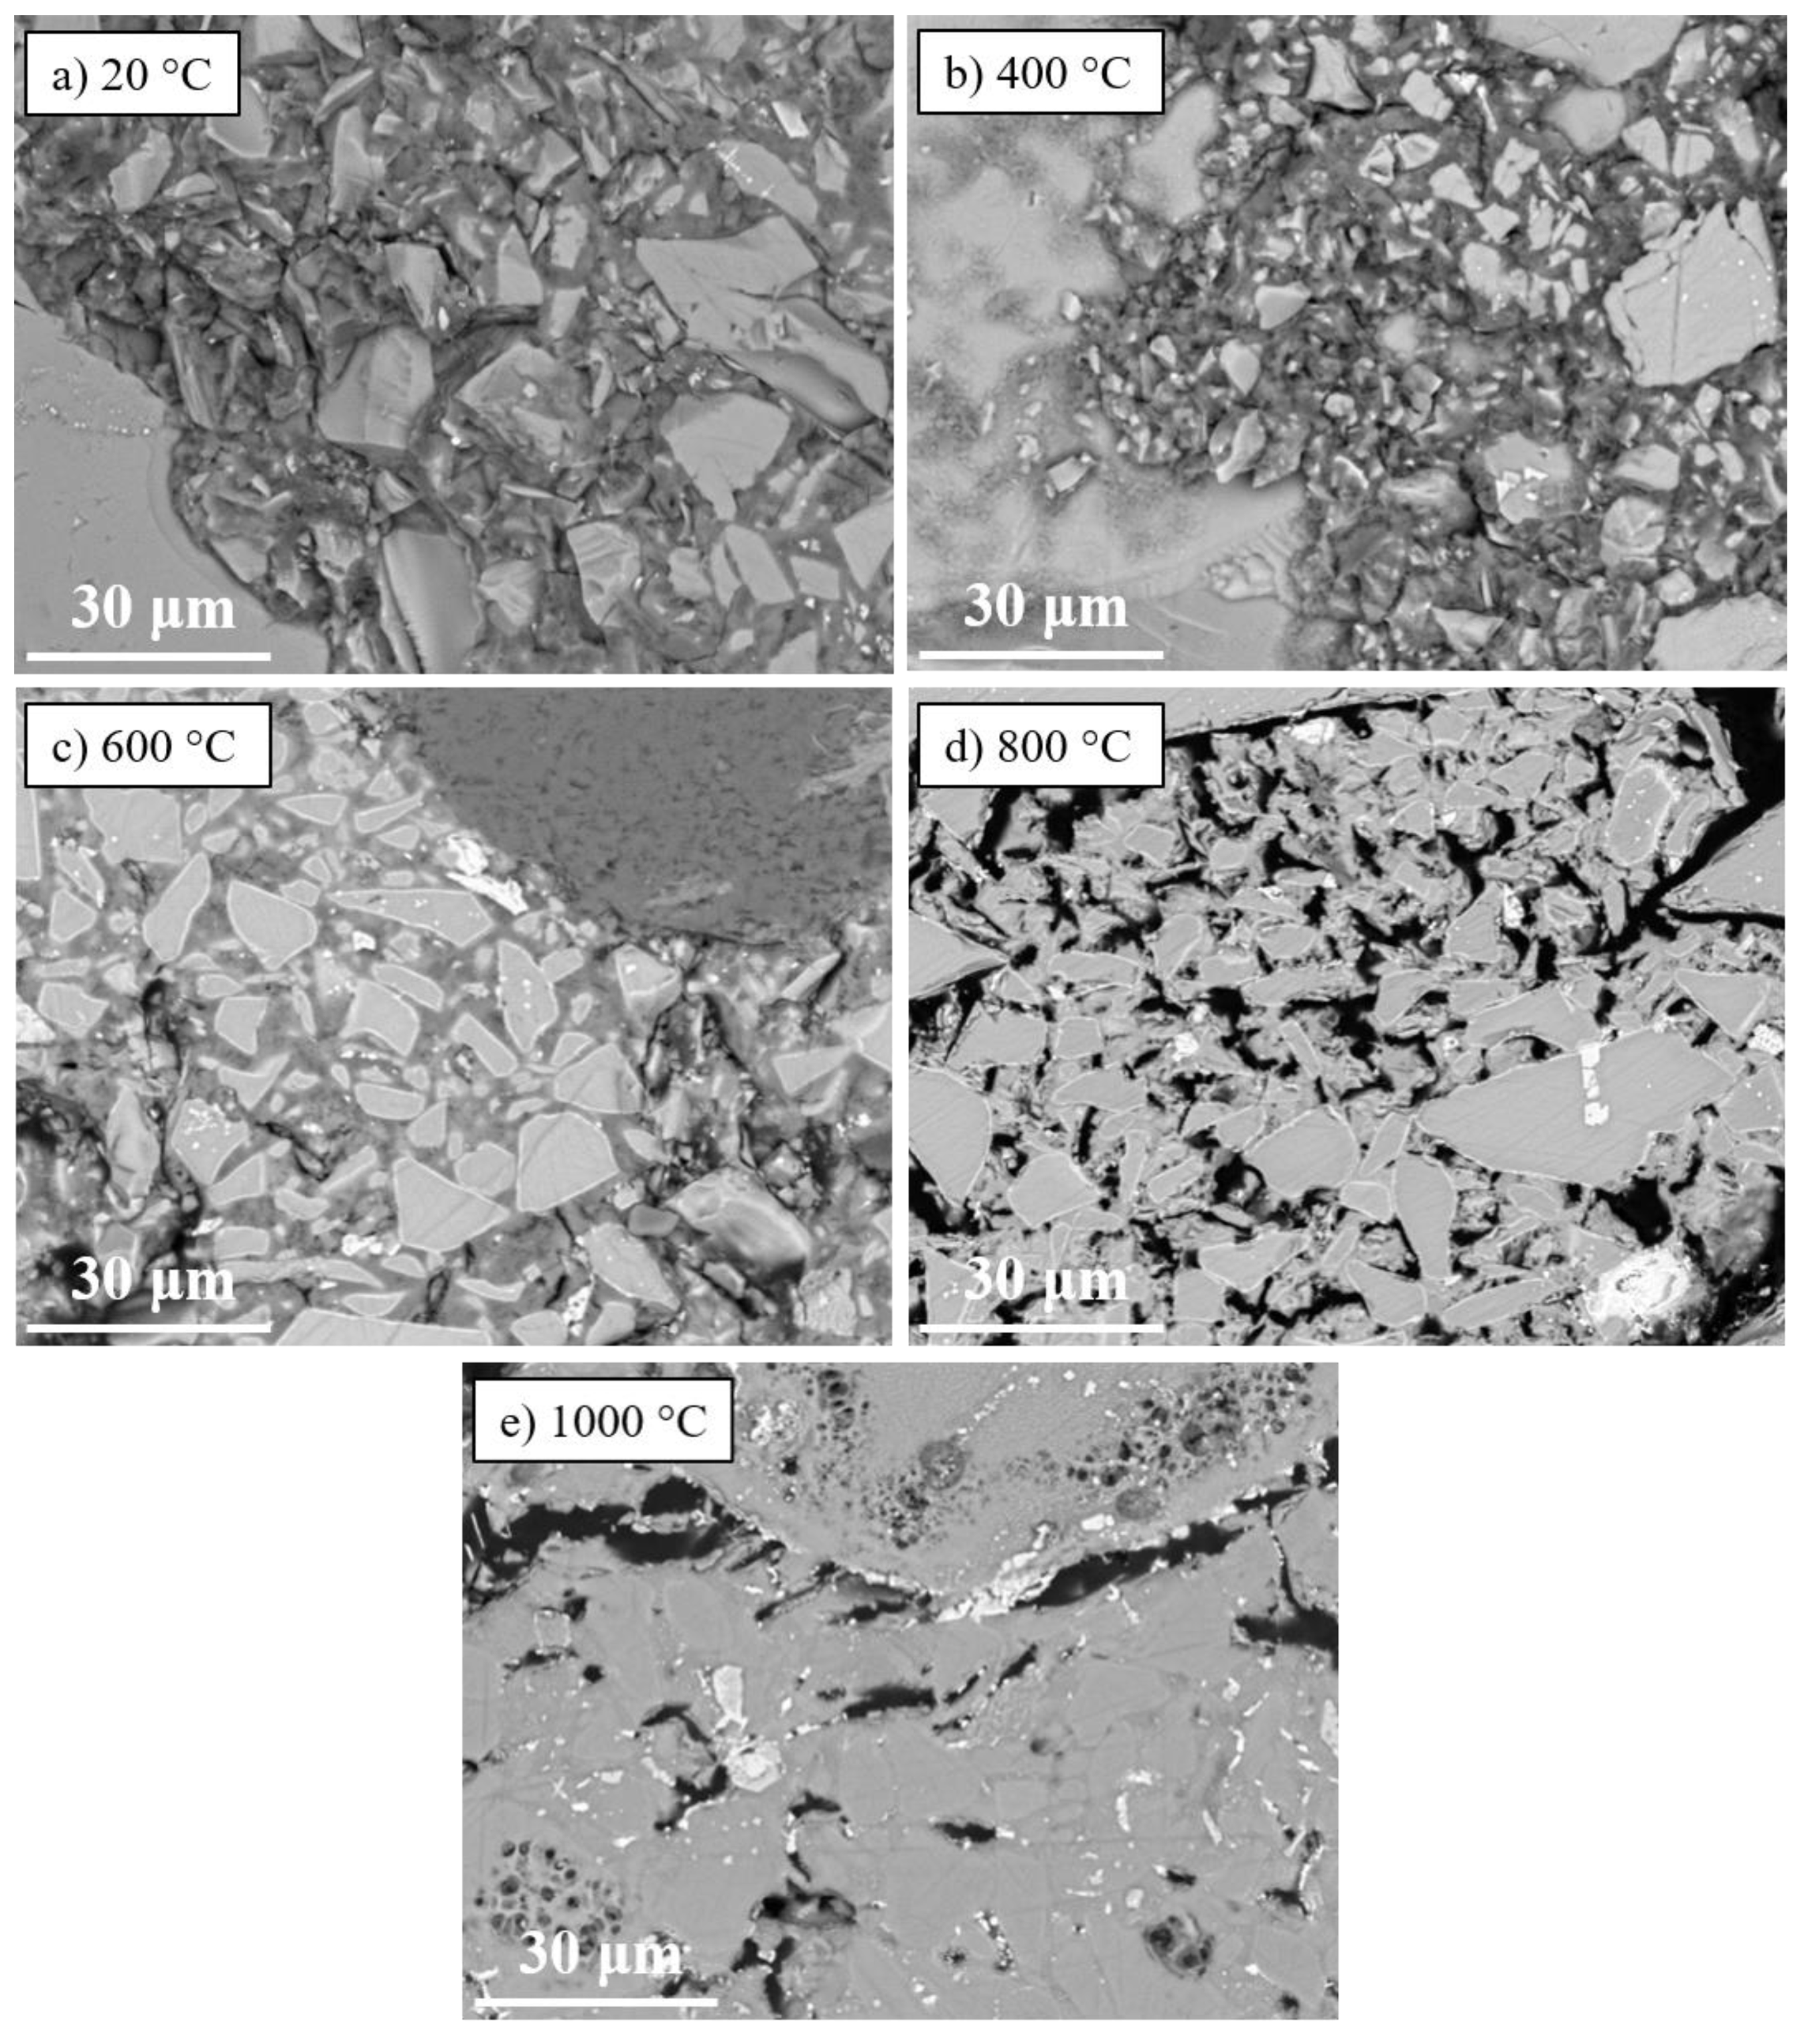
Backscatter electron images of the hardened ambient and heat-treated concrete samples are presented in
Figure 9. Unreacted FNS particles, identifiable by their brighter Z-contrast, exhibit irregular and angular morphologies with a bimodal size distribution (
Figure 9a). Larger FNS particles function as aggregates, while smaller GFNS particles serve as a precursor material for matrix gel formation, ultimately being consumed during the reaction. The surrounding quasi-homogeneous matrix is formed through the limited dissolution and polycondensation of GFNS and added SF.
In
Figure 9b, larger capillary pores and voids are visible in the matrix gel region of the ambient temperature specimen, consistent with the MIP data. The specimen treated at 400°C shows an increase in gel pore size, along with more pronounced dissolution of GFNS particles. The matrix also begins to exhibit signs of thermal damage, with the emergence of more visible voids and a slightly less homogeneous appearance.
The BSE image of the 600°C specimen (
Figure 9c) reveals a more homogeneous matrix contrast, suggesting further densification. The larger capillary pores appear less prominent, indicating that the matrix has become more compact as smaller pores collapse and merge. Decomposition of the matrix phase is evident in
Figure 9d, depicting the specimen subjected to 800°C. This figure shows significant matrix decomposition, with large dark areas corresponding to voids formed due to the shrinkage of the gel matrix. The contrast is less uniform, indicating a breakdown in the microstructure, which aligns with the reported decrease in mechanical strength at this temperature (
Figure 5d).
Upon further heating to 1000°C (
Figure 9e), the matrix becomes highly densified, with large cavities (>10 µm) formed by the coalescence of voids and the escape of gaseous species. The BSE test results are consistent with the trends observed in the MIP data, indicating significant densification, which at 1000°C is at the onset of the vitrification process [
31]
.
3.5. Four Point Bending Test
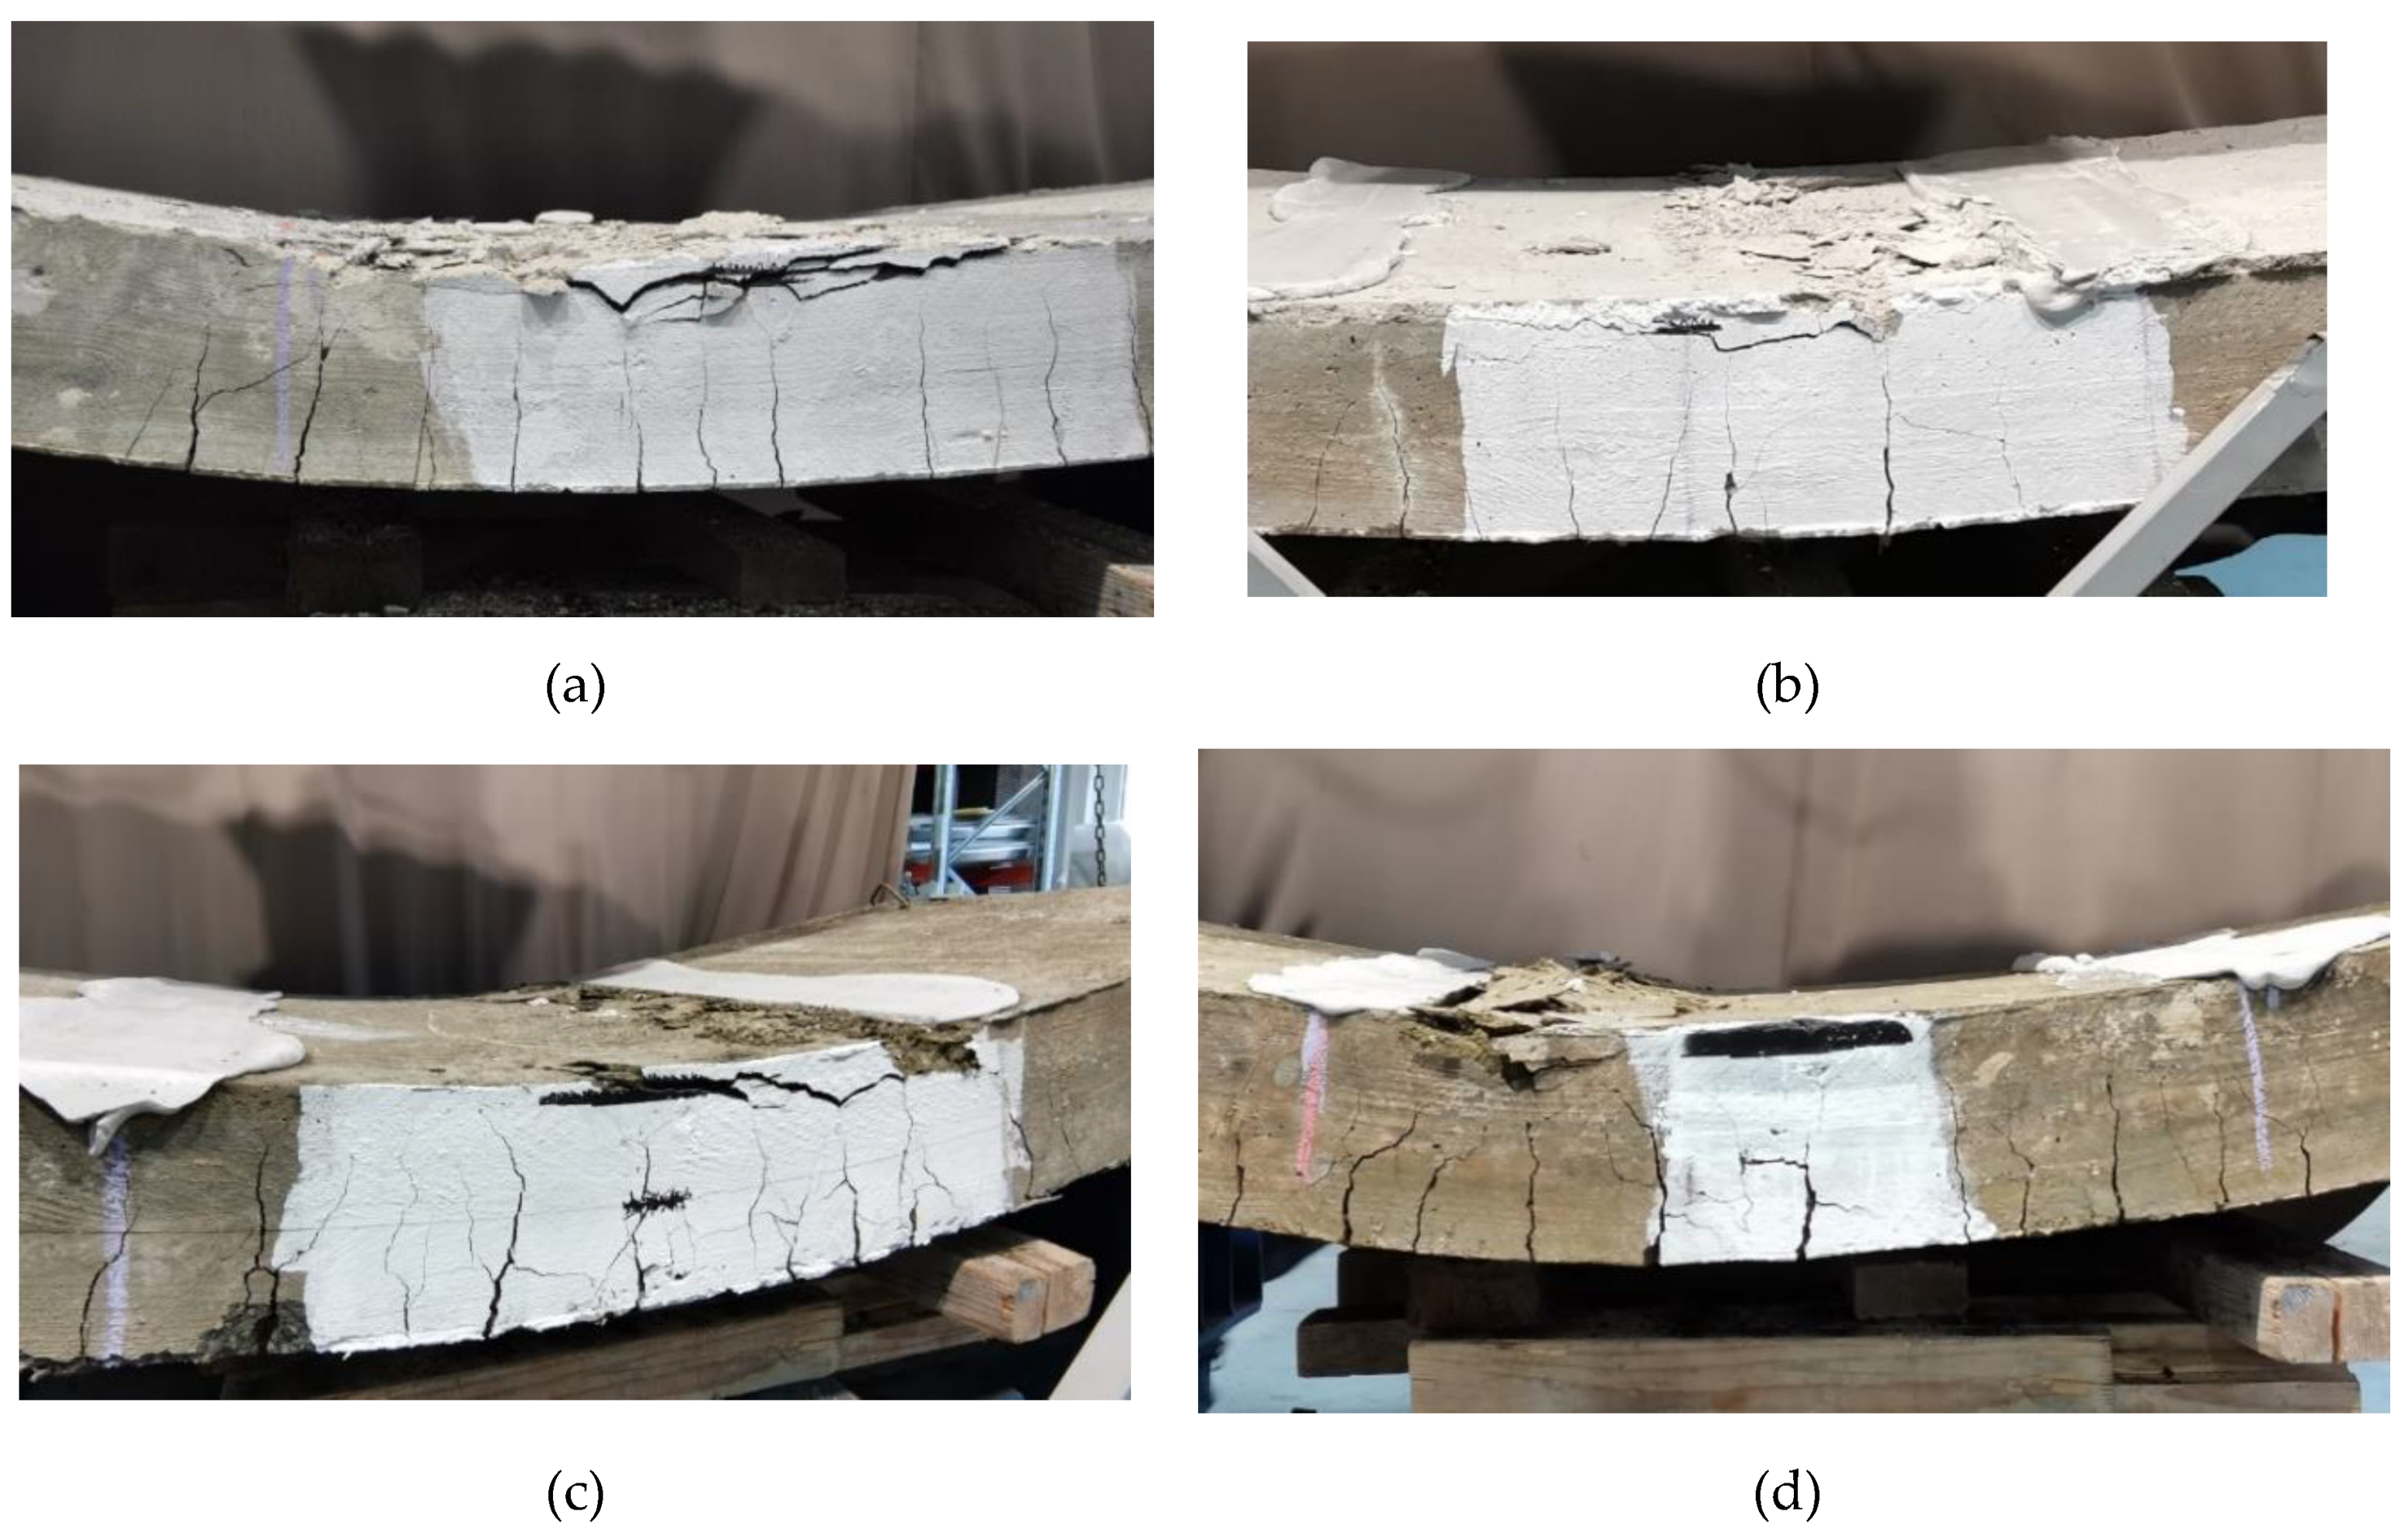
Figure 10 illustrates the failure modes of the four reinforced concrete slabs subjected to four-point bending tests. All specimens exhibited flexural cracks along the span located between the two supports, within the constant moment section. In all cases, the failure mode was characterized by the crushing of the outermost compressed concrete fiber. The crack patterns in both types of fired slabs followed those formed during the fire test. The crushing zone in the OPC slabs was distributed over a larger area, as shown in
Figure 10a,b. In contrast, the crushing zone in the FNS-AAC slab was localized near the load application points
Figure 10c,d.
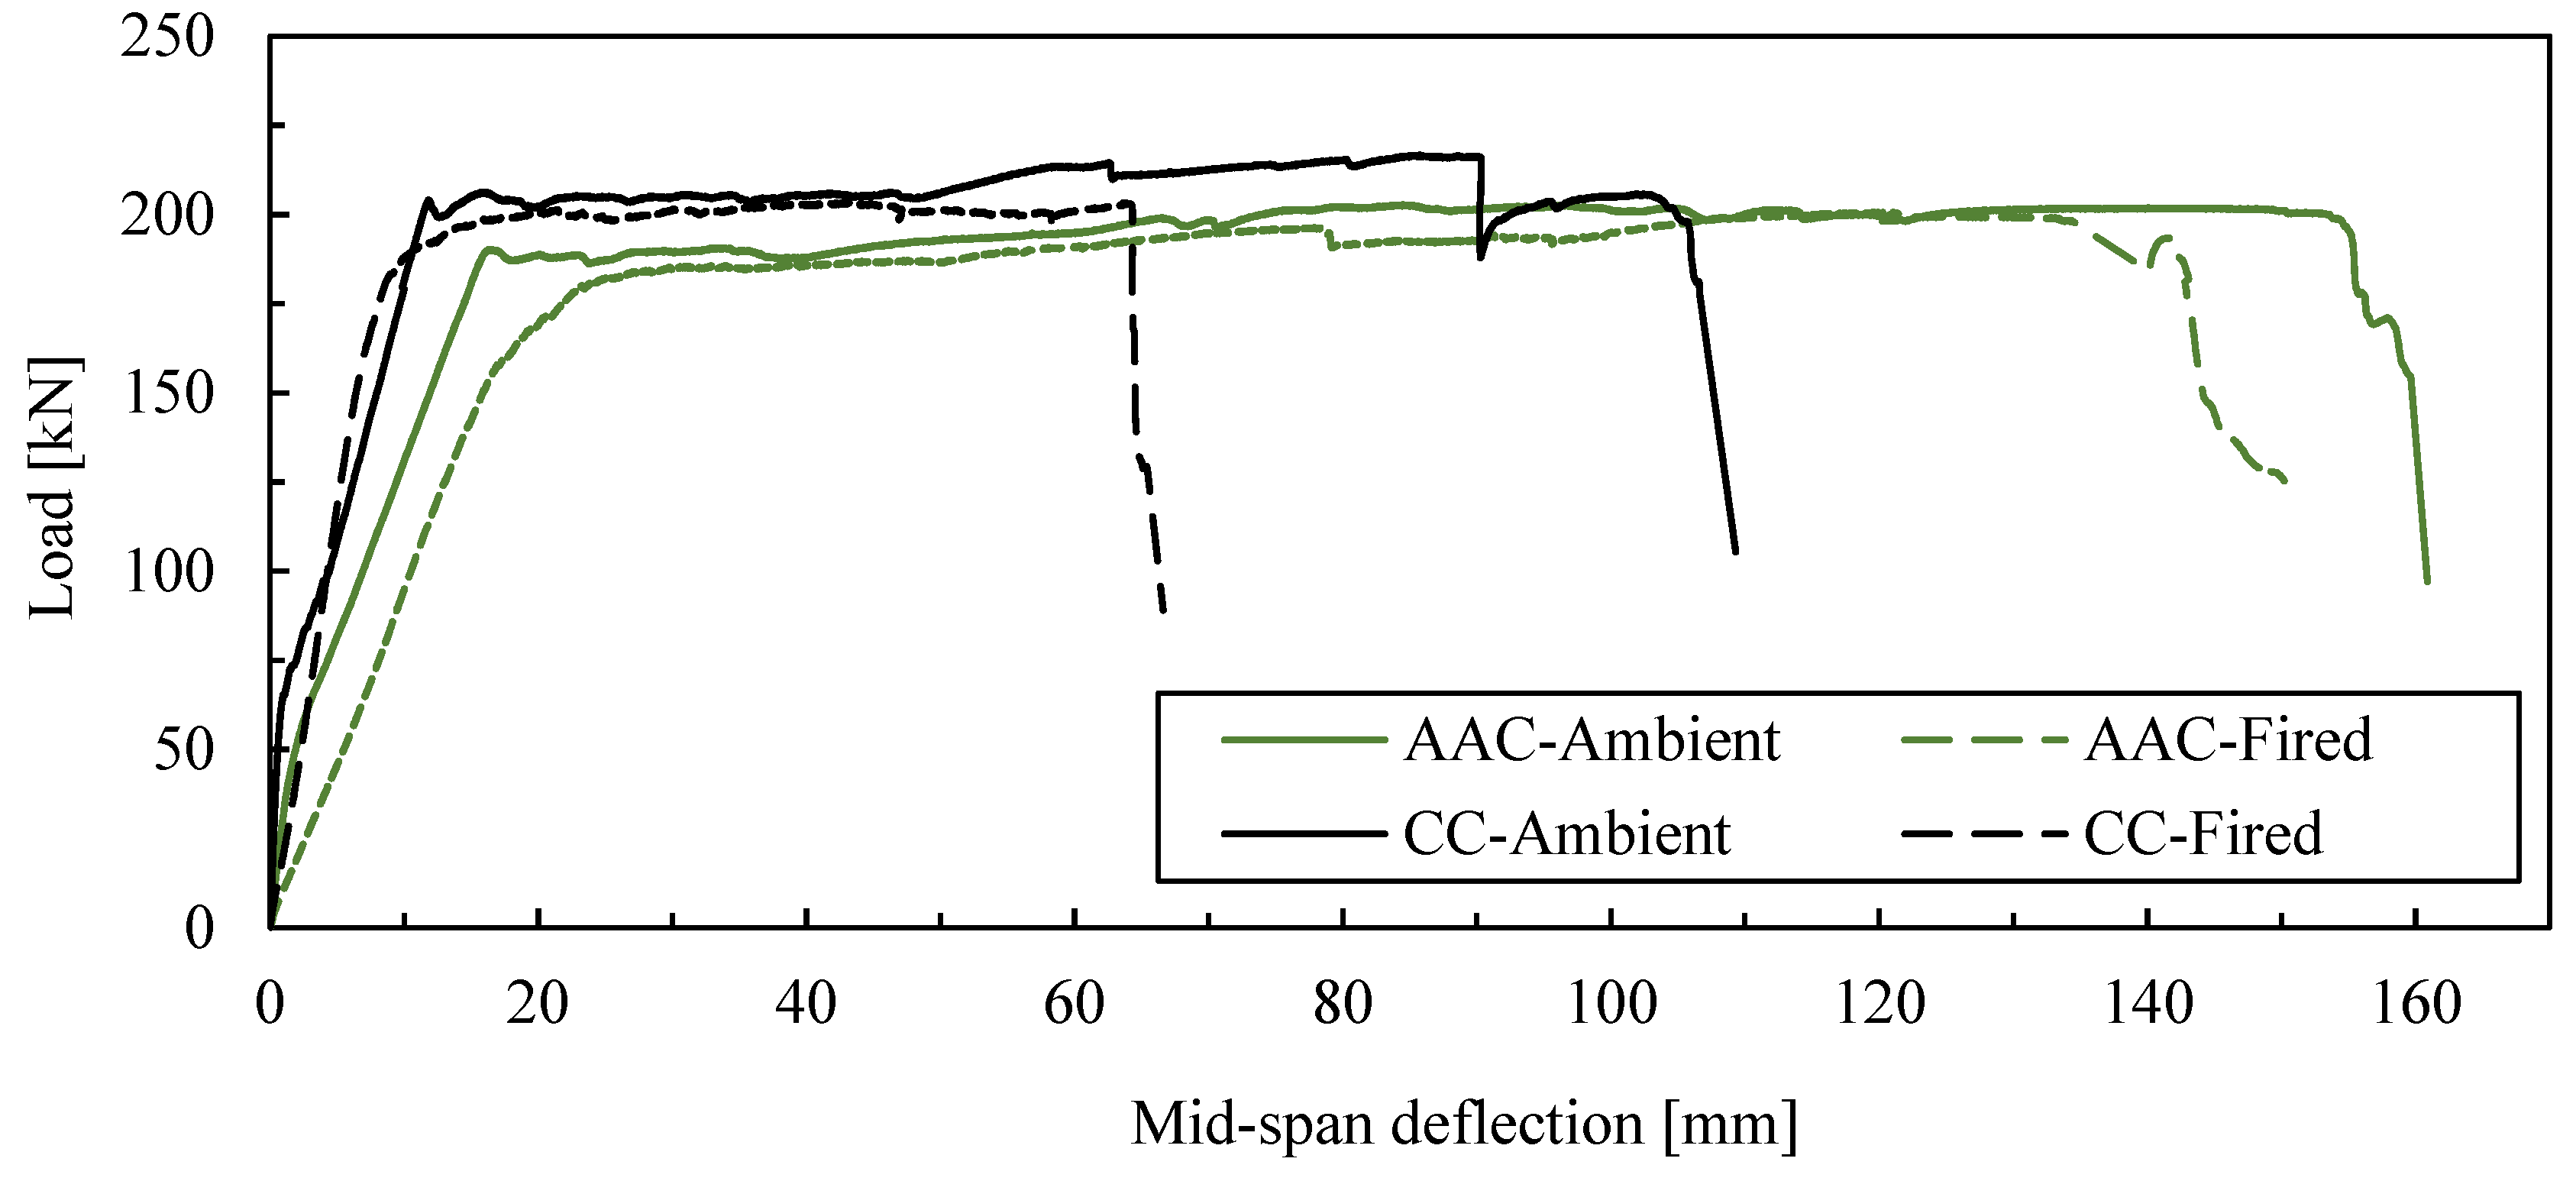
Figure 11a presents the load vs. deflection curves measured at mid-span. For the slabs that were not exposed to fire, the initial segment of these curves corresponds to the pre-cracked state of the concrete. This phase is characterized by higher stiffness in the OPC slabs. The increased stiffness observed in the OPC slabs is attributed to the higher modulus of elasticity of conventional concrete (CC) compared to GFNS concrete, with values of 35 MPa and 20.6 MPa, respectively.
The control (unfired) slabs exhibited typical bilinear behavior before reaching a yielding plateau. Initially, the stiffness reflected the composite action of concrete and steel reinforcement, with the OPC slab showing higher stiffness due to the significantly greater modulus of elasticity of high-strength concrete, consistent with findings by Kumaravel and Thirugnanasambandam [
32] in fly ash alkali-activated concrete beams. After first cracking, the stiffness decreased as the tensile capacity of the concrete was lost. The first crack loads were identified at 61 kN for the OPC slab and 46 kN for the FNS slab, where the load-deflection curves deviated from linearity.
Fire exposure led to a decrease in displacement at yielding for the OPC slab (8.1 mm vs. 11.7 mm for the unfired slab), consistent with the observed increase in stiffness. In contrast, FNS-based concrete showed remarkable stability, with only a 2% difference in the yielding point (17.8 mm vs. 18.1 mm for unexposed and exposed, respectively). The displacement at failure for the OPC slab dropped significantly by 39% (from 104.6 mm to 64.3 mm), whereas the GFNS slab showed only a 9% decrease (from 159 mm to 144 mm). This stability in deformation suggests that GFNS concrete holds great potential for use in fire-prone areas. However, the overall deformation behavior differed significantly between the two materials, with the FNS slab exhibiting 34.2% greater deformation at failure (159 mm vs. 105 mm) and a similar difference at yielding (34.3%, 24.8 mm vs. 17.1 mm).
Slabs exposed to high temperatures, which had pre-existing cracks from fire-induced flexural stress, lacked the initial composite stiffness and exhibited linear behavior from the start up to the yield point. Notably, the stiffness of the fired FNS-AAC slab was similar to that of its unfired counterpart after first cracking, while the fired OPC slab showed lower stiffness than the unfired slab before cracking but higher stiffness afterward, a phenomenon discussed further below. The transition from the linear ascending branch to the yielding plateau was sharp for the unfired slabs but smooth for the fired ones, indicating altered deformation characteristics in the heat-affected steel rebars. Yielding plateaus showed minimal strain hardening, and maximum loads were comparable across all slabs, with the OPC slabs reaching about 6% higher loads. However, deflections at failure were significantly higher for FNS-AAC slabs than for OPC ones, and higher for fired slabs compared to unfired ones.
The apparent increase in stiffness of the fired OPC slab compared to the unfired one in the cracked state prior to yielding can be attributed to a rise in the modulus of elasticity in the compression zone due to moisture clogging. Fire exposure caused water migration, leading to moisture accumulation in the upper sections of the slabs, as evidenced by water pooling on top (
Figure 6a for the OPC slab and
Figure 6b for the FNS slab). This moisture migration and condensation away from the heat-exposed faces align with the phenomenon described by Shorter and Harmathy [
33], and further visualized by Dauti et al. [
34] using in situ neutron tomography. In numbers, Liu et al. [
35] observed up to a 30% increase in the modulus of elasticity in concrete due to moisture content rising to approximately 3.5%, and Zhang et al. [
36] similarly reported a 24% increase from dry to saturated conditions. The moisture-clogging effect likely contributed to the behavior observed in the fired slabs.
The spalling behavior might also offer insight into the differing performance of FNS-AAC and OPC slabs. Zhou et al.[
37] concluded that, for concretes of similar strength, alkali-activated materials (AAMs) exhibit greater spalling resistance than Portland cement products due to their well-connected porous networks, which allow for more efficient vapor dissipation.
Figure 6c,d show the fire-exposed slab surfaces, where the FNS-based slab exhibited no spalling, while the OPC slab showed minor spalling. These findings suggest that the FNS matrix in FNS-AAC slabs is better interconnected, facilitating vapor dissipation. This is further supported by the MIP and BSE results presented in sections 3.2 and 3.3. Conversely, OPC, particularly high-strength concrete as used in this study, is more prone to spalling due to its lower permeability [
38], which generally decreases with higher compressive strength. The MIP and SEM results also demonstrate that the vapor dissipation advantage of FNS-AAC increased due to larger pore size, total pore volume (
Figure 8,
Section 3.2), and enhanced pore connectivity (
Figure 9,
Section 3.3).
4. Conclusions
The present study fillfiled its mission to decrease the gap of knowledge regarding large scale applciations of AAM in structural applciations, as aas a viable alternative CC. In aprticualr, the results show that:
The compressive and tensile strengths of FNS-AAC, while slightly lower than OPC, fall within acceptable ranges for structural applications, demonstrating that FNS-AAC can be considered a reliable alternative to conventional concrete. The distinctive failure modes observed in both FNS-AAC and OPC specimens further reinforce the similarity in their mechanical behavior.
The fire test results highlight the superior thermal stability of FNS-AAC. Unlike OPC slabs, which exhibited minor spalling and significant loss in displacement at failure after fire exposure, the FNS-AAC slabs maintained their structural integrity with no spalling and showed remarkable stability in their deformation behavior.
The analysis of the microstructural evolution under heat treatment revealed a well-connected porous network in FNS-AAC, which facilitates efficient vapor dissipation, which is likely the reason for the enhanced spalling resistance compared to OPC.
The findings of this study suggest that FNS-AAC can be utilized in construction scenarios where conventional concrete is typically employed, with added benefits in fire resistance. This positions FNS-AAC as a strong candidate for future construction materials, particularly in applications of high fire risk.
Funding
This research was funded by the European Union’s H2020 MARIE SKODOWSKA-CURIE ACTIONS, grant agreement No. 813596 DuRSAAM.
Availability of data and materials
All data generated or analysed during this study are included in this published article.
Declaration of Competing Interest
There are no competing interests associated with the submission of this manuscript.
Author contributions
Andres Arce: Conceptualization, Methodology, Software, Formal analysis, Investigation, Writing - Original Draft, Visualization Panagiotis Kapsalis: Methodology, Formal analysis, Writing - Original Draft, Catherine G. Papanicolaou: Validation, Resources, Data Curation, Writing - Review & Editing, Visualization, Supervision, Project administration, Funding acquisition Thanasis C. Triantafillou: Writing - Review & Editing, Visualization, Supervision, Project administration, Funding acquisition.
Acknowledgments
We thank the company LARCO for the kind donation of ferronickel slag. Special acknowledgement is given to the Laboratory of Sedimentology, and the Laboratory of Electron Microscopy and Microanalysis of the University of Patras.
References
- U. Nations, “Causes and Effects of Climate Change,” United Nations. Accessed: Aug. 17, 2022. [Online]. Available: https://www.un.org/en/climatechange/science/causes-effects-climate-change.
- Larco General Mining & Metallurgical Co. S.A., “Research and development,” 2022, [Online]. Available: http://www.larco.gr/rnd.php.
- Maragkos, I.; Giannopoulou, I.P.; Panias, D. Synthesis of ferronickel slag-based geopolymers. Miner. Eng. 2009, 22, 196–203. [Google Scholar] [CrossRef]
- Sakkas, K.; Nomikos, P.; Sofianos, A.; Panias, D. Utilisation of FeNi-Slag for the Production of Inorganic Polymeric Materials for Construction or for Passive Fire Protection. Waste Biomass- Valorization 2014, 5, 403–410. [Google Scholar] [CrossRef]
- Komnitsas, K.; Zaharaki, D.; Perdikatsis, V. Geopolymerisation of low calcium ferronickel slags. J. Mater. Sci. 2007, 42, 3073–3082. [Google Scholar] [CrossRef]
- Sam Meredith, “A sand shortage? The world is running out of a crucial — but under-appreciated — commodity,” Mar. 2021, [Online]. Available: https://www.cnbc.com/2021/03/05/sand-shortage-the-world-is-running-out-of-a-crucial-commodity.html.
- Rajendran, M.; Soundarapandian, N. An experimental investigation on the flexural behavior of geopolymer ferrocement slabs. J. Eng. Technol. 2013, 3, 97. [Google Scholar] [CrossRef]
- Sarker, P.K.; Mcbeath, S. Fire endurance of steel reinforced fly ash geopolymer concrete elements. Constr. Build. Mater. 2015, 90, 91–98. [Google Scholar] [CrossRef]
- Ma, C.-K.; Awang, A.Z.; Omar, W. Structural and material performance of geopolymer concrete: A review. Constr. Build. Mater. 2018, 186, 90–102. [Google Scholar] [CrossRef]
- International Organization for Standardization, “ISO 834-1:1999(E). Fire-resistance tests — Elements of building construction,” 1999.
- M. Papachristoforou, “Development of concrete mixtures for use as material for additive manufacturing”.
- Arce, A. Komkova, C. G. Papanicolaou, and T. C. Triantafillou, “Performance Based Design of Alkali Activated Concrete for High Thermal Load Applications,” Sep. 11, 2024, Preprints: 2024090829. [CrossRef]
- EN 12390-3. Testing Hardened Concrete—Part 3: Compressive Strength of Test Specimens,” Comite Europeen de Normalisation, Brussels, Belgium, 2019.
- EN 12390-6. Testing Hardened Concrete Part 6: Bending Strength of Test Specimens,” Comite Europeen de Normalisation, Brussels, Belgium, 2019.
- European Committee for Standardization (CEN), EN 1363-1. Fire resistance tests - Part 1: General requirements, Brussels, Belgium., 2020.
- Lindorf, A.; Curbach, M. S–N curves for fatigue of bond in reinforced concrete structures under transverse tension. Eng. Struct. 2010, 32, 3068–3074. [Google Scholar] [CrossRef]
- Tang, X.; Xu, J.; Zhang, Y.; Zhao, H.; Paluszny, A.; Wan, X.; Wang, Z. The rock-forming minerals and macroscale mechanical properties of asteroid rocks. Eng. Geol. 2022, 321. [Google Scholar] [CrossRef]
- Ban, H.; Karki, P.; Kim, Y.-R. Nanoindentation Test Integrated with Numerical Simulation to Characterize Mechanical Properties of Rock Materials. J. Test. Evaluation 2014, 42, 787–796. [Google Scholar] [CrossRef]
- Pan, Z.; Sanjayan, J.G.; Rangan, B.V. Fracture properties of geopolymer paste and concrete. Mag. Concr. Res. 2011, 63, 763–771. [Google Scholar] [CrossRef]
- Fernández-Jiménez, A.; Pastor, J.Y.; Martín, A.; Palomo, A. High-Temperature Resistance in Alkali-Activated Cement. J. Am. Ceram. Soc. 2010, 93, 3411–3417. [Google Scholar] [CrossRef]
- Rickard, W.D.A.; van Riessen, A.; Walls, P. Thermal Character of Geopolymers Synthesized from Class F Fly Ash Containing High Concentrations of Iron and α-Quartz. Int. J. Appl. Ceram. Technol. 2010, 7, 81–88. [Google Scholar] [CrossRef]
- Vázquez-Acosta, F.; Torres-Martínez, L.M.; López-González, W.; Ibarra-Rodríguez, J. Influence of iron content on the color of the C3A–Fe2O3 system synthesized under different conditions of temperature, atmosphere and cooling. Ceram. Int. 2012, 38, 3261–3272. [Google Scholar] [CrossRef]
- Kong, D.L.; Sanjayan, J.G. Damage behavior of geopolymer composites exposed to elevated temperatures. Cem. Concr. Compos. 2008, 30, 986–991. [Google Scholar] [CrossRef]
- Ranjbar, N.; Mehrali, M.; Alengaram, U.J.; Metselaar, H.S.C.; Jumaat, M.Z. Compressive strength and microstructural analysis of fly ash/palm oil fuel ash based geopolymer mortar under elevated temperatures. Constr. Build. Mater. 2014, 65, 114–121. [Google Scholar] [CrossRef]
- Bernal, S.A.; de Gutiérrez, R.M.; Ruiz, F.; Quiñones, H.; Provis, J.L. Desempeño a temperaturas altas de morteros y hormigones basados en mezclas de escoria/metacaolín activadas alcalinamente. Mater. De Construccion 2012, 62, 471–488. [Google Scholar] [CrossRef]
- Saha, A.K.; Sarker, P.K. Mitigation of the potential alkali–silica reaction of FNS using ground FNS as a supplementary binder. Adv. Cem. Res. 2019, 32, 537–546. [Google Scholar] [CrossRef]
- Ma, Y.; Hu, J.; Ye, G. The pore structure and permeability of alkali activated fly ash. Fuel 2013, 104, 771–780. [Google Scholar] [CrossRef]
- Fan, F.; Liu, Z.; Xu, G.; Peng, H.; Cai, C. Mechanical and thermal properties of fly ash based geopolymers. Constr. Build. Mater. 2018, 160, 66–81. [Google Scholar] [CrossRef]
- Alarcon-Ruiz, L.; Platret, G.; Massieu, E.; Ehrlacher, A. The use of thermal analysis in assessing the effect of temperature on a cement paste. Cem. Concr. Res. 2005, 35, 609–613. [Google Scholar] [CrossRef]
- Tantawy, M.A. Effect of High Temperatures on the Microstructure of Cement Paste. J. Mater. Sci. Chem. Eng. 2017, 05, 33–48. [Google Scholar] [CrossRef]
- Traven, K.; Češnovar, M.; Škapin, S.D.; Ducman, V. High temperature resistant fly-ash and metakaolin-based alkali-activated foams. Ceram. Int. 2021, 47, 25105–25120. [Google Scholar] [CrossRef]
- S. Kumaravel and S. Thirugnanasambandam, “Flexural Behaviour of Reinforced Low Calcium Fly Ash basedGeopolymer Concrete Beam,” p. 7, 2013.
- Shorter G. W. and Harmathy T. Z., “Discussion on the article ‘The fire resistance of concrete beams’ by Ashton and Bate,” in Proceedings of the ICE, Institute of Civil Engineers, p. 313.
- Dauti, D.; Tengattini, A.; Pont, S.D.; Toropovs, N.; Briffaut, M.; Weber, B. Analysis of moisture migration in concrete at high temperature through in-situ neutron tomography. Cem. Concr. Res. 2018, 111, 41–55. [Google Scholar] [CrossRef]
- Liu, B.D.; Lv, W.J.; Li, L.; Li, P.F. Effect of moisture content on static compressive elasticity modulus of concrete. Constr. Build. Mater. 2014, 69, 133–142. [Google Scholar] [CrossRef]
- Zhang, G.; Li, C.; Wei, H.; Wang, M.; Yang, Z.; Gu, Y. Influence of Humidity on the Elastic Modulus and Axis Compressive Strength of Concrete in a Water Environment. Materials 2020, 13, 5696. [Google Scholar] [CrossRef]
- Zhao, R.; Sanjayan, J.G. Geopolymer and Portland cement concretes in simulated fire. Mag. Concr. Res. 2011, 63, 163–173. [Google Scholar] [CrossRef]
- Amran, M.; Huang, S.-S.; Onaizi, A.M.; Murali, G.; Abdelgader, H.S. Fire spalling behavior of high-strength concrete: A critical review. Constr. Build. Mater. 2022, 341. [Google Scholar] [CrossRef]
Figure 1.
(a) Plan view drawing of the slabs indicating the five positions where thermocouples were embedded; (b) side view sketch of the slabs indicating the four depths in which thermocouples were embedded (identical to all five positions).
Figure 1.
(a) Plan view drawing of the slabs indicating the five positions where thermocouples were embedded; (b) side view sketch of the slabs indicating the four depths in which thermocouples were embedded (identical to all five positions).
Figure 2.
Four point bending test set-up.
Figure 2.
Four point bending test set-up.
Figure 3.
FNS-AAC post-failure shapes of: unfired cubes under compression (a), fired cubes under compression (exposure: 800 °C for 2h) (b), unfired cylinders under compression (c), unfired cylinders under splitting tension (d).
Figure 3.
FNS-AAC post-failure shapes of: unfired cubes under compression (a), fired cubes under compression (exposure: 800 °C for 2h) (b), unfired cylinders under compression (c), unfired cylinders under splitting tension (d).
Figure 4.
Color evolution as a function of temperature of exposure: 20 °C (a); 400 °C (b); 600 °C (c); 800 °C (e); and 1000 °C (d).
Figure 4.
Color evolution as a function of temperature of exposure: 20 °C (a); 400 °C (b); 600 °C (c); 800 °C (e); and 1000 °C (d).
Figure 5.
Compressive strength dependency on, time (a); exposure temperature (b).
Figure 5.
Compressive strength dependency on, time (a); exposure temperature (b).
Figure 6.
Top view of the concrete slabs during the fire exposure campaign (water pooling visible): (a) FNS-AAC slab, (b) OPC slab; (c) FNS-AAC slab and (d) OPC slab (limited spalling).
Figure 6.
Top view of the concrete slabs during the fire exposure campaign (water pooling visible): (a) FNS-AAC slab, (b) OPC slab; (c) FNS-AAC slab and (d) OPC slab (limited spalling).
Figure 7.
(a) Temperature recordings of the heated air inside the furnace and at the interior of the specimens during fire exposure of the OPC slab and the FNS-AAC slab; (b) through-depth profile of the maximum recorded temperatures.
Figure 7.
(a) Temperature recordings of the heated air inside the furnace and at the interior of the specimens during fire exposure of the OPC slab and the FNS-AAC slab; (b) through-depth profile of the maximum recorded temperatures.
Figure 8.
MIP differential curves for optimal GFNS-based concrete mixture, untreated (20 °C) and after heat treatment at different temperatures (400 °C, 600 °C, 800 °C, and 1000 °C).
Figure 8.
MIP differential curves for optimal GFNS-based concrete mixture, untreated (20 °C) and after heat treatment at different temperatures (400 °C, 600 °C, 800 °C, and 1000 °C).
Figure 9.
Backscatter electron (BSE) images of FNS AAC: (a) untreated (20 °C); (b) heat treatment at 400 °C; (c) heat treatment at 600 °C; (d) heat treatment at 800 °C and (e) heat treatment at 1000 °C.
Figure 9.
Backscatter electron (BSE) images of FNS AAC: (a) untreated (20 °C); (b) heat treatment at 400 °C; (c) heat treatment at 600 °C; (d) heat treatment at 800 °C and (e) heat treatment at 1000 °C.
Figure 10.
Flexural crack pattern of slabs at failure: (a) unfired CC; (b), fired CC; (c), unfired FNS AAC; (d), fired FNS AAC.
Figure 10.
Flexural crack pattern of slabs at failure: (a) unfired CC; (b), fired CC; (c), unfired FNS AAC; (d), fired FNS AAC.
Figure 11.
Deformation behavior of OPC and FNS AAC slabs described by their experimental load-displacement curves.
Figure 11.
Deformation behavior of OPC and FNS AAC slabs described by their experimental load-displacement curves.
Table 1.
Ferronickel slag and silica fume chemical analysis through XRF, by weight*.
Table 1.
Ferronickel slag and silica fume chemical analysis through XRF, by weight*.
| Precursor |
SiO2
[%] |
Al2O3
[%] |
CaO
[%] |
Fe2O3 [%] |
MgO
[%] |
Na2O
[%] |
P2O5
[%] |
K2O
[%] |
TiO2
[%] |
MnO
[%] |
LOI-Flux |
| GFNS |
36.9 |
3.61 |
4.18 |
32.8 |
7.41 |
0.15 |
0.02 |
0.48 |
0.19 |
0.00 |
0.00 |
| SF |
88.9 |
0.73 |
0.34 |
1.01 |
0.63 |
0.71 |
0.03 |
1.50 |
0.00 |
0.12 |
6.82 |
Table 2.
Alkali activated concrete ingredient proportions for 1 m3 GFNS concrete.
Table 2.
Alkali activated concrete ingredient proportions for 1 m3 GFNS concrete.
| GFNS (kg) |
SF (kg) |
KOH (kg) |
KS (kg) |
FNS Sand (kg) |
OA, 4 mm–
8 mm (kg) |
OA, 8 mm – 16 mm (kg) |
Water (kg) |
| 627.8 |
45.7 |
18.9 |
45.1 |
719.2 |
388.1 |
711.5 |
169.6 |
Table 3.
Summary of material properties for GFNS and OPC concrete.
Table 3.
Summary of material properties for GFNS and OPC concrete.
| Parameter |
GFNS |
OPC |
Difference
[%] |
| Average |
CV² [%] |
Average |
CV [%] |
| Density [kg/m³] |
2729 |
1.25% |
2339 |
0.39% |
14.3% |
| Humidity content [%] ¹ |
2.38 |
- |
3.03 |
- |
-27.3% |
| Compressive strength (cube) [MPa] |
77.2 |
3.23% |
73.2 |
1.64% |
5.1% |
| Compressive strength (cylinder) [MPa] |
49.6 |
15.8% |
50.5 |
8.33% |
-1.8% |
| Tensile strength [MPa] |
3.14 |
3.50% |
3.81 |
3.95% |
-21.2% |
| Modulus of elasticity [GPa] |
20.6 |
9.24% |
35.0 |
15.2% |
-70.3% |
|
Disclaimer/Publisher’s Note: The statements, opinions and data contained in all publications are solely those of the individual author(s) and contributor(s) and not of MDPI and/or the editor(s). MDPI and/or the editor(s) disclaim responsibility for any injury to people or property resulting from any ideas, methods, instructions or products referred to in the content. |
© 2024 by the authors. Licensee MDPI, Basel, Switzerland. This article is an open access article distributed under the terms and conditions of the Creative Commons Attribution (CC BY) license (http://creativecommons.org/licenses/by/4.0/).

