Preprint
Article

Predicting Treatment Outcomes in Patients with Drug-resistant Tuberculosis and HIV Co-infection Using a Supervised Machine Learning Algorithm

Altmetrics

Downloads

120

Views

49

Comments

0

A peer-reviewed article of this preprint also exists.

Submitted:

20 September 2024

Posted:

23 September 2024

You are already at the latest version

Alerts
Abstract
Drug-resistant tuberculosis (DR-TB) and HIV-coinfection present a conundrum to public health globally, and the achievement of the global END TB strategy in 2035. A descriptive, retrospective review of medical records of patients diagnosed with DR-TB who received treatment was conducted. Student’s t-test was performed to assess differences between two means and ANOVA between groups. Either the Chi-square test with and without trend or Fischer’s exact test was used to test the degree of association of categorical variables. Logistic regression was used to determine predictors of DR-TB treatment outcomes. Also, a decision tree classifier, which is a supervised machine learning algorithm was used. Python version 3.8. and R version 4.1.1 software were used for data analysis. A p-value of 0.05 with a 95% confidence interval (CI) was used to determine statistical significance. A total of 456 DR-TB patients were included in the study with more male patients (n = 256, 56.1%) than female patients (n = 200, 43.9%). The overall treatment success rate was 61.4%. There was a significant decrease in the % of patients cured during the Covid-19 pandemic compared to the pre-pandemic period. Our findings showed that machine learning can be used to predict TB patients' treatment outcomes.
Keywords: 
Subject: Public Health and Healthcare  -   Public Health and Health Services

1. Introduction

The global attempts to control tuberculosis (TB) notwithstanding, TB is positioned as the top contributor to mortality from a single infectious agent and a grave public health dilemma. The WHO reported that an estimated 10.6 million people contracted TB in 2022, with 1.3 million patient fatalities [1,2,3]. Tuberculosis (TB) is an infectious disease caused by Mycobacterium tuberculosis [4,5]. Drug-resistant TB (DR-TB) occurs when these bacteria become resistant to the drugs used to treat TB and can no longer destroy the TB germ [5]. Among cases of DR-TB in 2019, people who were categorized as TB monoresistant, which is resistance displayed to isoniazid, termed INH-R, were over a million in number, while patients who demonstrated resistance to rifampicin, RR, were about half a million with multidrug-resistant TB (MDR-TB) accounting for 78% of this estimate. [2,6,7]. DR-TB is associated with diagnostic and therapy intricacies, longer therapy regimens, morbidity, and fatality, which makes it challenging to deal with. The WHO report in 2022 indicated that only about 40% of patients with DR-TB accessed treatment [3]. MDR-TB happens when resistance to two main antituberculosis medications, isoniazid and rifampicin, is displayed and associated with prolonged hospitalization and increased mortality [1,8,9]. Globally, RR-TB and MDR-TB represent 3.3% and 18% of incident cases and previously treated cases, respectively; hence, the emergence of MDR-TB seriously threatens the END TB strategy of the WHO to reduce TB deaths by 2030 [7].
TB control has recorded good progress in recent times. However, the emergence of MDR-TB in many regions has made the gains almost inconsequential, with a global treatment success rate (TSR) pegged at 59% [10]. This public health crisis is aggravated by co-infections, comorbidities, and an increase in the pool of latent infection [11]. In 2021, global deaths from TB recorded 1.6 million people, out of which 11% were HIV-coinfections. In the USA, 7,882 cases were reported, and an estimated 13 million people live with latent tuberculosis infections [4]. Sub-Saharan Africa harbors the highest burden of coinfection, with 71% of global cases [12]. while in South Africa, approximately 180,000 incident TB cases are people with HIV-coinfection [13]. Despite the scale-up of antiretroviral therapy (ART), TB remains the main cause of HIV-related morbidity and mortality worldwide [3]. The correlation between TB and HIV infection fast-tracks the advancement of disease in people living with HIV(PLHIV) thereby contributing to the failure of TB-control programs to reach successful treatment targets, particularly in high-burden countries. Furthermore, TB and HIV coinfection facilitates the acquisition of MDR and extensively drug-resistant TB (XDR-TB) strains. There is a higher risk (19-fold) of developing active TB in PLHIV, especially with a CD4 count lower than 200/cm3, as compared with people who are HIV-negative [12]. Despite the introduction of new ART and anti-TB drugs, the dual management of TB and HIV coinfection represents an intricate clinical conundrum requiring a logical approach to curtail treatment failure and minimize morbidity and fatality [14]. Safety concerns of co-administration in therapy include drug-drug interactions, resulting in subtherapeutic concentrations of ART and anti-TB drugs resulting in impaired efficacy, development of overlapping toxicities, and immune reconstitution inflammatory syndrome (IRIS) [14].
Several targets [15] to limit the co-epidemics of TB and HIV and the emergence of MDR-TB were set in the 2011-2015 Global Plan to End TB [16]. These targets include 100% of TB patients knowing their HIV status, 100% of HIV/TB coinfected patients should receive antiretroviral therapy and newly enrolled patients in HIV care programs with latent TB infection should receive isoniazid as a form of preventive TB therapy [15]. The target to detect and treat all MDR-TB cases with 2nd-line TB medications was set in 2015, with a 75% treatment success rate. None of these targets have been attained in SSA [17]. The 2030 End TB strategy now seeks to end the global TB epidemic, with targets of a TB mortality reduced by 95% and TB incidence reduced by 90% compared to 2015 [15].
Computerised predictive model is a statistical technique using machine learning (ML) and data mining to predict and forecast possible future outcomes with the help of an existing dataset. Liu et al. [18] defined ML methods as the method of generating predictive models based on patterns of learning features from data to predict new data or outcomes through the constructed model. These methods are subdivided into three types, supervised learning, unsupervised learning, and reinforcement learning [19,20]. Supervised learning uses categorized data as a training dataset in its algorithm, where the outcome of interest is defined [19]. The decision tree algorithm uses supervised learning to predict and classify data [21]. The trees are diagram-like resembling flowcharts, with a root node for data inquiry [22]. ML has been found useful in the medical field for clinicians in practice and occasionally performs better than human expertise [23]. In the clinical space, ML has also been used to analyze biological datasets for cancer and HIV/AIDS research including drug discoveries [24]. ML systems have been developed in several fields of medicine, including radiology, for interpreting chest X-ray scans or magnetic resonance imaging for diagnostic purposes [25,26]. A first-of-its-kind independent approval was issued by the FDA in 2018 to IDx, an ML system, to detect diabetic retinopathy [27]. In infectious diseases, research, drug development, or clinical microbiology remains the focus of most ML systems. These include HIV genotyping and susceptibility prediction to antiretroviral (ARV) drugs [28]; the analysis of bacterial genomes and improvement of resistance prediction [29,30]; discovery of vaccines and antibacterial drugs [31,32]; and epidemic patterns for surveillance purposes [33,34]. Évora et al. [35] used ML methods for the identification of MDR-TB patients in the Brazilian city, Rio de Janeiro. Most common predictive models include decision trees, regressions (linear and logistic), and neural networks. Machine learning techniques such as artificial neural networks, random forests, and support vector machines have employed clinical and genotypic data to provide useful predictions about patient outcomes [23,36]. Such methods have proven viable in selecting new regimens [23,37]. Moreover, including clinical data in training a prediction model enhances its accuracy [23]. However, limited research is available on the efficacy of machine learning techniques for predicting treatment outcomes in our setting.
Given these interrelated disease conditions, analyzing treatment efficacy for patients burdened with DR-TB and HIV requires an integrated approach. It involves evaluating how each condition affects the others and determining the most effective strategies for integrated care. This study aims to analyze treatment efficacy (treatment outcomes and treatment success rate) in patients burdened with DR-TB/HIV coinfection and factors associated with successful treatment outcomes among patients in the OR Tambo and to use a machine-learning algorithm to predict and determine the risk factors associated with DR-TB disease.

2. Methods

2.1. Study Design, Setting, and Population

A descriptive, retrospective review of medical records of DR-TB enrolled in healthcare facilities in OR Tambo between January 2018 and December 2020. The Eastern Cape (ECP) is a predominantly rural province and the third biggest province out of nine provinces in South Africa with a population of approximately 7 million [38]. O. R. Tambo district is one of the 7 districts of the ECP located on the coastline, with a population of approximately 1.4 million. It is made up of five (5) local municipalities with the seat of administration in Mthatha. The predominant language spoken is isiXhosa. The study participants were drawn from selected five healthcare facilities (HCF) in OR Tambo district municipality in the Eastern Cape province of South Africa. These healthcare facilities were coded as HCF 1-5.

2.2. Data Collection

Data from the medical records of DR-TB patients who began treatment between 2018 and 2021 were recorded. The data collected included socio-demographics, clinical data, and treatment outcomes. Anti-TB drug sensitivity test results were categorized into different classes of drug resistance.

2.3. Statistical Analysis

Data on the study participants was described using absolute frequencies and percentages for categorical variables; measures of central tendency (mean, median, range) and dispersion (standard deviation and interquartile range) were used for continuous variables. Student’s t-test was performed to assess differences between two means and ANOVA between groups. Either the Chi-square test with and without trend or Fischer’s exact test was used to test the degree of association of categorical variables. ANOVA assumes that the data follows a normal distribution and has homogeneity of variance. If the initial tests (Chi-Square or ANOVA) show significant results, post-hoc pairwise comparison tests were used to identify which specific groups are significantly different from each other. Logistic regression was used to determine predictors of DR-TB treatment outcomes. Also, a decision tree classifier, which is a supervised machine learning algorithm was used. Decision trees were used to split data based on the value of input features (e.g., age, income, comorbidities) to make predictions (e.g., whether treatment will be successful or unsuccessful). The decision tree splits the dataset based on threshold values for the features at each node. Gini impurity, which is a measure of how “pure” a node is, or how mixed the classes (successful vs. unsuccessful) are at that node was determined. For each split, the algorithm tries to minimize the Gini impurity, meaning it looks for the feature and threshold that create the most homogeneous nodes (e.g., where most patients either succeed or fail). Splits were made based on variables selected to maximize the difference between the two classes (successful vs. unsuccessful treatment) after the split. The algorithm recursively partitions the dataset, starting at the root (top) node and continuing until a stopping criterion is met (e.g., maximum tree depth or minimum node size). At each step, the decision tree algorithm selects the feature and value that produces the largest information gain, meaning it reduces uncertainty (measured by Gini impurity) the most. In decision trees, pruning techniques were applied to avoid overfitting by removing branches that add little predictive power or that fit too closely to the training data. This improves the model’s ability to generalize to new, unseen data. Python version 3.8. and R version 4.1.1 software were used. A p < 0.05 was considered to be significant.

3. Results

3.1. Socio-Demographic and Clinical Characteristics of Study Participants

A total of 456 participants with records of DR-TB patients were assessed. The study had more male patients (n = 256, 56.1%) than female patients (n = 200, 43.9%). The study participants’ age distribution ranged from 1–86 years, with a mean age of 37.5 (SD ± 14.9) years. The median age (50th percentile) and 75th percentile was 36 and 47 years, respectively. The proportion of patients aged 19–35 was 41.6%, followed by those aged 36–50 with 31.9%. HIV/TB coinfection was observed in 281 (61.6%) patients. Those above the age of 66 comprised 4.7%, whereas 51–65 constituted 14.6%. Table 1 presents the sociodemographic and clinical characteristics of the patients.
Table 2 shows the type of DR-TB patients from 2018 to 2020 categorised by age. Most of the DR-TB cases were categorised as RR-TB with 45.0% prevalence, while the proportion of MDR-TB was 42.5%. pre-XDR and XDR-TB only accounted for 8.7%. The 19-35 age group had the highest concentration of RR-TB cases at 41.5%, followed by the age group 36-50 with 32.7% prevalence. A similar pattern was observed with the MDR-TB cases, with the 19-35 age group accounting for 43.3% followed by the age group 36-50 with 32% prevalence.
Figure 1 is a graphical illustration of the categorisation of DR-TB by HIV status. The results of the Chi-square tests for each DR-TB type reveal that for each DR-TB type, the differences in distribution between HIV-positive and HIV-negative patients are not statistically significant. This suggests that while there are more cases of certain DR-TB types in HIV-positive patients, the differences observed in the dataset may be due to random variation rather than a systematic association between HIV status and DR-TB type.

3.2. Treatment Outcomes of DR-TB

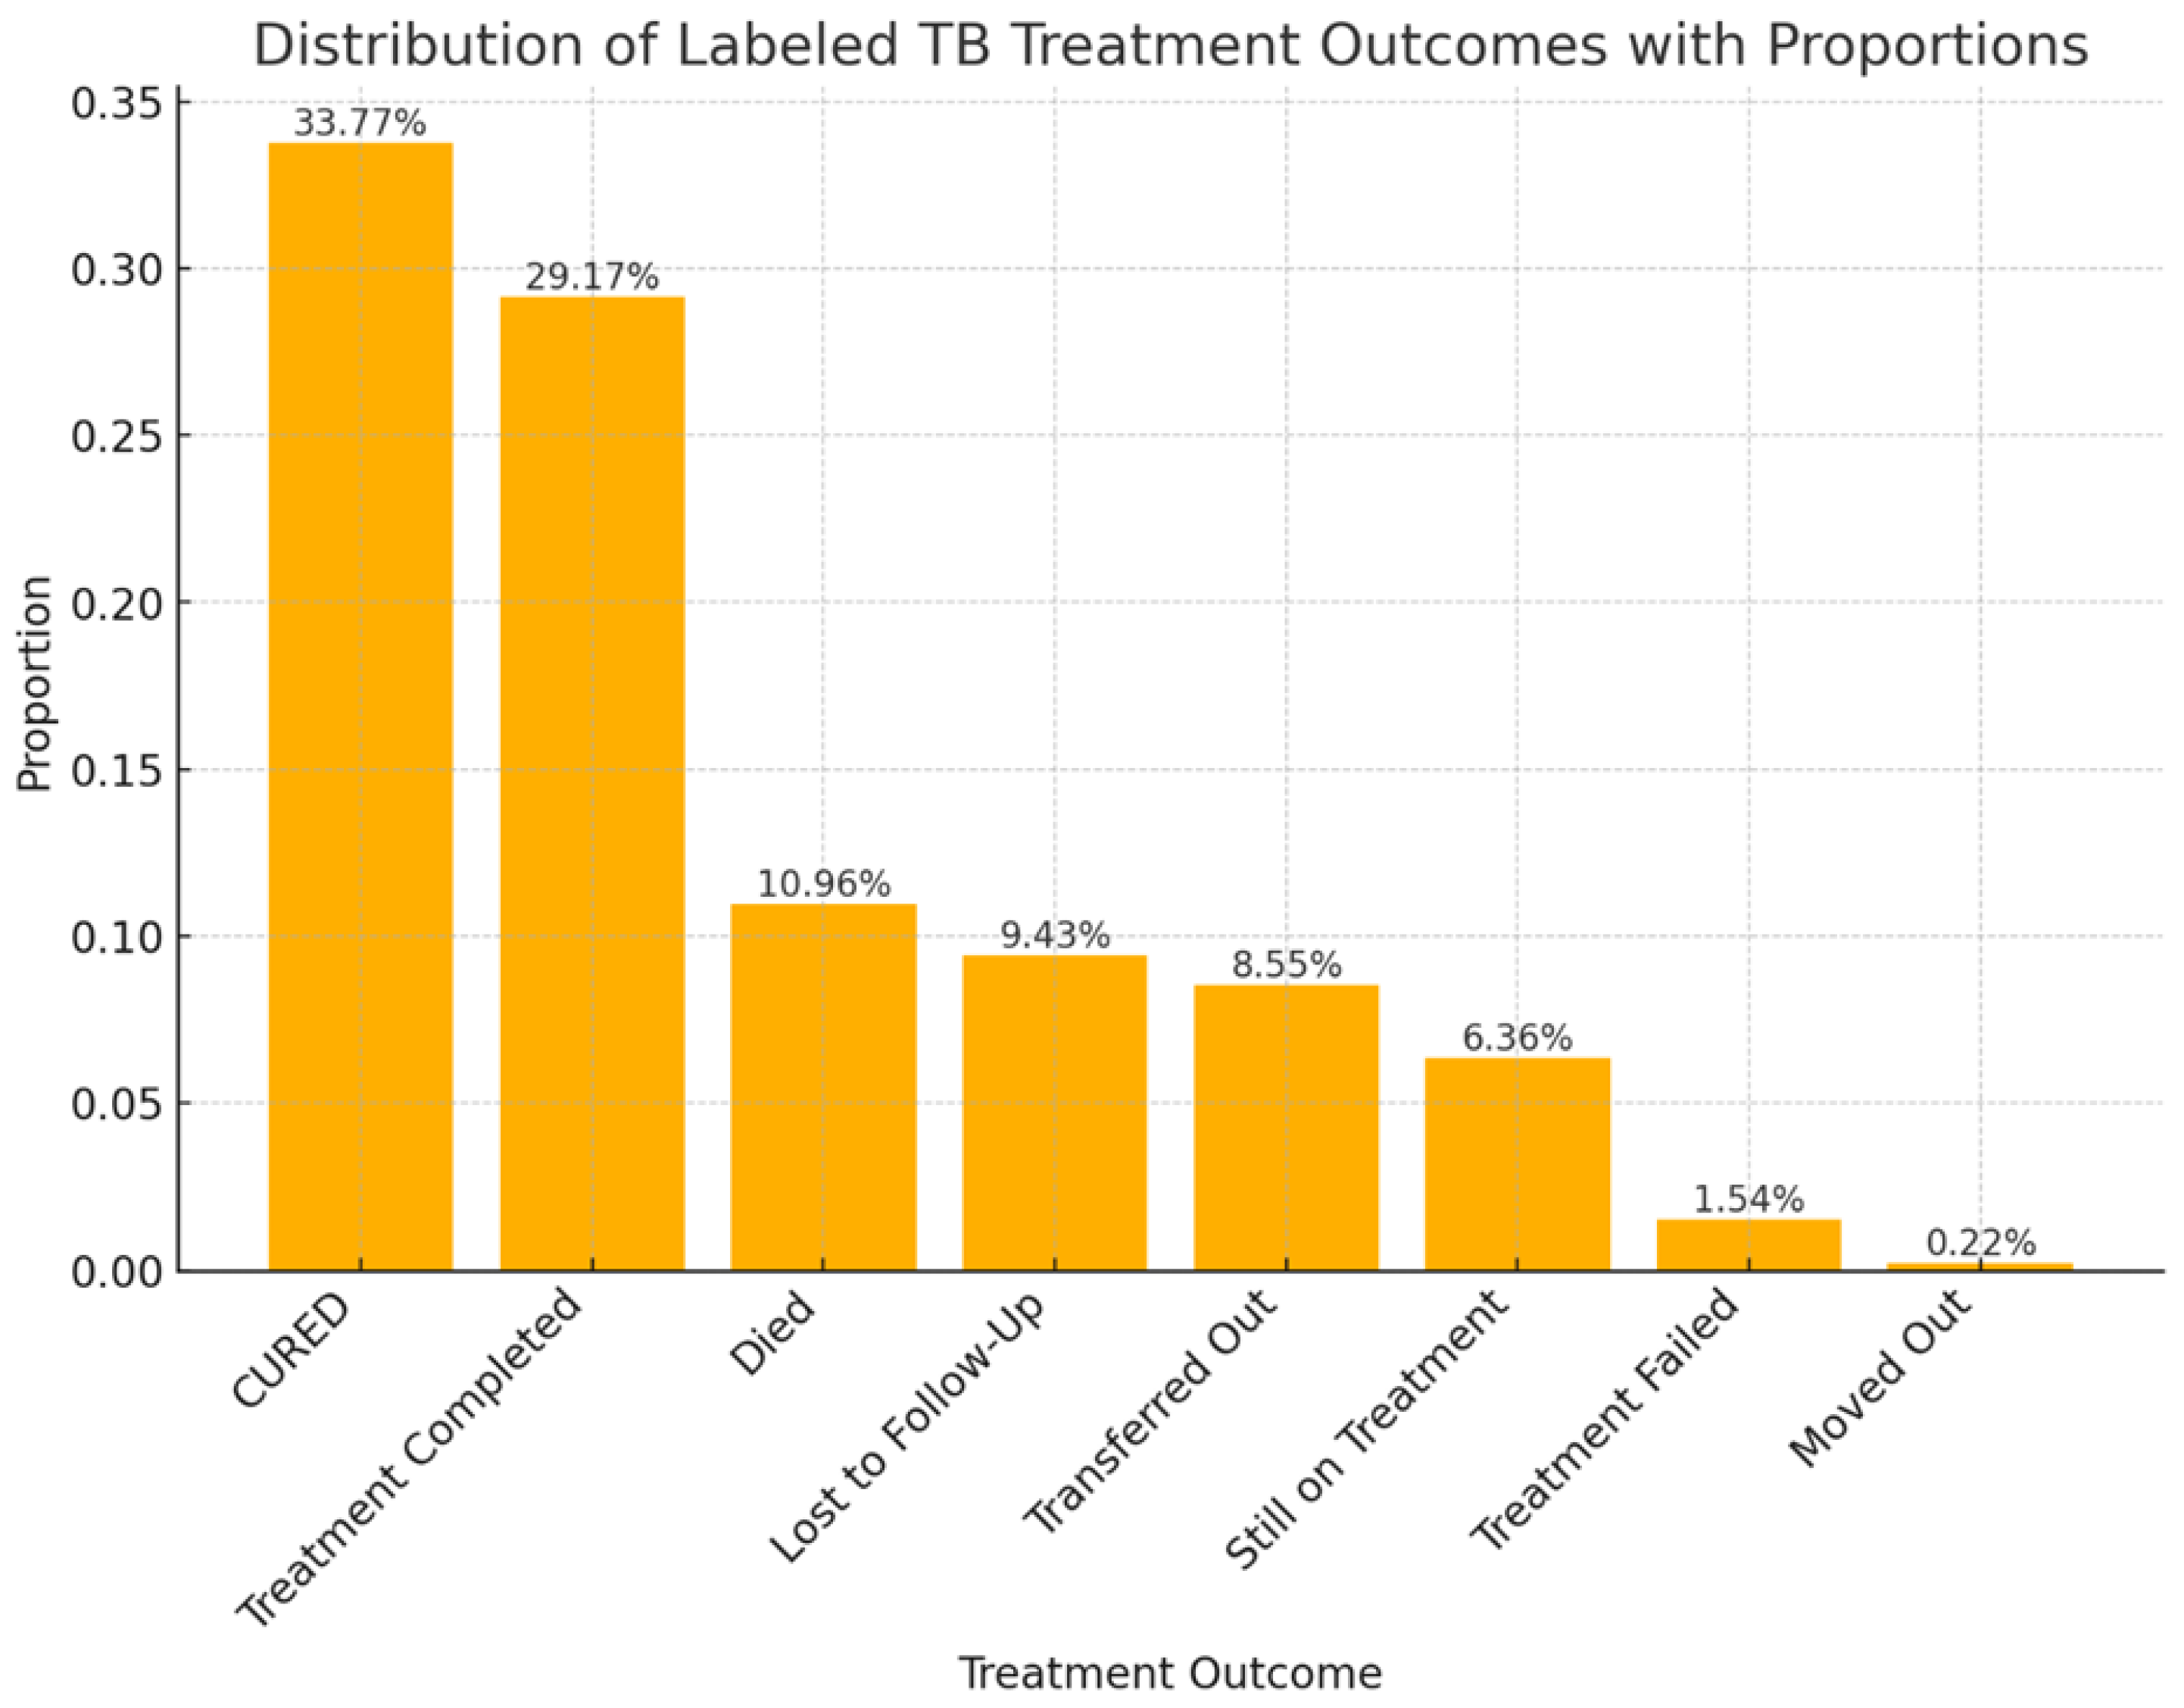
The final DR-TB treatment outcome results recorded for the patients cured (n = 153, 33.77%), treatment completed (n = 126, 29.17%), and those identified as lost to follow-up (n = 43, 9.43%); those who died (n = 50, 11%), those who moved out (n = 1, 0.2%), transferred out (n = 37, 8.55%) and those who experienced treatment failure (n = 7, 1.54%) and those who were still on treatment (n=29, 6.36%) (Figure 2).

3.3. Treatment Outcomes of DR-TB Comparing COVID-19 Pre-Pandemic (2018-2019) and Pandemic (2020-2021) Periods

There was a significant decrease in patients cured during the Covid-19 pandemic (42 cases) compared to the pre-pandemic period (111 cases). Similarly, the number of completed treatments dropped from 95 cases pre-pandemic to 31 during the pandemic. The number of patients lost to follow-up (LTFU) also decreased significantly during the pandemic, possibly due to fewer patients starting treatment or challenges in tracking patients. The number of deaths remained relatively stable, slightly decreasing during the pandemic.
Figure 3 below presents a graphical illustration comparing treatment outcomes between the pre-pandemic and pandemic periods. It highlighted the significant differences in the number of cases for each outcome, with the pandemic period showing a notable decrease in cured cases and completed treatments.

3.4. The Trend of Treatment Outcomes over Time

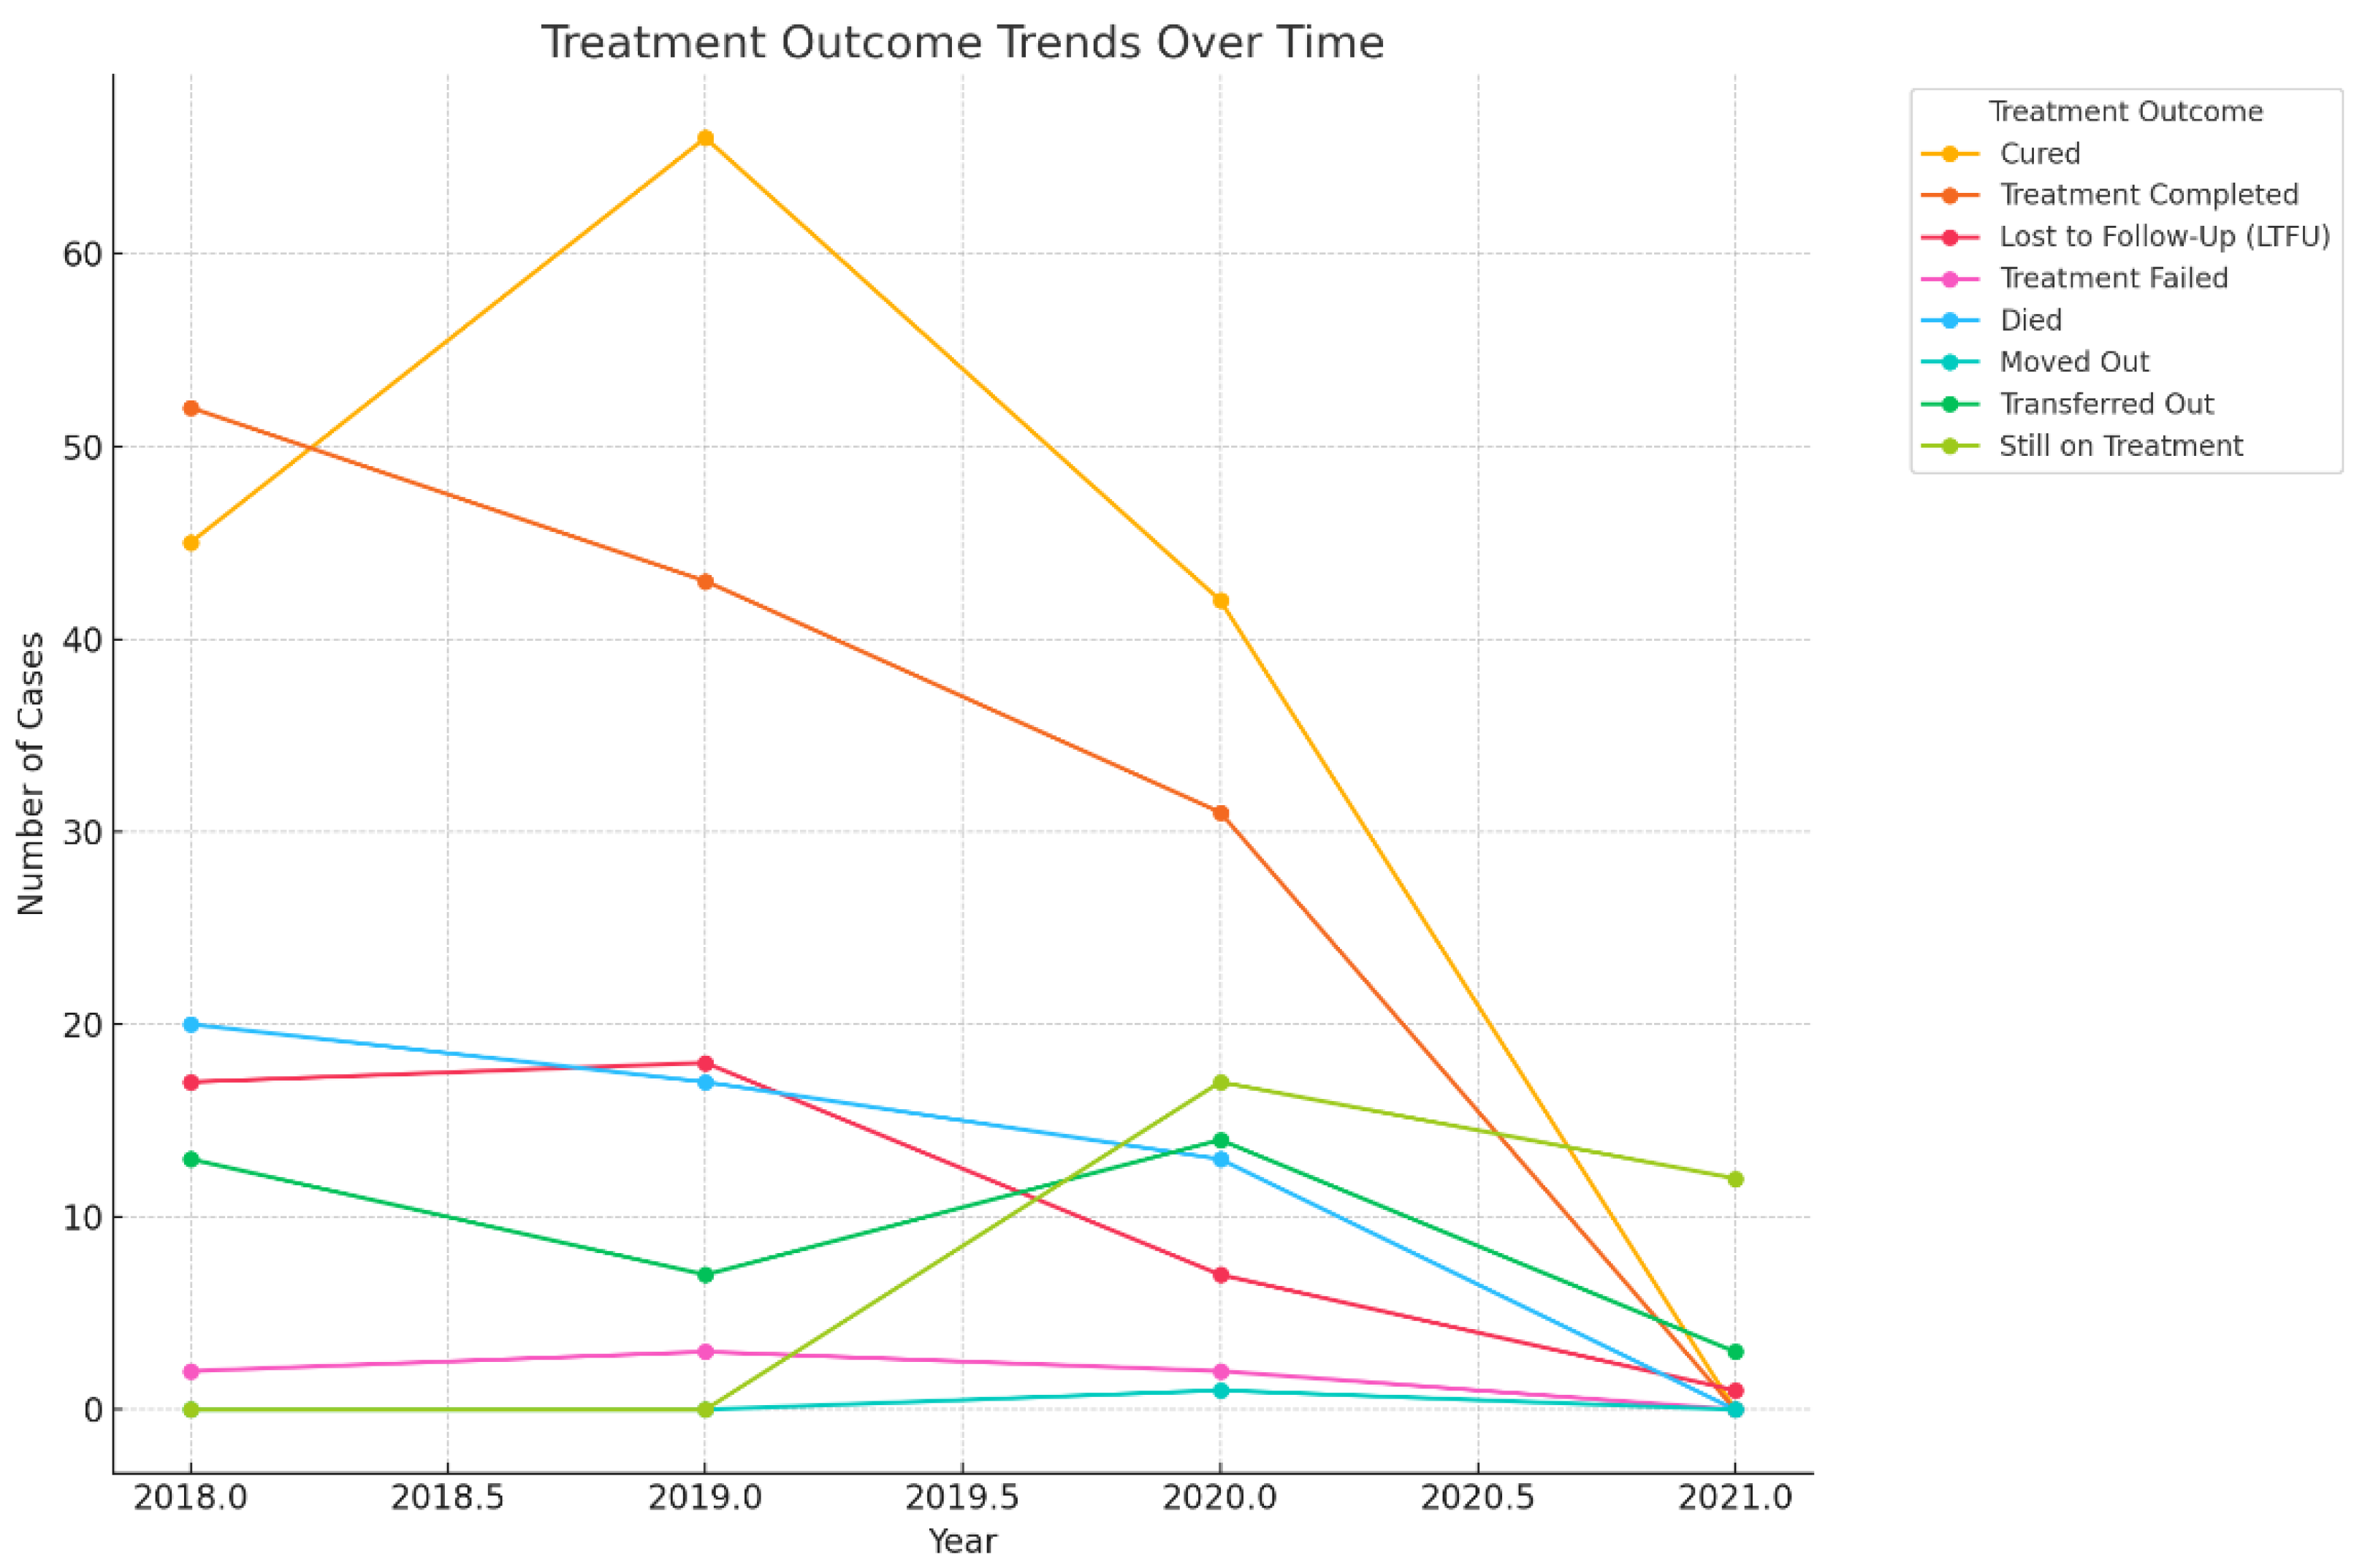
Cured and Treatment Completed: The highest number of cases where treatment was completed, or patients were cured occurred in 2019. However, there was a noticeable drop in 2020 and almost no cases in 2021, which correlates with the overall decrease in treatment starts.
Lost to Follow-Up (LTFU): The number of patients lost to follow-up remained relatively stable in 2018 and 2019, with a slight drop in 2020 and no cases in 2021.
Died: The number of deaths remained consistent across the years, peaking in 2020. This could suggest worsening cases or other external factors impacting patient outcomes.
Transferred Out: There was a decrease in patients transferred out in 2019, followed by a slight increase in 2020 and 2021.
Still on Treatment: Patients still on treatment increased significantly in 2020 and 2021, indicating that treatments might have been prolonged, or delays were experienced in completing treatments. (Figure 4).

3.4. Association between DR-TB and Treatment Outcomes

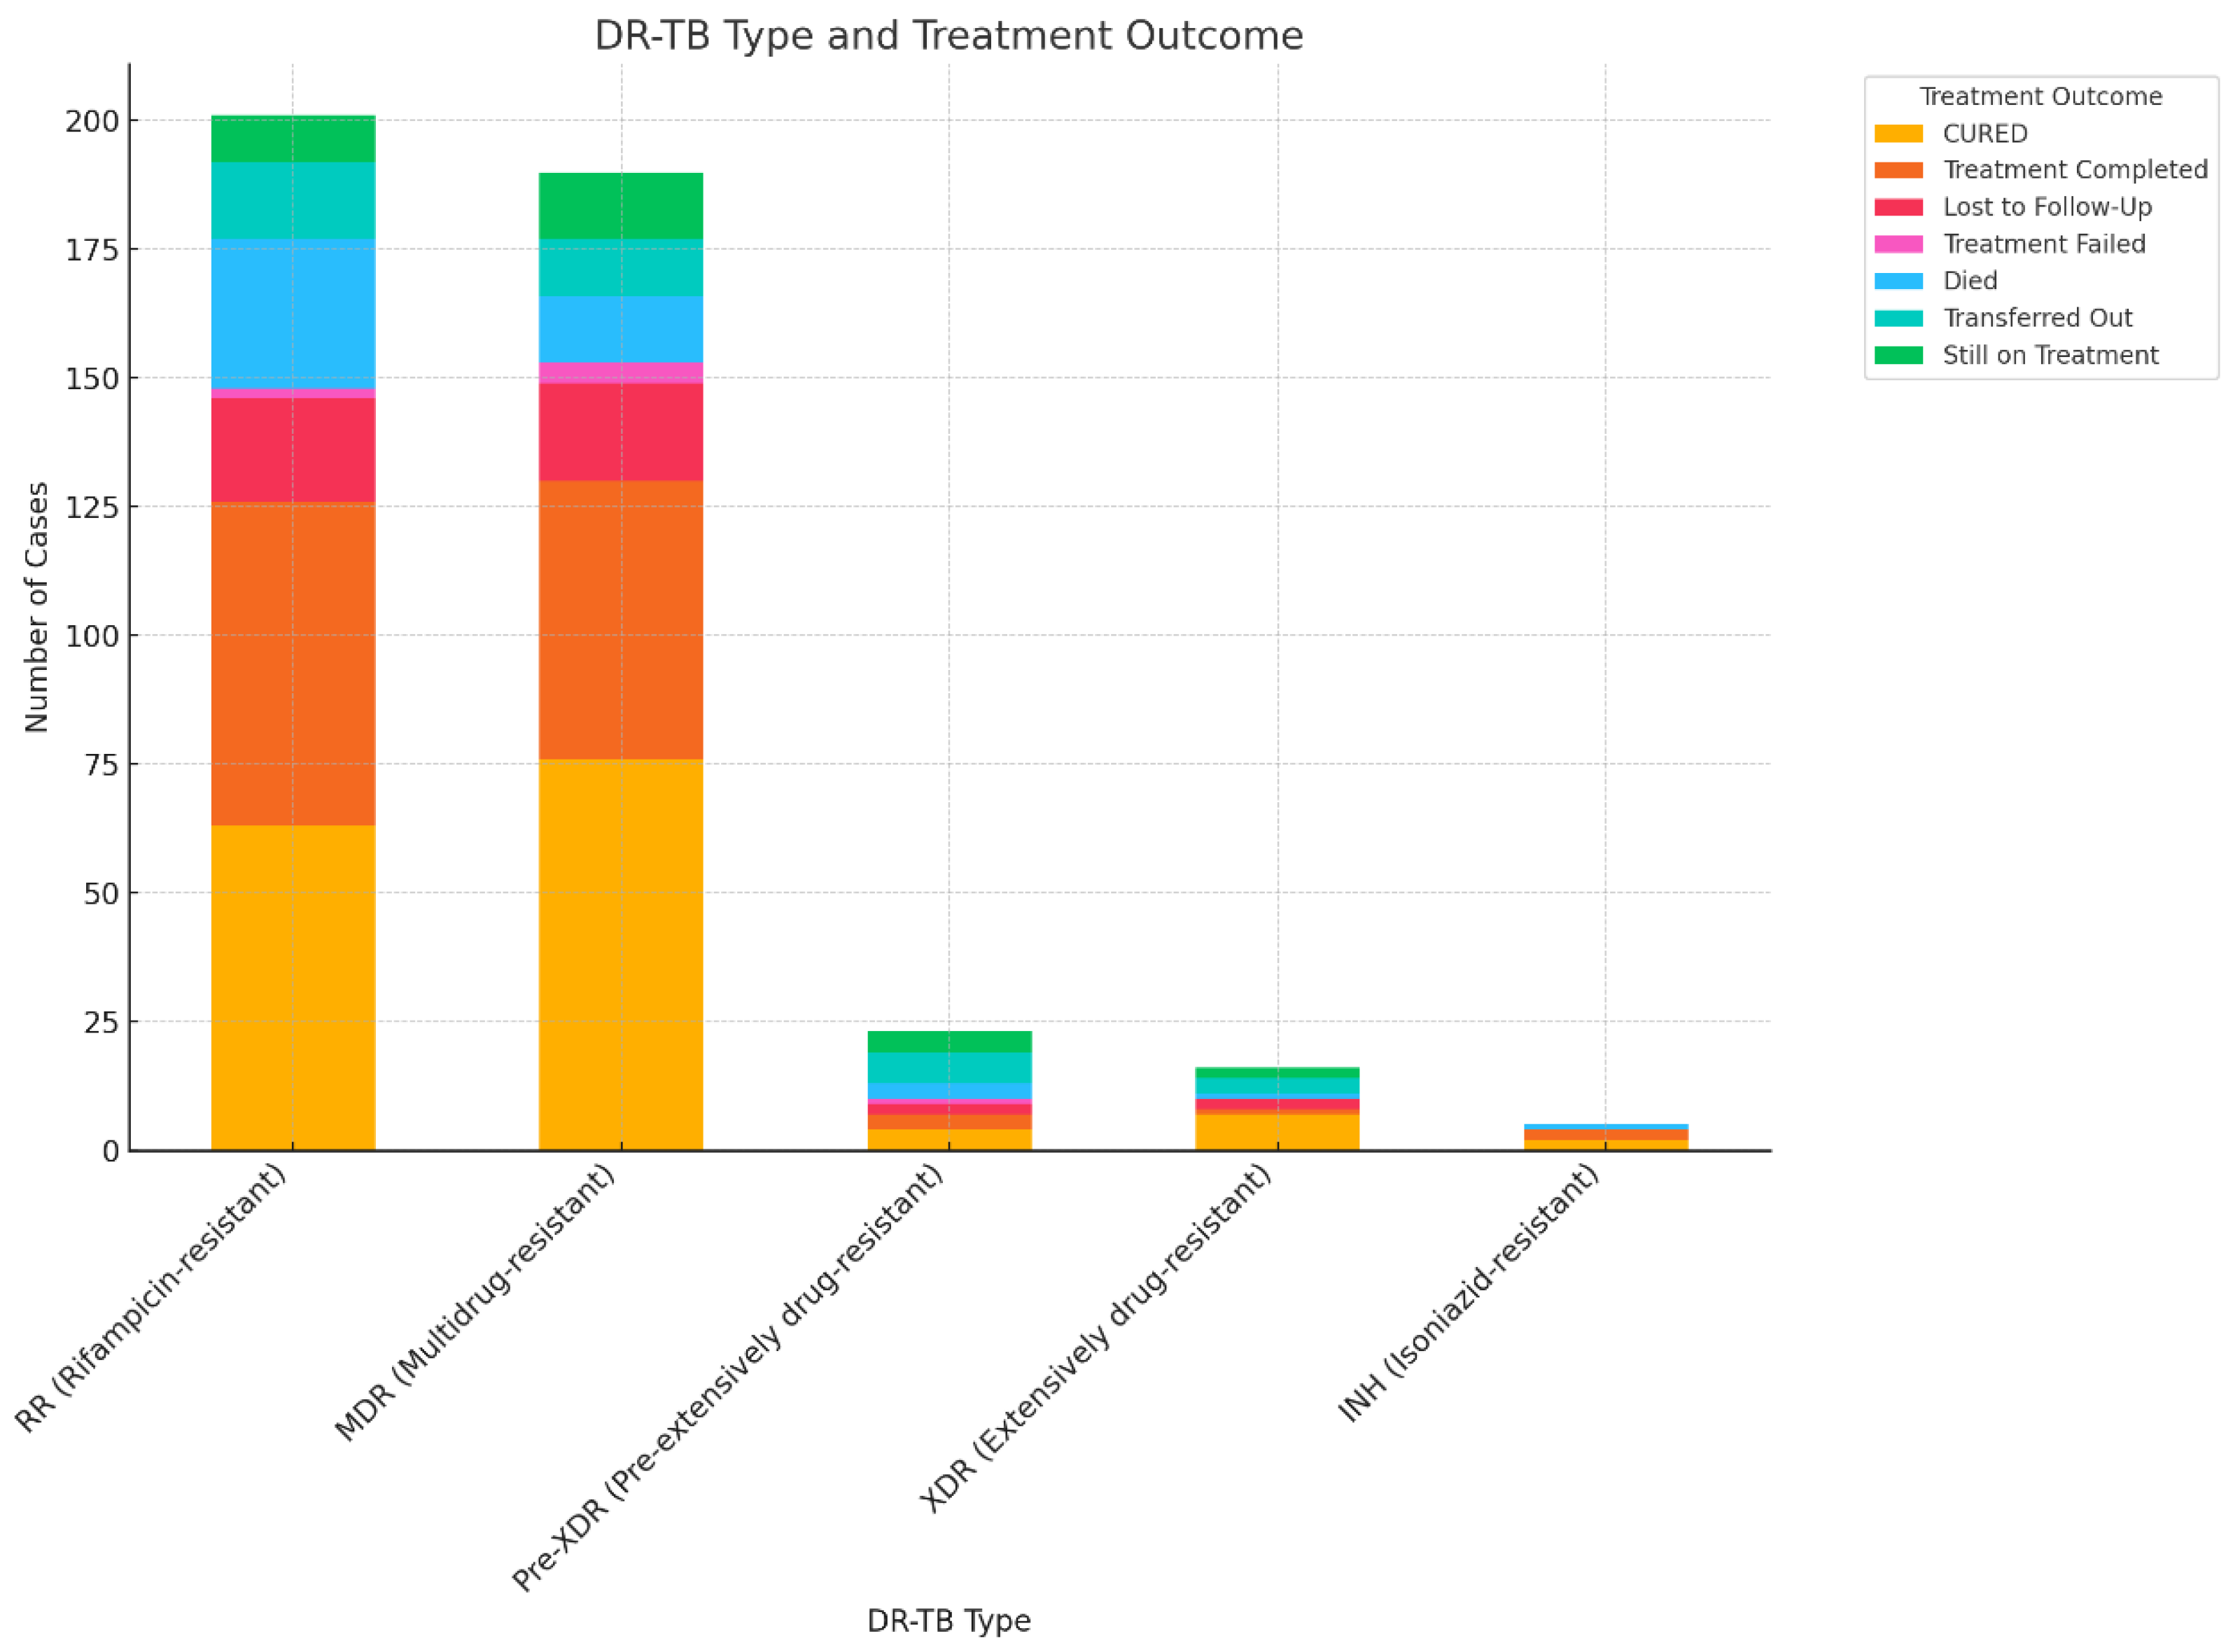
The association between DR-TB type and treatment outcomes is statistically significant (p-value = 0.028). (Figure 5). The results indicate a significant association between the type of DR-TB and the treatment outcome. Different types of drug resistance in TB are associated with different treatment outcomes, and these variations are statistically significant.
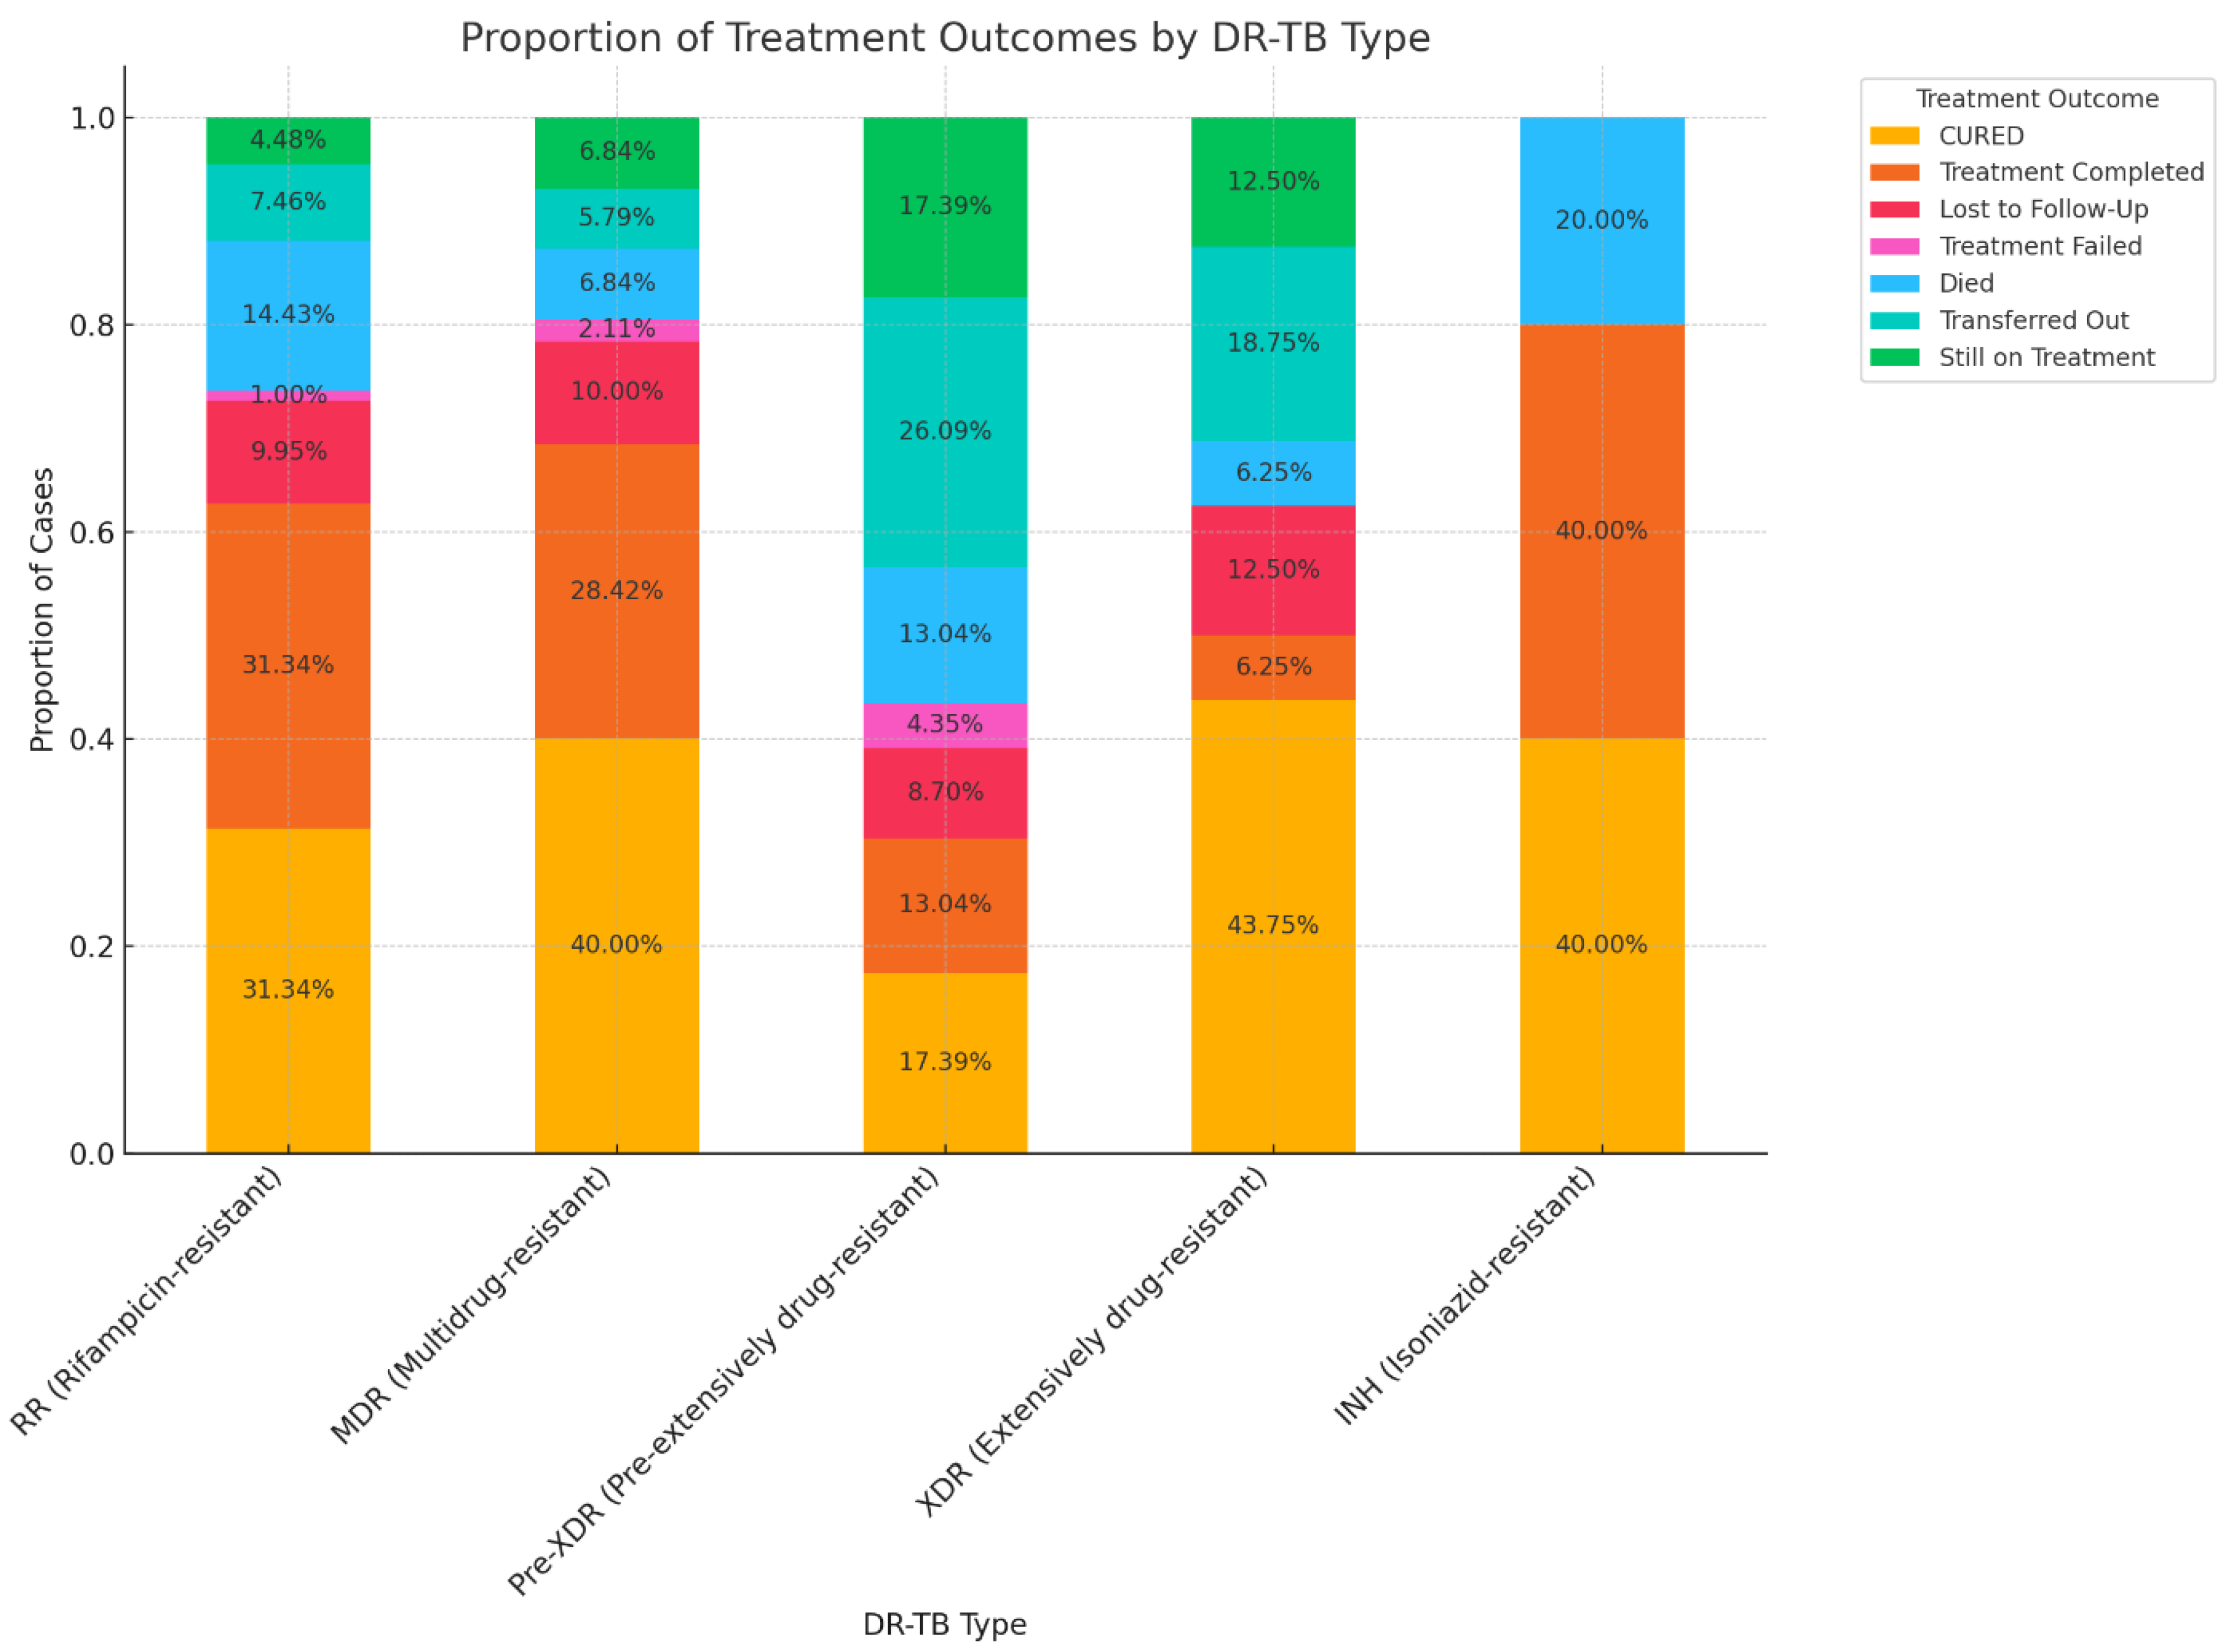
The proportion of cases for each treatment outcome within each DR-TB type is displayed in Figure 6. The percentages within each bar segment represent the relative frequency of each outcome, providing a clear comparison of how treatment outcomes differ by DR-TB type.
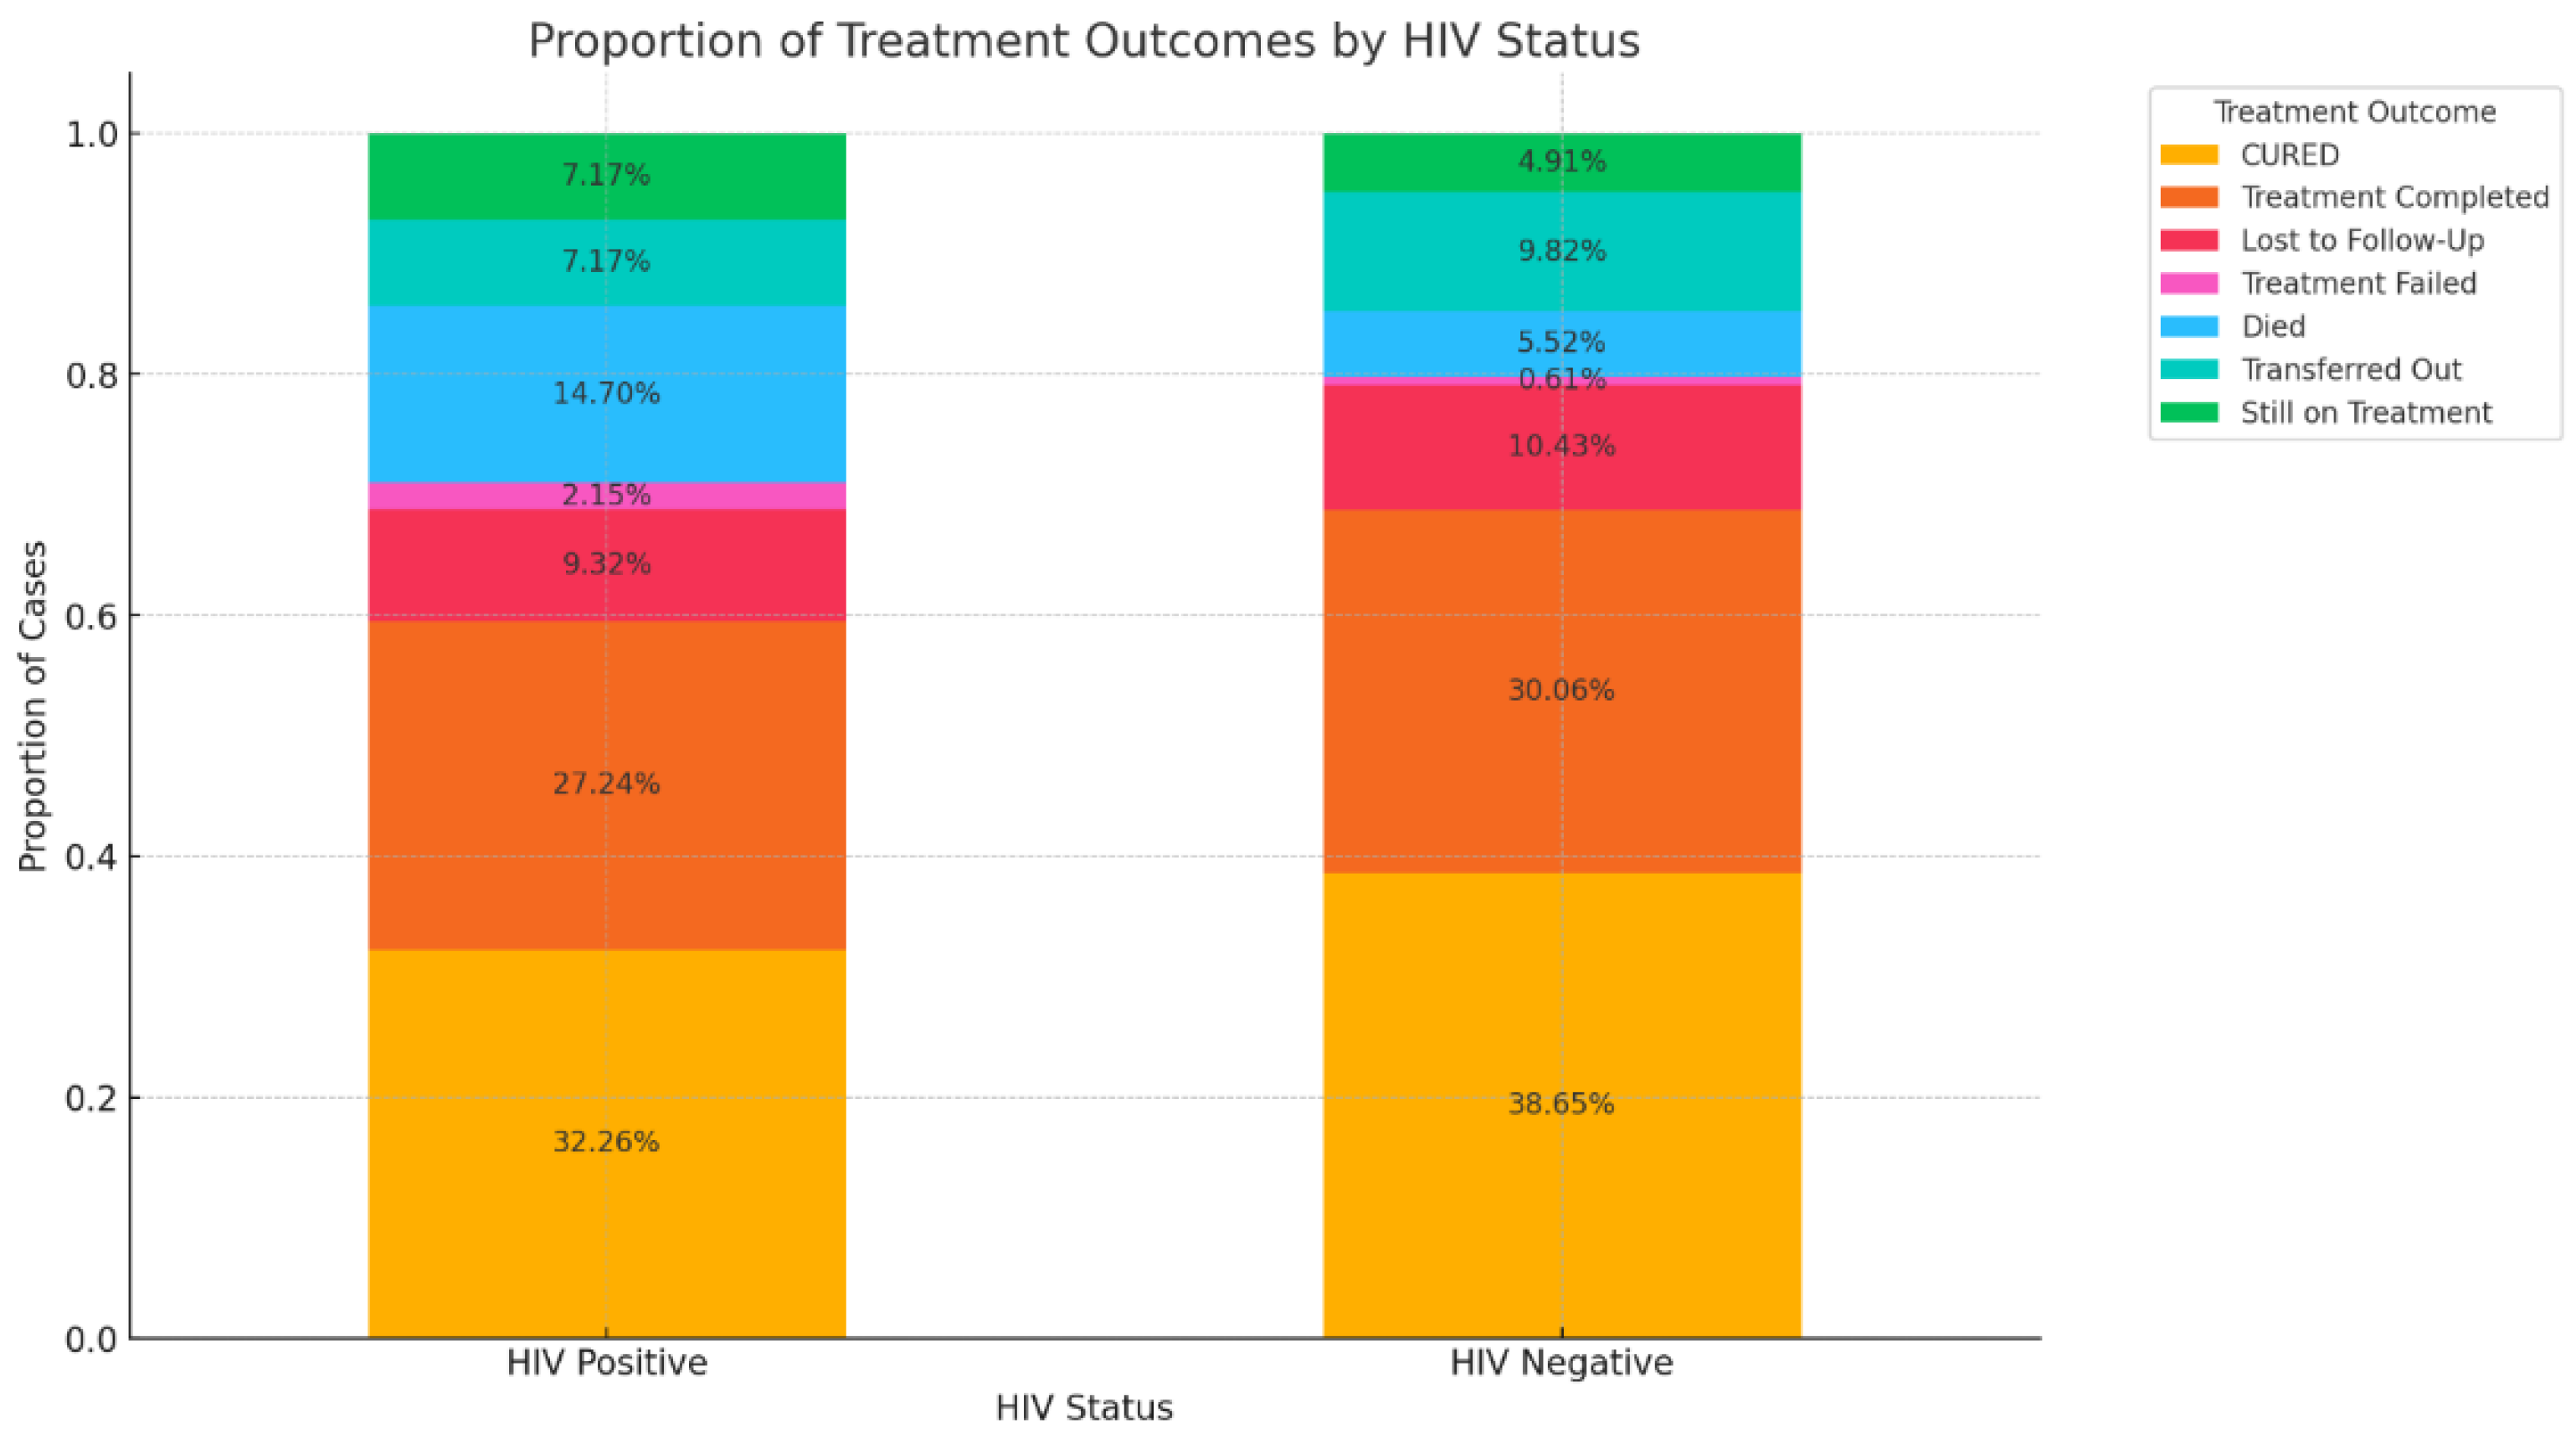
Figure 7 shows the proportion of treatment outcomes by HIV status. The association using the chi-square test indicates a p-value of 0.051. The p-value is slightly above the common significance threshold of 0.05 suggesting that the association between HIV status and treatment outcome is marginally not statistically significant, though very close to the threshold. In other words, there may be some association, but the evidence is not strong enough to confidently reject the null hypothesis. While there appears to be some relationship between HIV status and treatment outcomes, the evidence is not strong enough to conclude a statistically significant association at the 0.05 level. However, given that the p-value is close to 0.05, this result could still be considered noteworthy, and further investigation with a larger sample size might be warranted.
From the above Figure 7, a higher mortality was recorded with HIV-positive patients. The higher proportion of deaths among HIV-positive patients highlights the increased vulnerability of this group during TB treatment. The higher rate of “Lost to Follow-Up” among HIV-positive patients suggests potential difficulties in maintaining treatment adherence or access.
Overall Treatment Success: Although the proportions of “Cured” and “Treatment Completed” are substantial in both groups, HIV-negative patients generally fared slightly better, with higher success rates and lower mortality.

3.5. Impact of HIV Coinfection on Treatment Outcomes

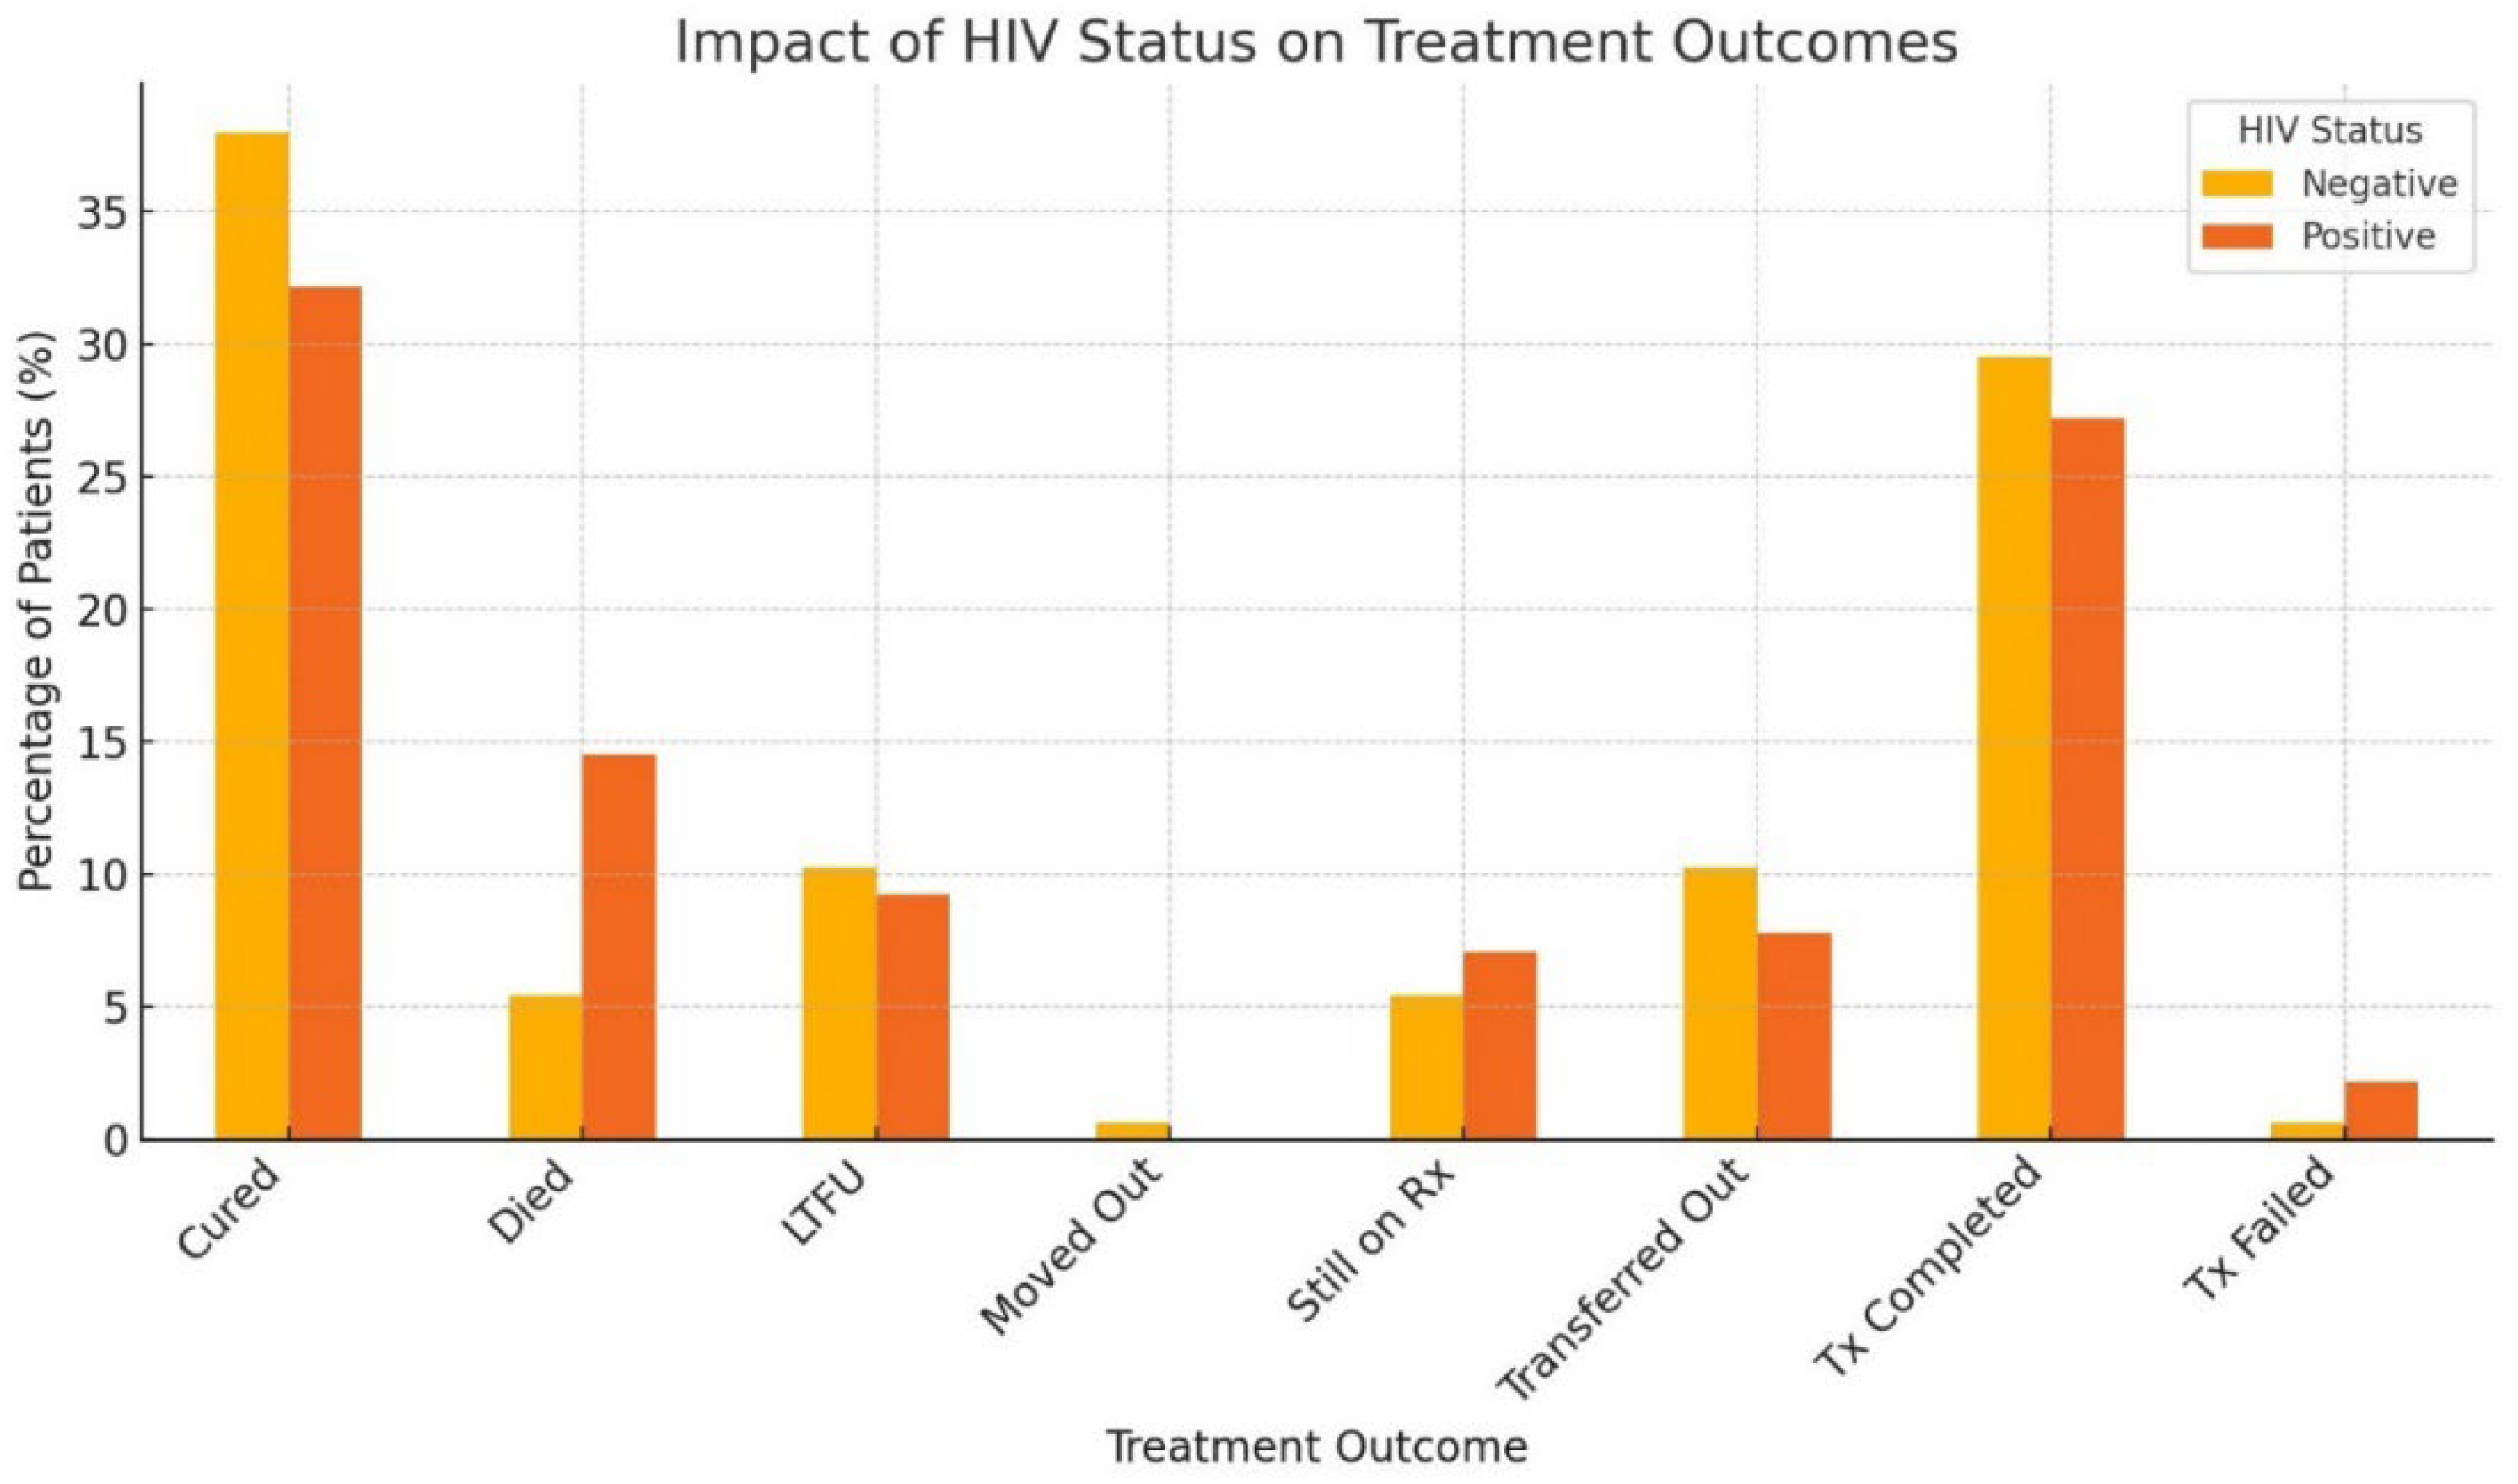
A higher percentage of HIV-negative patients (37.95%) were cured compared to HIV-positive patients (32.16%). The death rate is significantly higher among HIV-positive patients (14.49%) compared to HIV-negative patients (5.42%); with the treatment completed category, the percentage of patients who completed treatment is slightly higher among HIV-negative patients (29.52%) than among HIV-positive patients (27.21%). (Figure 8). This analysis suggests that HIV-positive patients are more likely to experience adverse outcomes, such as death, compared to HIV-negative patients.

3.6. Factors Influencing Treatment Outcomes

Using the regression analysis, multiple factors simultaneously influence treatment outcomes including HIV Status, gender, and education. The coefficient for HIV status is 0.41810, indicating that being HIV-positive is associated with a slight increase in the treatment outcome score, which suggests worse outcomes (since higher scores correspond to worse outcomes like Died or Treatment Failed). The p-value for HIV status is 0.0600, which is close to the 0.05 threshold, indicating a marginally significant impact on treatment outcomes. The coefficient for age is negative but very close to zero (−0.0071), suggesting that age has a negligible impact on treatment outcomes in this model. The p-value is 0.3420, indicating that age is not a significant predictor of treatment outcomes in this dataset. With gender, the coefficient for being male is 0.36410, suggesting that male patients might have slightly worse outcomes than female patients, but this is not statistically significant (p=0.092). The p-values for primary and tertiary education are 0.0340 and 0.0050, respectively, showing significant predictors of treatment outcomes. This analysis shows that HIV status, gender, and education level, particularly tertiary education, influence treatment outcomes, with education being a more significant factor.

3.7. Predictors of DR-TB Successful Treatment Outcome Using a Decision Tree Classifier (Supervised Machine Learning Algorithm)

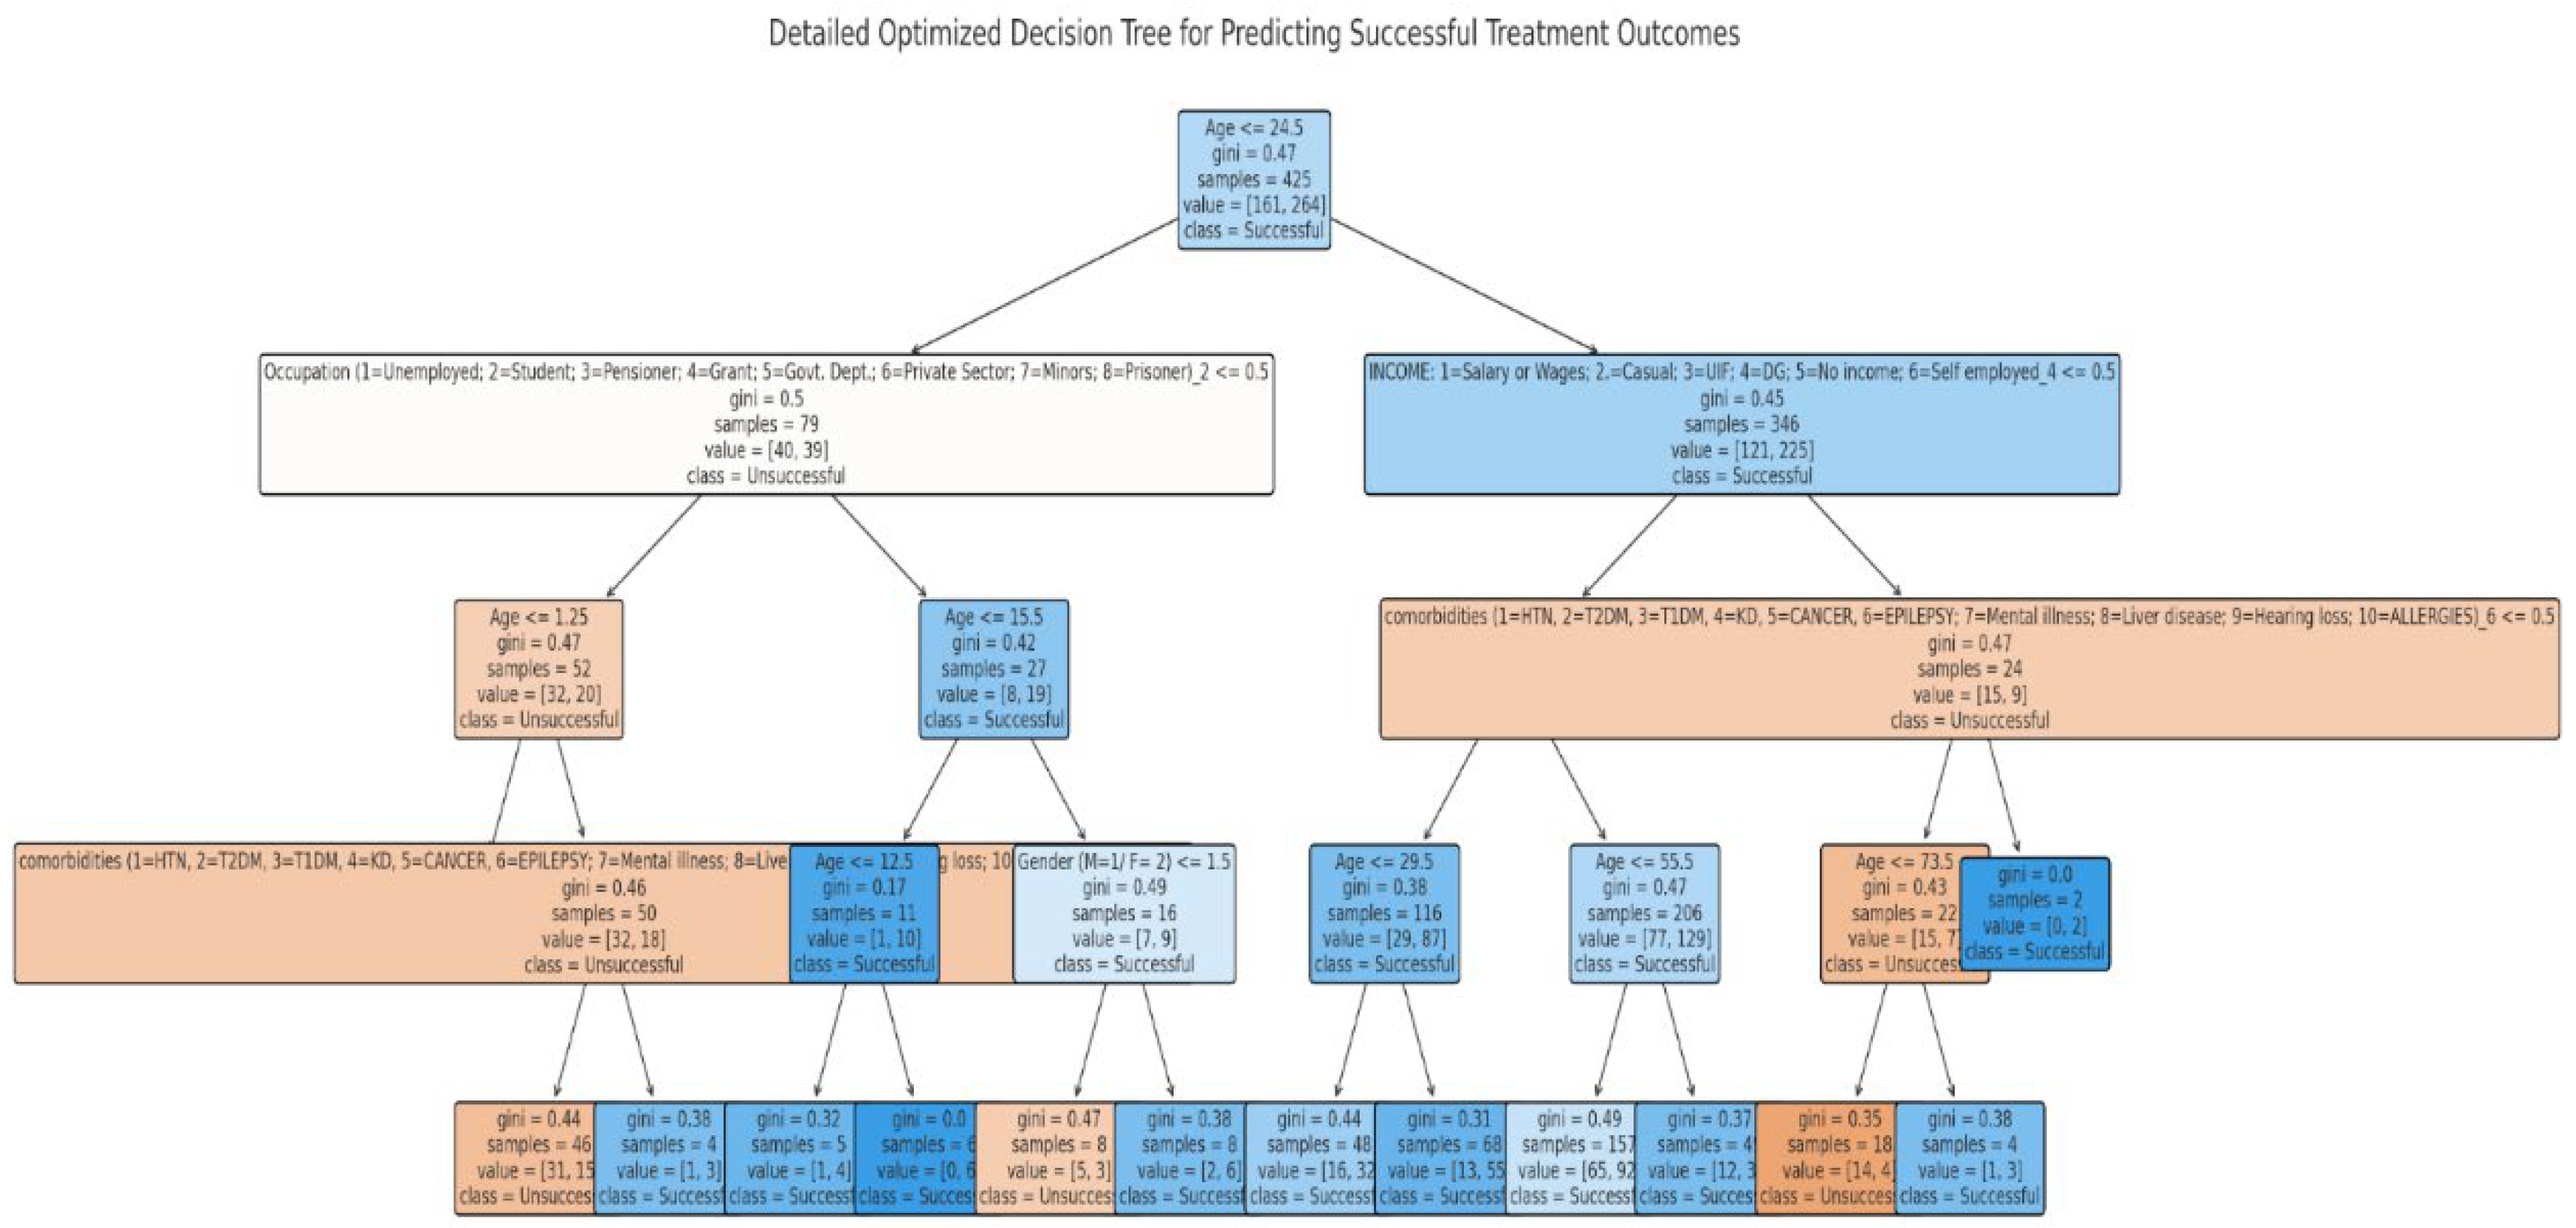
The decision tree model that predicts successful treatment outcomes based on the factors analyzed is shown below (Figure 9). The tree shows how factors such as age, income, gender, and comorbidities influence the likelihood of a successful outcome. Each node in the tree represents a decision point based on one of these factors, and the branches show how the data is split based on the values of these factors. The leaf nodes at the bottom represent the final prediction, with the color indicating the likelihood of success or failure.
The model achieved an accuracy of approximately 69%, meaning that it correctly predicted the treatment outcome for about 69% of the cases. The model performs well in predicting successful outcomes but is less effective at predicting unsuccessful ones, as indicated by the lower recall for the unsuccessful class. The model performs well when predicting successful treatment outcomes, as shown by the high recall (92%) and a balanced F1-score (78%). The model performs poorly in predicting unsuccessful outcomes, as indicated by the low recall (31%) and low F1-score (43%). This means that the model misses many actual unsuccessful outcomes. This discrepancy in performance could be due to class imbalance—if the dataset has many more successful cases than unsuccessful ones, the model will naturally perform better on the more frequent class (successful outcomes). It may also suggest that the features used in the model (e.g., age, income, comorbidities) are more predictive of success but less predictive of failure.
Age is the primary factor determining successful treatment, with younger patients (≤ 24.5) being more scrutinized based on their occupation and comorbidities. Income plays a significant role in older patients (> 24.5), where those with income generally have better outcomes. Comorbidities are a consistent factor influencing outcomes across different age and income groups. Gender and Specific Comorbidities further refine the predictions, highlighting more granular relationships between these factors and treatment outcomes.
The top predictors of treatment failure according to the decision tree include young age, certain occupations (such as students or prisoners), presence of comorbidities, low income, and age extremes. These factors are strongly associated with a higher likelihood of unsuccessful treatment outcomes, suggesting that patients with these characteristics might require additional support and targeted interventions to improve their chances of success.
In conclusion, the decision tree model performs very well in predicting successful DR-TB treatment outcomes but struggles with unsuccessful outcomes due to low recall and low F1-score. Improvements can be made through techniques like balancing the dataset or adjusting class weights to improve the model’s performance for the unsuccessful class.

4. Discussion

Studies have indicated poor outcomes and terrifying high mortality rates among PLHIV co-infected with DR-TB. HIV is also responsible for all forms of MDR and XDR-TB epidemics or outbreaks. TB in PLHIV is mostly smear-negative, and late diagnosis caused by scarcity of rapid diagnostic tests and appropriate treatment has resulted in high mortality in PLHIV. These twin epidemics of DR-TB and HIV have made Sub-Saharan Africa (SSA) and Eastern European regions hotbed of fatal human syndemics [12,17,39,40] apart from different levels of exposure in various regions of the world over the last decade, resulting in poor treatment outcomes and high fatality. The difference between the epidemic of HIV infection in the European region and SSA is that while it is concentrated within high-risk groups in the European region, the general population of the SSA has borne the brunt [12].
This study showed a predominance of both RR-TB and MDR-TB in patients who are unemployed and within the economically active age with a 45.0% prevalence, while the proportion of MDR-TB was 42.5%. The 19-35 age group had the highest concentration of RR-TB cases at 41.5%, followed by the age group 36-50 with 32.7% prevalence. The age distribution revealed that the incidence of DR-TB was highest among patients aged 19-35 years, followed by the 36-50 group. This suggests the disease is prevalent in the more economically productive age group. The higher incidence of resistance in younger patients might be attributed to their reluctance to adhere to prescribed medication regimens. A similar pattern was reported by Seloma et al. [41], with most of the DR-TB patients falling within the economically productive age range of 20-39 years, comprising 48.1% of cases. This trend suggests that DR-TB is particularly prevalent among individuals vital to the workforce and economic productivity. The prevalence of DR-TB among economically active age groups directly impacts workforce productivity, leading to reduced economic output [5]; and increased healthcare costs due to the need for more complex treatment regimens, prolonged hospital stays, and additional healthcare interventions. This financial burden can strain public health systems, particularly in low-resource settings.
The study had 56.1% male participants with DR-TB than 43.9% of female patients. The finding is consistent with the findings from other studies, which report that more men than women are infected with TB or DR-TB [41,42]. This is further reinforced by the WHO 2020 Global Report, which proved that adult men bear the greatest burden of TB, accounting for 56% of all cases, while women and children were 33% and 11% respectively [6].
About three-quarters (76.3%) of the cases of DR-TB in this study were unemployed and had no form of income. Similar findings were found in studies conducted in SSA, including other provinces in South Africa. Several studies in South Africa and SSA have found high rates of unemployment among patients with DR-TB. In a study in the Eastern Cape and Western Cape provinces of South Africa, most patients with MDR-TB were either unemployed or had jobs paying close to minimum wage before their illness [43]. In another retrospective study in Limpopo province, South Africa, the authors attributed their results partially to the high unemployment rate in the predominantly rural province [41]. Such findings underpin the close association between TB and poverty since people with no or low income tend to be vulnerable due to their exposure to different social and health conditions (2). A review of the socio-economic drivers of DR-TB in Africa identified unemployment as a common risk factor for DR-TB and poor treatment outcomes. Poverty and unemployment create barriers to accessing care and adhering to treatment [44].
The prevalence of DR-TB among unemployed individuals in South Africa is notably high, and studies indicate similar trends in other regions with varying prevalence rates. In Poland, a study observed that over 60% of patients with DR-TB were unemployed. The study emphasized that unemployment is a significant risk factor for poorer treatment outcomes and increased mortality among TB patients [45]. In Thailand, a study reported that unemployed individuals represented a significant percentage of TB cases, indicating that unemployment is a common risk factor for TB across different regions [46].
Several outcomes of DR-TB therapy, including cured, treatment completed, successful outcomes, treatment failure, LTFU, and death, are important to evaluate the effectiveness of such therapy [5,47]. Among the 456 patients with DR-TB reviewed during the study period, 33.77% had been declared cured, 29.17% had completed treatment, 9.43% were LTFU and 10.96% had died. The findings of our study report a successful treatment outcome rate of 61.4%, which is below the targets set by the National Strategic Plan and the World Health Organization (WHO). This result agrees with the previous studies conducted in another rural town of Eastern Cape with 62% and 65.8% rates [48,49], Limpopo, 57.9% [41], Ghana, 68.46% [50], and North-Central Nigeria, 67.4% [51]. The successful treatment outcome rate is higher than that reported in Abuja, Nigeria, which is 48.8% [52] but lower compared to 88.4% in Northwest Ethiopia [47], 80.7% in North-eastern Ethiopia [53], and 78.6% in Cameroon [54]. The disparity in treatment outcomes among these regions could be attributed to differences in number of study participants, sociodemographic characteristics, cultural practices, and socioeconomic status. These results underscore the significance of continued support and interventions for patients undergoing DR-TB treatment, especially for those at risk of losing follow-up or experiencing treatment failure. Addressing socio-economic barriers, improving patient education, and ensuring regular access to health care are crucial for improving treatment outcomes in this vulnerable population.
Although our study had a similar successful treatment rate to that conducted in Limpopo Province, the mortality rate and proportions of patients LTFU were 16.1% and 20.6% [41], respectively. In comparison, our study recorded lower figures of 10.96% and 9.43% respectively, among the DR-TB participants. Various reasons highlighted to be associated with LTFU of DR-TB patients include untraceable residential address, inability to be located or contacted, death after diagnosis, side effects of medications, lack of knowledge of disease severity, alcoholism, social stigma, difficulty in transportation, long distance to health facility, religious beliefs, negative predisposition towards treatment, poverty and lack of family and social support [55,56,57].
The COVID-19 pandemic had a devastating impact on the treatment outcomes of DR-TB in various regions of Africa, including South Africa. In Gabon, the number of newly detected TB cases fell by 80% in 2020 compared to the previous year. Botswana reported a 20% decline, and Lesotho reported a 35% decrease. Across Africa, 28% fewer patients with DR-TB were detected in 2020 compared to 2019. In South Africa, which has the largest number of DR-TB cases in the continent, 48% fewer people with drug-resistant TB were detected in 2020 compared to 2019. Globally, deaths from TB rose for the first time in a decade. In 2020, Africa reported 549, 000 deaths, an increase of around 2000 over 2019. The disruptions of health services by the COVID-19 pandemic also led to a reduction in the number of newly detected TB cases in high-burden African countries (58). According to the surveillance data analysis by Abdul et al. [59] in Gabon, the COVID-19 pandemic substantially disrupted the case-finding approach dynamics in RR-TB. Consequently, it reduced the number of patients screened between 2020 and 2021.
In our study, DR-TB-HIV co-infected patients have a higher risk of having an unsuccessful treatment outcome compared to non-co-infected patients. The mortality rate is significantly higher among DR-TB/HIV coinfected patients (14.49%) as compared to HIV-negative patients (5.42%). In the treatment completed category, the percentage of patients who completed treatment is slightly higher among HIV-negative patients (29.52%) than among HIV-positive patients (27.21%). This suggests that HIV-positive patients are more likely to experience adverse outcomes, such as death, compared to HIV-negative patients, although regression analysis indicated a marginally significant impact on treatment outcomes. A similar trend was seen in another South African study [60], with an association between HIV infection and TB mortality evident in their findings. TB/HIV co-infected patients had a 2.7 times higher risk of unsuccessful treatment outcomes, including death, compared to HIV-negative TB patients, according to the findings of a study conducted in Southern Ethiopia. The death rate was 5.6% in co-infected patients compared to 2% in HIV-negative patients [61] A study in Kenya reported that although the proportion of TB/HIV coinfections declined from 32% in 2012 to 24% in 2020, the patients still had lower treatment completion compared to HIV-negative TB patients [62]. There is a synergistic relationship between TB and HIV. TB infection aggravates HIV-associated immunodeficiency, while HIV infection modifies the pathogenesis of TB [62]. HIV-associated immunosuppression increases the risk of death during TB treatment. These findings consistently show that HIV co-infection is associated with higher mortality and lower treatment completion rates among TB patients. Hence, TB/HIV coinfected patients may require longer than standard therapy to avoid relapses or treatment failure.
This study applied a decision tree classifier as a supervised machine learning method to determine predicted treatment outcomes and risk factors associated with DR-TB with HIV coinfections. The model performs well when predicting successful treatment outcomes, as shown by the high recall (92%) and a balanced F1-score (78%). (ranging between 67.5% and 73.4%). The model performs poorly in predicting unsuccessful outcomes, as indicated by the low recall (31%) and low F1-score (43%). This means that the model missed many actual unsuccessful outcomes. The study of Balogun et al. [63] applied five machine learning methods, including a decision tree (DT), to determine predicted treatment outcomes and risk factors associated with TB patients. The overall classification showed that all the classification methods performed well in classifying the TB treatment outcome (ranging between 67.5% and 73.4%). Elhag [22] reported that the DT model was more accurate than the artificial neural network (ANN) when used to predict and classify tuberculosis cases in the United States of America using tuberculosis case data. Kalhori et al. [64] explored the use of machine learning to predict the outcome of a course of TB treatment. Using a data set of 6450 TB incidence from Iran in 2005, a comparison of six classifiers, including DT, Bayesian networks, logistic regression (LR), multi-layer perceptron (MLP), Radial Basis Function, and support vector machine (SVM), was made. The DT model presented the best performance with 97% of Area Under the Curve (AUC) Receiver Operating Characteristics (ROC). Using DT in our study, age was the primary factor determining successful treatment, with younger patients (≤ 24.5) being more scrutinized based on their occupation and comorbidities, with income playing a significant role in older patients (> 24.5). In contrast, those with income generally have better outcomes. Comorbidities are a consistent factor influencing outcomes across different age and income groups. Gender and specific comorbidities further refine the predictions, highlighting more granular relationships between these factors and treatment outcomes. Balogun et al. [63], on the other hand, identified age and length of stay as significant risk factors, while gender was not a significant risk factor for TB patients.

5. Conclusions

The burden of TB/HIV coinfection was associated with a higher mortality rate and LTFU. Our findings support the need for systematic HIV testing when initiating TB treatment and targeted interventions toward TB treatment completion and reduction of mortality. Strengthening TB/HIV collaborative activities, including early HIV diagnosis and prompt ART initiation, is critical to improve treatment outcomes in this high-risk population. Our findings showed the utility of a decision tree classifier as a model to predict DR-TB patients’ treatment outcomes with a high recall of 92%. Machine learning models can effectively predict patients’ treatment outcomes, highlighting their potential to improve clinical decision-making and patient care. Further investigation is needed using large datasets and more factors to validate this valuable treatment outcome prediction tool.

Author Contributions

Conceptualization, M.C.H.; methodology, M.C.H.; validation, M.C.H.; L.M.F.; T.A.; formal analysis, M.C.H.; T.A.; investigation, M.C.H.; L.M.F.; data curation, M.C.H.; L.M.F.; T.A.; writing—original draft preparation, M.C.H.; writing—review and editing, M.C.H.; L.M.F.; T.A. funding acquisition, L.M.F.; All authors have read and agreed to the published version of the manuscript

Funding

This research was funded by the South African Medical Research Council Pilot grant and The APC was funded by Walter Sisulu University.

Institutional Review Board Statement

The study was conducted in accordance with the Declaration of Helsinki and approved by the Biomedical Research Ethics Committee of the Faculty of Medicine and Health Sciences of Walter Sisulu University (ethical clearance No. 026/2019). The Department of Health approved the conduct of the research (DoH approval No EC_201904_011). Permission to conduct the study was sought and received from the different managers of the healthcare facilities.

Informed Consent Statement

Not applicable. The study only accessed and reviewed patients’ medical records after approval was sought from the Department of Health Eastern Cape Province, South Africa.

Data Availability Statement

Data can be requested from the corresponding author.

Acknowledgments

The authors are grateful to the healthcare workers who gave us access to the patients’ medical records. Many thanks to our colleagues for their support during data collection.

Conflicts of Interest

The authors declare no conflicts of interest. The funders had no role in the design of the study; in the collection, analyses, or interpretation of data; in the writing of the manuscript; or in the decision to publish the results.

References

  1. Song, W.M.; Guo, J.; Xu, T.T.; Li, S.J.; Liu, J.Y.; Tao, N.N.; Liu, Y.; Zhang, Q.Y.; Liu, S.Q.; An, Q.Q.; Li, Y.F. Association between body mass index and newly diagnosed drug-resistant pulmonary tuberculosis in Shandong, China from 2004 to 2019. BMC Pulm. Med. 2024, 21, 1–14. [Google Scholar] [CrossRef] [PubMed]
  2. Neves, A.C.D.O.J.; Dos Santos, A.P.G.; de Medeiros, R.L.; de Oliveira Jeronymo, A.J.; Neves, G.C.; de Almeida, I.N.; de Queiroz Mello, F.C.; Kritski, A.L. Sociodemographic and clinical factors associated with treatment outcomes for drug-resistant tuberculosis. Am. J. Trop. Med. Hyg. 2022, 107(6), 1295. [Google Scholar] [CrossRef] [PubMed]
  3. World Health Organization 2023. Global tuberculosis report 2023. Geneva: World Health Organization; 2023. Licence: CC BY-NC-SA 3.0 IGO. https://iris.who.int/bitstream/handle/10665/373828/9789240083851-eng.pdf?sequence=1 (accessed 12 August 2024).
  4. Torres, S.G.V. , Fullmer, J. and Berkowitz, L. A Case of Multidrug-Resistant (MDR) Tuberculosis and HIV Co-Infection. Cureus, 2023; 15. [Google Scholar] [CrossRef]
  5. Chanda, E. The clinical profile and outcomes of drug-resistant tuberculosis in Central Province of Zambia. BMC Infect. Dis, 2024; 24, 364. [Google Scholar] [CrossRef]
  6. World Health Organization, 2021. Global Tuberculosis Report 2021. Geneva, Switzerland: WHO. Available at: https://www.who.int/publications/i/item/9789240037021. (Accessed 18 August 2024). 18.
  7. Kamara, R.F. , Saunders, M.J., Sahr, F., Losa-Garcia, J.E., Foray, L., Davies, G., Wingfield, T. Social and health factors associated with adverse treatment outcomes among people with multidrug-resistant tuberculosis in Sierra Leone: a national, retrospective cohort study. Lancet Glob. Health, 2022; 10, e543–e554. [Google Scholar] [CrossRef]
  8. Diallo, A.; Diallo, B.D.; Camara, L.M.; Kounoudji, L.A.N.; Bah, B.; N’Zabintawali, F.; Carlos-Bolumbu, M.; Diallo, M.H.; Sow, O.Y. Different profiles of body mass index variation among patients with multidrug-resistant tuberculosis: a retrospective cohort study. BMC Infect. Dis, 2020; 20, 1–10. [Google Scholar] [CrossRef]
  9. Daftary, A., Mondal, S.; Zelnick, J.; Friedland, G.; Seepamore, B.; Boodhram, R.; Amico, K.R.; Padayatchi, N.; O’Donnell, M.R. Dynamic needs and challenges of people with drug-resistant tuberculosis and HIV in South Africa: a qualitative study. Lancet Glob. Health, 2021, 9(4), e479-e488. [CrossRef]
  10. Wagnew, F.; Alene, K.A.; Kelly, M.; Gray, D. Impacts of body weight change on treatment outcomes in patients with multidrug-resistant tuberculosis in Northwest Ethiopia. Sci. Rep, 2024; 14, 508. [Google Scholar] [CrossRef]
  11. Young, C.; Walzl, G.; Du Plessis, N. Therapeutic host-directed strategies to improve outcome in tuberculosis. Mucosal Immunol. 2020, 13(2), 190–204. [Google Scholar] [CrossRef] [PubMed]
  12. Singh, A.; Prasad, R.; Balasubramanian, V.; Gupta, N. Drug-resistant tuberculosis and HIV infection: current perspectives. HIV/AIDS-(Auckl), 2020; 9–31. [Google Scholar] [CrossRef]
  13. World Health Organization 2019. Global Tuberculosis Report 2019. Geneva: WHO; 2019 (WHO/CDS/TB/2019.15). Available from: https://www.who.int/tb/publications/global_report/en/. {Accessed 18 August 2024}.
  14. Cerrone, M.; Bracchi, M.; Wasserman, S.; Pozniak, A.; Meintjes, G.; Cohen, K.; Wilkinson, R.J. Safety implications of combined antiretroviral and anti-tuberculosis drugs. Expert Opin. Drug Saf. 2020, 19(1), 23–41. [Google Scholar] [CrossRef] [PubMed]
  15. WHO Report: Global strategy and targets for tuberculosis prevention, care, and control after 2015. http://apps.who.int/gb/ebwha/pdf_files/EB134/B134_12-en.pdf?ua=1 29 November 2013. (accessed 7 September 2024).
  16. World Health Organization (WHO) Report. The Global plan to stop TB 2011–2015. http://www.stoptb.org/assets/documents/global/plan/TB_GlobalPlanToStopTB2011-2015.pdf (accessed 7 September 2024).
  17. Zumla, A.; Petersen, E.; Nyirenda, T.; Chakaya, J. Tackling the tuberculosis epidemic in sub-Saharan Africa–unique opportunities arising from the second European Developing Countries Clinical Trials Partnership (EDCTP) programme 2015-2024. Int. J. Infect. Dis., 2015; 32, 46–49. [Google Scholar] [CrossRef]
  18. Liu, C.; Ma, Y.; Zhao, J.; Nussinov, R.; Zhang, Y.C.; Cheng, F.; Zhang, Z.K. Computational network biology: data, models, and applications. Phys. Rep, 2020; 846, 1–66. [Google Scholar] [CrossRef]
  19. Peiffer-Smadja, N.; Rawson, T.M.; Ahmad, R.; Buchard, A.; Georgiou, P.; Lescure, F.X.; Birgand, G.; Holmes, A.H. Machine learning for clinical decision support in infectious diseases: a narrative review of current applications. Clin. Microbiol. Infect, 2020; 26, 584–595. [Google Scholar] [CrossRef]
  20. Quazi, S. Artificial intelligence and machine learning in precision and genomic medicine. Med. Oncol, 2022; 39, 120. [Google Scholar] [CrossRef]
  21. Lino Ferreira da Silva Barros, M.H.; Oliveira Alves, G.; Morais Florêncio Souza, L.; da Silva Rocha, E.; Lorenzato de Oliveira, J.F.; Lynn, T.; Sampaio, V.; Endo, P.T. Benchmarking machine learning models to assist in the prognosis of tuberculosis. Informatic, 2021; 8, 27. [Google Scholar] [CrossRef]
  22. Elhag, A.A. Prediction and classification of Tuberculosis using machine learning. J. Stat. Appl. Pro. 2024, 13(3), 939–946. [Google Scholar] [CrossRef]
  23. Brandt, P.; Moodley D.; Pillay A.W.; Seebregts, C.J.; Oliveira, T.D. “An investigation of classification algorithms for predicting HIV drug resistance without genotype resistance testing.” In Foundations of Health Information Engineering and Systems: Third International Symposium, FHIES 2013, Macau, China, August 21-23, 2013. Revised Selected Papers 3, 236-253. Springer Berlin Heidelberg, 2014.
  24. Flores, K.R.; de Carvalho, L.V.F.M.; Reading, B.J.; Fahrenholz, A.; Ferket, P.R.; Grimes, J.L. Machine learning and data mining methodology to predict nominal and numeric performance body weight values using Large White male turkey datasets. J. Appl. Poult. Res, 2023; 32, 100366. [Google Scholar] [CrossRef]
  25. Choy, G.; Khalilzadeh, O.; Michalski, M.; Do, S.; Samir, A.E.; Pianykh, O.S.; Geis, J.R.; Pandharipande, P.V.; Brink, J.A.; Dreyer, K.J. Current applications and future impact of machine learning in radiology. Radiology, 2018; 288, 318–328. [Google Scholar] [CrossRef]
  26. Topol, E.J. High-performance medicine: the convergence of human and artificial intelligence. Nat Med., 2019, 25:44-56. [CrossRef]
  27. Abràmoff, M.D.; Lavin, P.T.; Birch, M.; Shah, N.; Folk, J.C. Pivotal trial of an autonomous AI-based diagnostic system for detection of diabetic retinopathy in primary care offices. NPJ digital medicine, 2018, 39. [CrossRef]
  28. Zazzi, M.; Cozzi-Lepri, A. Prosperi MCF. Computer-aided optimization of combined anti-retroviral therapy for HIV: new drugs, new drug targets and drug resistance. Curr HIV Res, 2016; 14, 101–109. [Google Scholar] [CrossRef]
  29. Macesic, N.; Polubriaginof, F.; Tatonetti, N.P. Machine learning: novel bioinformatics approaches for combating antimicrobial resistance. Curr Opin Infect Dis, 2017; 30, 511–517. [Google Scholar] [CrossRef]
  30. Su, M.; Satola, S.W.; Read, T.D. Genome-based prediction of bacterial antibiotic resistance. J Clin Microbiol, 201, 8. [CrossRef]
  31. Durrant, J.D.; Amaro, R.E. Machine-learning techniques applied to antibacterial drug discovery. Chem Biol Drug Des, 2015; 85, 14–21. [Google Scholar] [CrossRef]
  32. Lee, E.Y.; Lee, M.W.; Fulan, B.M.; Ferguson, A.L.; Wong, G.C.L. What can machine learning do for antimicrobial peptides, and what can antimicrobial peptides do for machine learning? Interface Focus 2017, 7, 20160153. [Google Scholar] [CrossRef] [PubMed]
  33. Sips, M.E.; Bonten, M.J.M.; van Mourik, M.S.M. Automated surveillance of healthcare-associated infections: state of the art. Curr Opin Infect Dis, 2017; 30, 425–431. [Google Scholar] [CrossRef]
  34. Roth, J.A.; Battegay, M.; Juchler, F.; Vogt, J.E.; Widmer, A.F. Introduction to machine learning in digital healthcare epidemiology. Infect Control Hosp Epidemiol, 2018; 39, 1457–1462. [Google Scholar] [CrossRef]
  35. Evora, L.H.R.A.; Seixas, J.M.; Kritski, A.L. Neural network models for supporting drug and multidrug resistant tuberculosis screening diagnosis. Neurocomputing, 2017; 265, 116–126. [Google Scholar] [CrossRef]
  36. Verma, R.; Bhandari, K.; Sah, S.P.; Anitha, V.; Mane, Y.D.; Punithavel, R.; Banerjee, S. AI in Healthcare: Predicting Patient Outcomes using Machine Learning Techniques. Afr.J.Bio.Sc. 2024; 6. [Google Scholar]
  37. Revell, A.D.; Wang, D.; Wood, R.; Morrow, C. ’ Tempelman, H.; Hamers, R.L.; Alvarez-Uria, G.; Streinu-Cercel, A.; Ene, L.; Wensing, A.M.J.; DeWolf, F. Computational models can predict response to HIV therapy without a genotype and may reduce treatment failure in different resource-limited settings. J. Antimicrob. Chemother, 2013; 68, 1406–1414. [Google Scholar]
  38. Statistics South Africa. Census 2022; Stats SA: Pretoria, South Africa, 2022. Available online: http://www.statssa.gov.za (accessed 21 April 2023).
  39. Berhan, A.; Berhan, Y.; Yizengaw, D. A meta-analysis of drug-resistant tuberculosis in Sub-Saharan Africa: how strongly associated with previous treatment and HIV co-infection? Ethiopian J. Health Sci., 2013; 23, 271–282. [Google Scholar]
  40. Nachega, J.B.; Kapata, N.; Sam-Agudu, N.A.; Decloedt, E.H.; Katoto, P.D.; Nagu, T.; Mwaba, P.; Yeboah-Manu, D.; Chanda-Kapata, P.; Ntoumi, F.; Geng, E.H. Minimizing the impact of the triple burden of COVID-19, tuberculosis and HIV on health services in sub-Saharan Africa. Int. J. Infect. Dis, 2021; 113, S16–S21. [Google Scholar] [CrossRef]
  41. Seloma, N.M.; Makgatho, M.E.; Maimela, E. Evaluation of drug-resistant tuberculosis treatment outcome in Limpopo province, South Africa. Afri. J. Prim. Health Care Fam. Med, 2023; 15, 3764. [Google Scholar] [CrossRef]
  42. El Hamdouni, M.; Bourkadi, J.E.; Benamor, J.; Hassar, M.; Cherrah, Y.; Ahid, S. Treatment outcomes of drug-resistant tuberculosis patients in Morocco: Multi-centric prospective study. BMC Infect Dis. 2019, 19(1), 316. [Google Scholar] [CrossRef] [PubMed]
  43. Ramma, L.; Cox, H.; Wilkinson, L.; Foster, N.; Cunnama, L.; Vassall, A.; Sinanovic, E. Patients’ costs associated with seeking and accessing treatment for drug-resistant tuberculosis in South Africa. Int. J. Tuberc. Lung Dis, 2015; 19, 1513–1519. [Google Scholar] [CrossRef]
  44. Ismail, N.; Ismail, F.; Omar, S.V.; Blows, L.; Gardee, Y.; Koornhof, H. Drug-resistant tuberculosis in Africa: Current status, gaps and opportunities. Afr. J. Lab. Med, 2018; 7, 781. [Google Scholar]
  45. Przybylski, G.; Dąbrowska, A.; Pilaczyńska-Cemel, M.; Krawiecka, D. Unemployment in TB patients–ten-year observation at regional center of pulmonology in Bydgoszcz, Poland. Med. Sci. Monit. : Inter. Medical J. Exp. Clin. Res, 2014; 20, 2125. [Google Scholar] [CrossRef]
  46. Mphande-Nyasulu, F.A.; Puengpipattrakul, P.; Praipruksaphan, M.; Keeree, A.; Ruanngean, K. Prevalence of tuberculosis (TB), including multi-drug-resistant and extensively-drug-resistant TB, and association with occupation in adults at Sirindhorn Hospital, Bangkok. IJID regions, 2022; 2, 141–148. [Google Scholar] [CrossRef]
  47. Limenh, L.W.; Kasahun, A.E.; Sendekie, A.K.; Seid, A.M.; Mitku, M.L.; Fenta, E.T.; Melese, M.; Workye, M.; Simegn, W.; Ayenew, W. Tuberculosis treatment outcomes and associated factors among tuberculosis patients treated at healthcare facilities of Motta Town, Northwest Ethiopia: a five-year retrospective study. Sci. Rep, 2024; 14, 7695. [Google Scholar] [CrossRef]
  48. Lotz, J.K.; Porter, J.D.; Conradie, H.H.; Boyles, T.H.; Gaunt, C.B.; Dimanda, S.; Cort, D. Treating drug-resistant tuberculosis in an era of shorter regimens: Insights from rural South Africa. South Afr. Med. J. 2023, 113(11), 1491–1500. [Google Scholar] [CrossRef] [PubMed]
  49. Faye, L.M.; Hosu, M.C.; Iruedo, J.; Vasaikar, S.; Nokoyo, K.A.; Tsuro, U.; Apalata, T. Treatment outcomes and associated factors among tuberculosis patients from selected rural eastern cape hospitals: An ambidirectional study. Trop. Med. Infect. Dis, 2023; 8, 315. [Google Scholar] [CrossRef]
  50. Agyare, S.A.; Osei, F.A.; Odoom, S.F.; Mensah, N.K.; Amanor, E.; Martyn-Dickens, C.; Owusu-Ansah, M.; Mohammed, A.; Yeboah, E.O. Treatment Outcomes and Associated Factors in Tuberculosis Patients at Atwima Nwabiagya District, Ashanti Region, Ghana: A Ten-Year Retrospective Study. Tuberc. Res. Treat, 2021; 9952806. [Google Scholar] [CrossRef]
  51. Sariem, C.N.; Odumosu, P.; Dapar, M.P.; Musa, J.; Ibrahim, L.; Aguiyi, J. Tuberculosis treatment outcomes: A fifteen-year retrospective study in Jos-North and Mangu, Plateau State, North-Central Nigeria. BMC Public Health, 2020; 20, 1–11. [Google Scholar] [CrossRef]
  52. Ofoegbu, O.S.; Odume, B.B. Treatment outcome of tuberculosis patients at National Hospital Abuja Nigeria: A five-year retrospective study. S. Afr. Fam. Pract, 2015; 57, 50–56. [Google Scholar] [CrossRef]
  53. Getie, A; Alemnew B. Tuberculosis treatment outcomes and associated factors among patients treated at Woldia General Hospital in NortheastEthiopia: An institution-based cross-sectional study. Infect. Drug Resist., 2020, 13:3423–3429.
  54. Tanue, E.A.; Nsagha, D.S.; Njamen, T.N.; Assob, N.J.C. Tuberculosis treatment outcome and its associated factors among people living with HIV and AID in Fako Division of Cameroon. PLoS One, 2019; 14, e0218800. [Google Scholar] [CrossRef]
  55. Kapata, N.; Grobusch, M.P.; Chongwe, G.; Chanda-Kapata, P.; Ngosa, W.; Tembo, M.; Musonda, S.; Katemangwe, P.; Bates, M.; Mwaba, P.; Zumla, A. Outcomes of multidrug-resistant tuberculosis in Zambia: a cohort analysis. Infection, 2017; 45, 831–839. [Google Scholar] [CrossRef]
  56. Soedarsono, S.; Mertaniasih, N.M.; Kusmiati, T.; Permatasari, A.; Juliasih, N.N.; Hadi, C.; Alfian, I.N. Determinant factors for loss to follow-up in drug-resistant tuberculosis patients: the importance of psycho-social and economic aspects. BMC Pulm. Med., 2021; 21, 1–8. [Google Scholar] [CrossRef]
  57. Adepoju, V.A.; Adelekan, A.; Adejumo, A.O. Timing and reasons for lost to follow-up among patients on 6-month standardized anti-TB treatment in Nigeria. J Pre-Clin Clin Res, 2022; 16, 34–37. [Google Scholar]
  58. World Health Organization (WHO) African Region. Low funding, COVID-19 curtail tuberculosis fight in Africa. https://www.afro.who.int/news/low-funding-covid-19-curtail-tuberculosis-fight-africa. (Accessed 5 September 2024).
  59. Abdul, J.B.P.A.A.; Adegbite, B.R.; Ndanga, M.E.D.; Edoa, J.R.; Mevyann, R.C.; Mfoumbi, G.R.A.I.; De Dieu, T.J.; Mahoumbou, J.; Biyogho, C.M.; Jeyaraj, S.; Niemann, S. Resistance patterns among drug-resistant tuberculosis patients and trends-over-time analysis of national surveillance data in Gabon, Central Africa. Infection, 2023; 51, 697–704. [Google Scholar] [CrossRef]
  60. Mabunda, T.E.; Ramalivhana, N.J.; Dambisya, Y.M. . Mortality associated with tuberculosis/HIV co-infection among patients on TB treatment in the Limpopo province, South Africa. Afr. Health Sci, 2014; 14, 849–854. [Google Scholar] [CrossRef]
  61. Alemu, M.A. , Yesuf, A., Girma, F., Adugna, F., Melak, K., Biru, M., Seyoum, M., Abiye, T. Impact of HIV-AIDS on tuberculosis treatment outcome in Southern Ethiopia–a retrospective cohort study. J. Clin. Tuberc. Other Mycobact. Dis., 2021, 25, 100279. 2021; 25, 100279. [Google Scholar] [CrossRef]
  62. Ngari, M.M.; Rashid, M.A.; Sanga, D.; Mathenge, H.; Agoro, O.; Mberia, J.K.; Katana, G.G.; Vaillant, M.; Abdullahi, O.A. ; Burden of HIV and treatment outcomes among TB patients in rural Kenya: a 9-year longitudinal study. BMC Infect. Dis, 2023; 23, 362. [Google Scholar] [CrossRef]
  63. Balogun, O.S.; Olaleye, S.A.; Mohsin, M.; Toivanen, P. Investigating machine learning methods for tuberculosis risk factors prediction: a comparative analysis and evaluation. Proceedings of the 37th International Business Information Management Association (IBIMA). ISBN: 978-0-9998551-6-4, 1-2 April 2021, Cordoba, Spain.
  64. Kalhori, S.R.N.; Zeng, X.J. Evaluation and comparison of different machine learning methods to predict outcome of tuberculosis treatment course. J. Intell. Learn. Syst. Appl. 2013, 5, 10. [Google Scholar] [CrossRef]
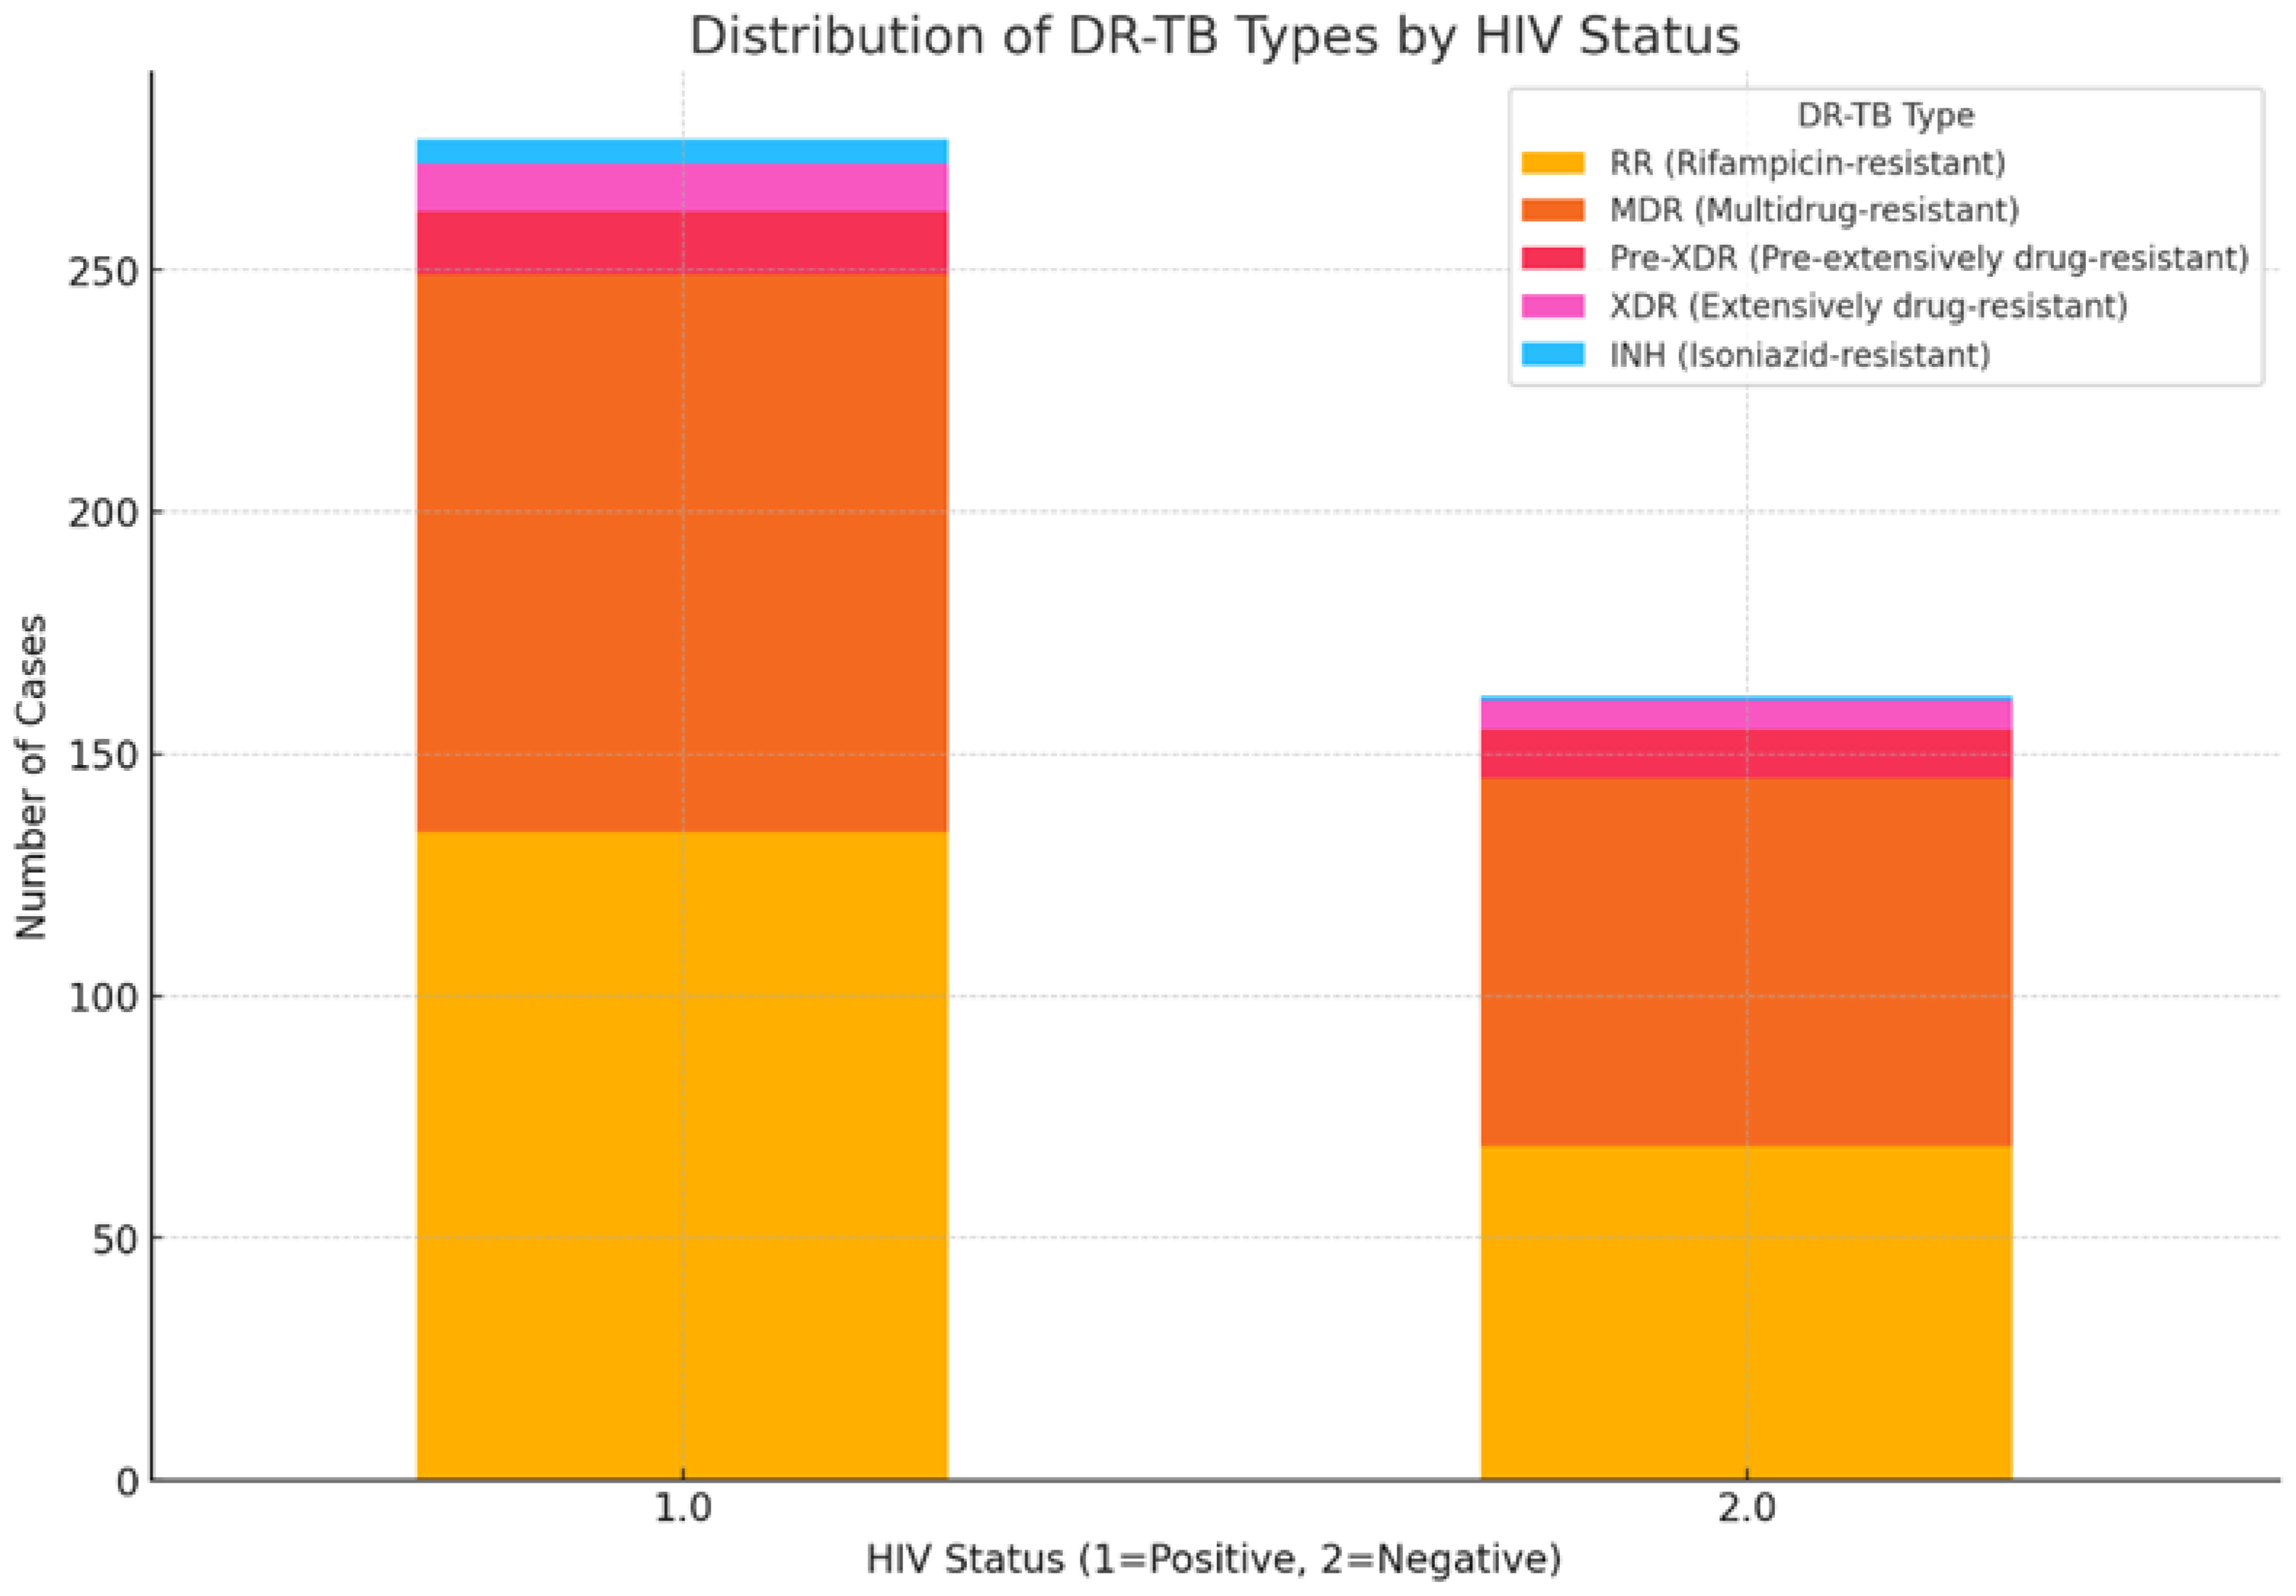
Figure 1. Distribution of DR-TB by HIV status.
Preprints 118853 g001
Figure 2. Treatment outcomes of patients with DR-TB at selected hospitals in the OR Tambo district municipality between January 2018 and December 2020.
Preprints 118853 g002
Figure 3. Pre-pandemic versus Pandemic Treatment outcomes.
Preprints 118853 g003
Figure 4. Treatment outcomes trend.
Preprints 118853 g004
Figure 5. Treatment outcomes according to DR-TB type.
Preprints 118853 g005
Figure 6. Proportion of Treatment outcomes by DR-TB.
Preprints 118853 g006
Figure 7. Proportion of Treatment outcomes by HIV status.
Preprints 118853 g007
Figure 8. Impact of HIV status on treatment outcomes.
Preprints 118853 g008
Figure 9. Detailed optimized decision tree for predicting successful treatment outcomes model.
Preprints 118853 g009
Table 1. Socio-demographic and clinical characteristics of drug-resistant tuberculosis patients from 2018 to 2020 (N = 456)#.
Characteristics N %
Gender
Male
Female

256
200

56.1
43.9
Age groups (years)
0-18
19-35
36-50
51-65
>66

32
185
142
65
21

7.2
41.6
31.9
14.6
4.7
Occupation
Unemployed
Employed (govt. and private)
Student
Pensioner
Grant recipient
Minors

331
34
35
20
8
6

76.3
7.8
8.1
4.6
1.8
1.4
Type of TB
PTB
EPTB
NR

446
6
4

97.8
1.3
0.9
Type of resistance
Monoresistance
Polyresistance
NR

207
237
12

45.4
52.0
2.6
Type of drug resistance
RR
MDR
Pre-XDR
XDR
INH-R
NR

205
194
23
17
6
11

45.0
42.5
5.0
3.7
1.3
2.4
Previous drug history
New
PT1
PT2
Unk
NR

226
178
43
1
8

49.6
39.0
9.4
0.2
1.75
HIV status
Positive
Negative
NR

281
165
10

61.6
36.2
2.2
PTB- pulmonary TB; EPTB- extrapulmonary TB; RR—Rifampicin resistance; MDR—multidrug-resistant; XDR—extremely drug-resistant; INH-R—isoniazid-resistant; NR- Not reported PT1—previously treated with first-line drugs; PT2—previously treated with second-line drugs; UNK—unknown. # Some characteristics did not equal 456 because they were not reported.
Table 2. Type of DR-TB categorised according to age groups.
DR-TB type Age groups (years)
0-18 19-35 36-50 51-65 >66
RR 15 85 67 24 14
MDR 12 84 62 31 5
Pre-XDR 3 5 7 7 1
XDR 2 11 1 3 0
INH-R 0 0 5 0 1
RR—Rifampicin resistance; MDR—multidrug-resistant; XDR—extremely drug-resistant; INH-R—isoniazid-resistant.
Disclaimer/Publisher’s Note: The statements, opinions and data contained in all publications are solely those of the individual author(s) and contributor(s) and not of MDPI and/or the editor(s). MDPI and/or the editor(s) disclaim responsibility for any injury to people or property resulting from any ideas, methods, instructions or products referred to in the content.
Copyright: This open access article is published under a Creative Commons CC BY 4.0 license, which permit the free download, distribution, and reuse, provided that the author and preprint are cited in any reuse.
Prerpints.org logo

Preprints.org is a free preprint server supported by MDPI in Basel, Switzerland.

Subscribe

© 2024 MDPI (Basel, Switzerland) unless otherwise stated