
Submitted:
20 September 2024
Posted:
23 September 2024
You are already at the latest version
Abstract
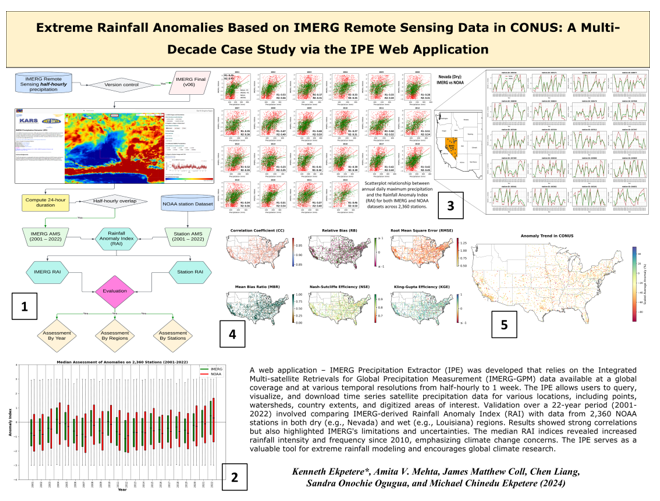
A web application – IMERG Precipitation Extractor (IPE) was developed that relies on the Integrated Multi-satellite Retrievals for Global Precipitation Measurement (IMERG-GPM) data available at a global coverage. The IPE allows users to query, visualize, and download time series satellite precipitation data for various locations, including points, watersheds, country extents, and digitized areas of interest. It supports different temporal resolutions ranging from 30 minutes to 1 week. Additionally, the IPE facilitates advanced analyses such as storm tracking and anomaly detection, which can be used to monitor climate change through variations in precipitation frequency and intensity. To validate the IMERG precipitation data for anomaly estimation over a 22-year period (2001 to 2022), the Rainfall Anomaly Index (RAI) was calculated and compared with RAI data from 2,360 NOAA stations across the conterminous United States (CONUS), considering both dry and wet climate regions. In the dry region (e.g., Nevada), the results showed an average correlation coefficient (CC) of 0.94, a percentage relative bias (PRB) of -22.32%, a root mean square error (RMSE) of 0.96, a mean bias ratio (MBR) of 0.74, a Nash-Sutcliffe Efficiency (NSE) of 0.80, and a Kling-Gupta Efficiency (KGE) of 0.52. In the wet region (e.g., Louisiana), the average CC was 0.93, the PRB was 24.82%, the RMSE was 0.96, the MBR was 0.79, the NSE was 0.80, and the KGE was 0.18. Median RAI indices from both IMERG and NOAA indicated an increase in rainfall intensity and frequency since 2010, highlighting growing concerns about climate change. The study suggests that IMERG data can serve as a valuable alternative for modeling extreme rainfall anomalies in data-scarce areas, noting its possibilities, limitations, and uncertainties. The IPE web application also offers a platform for extending research beyond CONUS, advocating for further global climate change studies.
Keywords:
IPE
; IMERG
; Rainfall anomaly index
; climate change
; rainfall intensity
; rainfall frequencies
; rainfall storm
; web application
; NOAA
; CONUS
1. Introduction
With the rise in extreme precipitation driven by global climate change [1,2], precipitation-induced floods have increasingly overwhelmed flood retention infrastructures such as dams, culverts, levees, and bridges, leading to widespread destruction of farmlands, buildings, urban flooding, waterborne diseases, groundwater pollution, and loss of life [3,4,5,6,7,8,9,10]. The Intergovernmental Panel on Climate Change (IPCC) has reported that climate patterns are shifting, with many regions experiencing wetter conditions and an increasing trend in the median of annual maximum daily precipitation [11,12]. Although extreme precipitation is increasing globally, regional trends deviate significantly, raising questions about the magnitude of anomalies in extreme rainfall [11,13,14,15].
In the United States, earlier studies have documented an increase in both the intensity and frequency of precipitation extremes [1,11,16], prompting concerns about the relevance of the National Oceanic and Atmospheric Administration (NOAA) Atlas-14 precipitation estimates (PE) for modeling and planning extreme events. The NOAA Atlas-14 PE is widely used for planning across the conterminous United States (CONUS), excluding some northwestern states (Idaho, Montana, Oregon, Washington, and Wyoming) [17,18,19,20]. However, Atlas-14 primarily incorporates historical observations, without accounting for projected future extremes, making it less suitable for planning in a changing climate where extreme precipitation events are becoming more frequent in the CONUS region [21,22]. The lacking credibility on the Atlas-14 PFE has called for a shift to try alternative sources such as the use of satellite precipitation products for rainfall analyses.
To quantify rainfall changes over time, various indices have been developed, such as the Palmer Drought Severity Index (PDSI) [23], the Standardized Precipitation Evapotranspiration Index (SPEI) [24], and the Standardized Precipitation Index (SPI) [25]. However, these indices primarily focus on drought and do not capture the extreme rainfall anomalies necessary for flood-related decision-making in the CONUS [26]. Consequently, the Rainfall Anomaly Index (RAI), developed by Van Rooy in 1965 [27], has remained a cornerstone for studying both drought and extreme rainfall globally [27,28,29]. In this study, we adopted the RAI to model rainfall anomalies based on annual maximum daily precipitation from thousands of stations across the CONUS, spanning two decades (2001 to 2022). The method is particularly suitable due to its ability to capture significant changes over short periods (≥10 years) [26,27].
Previous research has linked large-scale ocean-atmosphere conditions to local and regional manifestations of climate change, resulting in severe rainfall anomalies. The most frequently studied phenomena in the CONUS include the El Niño Southern Oscillation (ENSO), Pacific Decadal Oscillation (PDO), North Atlantic Oscillation (NAO), and Atlantic Multidecadal Oscillation (AMO) [11,30,31]. These climatic cycles influence the intensity and frequency of extreme precipitation events across the CONUS, though they fall outside the scope of this study. Rainfall observations are typically conducted at weather stations [32] or within gauged watersheds [33]. However, station data is often sparse, especially in ungauged areas, necessitating the interpolation of data where stations are lacking [17,34]. Moreover, the reliability and validity of station-based observations are frequently questioned [28,33,35,36,37,38,39,40,41]. To address these limitations, remote sensing products have become increasingly important, filling observational gaps where station data is uncertain, extending beyond the CONUS [43,44,45,46,47], and offering broad availability [38,39,48,49].
The Integrated Multi-Satellite Retrievals for Global Precipitation Measurement (IMERG), like other satellite precipitation products (SPPs), has been used to measure precipitation at local, regional, and global scales, providing critical insights for flood risk assessment [50,51,52,53]. Previous studies have shown that IMERG estimates are comparable to station-based observations [51,54,55,56,57,58,59,60,61,62]. IMERG is recognized as a next-generation SPP, covering a global latitude range of 0-65° N/S, with a spatial resolution of 0.1° and a temporal resolution of half-hourly intervals [51,63,64,65,66]. It has become a sophisticated tool for advanced hydrological applications, combining data from optical and radar sensors as well as existing SPPs like the Global Precipitation Measurement (GPM) mission and the Tropical Rainfall Measuring Mission (TRMM). Additionally, it is calibrated using data from over 80,000 Global Precipitation Climatology Centre (GPCC) gauge networks [46,51,54].
Numerous studies have assessed anomalies in extreme precipitation, both in the United States and globally, focusing on various aspects. For example, [11] examined the temporal anomalies of extreme precipitation across 1,041 stations in the U.S. and their association with different climatic modes using a quartile perturbation approach. The study identified drier conditions in the mid-20th century and wetter conditions in recent decades. In another study, [67] evaluated the impact of seasonal rainfall anomalies on catchment-scale water balance components using the Soil and Water Assessment Tool (SWAT) in southern Italy, identifying regression equations linking water yield and dryness during the wet season. Meanwhile, [68] used Global Historical Climate Network (GHCN) data to identify extreme precipitation days in the U.S. from 1979 to 2019. In another related study, [69] demonstrated the predictive power of climate-driven changes in seasonal precipitation through sea surface temperature patterns. Other studies have explored the role of large-scale circulation anomalies in influencing extreme precipitation frequencies in the U.S. [15], revealing multidecadal variations in the North American Monsoon System (NAMS) between 1948 and 2009 [30], as well as the influence of El Niño on precipitation anomalies in South America [12].
While these studies are valuable, a gap remains in the application of recent datasets, such as IMERG, which can provide more accurate insights into contemporary rainfall anomalies, offering optimal accuracy compared to gauge observations [60,63,70,71]. Furthermore, earlier research has faced challenges related to data centralization, making it difficult for non-experts to access the relevant data. To address these gaps, we adopted IMERG (Final) data and developed the IMERG Precipitation Extractor (IPE), an intuitive, self-updating web application that facilitates time series data extraction, storm tracking, real-time anomaly calculations, visualization, and data downloads. The IPE is a global web application that ensures rapid IMERG data retrieval beyond CONUS. For this study, raw IMERG data were extracted, and daily annual maximum values were computed from 2001 to 2022. RAI values were derived for each year and compared with NOAA station-based RAI to evaluate the validity of IMERG-derived RAI.
The objectives of this study are as follows: (1) to demonstrate the capability of the IPE web application for time series extraction, storm tracking, anomaly calculation, visualization, and data download; (2) to model RAI from IMERG data and compare it with NOAA station-based RAI from 2,360 stations at temporal, regional, and CONUS scales; and (3) to derive insights from IMERG RAI observations regarding recent extreme rainfall and the impacts of climate change. The remainder of this paper is structured as follows: Section 2 describes the study area and data, Section 3 outlines the methodology, Section 4 presents and discusses the results, and Section 5 offers conclusions.
2. Study Area and Data
2.1. Study Area
This study covers the entire conterminous United States (CONUS), excluding five northwestern states (Idaho, Montana, Oregon, Washington, and Wyoming), where station data are unavailable. CONUS spans an estimated area of 3,119,885 square miles (8,080,464 km²), with approximately 83.65% of this area consisting of land. The region experiences a broad range of mean annual precipitation, varying from as little as 2.5 inches in the arid west to over 2,000 inches in the humid east, generally following a west-to-east increasing precipitation gradient (Figure 1).
To minimize uncertainties associated with limited gauge data, we selected 2,360 stations from the National Oceanic and Atmospheric Administration (NOAA) database [18,22,72], each with 22 years of data (2001–2022). These stations correspond to 2,360 unique pixels within the IMERG dataset, from which precipitation estimates were extracted for comparative analysis. At the time of this study, NOAA station data for the northwestern part of CONUS were not yet available, though efforts were underway to extend coverage to those areas [19,21,72,73]. Consequently, the evaluation is restricted to regions within CONUS that have sufficient NOAA station coverage.
2.2. IMERG Precipitation Data
The IMERG dataset integrates inputs from various algorithms, including the Global Precipitation Measurement Profiling Algorithm (GPROF), the Precipitation Retrievals and Profiling Scheme (PRPS), the PERSIANN-Cloud Classification System (PERSIANN-CCS), the Combined Radar-Radiometer Algorithm (CORRA), and the Global Precipitation Climatology Project’s monthly satellite-gage (PCP-SG) [51,74]. IMERG provides three distinct products: “Early,” “Late,” and “Final.” These products are generated in several stages. Initially, the “Early-run” offers preliminary estimates approximately 4 hours after observation time (AOT). The “Late-run” follows, released roughly 12 hours AOT. Finally, the “Final-run” is made available after 2.5–3 months AOT, incorporating gage calibration [62,75].
Both the Early and Late-run IMERG products include climatological corrections, while the Final-run is calibrated using data from over 80,000 Global Precipitation Climate Center (GPCC) stations worldwide [45,46,74,76]. IMERG provides data at a half-hourly temporal resolution and a spatial resolution of 0.1° × 0.1°, which may vary depending on proximity to the equator. For this study, the IMERG-Final product Version 06 was employed, as Version 07 is still under development and not yet available for research purposes. IMERG data span from 2000 to the present and include three key precipitation fields: the calibrated “PrecipitationCal,” the uncalibrated “PrecipitationUncal,” and the microwave-based “HQprecipitation.” The PrecipitationUncal represents the raw multi-satellite precipitation estimate, while HQprecipitation is derived from merged microwave data. In this study, PrecipitationCal was used, which integrates both PrecipitationUncal and HQprecipitation and is calibrated using GPCC gages [51].
2.3. NOAA Station Data
The NOAA station database [19] serves as the reference for precipitation data in this study. The dataset consists of Annual Maximum Series (AMS) spanning durations from 5 minutes to 60 days, with records extending from the 1950s to the present [21,22]. While the NOAA station database includes over 16,000 stations across the conterminous United States (CONUS), only 2,360 stations with a complete 22-year record (2001–2022) were selected for validating the IMERG-derived Rainfall Anomaly Index (RAI). The NOAA station datasets are recognized as the authoritative AMS dataset and are widely recommended for meeting national standards [22,77]. Table 1 provides a comparison between the NOAA station data and the satellite-based IMERG data.
3. Methods
3.1. Computing Annual Maximum Series (AMS) from IMERG Data
The AMS for NOAA data is provided as daily annual maximum estimates [17,22]. In contrast, IMERG data is recorded in half-hour increments [65,70]. To compute the daily annual maximums from IMERG, 30-minute rainfall data was accumulated over 24-hour periods. The accumulation period spans from January 1 at 00:00 UTC to December 31 at 23:30 UTC for each year. The dataset covers the years 2000 to 2023, though the year 2000 was excluded due to incomplete records, as IMERG data is only available starting from June 3, 2000. The accumulated daily annual maximum for each year (2001 to 2022) was computed for all 2,360 stations. Figure 2 provides a visual representation of the methodology used to develop the AMS and model the RAI for both the estimated IMERG data and the NOAA station observations.
3.2. Calculating Rainfall Anomaly Index from both IMERG and NOAA Datasets
The Rainfall Anomaly Index (RAI), developed by Van Rooy in 1965, is a rank-based index used to measure drought by assigning magnitudes to negative (deficit) and positive (surplus) precipitation anomalies [27]. This index categorizes rainfall anomalies on a scale ranging from -3 (extremely dry) to +3 (extremely wet), with values assessed against a nine-classification scheme, as presented in Table 2. The mathematical formulation of the RAI is given in Equation 1:
In this equation, represents the daily maximum precipitation for year n (2001 to 2022), is the mean precipitation from the series of daily maximums, is the average of the 10 highest values in the series, and is the average of the 10 lowest values. ±3 is a standardization factor that limits the anomalies within the range of -3 to +3 through a unity-based scaling, ensuring an asymmetrical distribution. If the difference is positive, the index is multiplied by +3, and if negative, it is multiplied by -3.
The selection of the 10 lowest and 10 highest values to compute and is an arbitrary standard that has persisted for decades, though it remains unproven. While this work does not seek to explore this choice further, it identifies it as an area for potential method development in future research. Using Equation 1, the RAI was calculated for both IMERG and NOAA datasets across 2,360 stations, covering a 22-year period. Figure 2 provides a detailed summary of the workflow used in this study.
3.3. Evaluation Metrics
To evaluate the performance of the modeled IMERG RAI index against the RAI index derived from NOAA stations across the 2,360 stations in CONUS, six statistical metrics were applied: Pearson correlation coefficient (CC), percentage relative bias (PRB), root mean squared error (RMSE), Mean Bias Ratio (MBR), Nash-Sutcliffe Efficiency (NSE), and Kling-Gupta Efficiency (KGE) (refer to Table 3). Among these, PRB is particularly critical as it indicates the level of agreement between the IMERG and NOAA station RAI indices, specifically regarding the potential overestimation or underestimation of the IMERG RAI index. A bias close to zero signifies strong agreement, while a positive bias suggests overestimation, and a negative bias indicates underestimation. The mathematical expressions and units for each evaluation metric are presented in Table 3, where O denotes the observed RAI index values from NOAA stations over the years 2001 to 2022, and P represents the modeled IMERG RAI index.
4. Results and Discussions
4.1. Comparing Time Variability between IMERG and NOAA Station RAI Index
We compared the median temporal variability between the IMERG and NOAA station RAI indices across the 2,360 stations and presented the average median time using a boxplot (Figure 3). Overall, the IMERG RAI index aligned well with the NOAA RAI index, with a few exceptions in certain years. Specifically, in 2004, 2008, 2010, and 2021, the IMERG RAI index recorded a median value above 0, while the NOAA RAI index was below 0 for the same years. However, in 2022, both IMERG and NOAA RAI indices were above the 0 mark. These results indicate that IMERG demonstrates a notable capability in estimating extreme rainfall anomalies when compared to NOAA across the years considered. The pattern in Figure 3 also reveals an increasing trend in anomaly values from 2012 to 2022, when the values consistently rose above 0, in line with earlier studies conducted in North America.
In a previous study, [67] assessed the impact of seasonal rainfall and demonstrated that due to changing climate conditions, rainfall frequency and intensity increased between 2010 and 2018 across Europe, particularly in Italy [67]. A similar pattern is observed in Figure 3, where the anomalies suggest increasing rainfall depth in CONUS, particularly from 2010 through 2022. A related study by [68] highlighted how the warming global climate is driving changes in large-scale extreme precipitation in the mid-Atlantic and northern United States. That study linked extreme precipitation days to frequent tropical cyclones, strengthened high-pressure systems over the Atlantic, and atmospheric rivers. These findings, along with other related studies [2,12,30,78], support our observation that increasing rainfall depth and frequency are contributing to positively skewed anomalies across CONUS.
To further validate IMERG, we conducted a direct statistical comparison between the IMERG RAI index and NOAA station RAI index across the years 2001 to 2022 for all 2,360 stations (Table 4). The results showed an average CC of 0.94, an average PRB of -22.32%, an average RMSE of 0.96, an average MBR of 0.74, an average NSE of 0.80, and an average KGE of 0.52. These statistical outcomes suggest that IMERG demonstrates a strong potential in estimating extreme rainfall across the 2,360 stations in CONUS. The capability of IMERG to estimate extreme rainfall has been examined in earlier research [56,60,65,79]. For instance, Guo et al. (2023) evaluated various satellite precipitation products in southern China across short to long duration precipitation intervals and found that IMERG exhibited the least error and bias compared to station observations. Similarly, [80] assessed IMERG in China and concluded that the product reliably compared with authoritative station data.
The strong agreement between IMERG and NOAA stations in estimating extreme daily rainfall is not unexpected, as IMERG is calibrated using over 8,000 GPCC gaging stations contributed by member nations of the World Meteorological Organization [74,76,81]. This calibration enhances the suitability of IMERG satellite data for extreme rainfall studies, making it a viable alternative to station data.
4.2. Relationship between Rainfall Anomaly and Maximum Depth
The comparison between estimated rainfall anomalies from both IMERG and NOAA with station-based precipitation depth is essential to understand their relationships. Figure 4 presents the scatterplot illustrating the relationship between the RAI index estimates and daily rainfall depth (in mm). The correlation coefficient (CC) between the NOAA RAI index and station daily maximum rainfall depth is labeled R1, while the CC between the IMERG RAI index and station daily maximum rainfall depth is labeled R2. By aggregating values from 2,360 stations and comparing the two index products from IMERG and NOAA across the years 2001 to 2022, we can effectively assess these relationships over time. A moderately strong correlation is observed between the RAI index of NOAA (average CC ~0.40) and IMERG (average CC ~0.42) with station daily maximum rainfall depth. Both R1 and R2 show increasing trends from 2001 to 2022, indicating that the RAI index tends to rise in a positive direction as rainfall depth increases due to extreme rainfall events. This finding suggests that the RAI index may serve as a valuable indicator for precipitation-driven climate change studies, as supported by previous research [14,82,83].
In an earlier effort to assess the relationship between the RAI index and observed rainfall depth, [26] found that different rainfall anomaly indices behave similarly, skewing positively as rainfall depth increases but reversing as depth decreases. A similar pattern is observed with the RAI index in this study. Additionally, Figure 4 reveals that the scatterplot between the NOAA RAI index and station daily maximum rainfall depth displays more noise across the years compared to the IMERG RAI index. The relatively lower noise in the IMERG RAI index’s relationship with daily maximums could be attributed to the intensive calibration and sensor averaging applied to IMERG data. In contrast, NOAA weather stations, which are highly sensitive to local environmental factors—such as wind, elevation, and obstacles like trees or buildings—may introduce noise into their readings [51].
By further analyzing Figure 4, we substantiate earlier claims that the IMERG-derived RAI index could provide significant benefits for ungaged locations beyond CONUS. It could serve as a useful tool for farmers in predicting crop yield performance in response to fluctuating rainfall intensities and frequencies. Additionally, engineers can use it to better plan for future flood impacts [34,84,85,86], while city and town planners can leverage it for informed community development strategies [4,87,88,89].
4.3. Regional Attribution of IMERG Precipitation Anomalies
Assessing the performance of the IMERG RAI index in very dry and very wet climate regions in CONUS is a key objective of this study. Previous research [11,16] identified Nevada and Louisiana as the states with the lowest and highest average annual rainfall depths in CONUS, respectively. To evaluate IMERG’s capability to model the RAI index in these precipitation-contrasting states, 20 stations were selected from each state, and the RAI index was calculated using daily annual precipitation maxima from 2001 to 2022. The following subsections present detailed results and discuss their significance in terms of climate extremes and regional variability.
4.3.1. IMERG RAI Index Assessment in Nevada (Dry western CONUS)
Nevada is considered the driest state in CONUS, receiving the least average precipitation in terms of frequency, intensity, and humidity [90,91]. A previous study [90] investigating the effects of climate change on Nevada used a high-resolution Weather Forecasting Model with dynamic scaling and found that Nevada experiences low precipitation for most of the year. As such, Nevada was chosen to assess the IMERG RAI index. Figure 5 illustrates a strong relationship between the IMERG RAI index (in green) and the NOAA station RAI index (in red) across 20 selected stations. The IMERG RAI index performed exceptionally well, demonstrating consistency across the stations.
The statistical results presented in Table 5 show an average correlation coefficient (CC) of 0.95, an average percentage relative bias (PRB) of 20.71, an average root mean squared error (RMSE) of 0.91, an average mean bias ratio (MBR) of 0.82, an average Nash-Sutcliffe Efficiency (NSE) of 0.83, and an average Kling-Gupta Efficiency (KGE) of 0.29. The high CC indicates a strong correlation between the IMERG and NOAA RAI indices, while the MBR suggests a slight overall difference of 0.18 (18%) between the two datasets. Although the average KGE, which incorporates biases and variance, is relatively low due to the variability between the IMERG and NOAA RAI indices, the overall NSE suggests good performance of the IMERG RAI index.
Nevada experienced unusually high precipitation in 2010 [92], including an event where 8.05 inches of rain fell over several days before Christmas, leading to flooding and debris accumulation on roads [91,93,94,95]. Most stations in Nevada showed a positively skewed RAI index for both IMERG and NOAA station data (Figure 5), with other positively skewed indices occurring in different years depending on station location and the precipitation characteristics of those years. This assessment reinforces earlier research findings that satellite precipitation products have the capability to quantify rainfall anomalies at a broader spatial scale.
With increasing concerns about climate change, IMERG satellite precipitation data can provide critical insights for researchers and policymakers to effectively monitor and assess drought severity. By comparing current rainfall data to historical averages, early warning systems can be developed to support informed decision-making on water management strategies in drought-prone regions such as Nevada and Arizona. Furthermore, this approach can be extended beyond CONUS for drought monitoring in other parts of the world [24,59,97].
4.3.2. Evaluation of IMERG RAI Index in the High-Rainfall Region of Louisiana
Louisiana is renowned as one of the wettest states in CONUS, attributed to several climatic factors. The state’s subtropical climate features hot, long, and humid summers, and short winters. Located between the Gulf of Mexico and the flat plains of North America, Louisiana benefits from warm, moist air from the Gulf, which moderates the climate in its southern regions. Additionally, the presence of the Mississippi River, susceptibility to tropical cyclones [98], and two prominent rainy seasons—spring and fall—contribute to its high average annual rainfall depth of 57.05 inches, although this varies across the state [99,100]. Consequently, evaluating the IMERG RAI index in Louisiana is crucial for understanding the potential and limitations of IMERG precipitation data for extreme precipitation studies.
Figure 6 presents a comparison of the IMERG RAI index with the NOAA RAI index across 20 selected stations in Louisiana. The results indicate a strong agreement between IMERG and NOAA RAI indices across the years from 2001 to 2022 at each station. The average profiles of both indices are slightly above the zero mark. Statistical results, detailed in Table 6, show a mean correlation coefficient (CC) of 0.93, a mean percentage relative bias (PRB) of 24.82, a mean root mean squared error (RMSE) of 0.96, a mean bias ratio (MBR) of 0.79, a mean Nash-Sutcliffe Efficiency (NSE) of 0.80, and a mean Kling-Gupta Efficiency (KGE) of 0.18. These statistics suggest that IMERG performed well in modeling anomalies in the rainfall-rich state of Louisiana, consistent with previous studies demonstrating the potential of remote sensing precipitation capabilities to model extreme rainfall events [31,100].
The capability of IMERG to model extreme rainfall has been explored extensively in other parts of the world, revealing its potential for assessing precipitation-induced flood risks for infrastructure development [42,59,101,102,103]. However, there has been limited application of IMERG data to model extreme rainfall anomalies using dense gauge networks, such as the 2,360 stations across CONUS. Our assessment across varied climatic regions in CONUS demonstrates IMERG’s potential to detect extreme rainfall anomalies on a continental scale and beyond. We hope that this research will inspire further studies on extreme rainfall events using IMERG data, particularly in ungauged regions.
4.4. Spatial Evaluation and Hydrological Utility of IMERG RAI Index
The Rainfall Anomaly Index (RAI) derived from IMERG data for all 2,360 stations over a 22-year period was evaluated against the NOAA station-based RAI index. The statistical results for each station were mapped spatially to elucidate the spatial relationship between IMERG and NOAA RAI indices. Figure 7 presents the spatial statistics, which reveal a high correlation coefficient (CC) with an average value of ≥ 0.85. Although there is no distinct spatial trend in the distribution of CC, localized effects are observed at individual stations. The percentage relative bias (PRB) varies between -100% and 100% and does not exhibit a specific spatial pattern across CONUS. The root mean squared error (RMSE) is notably higher in the wetter eastern part of CONUS and the arid western regions, particularly in the desert areas of Nevada, Arizona, and parts of California. This finding is consistent with previous studies, which have shown that IMERG tends to underestimate observations in dry regions and overestimate in wet regions [34,56,65].
Earlier research by [56] assessed IMERG’s performance over the Tianshi region of China by comparing IMERG data with TRMM observations. This study found that IMERG not only outperformed TRMM but also had a tendency to underestimate rainfall in areas with scarce precipitation compared to regions with above-average rainfall [56]. Similarly, [80] observed that IMERG records lower bias during the winter season with low precipitation compared to the rainy seasons. Our findings align with these observations, revealing a similar pattern where biases from CC, PRB, RMSE, and MBR are lower in the dry western CONUS compared to the eastern part. It is noteworthy that precipitation increases from west to east across CONUS, with the west experiencing drier conditions and the east receiving more rainfall.
The examination of the hydrological utility of IMERG based on anomaly estimation, as presented in Figure 7, shows high Nash-Sutcliffe Efficiency (NSE) values (≥0.7) and average Kling-Gupta Efficiency (KGE) values (≥0). These high NSE and KGE estimates suggest that IMERG provides rainfall data comparable to station observations for modeling purposes. Therefore, IMERG can serve as a valuable precipitation source for regions lacking adequate rain gauge data, extending beyond CONUS. Previous studies have also affirmed the hydrological utility of IMERG. For instance, [60] evaluated IMERG satellite precipitation products in the Yellow River source region of China and found that IMERG data could drive hydrological models effectively, yielding an NSE value of 0.807 when compared with station model outputs. This is consistent with our findings, where the NSE range for IMERG RAI index compared to NOAA station RAI index falls between 0.7 and 0.9 in CONUS. Thus, IMERG can be considered a reliable data source for rainfall anomaly studies in CONUS and holds potential for application in regions beyond CONUS.
4.5. Trend in Rainfall Anomaly in CONUS and Climate Change Implications
The average Rainfall Anomaly Index (RAI) values, scaled to percentages, for all 2,360 stations across CONUS were calculated for visual examination and are presented in Figure 8. The average anomaly index does not reveal any significant patterns, as the averaging at each station tends to smooth out any spikes from the 22 years of anomaly estimates. However, a localized effect is observed, with stations in central CONUS showing average anomalies below the 0-percentage mark, while a few stations exhibit average anomalies above this threshold. The eastern part of CONUS, particularly the northeast, is prone to increased precipitation, whereas the southwest generally experiences drier conditions [11]. Consequently, the anomaly index is not uniformly positively skewed, except in instances of intense precipitation events, such as the floods of 2007 and 2019 in the Midwest [104,105]. However, in dry regions, the anomaly index can spike positively in response to unexpectedly intense precipitation.
Regarding climate change and its impact on anomalous rainfall throughout CONUS, [104] employed five rainfall projection models to demonstrate that future rainfall is expected to increase in both frequency and intensity, exhibiting positively skewed variability in total annual precipitation. Specifically, the rainfall intensity in the eastern part of CONUS is projected to increase progressively more than in the western CONUS, where projections indicate the opposite trend [104]. Given the growing number of models, IMERG could prove valuable for future studies aiming to model projected rainfall for probabilistic flood event scenarios across CONUS and beyond. This work aims to inspire further research into utilizing IMERG data for projecting or probabilistic extreme precipitation events, similar to past studies [34,106].
4.6. IMERG Precipitation Extractor (IPE) and Uncertainties in IMERG Data
This section introduces the IMERG Precipitation Extractor (IPE), a web application developed to facilitate the extraction and analysis of precipitation data from IMERG. This is necessary to guide users of IPE and help first term users of IMERG data get acquitted with the web application and the data and create awareness regarding uncertainties in IMERG data.
4.6.1. IMERG Precipitation Extractor (IPE): History, Potentials, and Use Cases
The IMERG precipitation extractor (IPE) was developed by Dr. Keneth Ekpetere, under the supervision of Dr. Amita V. Mahta during the 2023 NASA-GPM mentorship program. The development of IPE responded to a growing demand among researchers and academic communities for a user-friendly, efficient web tool to download precipitation data. Initially intended for visualizing and downloading time-series precipitation data for specific points and areas, the tool was later enhanced to include functionalities for computing the Rainfall Anomaly Index (RAI) and tracking storms, thus addressing broader climate change monitoring needs.
The IPE offers numerous functionalities that are particularly noteworthy. It provides global coverage, extending beyond CONUS, and allows users to filter time-series precipitation data at both point and polygon/area levels. Users can specify a date range for data extraction, visualize the data as either a time-series plot or a map (derived from the time-series average), and download the data in CSV format or as a TIFF file for GIS applications. Figure 9 illustrates the IPE interface, demonstrating its use to visualize precipitation in Nigeria during the rainy season from June 2, 2007, to August 30, 2007.
Additional features of the IPE include on-the-fly conversion of half-hourly data into various longer durations (1-hour, 2-hour, 3-hour, 6-hour, 12-hour, 24-hour, and 1-week), providing users with flexible temporal resolution options. Users can digitize points or polygons for data extraction or use built-in gauges from USGS (for CONUS) or the Global Historical Climatology Network (GHCN) from NOAA. The application also integrates fine-resolution watershed boundaries from HYDROSHARE, facilitating watershed-specific precipitation extraction and allowing downloads at the country scale.
For climate change monitoring, the IPE includes functions for visualizing and tracking storm events through their stages of initiation, formation, movement, and dissipation. Storm movement can be exported as a Graphics Interchange Format (GIF) file for playback or further analysis. Figure 10 demonstrates the IPE’s application in tracking storms that caused significant flooding in Nigeria during 2012–2013 [107]. The monthly rainfall anomaly index for this area, computed using the IPE’s built-in anomaly index calculator, is presented in Figure 11.
We encourage further testing of the IPE beyond the scope of this study, aiming to advance research in precipitation extremes, climate change anomaly studies, and storm behavior analysis. The IPE is publicly accessible at https://cartoviews.users.earthengine.app/view/ipe, and we hope it will be a valuable resource for the scientific community.
4.6.2. Possibilities, Limitations, and Uncertainties in IMERG Data
The IMERG data offers significant opportunities for advancing precipitation research. Its most notable advantage is its global coverage [74], which enables researchers to conduct comprehensive regional to global precipitation analyses. The extensive IMERG datasets support critical observations and findings with broad implications. Since its introduction, IMERG has alleviated issues related to data scarcity that were prevalent before the early 2000s [37,38]. Additionally, IMERG integrates multiple satellite precipitation products and is highly calibrated with global gauge networks, making it a valuable resource for rainfall studies [46,108,109]. Furthermore, IMERG is freely accessible, removing financial barriers that could otherwise hinder research.
However, IMERG data also presents certain limitations. One significant drawback is its relatively short record length, with just over 20 years of data. This constraint poses challenges for researchers requiring extended precipitation records for multi-decade global analysis [110,111]. Although IMERG began in February 2014, it incorporated data from TRMM starting in 2020, resulting in a continuous record extending from 2000 to the present. Nonetheless, the integration of earlier TRMM data into IMERG has been a point of contention among researchers [76,103].
Like other satellite precipitation products, IMERG is subject to uncertainties. Its spatial resolution of 0.1° x 0.1° (~11 km near the tropics) can be inadequate for modeling precipitation over small areas, where a few pixels may encompass the entire region. Additionally, the half-hourly temporal resolution may not capture short-duration, high-intensity rainfall events effectively. The reliance on multiple satellite sources with varying resolutions also raises concerns, particularly for users unfamiliar with the data fusion algorithms [45,59,62,112]. Despite these challenges, IMERG has demonstrated itself as a reliable tool for advanced precipitation research [51,103].
5. Summary and Conclusions
This research significantly advances the field by developing the IMERG Precipitation Extractor (IPE), a web application designed for querying, visualizing, and downloading time series remote sensing precipitation data. The IPE supports various temporal resolutions (0.5-hour, 1-hour, 2-hour, 3-hour, 6-hour, 12-hour, 24-hour, and 1-week) and offers functionality for points, watersheds, country extents, and user-defined areas on a global scale. Users can track storms through their stages—initiation, formation, mobility, and dissipation—and download storm videos in Graphics Interchange Format (GIF) for further analysis. Additionally, the IPE facilitates the calculation of rainfall anomalies, with the results available for download as CSV files.
A second major contribution of this research is the evaluation of the IMERG-derived Rainfall Anomaly Index (RAI) against the NOAA station RAI index using data from 2,360 dense gauge networks in the conterminous United States. This study is the first to utilize such a large number of stations for a nationwide analysis, thereby enhancing validity and reducing uncertainties associated with sparse station networks. The assessment involved comparing IMERG RAI indices across various regions, specifically contrasting 20 stations from Nevada (a dry region) and 20 from Louisiana (a wet region), as well as examining the performance of the IMERG RAI index annually from 2001 to 2022.
The study also compared the spatial trends of the computed RAI indices from IMERG data with climate change studies focused on precipitation anomalies in CONUS. Several key findings emerged:
- (1)
- The IPE web application proves to be an effective tool for rapid precipitation data extraction, visualization, and download at multiple durations globally. It offers functionality for tracking and downloading storm signatures and calculating and downloading anomaly data for specific areas of interest.
- (2)
- The IMERG RAI index demonstrates strong agreement with the NOAA station RAI index. Analysis of data from 2,360 stations reveals an average correlation coefficient (CC) of 0.94, a percent residual bias (PRB) of -22.32%, a root mean square error (RMSE) of 0.96, a mean bias ratio (MBR) of 0.74, a Nash-Sutcliffe efficiency (NSE) of 0.80, and a Kling-Gupta efficiency (KGE) of 0.52. Furthermore, the IMERG RAI index shows a positive correlation with daily annual maximum precipitation depths, with an average CC of 0.42 across the years.
- (3)
- Regional assessments indicate that the IMERG RAI index shows an average CC of 0.95, PRB of 20.71%, RMSE of 0.91, MBR of 0.82, NSE of 0.83, and KGE of 0.29 in the arid western CONUS (Nevada). In contrast, in Louisiana, the wettest state, the statistics are similar with a mean CC of 0.93, PRB of 24.82%, RMSE of 0.96, MBR of 0.79, NSE of 0.80, and KGE of 0.18.
- (4)
- Across CONUS, from west to east, the IMERG RAI index shows good agreement with the station RAI index. Additionally, median RAI indices from both IMERG and NOAA reveal increasing rainfall intensity and frequency since 2010, highlighting climate change issues that have garnered attention in recent years.
This study thoroughly evaluates the performance of IMERG remote sensing precipitation data in modeling rainfall anomalies, underscoring its potential as a valuable resource for climate change research and investigations. While IMERG shows strong agreement with station observations across CONUS, attributed to its high gauge-based calibration, users should remain cautious and perform regional evaluations to identify potential biases. Previous studies, including those discussed here, indicate that IMERG may underestimate precipitation in low-rainfall regions and overestimate it in high-rainfall areas. It is anticipated that the IPE web application will benefit a wide range of users, including hydrologists, engineers, scientists, researchers, universities, government agencies, and private individuals, by providing valuable insights into precipitation anomalies and climate change.
Acknowledgments
This work was supported by the National Science Foundation under the Kansas NSF-EPSCoR, award number OIA-2148878.
Code: data, web application, and use case: Code and data: https://github.com/Kennethekpetere/Modified-Rainfall-Anomaly-Index; IPE web application: https://cartoviews.users.earthengine.app/view/ipe; IPE use case: https://youtu.be/PGUeC2h_fbU.
References
- Gil-Alana, L.A.; Gupta, R.; Sauci, L.; Carmona-González, N. Temperature and Precipitation in the US States: Long Memory, Persistence, and Time Trend. Theor Appl Climatol 2022, 150, 1731–1744. [Google Scholar] [CrossRef] [PubMed]
- Huang, H.; Patricola, C.M.; Winter, J.M.; Osterberg, E.C.; Mankin, J.S. Rise in Northeast US Extreme Precipitation Caused by Atlantic Variability and Climate Change. Weather and Climate Extremes 2021, 33, 100351. [Google Scholar] [CrossRef]
- Adeel, Z.; Bakkensen, L.; Cabrera-Rivera, O.; Franco, E.; Garfin, G.M.; McPherson, R.A.; Méndez, K.; Wen, X. Challenges in and Opportunities for International Collaboration: Costing Flood Damages and Losses across Canada, Mexico, and the United States. 2023. [Google Scholar] [CrossRef]
- Ahn, J.; Cho, W.; Kim, T.; Shin, H.; Heo, J.-H. Flood Frequency Analysis for the Annual Peak Flows Simulated by an Event-Based Rainfall-Runoff Model in an Urban Drainage Basin. Water 2014, 6, 3841–3863. [Google Scholar] [CrossRef]
- Bathrellos, G.D.; Karymbalis, E.; Skilodimou, H.D.; Gaki-Papanastassiou, K.; Baltas, E.A. Urban Flood Hazard Assessment in the Basin of Athens Metropolitan City, Greece. Environ Earth Sci 2016, 75, 319. [Google Scholar] [CrossRef]
- Corringham, T.W.; McCarthy, J.; Shulgina, T.; Gershunov, A.; Cayan, D.R.; Ralph, F.M. Climate Change Contributions to Future Atmospheric River Flood Damages in the Western United States. Sci Rep 2022, 12, 13747. [Google Scholar] [CrossRef]
- Devitt, L.; Neal, J.; Wagener, T.; Coxon, G. Uncertainty in the Extreme Flood Magnitude Estimates of Large-Scale Flood Hazard Models. Environ. Res. Lett. 2021, 16, 064013. [Google Scholar] [CrossRef]
- Gabriels, K.; Willems, P.; Van Orshoven, J. A Comparative Flood Damage and Risk Impact Assessment of Land Use Changes. Natural Hazards and Earth System Sciences 2022, 22, 395–410. [Google Scholar] [CrossRef]
- Quinn, N.; Bates, P.D.; Neal, J.; Smith, A.; Wing, O.; Sampson, C.; Smith, J.; Heffernan, J. The Spatial Dependence of Flood Hazard and Risk in the United States. Water Resources Research 2019, 55, 1890–1911. [Google Scholar] [CrossRef]
- Ekpetere, K.; Ekeh, F.; Ofodum, N. Impact of Abattoir Wastes on Groundwater Quality in the Fct, Abuja-Nigeria: A Case Study of Gwagwalada Satellite Town. 2019, 9, 90. [Google Scholar] [CrossRef]
- Armal, S.; Khanbilvardi, R. Anomalies in the US Precipitation Extremes and Their Association with Different Modes of Climate Variability. Hydrological Sciences Journal 2019, 64, 1605–1615. [Google Scholar] [CrossRef]
- Córdova, M.; Célleri, R.; van Delden, A. Dynamics of Precipitation Anomalies in Tropical South America. Atmosphere 2022, 13, 972. [Google Scholar] [CrossRef]
- Baratto, J.; de Bodas Terassi, P.M.; de Beserra de Lima, N.G.; Galvani, E. Precipitation Anomalies and Trends Estimated via Satellite Rainfall Products in the Cananeia–Iguape Coastal System, Southeast Region of Brazil. Climate 2024, 12, 22. [Google Scholar] [CrossRef]
- Xu, Y.; Zhao, Y.; Wu, Y.; Gao, C. Change Patterns of Precipitation Anomalies and Possible Teleconnections with Large-Scale Climate Oscillations over the Yangtze River Delta, China. Journal of Water and Climate Change 2022, 13, 2972–2990. [Google Scholar] [CrossRef]
- Yu, L.; Zhong, S.; Pei, L.; Bian, X.; Heilman, W.E. Contribution of Large-Scale Circulation Anomalies to Changes in Extreme Precipitation Frequency in the United States. Environ. Res. Lett. 2016, 11, 044003. [Google Scholar] [CrossRef]
- Singh, J.; Karmakar, S.; PaiMazumder, D.; Ghosh, S.; Niyogi, D. Urbanization Alters Rainfall Extremes over the Contiguous United States. Environ. Res. Lett. 2020, 15, 074033. [Google Scholar] [CrossRef]
- Bonnin; Martin; Lin; Parzybok; Yekta; Riley Precipitation-Frequency Atlas of the United States. 2006.
- Miller; Frederick; Tracey Precipitation-Frequency Atlas of the Western United States. 1973.
- NOAA NOAA Atlas 14 Time Series Data of Annual Maximum Precipitation. 2017.
- Perica, S.; Lin, B.; Martin, D.; Martin, F.; Brewer, D.; Trypaluk, C.; Yekta, M.; Hiner, L.; Heim, S.; Dietz, S.; et al. NOAA Atlas 14 Precipitation-Frequency Atlas of the United States. 2011, 5. [Google Scholar]
- NOAA-OWP NOAA ATLAS 15: Update to the National Precipitation Frequency Standard 2022.
- Perica, S.; Martin, D.; Pavlovic, S.; Roy, I.; St. Laurent, M.; Trypaluk, C.; Unruh, D.; Yekta, M.; Bonnin, G. Precipitation-Frequency Atlas of the United States 2013.
- Palmer, W. Meteorological Drought. Research Paper No. 45, 1965, 58 p. 2006, 1–65.
- Vicente-Serrano, S.M.; Beguería, S.; López-Moreno, J.I. A Multiscalar Drought Index Sensitive to Global Warming: The Standardized Precipitation Evapotranspiration Index. 2010. [Google Scholar] [CrossRef]
- Mckee, T.; Doesken, N.; Kleist, J. The Relationship of Drought Frequency and Duration to Time Scales. 1993. [Google Scholar]
- Raziei, T. Revisiting the Rainfall Anomaly Index to Serve as a Simplified Standardized Precipitation Index. Journal of Hydrology 2021, 602, 126761. [Google Scholar] [CrossRef]
- Van-rooy, M.P. A Rainfall Anomaly Index (RAI), Independent of the Time and Space, 1965.
- Costa, J.; Rodrigues, G. Space-Time Distribution of Rainfall Anomaly Index (RAI) for the Salgado Basin, Ceará State - Brazil. Ciência e Natura 2017, 39, 627. [Google Scholar] [CrossRef]
- Koudahe, K.; Kayode, A.J.; Samson, A.O.; Adebola, A.A.; Djaman, K. Trend Analysis in Standardized Precipitation Index and Standardized Anomaly Index in the Context of Climate Change in Southern Togo. Atmospheric and Climate Sciences 2017, 7, 401–423. [Google Scholar] [CrossRef]
- Arias, P.A.; Fu, R.; Mo, K.C. Decadal Variation of Rainfall Seasonality in the North American Monsoon Region and Its Potential Causes. Journal of Climate 2012, 25, 4258–4274. [Google Scholar] [CrossRef]
- Gu, L.; Yin, J.; Gentine, P.; Wang, H.-M.; Slater, L.J.; Sullivan, S.C.; Chen, J.; Zscheischler, J.; Guo, S. Large Anomalies in Future Extreme Precipitation Sensitivity Driven by Atmospheric Dynamics. Nat Commun 2023, 14, 3197. [Google Scholar] [CrossRef] [PubMed]
- Lau, A.; Behrangi, A. Understanding Intensity–Duration–Frequency (IDF) Curves Using IMERG Sub-Hourly Precipitation against Dense Gauge Networks. Remote Sensing 2022, 14, 5032. [Google Scholar] [CrossRef]
- Noor, M.; Ismail, T.; Shahid, S.; Asaduzzaman, M.; Dewan, A. Evaluating Intensity-Duration-Frequency (IDF) Curves of Satellite-Based Precipitation Datasets in Peninsular Malaysia. Atmospheric Research 2021, 248, 105203. [Google Scholar] [CrossRef]
- Ekpetere, K. Assessment of the PMPs and Design Storms Estimated from the IMERG Satellite Precipitation Data. Ph.D., University of Kansas: United States -- Kansas, 2024.
- Alamri, N.; Subyani, A. Generation of Rainfall Intensity Duration Frequency (IDF) Curves for Ungauged Sites in Arid Region. Earth Systems and Environment 2017, 1, 8. [Google Scholar] [CrossRef]
- De Paola, F.; Giugni, M.; Topa, M.E.; Bucchignani, E. Intensity-Duration-Frequency (IDF) Rainfall Curves, for Data Series and Climate Projection in African Cities. SpringerPlus 2014, 3, 133. [Google Scholar] [CrossRef] [PubMed]
- Duque-Gardeazabal, N.; Rodríguez, E.A. Improving Rainfall Fields in Data-Scarce Basins: Influence of the Kernel Bandwidth Value of Merging on Hydrometeorological Modeling. Journal of Hydrologic Engineering 2023, 28, 04023017. [Google Scholar] [CrossRef]
- Kim, D.-E.; Gourbesville, P.; Liong, S.-Y. Overcoming Data Scarcity in Flood Hazard Assessment Using Remote Sensing and Artificial Neural Network. Smart Water 2019, 4, 2. [Google Scholar] [CrossRef]
- Tan, M.L.; Yang, X. Effect of Rainfall Station Density, Distribution and Missing Values on SWAT Outputs in Tropical Region. Journal of Hydrology 2020, 584, 124660. [Google Scholar] [CrossRef]
- Willems, P. Stochastic Generation of Spatial Rainfall for Urban Drainage Areas. Water Science and Technology 1999, 39, 23–30. [Google Scholar] [CrossRef]
- Willems, P. Compound Intensity/Duration/Frequency-Relationships of Extreme Precipitation for Two Seasons and Two Storm Types. Journal of Hydrology 2000, 233, 189–205. [Google Scholar] [CrossRef]
- Ekpetere, K.; Abdelkader, M.; Ishaya, S.; Makwe, E.; Ekpetere, P. Integrating Satellite Imagery and Ground-Based Measurements with a Machine Learning Model for Monitoring Lake Dynamics over a Semi-Arid Region. Hydrology 2023, 10, 78. [Google Scholar] [CrossRef]
- Chen, J.; Liao, J.; Lou, Y.; Ma, S.; Shen, G.; Zhang, L. High-Resolution Datasets for Lake Level Changes in the Qinghai-Tibetan Plateau from 2002 to 2021 Using Multi-Altimeter Data. Earth System Science Data Discussions 2022, 1–18. [Google Scholar] [CrossRef]
- Gu, H.; Ma, Z.; Li, M. Effect of a Large and Very Shallow Lake on Local Summer Precipitation over the Lake Taihu Basin in China. Journal of Geophysical Research: Atmospheres 2016, 121, 8832–8848. [Google Scholar] [CrossRef]
- Pradhan, R.K.; Markonis, Y.; Vargas Godoy, M.R.; Villalba-Pradas, A.; Andreadis, K.M.; Nikolopoulos, E.I.; Papalexiou, S.M.; Rahim, A.; Tapiador, F.J.; Hanel, M. Review of GPM IMERG Performance: A Global Perspective. Remote Sensing of Environment 2022, 268, 112754. [Google Scholar] [CrossRef]
- Schamm, K.; Ziese, M.; Becker, A.; Finger, P.; Meyer-Christoffer, A.; Schneider, U.; Schröder, M.; Stender, P. Global Gridded Precipitation over Land: A Description of the New GPCC First Guess Daily Product. Earth System Science Data 2014, 6, 49–60. [Google Scholar] [CrossRef]
- Zhao, G.; Li, Y.; Zhou, L.; Gao, H. Evaporative Water Loss of 1.42 Million Global Lakes. Nat Commun 2022, 13, 3686. [Google Scholar] [CrossRef]
- Kasi, V.; Rathinasamy, M.; Jarajapu, D. Framework for Developing IDF Curves Using Satellite Precipitation: A Case Study Using GPM-IMERG V6 Data. Earth Science Informatics 2022, 15, 1–17. [Google Scholar] [CrossRef]
- Mab, P.; Ly, S.; Chompuchan, C.; Kositsakulchai, E. Evaluation of Satellite Precipitation from Google Earth Engine in Tonle Sap Basin, Cambodia, 2019.
- Aksu, H.; Taflan, G.Y.; Yaldiz, S.G.; Akgül, M.A. Evaluation of IMERG for GPM Satellite-Based Precipitation Products for Extreme Precipitation Indices over Turkiye. Atmospheric Research 2023, 291, 106826. [Google Scholar] [CrossRef]
- Huffman Algorithm Theoretical Basis Document (ATBD) Version 06 of NASA Global Precipitation Measurement (GPM) Integrated Multi-satellitE Retrievals for GPM (IMERG) 2020.
- Ning, S.; Song, F.; Udmale, P.; Jin, J.; Thapa, B.R.; Ishidaira, H. Error Analysis and Evaluation of the Latest GSMap and IMERG Precipitation Products over Eastern China. Advances in Meteorology 2017, 2017, e1803492. [Google Scholar] [CrossRef]
- Pucknell, S.; Kjeldsen, T.; Haxton, T.; Jeans, J.; Young, A. Estimating the Probable Maximum Flood in UK Catchments Using the ReFH Model. Dams and Reservoirs 2020, 30, 85–90. [Google Scholar] [CrossRef]
- Anjum, M.N.; Ding, Y.; Shangguan, D.; Ahmad, I.; Ijaz, M.W.; Farid, H.U.; Yagoub, Y.E.; Zaman, M.; Adnan, M. Performance Evaluation of Latest Integrated Multi-Satellite Retrievals for Global Precipitation Measurement (IMERG) over the Northern Highlands of Pakistan. Atmospheric Research 2018, 205, 134–146. [Google Scholar] [CrossRef]
- Dehaghani, A.M.; Gohari, A.; Zareian, M.J.; Torabi Haghighi, A. A Comprehensive Evaluation of the Satellite Precipitation Products across Iran. Journal of Hydrology: Regional Studies 2023, 46, 101360. [Google Scholar] [CrossRef]
- Min Yang; Zhongqin Li; Muhammad Naveed Anjum; Yayu Gao Performance Evaluation of Version 5 (V05) of Integrated Multi-Satellite Retrievals for Global Precipitation Measurement (IMERG) over the Tianshan Mountains of China. Water 2019, 11, 1139. [CrossRef]
- Wang, J.; Petersen, W.A.; Wolff, D.B. Validation of Satellite-Based Precipitation Products from TRMM to GPM. Remote Sensing 2021, 13, 1745. [Google Scholar] [CrossRef]
- Wang, Y.; Miao, C.; Zhao, X.; Zhang, Q.; Su, J. Evaluation of the GPM IMERG Product at the Hourly Timescale over China. Atmospheric Research 2023, 285, 106656. [Google Scholar] [CrossRef]
- Weng, P.; Tian, Y.; Jiang, Y.; Chen, D.; Kang, J. Assessment of GPM IMERG and GSMaP Daily Precipitation Products and Their Utility in Droughts and Floods Monitoring across Xijiang River Basin. Atmospheric Research 2023, 286, 106673. [Google Scholar] [CrossRef]
- Yuan, F.; Wang, B.; Shi, C.; Cui, W.; Zhao, C.; Liu, Y.; Ren, L.; Zhang, L.; Zhu, Y.; Chen, T.; et al. Evaluation of Hydrological Utility of IMERG Final Run V05 and TMPA 3B42V7 Satellite Precipitation Products in the Yellow River Source Region, China. Journal of Hydrology 2018, 567, 696–711. [Google Scholar] [CrossRef]
- Zhao, H.; Yang, B.; Yang, S.; Huang, Y.; Dong, G.; Bai, J.; Wang, Z. Systematical Estimation of GPM-Based Global Satellite Mapping of Precipitation Products over China. Atmospheric Research 2018, 201, 206–217. [Google Scholar] [CrossRef]
- Zhou, Z.; Lu, D.; Yong, B.; Shen, Z.; Wu, H.; Yu, L. Evaluation of GPM-IMERG Precipitation Product at Multiple Spatial and Sub-Daily Temporal Scales over Mainland China. Remote Sensing 2023, 15, 1237. [Google Scholar] [CrossRef]
- Peinó, E.; Bech, J.; Udina, M. Dependence of GPM IMERG Products on Precipitation Intensity in Catalonia; Copernicus Meetings, 2023. [Google Scholar]
- Sathianarayanan, M.; Hsu, P.-H. SPATIAL DOWNSCALING OF GPM IMERG V06 GRIDDED PRECIPITATION USING MACHINE LEARNING ALGORITHMS. Int. Arch. Photogramm. Remote Sens. Spatial Inf. Sci. 2023, XLVIII-4/W6-2022, 327–332. [Google Scholar] [CrossRef]
- Tang, S.; Li, R.; He, J.; Wang, H.; Fan, X.; Yao, S. Comparative Evaluation of the GPM IMERG Early, Late, and Final Hourly Precipitation Products Using the CMPA Data over Sichuan Basin of China. Available online: https://doaj.org (accessed on 12 February 2021).
- Xin, Y.; Yang, Y.; Chen, X.; Yue, X.; Liu, Y.; Yin, C. Evaluation of IMERG and ERA5 Precipitation Products over the Mongolian Plateau. Sci Rep 2022, 12, 21776. [Google Scholar] [CrossRef] [PubMed]
- Nasta, P.; Allocca, C.; Deidda, R.; Romano, N. Assessing the Impact of Seasonal-Rainfall Anomalies on Catchment-Scale Water Balance Components. Hydrology and Earth System Sciences 2020, 24, 3211–3227. [Google Scholar] [CrossRef]
- Henny, L.; Thorncroft, C.D.; Bosart, L.F. Changes in Seasonal Large-Scale Extreme Precipitation in the Mid-Atlantic and Northeast United States, 1979–2019. 2023. [Google Scholar] [CrossRef]
- Le, P.V.V.; Randerson, J.T.; Willett, R.; Wright, S.; Smyth, P.; Guilloteau, C.; Mamalakis, A.; Foufoula-Georgiou, E. Climate-Driven Changes in the Predictability of Seasonal Precipitation. Nat Commun 2023, 14, 3822. [Google Scholar] [CrossRef]
- Da Silva, N.A.; Webber, B.G.M.; Matthews, A.J.; Feist, M.M.; Stein, T.H.M.; Holloway, C.E.; Abdullah, M.F.A.B. Validation of GPM IMERG Extreme Precipitation in the Maritime Continent by Station and Radar Data. Earth and Space Science 2021, 8, e2021EA001738. [Google Scholar] [CrossRef]
- Tan, M.L.; Santo, H. Comparison of GPM IMERG, TMPA 3B42 and PERSIANN-CDR Satellite Precipitation Products over Malaysia. Atmospheric Research 2018, 202, 63–76. [Google Scholar] [CrossRef]
- NWS, N. HDSC PMP Documents. Available online: https://www.weather.gov/owp/hdsc_pmp (accessed on 22 June 2022).
- NOAA; National Ocean Service; National Geodetic Survey NOAA Guidance Document for Determination of Vertical Land Motion at Water Level Stations Using GPS Technology 2015.
- Huffman; Bolvin, D.T.; Nelkin, E.J.; Wolff, D.B.; Adler, R.F.; Gu, G.; Hong, Y.; Bowman, K.P.; Stocker, E.F. The TRMM Multisatellite Precipitation Analysis (TMPA): Quasi-Global, Multiyear, Combined-Sensor Precipitation Estimates at Fine Scales. Journal of Hydrometeorology 2007, 8, 38–55. [Google Scholar] [CrossRef]
- Dekai Lu; Bin Yong Evaluation and Hydrological Utility of the Latest GPM IMERG V5 and GSMaP V7 Precipitation Products over the Tibetan Plateau. Remote Sensing 2018, 10, 2022. [CrossRef]
- Gebregiorgis, A.S.; Kirstetter, P.-E.; Hong, Y.E.; Gourley, J.J.; Huffman, G.J.; Petersen, W.A.; Xue, X.; Schwaller, M.R. To What Extent Is the Day 1 GPM IMERG Satellite Precipitation Estimate Improved as Compared to TRMM TMPA-RT? Journal of Geophysical Research: Atmospheres 2018, 123, 1694–1707. [Google Scholar] [CrossRef]
- Gao, P.; Carbone, G.J.; Lu, J.; Guo, D. An Area-Based Approach for Estimating Extreme Precipitation Probability. Geographical Analysis 2018, 50, 314–333. [Google Scholar] [CrossRef]
- Wang, S.; Zuo, H.; Yin, Y.; Hu, C.; Yin, J.; Ma, X.; Wang, J. Interpreting Rainfall Anomalies Using Rainfall’s Nonnegative Nature. Geophysical Research Letters 2019, 46, 426–434. [Google Scholar] [CrossRef]
- Guo, B.; Xu, T.; Yang, Q.; Zhang, J.; Dai, Z.; Deng, Y.; Zou, J. Multiple Spatial and Temporal Scales Evaluation of Eight Satellite Precipitation Products in a Mountainous Catchment of South China. Remote Sensing 2023, 15, 1373. [Google Scholar] [CrossRef]
- Guo; Chen, S.; Bao, A.; Behrangi, A.; Hong, Y.; Ndayisaba, F.; Hu, J.; Stepanian, P.M. Early Assessment of Integrated Multi-Satellite Retrievals for Global Precipitation Measurement over China. Atmospheric Research 2016, 176–177, 121–133. [Google Scholar] [CrossRef]
- Huff, F.A. Time Distribution of Rainfall in Heavy Storms. Water Resources Research 1967, 3, 1007–1019. [Google Scholar] [CrossRef]
- Stavish, M. Using Standard Anomaly and Ensemble Data to Support Forecast Confidence of an Extreme Wind Event in the Pacific Northwest on December 14th-15th 2006. 2007. [Google Scholar]
- Zaveri, E.; Russ, J.; Damania, R. Rainfall Anomalies Are a Significant Driver of Cropland Expansion. Proceedings of the National Academy of Sciences 2020, 117, 10225–10233. [Google Scholar] [CrossRef]
- LaRocque, A. Probable Maximum Flood (PMF). In Encyclopedia of Natural Hazards; Bobrowsky, P.T., Ed.; Springer Netherlands: Dordrecht, 2013; pp. 777–778. ISBN 978-1-4020-4399-4. [Google Scholar]
- VDCR Probable Maximum Precipitation Study and Evaluation Tool (Virginia Department of Conservation and Recreation). Available online: https://www.dcr.virginia.gov/dam-safety-and-floodplains/pmp-tool (accessed on 1 November 2021).
- Zischg, A.P.; Felder, G.; Weingartner, R.; Quinn, N.; Coxon, G.; Neal, J.; Freer, J.; Bates, P. Effects of Variability in Probable Maximum Precipitation Patterns on Flood Losses. Hydrology and Earth System Sciences 2018, 22, 2759–2773. [Google Scholar] [CrossRef]
- Boota, M.W.; Nabi, G.; Abbas, T.; Yaseen, M.; Faisal, M.; Azam, M.I. ESTIMATION OF PROBABLE MAXIMUM FLOOD (PMF): A CASE STUDY OF POTHWAR REGION, PAKISTAN. 2015, 5. [Google Scholar]
- Fashae, O.; Jolaade, O.; OLUSOLA, A. An Assessment of Digital Elevation Model for Geospatial Studies: A Case Study of Alawa Town, Niger State, Nigeria. Ife Research Publications in Geography 2017, 15, 31–51. [Google Scholar]
- Trinh, T.; Diaz, A.; Iseri, Y.; Snider, E.; Anderson, M.L.; Carr, K.J.; Kavvas, M.L. A Numerical Coupled Atmospheric–Hydrologic Modeling System for Probable Maximum Flood Estimation with Application to California’s Southern Sierra Nevada Foothills Watersheds. Journal of Flood Risk Management 2022, n/a, e12809. [Google Scholar] [CrossRef]
- Pan, L.-L.; Chen, S.-H.; Cayan, D.; Lin, M.-Y.; Hart, Q.; Zhang, M.-H.; Liu, Y.; Wang, J. Influences of Climate Change on California and Nevada Regions Revealed by a High-Resolution Dynamical Downscaling Study. Clim Dyn 2011, 37, 2005–2020. [Google Scholar] [CrossRef]
- Yu, Z.; Jiang, P.; Gautam, M.R.; Zhang, Y.; Acharya, K. Changes of Seasonal Storm Properties in California and Nevada from an Ensemble of Climate Projections. Journal of Geophysical Research: Atmospheres 2015, 120, 2676–2688. [Google Scholar] [CrossRef]
- Hoell, A.; Quan, X.-W.; Hoerling, M.; Diaz, H.F.; Fu, R.; He, C.; Lisonbee, J.R.; Mankin, J.S.; Seager, R.; Sheffield, A.; et al. Water Year 2021 Compound Precipitation and Temperature Extremes in California and Nevada. Bulletin of the American Meteorological Society 2022, 103, E2905–E2911. [Google Scholar] [CrossRef]
- Byrne, S.M.; Merrifield, M.A.; Carter, M.L.; Cayan, D.R.; Flick, R.E.; Gershunov, A.; Giddings, S.N. Southern California Winter Precipitation Variability Reflected in 100-Year Ocean Salinity Record. Commun Earth Environ 2023, 4, 1–9. [Google Scholar] [CrossRef]
- Hoell, A.; Quan, X.-W.; Hoerling, M.; Diaz, H.F.; Fu, R.; He, C.; Lisonbee, J.R.; Mankin, J.S.; Seager, R.; Sheffield, A.; et al. Water Year 2021 Compound Precipitation and Temperature Extremes in California and Nevada. 2022. [Google Scholar] [CrossRef]
- Hu, F.; Zhang, L.; Liu, Q.; Chyi, D. Environmental Factors Controlling the Precipitation in California. Atmosphere 2021, 12, 997. [Google Scholar] [CrossRef]
- Zhang, G.; Su, X.; Singh, V.P.; Ayantobo, O.O. Appraising Standardized Moisture Anomaly Index (SZI) in Drought Projection across China under CMIP6 Forcing Scenarios. Journal of Hydrology: Regional Studies 2021, 37, 100898. [Google Scholar] [CrossRef]
- Gavahi, K.; Abbaszadeh, P.; Moradkhani, H. How Does Precipitation Data Influence the Land Surface Data Assimilation for Drought Monitoring? Science of The Total Environment 2022, 831, 154916. [Google Scholar] [CrossRef] [PubMed]
- Tibbetts, J. Louisiana’s Wetlands: A Lesson in Nature Appreciation. Environ Health Perspect 2006, 114, A40–A43. [Google Scholar] [CrossRef]
- Brown, V.M.; Keim, B.D.; Kappel, W.D.; Hultstrand, D.M.; Peyrefitte, A.G.; Black, A.W.; Steinhilber, K.M.; Muhlestein, G.A. How Rare Was the August 2016 South-Central Louisiana Heavy Rainfall Event? 2020. [Google Scholar] [CrossRef]
- Faiers, G.E.; Grymes, J.M.; Keim, B.D.; Muller, R.A. A Reexamination of Extreme 24-Hour Rainfall in Louisiana, USA. Climate Research 1994, 4, 25–31. [Google Scholar] [CrossRef]
- Ekpetere, K.; Li, X.; Frame, J. Metadata for the Rapid Forcing Retrieval (RFR) Web Tool 2022.
- Felder, G.; Paquet, E.; Penot, D.; Zischg, A.; Weingartner, R. Consistency of Extreme Flood Estimation Approaches. Journal of Hydrologic Engineering 2019, 24, 04019018. [Google Scholar] [CrossRef]
- Yuan, F.; Zhang, L.; Ren, L.; Zhao, C.; Zhu, Y.; Jiang, S.; Liu, Y. Applications of TRMM- and GPM-Era Multiple-Satellite Precipitation Products for Flood Simulations at Sub-Daily Scales in a Sparsely Gauged Watershed in Myanmar. Remote Sensing 2019, 11. [Google Scholar] [CrossRef]
- Gershunov, A.; Shulgina, T.; Clemesha, R.E.S.; Guirguis, K.; Pierce, D.W.; Dettinger, M.D.; Lavers, D.A.; Cayan, D.R.; Polade, S.D.; Kalansky, J.; et al. Precipitation Regime Change in Western North America: The Role of Atmospheric Rivers. Sci Rep 2019, 9, 9944. [Google Scholar] [CrossRef]
- McKitrick, R.; Christy, J. Assessing Changes in US Regional Precipitation on Multiple Time Scales. Journal of Hydrology 2019, 578, 124074. [Google Scholar] [CrossRef]
- Kappel, B. PMP Estimation for Mine Tailings Dams in Data Limited Regions. In Sustainable and Safe Dams Around the World; Tournier, J.-P., Bennett, T., Bibeau, J., Eds.; CRC Press, 2019; pp. 3170–3182. ISBN 978-0-429-31977-8. [Google Scholar]
- Umar, N.; Gray, A. Flooding in Nigeria: A Review of Its Occurrence and Impacts and Approaches to Modelling Flood Data. International Journal of Environmental Studies 2023, 80, 540–561. [Google Scholar] [CrossRef]
- Li, N.; Tang, G.; Zhao, P.; Hong, Y.; Gou, Y.; Yang, K. Statistical Assessment and Hydrological Utility of the Latest Multi-Satellite Precipitation Analysis IMERG in Ganjiang River Basin. Atmospheric Research 2017, 183, 212–223. [Google Scholar] [CrossRef]
- Wu, X.; Su, J.; Ren, W.; Lü, H.; Yuan, F. Statistical Comparison and Hydrological Utility Evaluation of ERA5-Land and IMERG Precipitation Products on the Tibetan Plateau. Journal of Hydrology 2023, 620, 129384. [Google Scholar] [CrossRef]
- Hosseini-Moghari, S.-M.; Tang, Q. Can IMERG Data Capture the Scaling of Precipitation Extremes With Temperature at Different Time Scales? Geophysical Research Letters 2022, 49, e2021GL096392. [Google Scholar] [CrossRef]
- Li, R.; Guilloteau, C.; Kirstetter, P.-E.; Foufoula-Georgiou, E. How Well Does the IMERG Satellite Precipitation Product Capture the Timing of Precipitation Events? Journal of Hydrology 2023, 620, 129563. [Google Scholar] [CrossRef]
- Gabric, O.; Prodanovic, D.; Plavsic, J. Uncertainty Assessment of Rainfall Simulator Uniformity Coefficient.; April 24 2014.
Figure 1.
Locations of the 2,360 selected NOAA stations in CONUS with data spanning from 2001 to 2022, along with the mean annual precipitation depth (in inches). Note that NOAA station data are missing in the Northwestern CONUS (Idaho, Montana, Oregon, Washington, and Wyoming), and thus, evaluations do not cover these areas.
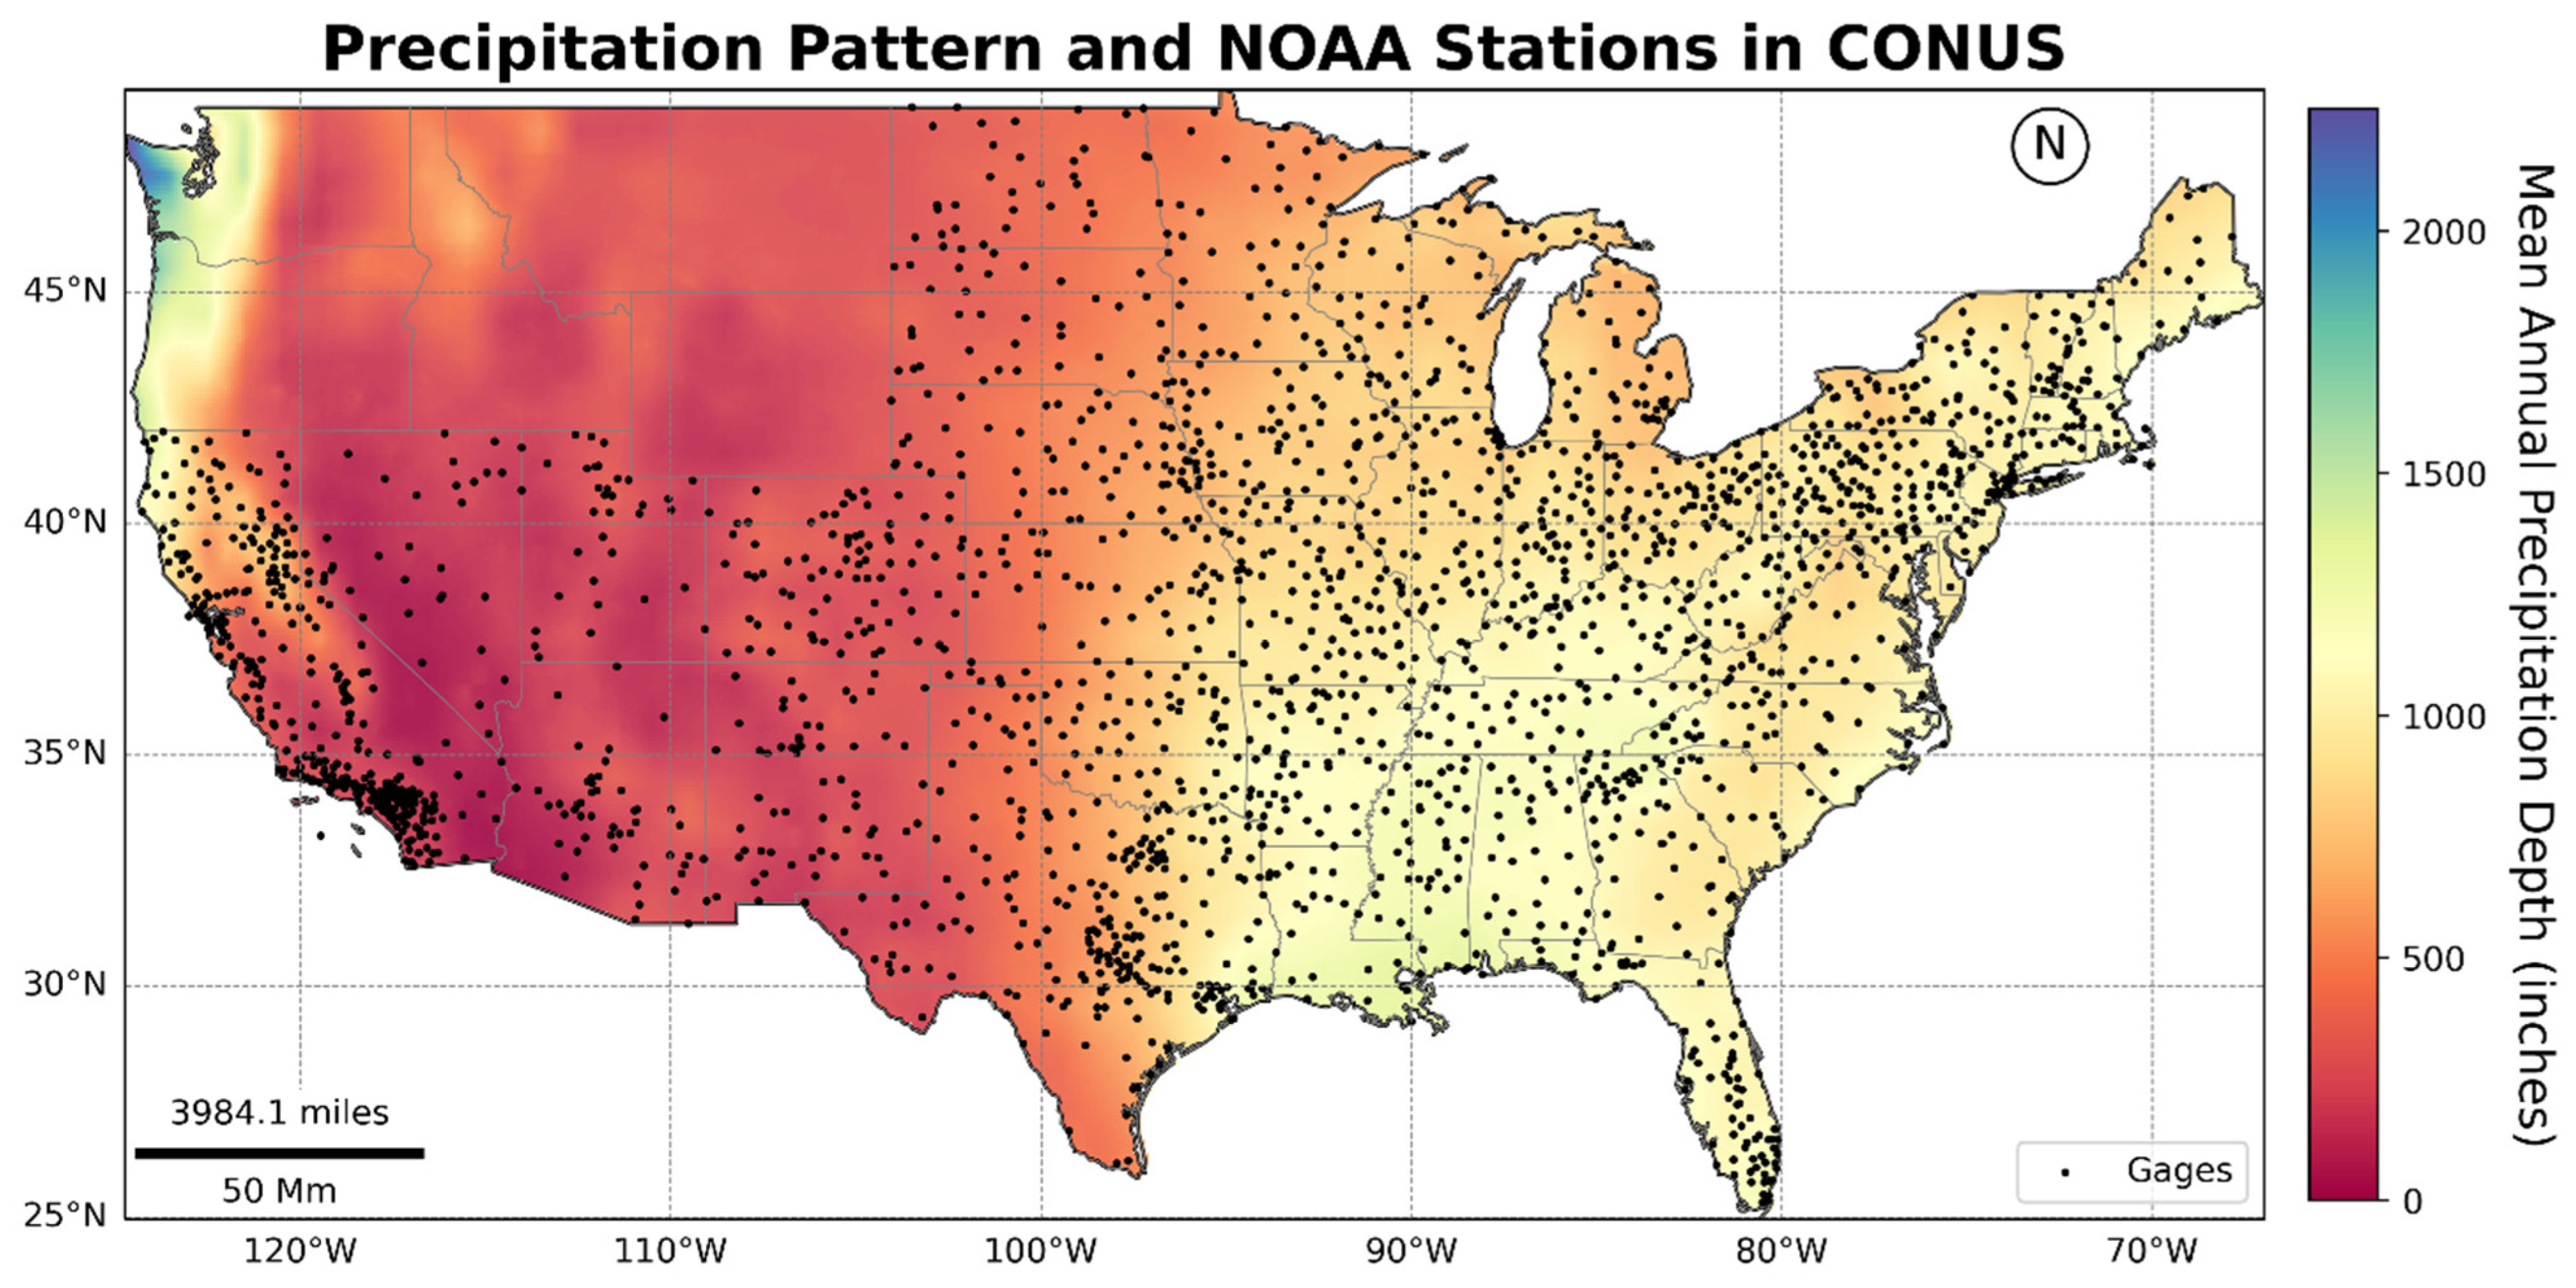
Figure 2.
Workflow for Modeling Rainfall Anomaly Index (RAI) from IMERG and NOAA AMS Data.
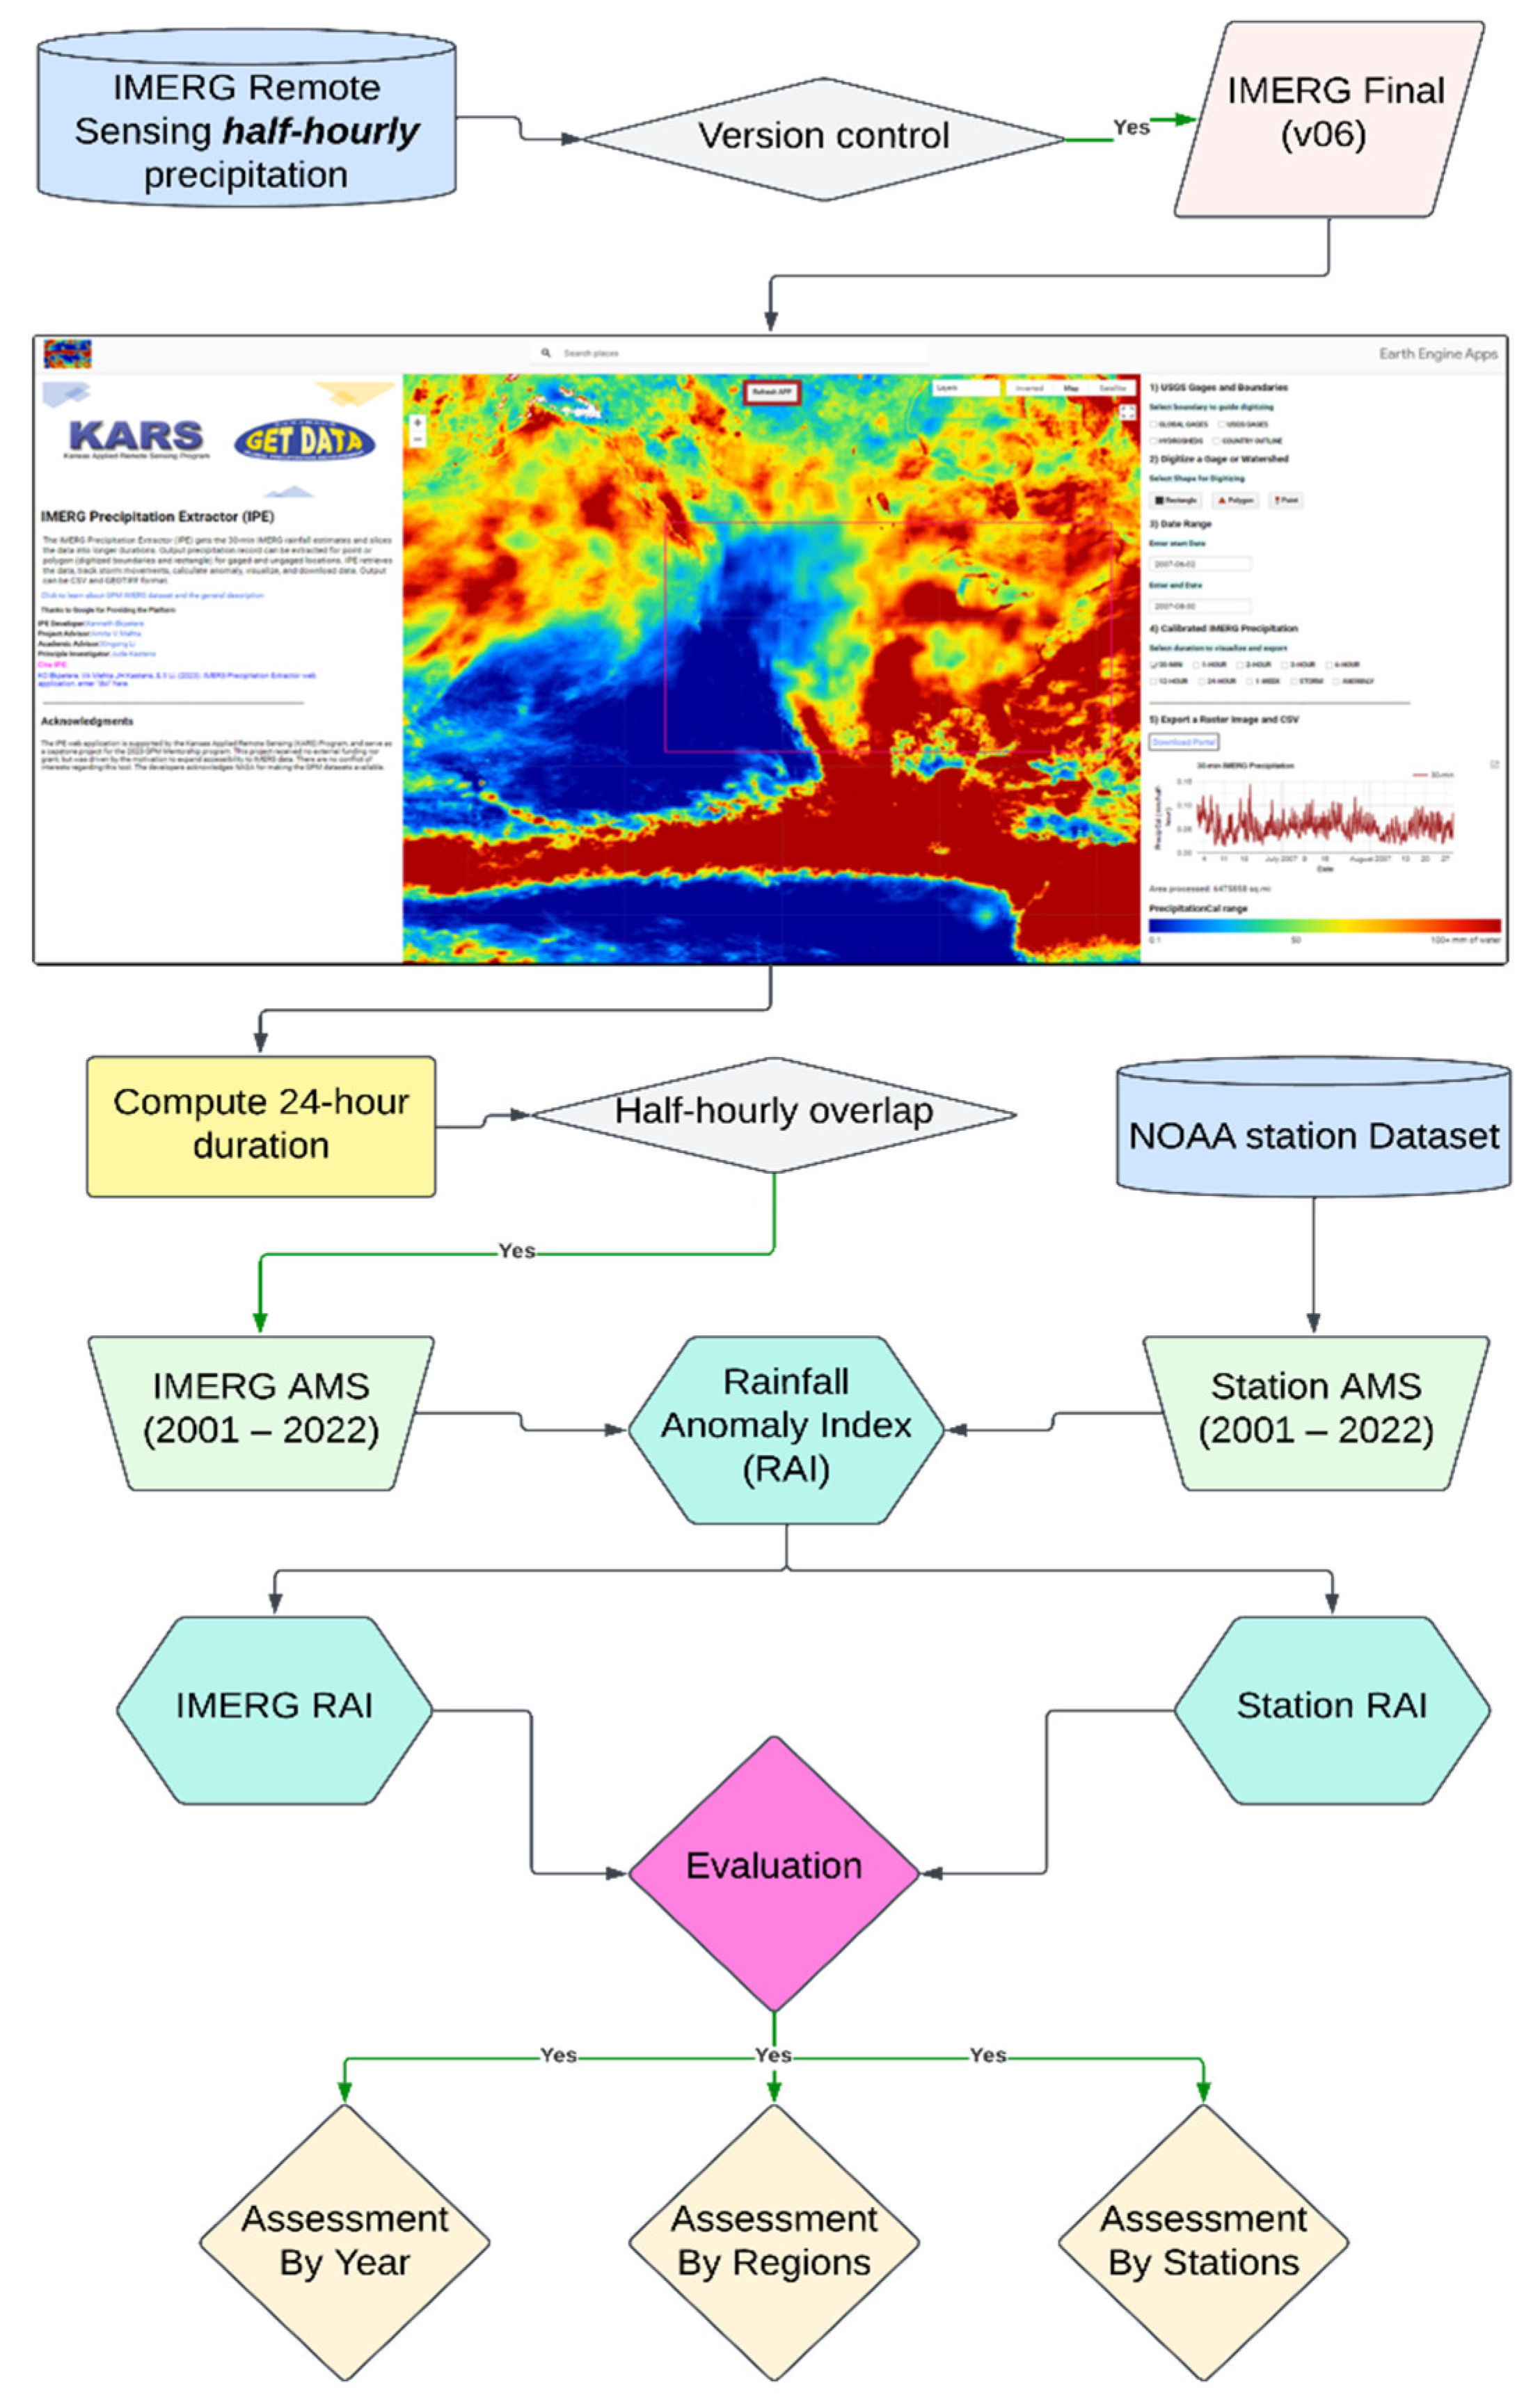
Figure 3.
Median Anomaly Comparison of Daily Rainfall Maximum Between IMERG and NOAA Across 2,360 Stations (2000–2022). IMERG anomalies were generally consistent with NOAA’s, with minor variations.
Figure 3.
Median Anomaly Comparison of Daily Rainfall Maximum Between IMERG and NOAA Across 2,360 Stations (2000–2022). IMERG anomalies were generally consistent with NOAA’s, with minor variations.
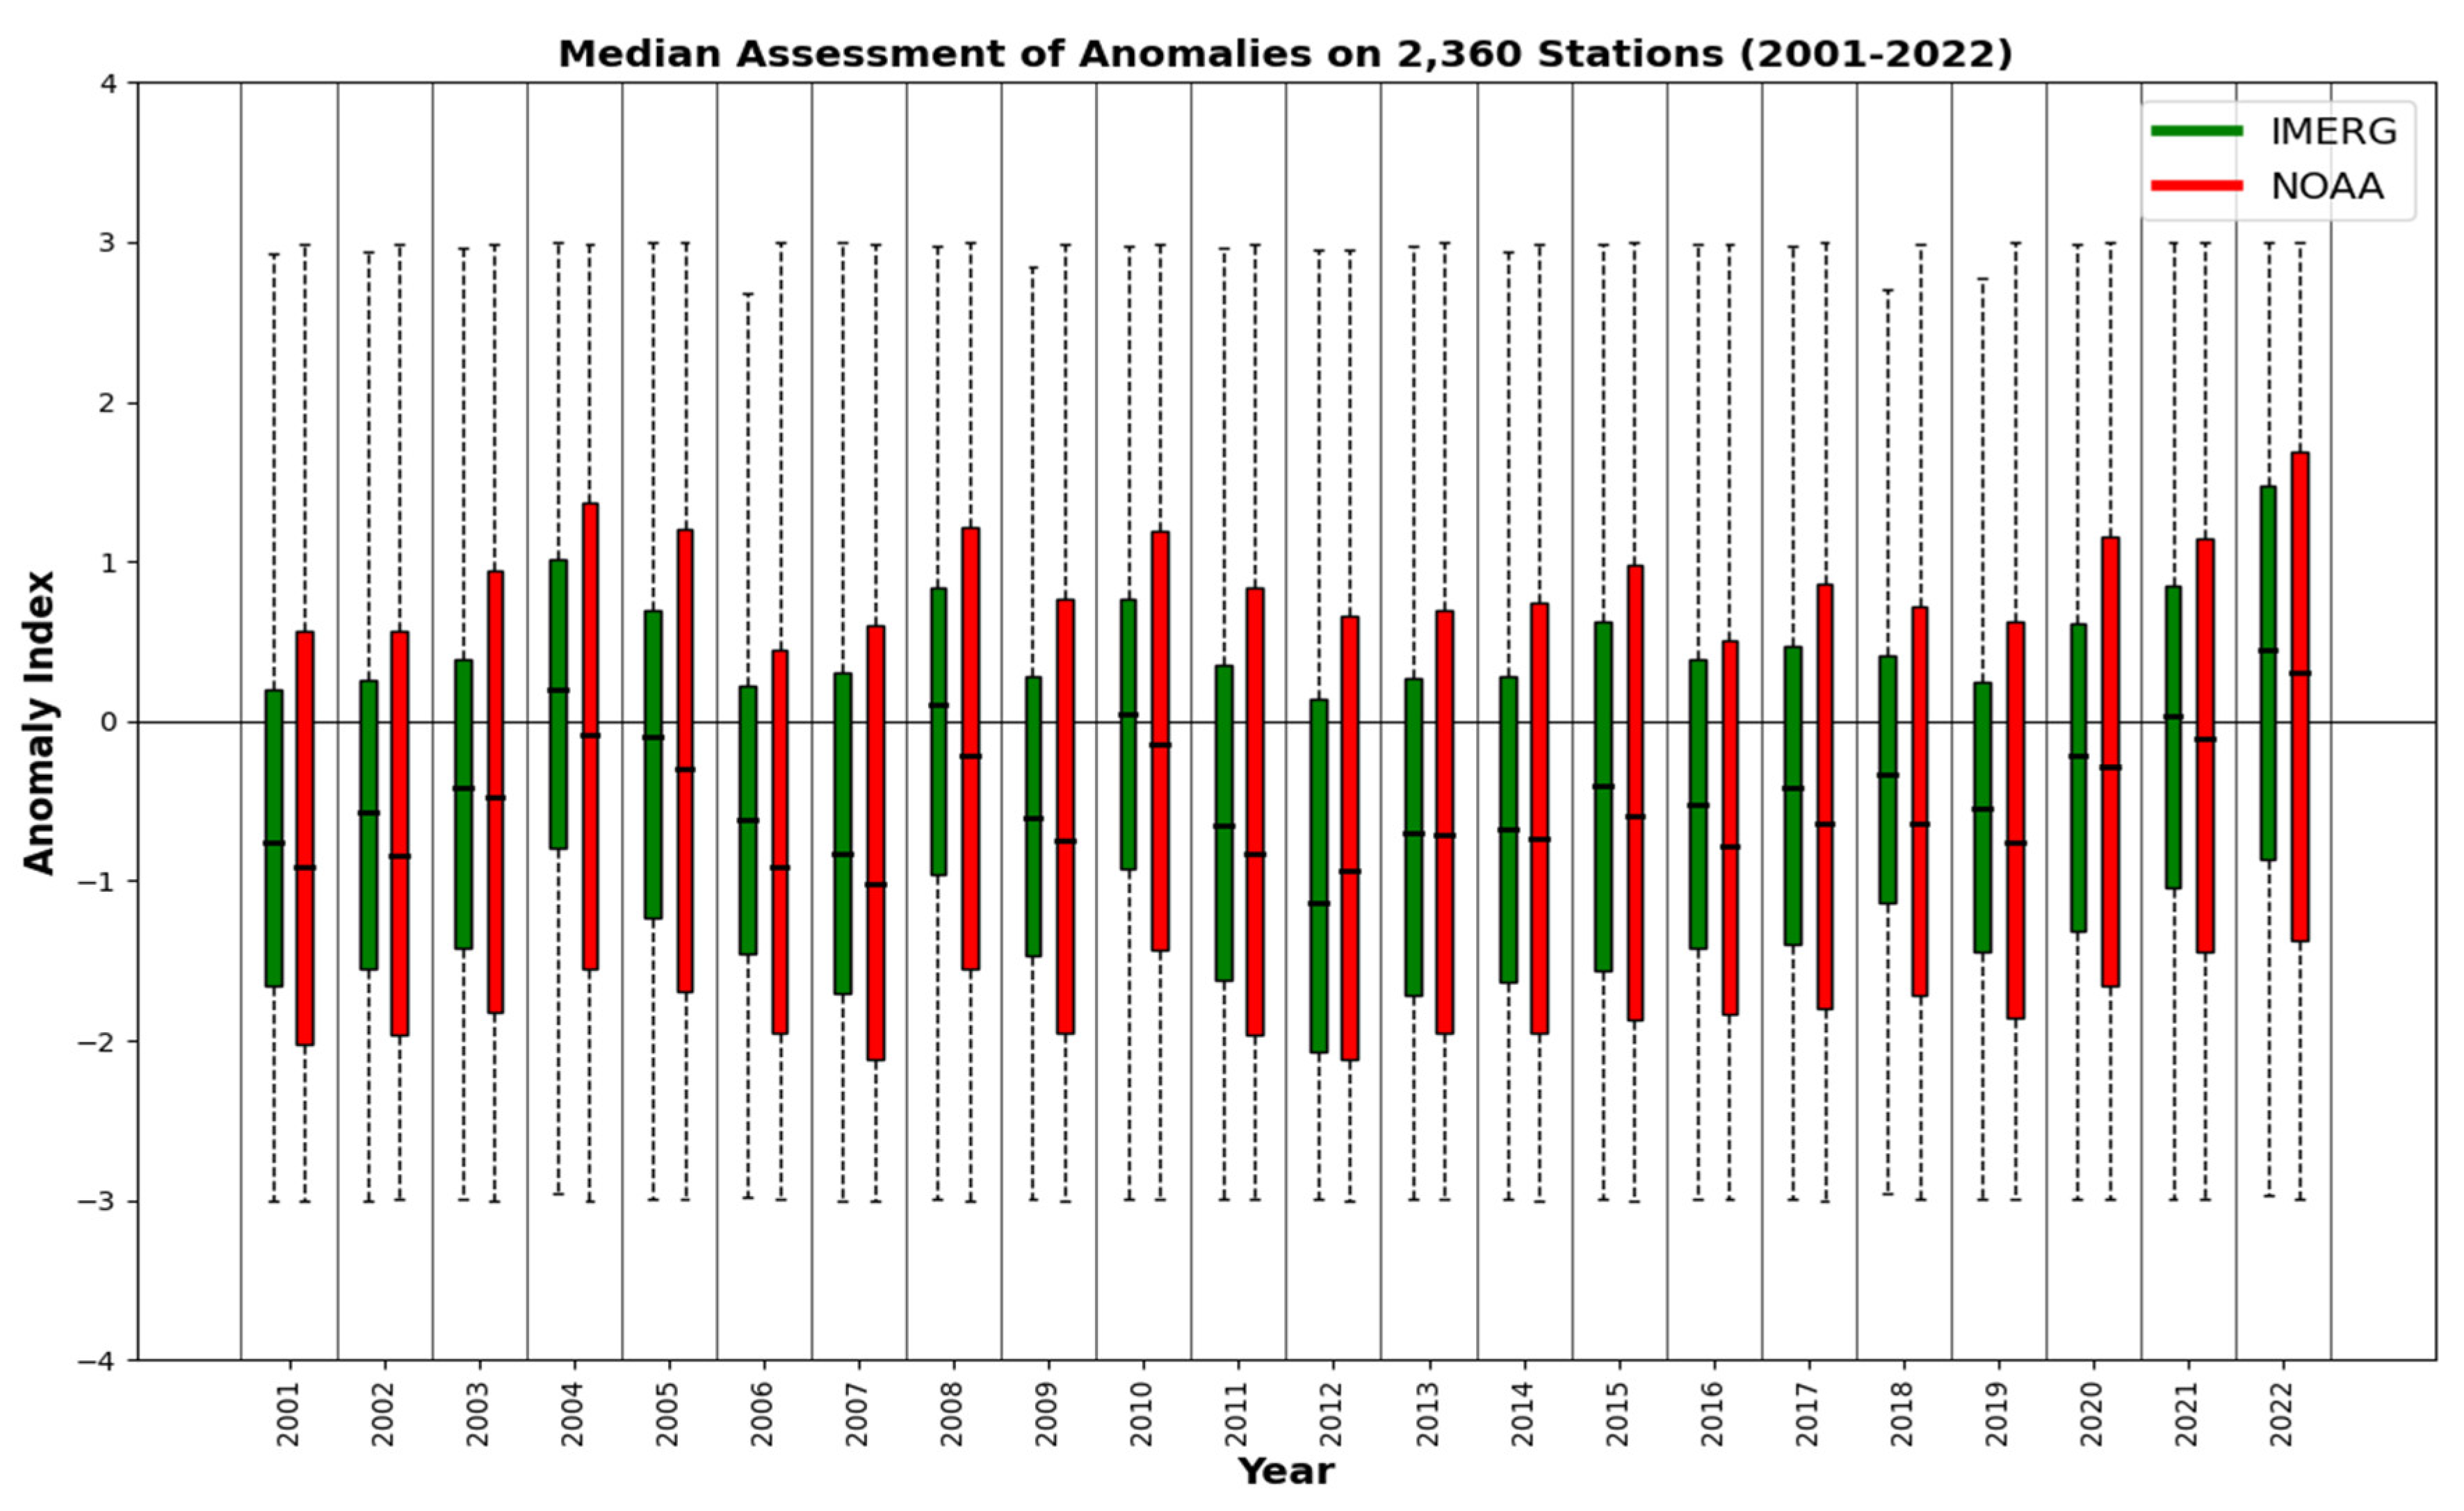
Figure 4.
Relationship between anomaly index estimates from IMERG and NOAA versus annual daily maximum rainfall from 2,360 stations (2000–2022). The annual daily maximum precipitation is based on NOAA stations. Both IMERG (green) and NOAA (red) RAI indices show a positive correlation with increasing rainfall depth, with IMERG displaying a less variable relationship compared to NOAA.
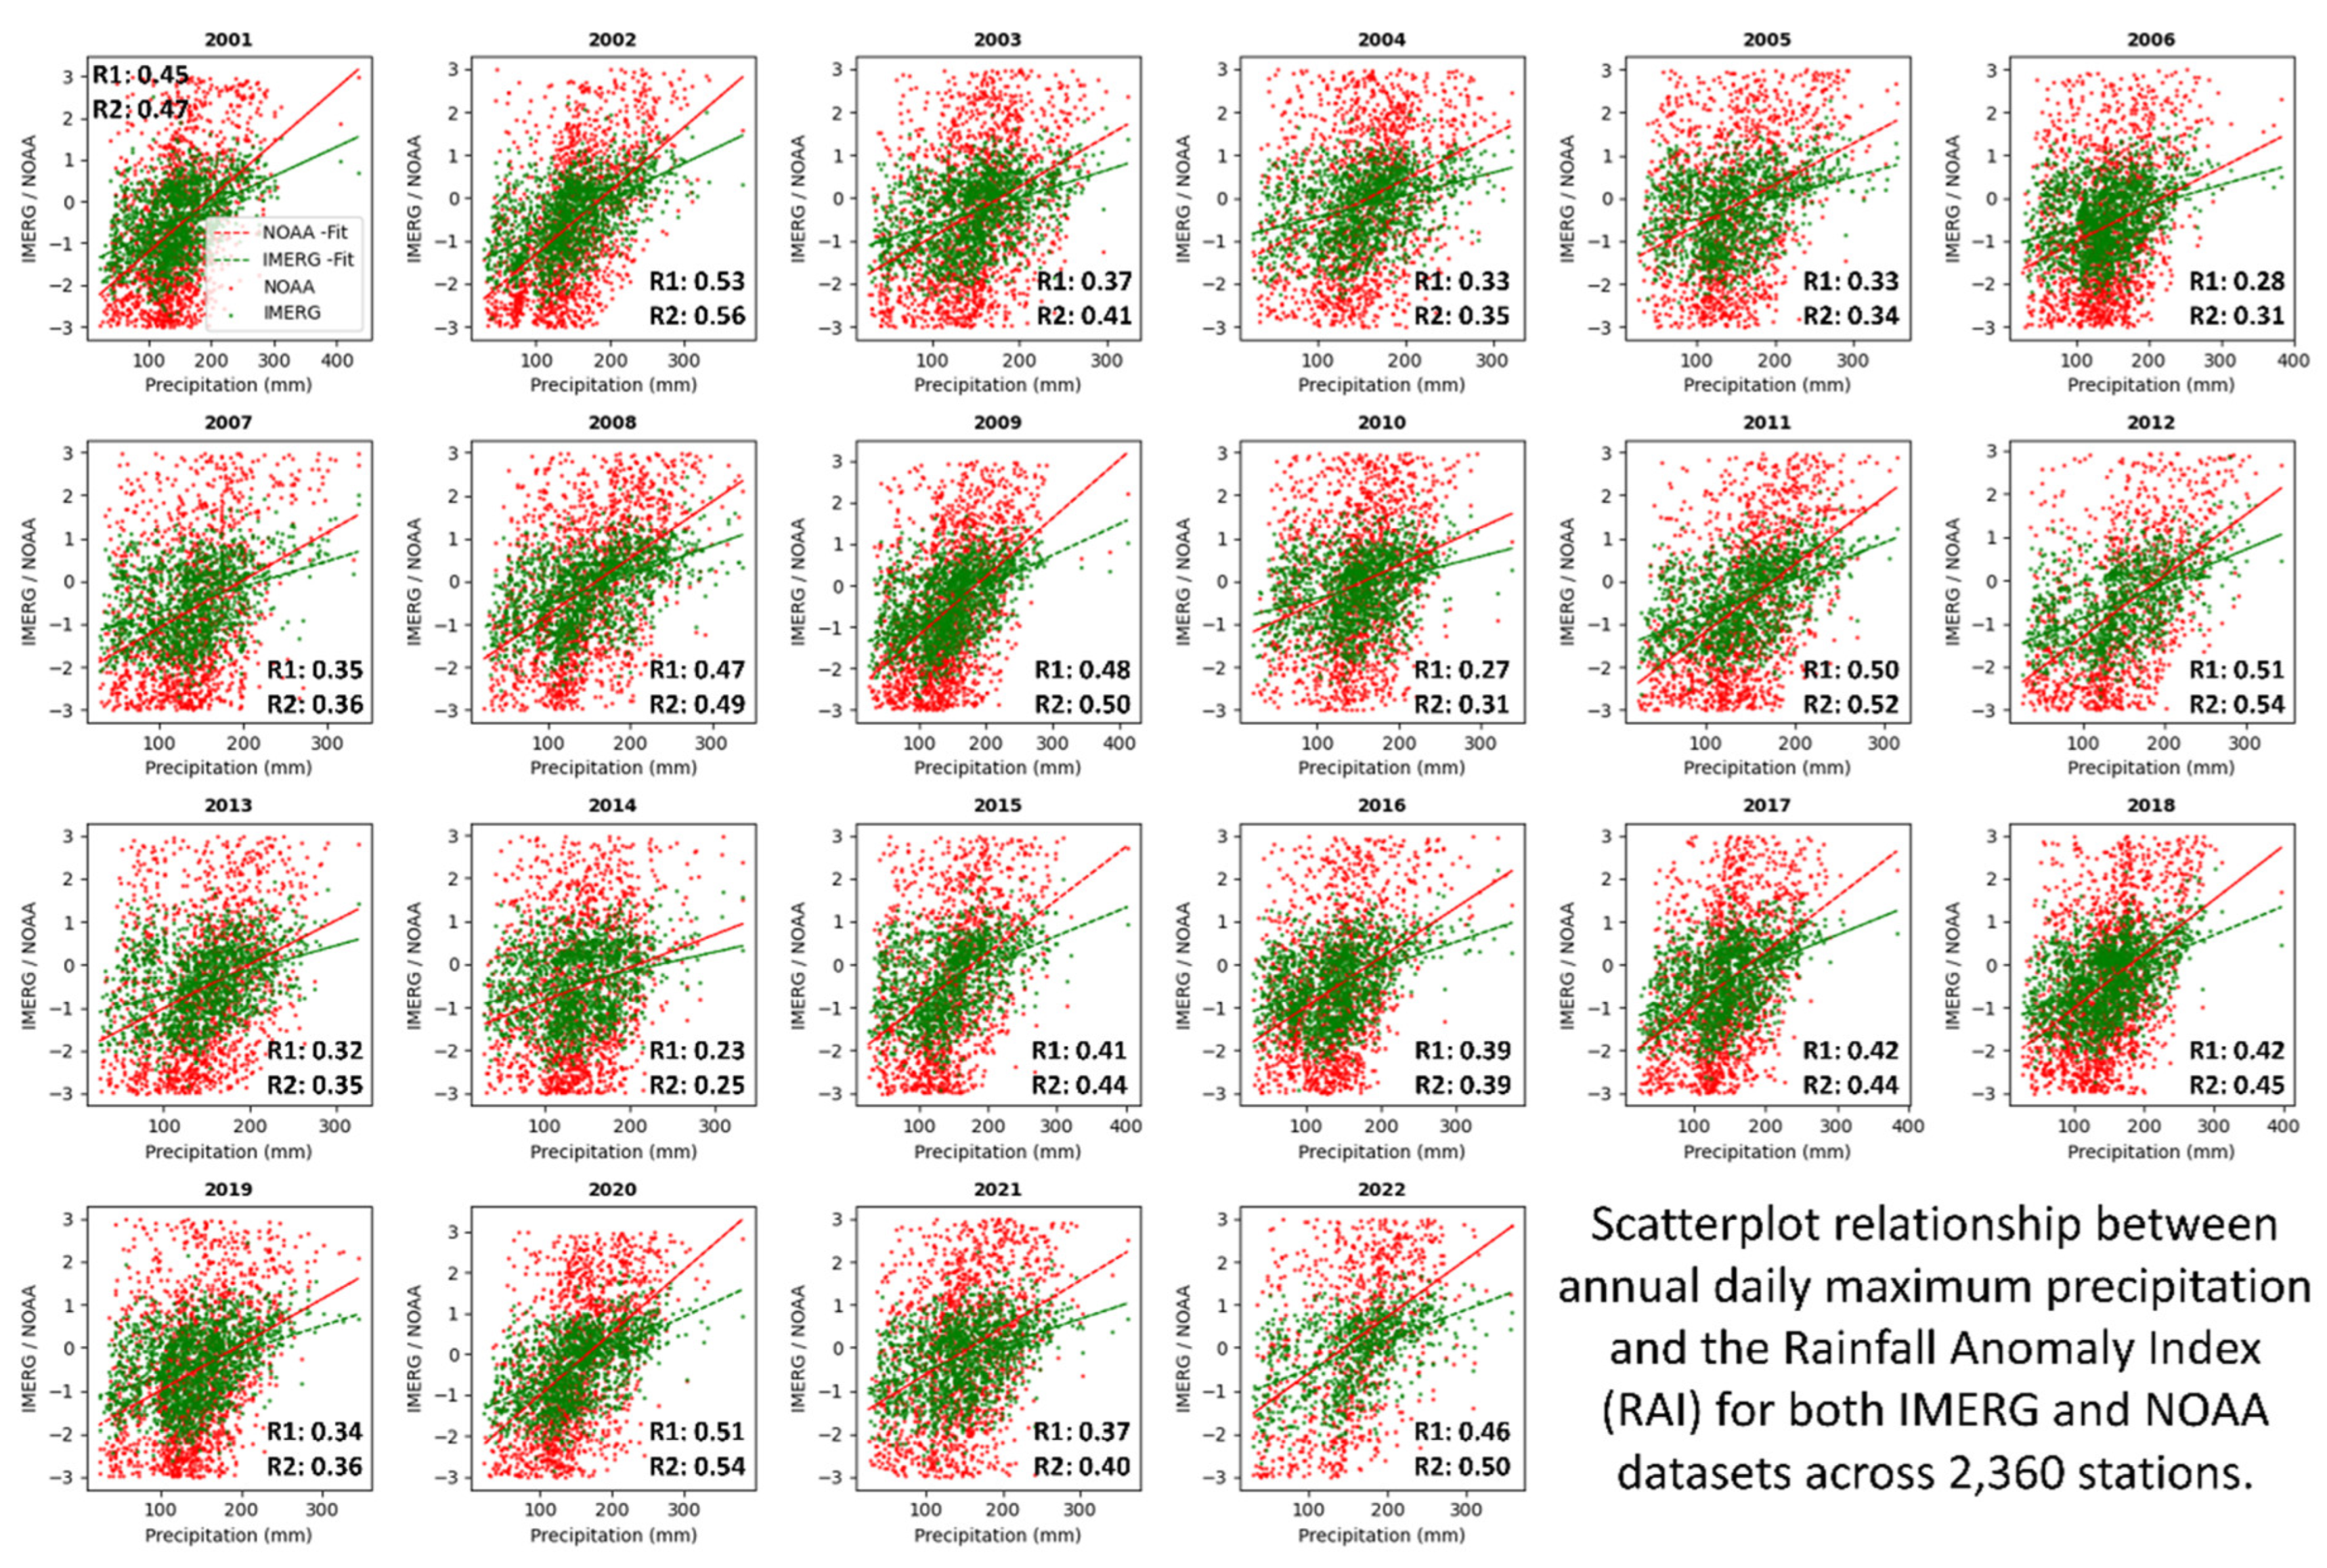
Figure 5.
Comparison of anomaly index estimates between IMERG and NOAA for 20 selected stations in Nevada. These stations are pivotal for evaluating IMERG performance in arid regions like Nevada. IMERG RAI is shown in green, while NOAA station RAI is represented in red.
Figure 5.
Comparison of anomaly index estimates between IMERG and NOAA for 20 selected stations in Nevada. These stations are pivotal for evaluating IMERG performance in arid regions like Nevada. IMERG RAI is shown in green, while NOAA station RAI is represented in red.
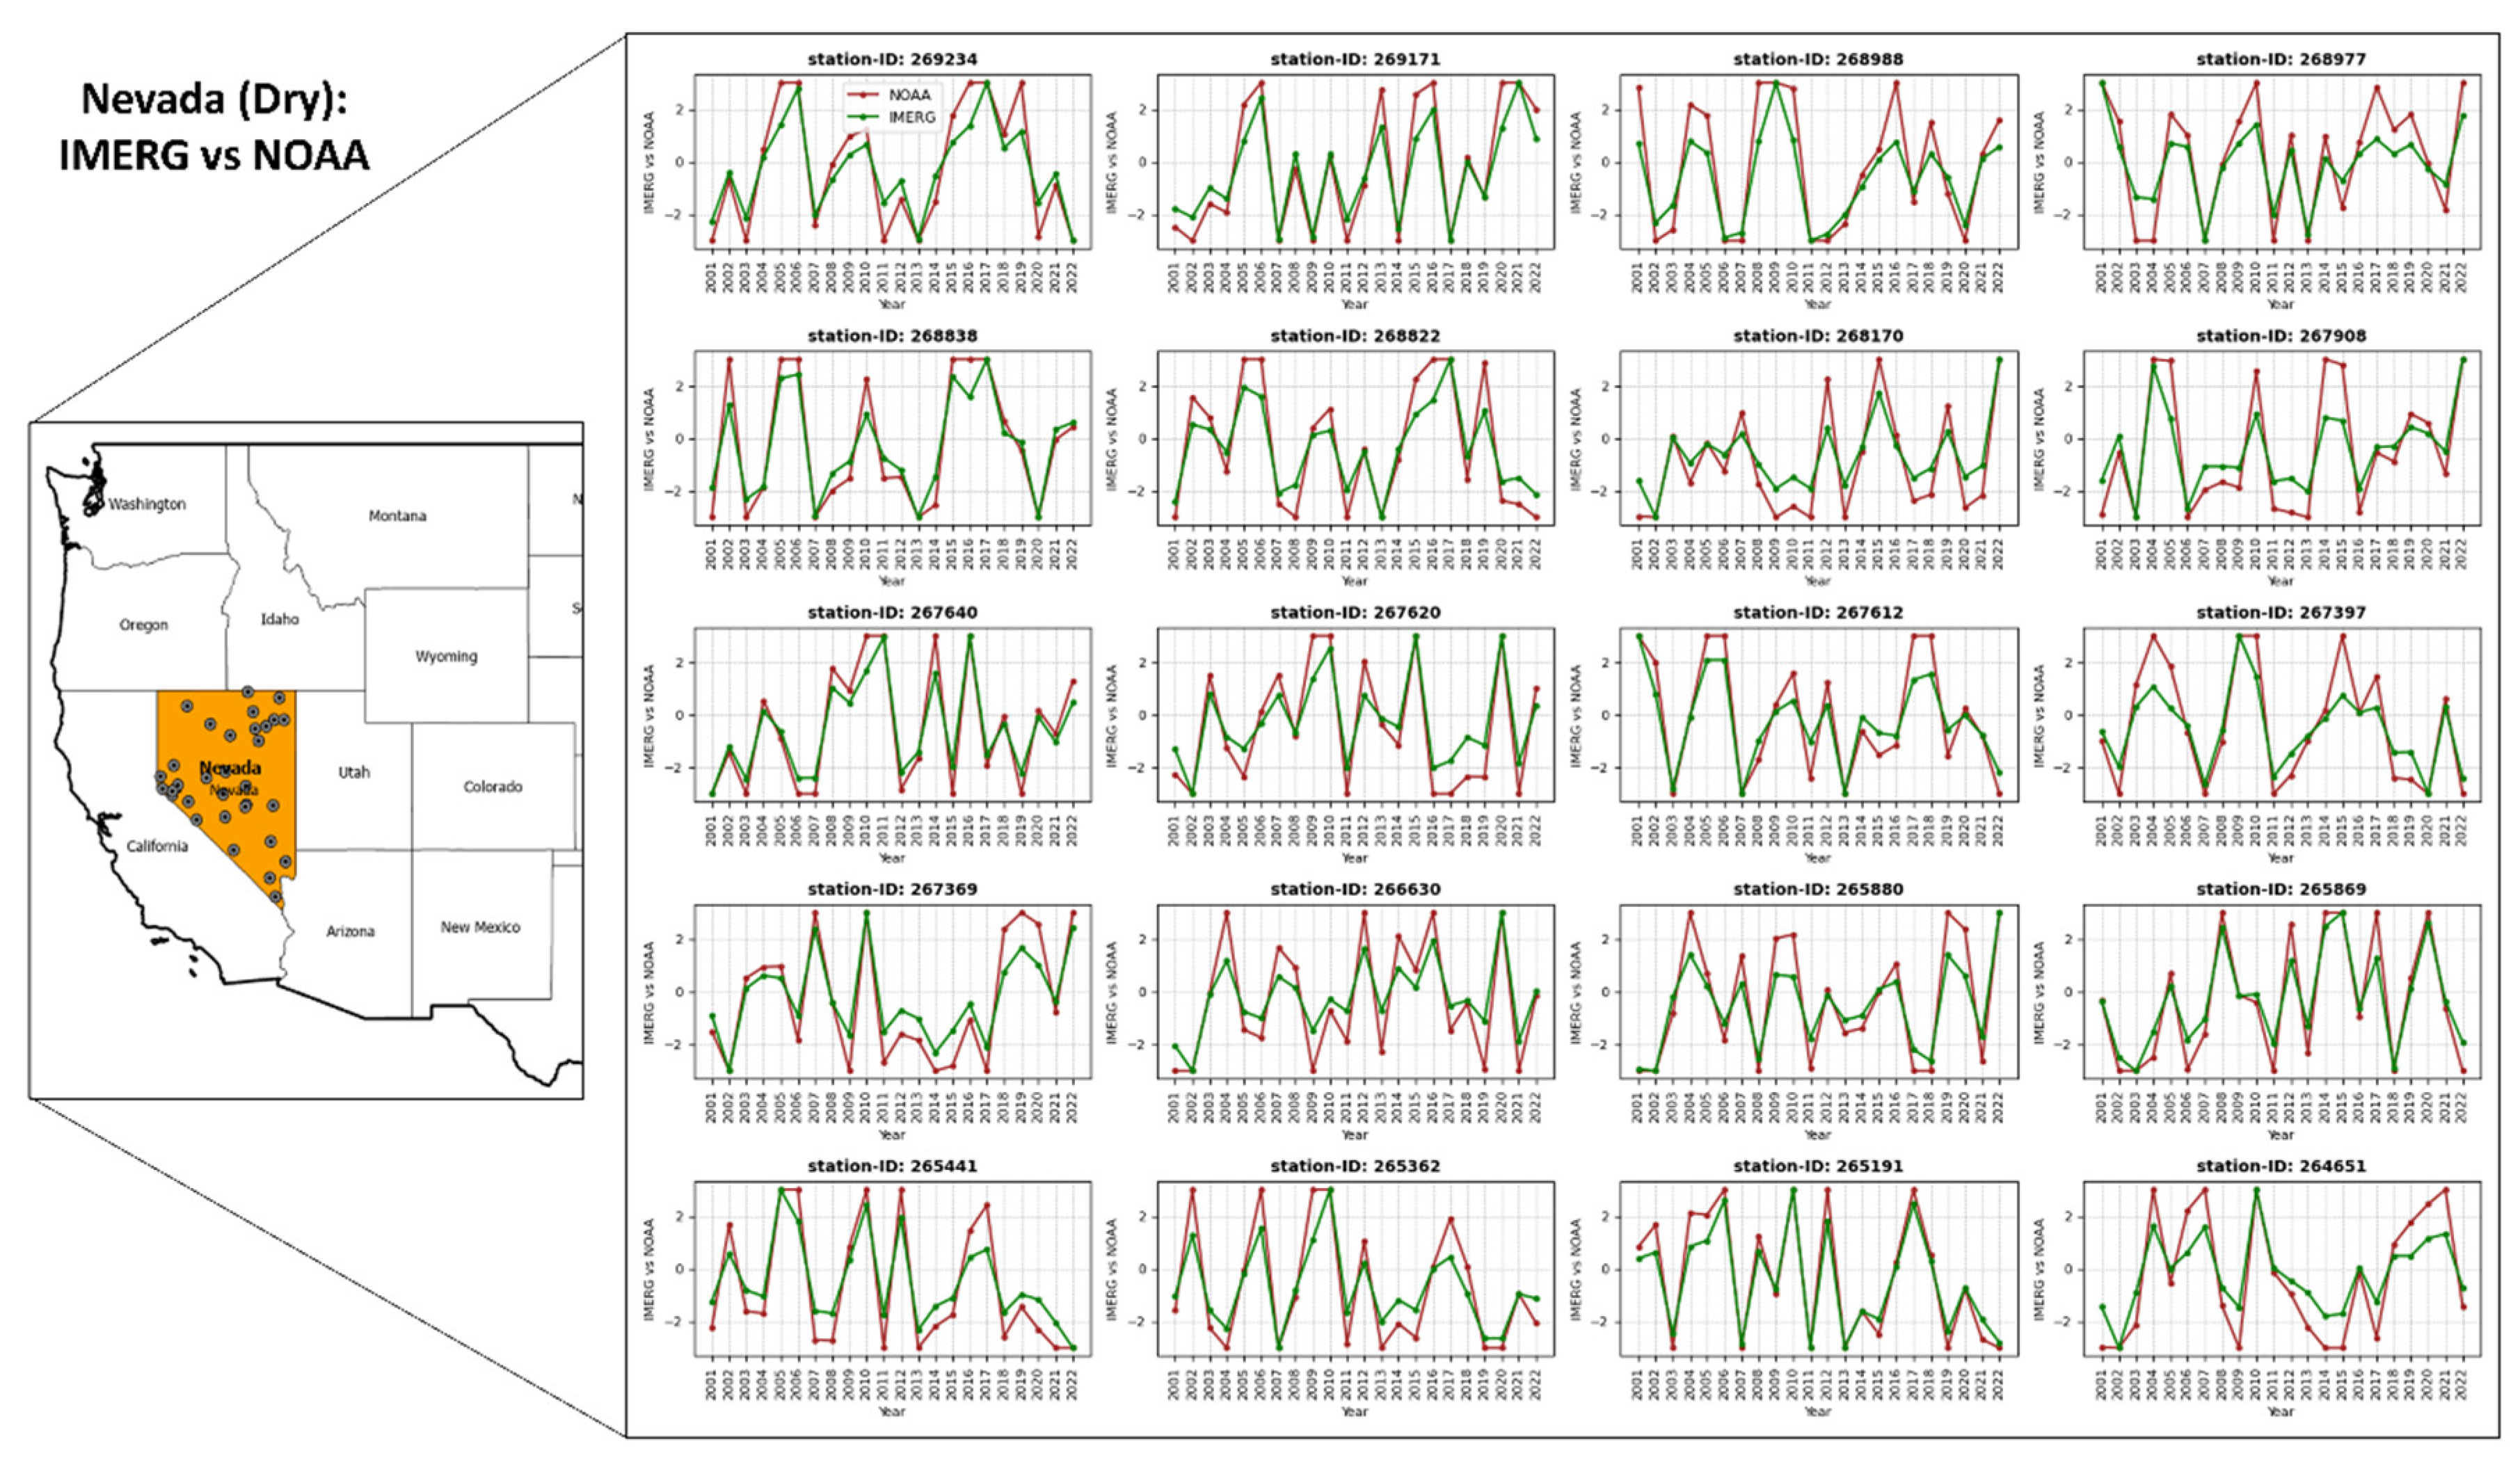
Figure 6.
Comparison of anomaly index estimates from IMERG and NOAA at 20 selected stations in Louisiana. The 20 stations are used to assess IMERG performance in a humid region like Louisiana. IMERG RAI is depicted in green, while NOAA RAI is shown in red.
Figure 6.
Comparison of anomaly index estimates from IMERG and NOAA at 20 selected stations in Louisiana. The 20 stations are used to assess IMERG performance in a humid region like Louisiana. IMERG RAI is depicted in green, while NOAA RAI is shown in red.
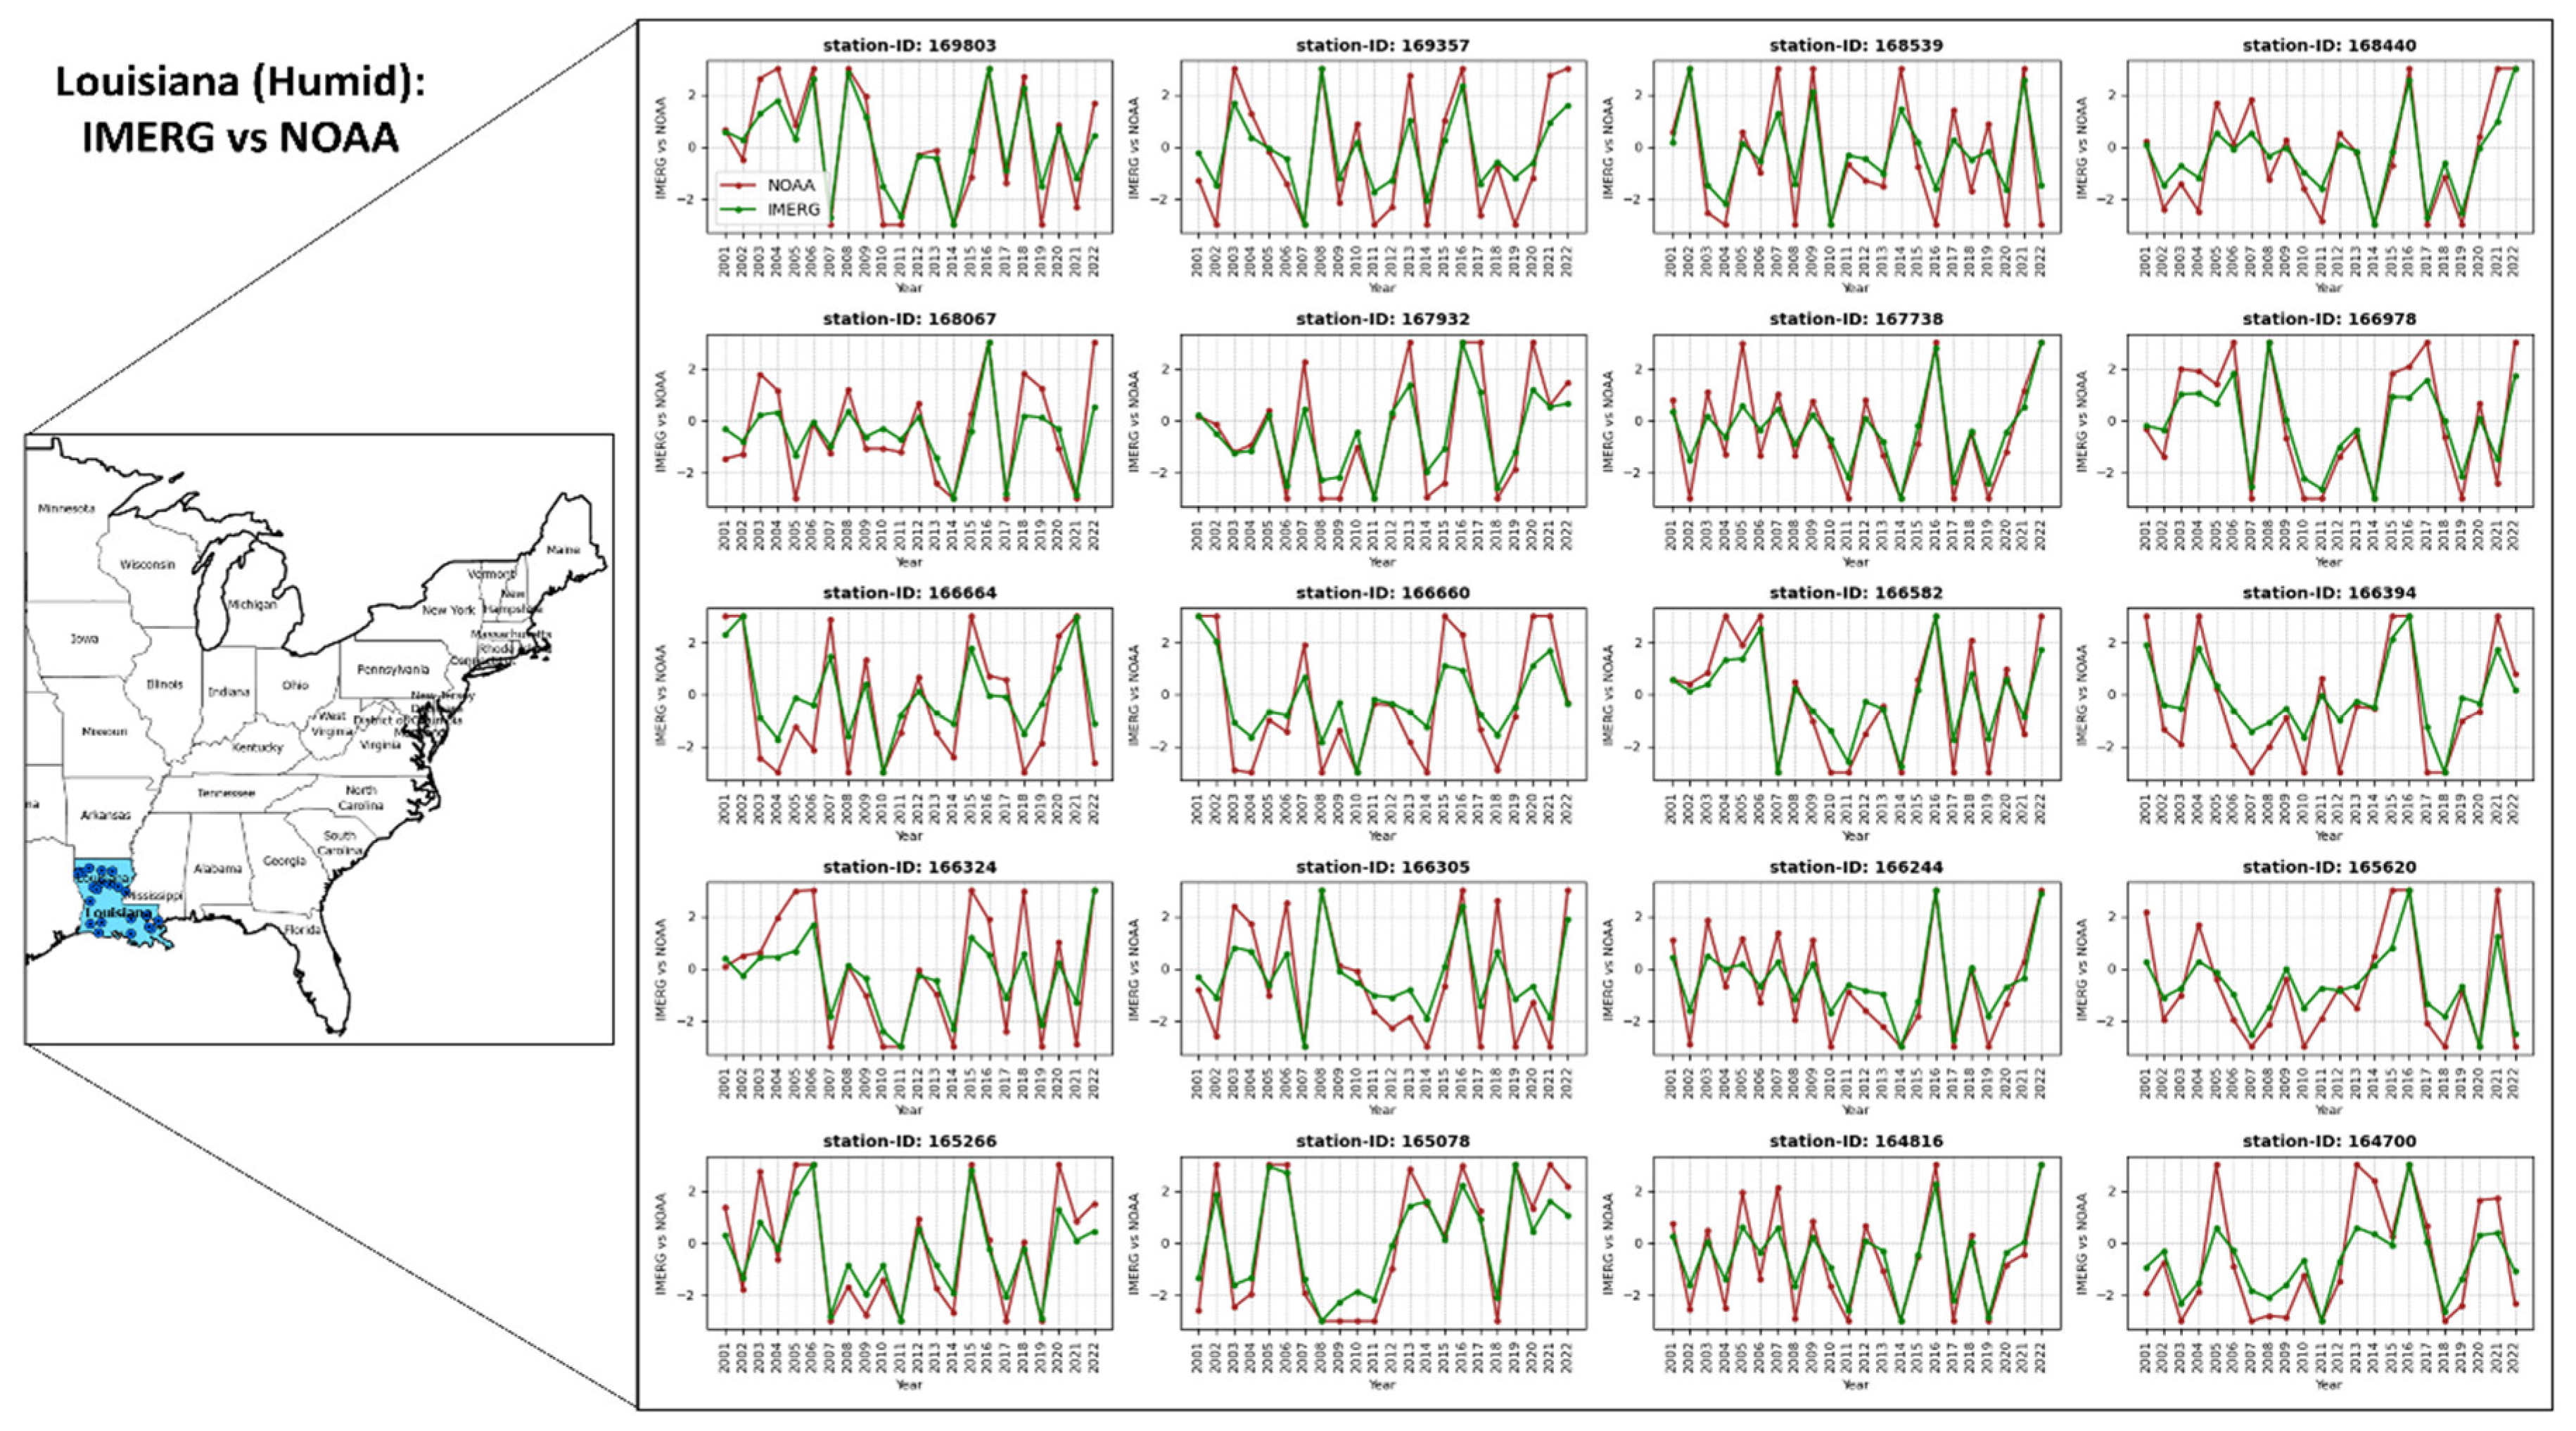
Figure 7.
Spatial Evaluation of IMERG RAI Index Across 2,360 Stations. Anomaly index from IMERG is compared with the NOAA station RAI index at each location.
Figure 7.
Spatial Evaluation of IMERG RAI Index Across 2,360 Stations. Anomaly index from IMERG is compared with the NOAA station RAI index at each location.
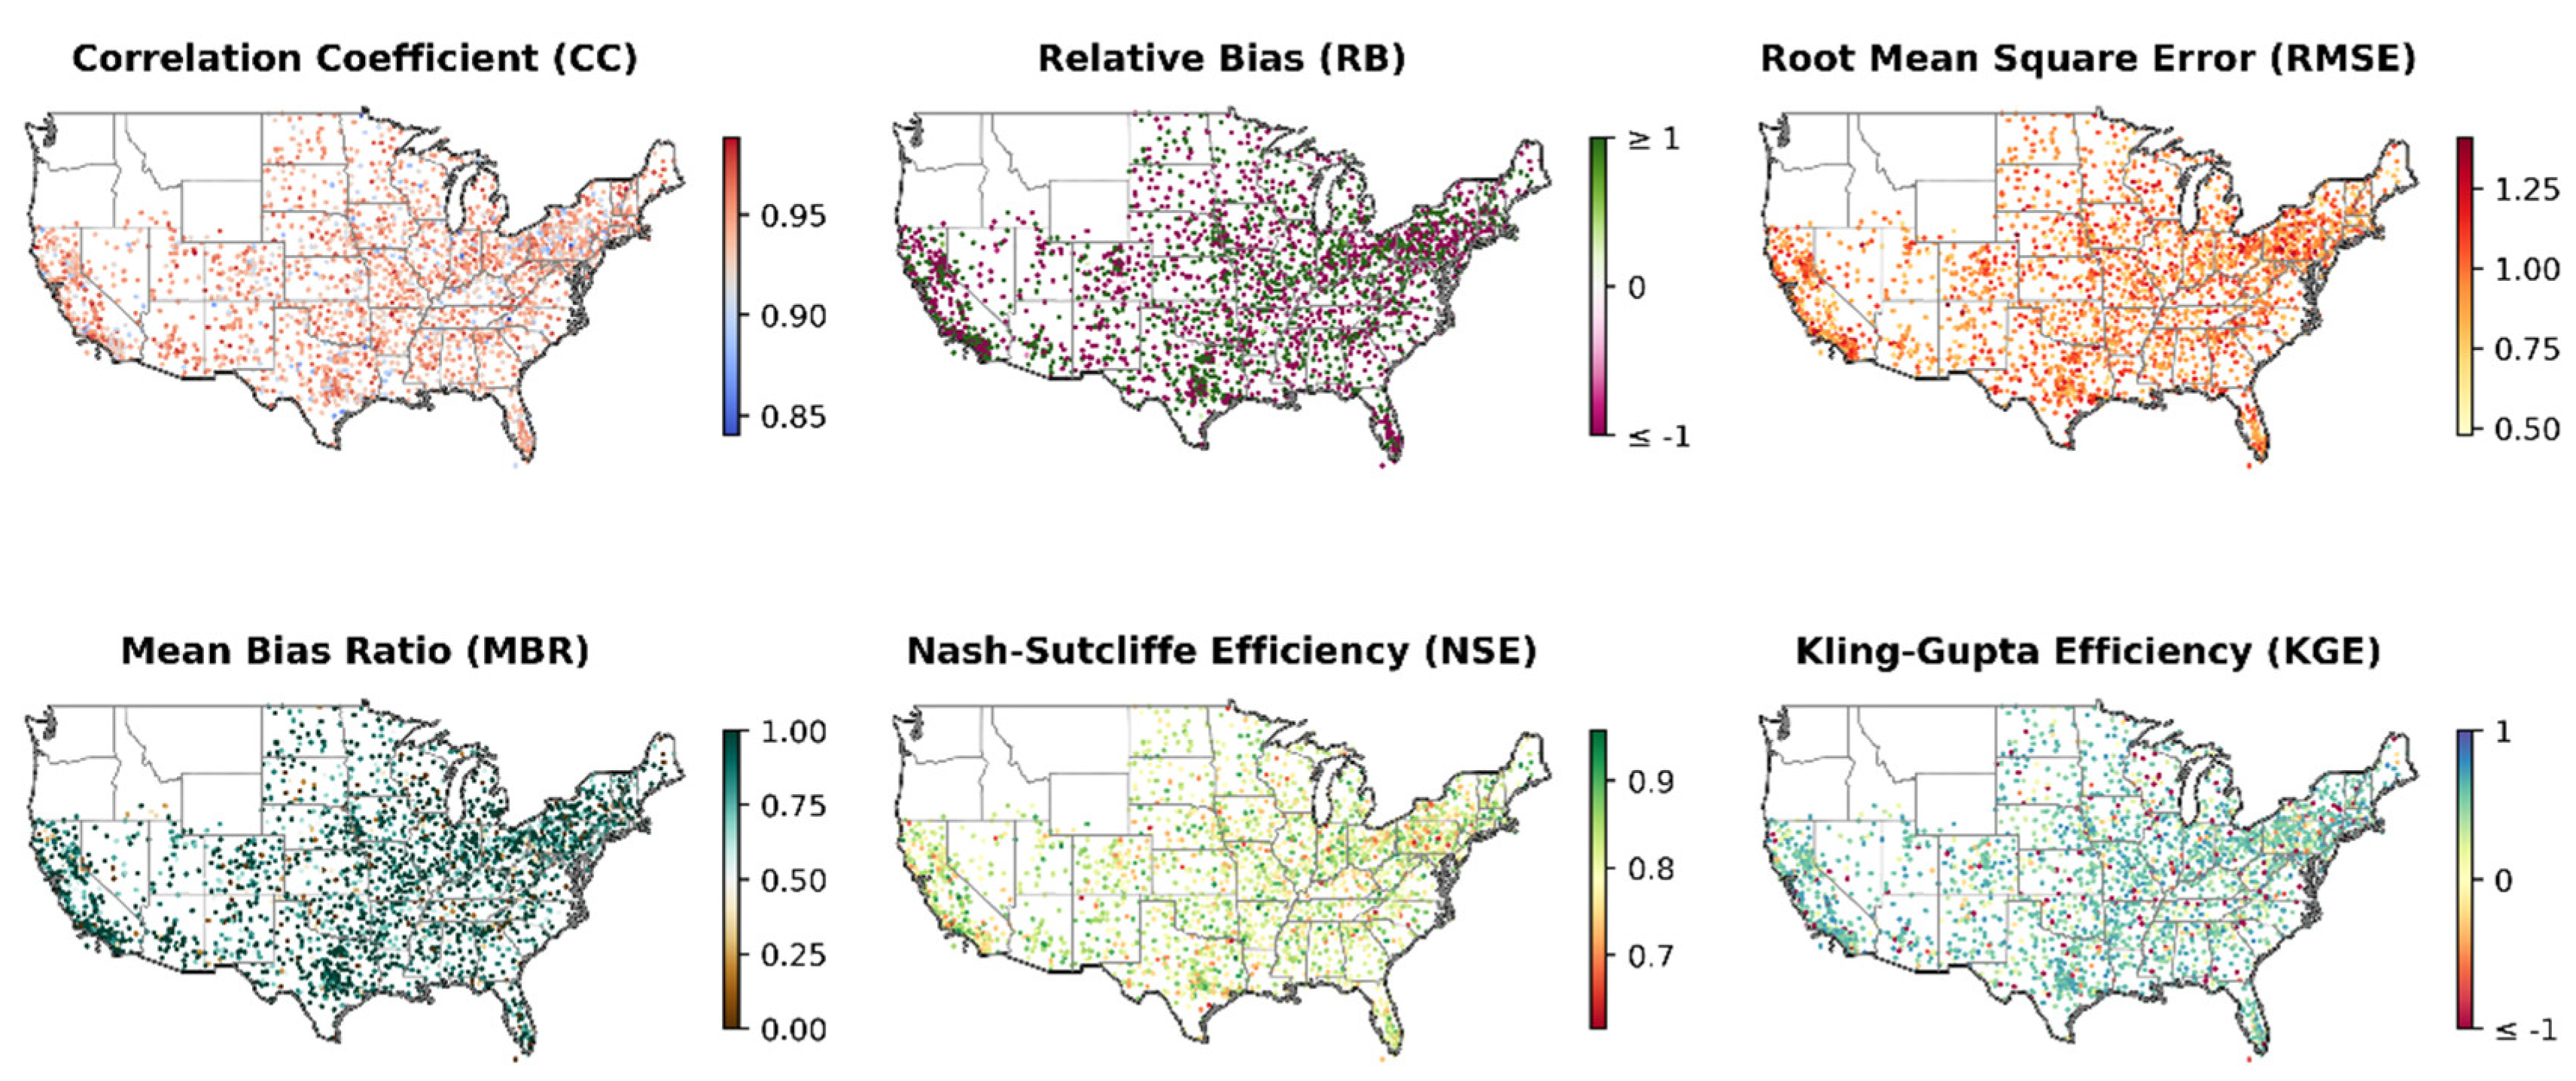
Figure 8.
Trend of Average Anomaly Index Estimated from IMERG Daily Rainfall Maximums (2000–2022) Across 2,360 Stations. The average anomaly index is scaled to a percentage range of -100% to +100%.
Figure 8.
Trend of Average Anomaly Index Estimated from IMERG Daily Rainfall Maximums (2000–2022) Across 2,360 Stations. The average anomaly index is scaled to a percentage range of -100% to +100%.
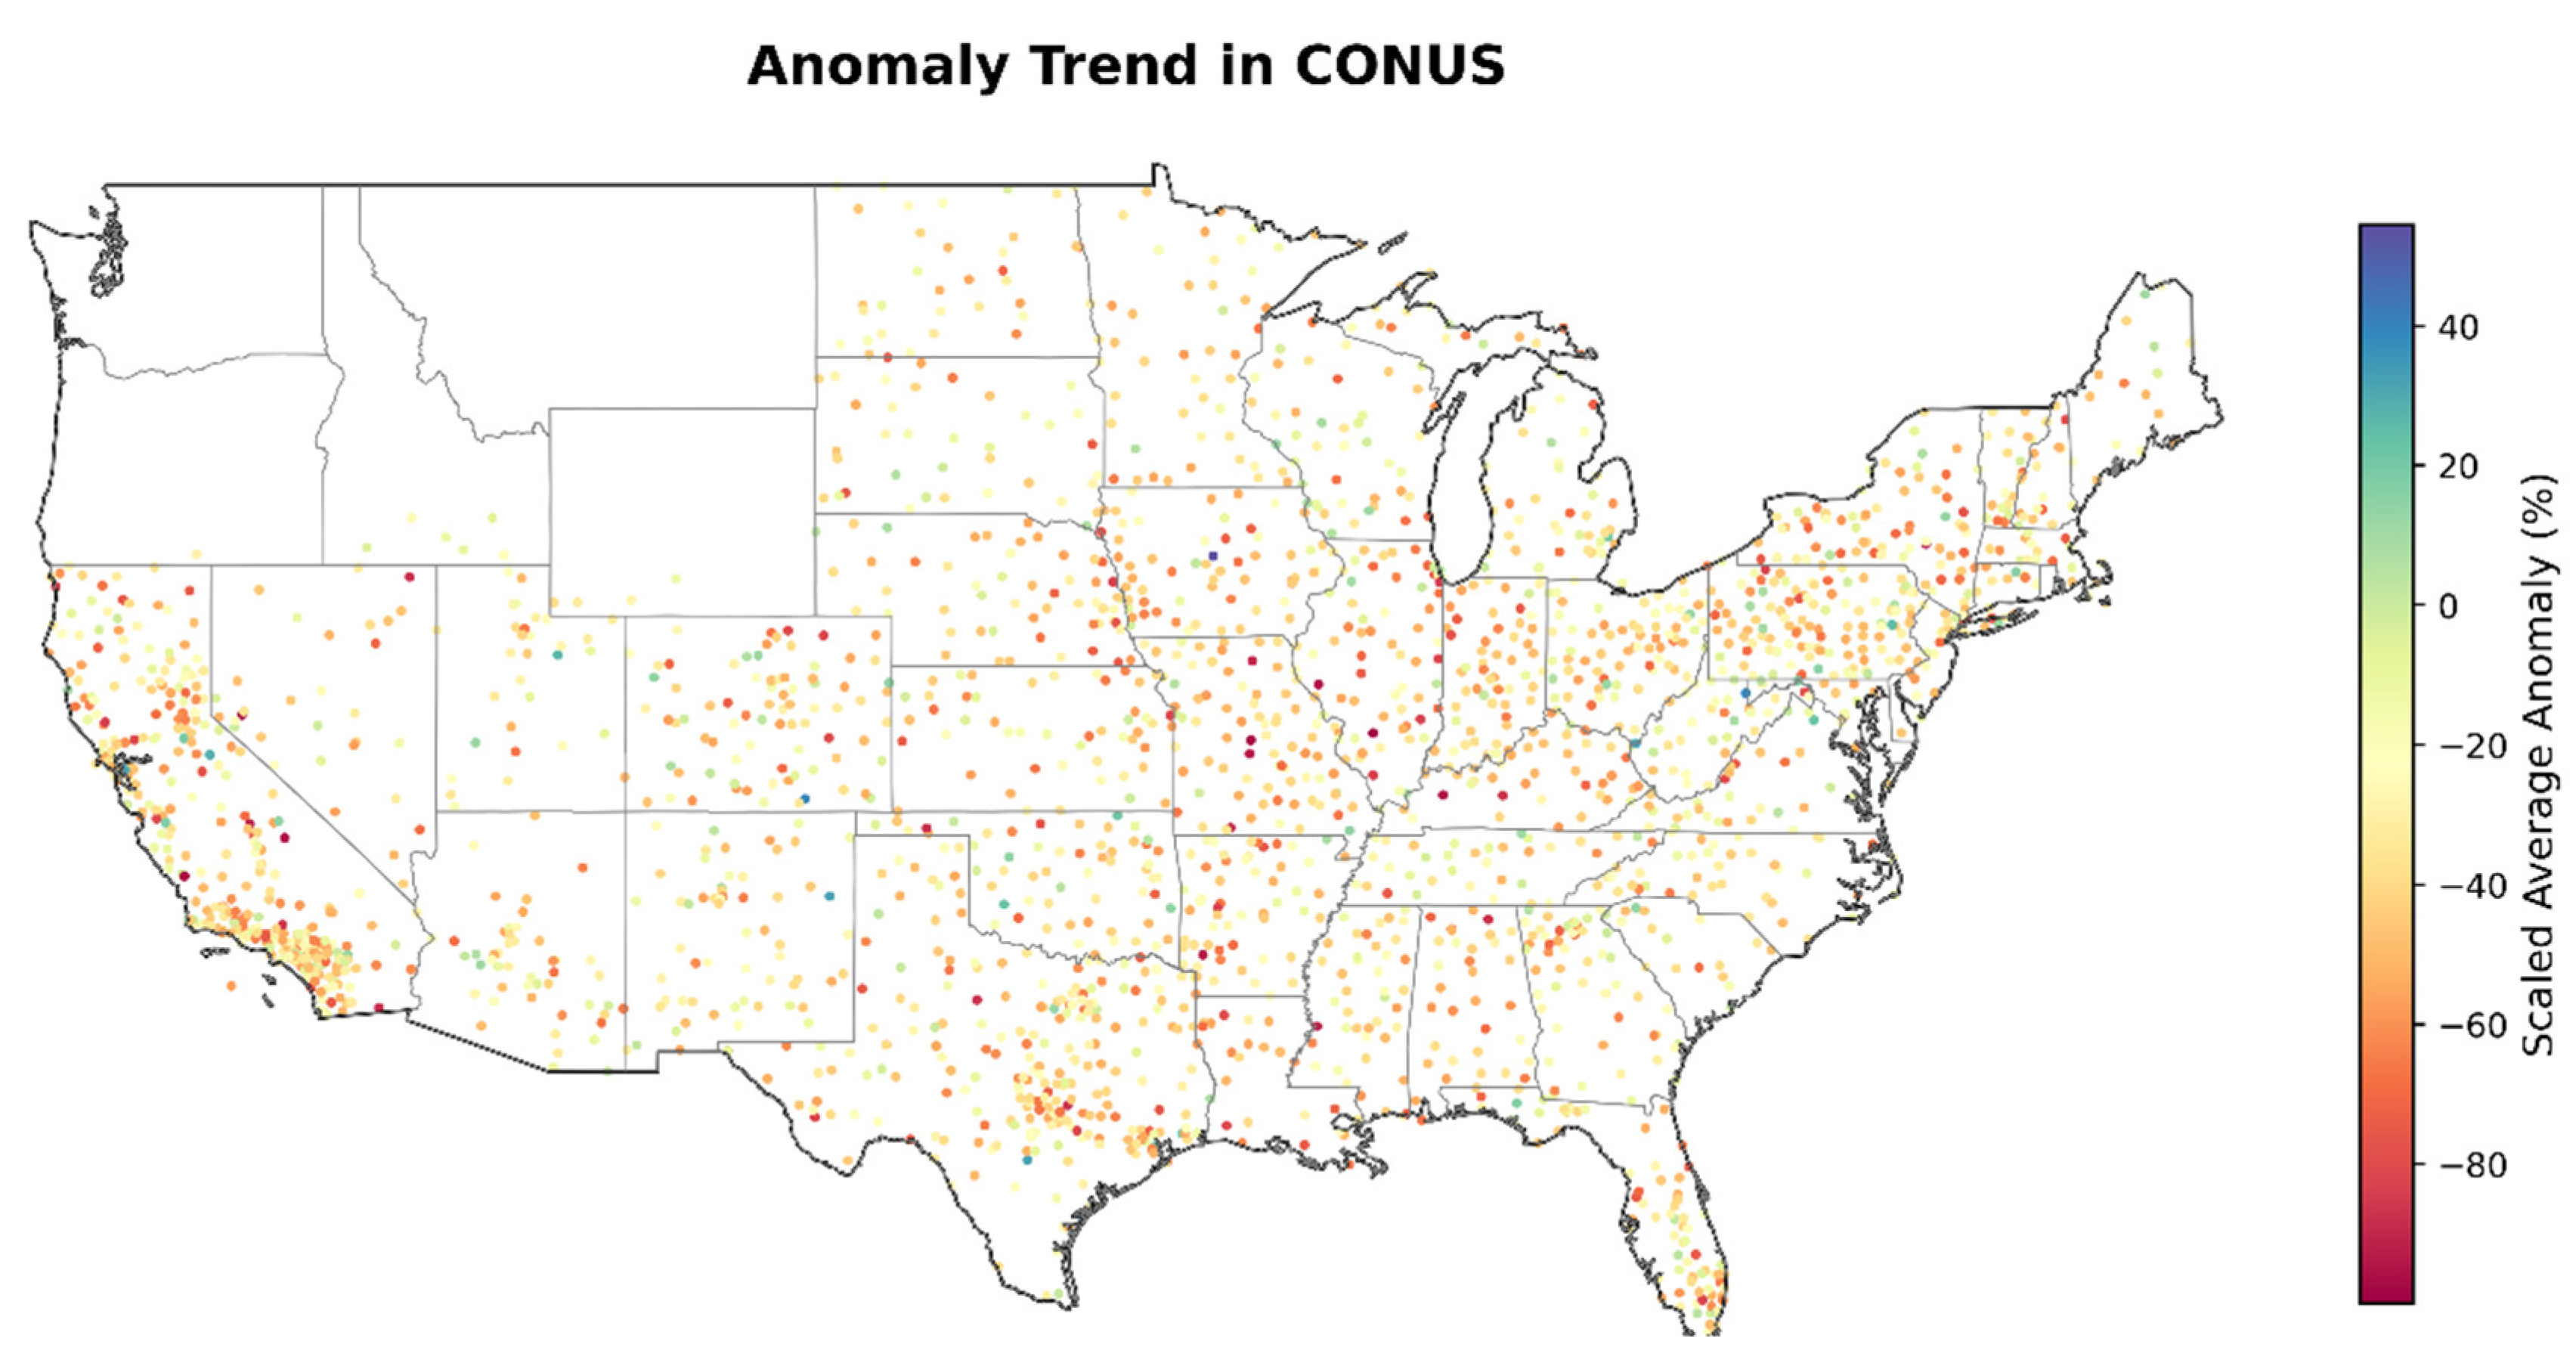
Figure 9.
Visualization of the IMERG Precipitation Extractor in Action. The IMERG IPE is used here to retrieve time series precipitation data averaged over a user-defined bounding box (in purple) for a specified time window.
Figure 9.
Visualization of the IMERG Precipitation Extractor in Action. The IMERG IPE is used here to retrieve time series precipitation data averaged over a user-defined bounding box (in purple) for a specified time window.
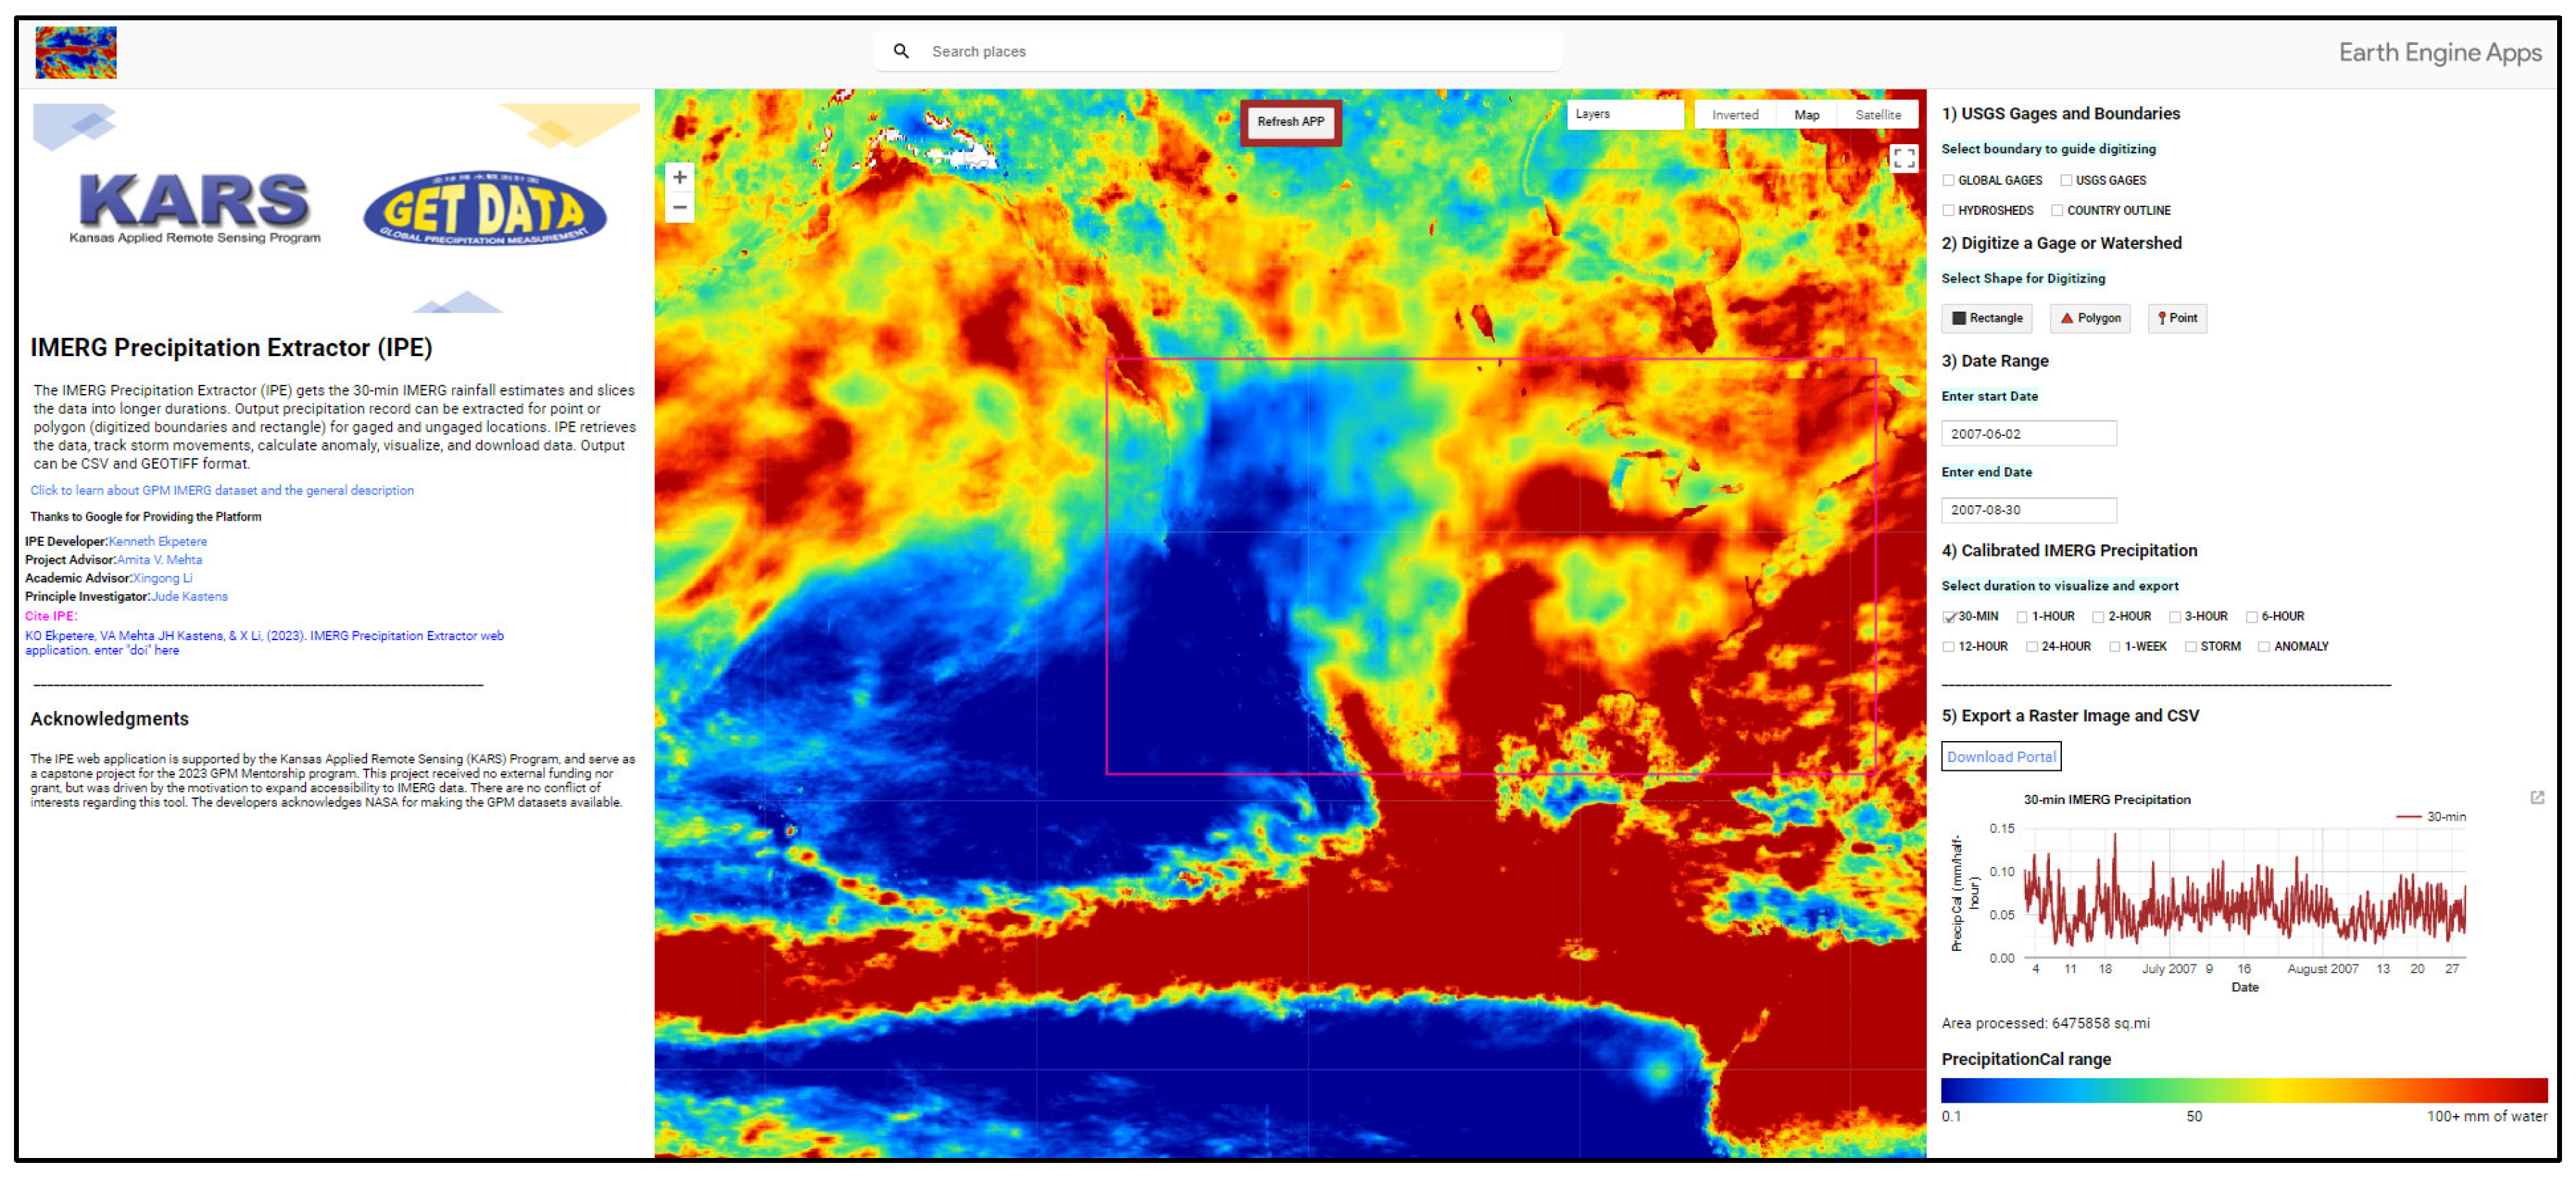
Figure 10.
Visualization of the IMERG Precipitation Extractor in Action. Here, the IMERG IPE tracks storm movement over a bounding box (in purple) across a user-defined time window. The storm tracking feature records, visualizes, and allows the download of storm signatures from initiation through formation, movement, and dissipation stages.
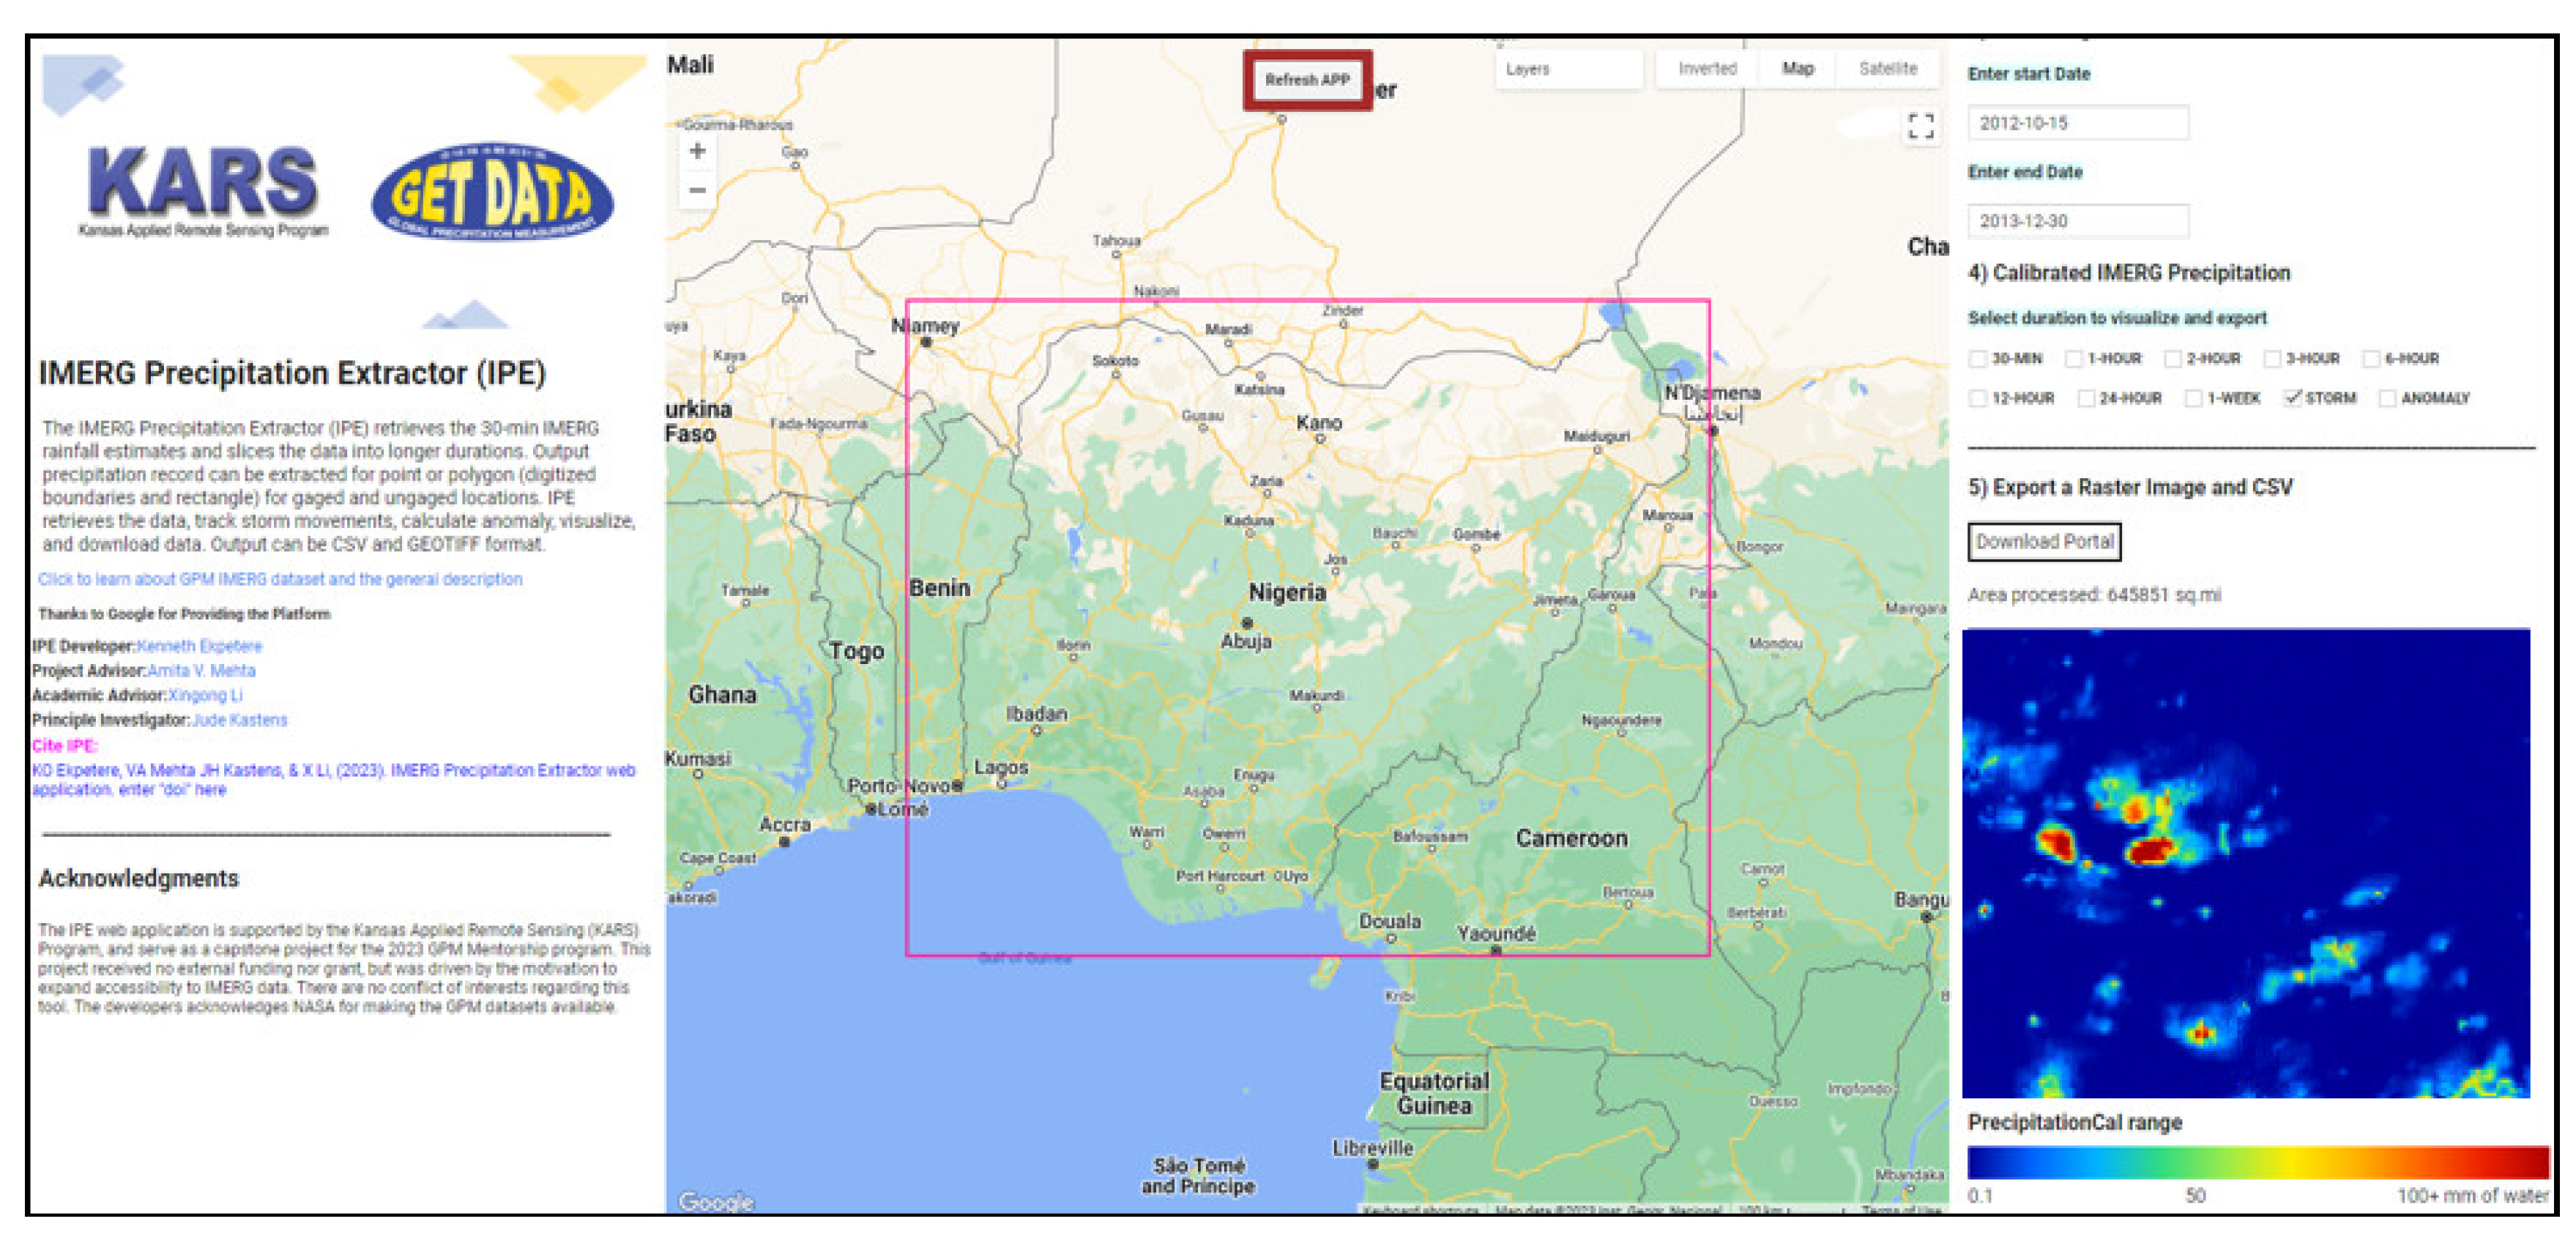
Figure 11.
Visualization of the IMERG Precipitation Extractor in Action. Here, the IMERG IPE computes the anomaly index over a bounding box (in purple) for a user-defined time window. The computed anomaly index can be exported directly to a specified location.
Figure 11.
Visualization of the IMERG Precipitation Extractor in Action. Here, the IMERG IPE computes the anomaly index over a bounding box (in purple) for a user-defined time window. The computed anomaly index can be exported directly to a specified location.
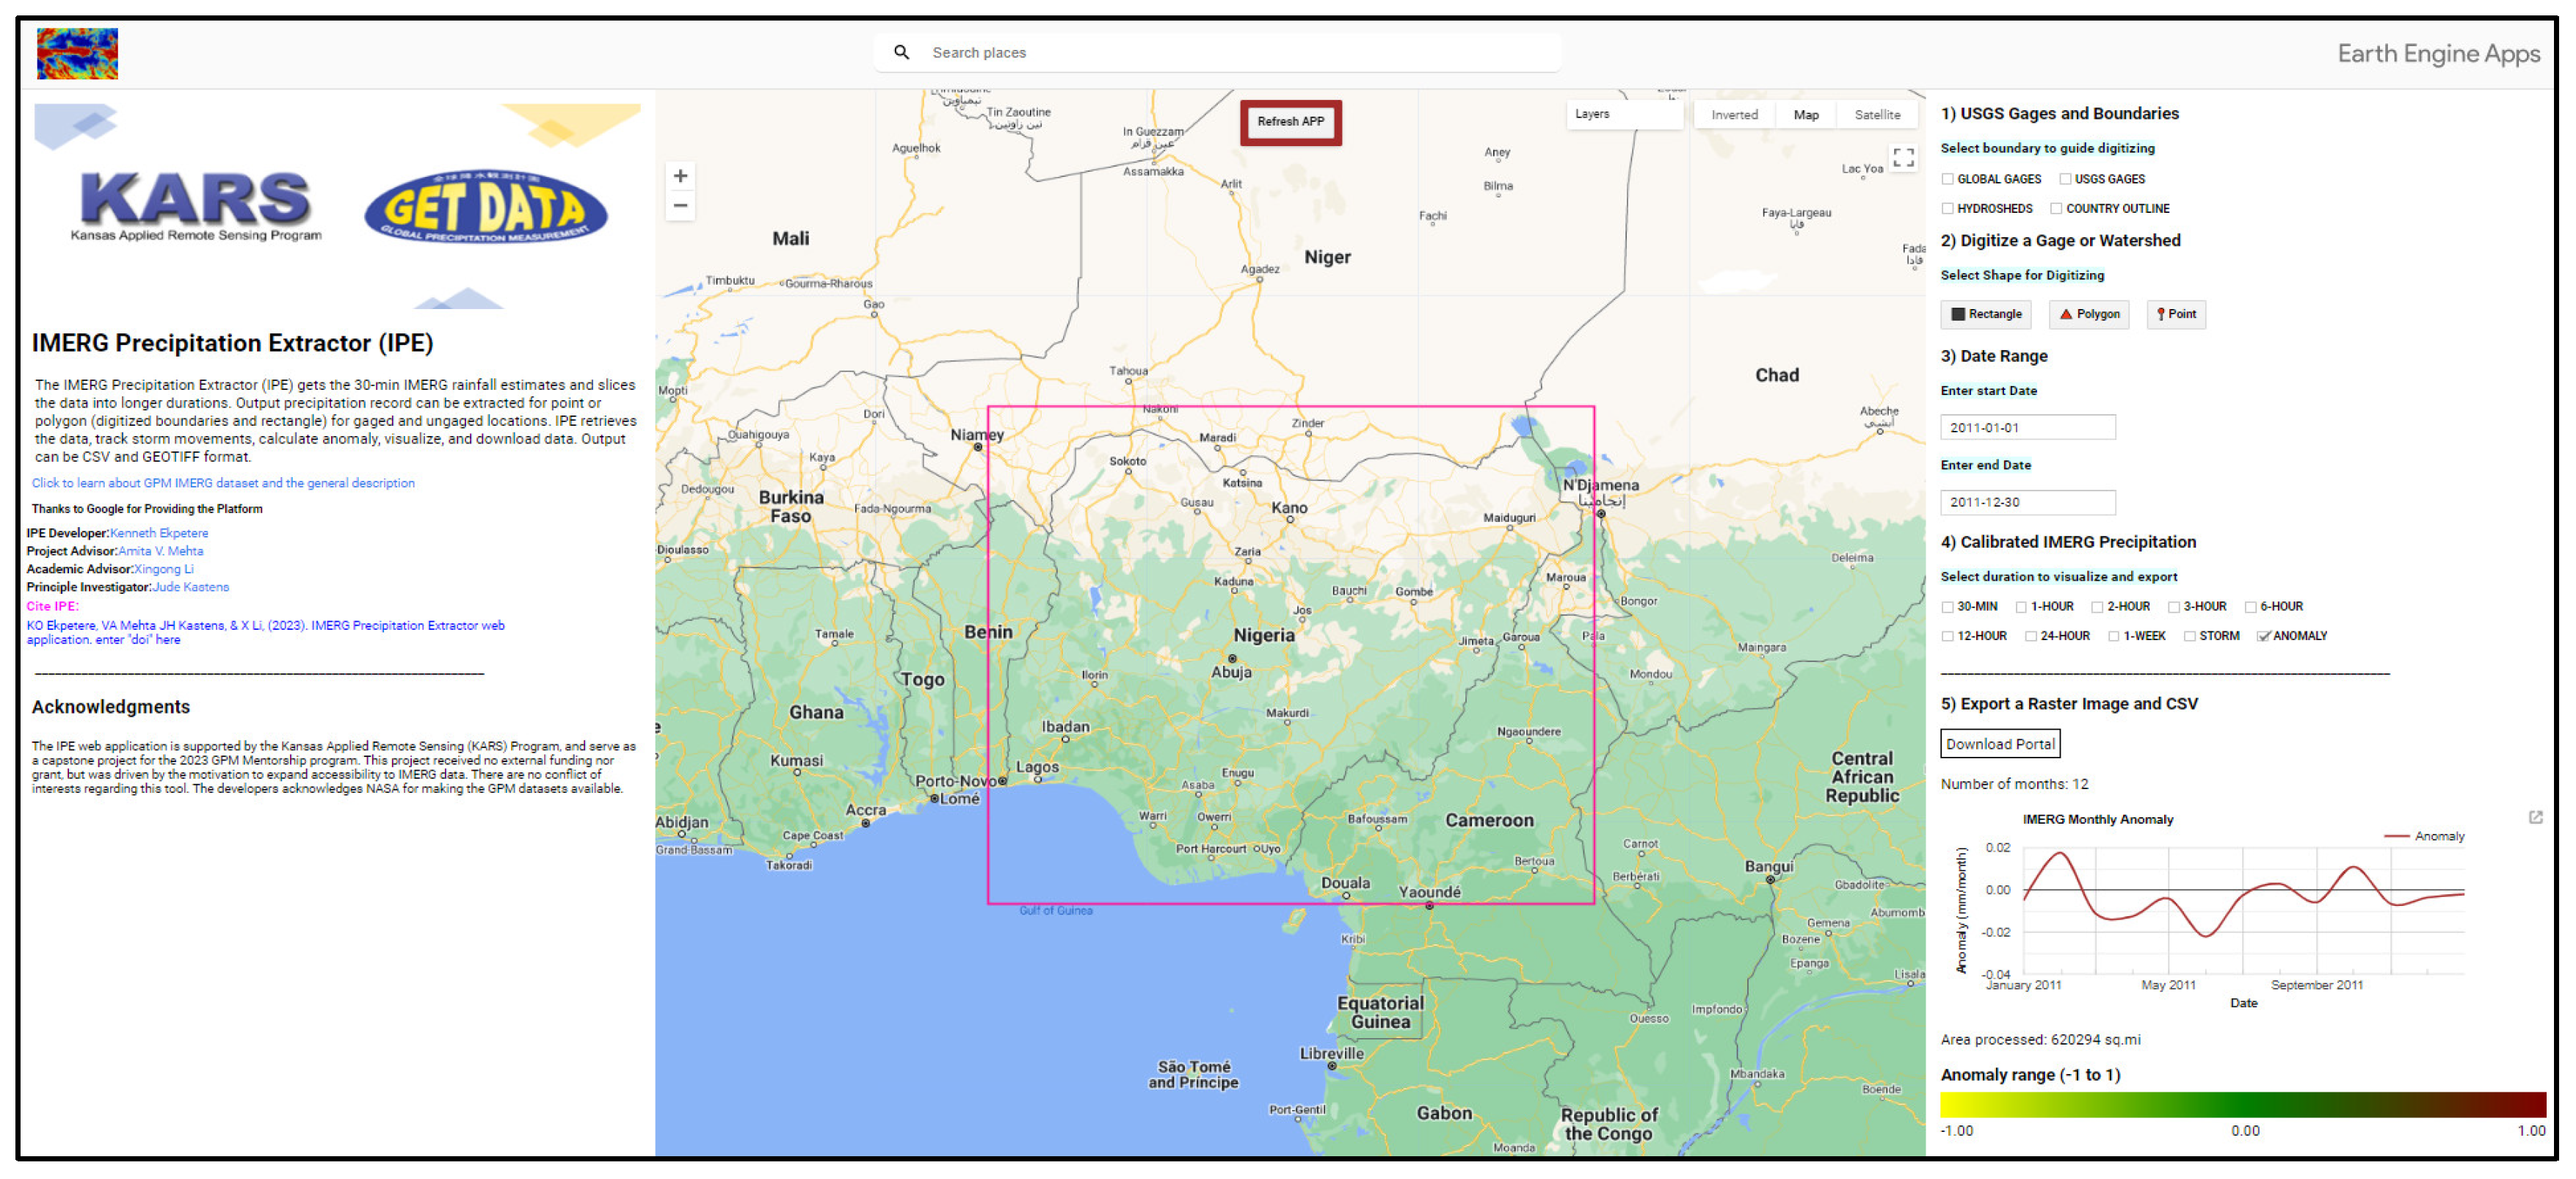

Table 1.
Comparisons Between NOAA Station Data and IMERG Satellite Precipitation Data.
| Characteristics | NOAA station Data | IMERG Satellite Data |
| Spatial Resolution | ≥ 200 m (varies) | 0.1˚ (~11 km) |
| Temporal Resolution | 5-min to 60-days | Half-hourly |
| Period | 2001 – 2022 | 2001 – 2022 |
| Sensor(s) | Rain gages | GMI & DPR |
| Area coverage | CONUS | Global |
| Calibration | Gage | TRMM, TMPA, & GPCC |
| Ownership | NOAA | NASA & JAXA |
| Reference | [20] | (Huffman et al., 2020) |
| RAI | Class description |
| ≥ 3.00 | Extremely wet |
| 2.00 to 2.99 | Very wet |
| 1.00 to 1.99 | Moderately wet |
| 0.50 to 0.99 | Slightly wet |
| -0.49 to 0.49 | Near normal |
| -0.99 to -0.50 | Slightly dry |
| -1.99 to -1.00 | Moderately dry |
| -2.99 to -2.00 | Very dry |
| ≤ -3.00 | Extremely dry |
Table 3.
Evaluation metrics used for evaluation of the IMERG and NOAA rainfall anomaly index. P represents IMERG, O NOAA station values, N is a set 2360 stations, μ is the mean, S standard deviation.
Table 3.
Evaluation metrics used for evaluation of the IMERG and NOAA rainfall anomaly index. P represents IMERG, O NOAA station values, N is a set 2360 stations, μ is the mean, S standard deviation.
| Statistics | Formula | Range | Optimal Value | Unit |
|---|---|---|---|---|
| Correlation Coefficient (CC) | -1 to 1 | 1 | Unitless | |
| Percentage Relative Bias (PRB) | -∞ to +∞ | 0 | % | |
| Root Mean Square Error (RMSE) | 0 to +∞ | 0 | Unitless | |
| Mean Bias Ratio (MBR) | 0 to 1 | 1 | Unitless | |
| Nash-Sutcliffe Efficiency(NSE) | 0 to 1 | 1 | Unitless | |
| Kling-Gupta Efficiency(KGE) | -∞ to 1 | 1 | Unitless |
Table 4.
Comparison of IMERG and NOAA RAI Indices from 2,360 Stations in CONUS at Yearly Resolution (2001–2022).
Table 4.
Comparison of IMERG and NOAA RAI Indices from 2,360 Stations in CONUS at Yearly Resolution (2001–2022).
| Year | CC | PRB (%) | RMSE | MBR | NSE | KGE |
|---|---|---|---|---|---|---|
| 2001 | 0.93 | -15.29 | 0.94 | 0.85 | 0.79 | 0.63 |
| 2002 | 0.94 | -17.09 | 0.92 | 0.83 | 0.81 | 0.63 |
| 2003 | 0.94 | -4.40 | 1.00 | 0.96 | 0.78 | 0.62 |
| 2004 | 0.92 | -46.61 | 1.07 | 0.53 | 0.77 | 0.42 |
| 2005 | 0.94 | -67.37 | 0.92 | 0.33 | 0.85 | 0.28 |
| 2006 | 0.93 | -23.30 | 0.93 | 0.77 | 0.79 | 0.58 |
| 2007 | 0.94 | -14.19 | 0.97 | 0.86 | 0.81 | 0.65 |
| 2008 | 0.93 | -77.50 | 1.01 | 0.23 | 0.79 | 0.16 |
| 2009 | 0.93 | -15.90 | 0.95 | 0.84 | 0.79 | 0.61 |
| 2010 | 0.93 | -84.24 | 1.01 | 0.16 | 0.79 | 0.09 |
| 2011 | 0.94 | -12.18 | 0.98 | 0.88 | 0.80 | 0.64 |
| 2012 | 0.94 | -14.30 | 0.88 | 0.86 | 0.84 | 0.70 |
| 2013 | 0.94 | -17.97 | 0.94 | 0.82 | 0.82 | 0.63 |
| 2014 | 0.94 | -15.18 | 0.93 | 0.85 | 0.81 | 0.64 |
| 2015 | 0.94 | 9.06 | 0.97 | 1.00 | 0.83 | 0.69 |
| 2016 | 0.94 | -4.16 | 0.96 | 0.96 | 0.81 | 0.67 |
| 2017 | 0.94 | -2.67 | 0.97 | 0.97 | 0.81 | 0.67 |
| 2018 | 0.94 | 1.05 | 0.98 | 1.00 | 0.77 | 0.60 |
| 2019 | 0.93 | -15.13 | 0.93 | 0.85 | 0.79 | 0.61 |
| 2020 | 0.94 | 62.83 | 1.00 | 1.00 | 0.80 | 0.29 |
| 2021 | 0.93 | -85.50 | 1.01 | 0.15 | 0.80 | 0.08 |
| 2022 | 0.94 | -30.92 | 0.92 | 0.69 | 0.86 | 0.64 |
| Min | 0.92 | -85.50 | 0.88 | 0.15 | 0.77 | 0.08 |
| Max | 0.94 | 62.83 | 1.07 | 1.00 | 0.86 | 0.70 |
| Std. Dev | 0.00 | 33.70 | 0.04 | 0.28 | 0.02 | 0.20 |
| Mean | 0.94 | -22.32 | 0.96 | 0.74 | 0.80 | 0.52 |
Table 5.
Performance of IMERG in detecting rainfall anomalies in dry Nevada.
| ID | Lat | Lon | CC | PRB | RMSE | MBR | NSE | KGE |
|---|---|---|---|---|---|---|---|---|
| 269234 | 40.4344 | -95.3883 | 0.95 | 41.29 | 0.91 | 1.00 | 0.84 | 0.50 |
| 269171 | 40.0825 | -93.6086 | 0.96 | 83.92 | 0.84 | 1.00 | 0.88 | 0.12 |
| 268988 | 37.2333 | -91.8833 | 0.95 | 273.52 | 1.12 | 1.00 | 0.78 | -1.76 |
| 268977 | 38.9483 | -94.3969 | 0.93 | -124.83 | 1.02 | 0.00 | 0.78 | -0.30 |
| 268838 | 37.7119 | -91.1328 | 0.96 | 13.50 | 0.77 | 1.00 | 0.90 | 0.74 |
| 268822 | 38.2017 | -91.9811 | 0.96 | 37.02 | 0.94 | 1.00 | 0.84 | 0.50 |
| 268170 | 36.9231 | -90.2836 | 0.94 | -31.74 | 0.95 | 0.68 | 0.77 | 0.52 |
| 267908 | 38.5425 | -90.9719 | 0.92 | -10.15 | 1.10 | 0.90 | 0.77 | 0.63 |
| 267640 | 36.8581 | -92.5875 | 0.98 | 6.47 | 0.65 | 1.00 | 0.92 | 0.77 |
| 267620 | 38.8128 | -90.8561 | 0.95 | -46.70 | 0.89 | 0.53 | 0.84 | 0.45 |
| 267612 | 36.7425 | -91.8347 | 0.95 | 183.83 | 0.83 | 1.00 | 0.86 | -0.86 |
| 267397 | 42.5522 | -99.8556 | 0.94 | 38.71 | 0.98 | 1.00 | 0.80 | 0.48 |
| 267369 | 42.2342 | -98.9156 | 0.96 | -39.67 | 0.89 | 0.60 | 0.85 | 0.50 |
| 266630 | 41.5975 | -99.8258 | 0.93 | -41.01 | 1.03 | 0.59 | 0.77 | 0.44 |
| 265880 | 42.0686 | -102.584 | 0.95 | 56.82 | 0.93 | 1.00 | 0.83 | 0.35 |
| 265869 | 41.2481 | -98.7989 | 0.97 | -22.74 | 0.75 | 0.77 | 0.90 | 0.67 |
| 265441 | 42.5800 | -99.54 | 0.96 | -28.89 | 0.92 | 0.71 | 0.84 | 0.57 |
| 265362 | 40.2994 | -96.75 | 0.95 | 3.95 | 0.94 | 1.00 | 0.82 | 0.66 |
| 265191 | 41.3686 | -96.095 | 0.98 | 64.55 | 0.59 | 1.00 | 0.94 | 0.33 |
| 264651 | 41.0469 | -102.147 | 0.94 | -43.67 | 1.11 | 0.56 | 0.76 | 0.40 |
| Min | 0.92 | -124.83 | 0.59 | 0.00 | 0.76 | -1.76 | ||
| Max | 0.98 | 273.52 | 1.12 | 1.00 | 0.94 | 0.77 | ||
| Std. Dev | 0.02 | 87.26 | 0.14 | 0.26 | 0.05 | 0.61 | ||
| Mean | 0.95 | 20.71 | 0.91 | 0.82 | 0.83 | 0.29 | ||
Table 6.
Performance of IMERG for Rainfall Anomaly Detection in Humid Louisiana.
| ID | Lat | Lon | CC | PRB | RMSE | MBR | NSE | KGE |
|---|---|---|---|---|---|---|---|---|
| 169803 | 41.0333 | -81.0167 | 0.95 | 9.90 | 0.80 | 1.00 | 0.88 | 0.74 |
| 169357 | 41.4619 | -84.5272 | 0.94 | -37.68 | 1.09 | 0.62 | 0.78 | 0.47 |
| 168539 | 41.4667 | -81.1667 | 0.94 | -49.55 | 1.03 | 0.50 | 0.80 | 0.40 |
| 168440 | 40.0167 | -81.5833 | 0.93 | -11.48 | 0.81 | 0.89 | 0.83 | 0.70 |
| 168067 | 40.7667 | -81.3833 | 0.87 | 24.54 | 0.99 | 1.00 | 0.72 | 0.57 |
| 167932 | 40.3000 | -82.65 | 0.94 | 32.04 | 0.92 | 1.00 | 0.82 | 0.55 |
| 167738 | 40.7400 | -82.3569 | 0.93 | -16.59 | 0.83 | 0.83 | 0.82 | 0.68 |
| 166978 | 39.3744 | -83.0036 | 0.96 | 422.46 | 0.82 | 1.00 | 0.87 | -3.23 |
| 166664 | 38.7983 | -84.1731 | 0.93 | -90.27 | 1.11 | 0.10 | 0.77 | 0.03 |
| 166660 | 41.0517 | -81.9361 | 0.93 | -40.84 | 1.13 | 0.59 | 0.76 | 0.43 |
| 166582 | 39.1000 | -84.5167 | 0.95 | 5.43 | 0.84 | 1.00 | 0.85 | 0.71 |
| 166394 | 39.6106 | -82.9547 | 0.94 | -80.95 | 1.04 | 0.19 | 0.77 | 0.11 |
| 166324 | 41.4050 | -81.8528 | 0.92 | 354.06 | 1.16 | 1.00 | 0.74 | -2.56 |
| 166305 | 40.8833 | -80.6833 | 0.92 | -36.52 | 1.12 | 0.63 | 0.75 | 0.47 |
| 166244 | 39.9914 | -82.8808 | 0.93 | -28.00 | 0.83 | 0.72 | 0.82 | 0.61 |
| 165620 | 41.9833 | -80.5667 | 0.91 | -13.79 | 1.02 | 0.86 | 0.75 | 0.61 |
| 165266 | 39.9061 | -84.2186 | 0.95 | 55.69 | 0.83 | 1.00 | 0.86 | 0.39 |
| 165078 | 39.6253 | -83.2128 | 0.97 | 12.62 | 0.83 | 1.00 | 0.89 | 0.72 |
| 164816 | 41.2833 | -84.3833 | 0.94 | -17.11 | 0.77 | 0.83 | 0.84 | 0.68 |
| 164700 | 40.0000 | -82.0833 | 0.90 | 2.44 | 1.15 | 1.00 | 0.72 | 0.59 |
| Min | 0.87 | -90.27 | 0.77 | 0.10 | 0.72 | -3.23 | ||
| Max | 0.97 | 422.46 | 1.16 | 1.00 | 0.89 | 0.74 | ||
| Std. Dev | 0.02 | 129.73 | 0.14 | 0.27 | 0.05 | 1.08 | ||
| Mean | 0.93 | 24.82 | 0.96 | 0.79 | 0.80 | 0.18 | ||
Disclaimer/Publisher’s Note: The statements, opinions and data contained in all publications are solely those of the individual author(s) and contributor(s) and not of MDPI and/or the editor(s). MDPI and/or the editor(s) disclaim responsibility for any injury to people or property resulting from any ideas, methods, instructions or products referred to in the content. |
© 2024 by the authors. Licensee MDPI, Basel, Switzerland. This article is an open access article distributed under the terms and conditions of the Creative Commons Attribution (CC BY) license (http://creativecommons.org/licenses/by/4.0/).
Copyright: This open access article is published under a Creative Commons CC BY 4.0 license, which permit the free download, distribution, and reuse, provided that the author and preprint are cited in any reuse.


