Preprint
Article

A Methodologic Approach to Study Large and Complex Landslides: An Application in Central Apennines

Altmetrics

Downloads

67

Views

40

Comments

0

A peer-reviewed article of this preprint also exists.

Submitted:

21 September 2024

Posted:

23 September 2024

You are already at the latest version

Alerts
Abstract
The evaluation of landslide hazard in seismic areas is based on a deterministic analysis to define the stability of the sites. However, deterministic analysis is not able to consider various uncertainties in the analysis process. This paper focuses on the results established by the probabilistic seismic hazard analysis and extends the probabilistic landslide hazard analysis to consider the uncertainties of opposing ground deformations and strength. The work studies the areas between Nibbiano and Sant'Erasmo inhabited centres in the Camerino municipality located in central Italy. The current state of the areas shows dangerous conditions for the building structures. In fact, all constructions present evidence of damage caused by both the 2016 earthquake and slope instability. The studies, carried out through careful geological survey and detailed geophysical investigations, are performed to define the geological, geomorphological and hydrogeological characteristics of the areas and also to run a new analysis aimed to define the material stress-strain behavior. Both inhabited Centers are located on debris deposits with highly variable thicknesses. The key point regards the definition of the depth of unstable mass, its position and its extension. Therefore, this contribution aims to summarize the knowledge of the landslide phenomenon that affected the area, trying to interpret its evolution with new field investigations. Indeed, during the first step, related to the geological and geomorphological detailed surveys, a remarkable geological model was obtained to better interpret the slope dynamics in relation to the structures of this section of the ridge. This model was also confirmed by the geophysical investigations. The study involves a more detailed definition of the landslide perimeter. Indeed, to analyze the phenomenon, it was necessary to study both the local seismic amplification with finite element 2D simulations and the slope stability conditions with finite 3D difference simulation.
Keywords: 
Subject: Environmental and Earth Sciences  -   Geophysics and Geology

1. Introduction

The work shows the study and detailed characterization of a large gravitational phenomenon located on the eastern side of the Umbria-Marche Apennine between the Chienti and Potenza rivers (Figure 1). This Apennine part is characterized by deep gravitational deformations and large landslides which have had a complex geological and geomorphological quaternary evolution [1,2,3,4,5]. In the areas of overthrust, large landslide phenomena have occurred over time, with mechanisms of collapse, overturning and sliding (translational and rotational) which have produced powerful landslide deposits. The objective was to analyze the geomorphological evolution of the gravitational phenomena and the relation between the geological-structural setting and the landslide mechanisms. Furthermore, the aim is to understand the correlation between the bedrock and the gravitational phenomena, also considering the high seismicity of the area. The Nibbiano landslide is the one that best suited our purpose, given the emptying of the large Paleo-landslide accumulation and the bedrock that is not too deep. This setting has facilitated the interpretation of the landslide debris/rock contact. The area was affected by the seismic crisis of 2016 which caused the partial reactivation of various gravitational landslides including the Nibbiano hamlet.

2. Geological Setting

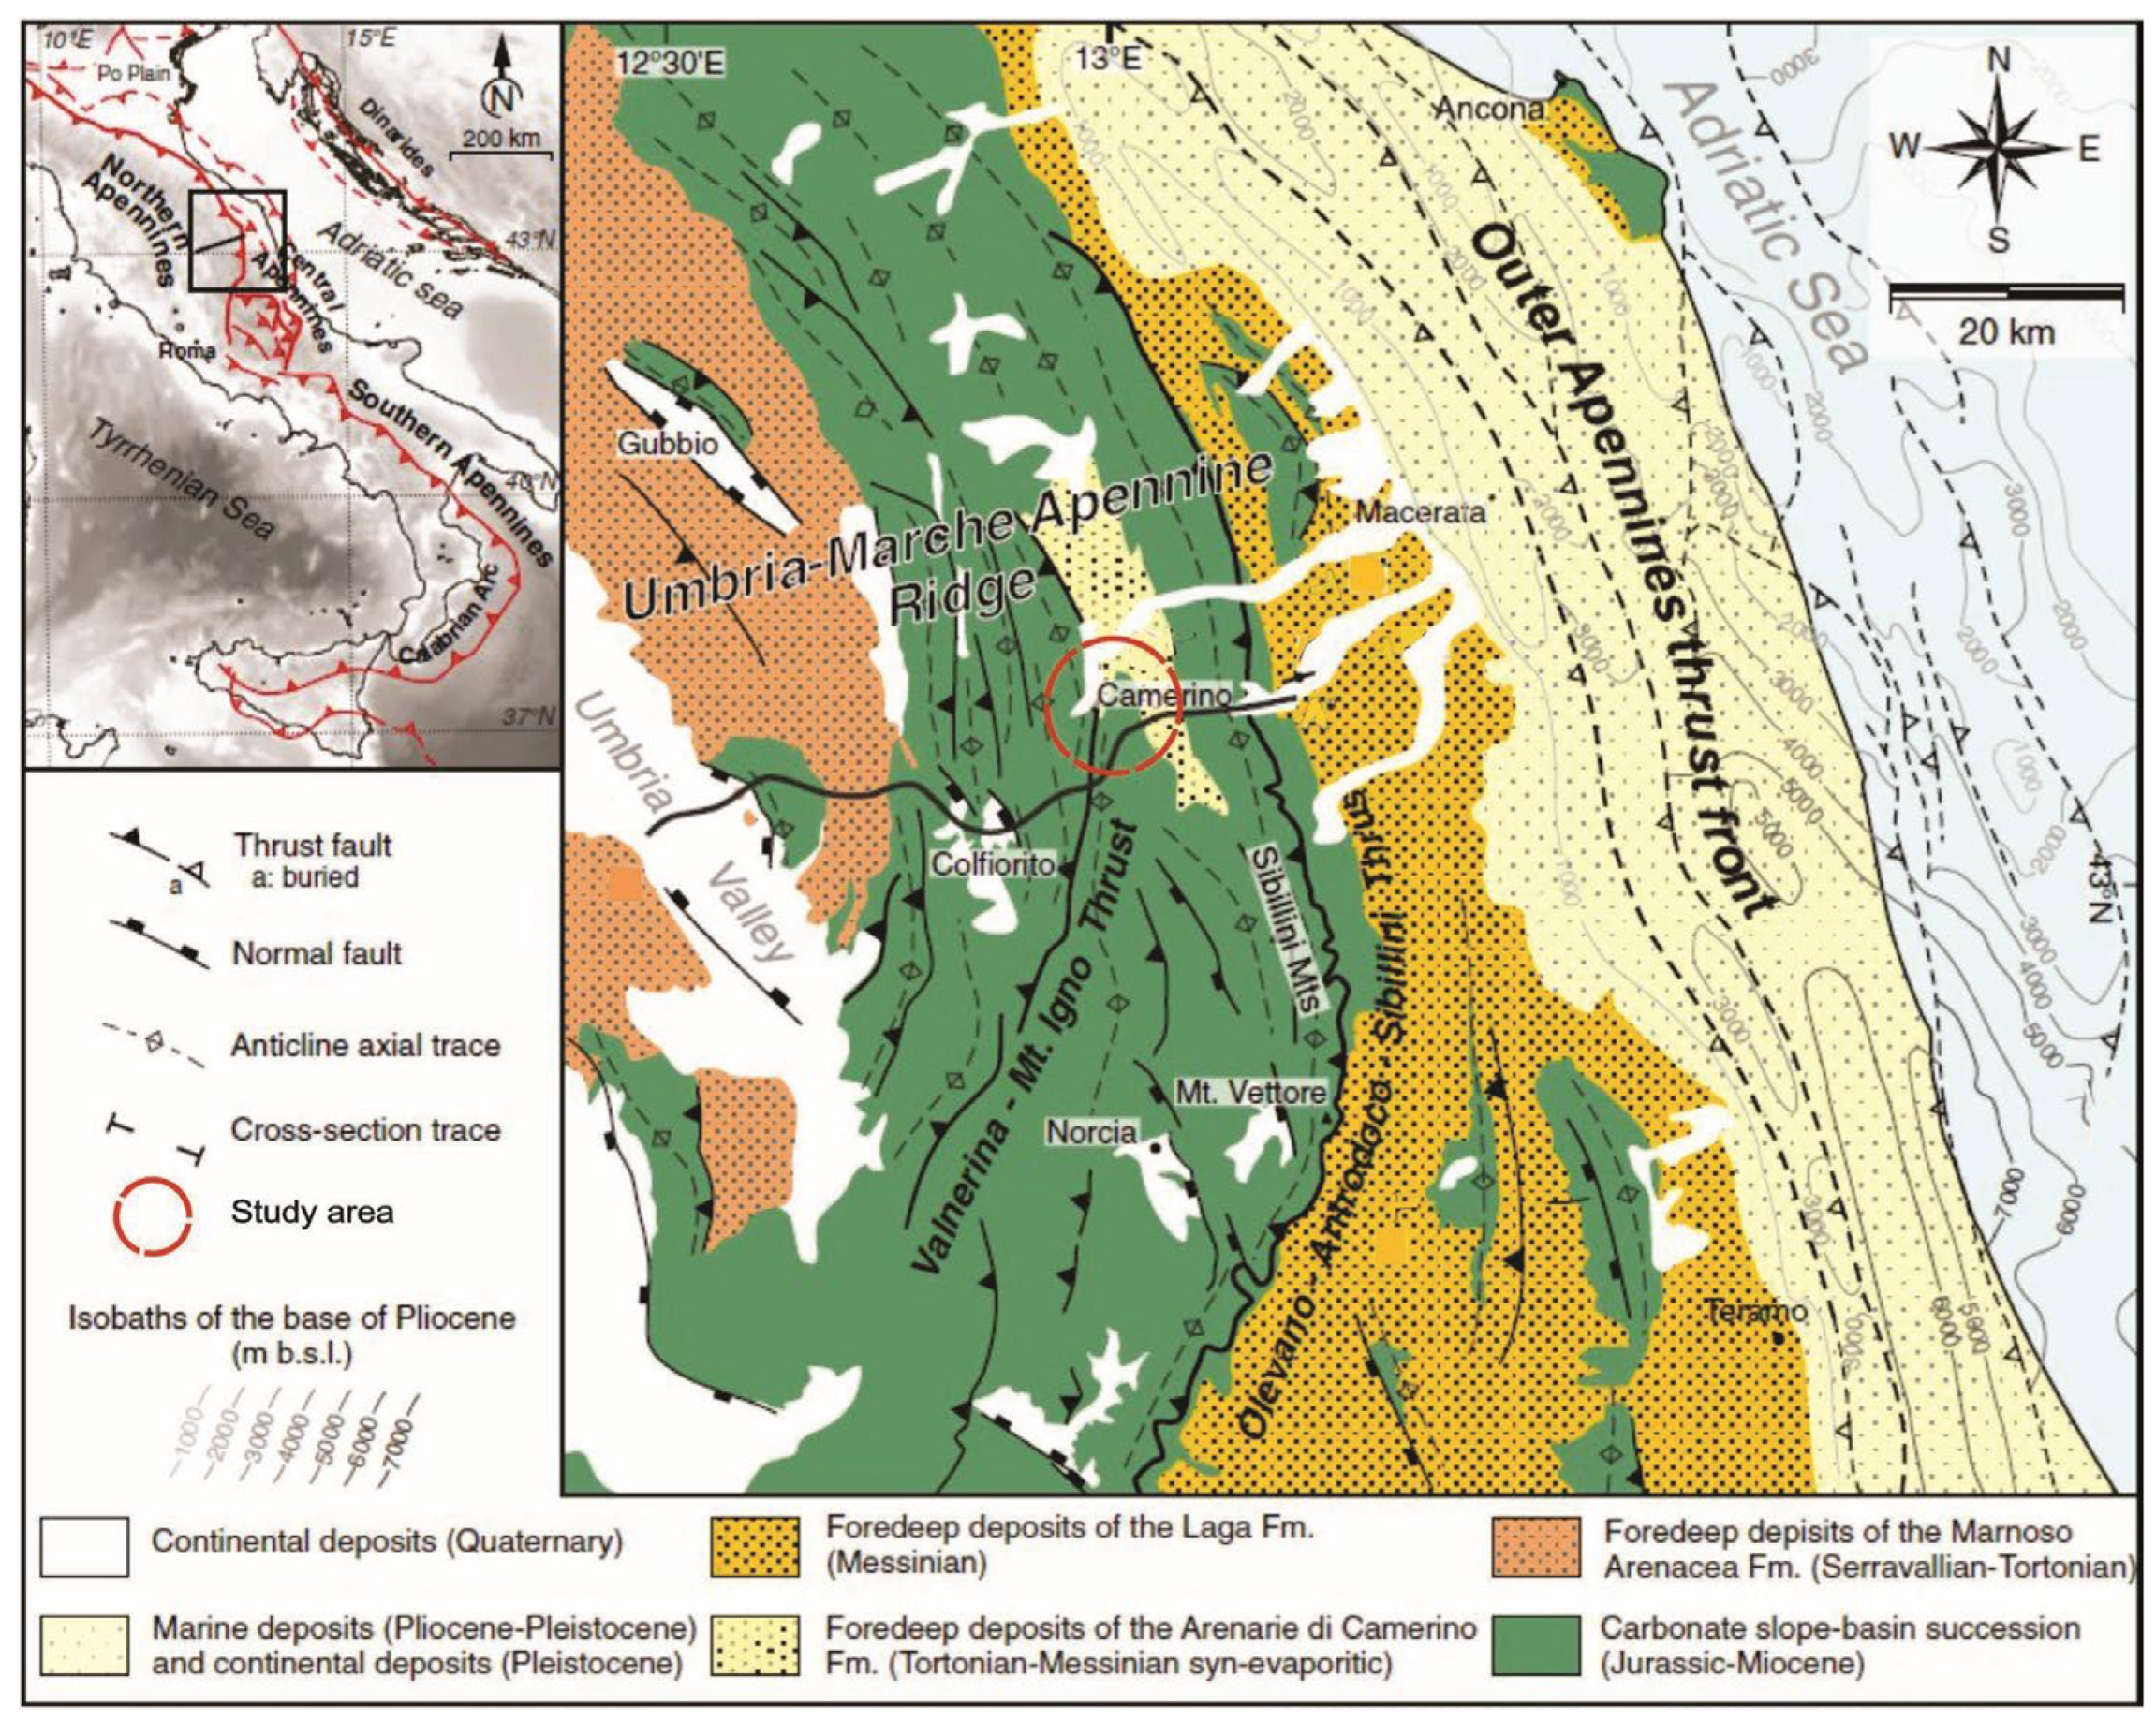
The Umbria-Marche Apennines are represented by an arcuate mountain ridge that stretches for about 450 km and has very pronounced reliefs, with altitudes above 2,000 m above sea level, compared to the adjacent foothills. The Apennine reliefs are mainly made up of pelagic, Jurassic-paleogenic carbonate sediments, deformed by folds and overthrusts associated with Neogene compressive tectonics. The Apennine structure has been classically interpreted according to a model of pellicular tectonics, with imbrication of sedimentary units that have dislodged along Triassic evaporites, on an undeformed and buried crystalline basement [6,7,8]. Quaternary extensional tectonics subsequently disarticulated the edifice in folds and overthrusts with normal faults dipping predominantly towards the WSW that created tectonic basins, even large ones (Figure 2). The examined area is located on the western edge of the Camerino syncline and in particular in the foothills affected by the front of the Valnerina - Monte Igno overthrust (Figure 2).
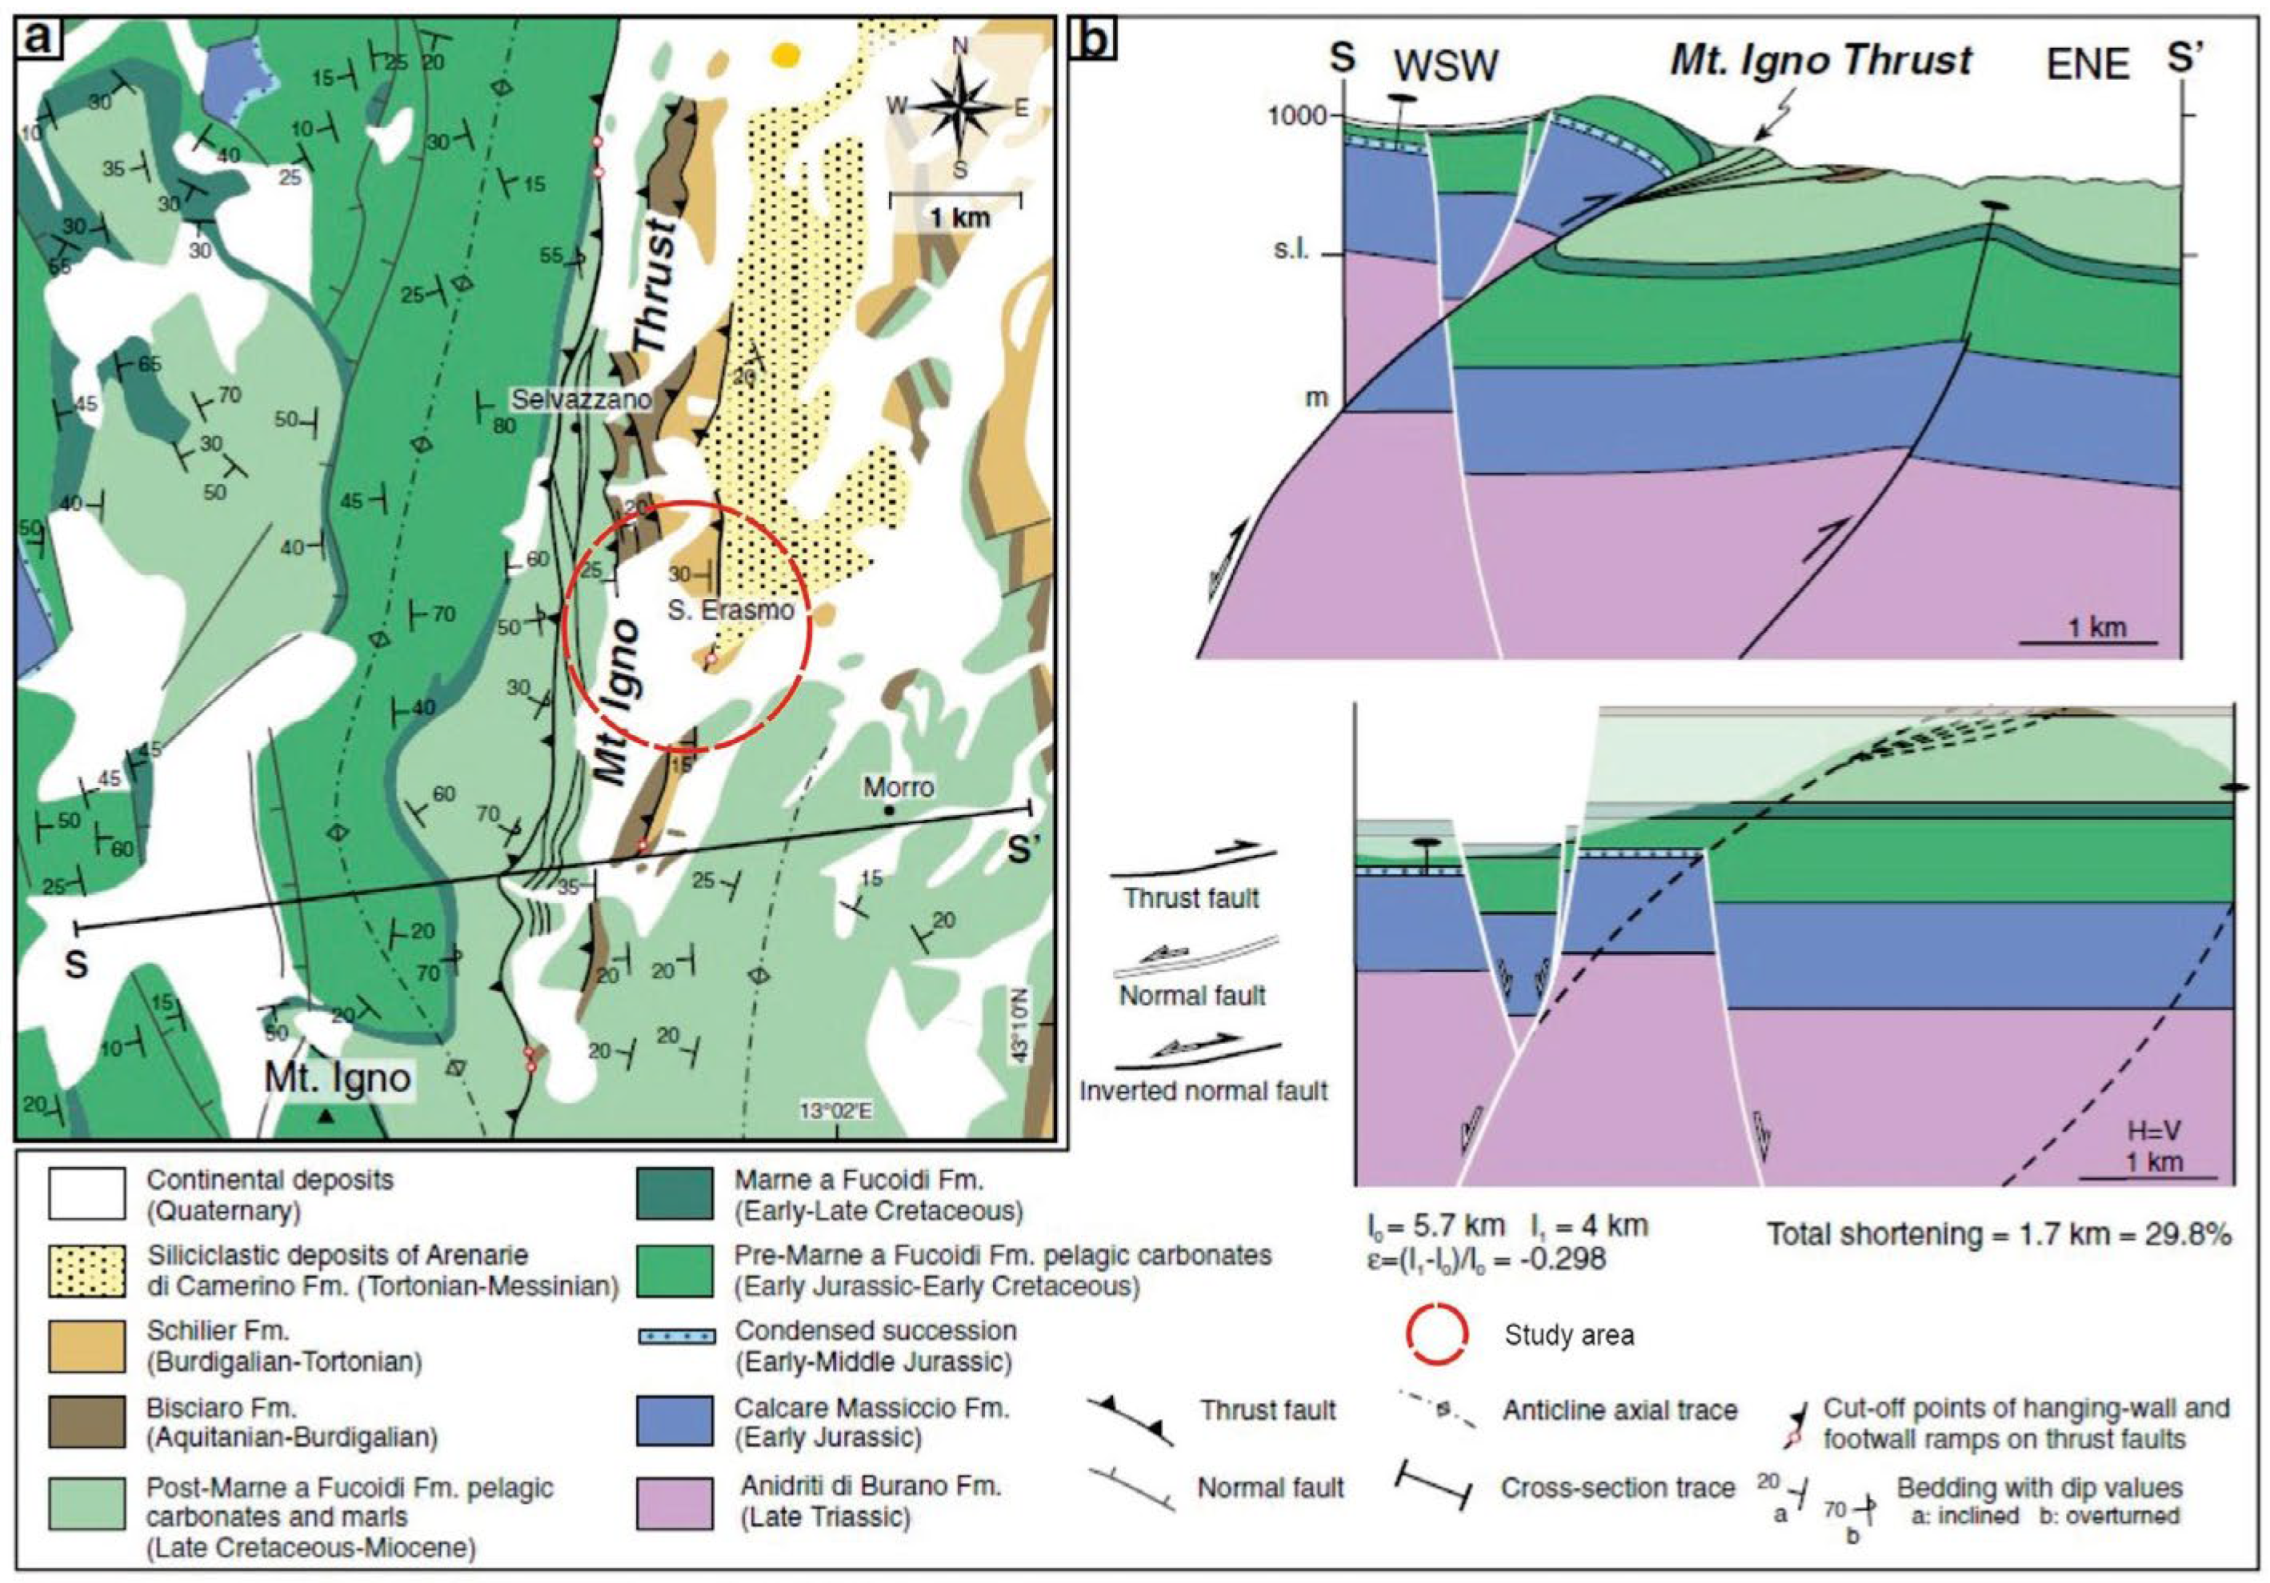
A detailed geological-structural survey was carried out along the Monte Igno overthrust, including a significant area with respect to the Nibbiano landslide phenomenon (Figure 3).
The Monte Igno anticline shows the eastern flank overturned towards the east with predominantly calcareous, calcareous-marly and marly rock formations (Cretaceous-Paleogenic Group) that overlap, through one or more overthrusts, the predominantly marly-calcareous, marly-clayey and arenaceous formations of the Miocene Group. The Cretaceous-Paleogenic Group includes the Marne a Fucoidi (marly limestones and marls), the Scaglia Bianca and Scaglia Rossa (marly limestones and limestones), and the Scaglia Variegata and Scaglia cinerea, the latter consisting mainly of marly-clayey and clayey formations.
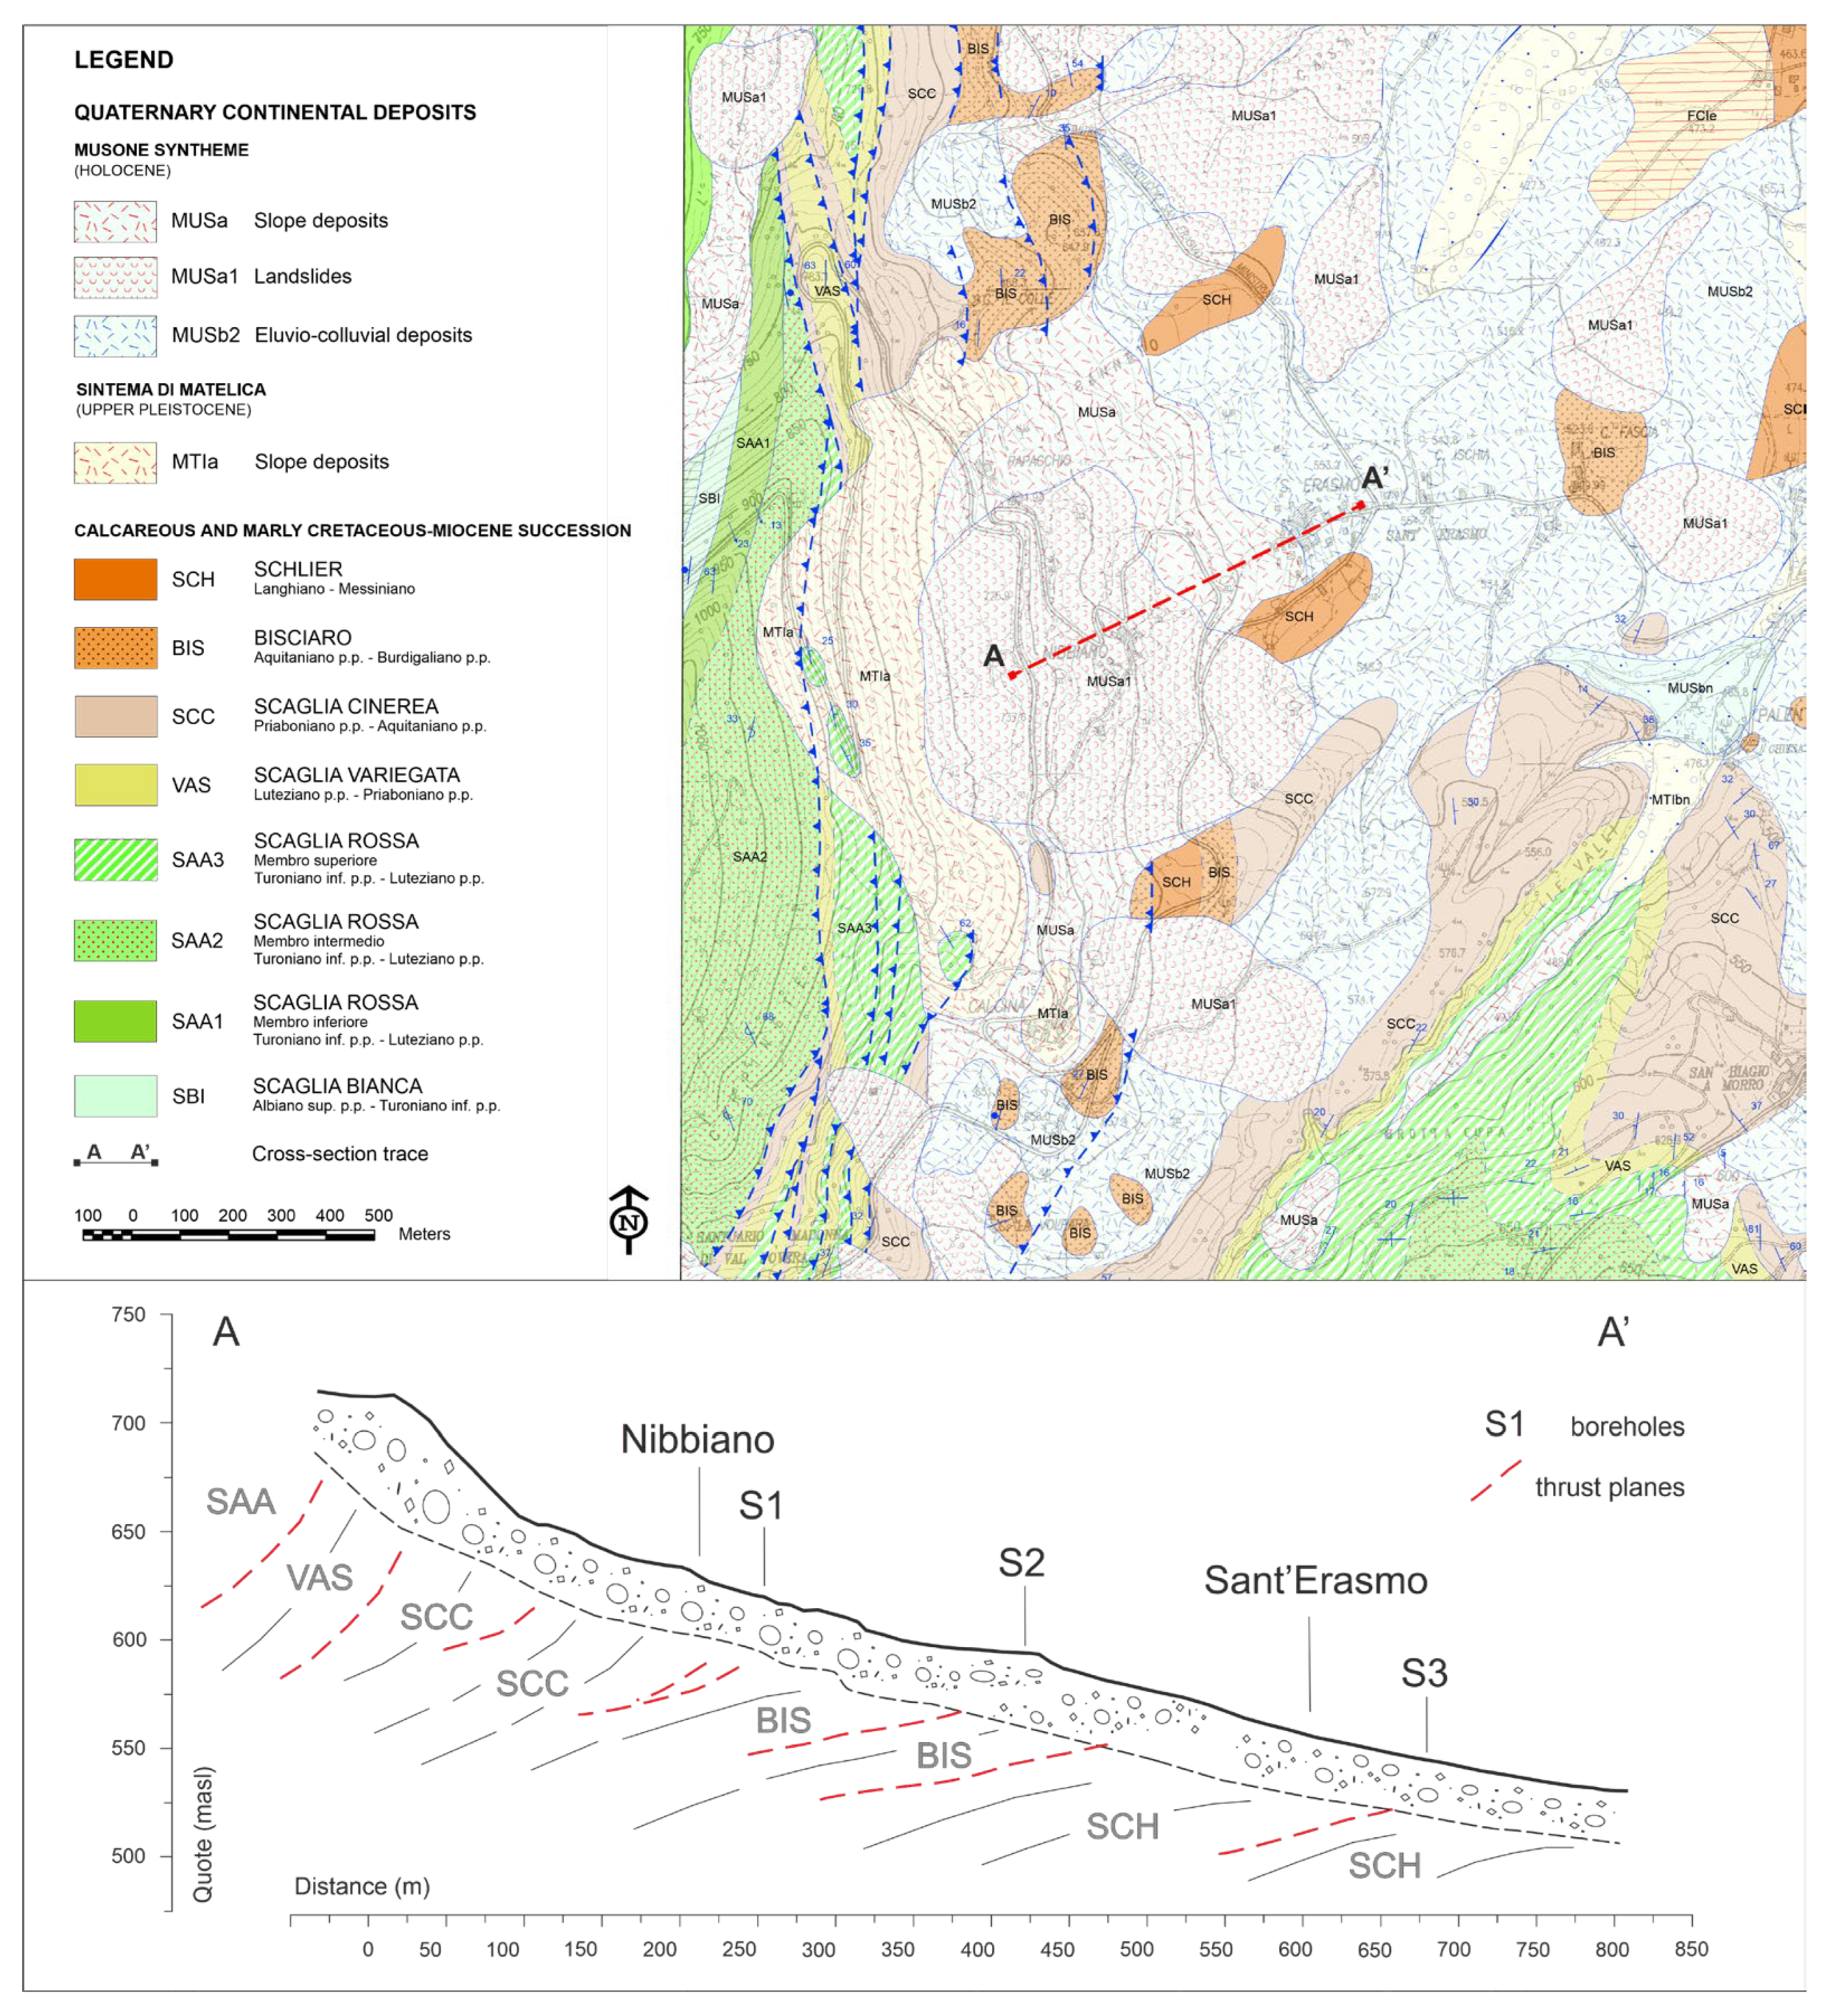
The formations of the Miocene Group include the Bisciaro (marls and marly limestones), the Schlier (marls, calcareous marls and clayey marls) and the Camerino Sandstones, consisting of silicoclastic turbiditic deposits (Figure 4a and Figure 4b).
The geological cross section in figure 4 highlights the lithological and structural characteristics of the Nibbiano landslide bed. In the summit part, roughly corresponding with the detachment niche of the landslide, the contact by overthrusting is realized between the Scaglia Rossa and Scaglia variegata formations with the underlying Scaglia cinerea, the latter outcropping for a wide portion. All the formations involved are characterized by overturned layers, particularly fractured and with pervasive shear zones in the more marly lithotypes. Moreover, the geometric analysis of the numerous thrusts, in the areas not affected by landslide phenomena, highlights slopes of 30°-40° degrees plunging towards the west [3].
The covering coulters consist mainly of debris deposits and landslide accumulations, characterized by heterometric materials, ranging from medium grain sizes to blocks. They have variable friction angles, very low cohesion values and often a high water content.

3. Geomorphological Setting

On a large scale, the hilly system of the area is narrow between the reliefs that border the Camerino basin, and present morphological features fragmented by a dense network of fluvial incisions with coulters of varying thickness. The high energy of the reliefs to the west and the mechanical characteristics of the often-saturated soils have contributed to generating important landslide movements with different states of activity, in many cases also connected to the seismic conditions of the area and the extreme events [9,10,11,12].
In particular, the study area extends along the eastern slopes of the high-hill alignment between the peaks of Mountains Igno (south) and Primo (north) and respectively between the Chienti and Potenza watercourses (Figure 1).
Along this side of the ridge, even from the middle of the slope, there are widespread debris with thicknesses of up to 30-40 m, which in many places mask the outcrop of the thrust plane. This mountain strip is also characterized by several springs, some of considerable discharge, which attest to the emergence of important aquifers.
As a result of the above, the following scenario strongly predisposing to instability is outlined.
  • Steep eastern flank of anticline with the presence of thrust planes, steeply inclined and overturned strata in the upper part and gently dipping stratification in the lower part, sometimes out of the slope.
  • Presence of extensive and thick debris accumulations, resulting from degradation and local fall-type landslides.
  • Situation of local highly saturated deposits.
To better understand the entire deformation phenomenon, as well as the complex relationship between the lithological-structural structure and the morphodynamics of the extended slope, the Nibbiano-Sant'Erasmo area was identified. Here, geomorphologically, the territory appears as emptied, testifying to the considerable activity of mass movements, past and present, as also noted by the authors in comparable geomorphological contexts [1,9,12].
Going into detail, both settlements are in the medium-low portion of the slope of the ridge, at altitudes of 646 meters a.s.l. and 560 meters a.s.l., respectively. They are located on the aforementioned detrital deposits, with varying thicknesses also in relation to the lithological and stratigraphic characteristics that have significantly influenced the morphological structure of the landscape and the development of the settlements.
A morphometric analysis of the system was indispensable in the study of landforms. The aim is to superimpose a quantitative evaluation of their characteristics on the description of the forms. Through morphometry, therefore, it is possible to develop mathematical models that effectively contribute to outlining the evolution of the relief [13,14,15,16]. To increase the accuracy of the analysis, a detailed morphometric study was carried out by acquiring LIDAR data (MASE. Creative Commons - Attribution - 4.0 International) with a ground resolution of 1.0x1.0 meters. The data was appropriately processed with specific algorithms to obtain a general view of the landforms even in those parts currently occupied by residential buildings and/or road infrastructure.
Among the fundamental tools of analysis is certainly the use of the acclivity map, which expresses an initial classification of the territory according to the average slope of the slopes by analyzing geometric factors of length and height. The analysis represents a set of techniques useful for quantitatively describing the morphology of places by calculating the average slope of the grid of listed points, extrapolating them according to various degrees of inclination using the geometric information of the shapes. Slope inclination represents a predisposing factor of considerable importance for slope stability, since it is directly related to the inclination of possible failure planes and/or horizons and therefore correlates with the distribution of landslide phenomena.
Using the digital terrain model (DEM), an analysis of the acclivity and energy of the relief can be carried out by calculating the gradient of the plane tangent to the surface in the direction of maximum slope. This is equivalent to the first derivative of the function expressing the elevation change along the same direction obtained for each cell or pixel.
The result is that which corresponds to the maximum gradient of the 3D surface section analyzed and therefore considered as the gradient of the maximum value according to the following formula.
S l o p e = z x 2 + z y 2
z x = z i + 1 , j + 1 + 2 z i + 1 , j + z i + 1 , j 1 z i 1 , j + 1 + 2 z i 1 , j + z i 1 , j 1 / 8 x
z y = z i + 1 , j + 1 + 2 z i , j + 1 + z i 1 , j + 1 z i + 1 , j 1 + 2 z i , j 1 + z i 1 , j 1 / 8 y
The formula number two represents the gradient in the East-West direction, while the formula number three represents the gradient in the north-south direction.
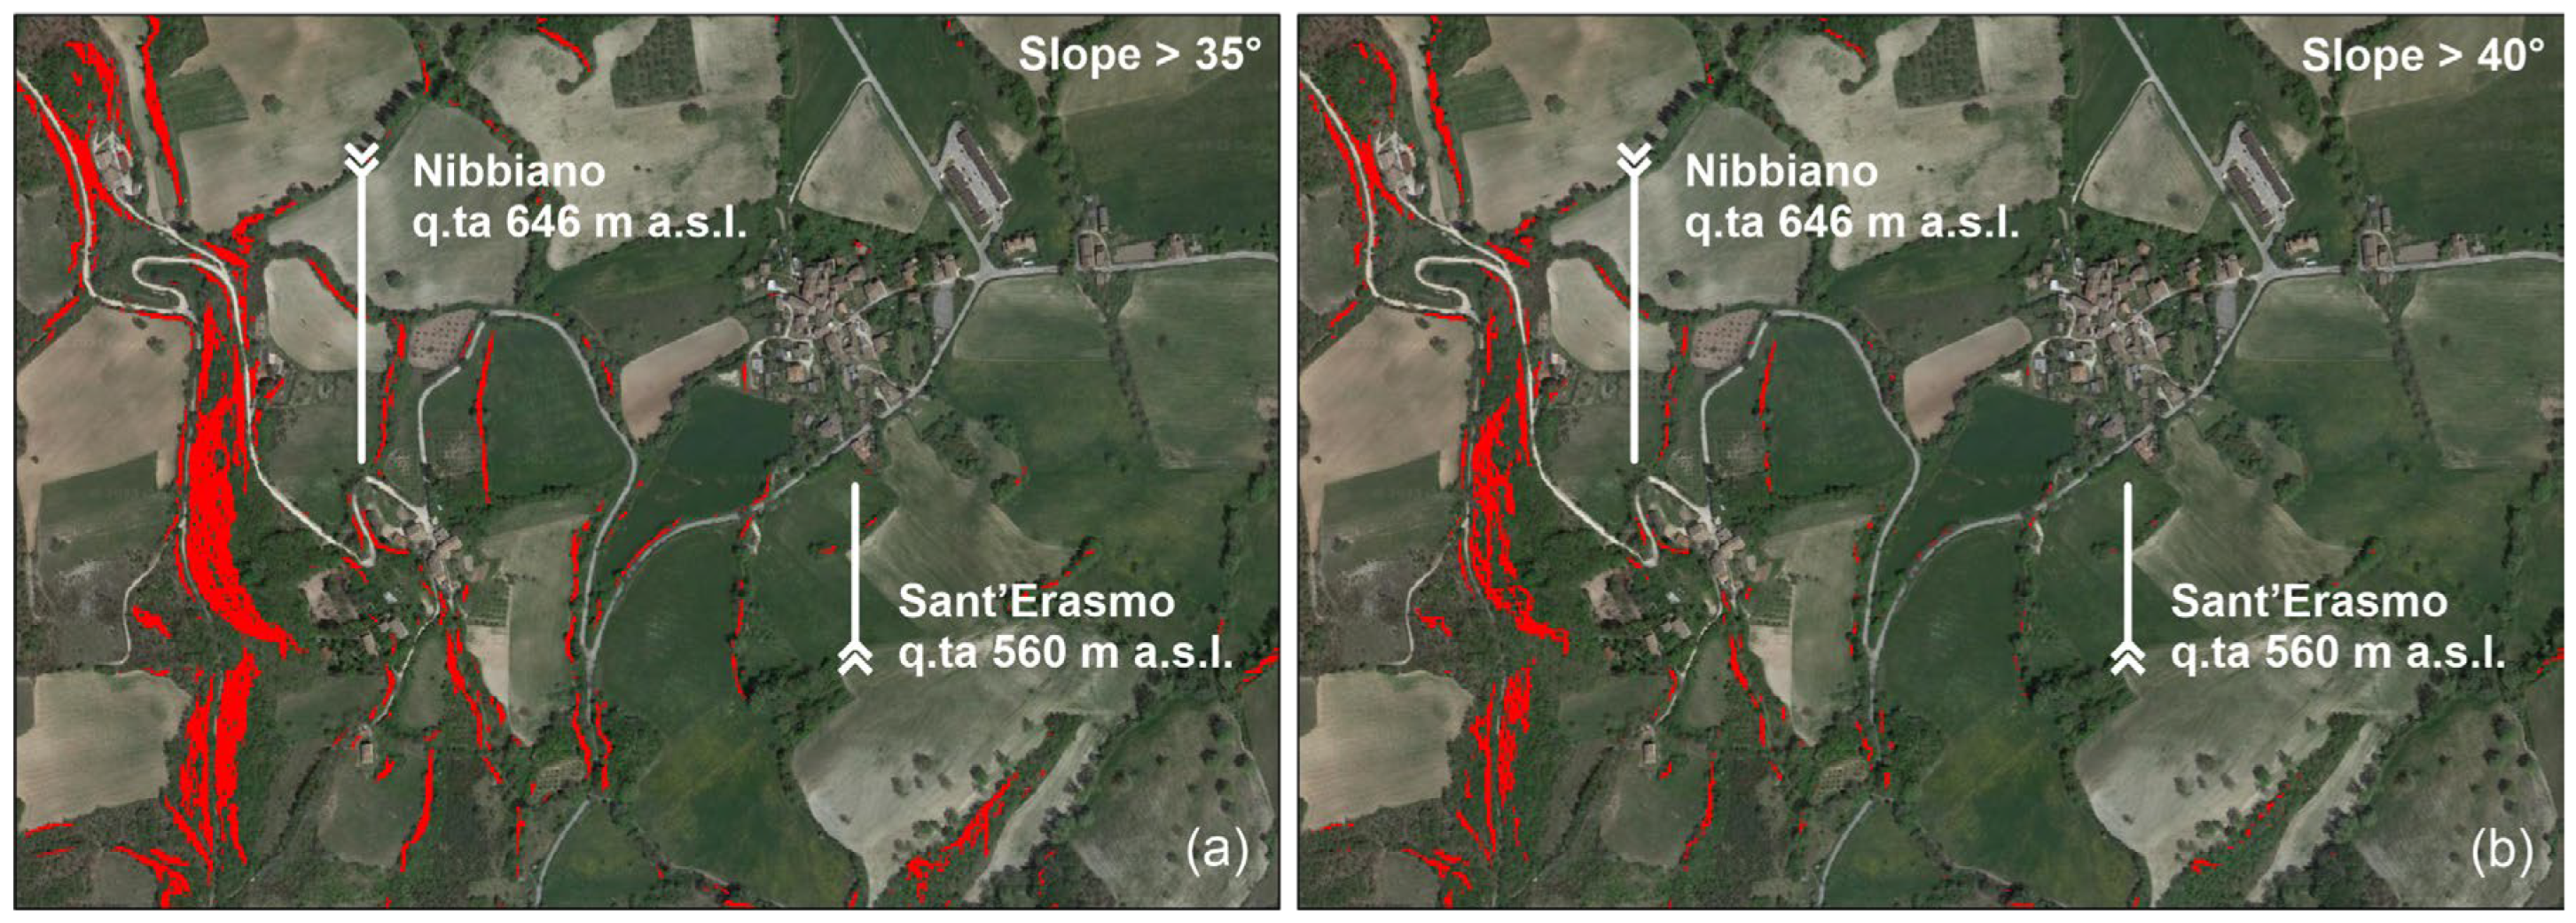
The figure 5, an overlay is shown at the locations of the largest gradients calculated for the areas. On the raster image of the slopes, a high-pass filter was applied to highlight slopes greater than 35° and 40°.

4. Site Investigations

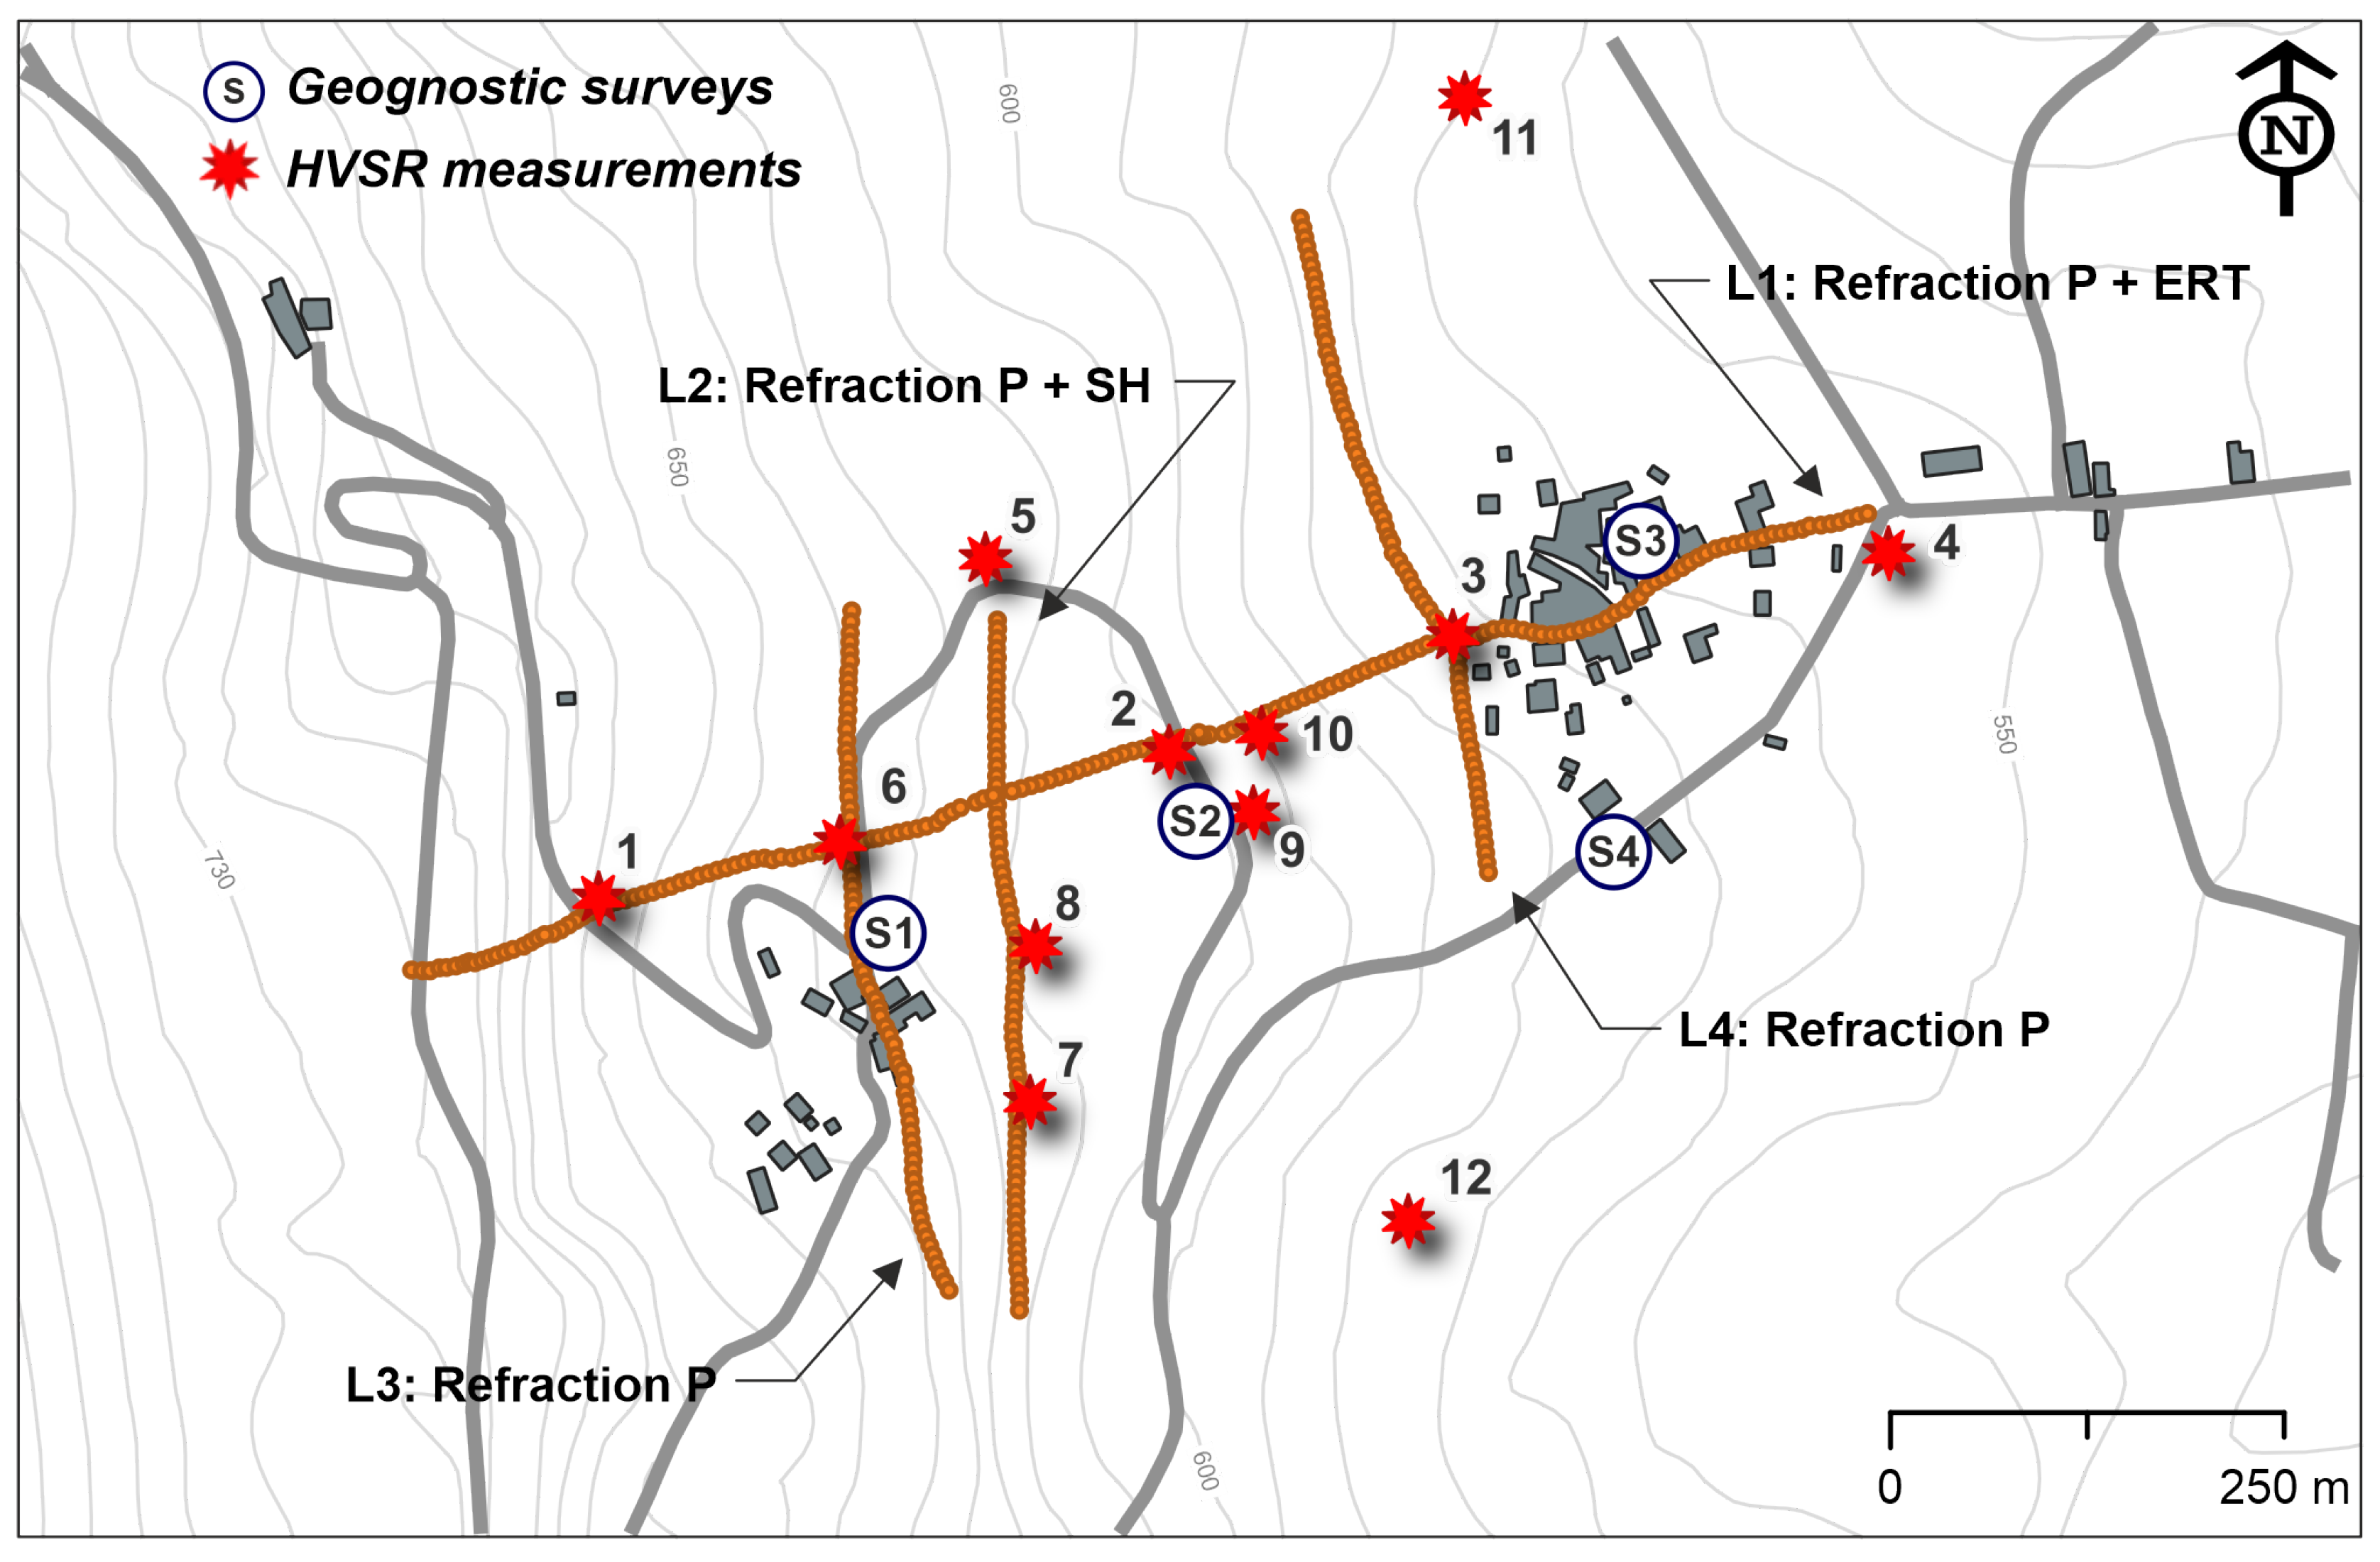
The area was investigated with four boreholes. The S1 (depth 60.0 m) more upstream in the Nibbiano area, the S3 (depth 51.2 m) and the S4 (depth 60.0 m) more downstream in the Sant'Erasmo area and the S2 (depth 60.0 m) in the intermediate part. In addition, refraction seismic surveys were carried out. The L1 line between Nibbiano and Sant'Erasmo hamlet and the L2, L3 and L4 in the transversal direction. To estimate the Vs velocities, in the L2 line, also SH waves were recorded. Finally, an electrical tomography (along the L1 line) was carried out to improve the interpretation accuracy in depth and n.12 ambient noise stations were recorded (HVSR).
The figure 6 shows the location of the investigations. The position of each test was taken from a preventive study of the major criticalities found by the surface survey in the area.

4.1. Geotechnical Setting

The stratigraphy shows a considerable thickness of detrital materials in the most superficial part of the boreholes. The granular nature, due to the component of calcareous debris, did not allow the taking of undisturbed soil samples. Therefore, the SPTs were performed to characterize the mechanical behaviour of the superficial layer.
The processing was implemented using the characteristic value concept. The Eurocode 7 [17] defines the characteristic value as a precautionary estimate of the parameter that influences the start of the limit state [18]. The estimates were based on the Student's t distribution (more suitable for geotechnical problems) using the following formula.
X k = X _ ± t n 1 0.95 s n 1
where X k is the characteristic value of the parameter; X _ is the average value; t is the value of the "Student" distribution with n-1 degrees of freedom; s is the standard deviation of the sample; n is the number of data used. The table 1 shows the mechanical parameters only for the superficial detrital material.
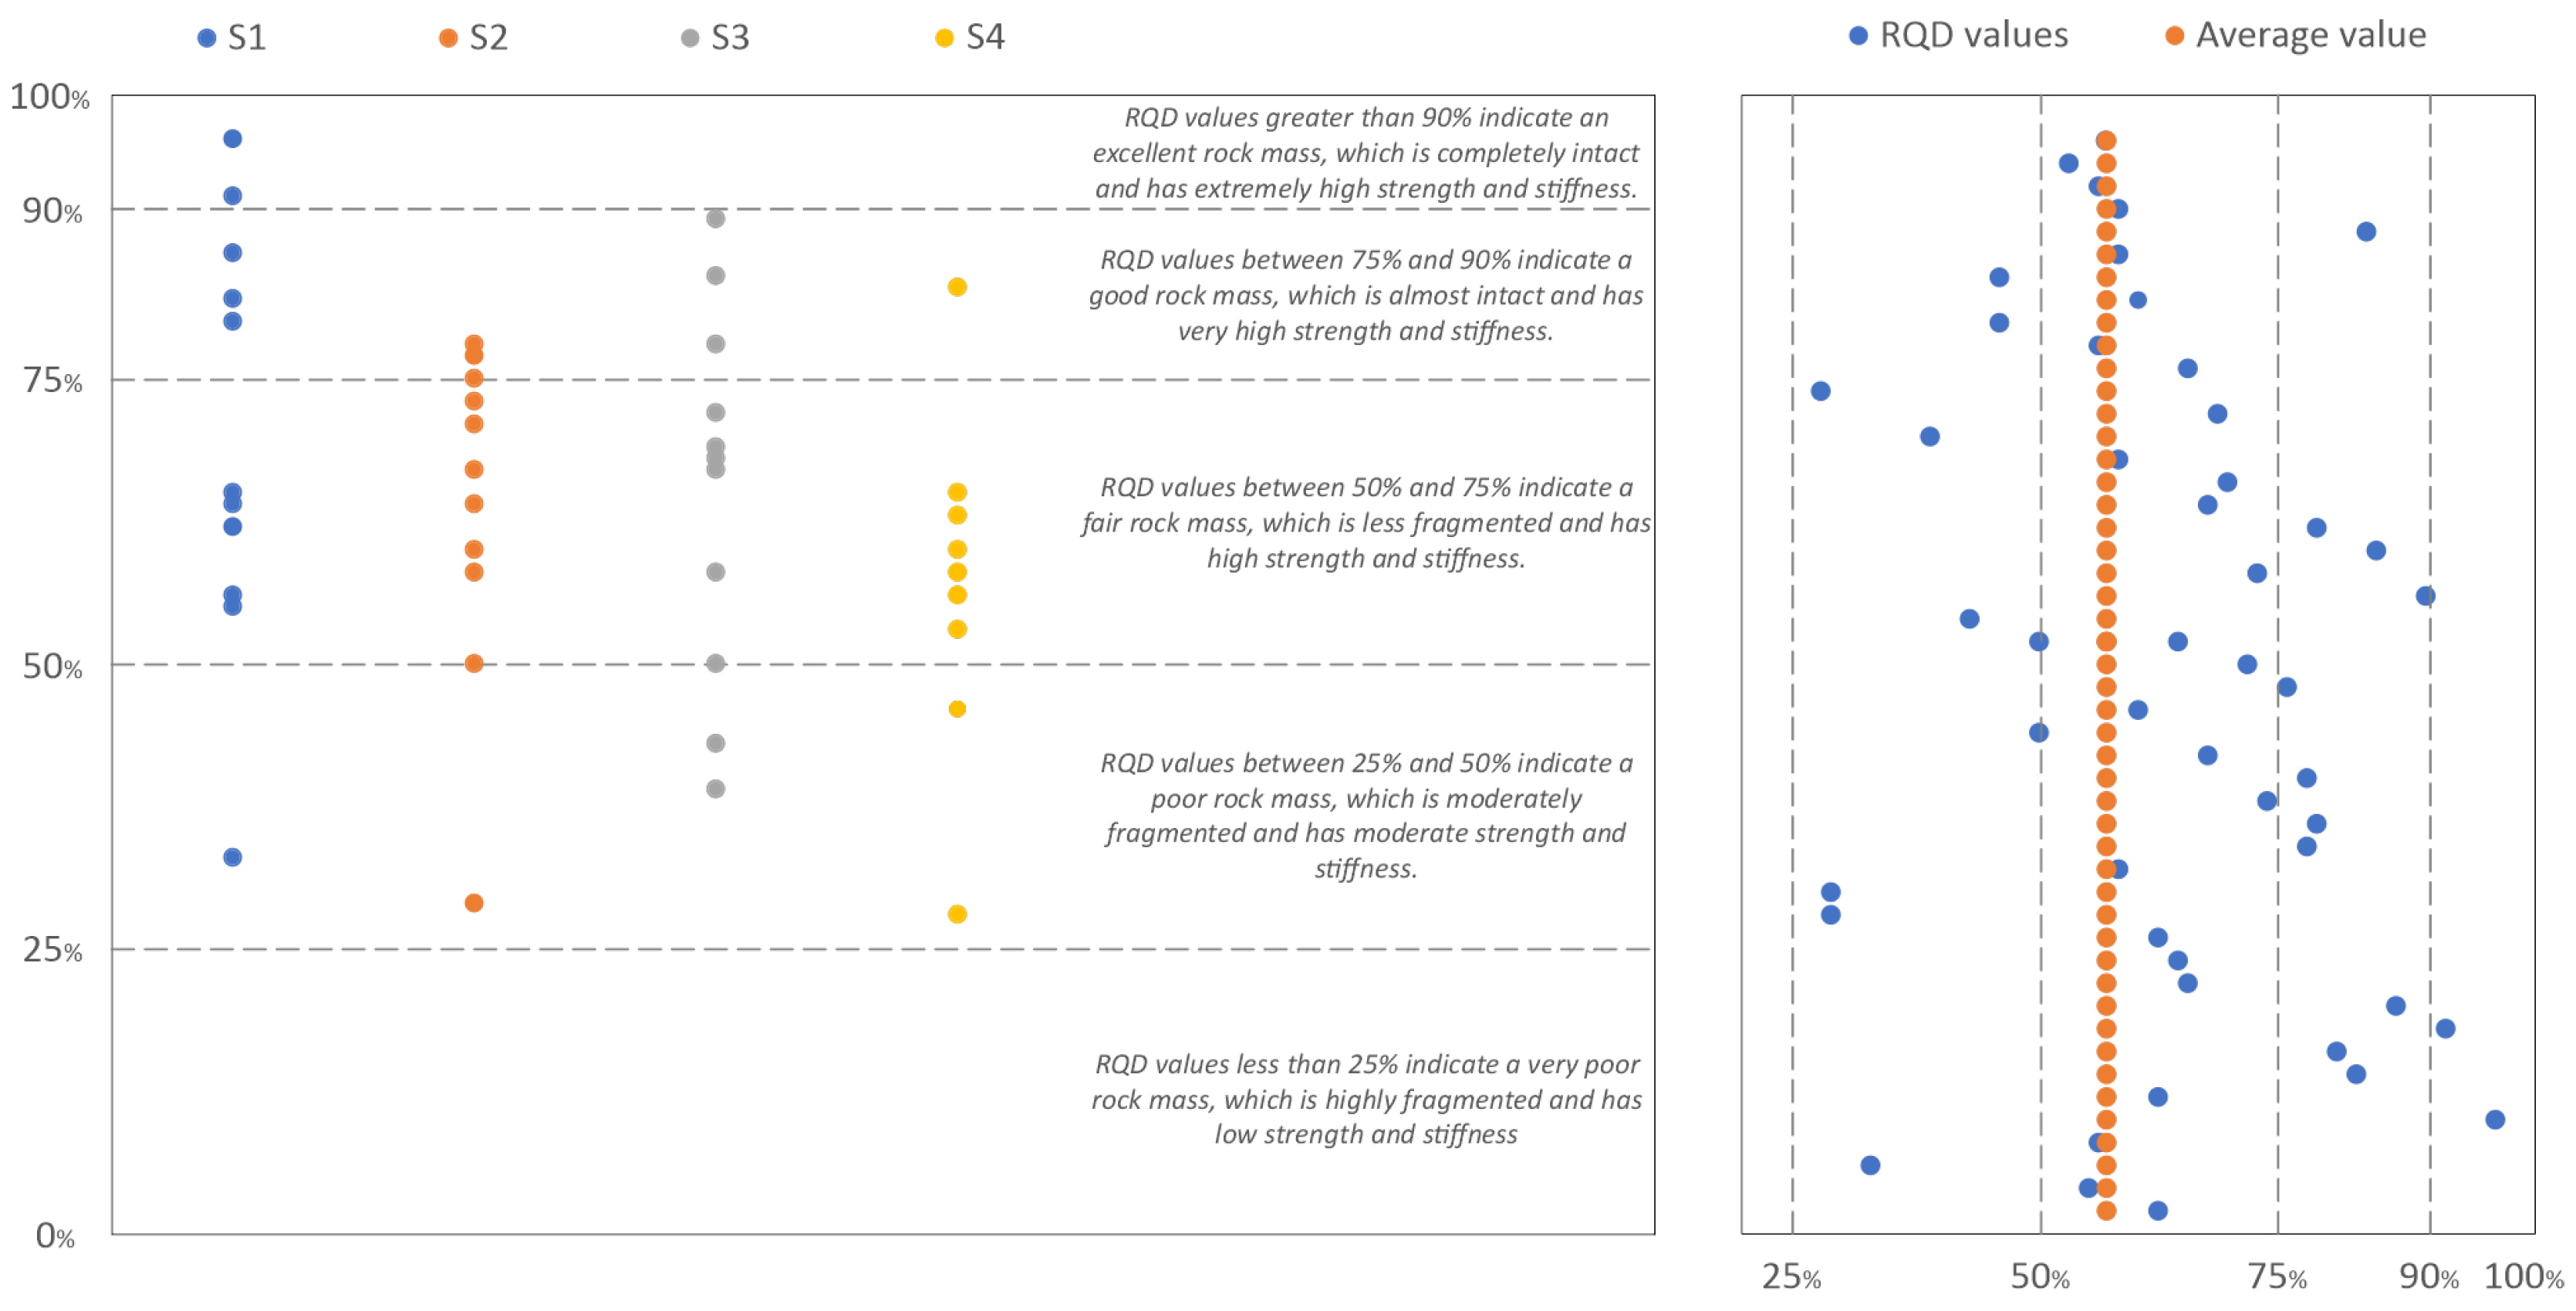
The bedrock involves of marly limestones with medium degree of fracturing. Foreach meter of perforation in the rock, the quality of the cluster was estimated by the RQD value. The Rock-Quality-Designation is the ratio (in percentage) of the sum of the healthy core segments with length greater than 0.1 meter and the total length of the section in which the estimate is performed. The method [19,20,21,22,23,24] was used to define the quality and degree of fracturing. The figure 7 shows the individual values for each survey and their range of distribution.
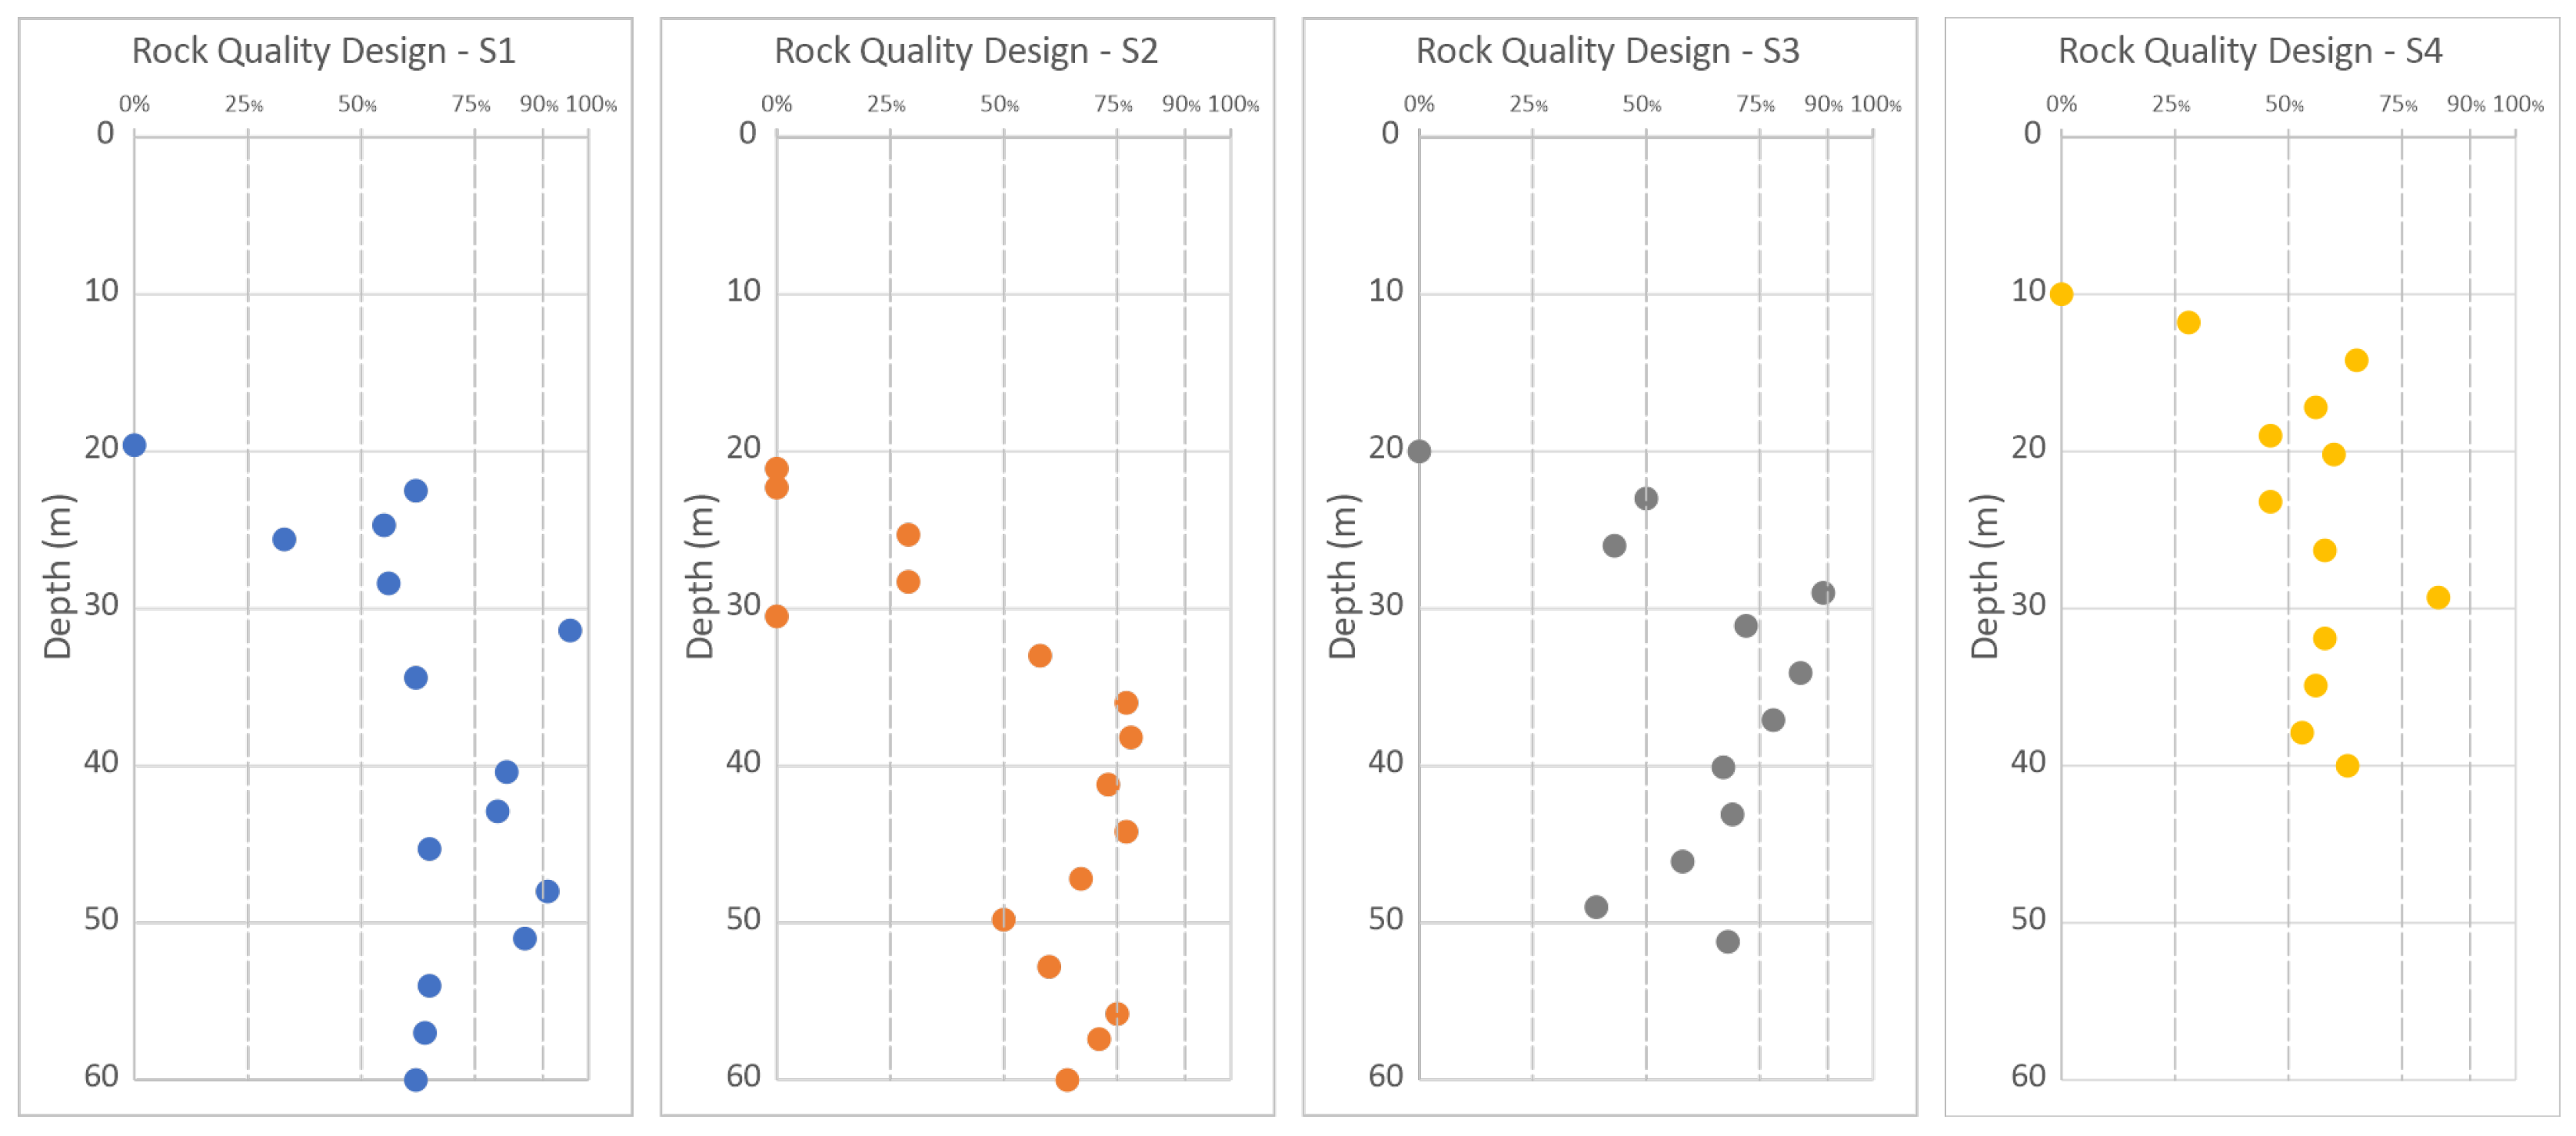
The values show a fairly homogeneous bedrock between Nibbiano and Sant’Erasmo hamlet. The RQD values vary between 0.0 to 95.8%, with an average value of 56.4% and a standard deviation of 24.64. The data (figure 8) show at the top of the rock mass RQD values lower than 50%. This aspect is more marked in the S1, S2 and S3 borehole for the first 3/5 meters, while at greater depths, the quality of the cluster appears superior. Similar conditions for the S4 borehole, where the poor thickness is reduced by about 2 meters. This aspect is due to the presence of a discrete fracturing in the highest part of the rock giving to the mass moderate resistance and poor stiffness.
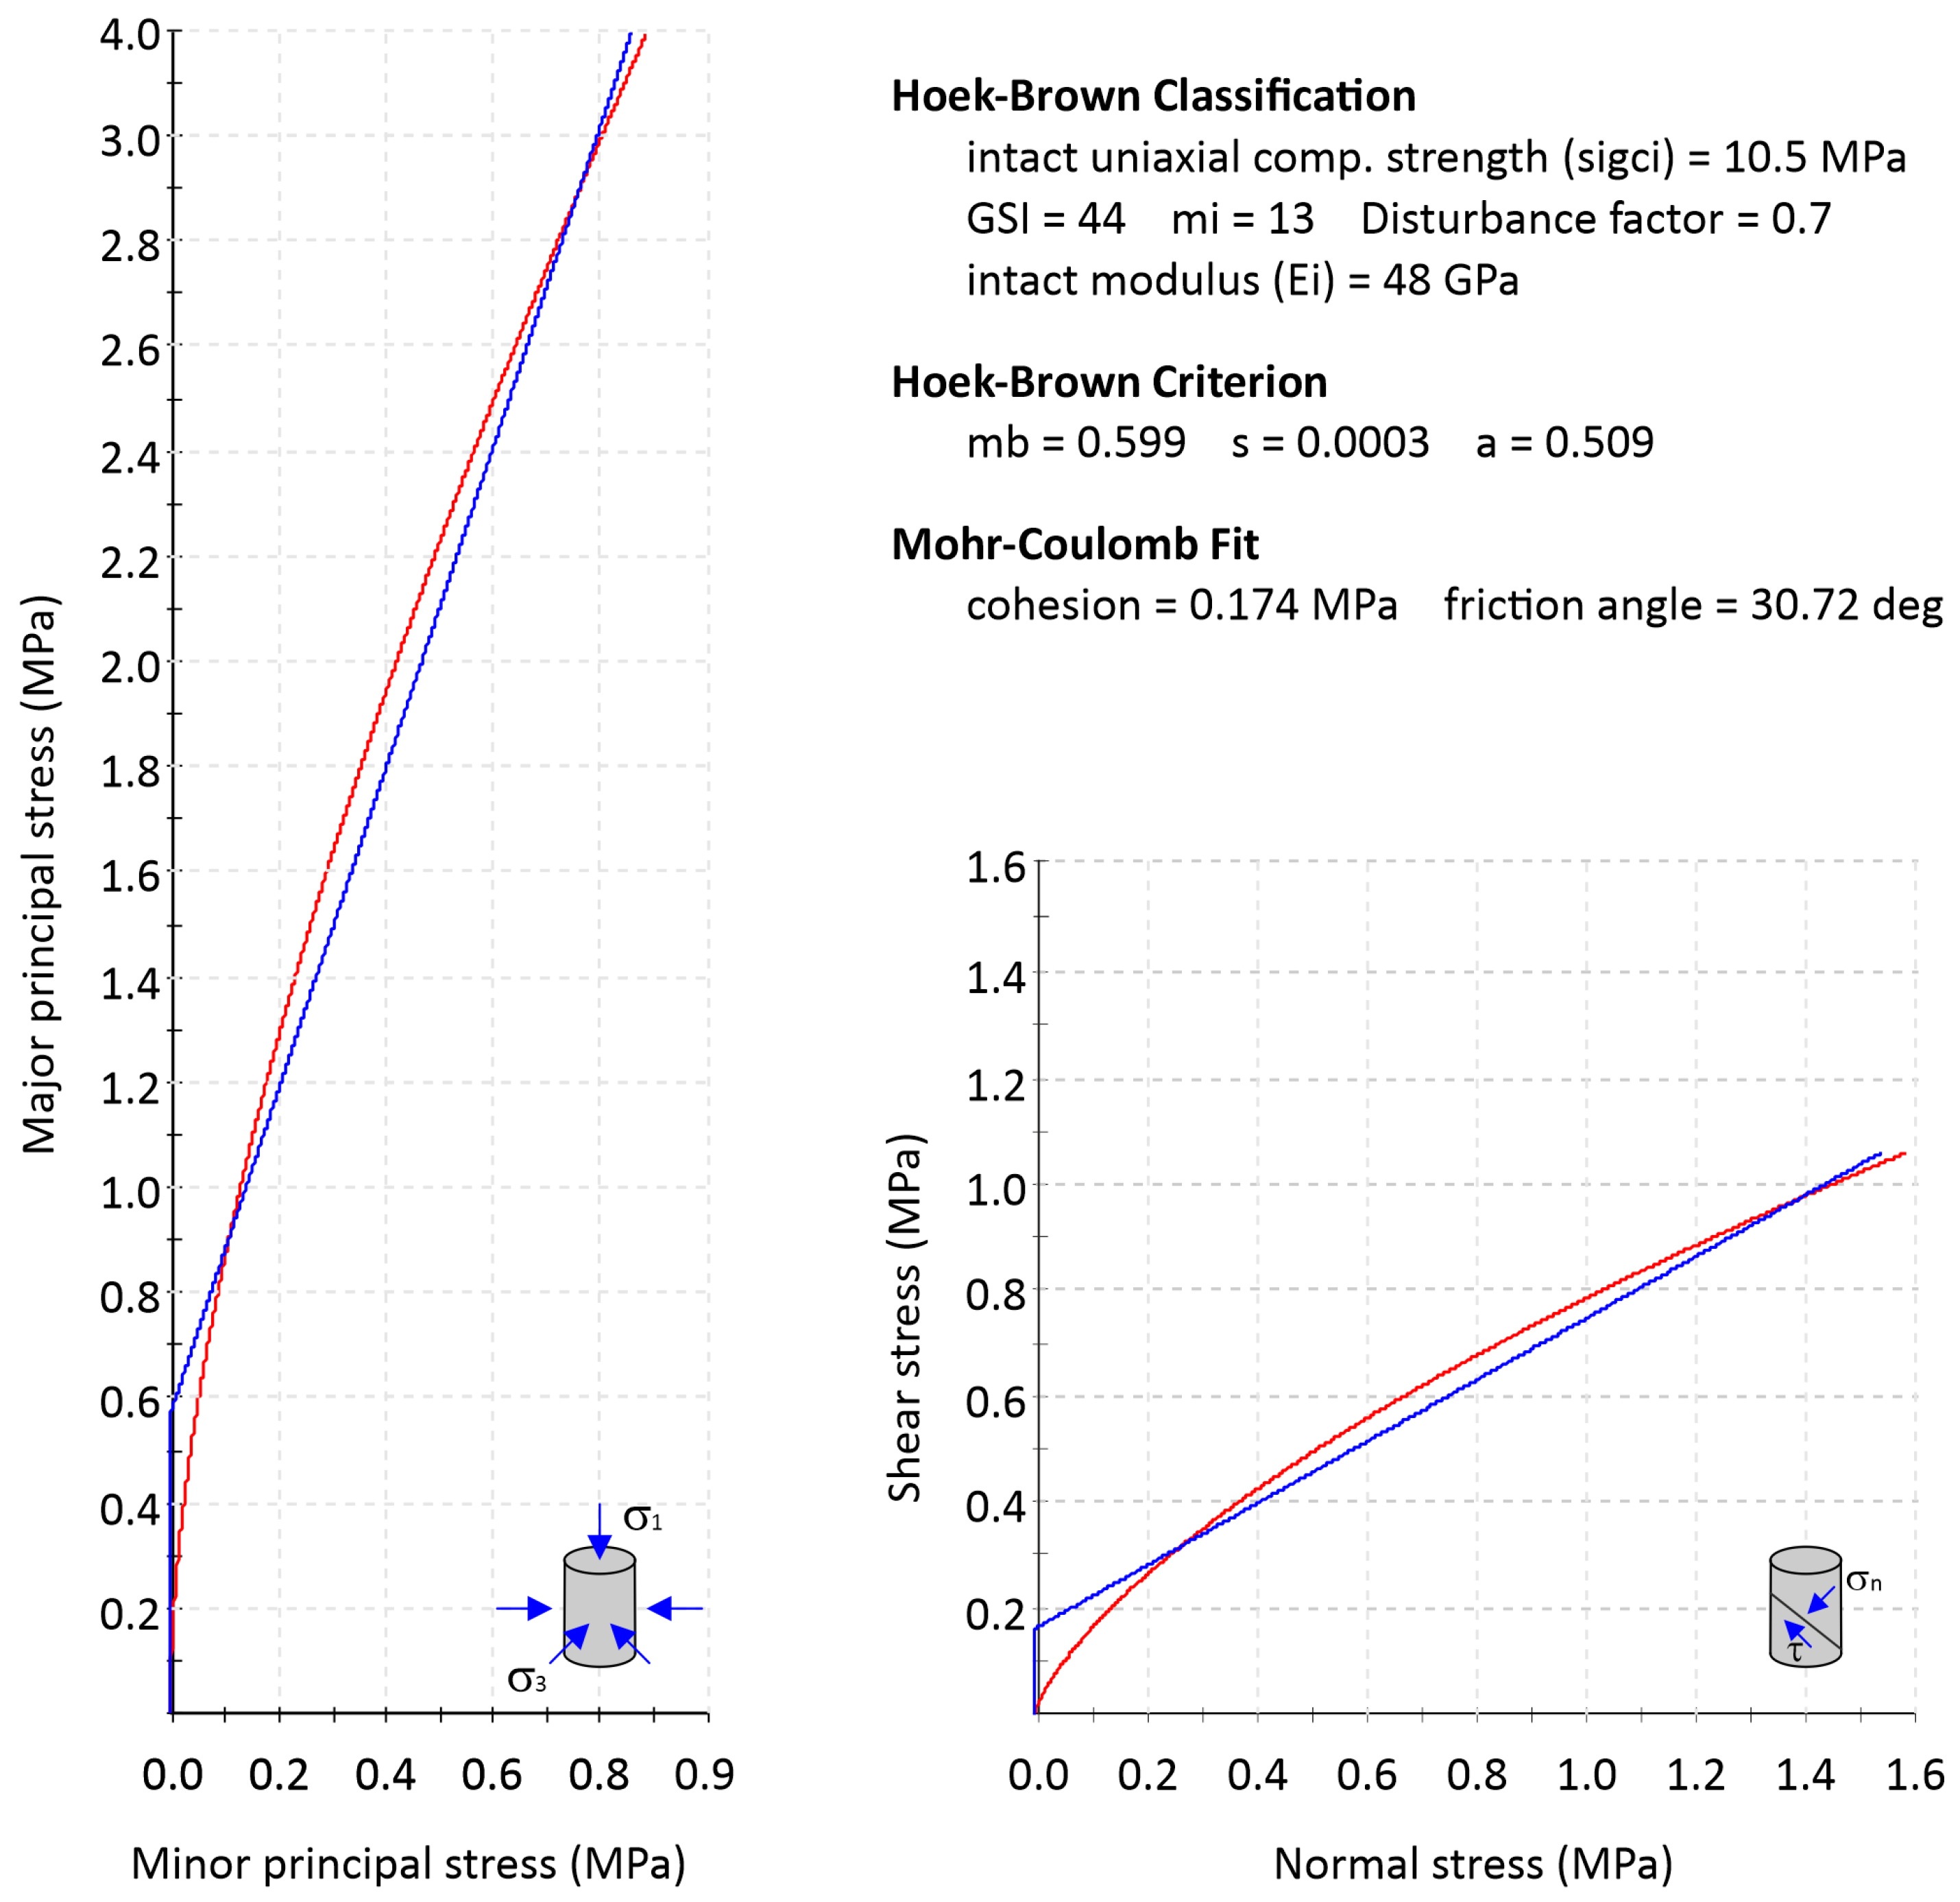
For the geomechanical characterization, the failure criterion developed by [25] and updated by [26] was used. The method defines the resistance in terms of major and minor principal stresses, starting from the characteristics of the intact rock and deriving the representative properties of the mass based on the characteristics of the joints. Among the main classification systems of rock masses, the Geological Strength Index value is more representative. In the evaluation of GSI, there are various interpolation matrices for various rock types [27] or criteria for the evaluation of the description of the structure and conditions of the discontinuities. In this work it was considered more appropriate to use the equation proposed by [28] which indicates to calculate GSI as a function of the RQD parameter as:
G S I = 18.7 e x p   e x p   0.0125 R Q D   = 44
Furthermore, the uniaxial compressive strength (Uniaxial Compressive Strength) was calculated. The σ c i is defined as the maximum stress supported before failure. In this case it was estimated between 10÷11 MPa derived from the results of the uniaxial compression tests performed on intact rock samples. Finally, a disturbance degree of the rock mass ranging from 0.7 (Good) to 1.0 (Poor) was considered. Since the uniaxial compressive strength σ c i is less than 100 Mpa, the deformation modulus of the rock was calculated by [26] according to the following formula:
E m G P a = 1 D 2 σ c i 100 · 10 G S I 10 40
Considering a variable degree of disturbance, a range of elastic modulus between 0.18 to 0.83 GPa was obtained. In the analysis, the bedrock was considered as an equivalent continuum model. For this, it was necessary to determine the failure criterion in terms of Mohr-Coulomb and define a stress range, a friction angle and an equivalent cohesion for the rock mass. The approximation of the non-linear Hoek-Brown failure envelope with the linear Mohr-Coulomb failure envelope was done by fitting the curve generated by the following equation, for a range of minor principal stresses defined by σ t < σ 3 < σ 3 m a x :
σ 1 = σ 3 + σ c i m b σ 3 σ c i + s a τ = c + σ · t a n φ
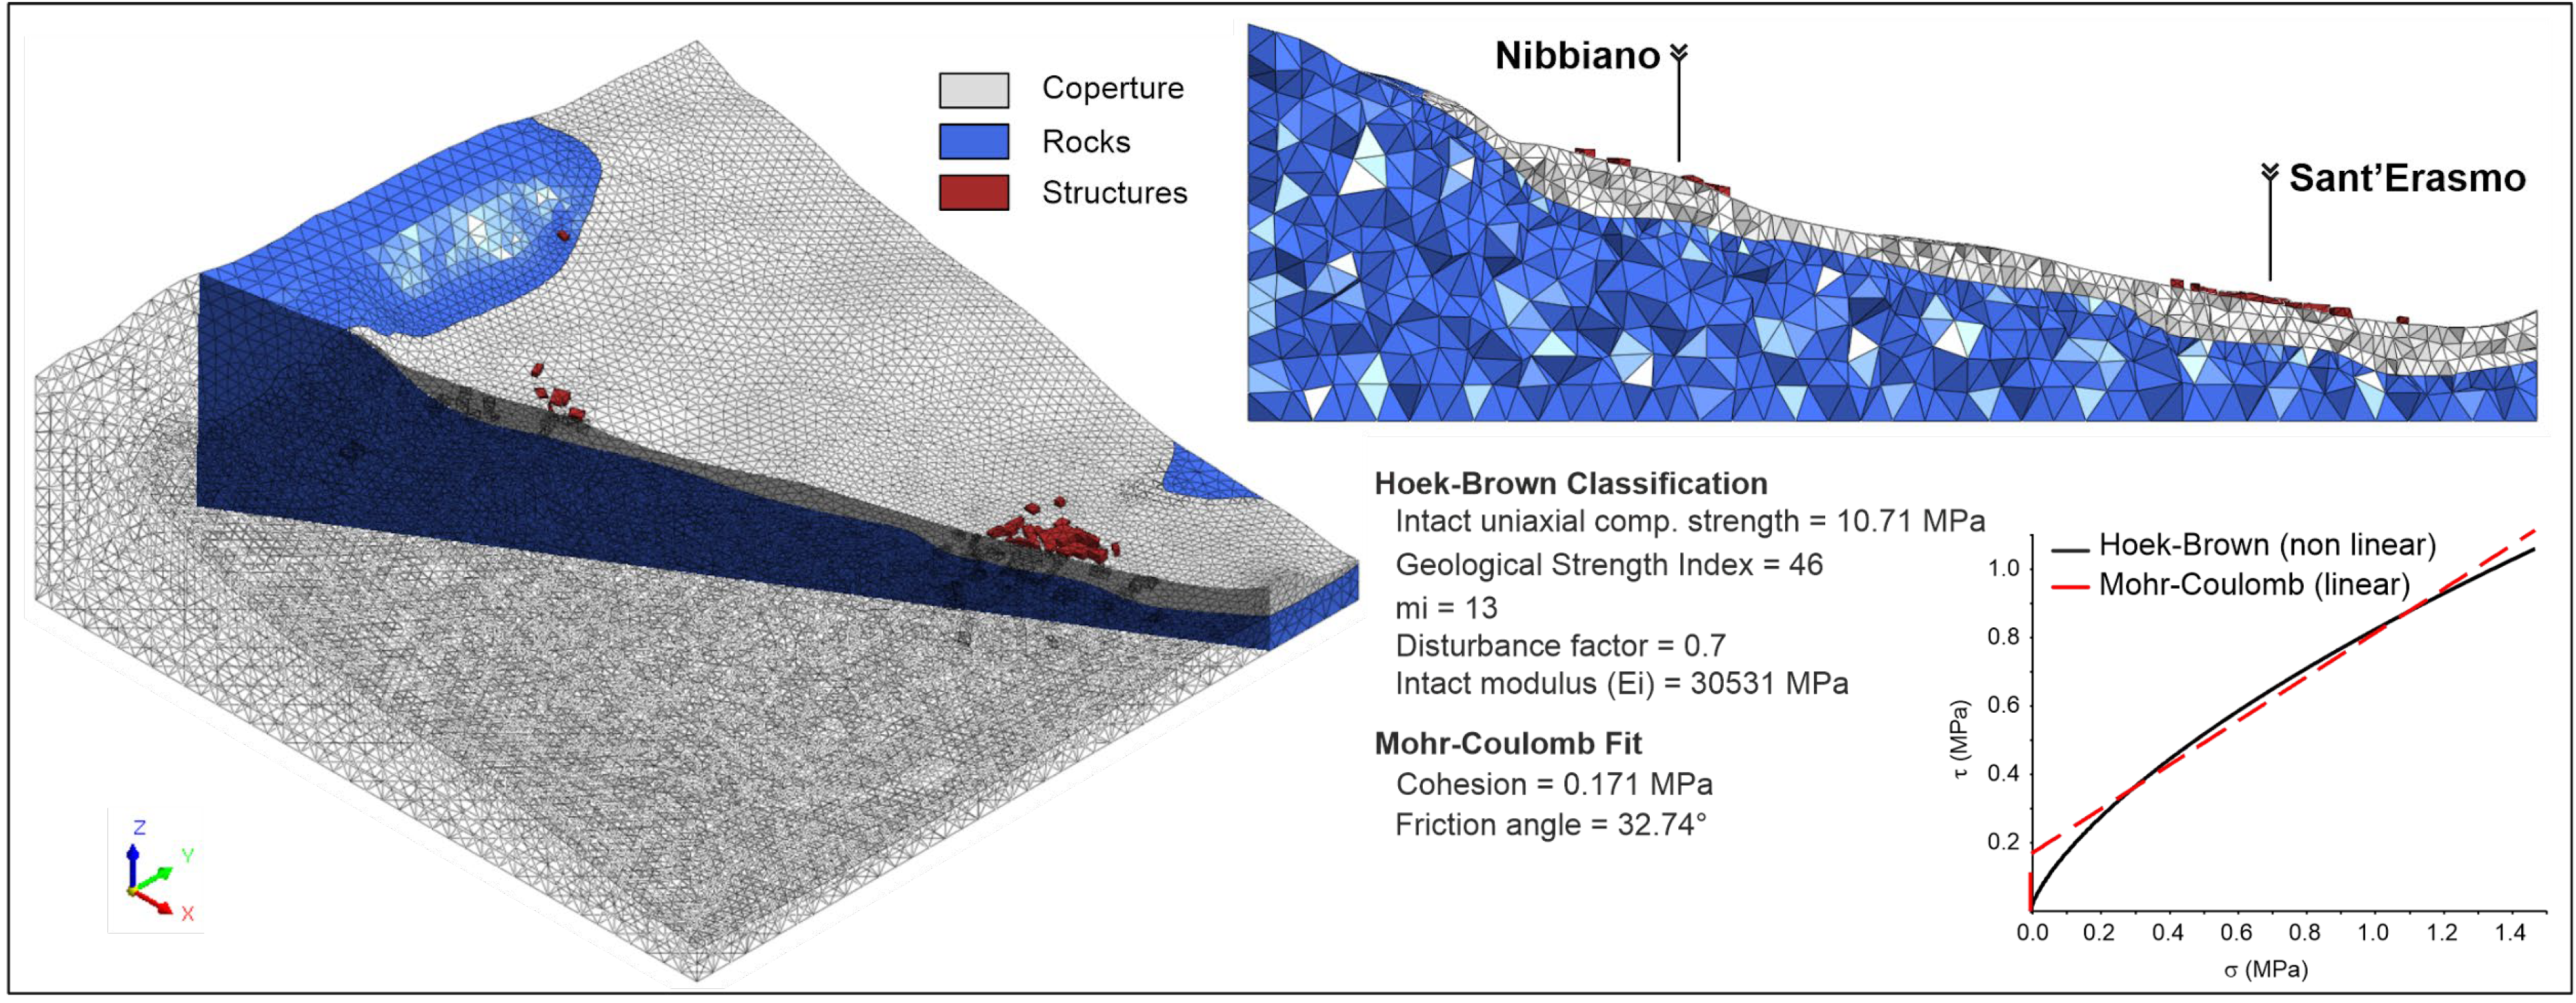
where, as stated by [26], m , s e a are constants of the material. The fitting process involves balancing the areas above and below the Mohr-Coulomb diagram as shown in figure 9.

4.2. Geophysical Investigations

A set of geophysical surveys were carried out to investigate the territory with a continuous vision. Seismic refraction surveys [30,31] were carried out with the roll-along technique using 48 geophones, according to acquisition sequences with overlapping of 24 geophones at a time. The table 2 shows the main acquisition characteristics.
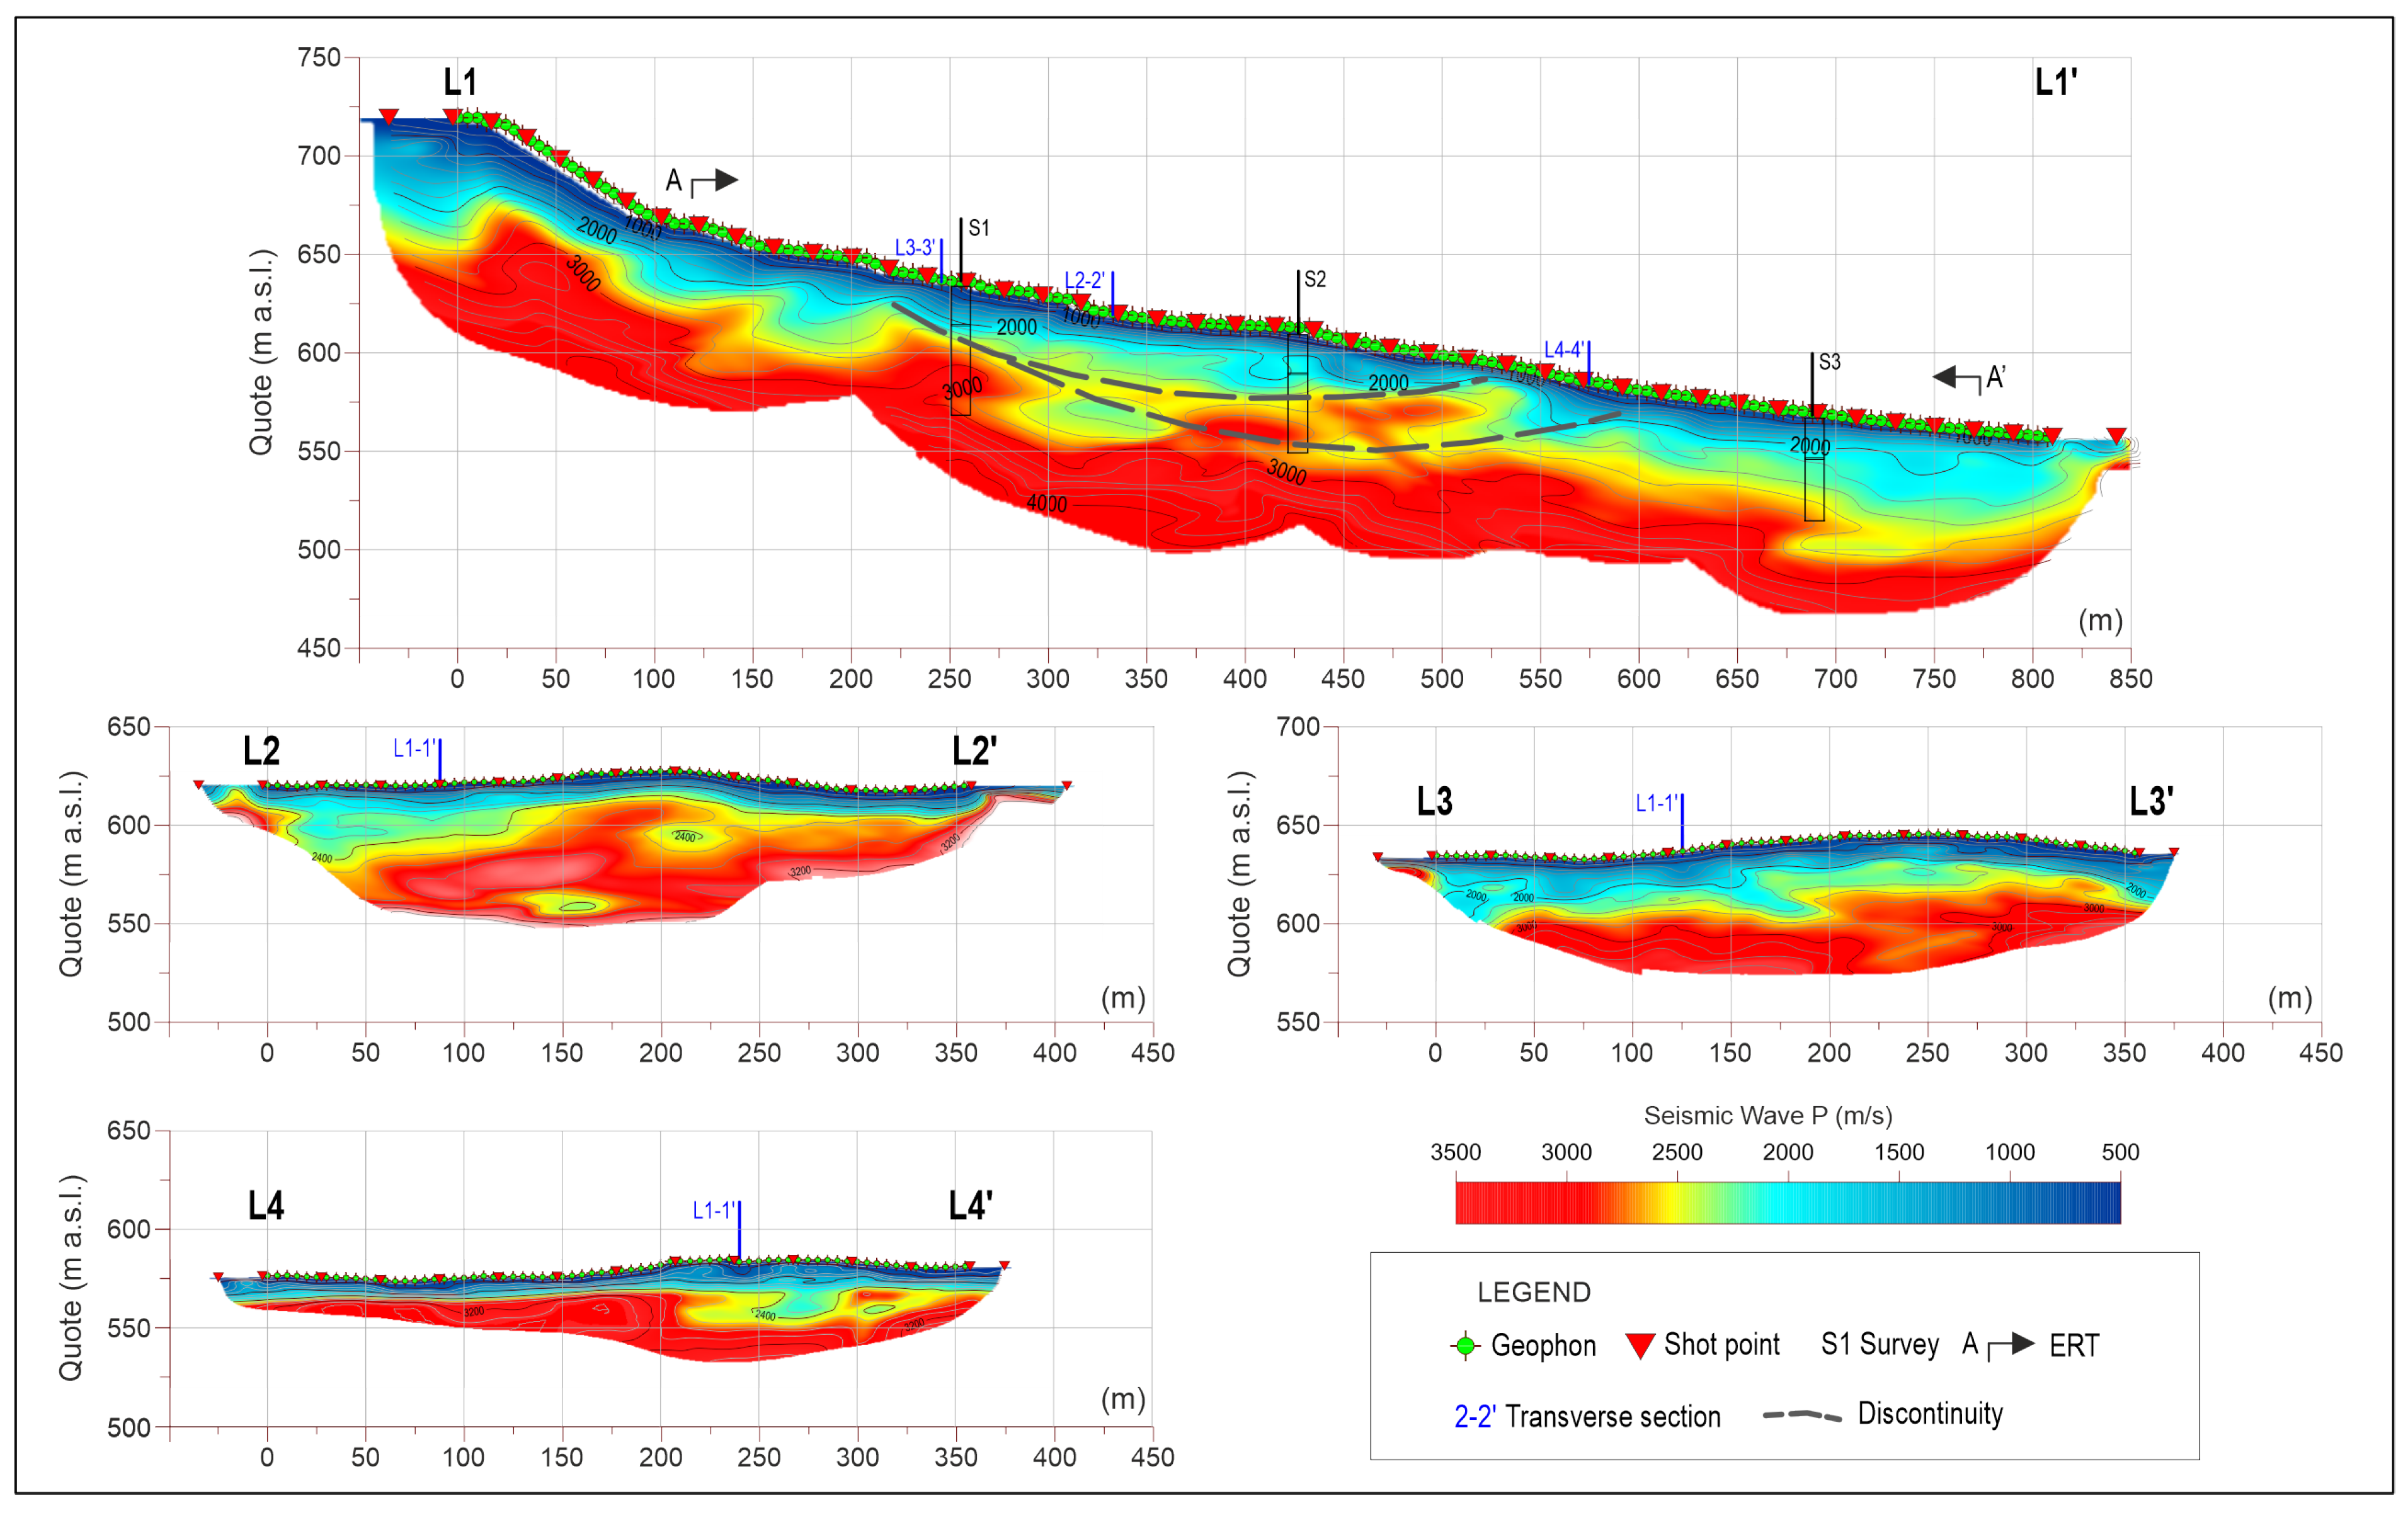
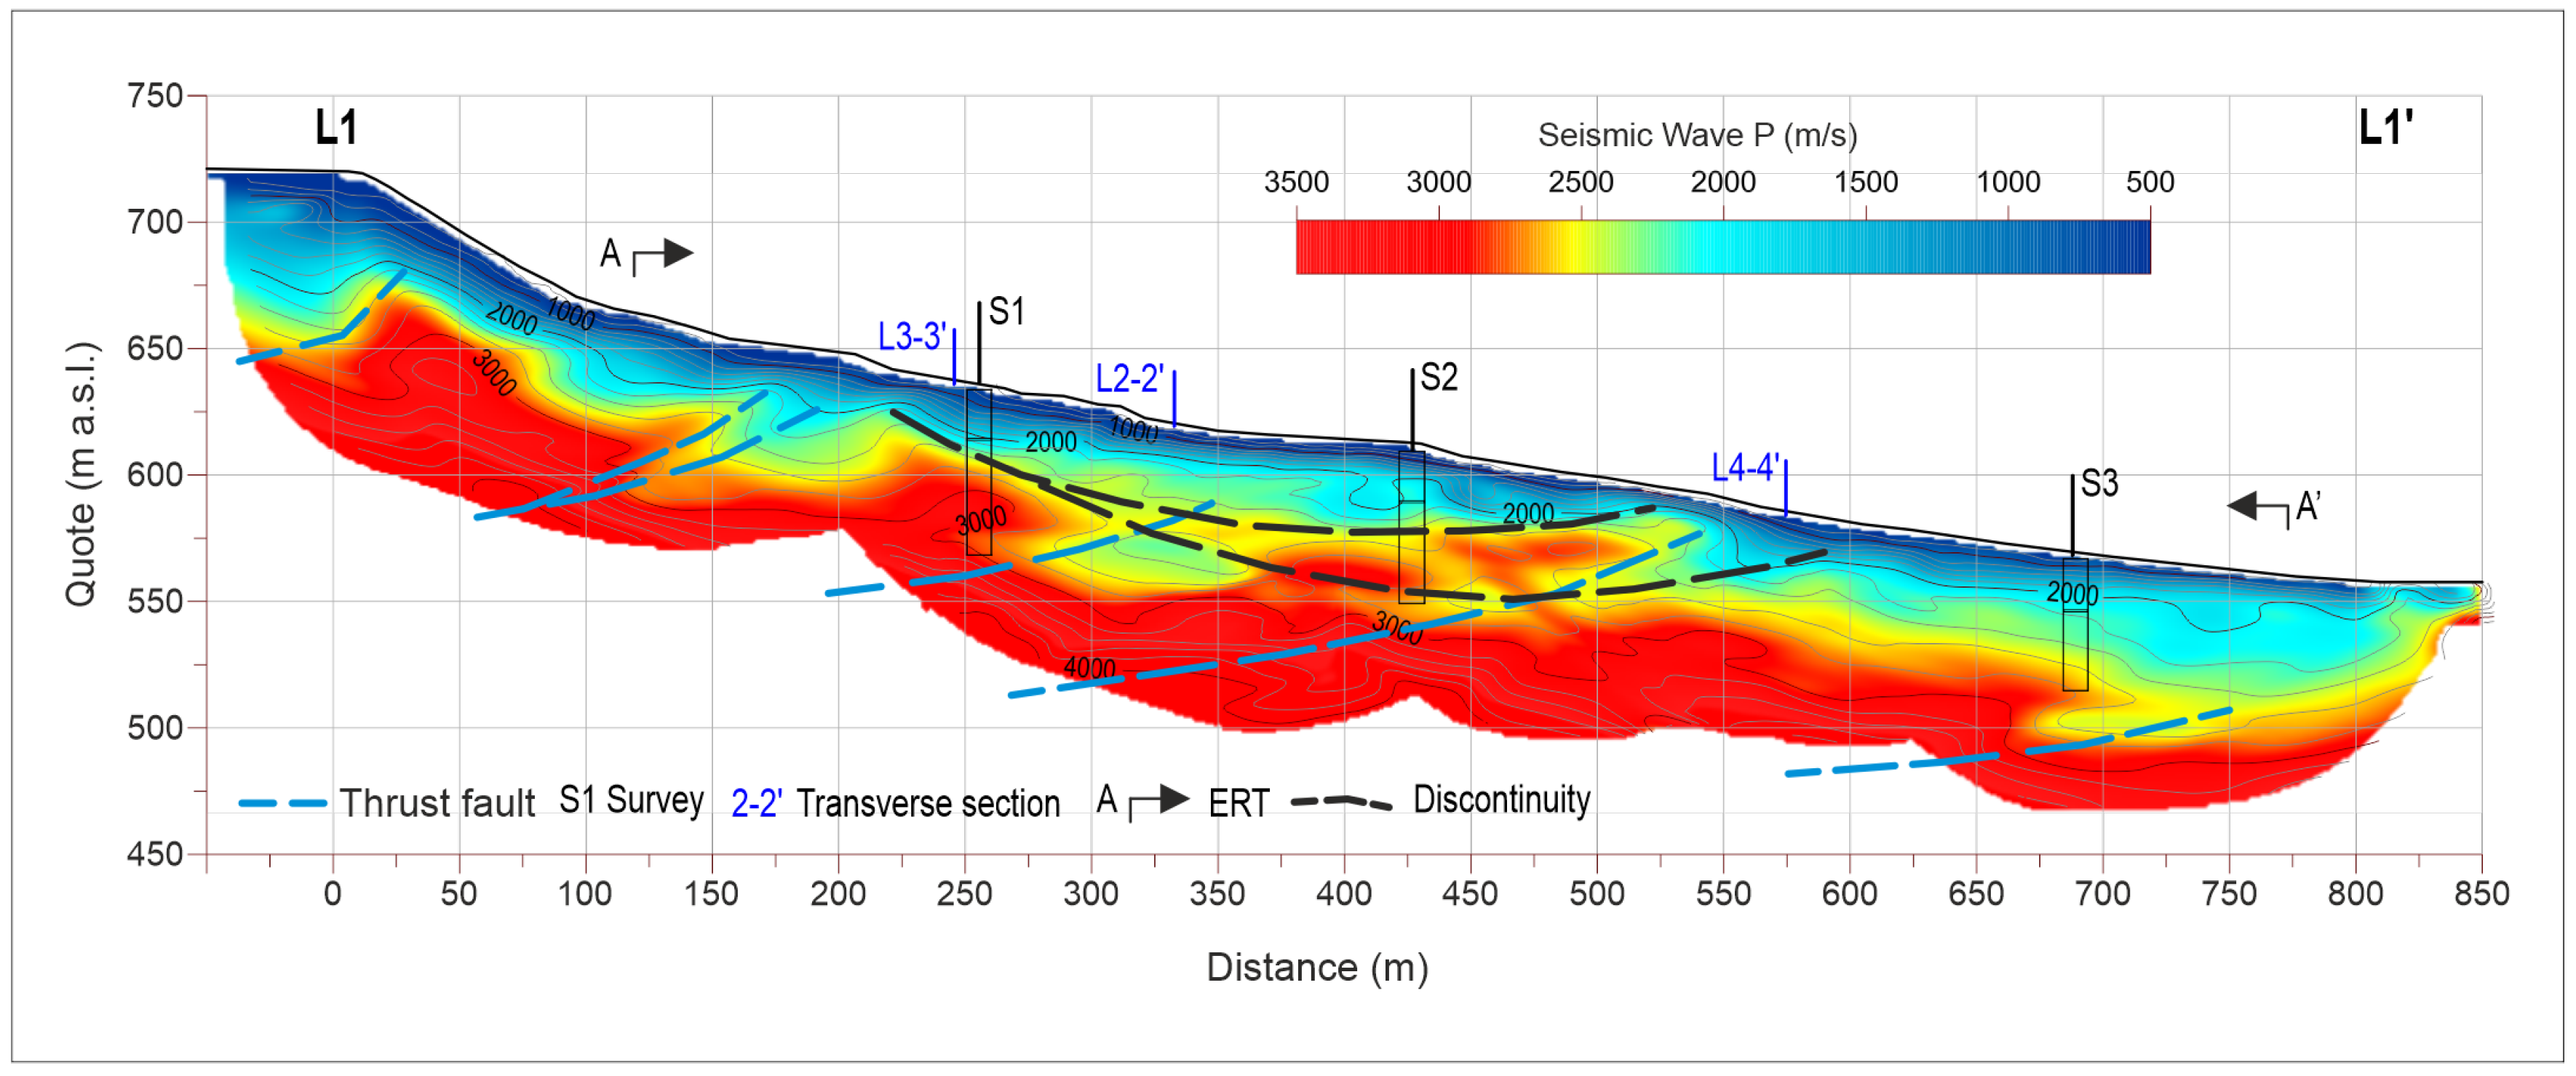
The seismic recordings were analyzed with tomographic techniques by progressively reducing the convergence error in an iterative way to define the best distribution of velocities by comparing the real arrival times with the theoretical ones. The method allows to calculate, for each source-receiver pair, the optimal path of the seismic rays (ray-tracing) and to derive the theoretical dromochrones. The process has allowed us to define a two-dimensional model of the soil with a detailed reconstruction of the buried morphometry and any discontinuities. In fact, the seismic waves are correlated of the stiffness and, therefore, represent a fundamental parameter for the definition of the bedrock and the stratigraphic relationships between it and the covering sediments [32]. The figure 10 shows the 2D model. The more length profile (L1 line) is the one that shows the stratigraphic in the most detailed and complete way. The superficial part has a Vp variability range between 500 to 2000 m/s. There is an improvement of the stiffness, until reaching the deep bedrock with P-wave velocities between 2200 and 2850 m/s. Even on the L2, L3 and L4 lines, the two-layer interpretation was possible.
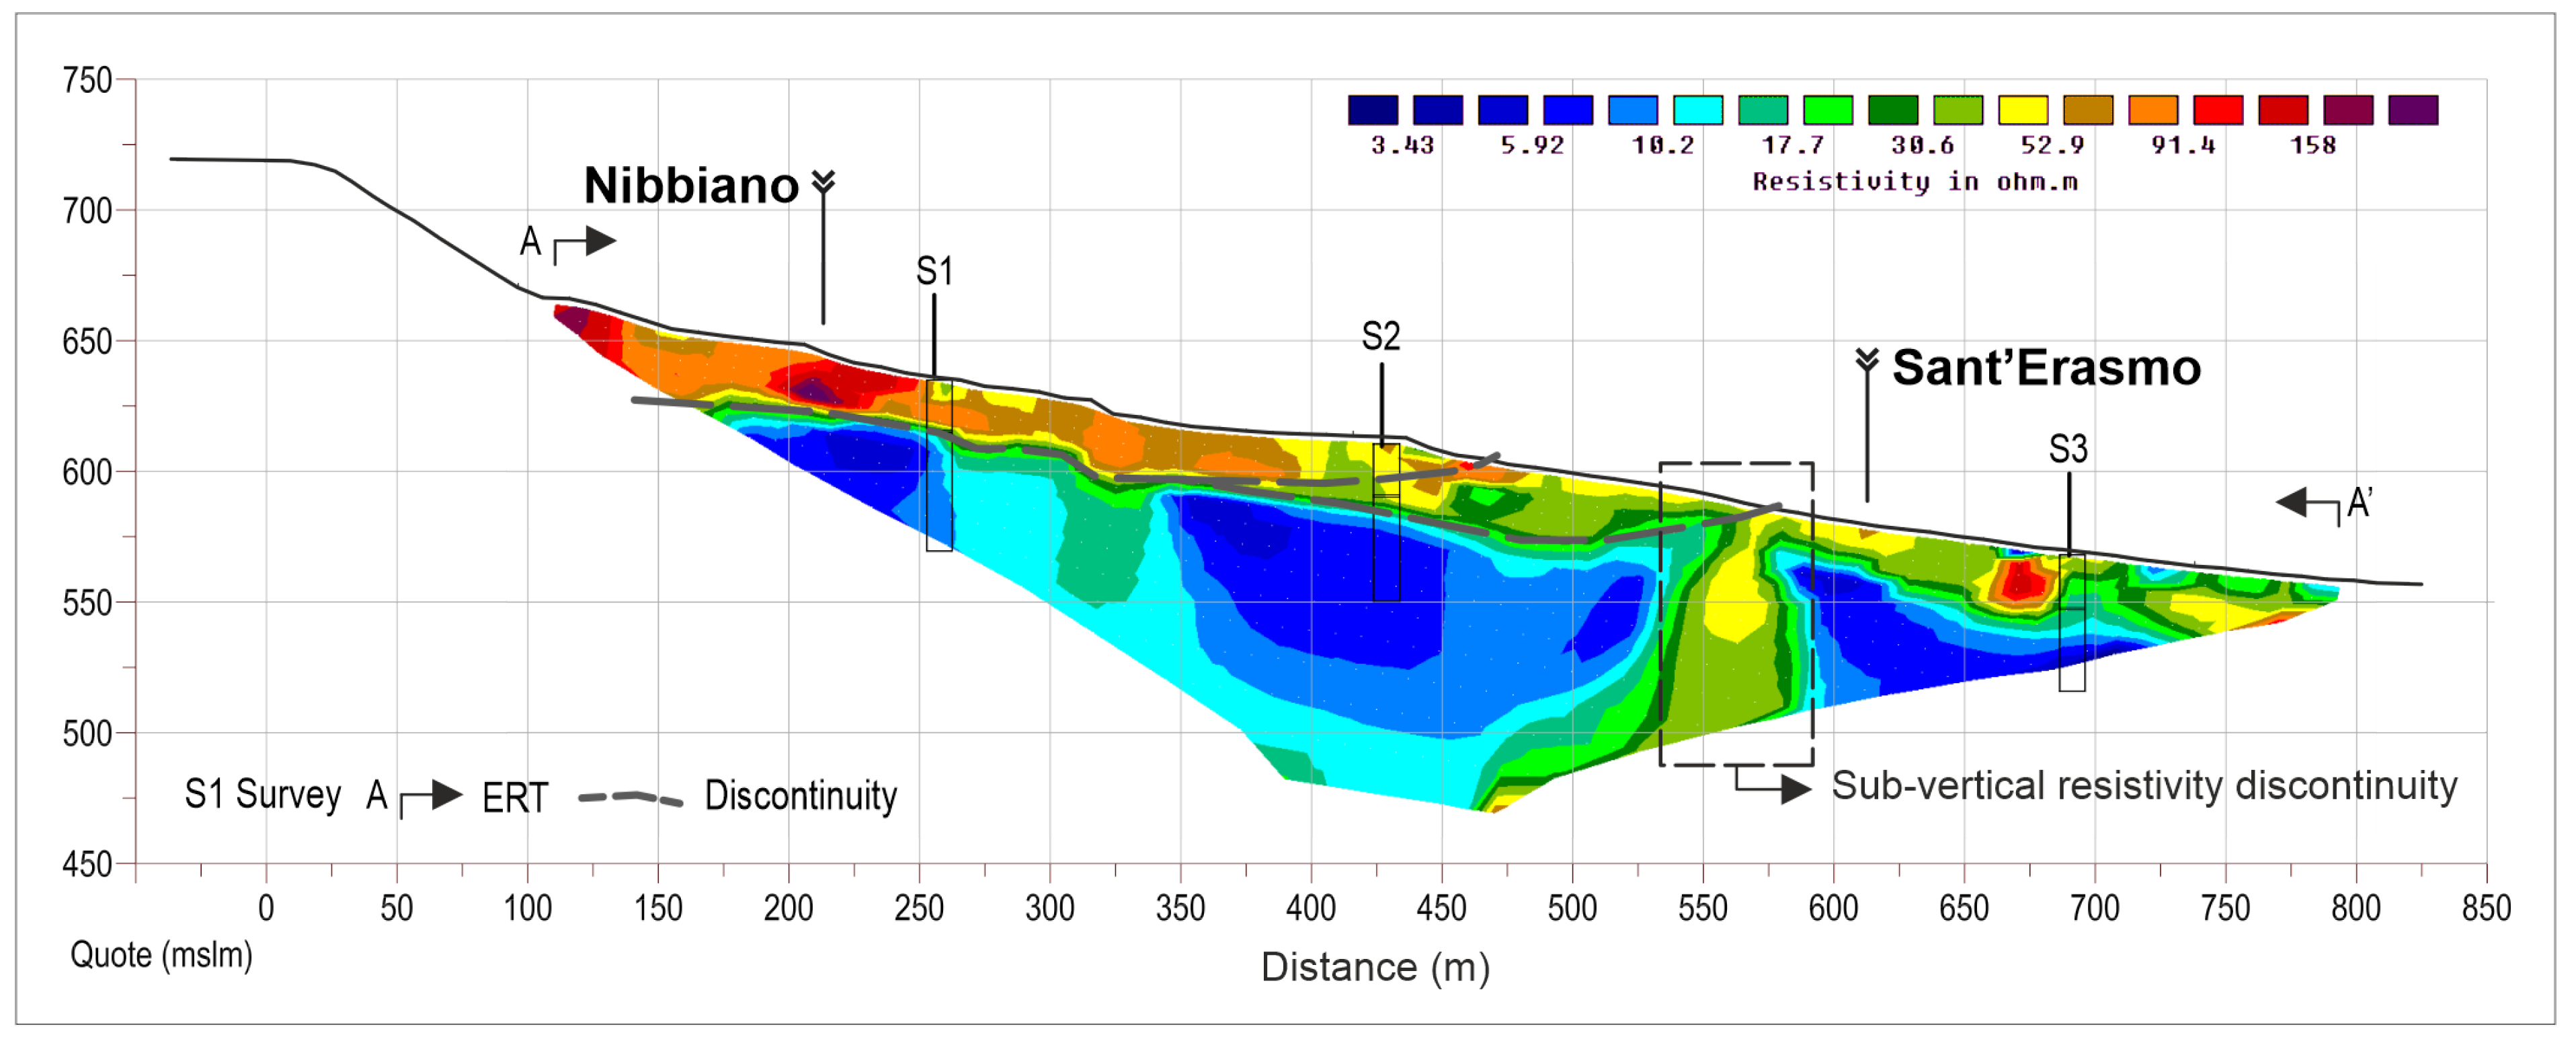
A geo-electrical investigation [33] was performed to improve the geometric interpretation of the cover/bedrock contact. An ERT profile (Electrical Resistivity Tomography) was recorded along L1 Line, and the main acquisition characteristics are shown in table 3
The geoelectrical surveys are widely used methods for the reconstruction of stratigraphic of buried soils [34,35]. They are also used for the study of landslides because they provide excellent results both in the horizontal and vertical sense. The geoelectrical line was carried out with a 720 meters extension and 10 meters electrode-electrode spacing allowed to reach considerable depths with good data reliability (Wenner-Schlumberger configuration). The profile shows a superficial horizon of about 20.0 meters characterized by resistivity values > 40 Ohm.m and a transition to more conductive materials at depth with resistivity values < 40 Ohm.m. The figure 11 shows a reconstruction of the lithological contacts and of the electrical resistivity anomaly identified shortly before the Sant'Erasmo hamlet.
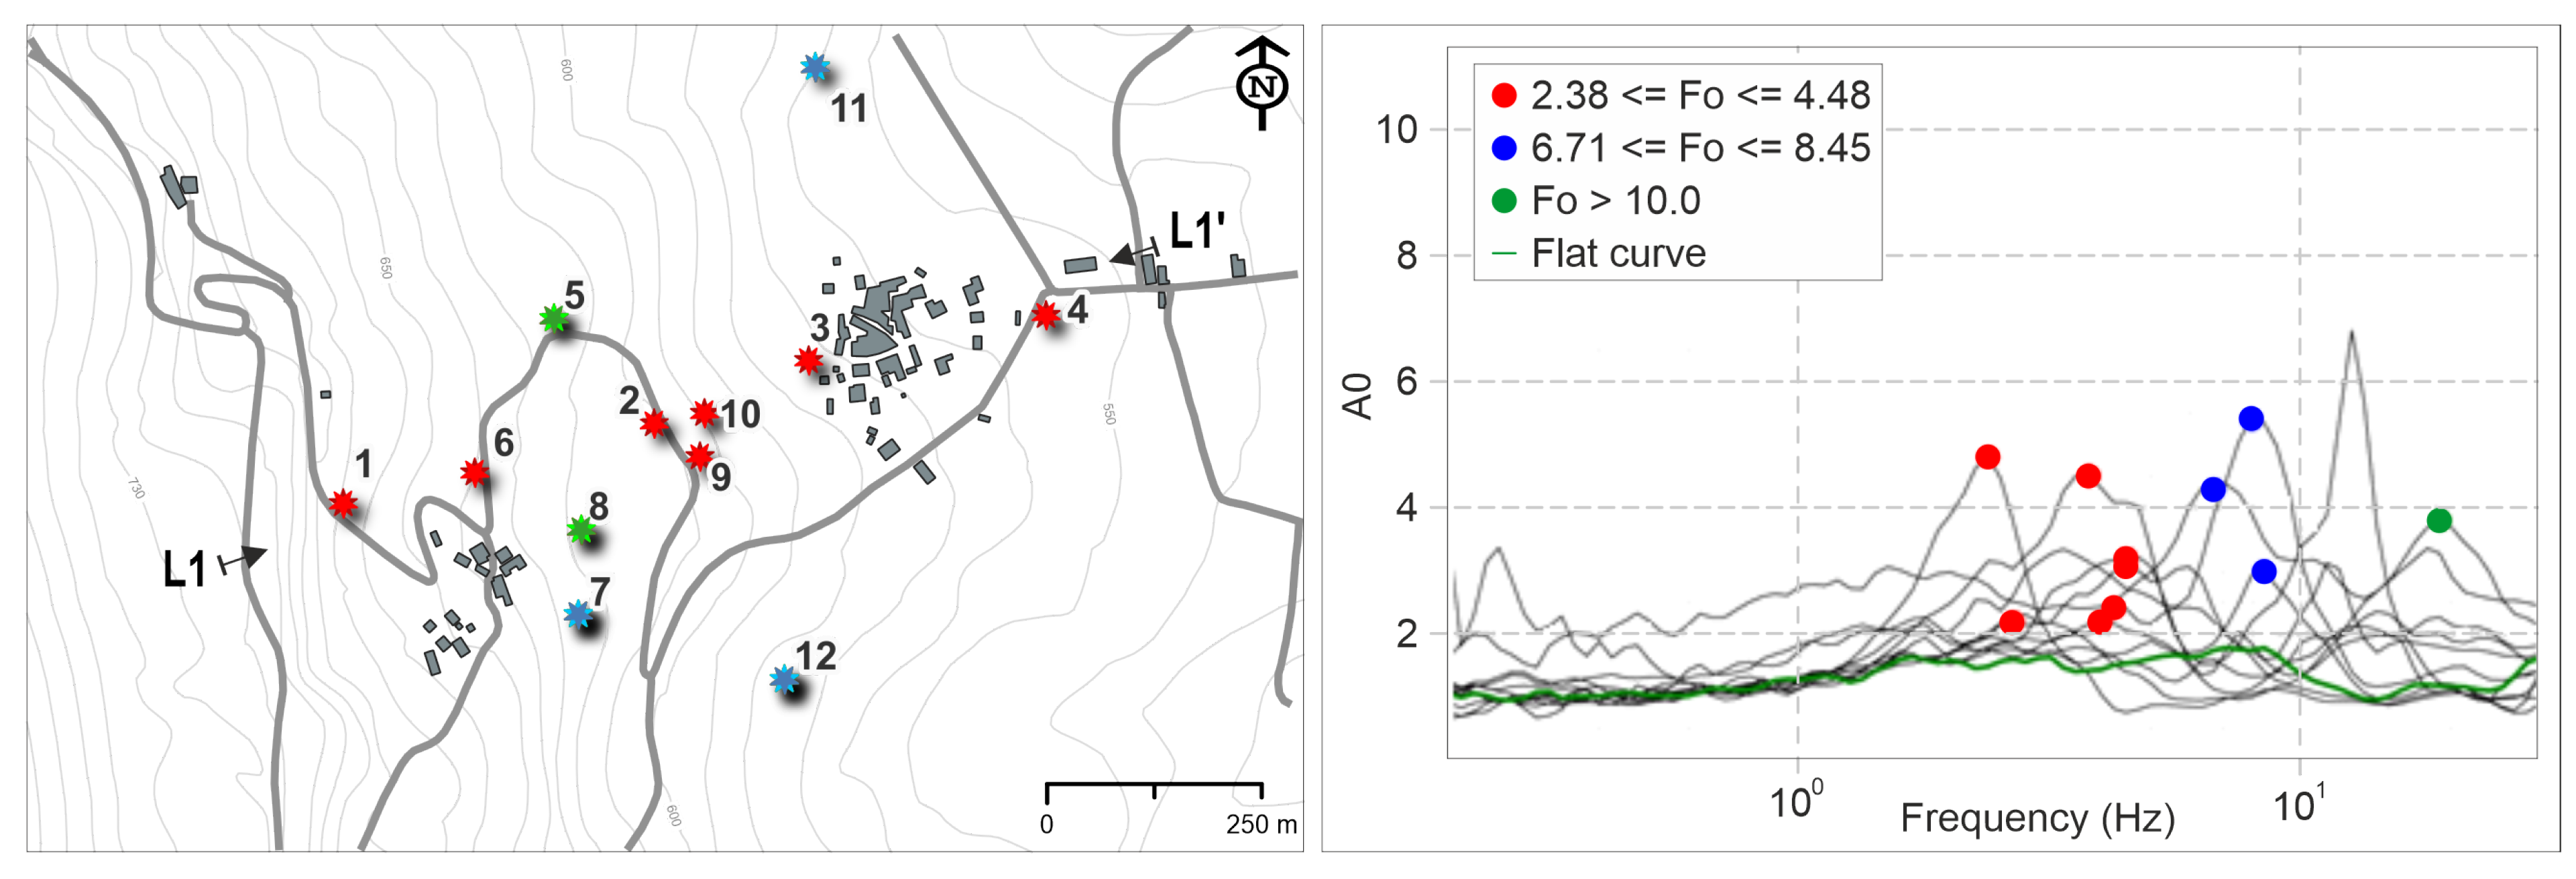
Before the geological and geophysical investigations, some passive recordings of environmental noise were carried out using the HVSR technique [36,37,38]. Studies are known in the literature that highlight the usefulness of the HVSR test as a support for defining the volumes of potentially unstable masses [39,40,41]. In this work, the HVSR surveys have had a dual purpose. The first to provide preliminary indications of the depth contact characterized by greater contrast in soil stiffness, allowing the preparation of an optimized geognostic survey for typology and positioning. Secondly, the HVSR investigations were allowed to evaluate the reliability in transferring seismic stratigraphic models from areas well characterized by geognostic investigations to uninvestigated areas based on the similar HVSR curves [42,43]. Twelve HVSR tests were carried out between the Nibbiano and Sant’Erasmo hamlet, using a triaxial surface sensor with a natural frequency of 2 Hz. The guidelines indicated in the InterPACIFIC project [38] were followed for positioning, acquisition and data processing. The tests were characterized by a signal acquisition time of 20 minutes with a sampling frequency equal to 250 Hz. For all the analyses, a window length of 20 seconds was used, and a good signal coverage was guaranteed in the windows selection process (signal coverage min = 58% - mean = 85% - max = 93%). The post-processing was carried out with the same parameters for all tests; 'Tapering' (Enabled - bandwidth = 10%) and 'Smoothing' (Konno-Ohmachi - bandwidth = 40) [44]. The figure 12 shows the clustered results of the environmental noise study.
4.3 Seismic Performance of the Slope
The accuracy of pseudo-static analysis results depends strongly on the value of the seismic coefficient used. The selection of an appropriate coefficient is the most important and difficult aspect of a pseudo-static stability analysis. The seismic coefficient controls the force applied to the mass of each individual element, so its value must be related to the measure of the magnitude of the induced inertial force. Typically, the seismic coefficient value is function of the peak horizontal ground acceleration a m a x [45,46]. In this work, the most appropriate seismic coefficient value was estimated by the 2D Local Seismic Response analysis. Site effects are the result of multiple physical phenomena (multiple reflections, diffraction, focusing, resonances, etc.) that waves undergo in correspondence with the heterogeneities and discontinuities of the most superficial layers and topographic irregularities. Local seismic response studies [47,48] allow us to evaluate the actual modifications that the seismic signal undergoes in its path from the seismic bedrock to the topographic surface [49,50]. The use of subsoil categories relating only to the Vs parameter does not consider the seismic stiffness contrast defined by the ratio between the values of shear wave propagation velocity. Therefore, in this work, the seismic amplification phenomena were improved by the 2D numerical analyses, capable of modelling the topographic and the stratigraphic conditions of the area. The analysis was divided into various work phases, one preparatory to the other:
Estimation of the base acceleration with probabilistic approach (PSHA), definition of the disaggregation data and identification of magnitude-distance pairs.
  • Selection of the natural input accelerograms.
  • Reconstruction of the stratigraphic model and seismic parameterization.
  • 2D local seismic response analysis in Linear Equivalent (LEQ) conditions.
  • Estimation of the maximum accelerations and calculation of the horizontal seismic coefficients.
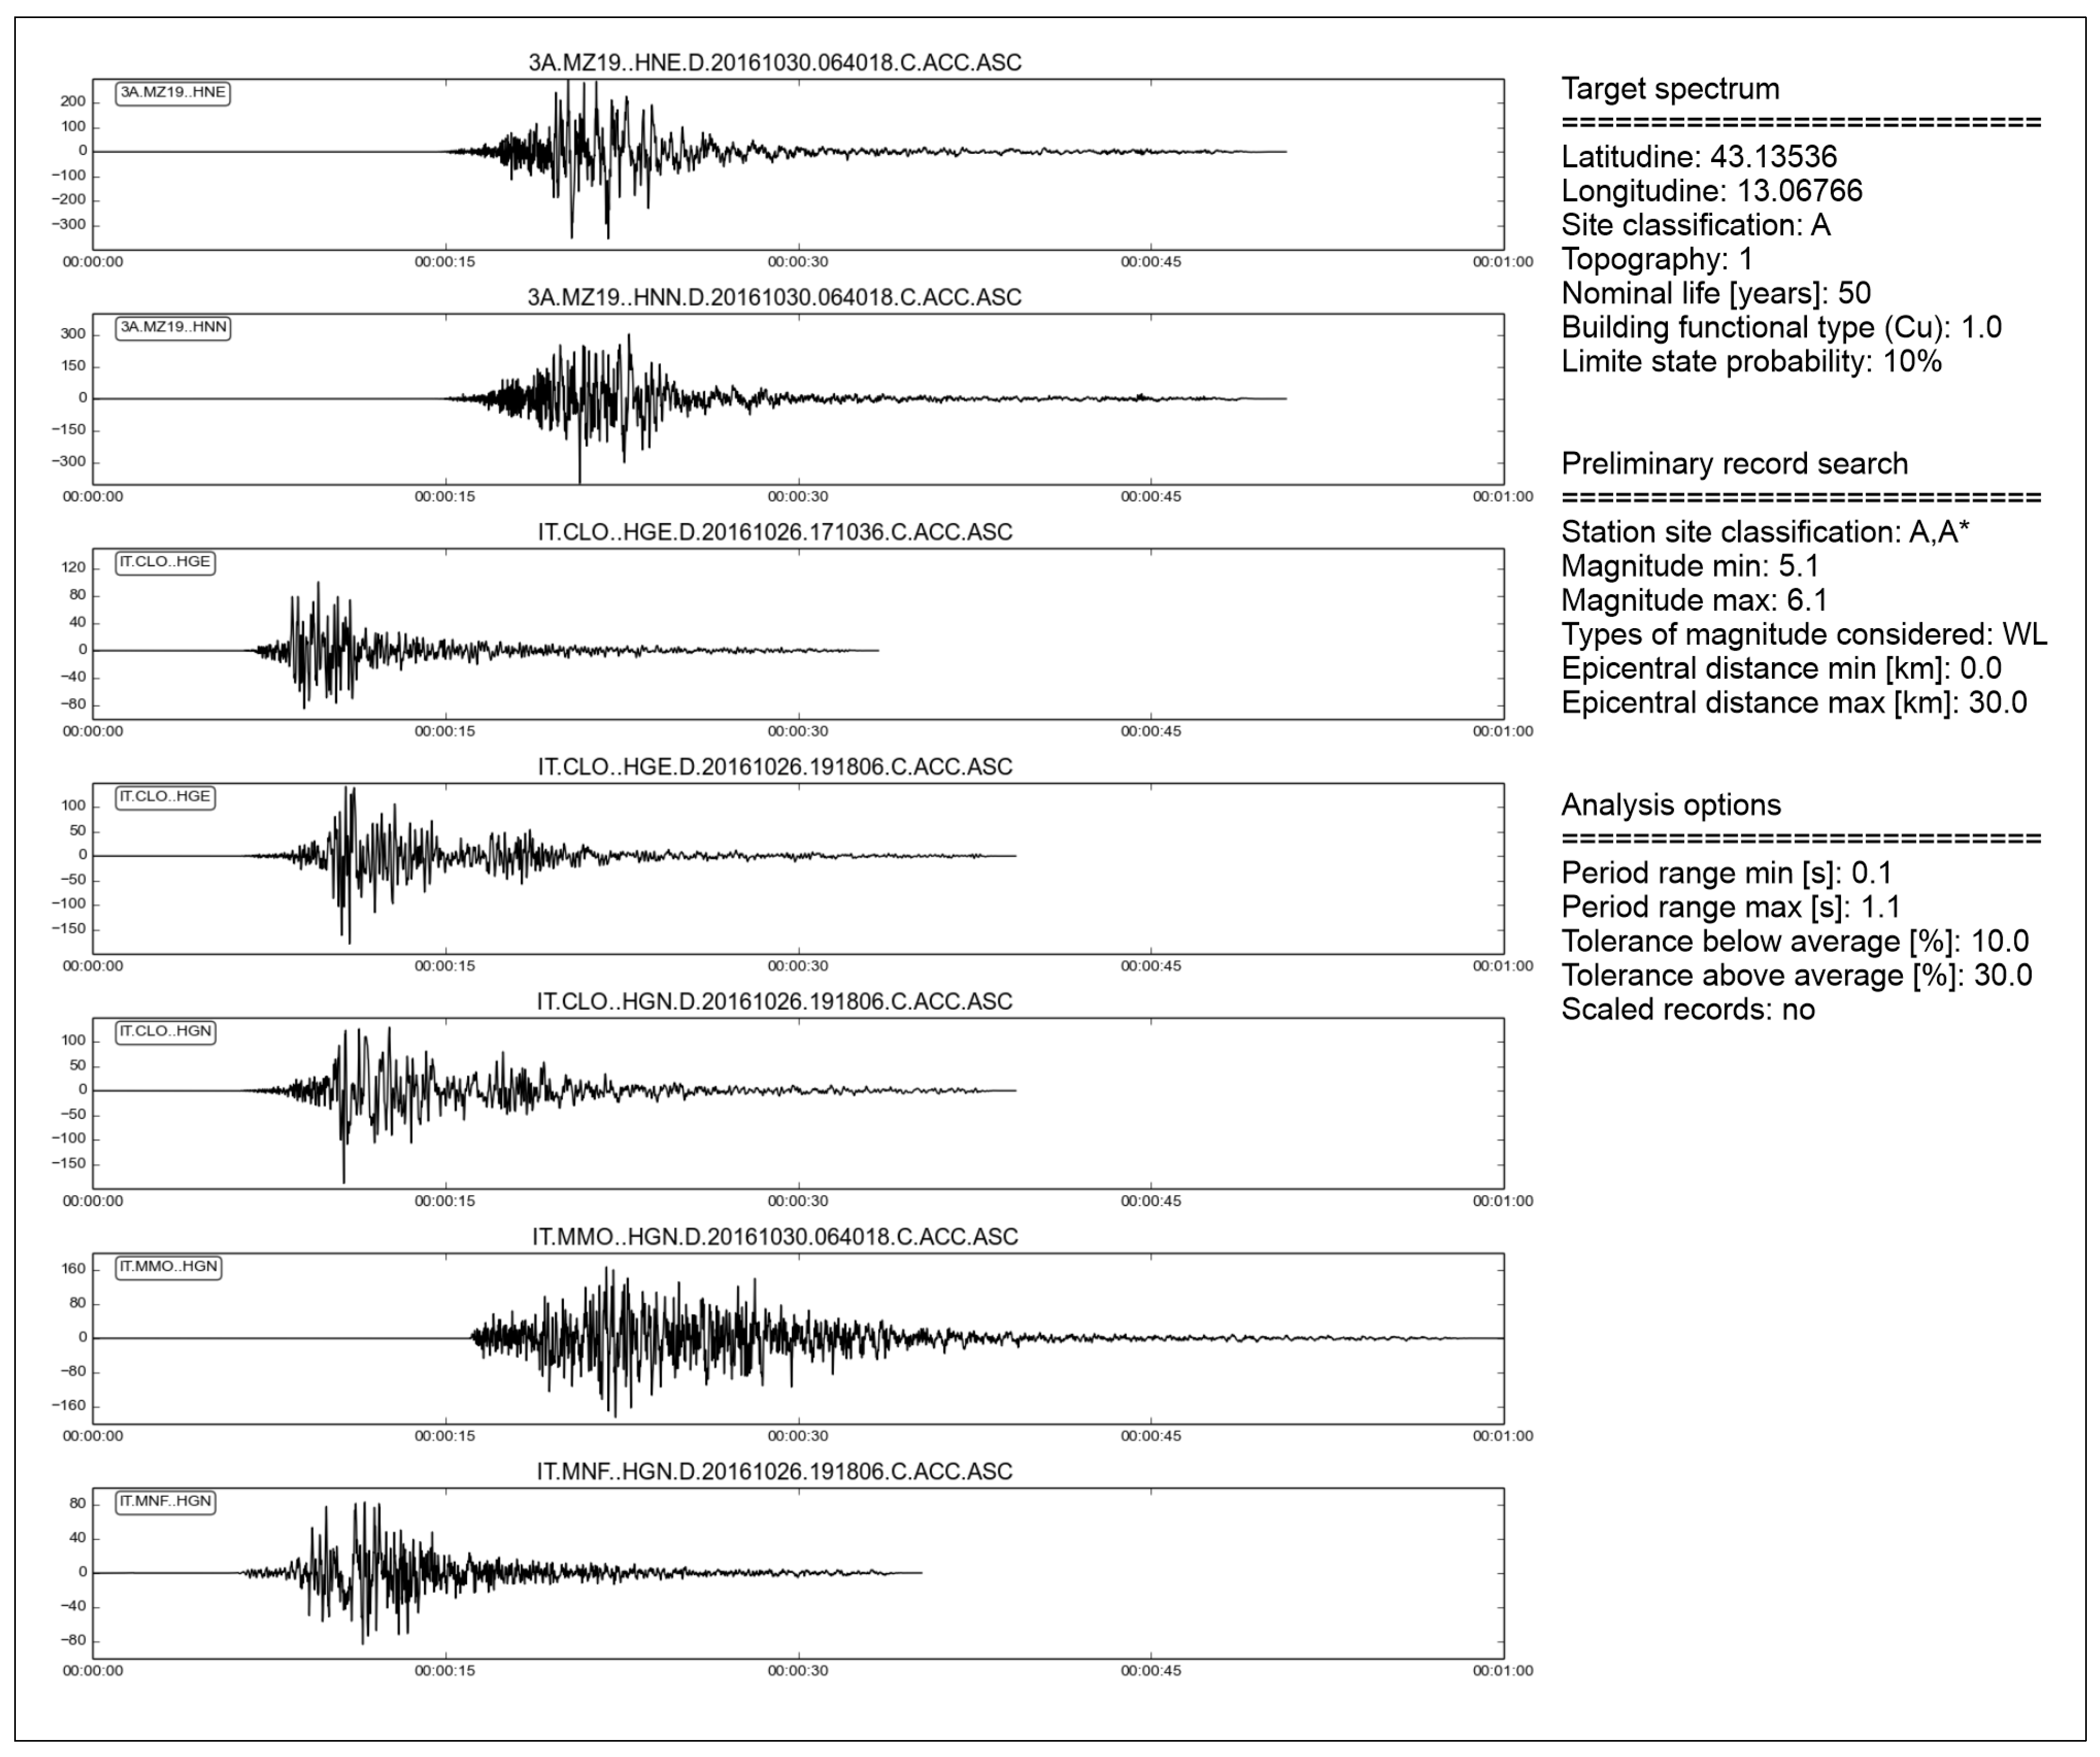
From the seismic hazard map provided by INGV for the Italian territory, the basic seismic parameters (ag, Fo, T*c) were defined, and the disaggregation of the seismic hazard was estimated by evaluating the relative contributions of different seismic sources for different magnitude-distance pairs. The definition of these parameters allowed the selection of the spectral accelerograms compatible with the target spectrum (Cat. A – T1) of the area relating to 475 years return period. The figure 13 shows the waveforms of the earthquakes used as input in the analyses.
For each accelerogram, an analysis was performed obtaining the final PGA (Peak Ground Acceleration) of the area as the average of the individual analysis. The simulations carried out with an equivalent linear approach, consider the variation of the mechanical characteristics of the soils in terms of stiffness and damping [51,52] as a function of the stress condition induced by the seismic force.
Since the 1980s numerous experimental approaches have been conducted for the analysis of the dynamic properties of granular materials to define the variation of the shear modulus G and the damping ratio D with the shear deformation γ. Among the most important and interesting test, there is the study by Rollins et al. [53,54] who, starting from the hyperbolic relation proposed by Hardin and Drnevich [54] for the sands, defined the mean curves for the evaluation of G/Gmax – γ e D – γ for the gravels. Rollins defines these curves, independent of both the sample disturbance and the fine content.
For the present work, given the granular nature of the cover soils, the Rollins et al. [53] relations were used to consider the non-linearity behavior of the materials under cyclic earthquake actions. The bedrock, instead, was considered with a perfectly elastic behavior. The table 4 shows the variation curves used for each layer.
The 2D numerical model was assembled using the seismic line L1 results between the Nibbiano and Sant’Erasmo hamlet. The seismic amplifications were analyzed with the Quad4M code [55] implemented with VisualQ4M [56]. The VisualQ4M is a pre/post-processor capable of discretizing the geo-lithologic model with a 2D finite element mesh and reordering the numbering of the nodes to reduce matrix bandwidth and consequently the calculation times. An important phase of the assembling of the model is the discretization. Excessively coarse elements can produce filter effects for the high frequency components that were avoided since the small wavelengths cannot be adequately modelled by nodes that are too distant from each other. To eliminate the problem, it was imposed an element height h m a x equal to:
h m a x 1 5 ÷ 1 8 V s f m a x
where V s is the Vs wave velocity and f m a x is the maximum frequency considered in the analysis equal to 20 Hz.
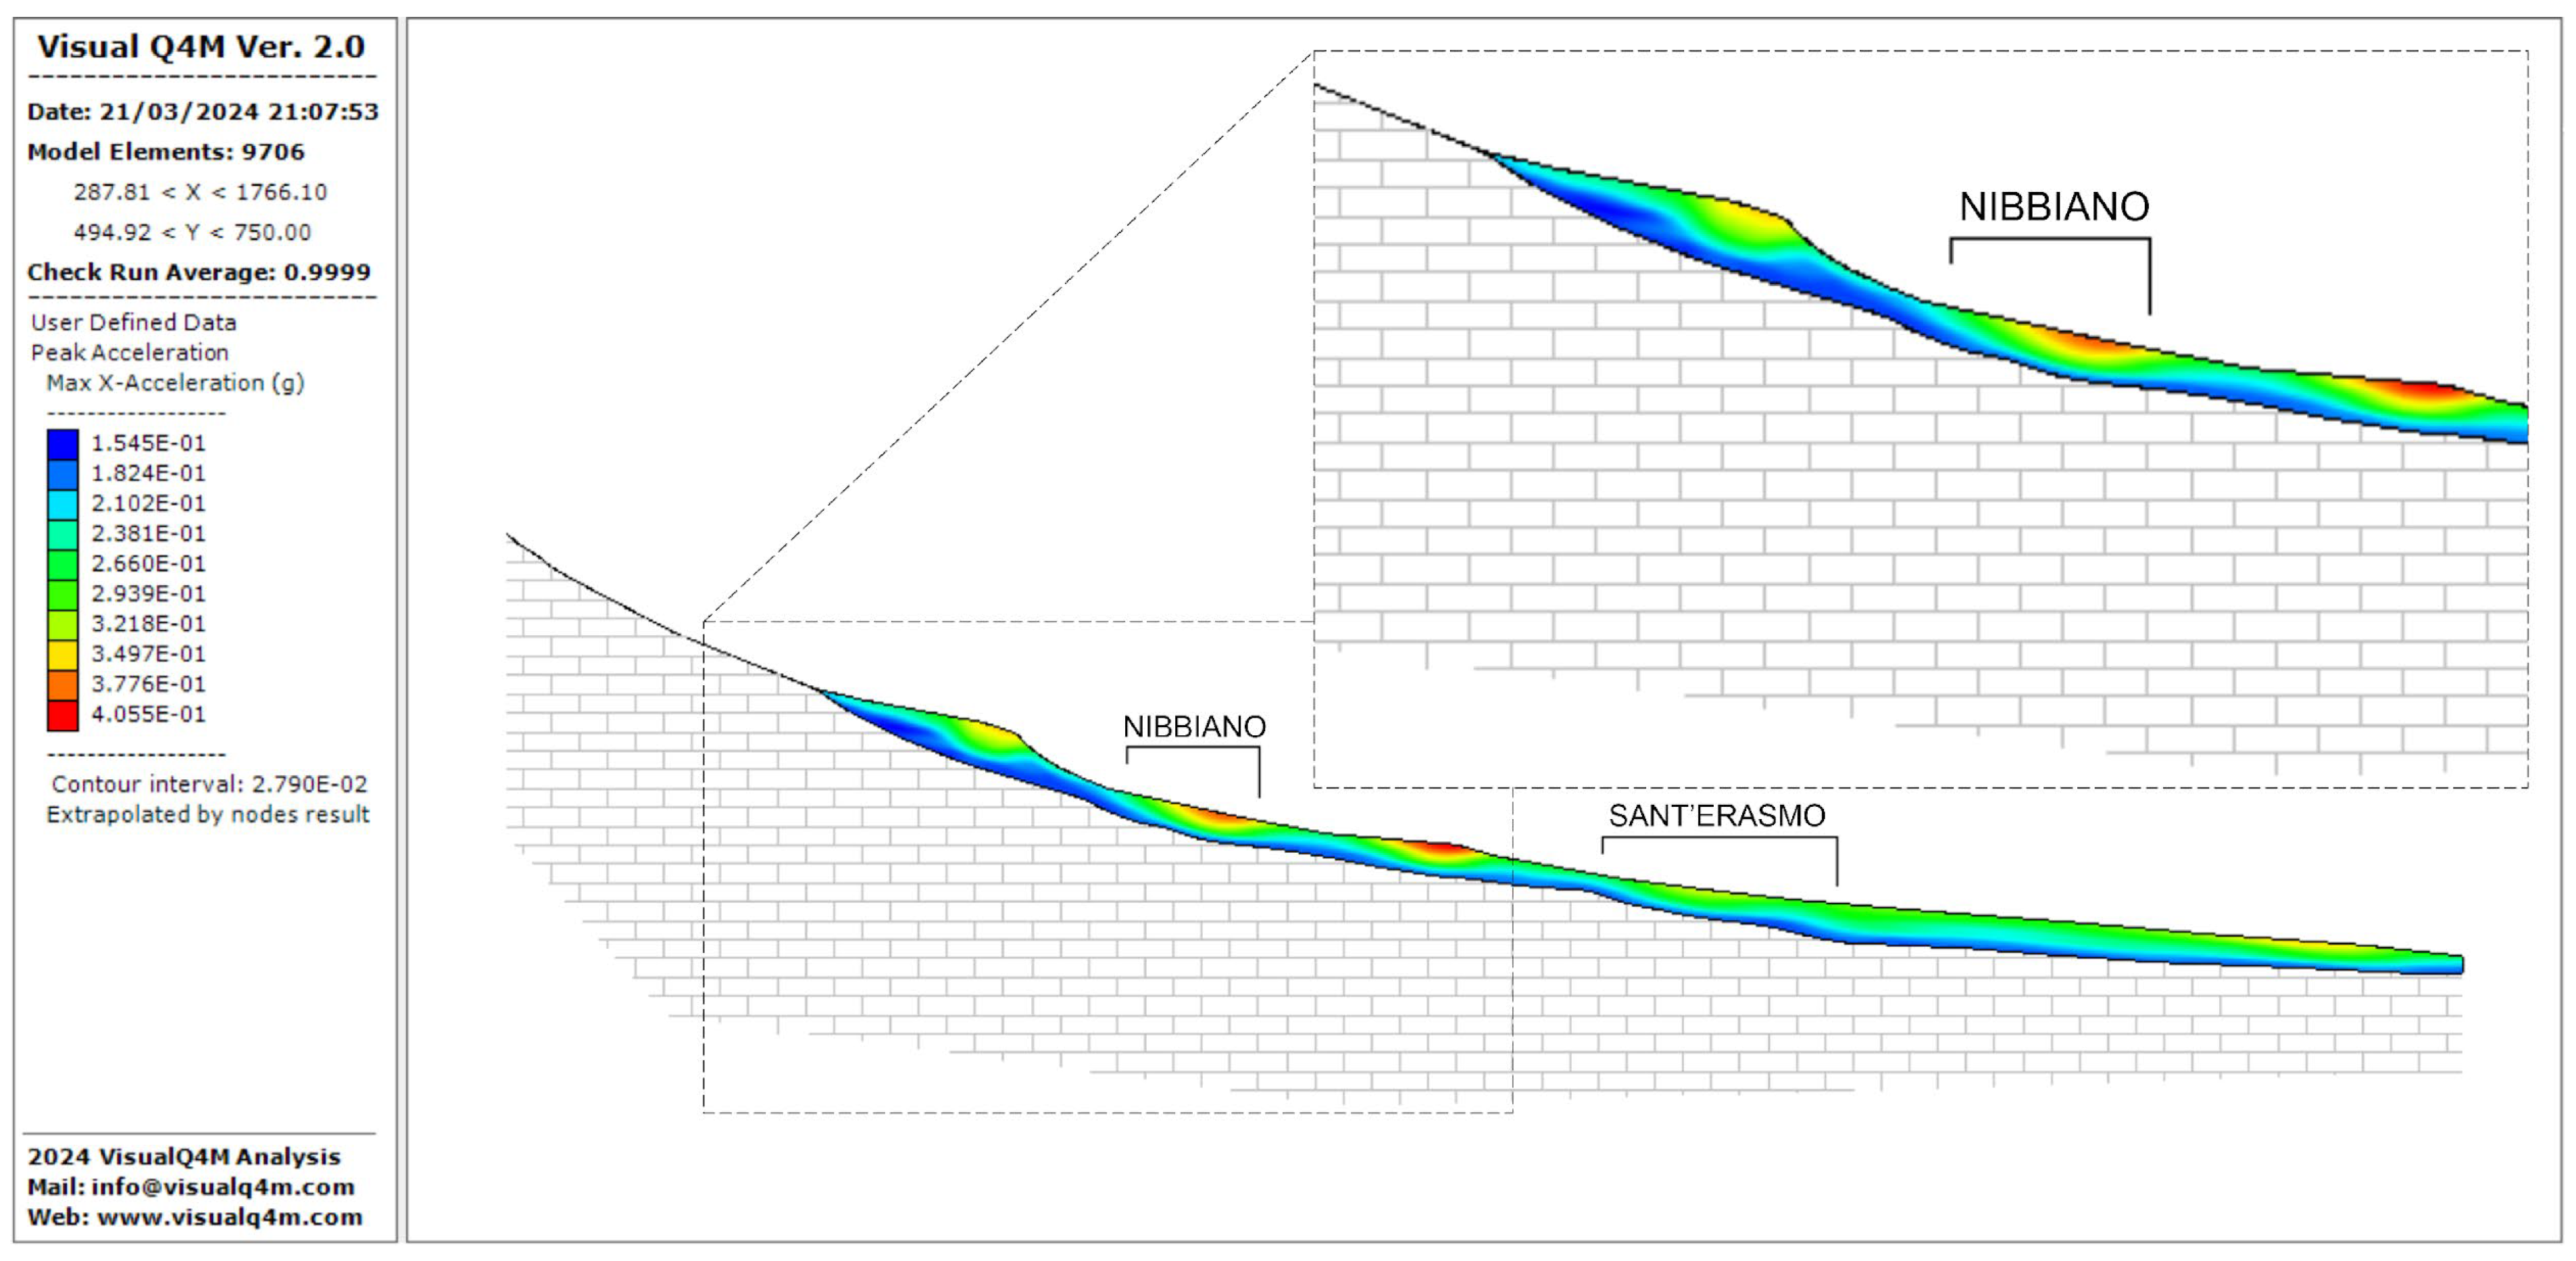
The geometric model was built by discretizing only the cover material, while the bedrock was considered as an infinite half space with a transmissible boundary, therefore able to absorb part of the incident seismic waves. Each element was assembled in a concentrated mass scheme using springs and viscous dampers as connections. The iterative resolution, with a direct integration in the time domain according to the Newmark scheme, minimises the Rayleigh coefficients based on the fundamental frequency of the model. The figure 14 shows the average distribution of the calculated maximum horizontal accelerations. There are two main focuses (max PGA), one near the Nibbiano hamlet and the other a little further downstream.
4.4 Numerical Modelling of the 3D Slope Stability
The study of slope stability examines the relationships between the mechanical characteristics of the ground (which oppose each other) and the external forces (agents) destabilize it. It is fundamental to predict the degree of safety associated with the slope along which significant slides could occur, as these phenomena have important consequences, both from a human and economic point of view [57]. For complex geometries, the use of finite element approaches is more appropriate as it does not impose the a priori hypothesis of the position and/or shape of the sliding surface. In this work, the slope stability was studied with the FLAC3D software (www.itascacg.com), an explicit finite difference code for continuum mechanics calculations.
The code simulates the behavior of continuous systems, which undergo plastic flow when the yield limits of the materials themselves are reached. Given the extension of the area between the Nibbiano and Sant’Erasmo hamlet a model of 800x800 meter was built. To obtain the consistent results, a mesh was realized with elements of variable dimensions from 10 meters in the most superficial part, to 30 meters in the deepest part.
In the model, the most superficial part has been schematized with a variable thickness (grey color in figure 15) function for both the geognostic investigations and the geophysical interpretations.
The cover material was modelled according to the Mohr-Coulomb theory using an effective cohesion equal to 5.0 kPa (conservative value) and an internal friction angle equal to 29.5°. The bedrock, instead, was simulated according to an equivalent continuous model, applying a stress-strain approach according to the Ubiquitous-Joint Plasticity criterion. This approach considers some planes of weakness within a Mohr-Coulomb stress-strain relationship. In the specific case, an effective cohesion equal to 171 kPa and an internal friction angle equal to 32.7° was used, while for the planes of weakness, an effective cohesion of zero and an internal friction angle equal to 16° was used.
The analysis was performed to evaluate the general deformation state and the possible evolution of the system according to two hypothetical levels of the piezometric level and different states of dynamic load. In this paper we show the results for:
  • Static analysis with a water table equal to -1.0 meter from ground level.
  • Pseudo-Static analysis with a water table equal to -4.0 meter from ground level.
The most widespread method for the dynamic slope stability is certainly the pseudo-static one. In this approach the seismic action is assimilated to an equivalent static force of an entity equal to the product between the seismic coefficient k and the weight of the potentially unstable ground. To obtain an analysis consistent with the real conditions of the slope, the value ​​of the seismic coefficient was correlated to the seismic performance of the slope under the cycling actions. The seismic coefficient was expressed according to:
k h = β s · a m a x g = 0.112
where a m a x = 0.4 g is the maximum horizontal acceleration resulting from the analysis of the local seismic response 2D, g is the acceleration of gravity and β s = 0.28 is the reduction coefficient of the maximum acceleration at the site by Italian building code. In the analyses were used the seismic coefficient, considering the horizontal component equal for both X and Y directions according to the combination reported in table 5.
+ K h + K h + K h - K h The slope stability analyses were performed using the Strength Reduction Factor procedure. The method is based on the repetition of the same stability test, in the same general conditions, but introducing systematically and proportionally reduced values in the resistance parameters only. Numerically, collapse occurs when it’s no longer possible to obtain a convergent solution of the stress-strain relationship and therefore of the global equilibrium. Upon reaching the generalized collapse, the global safety factor of the slope was calculated, assuming the last value of SRF that verifies the stability condition of the system. The Strength Reduction Factor (SRF) is defined as:
S R F   = t a n   φ t a n   φ f = c c f
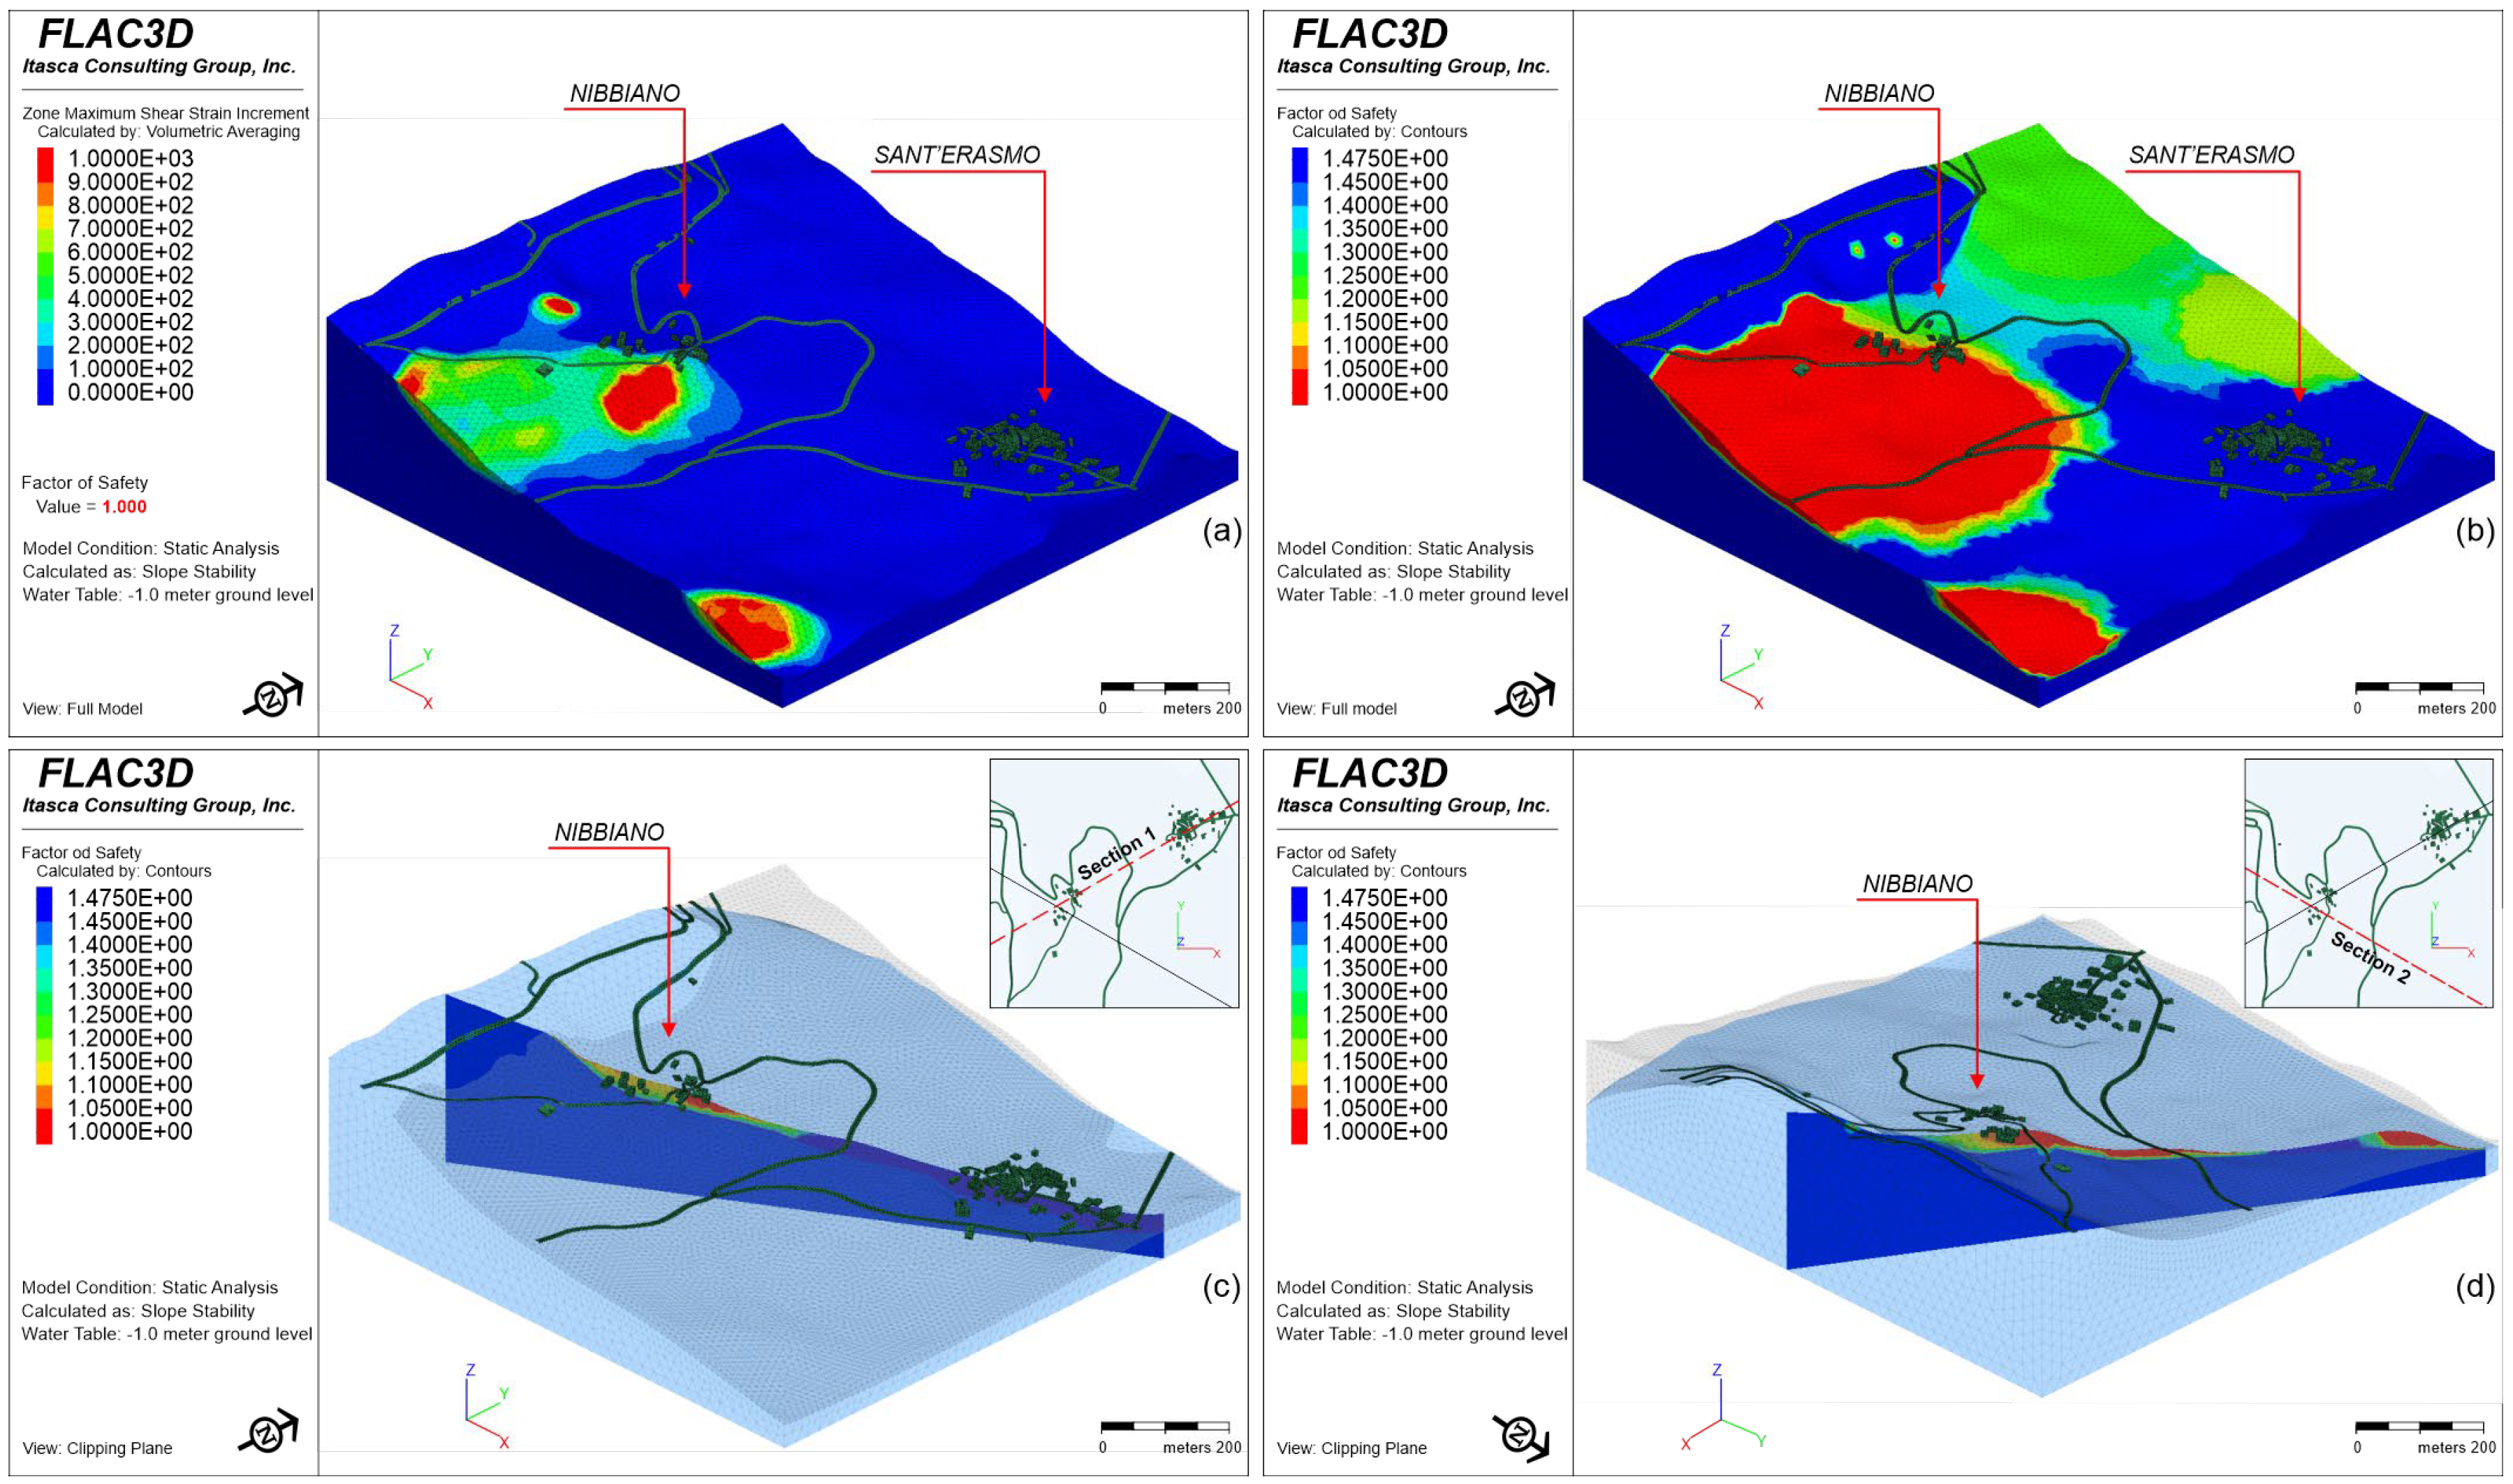
where φ f and c f are the frictional and cohesive parameters of breaking resistance. Dawson et al. [58] concluded that the value of the elasticity parameters, therefore Young's modulus (E) and Poisson's ratio (ν) have little influence on the final result of the safety factor, therefore, the effects of the elastic parameters, in this work, were not consideration. The figure 16 shows the results obtained by the static calculation and with the piezometric level equal to 1.0 meters from the elevation of the ground plane.
The figure 16a shows the maximum values of the shear deformations. The values were concentrated in the southern/south-eastern portion of the Nibbiano hamlet. Typically, the application of the SRF method produces a single safety factor that corresponds to a global minimum stability state. However, for this work, a study of multiple minimum states is more interesting to generate a distribution of the safety factors within the model itself. The figure 16b shows the color-map trend of the safety factors distribution. The same considerations for the other figures where the safety factor is represented in depth with 2D sections along the Nibbiano-Sant’Erasmo line (figure 16c) and on the maximum slope line (figure 16d).
The water table was gradually lowered to -4.0 meters depth from ground level and the pseudo-static load was applied with a force proportional to K h . Also in this case, the results identify a condition of global instability with safety factors equal to one. The figure 17 shows the trend of the maximum shear deformations.

5. Discussion

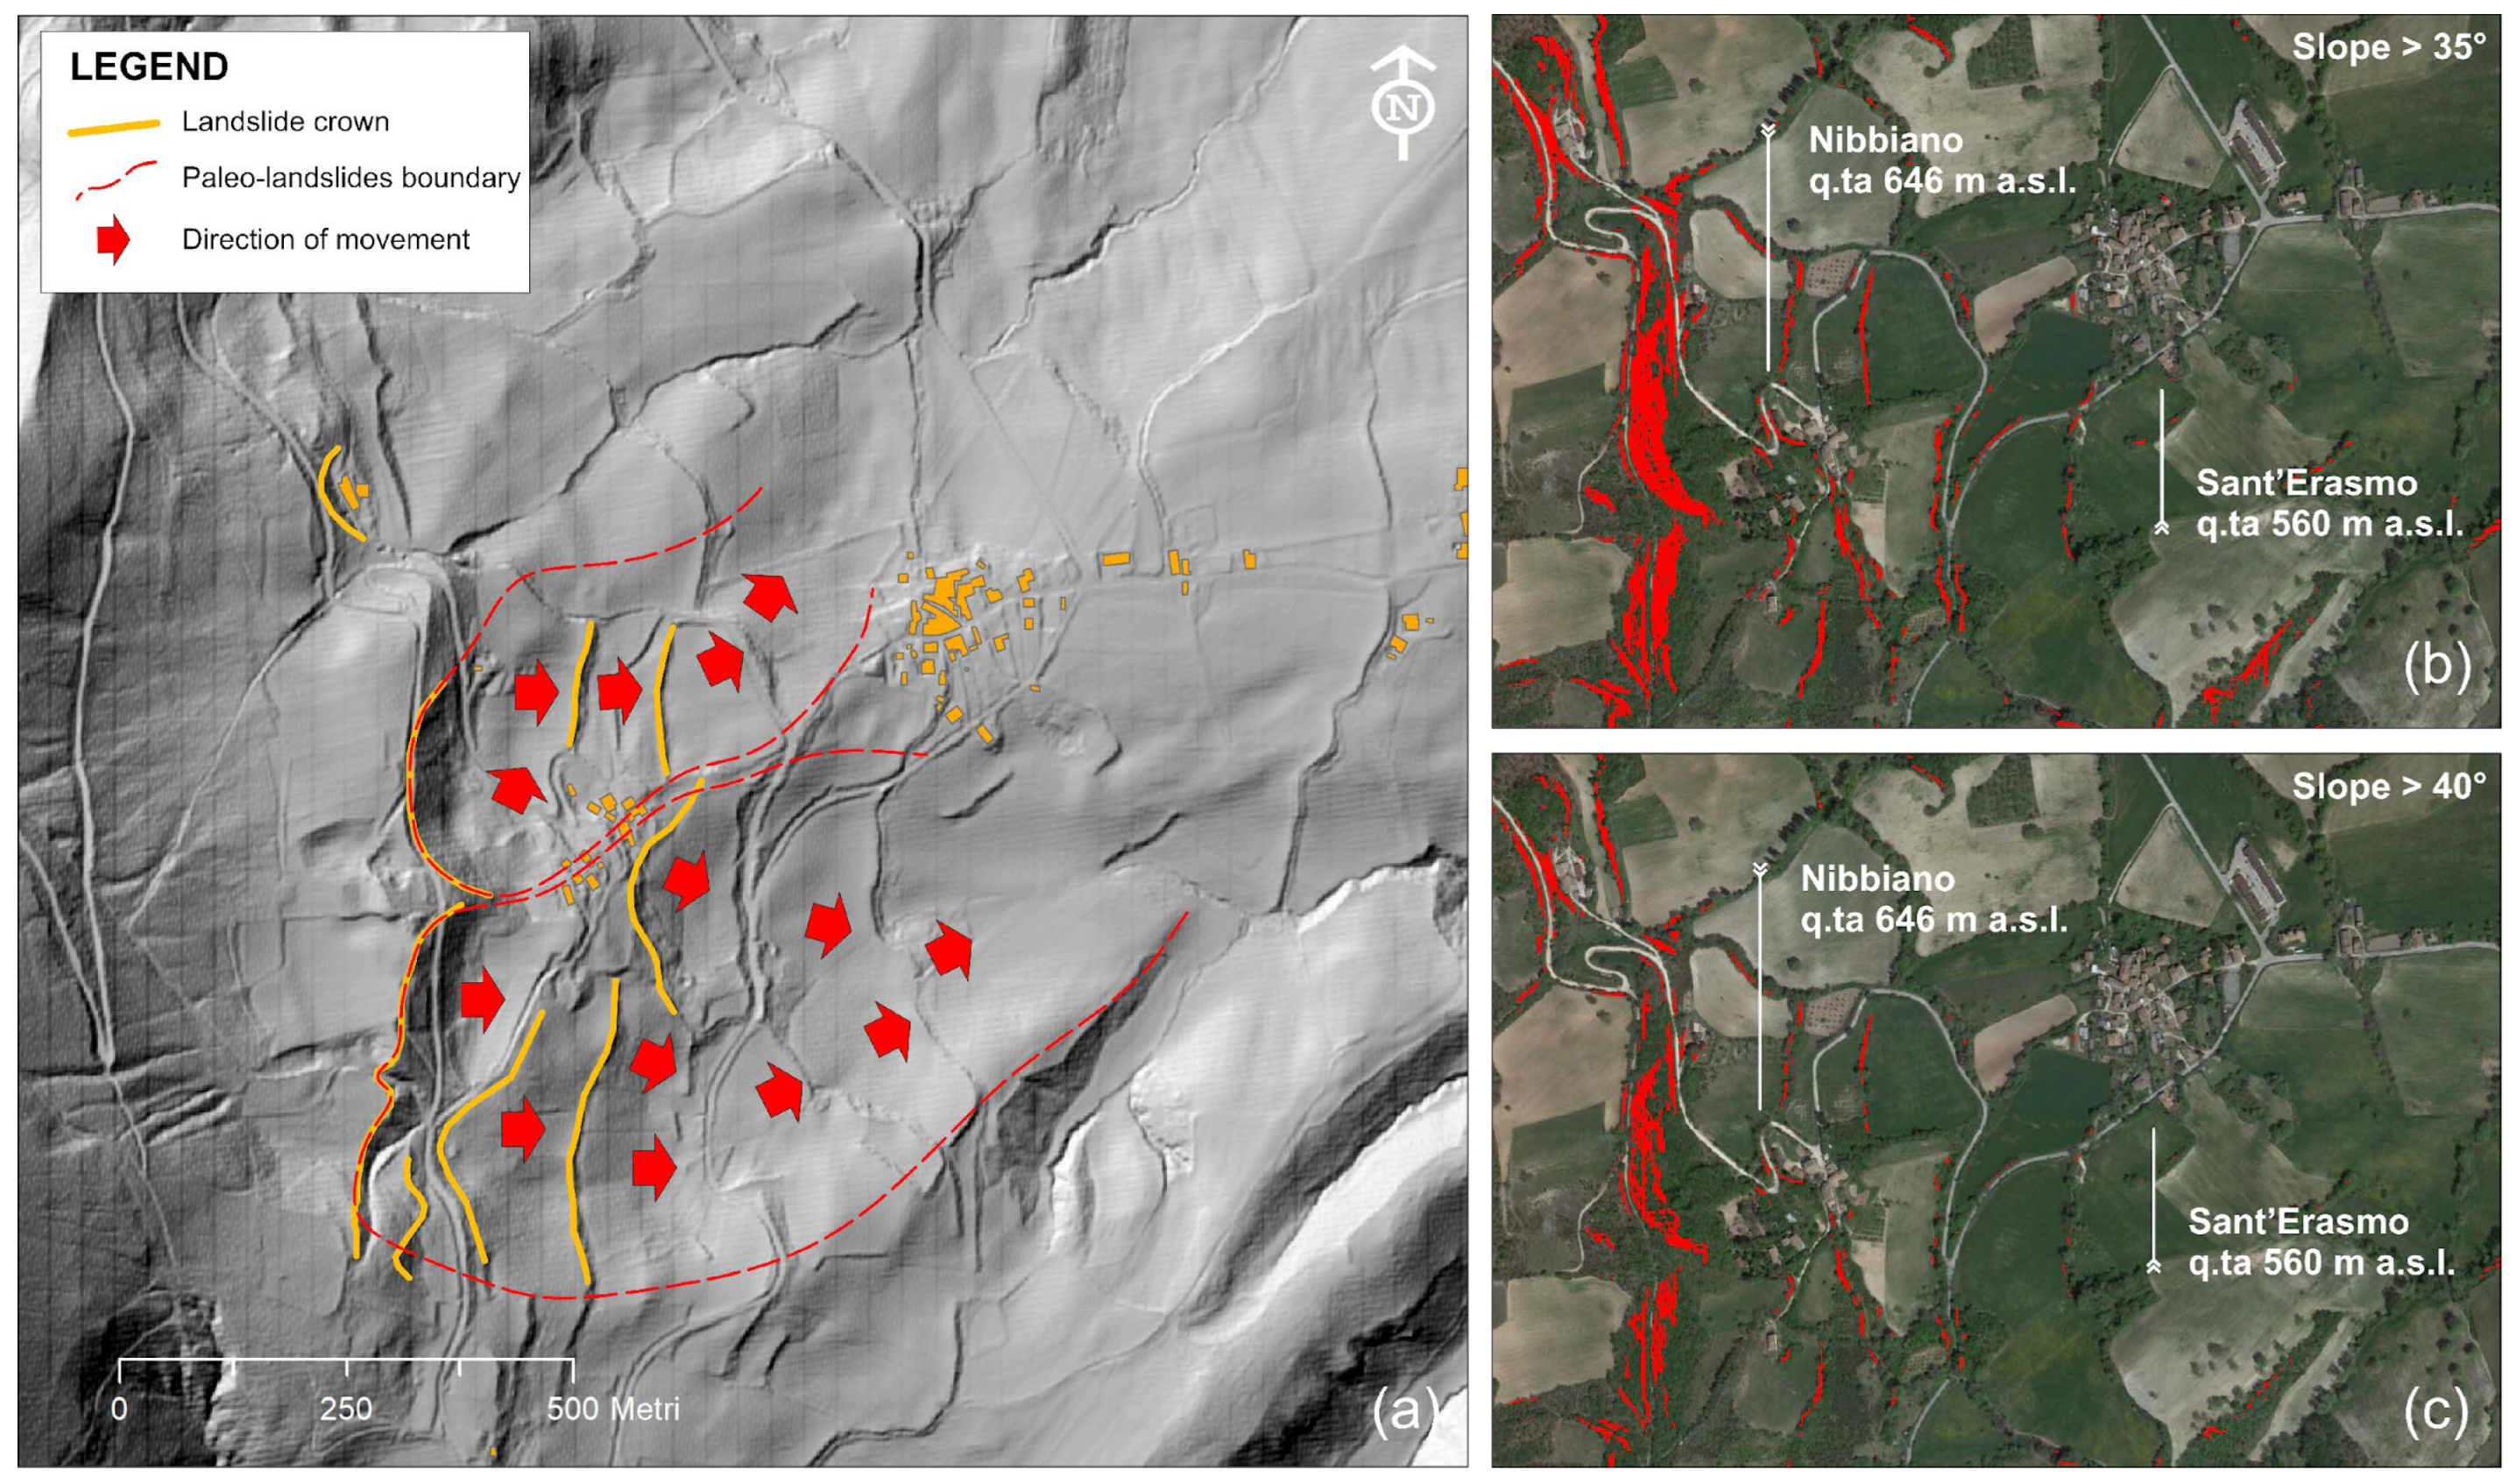
The geomorphological study showed that the Nibbiano hamlet is the one most affected by steep slopes (> 40°) recognized as scraps of old paleo-landslides. These shapes appear elongated on the north-south alignment with typical arched shapes. The landslide extends along the eastern slope of Monte Campalto, completely encompassing the Nibbiano hamlet. It is possible to state that the entire landslide is separated in two parts by the geometric rise on which both Nibbiano and Sant’Erasmo hamlets stand. The northeastern part of the area presents a lower energy, with slopes about 10° maximum, the southwestern portion, instead, presents slopes with greater energy, various counter-slopes and multiple scarps (Figure 18).
In general, the low stiffness of the debris covers and their fair degree of permeability both contribute to generating possible scenarios of instability due both to intense and/or exceptional rainfall and to induced effects by strong earthquakes. The Nibbiano hamlet shows both scenarios. These areas are present conditions of instability generated along the slopes with significant sliding depths. These instabilities are generated by both the increase of the piezometric level, already considerable given the presence of water emergencies found in the territory, and by possible seismic accelerations such as those already occurred in the Central Italy crisis of 2016-2017. The Sant’Erasmo hamlet, instead, has no relevant morphometric shapes because it is located on a very low-slope plateau with no movement energy. In this area, the damages are due only to recent seismic activity. Furthermore, it is possible to exclude the presence of deep gravitational deformations between the two hamlets.
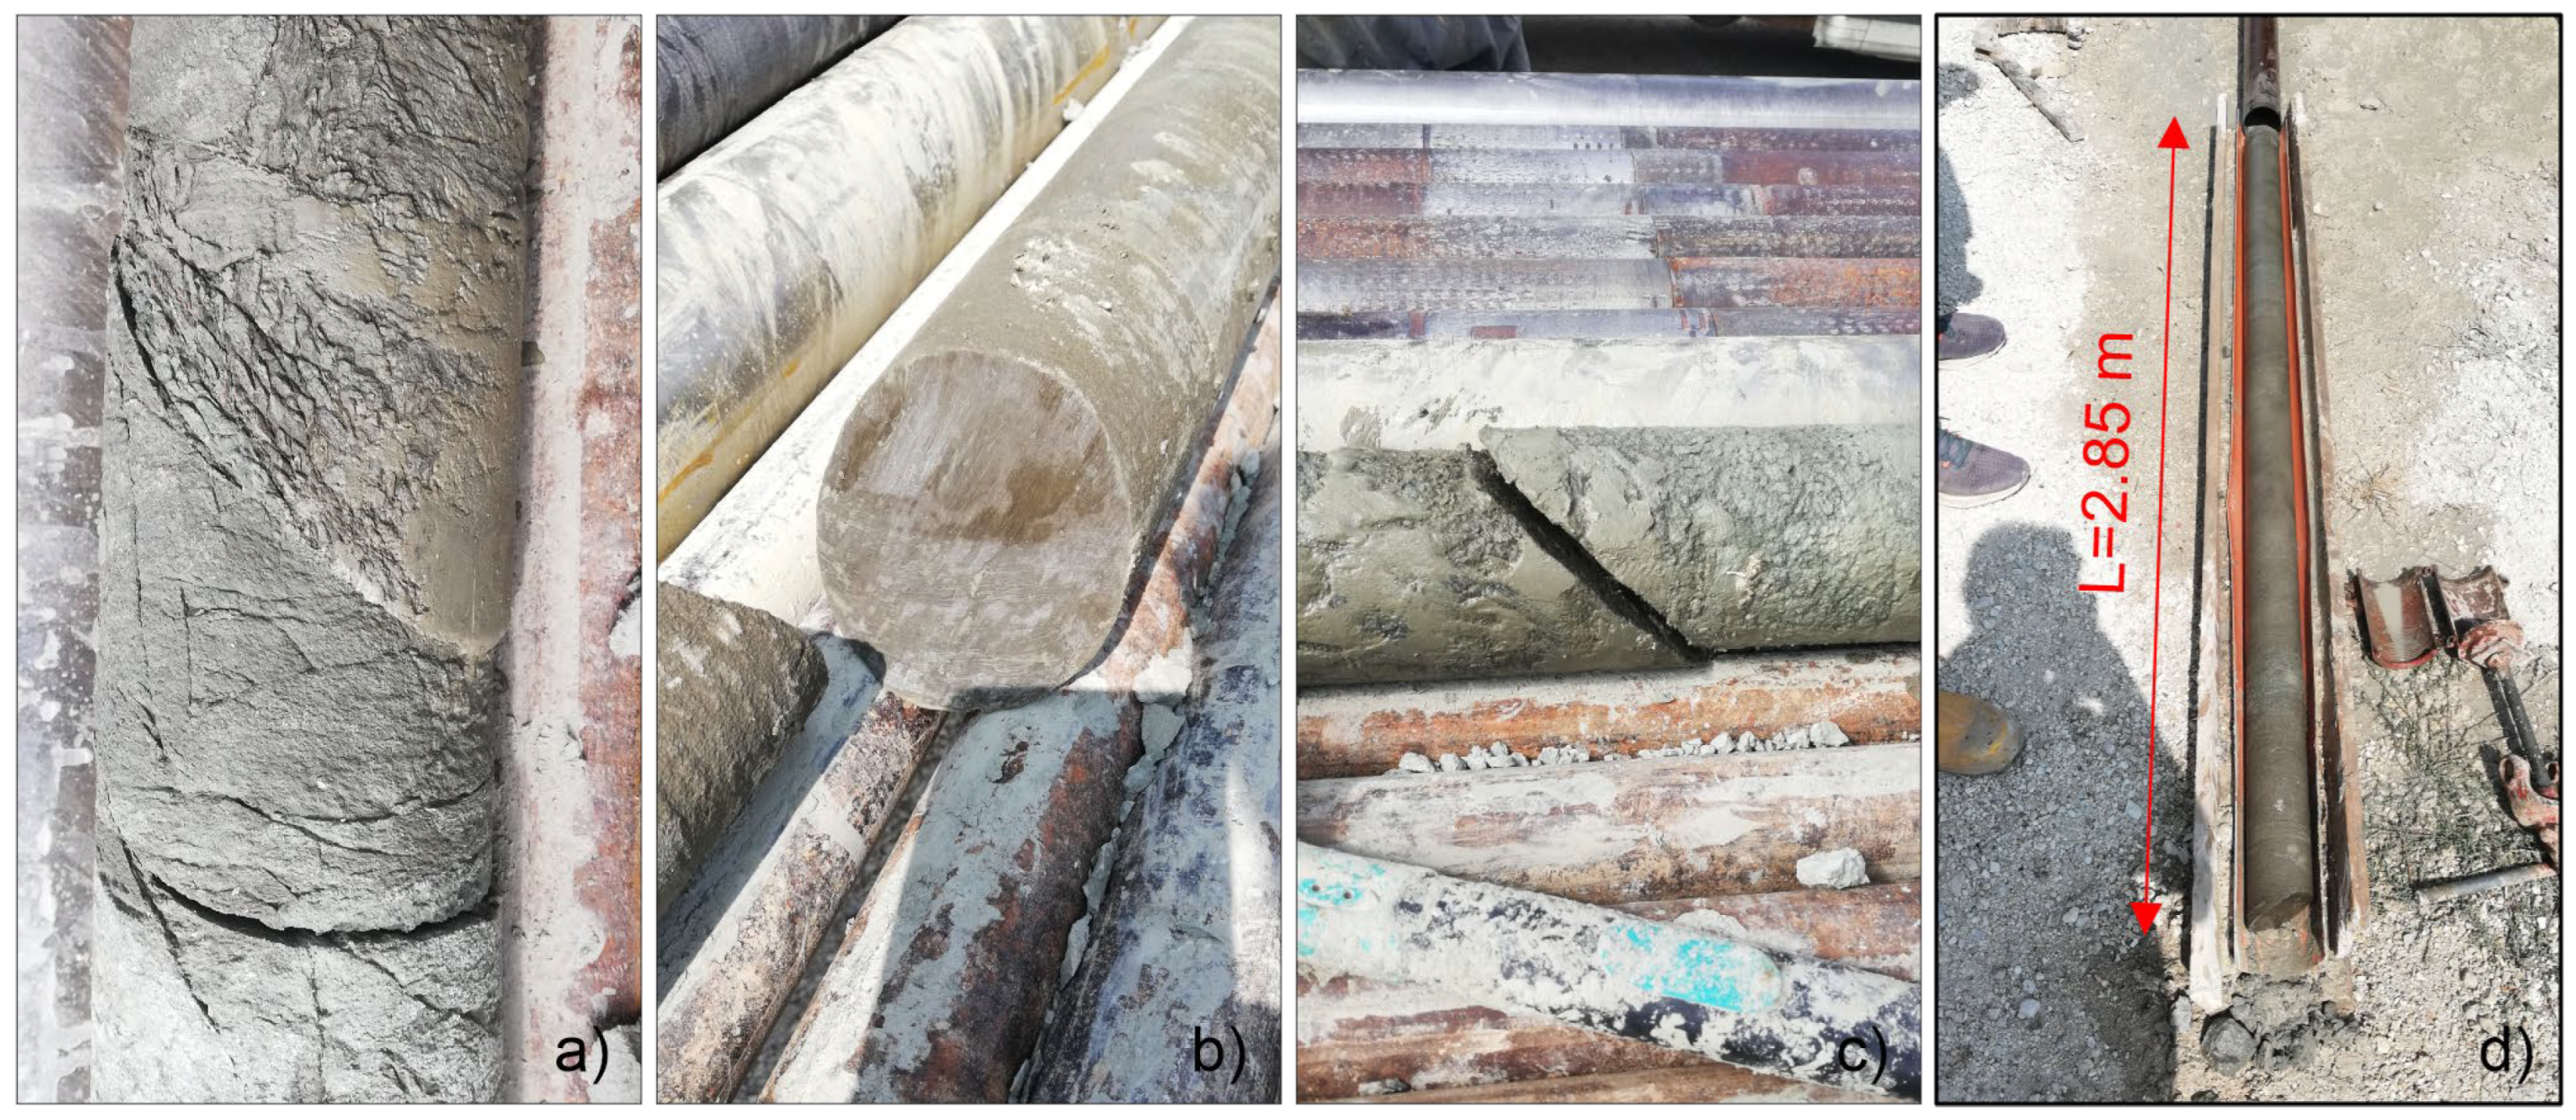
The borehole stratigraphies show a more superficial part with granular behavior due to the abundant component of calcareous debris in a sandy-silty-clay matrix, and a deep bedrock with altered marly levels in the clay matrix. The superficial part has variable thicknesses from 10.0 m in the S4 borehole to 19.5/20.0 m in the S1, S2 and S3 boreholes. The granular nature of the superficial deposits derives from the accumulation of debris along the eastern slope of Monte Campalto due to both the action of gravity and the effect of washing. The drilling of the bedrock was carried out using a double core barrel with a thin-walled crown and therefore with a minimum cutting surface. This method allowed zero disturbance to the material and a good vision of the extracted core. The bedrock shows some fractures with inclinations varying from 45° to 60° (Figures 19a, b and c) with more frequency at the top of the cluster. These slickensides are tectonic lineaments clearly visible on the cores and evident signs of fault activity. Instead, in the deeper portions the mass rock appears completely intact (Figures 19d).
The interpretation of the seismic profiles results was performed in comparison with the stratigraphy of the boreholes. For this, a bi-layered model was defined with a gradual increase of the Vp wave velocity in depth from 250 m/s to 3000 m/s. The superficial part can be referred to sediments composed mainly of calcareous breccias in a silty-clayey matrix, while the highest velocities were recorded in the deep bedrock consisting of marly limestones. The seismic profiles show a good geometrical correlation too, in fact the top of the bedrock was recorded at a depth of 20.0/25.0 meters from the ground level with a non-linear trend. The irregularities of the debris/bedrock contact are due to a portion of about 4/5 meters of rock with a high degree of fracturing probably linked to the tectonic nature of the places and in particular to the thrust planes. The section L1-L1', between the Nibbiano and the Sant'Erasmo hamlet, was interpreted in figure 20 and allows us to define the geometry of thrust planes in the slope. It is evident that they are not arranged according to the "natural" 30-40° inclination but have smaller slopes. These can be interpreted as an involvement in the gravitational deformation of the slope, which would tend to rotate the loose materials and some portions of the bedrock together with the planes, during the movement towards the valley.
The L4 seismic profile shows particulars very interesting. The results highlight a depression with a pronounced concavity towards the top in correspondence with the Sant’Erasmo hamlet. This geometry was interpreted as a small buried valley that, in particular seismic conditions, generates amplifications and focusing of seismic waves on the surface. In fact, following the earthquake between August and October 2016 and January 2017, the Sant’Erasmo hamlet reported damages to all existing buildings.
The geoelectric profile (ERT) L1 is according to the seismic interpretations and with the stratigraphic results of the boreholes. In fact, the profile shows a superficial layer with a thickness about 20.0 meters and resistivity values > 40 Ohm.m. This layer was interpreted as remobilized and aerated material attributable to the cover detrital deposits. The results show, in depth, a transition to more conductive materials typical of the calcareous marls with resistivity values more homogeneity.
The results of the HVSR tests allowed us to identify the max frequency F0 to define the depth of the contact between the cover layer and the bedrock. The tests 5, 7, 11 and 12 show very high fundamental F0 frequencies. These can be interpreted as reduced thicknesses of the cover layer, and they can be considered in some cases as the limit of closure of the volumes. All the HVSR tests with lower frequencies are aligned along the L1 line. These interpretations were essential to define the survey program and for resource optimization. The data of all investigations were used to reconstruct the 3D model subsequently analyzed by the Flac3D code to study the evolution of the area. The slopes are very vulnerable to variations to the piezometric level with safety factors that identify instability in the phases of maximum level equal to -1.0 from ground level. Moreover, the slopes are vulnerable also to the seismic cycles with lower piezometric level. In fact, also the pseudo-static analyses show minimal safety factors, and the greatest deformations are recorded on the slope that entirely encompasses the Nibbiano hamlet. The Sant'Erasmo hamlet, instead, shows conditions of stability.

6. Conclusions

In this work it was highlighted how it is essential to integrate different approaches to define the 3D geological model. The data was used to define the geometry of what is thought be the volume of soil potentially affected by gravitational movements. Specifically, it was possible to:
  • check the information on the areas with detailed studies aimed at confirming the current geological, geomorphological and structural knowledge;
  • define of the buried geometries for an areal extension capable of involving the two hamlet;
  • estimate of the geometric variations of the debris covers and of the bedrock in depth;
  • estimate the mechanical characterization of the debris along the slope and of the bedrock;
  • estimate, by the 2D local seismic response, of the maximum seismic acceleration for the two hamlet;
  • identify, by the 3D numerical modelling, of the main deformations and instabilities distinct for the two hamlet;
  • define a real deformation model that can be extended to neighboring areas, with similar lithological-structural, lithotechnical and geomorphological characteristics, useful for the creation of monitoring systems and possible remediation.
The use of geognostic and geophysical investigations demonstrate once again how a multi-source approach cannot be ignored for the definition of complex geo-morpho-stratigraphic models. The stratigraphic configuration resulting of the area and the very nature of the materials meant that it was possible to highlight a good convergence of the results between the direct geotechnical tests (boreholes, SPT, laboratory analysis) and indirect geophysical tests (Seismic, Geoelectric, HVSR). Environmental noise records processed with HVSR technique also proved to be extremely efficient, providing indispensable support to the definition of the investigation program. The data obtained allowed a detailed reconstruction of a three-dimensional model of the subsoil between the Nibbiano and Sant’Erasmo hamlet, including the local geology of the slope and the ongoing landslide process. Finally, 3D numerical analyses were useful to the delimitation of the landslide areas, of the maximum deformations and for the understanding of the future evolution of the slopes.

Author Contributions

Conceptualization, M.M. and G.S.; methodology, M.M., L.M.G. and G.P.; software, M.M. and L.M.G.; validation, G.P., N.S.; investigation, M.M. and D.A.; resources, N.S. and G.S.; data curation, M.M, D.A., G.S.; writing—original draft preparation, M.M., D.A., G.P. and N.S; writing—review and editing, M.M., G.P., D.A. and N.S.; supervision, G.P. and N.S.; funding acquisition, N.S. and G.S. All authors have read and agreed to the published version of the manuscript.”

Acknowledgments

the Authors thank the Special Office for Reconstruction of the Italian Government's for providing funds for the geognostic surveys.

Conflicts of Interest

The Authors declare no conflicts of interest

References

  1. Gentili, B.; Pambianchi, G.; Aringoli, D.; Materazzi, M.; Giacopetti, M. Pliocene-Pleistocene geomorphological evolution of the Adriatic side of central Italy. Geologica Carpathica, 2017, Vol.68 (1), pp.6-18. [CrossRef]
  2. Gentili, B.; Pambianchi, G. Deep-seated gravitational slope deformations and large landslides in the central Apennines (F. 124 Macerata). Interlinea Editors, Teramo, 1993.
  3. Calamita, F.; Pierantoni, P.P.; Zamputi, M. Il sovrascorrimento di M. Cavallo-M. Primo tra il F. Chienti e il F. Potenza (Appennino Umbro-Marchigiano): carta geologica e analisi strutturale. Scale 1:25000, 1 sheet. Boll. Soc. Geol. It. 1993, 112, 825–835.
  4. Calamita, F.; Pizzi, A.; Roscioni, M. I fasci di faglie recenti ed attive di M.Vettore-M.Bove e di M.Castello-M.Cardosa (Appennino umbro-marchigiano). Studi Geol. Camerti 1992, Vol. Spec. 1992/1, 81–95.
  5. Scisciani, V.; Agostini, S.; Calamita, F.; Pace, P.; Cilli, A.; Giori, I.; Paltrinieri, W. Positive inversion tectonics in foreland fold-and-thrust belts: A reappraisal of the Umbria–Marche Northern Apennines (Central Italy) by integrating geological and geophysical data. Tectonophysics 2014 637, 218–237. [CrossRef]
  6. Bally, A.W.; Burbi, L.; Cooper, C.; Ghelardoni, R. Balanced sections and seismic reflection profiles across the central Apennines. Mem. Soc. Geol. It., 1986, 35, 257-310.
  7. Ghisetti, F.; Vezzani, L. Interfering Paths of Deformation and Development of Arcs in the Fold-and-Thrust Belt of the Central Apennines (Italy). Tectonics, 1997, 16, 523-536. [CrossRef]
  8. Hill, K.C.; Hayward, A.B. Structural constraints on the Tertiary plate tectonic evolution of Italy. Marine and Petroleum Geol., 1988, 5, 2-15. [CrossRef]
  9. Aringoli, D., Gentili, B., Materazzi, M., Pambianchi, G. Mass movement in adriatic central Italy: activation and evolutive control factors. In: Landslides: Causes, Types and Effects; Werner, E.D., Friedman, H.P. Eds.; Nova Science Pub Inc: New York, 2010; pp.1-71.
  10. Aringoli, D.; Farabollini, P.; Pambianchi, G.; Materazzi, M.; Bufalini, M.; Fuffa, E.; Gentilucci, M.; Scalella, G. Geomorphological hazard in active tectonics area: Study cases from Sibillini mountains thrust system (Central Apennines). Land, 2021, 10(5), 510. [CrossRef]
  11. Aringoli, D. Hydrogeological and climatic risks: the emblematic case of an exceptional debris flow in central Apennines (Italy). In: Advances in Science, Technology & Innovation. Chenchouni, H. et al. Eds. Springer, Cham. 2024, 283–290. [CrossRef]
  12. Materazzi, M., Gentili, B, Aringoli, D., Farabollini, P., Pambianchi, G. Elements of slope and fluvial dynamics as evidence of late Holocene climatic fluctuations in the central Adriatic sector, Italy. Geogr. Fis. Dinam. Quat., 2010, 33, 193-204.
  13. Avena G.C.; Giuliano G.; Lupia Palmieri E. Sulla valutazione quantitativa della gerarchizzazione ed evoluzione dei reticoli fluviali. Boll. Soc. Geol. It., 1967, 86, 729-737.
  14. Ciccacci, S.; Fredi, P.; Lupia Palmieri, E.; Pugliese, F. Contributo dell'analisi geomorfica quantitativa alla valutazione dell'entità dell'erosione nei bacini fluviali. Boll. Soc. Geol. It. 1980, 99, 455 -516.
  15. Palmieri, E. L., Centamore, E., Ciccacci, S., D'Alessandro, L., Del Monte, M., Fredi, P., Pugliese, F. Geomorfologia quantitativa e morfodinamica del territorio abruzzese: II–Il bacino idrografico del Fiume Tordino: Quantitative Geomorphology and morphodynamics of a the Abruzzo, Italy: II–The drainage basin of the River Tordino. Geogr. Fis. Dinam. Quat., 1998, 21(1), 113-129.
  16. Della Seta, M., Del Monte, M., Fredi, P., Lupia Palmieri, E. Quantitative morphotectonic analysis in areas on unpervasively deformed lithologies: a case study from southern Marche, Italy. Géomorphologie relief processus environnement. 2004, 4, 267-284. [CrossRef]
  17. Eurocode 7. Geotechnical design. Part 1, General rules.
  18. Frank R, Bauduin C, Driscoll R, Kavvadas M, Krebs Ovesen N, Orr T and Schuppener B. Designers’ Guide to EN 1997: Geotechnical Design – Part 1: General rules. Thomas Telford, London, UK. 2004.
  19. Deere, D.U. and Miller, D.W. The Rock Quality Designation (RQD) Index in Practice, Classification Systems for Engineering Purposes. ASTM STP, American Society for Testing and Materials, Philadelphia, 1967, PA, 91-101. [CrossRef]
  20. Coon, R. F., and A. H. Merritt. Predicting in situ modulus of deformation using rock quality indexes. West Conshohocken: ASTM International, 1970.
  21. Serafim, J.L. and Pereira, J.P. Considerations on the Geomechanical Classification of Bieniawski. Proceedings of International Symposium on Engineering Geology and Underground Openings, Lisbon, Portugal, 1983, 1133-1144.
  22. Zhang, L. and Einstein, H.H. Using RQD to Estimate the Deformation Modulus of Rock Masses. International Journal of Rock Mechanics and Mining Sciences 2004, 41, 337-341. [CrossRef]
  23. Zhang, Lianyang. Estimating the strength of jointed rock masses. Rock Mechanics and Rock Engineering 2010 43: 391-402. [CrossRef]
  24. Pells, Philip & Bieniawski, Z. & Hencher, Steve & Pells, Steven. RQD: Time to Rest in Peace. Canadian Geotechnical Journal. 2017. 54. [CrossRef]
  25. Hoek, Evert & Brown, E. The Hoek-Brown failure criterion -a 1988 update. Toronto. 15th Canadian Rock Mechanics Symposium. 1988.
  26. Hoek, E & Carranza-Torres, C. & Corkum, Brent & Hoek, Evert & Carranza-Torres, Carlos. Hoek-Brown failure criterion - 2002 Edition.
  27. Marinos, P. & Marinos, V. & Hoek, Evert. The Geological Strength Index (GSI): A characterization tool for assessing engineering properties of rock masses. 2007, . [CrossRef]
  28. Truzman, M. Metamorphic rock mass characterization using the Geological Strength Index (GSI). In Proceedings of the 43rd U.S. Rock Mechanics Symposium & 4th U.S.- Canada Rock Mechanics Symposium – American Rock Mechanics Association (ARMA), 2009.
  29. ROCSCIENCE Inc., RocData Software (2011) Rocscience Inc. <www.rocscience.com>; [accessed 4.3.24].
  30. Cerveny V. Seismic ray and ray intensities in inhomogeneous anisotropic media. Geophysical Journal of the Royal Astronomical Society 1972, 29, 1-13. [CrossRef]
  31. Zhang, J., Toksoz M. Nonlinear refraction traveltime tomography. Geophysics 1998, 63, 5, 1726–1737. [CrossRef]
  32. J.S. Whiteley, J.E. Chambers, S. Uhlemann, J. Boyd, M.O. Cimpoiasu, J.L. Holmes, C.M. Inauen, A. Watlet, L.R. Hawley-Sibbett, C. Sujitapan, R.T. Swift, J.M. Kendall, Landslide monitoring using seismic refraction tomography – The importance of incorporating topographic variations. Engineering Geology, 2020, 268, 105525, ISSN 0013-7952, . [CrossRef]
  33. Loke, M.H., Chambers, J.E., Rucker, D.F., Kuras, O., Wilkinson, P.B. Recent developments in the direct-current geoelectrical imaging method. J. Appl. Geophys. 2013 95, 135–156. [CrossRef]
  34. Crook, N., Binley, A., Knight, R., Robinson, D.A., Zarnetske, J., Haggerty, R. Electrical resistivity imaging of the architecture of substream sediments. Water Resour, 2008 Res. 44, W00D13. [CrossRef]
  35. Ciampi P., Giannini L.M., Cassiani G., Esposito C., Petrangeli Papini M.. Geo-constrained clustering of resistivity data revealing the heterogeneous lithological architectures and the distinctive geoelectrical signature of shallow deposits, Engineering Geology 337,2024,107589, ISSN 0013-7952,. [CrossRef]
  36. Nakamura, Y. A method for dynamic characteristics estimation of subsurface using microtremors on the ground surface. Q. Report RTRI 1989 Jpn. 30, 25–33.
  37. Lunedei E., Malischewsky P.. A review and some new issues on the theory of the H/V technique for ambient vibrations. A. Ansal (ed.), Perspectives on European Earthquake Engineering and Seismology, Geotechnical, Geological and Earthquake Engineering 2015 39 (371 – 394).
  38. Foti S., Hollender F., Garofalo F., Albarello D., Asten C., Cox B., Di Giulio G., Forbriger T., Hayashi K., Lunedei E., Martin A., Mercerat D., Ohrnberger M., Poggi V., Renalier F., Sicilia D., Socco V. Guidelines for the good practice of surface wave analysis: a product of the InterPACIFIC project. Bulletin of Earthquake Engineering 2017, 16, 6, 2367-2420. [CrossRef]
  39. Maresca R., Guerriero L., Ruzza G., Mascellaro N., Guadagno F.M., Revellino P. Monitoring ambient vibrations in an active landslide: Insights into seasonal material consolidation and resonance directivity. Journal of Applied Geophysics 203, 2022, 104705, . [CrossRef]
  40. Iannucci R., Martino S., Paciello A., D’Amico S., Galea P. Engineering geological zonation of a complex landslide system through seismic ambient noise measurements at the Selmun Promontory (Malta). Geophysical Journal International, 213, 2018, 1146-1161, . [CrossRef]
  41. Pazzi V., Tanteri L., Bicocchi G., D’Ambrosio M., Caselli A., Fanti R. H/V measurements as an effective tool for the reliable detection of landslide slip surfaces: Case studies of Castagnola (La Spezia, Italy) and Roccalbegna (Grosseto, Italy). Physics and Chemistry of the Earth, 98, 2017, 136-153, . [CrossRef]
  42. Giannini, L.M., Varone, C., Esposito, C., Scarascia Mugnozza, G., Schilirò, L. The potential of spatial statistics for the reconstruction of a subsoil model: a case study for the Firenze-Prato-Pistoia Basin, Central Italy. J. Appl. Geophys. 194, 2021, 104466, 104466 . [CrossRef]
  43. Paolucci E., Lunedei E., Albarello D. Application of the principal component analysis (PCA) to HVSR data aimed at the seismic characterization of earthquake prone areas. Geophysical Journal International, 211, 2017, 650-662, 2017, . [CrossRef]
  44. Wathelet, Marc & Chatelain, Jean-Luc & Cornou, Cécile & Di Giulio, Giuseppe & Guillier, Bertrand & Ohrnberger, Matthias & Savvaidis, Alexandros. Geopsy: A User-Friendly Open-Source Tool Set for Ambient Vibration Processing. Seismological Research Letters 2020. 91. [CrossRef]
  45. Seed, H.B. and Martin, G.R. The seismic coefficient in earth dam design. Journal of the Soil Mechanics and Foundation Division, ASCE, 92, (SM3), 1966, Pages 25–57.
  46. Dakoulas, P. and Gazetas, G. Seismic shear strains and seismic coefficients in dams and embankments. Soil Dynamics and Earthquake Engineering Volume 5, Issue 2, April 1986, Pages 75-83. [CrossRef]
  47. Lanzo, G. Silvestri F. Risposta sismica locale. Teoria ed esperienze. Hevelius ISBN-10: 8886977131, 1999.
  48. Kramer, S.L. Geotechnical Earthquake Engineering; Prentice Hall: Upper Saddle River, NJ, USA, 1996.
  49. Pasculli, A., Mangifesta, M.. Local Seismic Change Following an Excavation in an Area Located in the Territory of L'Aquila City (Italy). International Conference of Numerical Analysis and Applied Mathematics ICNAAM 2019 AIP Conf. Proc. 2293 420072-1–420072-6; Rhodes, Greece, 23-28 September 2019; [CrossRef]
  50. Pasculli, A., Mangifesta, M., Sciarra, N. Stochastic Approach for 2D Superficial Seismic Amplification Based on Quad4M; City of L’Aquila (Italy) Test Case. Geosciences 2023, 13, 165. [CrossRef]
  51. Khouri, N.Q. Dynamic properties of soils, Master Thesis 1984, Department of Civil Engineering, Syracuse University.
  52. Darendeli, M.B. Development of a New Family of Normalized Modulus Reduction and Material Damping Curves, Ph.D. Dissertation, University of Texas at Austin 2001, 362 pp.
  53. Rollins, K. M., Evans, M. D., Dihel, N. B. e Daily III, W. D. Shear modulus and damping relationships for gravels. Journal of Geotech. And Geoenv. Engineering, ASCE 1998, 124 (5).
  54. Hardin, Bobby & Drnevich, Vincent. Shear Modulus and Damping in Soils: Design Equations and Curves. J. Soil Mech. Found. Div. 98, 1972, . [CrossRef]
  55. Hudson, M., Idriss, I.M., Beikae, M. QUAD4M: A Computer Program to Evaluate the Seismic Response of Soil Structures Using Finite Element Procedures and Incorporating a Compliant Base; Center for Geotechnical Modeling, Department of Civil and Environmental Engineering, University of California Davis: Davis, CA, USA, 1994.
  56. Mangifesta M. VisualQ4M v2.0. Pre & Post Processor for evaluation of the seismic response. www.visualq4m.com. 2024.
  57. Sciarra N., Mangifesta M., Carabba L., Mischiatti L. Methodological Approach for the Study of Historical Centres of High Architectural Value Affected by Geo-Hydrological Hazards: The Case of Lanciano (Abruzzo Region—Central Italy). Geosciences. 2022; 12(5):193. [CrossRef]
  58. Dawson, E.M., Roth, W.H. and Drescher, A. Slope Stability Analysis by Strength Reduction, Geotechnique 1999, 49(6), 835-840. [CrossRef]
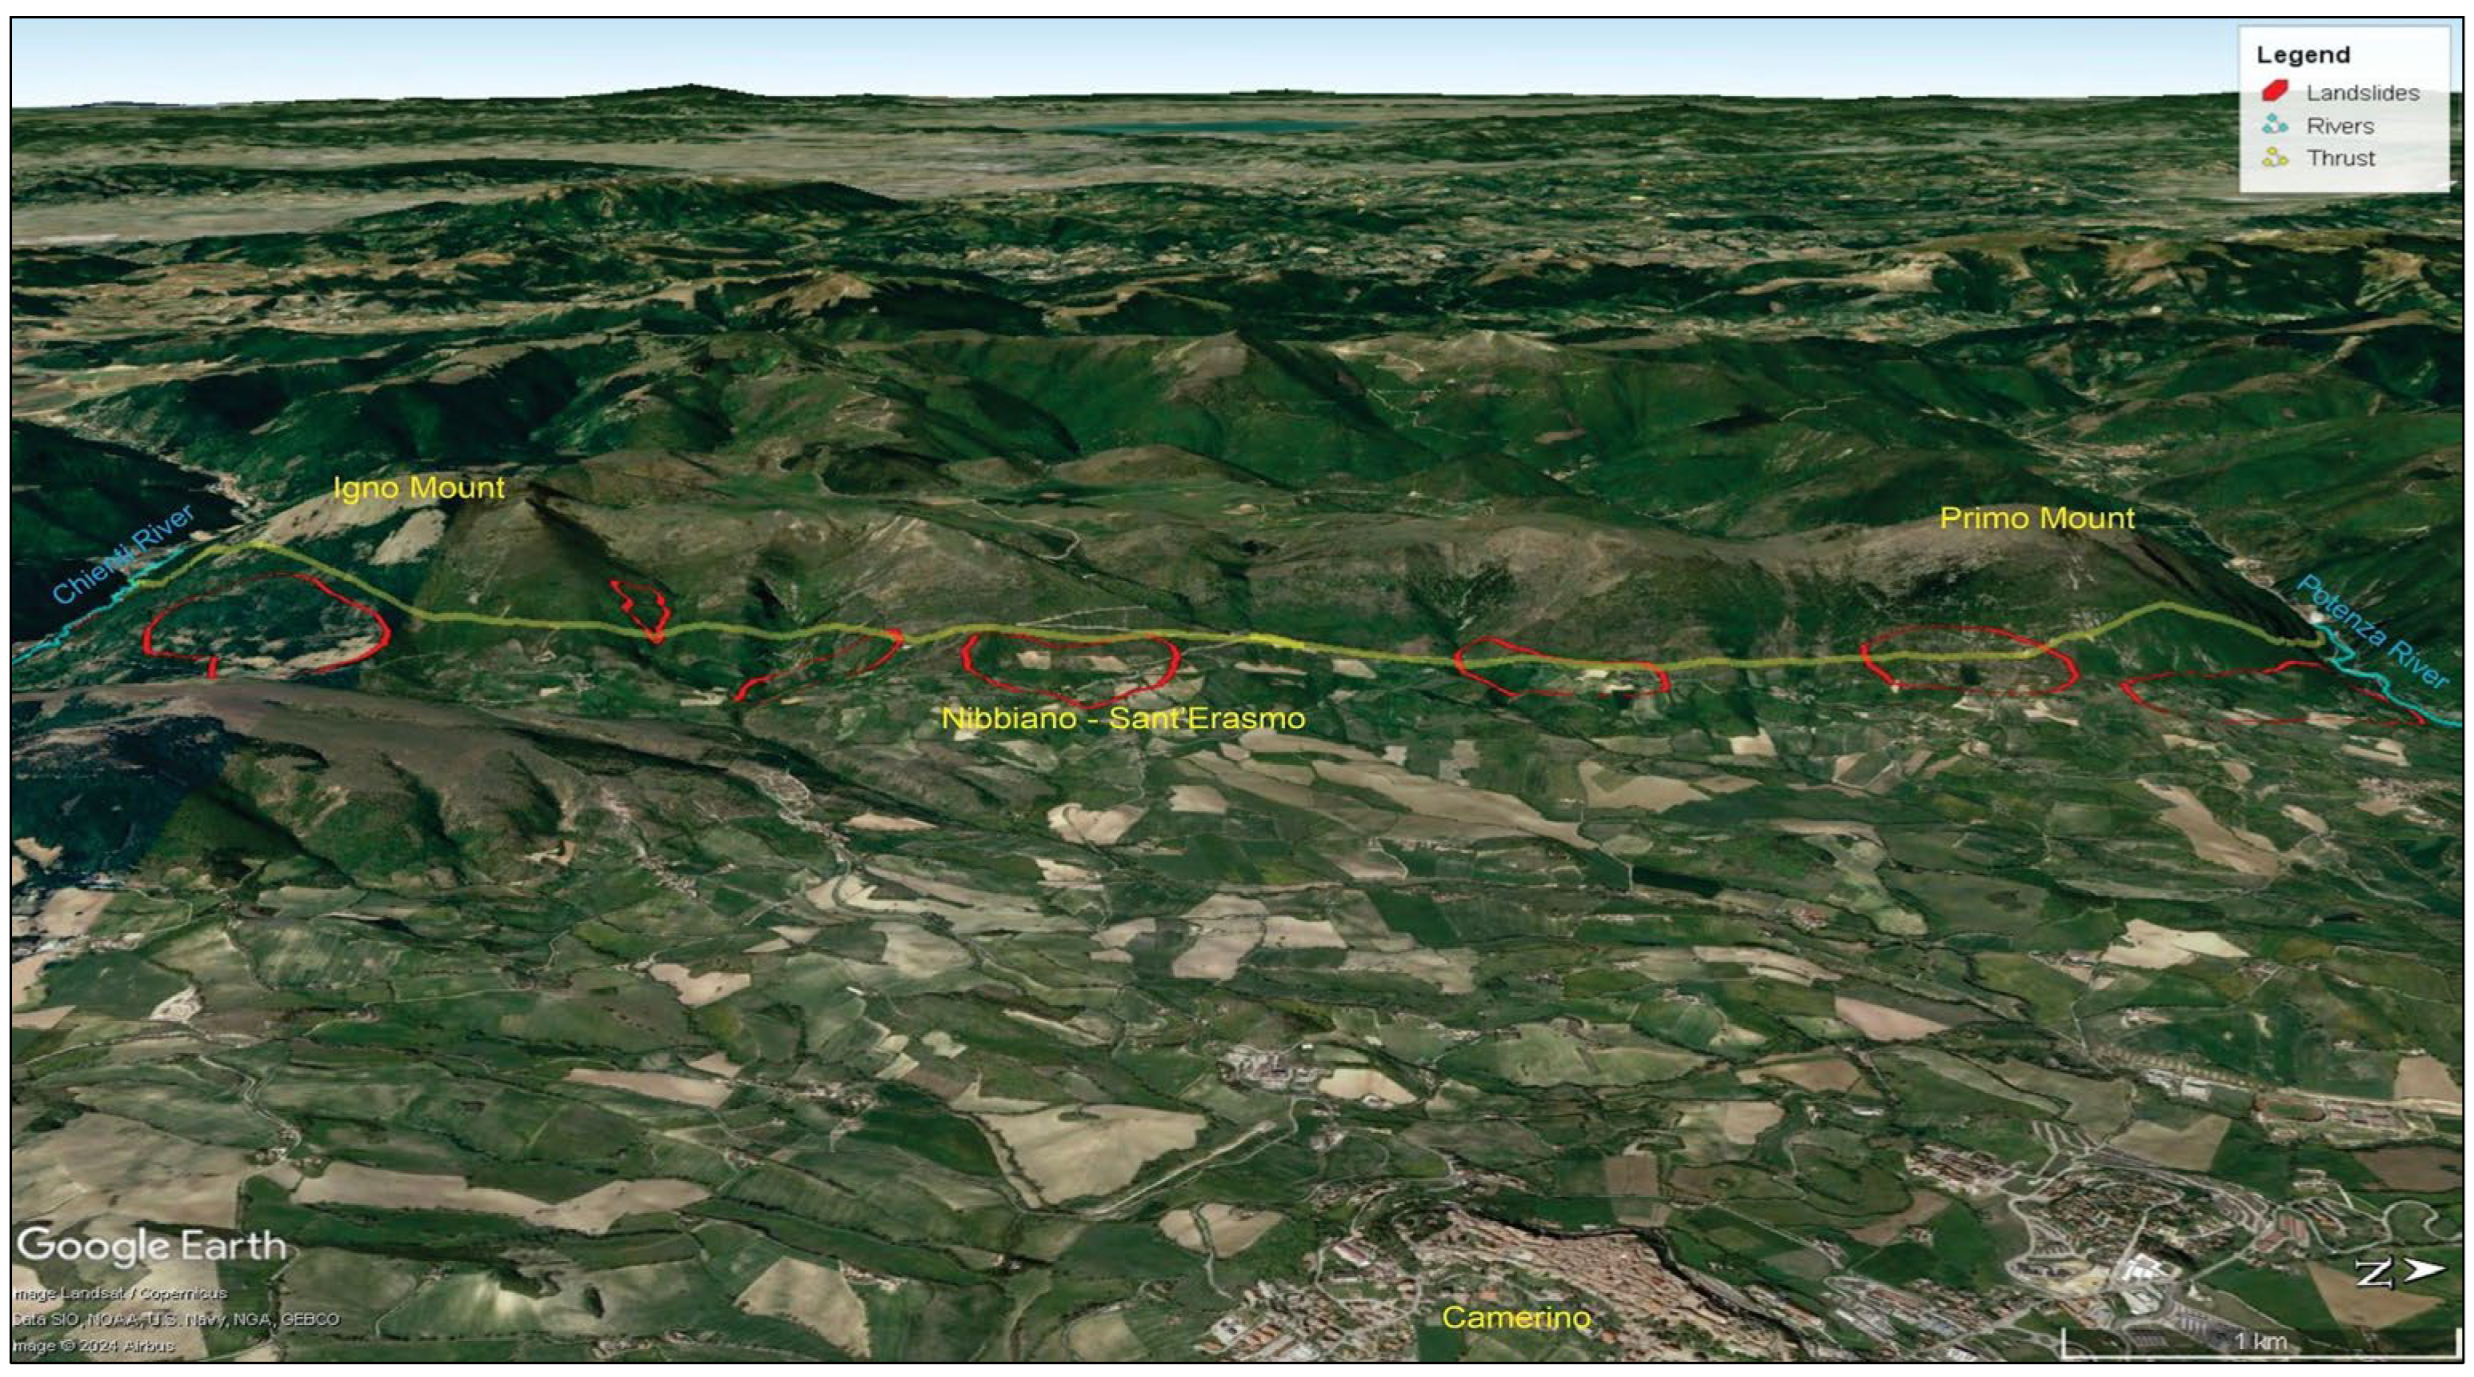
Figure 1. Outline of the analysed area with the main gravitational phenomena along the overthrust line (background image from Google Earth, modified)..
Preprints 118887 g001
Figure 2. Geological-structural scheme of the Apennine region under study (after Scisciani et al., 2014, modified).
Preprints 118887 g002
Figure 3. Geological map (a) of the Mt. Igno sector including Nibbiano-Sant’Erasmo area and geological cross-sections (b) showing the thrusts geometry (after Scisciani et al., 2014, modified).
Preprints 118887 g003
Figure 4. a) Geological Map of the area extracted from the Marche Region inventory. b) Interpretative cross section of the bedrock under investigation: below the debris cover, in red the probable thrust planes overlapping several lithologies (SAA-Scaglia Rosata, VAS-Scaglia Variegata, SCC-Scaglia cinerea, BIS-Bisciaro, SCH-Schlier).
Preprints 118887 g004
Figure 5. Map of the scarps with gradients greater than 35° (a) and 40° (b).
Preprints 118887 g005
Figure 6. Map of the mechanical drilling location, seismic and electric ubication lines and HVSR positions.
Preprints 118887 g006
Figure 7. Distribution of RQD values calculated on each meter of core according to the single survey and representation of the average value.
Preprints 118887 g007
Figure 8. RQD values Distribution calculated each meter of core as a function of depth for each single borehole.
Preprints 118887 g008
Figure 9. Analysis of the Rock/Soil strength by RocData software [29]. The blue-line is the Mohr–Coulomb failure criterion while the red-line is the Hoek–Brown failure criterion.
Preprints 118887 g009
Figure 10. Seismic profiles in Vp waves. Line L1, L2, L3 and L4. Along the L1-L1' line, are evident some discontinuities that can probably be attributable to the gravitational deformation of the slope.
Preprints 118887 g010
Figure 11. Geoelectric line A-A’ with geometric indication of low resistivity areas and identification of a discontinuity mountainward the Sant’Erasmo hamlet.
Preprints 118887 g011
Figure 12. Location of the HVSR recordings and clustering of maximum H/V ratios.
Preprints 118887 g012
Figure 13. Earthquake waveforms used in seismic numerical modelling.
Preprints 118887 g013
Figure 14. Average Peak-Acceleration recorded in the seismic analysis.
Preprints 118887 g014
Figure 15. 3D numerical model and correlation between the Hoek-Brown criterion and the equivalent values of the Mohr-Coulomb criterion for the Bedrock.
Preprints 118887 g015
Figure 16. Static analysis. a) Shear Strain Increment calculated as a global stability analysis. b) Color-Map of the local safety factor. c, d) 2D sections with the distribution of the local safety factor
Preprints 118887 g016
Figure 17. Contours of Safety Factor. a) Water table at -4.0 meters from ground level. b) Water table at -4.0 meters from ground level.
Preprints 118887 g017
Figure 18. Three-dimensional reconstruction of the morphology of the area. a) Hillshade with the movement indications. b) slopes scarps (35°). c) slope scarps (40°).
Preprints 118887 g018
Figure 19. Details of the drilling of the bedrock. a), b) and c) Slickenside kinematic indicator. d) Extraction of an intact core in the S1 survey at -48.0 meters from ground level.
Preprints 118887 g019
Figure 20. Seismic line L1 where the interpretation confirms the thrusts assumed by the geological survey (Fig. 4b) and with highlighting of the probable gravitational deformation surfaces (discontinuities).
Preprints 118887 g020
Table 1. Summary of frictional and deformation parameters of the debris material.
Parameters Records Min Max Average DevST Characteristic
Friction (°) 9 24.49 48.54 34.29 ± 7.38992 29.43
Young Mod. (MPa) 9 3.60 24.30 10.33 ±6.73515 5.91
Table 2. Seismic acquisition parameters used to geophysical surveys.
Parameters Line 1 Line 2 Line 3 Line 4
Length (m) 835 355 360 350
Type Wave P Wave P-SH Wave P Wave P
Intergeophone distance (m) 5.0 5.0 5.0 5.0
Number of geophone 168 72 72 72
Table 3. Geoelectric line acquisition parameters.
Parameters Line 1
Length (m) 720
Type Array Wenner-Schlumberger
Interelectrode distance (m) 10
Number of electrodes 72
Table 4. Stress function G/Gmax e Damping used in analysis.
Layer G/G0 and D Function
Cover layer Rollins et al. (1998)
Bedrock Elastic behaviour
Table 5. Planar combination (ref. figure 15) of the seismic coefficients.
Direction X Y
Seismic load + K h + K h
+ K h - K h
Disclaimer/Publisher’s Note: The statements, opinions and data contained in all publications are solely those of the individual author(s) and contributor(s) and not of MDPI and/or the editor(s). MDPI and/or the editor(s) disclaim responsibility for any injury to people or property resulting from any ideas, methods, instructions or products referred to in the content.
Copyright: This open access article is published under a Creative Commons CC BY 4.0 license, which permit the free download, distribution, and reuse, provided that the author and preprint are cited in any reuse.
Prerpints.org logo

Preprints.org is a free preprint server supported by MDPI in Basel, Switzerland.

Subscribe

© 2024 MDPI (Basel, Switzerland) unless otherwise stated