Preprint
Article

Novel Fluidic Oscillator Evaluation Considering Dimensional Modifications

Altmetrics

Downloads

35

Views

33

Comments

0

A peer-reviewed article of this preprint also exists.

This version is not peer-reviewed

Submitted:

23 September 2024

Posted:

23 September 2024

You are already at the latest version

Alerts
Abstract
Although flow mixing and cooling can be greatly enhanced when considering the use of Fluidic Oscillators (FO), they are more commonly employed in Active Flow Control (AFC) applications where the injected pulsating flow interacts with the boundary layer in order to usually delay its separation. In fact, prior to any FO implementation in a given application, it is essential to study the range of frequencies and amplitudes it can generate as a function of the incoming mass flow and its dimensions. This point is what is being enlightened in the present manuscript for a rather novel FO configuration. We are numerically studding a standard FO configuration in three dimensions 3D and also using a two dimensional 2D approach. After comparing the 3D and the 2D results and analyzing the main differences, we modified some of the internal dimensions of the FO in order to evaluate the variation of its dynamic performance. The present results clarify which internal dimensional modifications are more effective in generating larger output frequencies and velocity field variations. Care is taken to analyze the origin of the self sustained oscillations. In fact, the present research needs to be seen as the continuation of a former one recently published , where the effect of several Reynolds numbers as well as some different internal dimensions was considered.
Keywords: 
Subject: Physical Sciences  -   Applied Physics

1. Introduction

Despite the fact that Fluidic Oscillators (FOs) are commonly used to activate the boundary layer in Active Flow Control (AFC) applications [2,3,4,5,6,7], their use as heat transfer enhancers [8,9,10,11,12], mixing enhancers [13,14,15,16] or as acoustic biosensors [17,18], among other applications, is to be considered. One of the main advantages of FOs versus other Active Flow Control (AFC) methodologies like constant blowing or sucking, resides in the fact that it generates pulsating flow, which reduces the energy required to interact with the boundary layer dynamics and delay its separation in any bluff body [19,20,21]. When comparing the different devices capable of generating pulsating flow, zero-net-mass flux actuators (ZNMFAs) and fluidic oscillators (FOs), the second ones have the advantage of not having moving parts, which maximizes their reliability. At the present there are few canonical shapes of FOs and a typical characteristic of all of them is the direct relation between the output frequency and the incoming mass flow. Yet, for a given canonical shape, the dynamic performance depends on the internal configuration as well as the FO scaling [11,22,23,24,25,26,27].
Initial recommendations of how to modify the output frequency of a FO via modifying the inlet width were reported by Bobusch et al. [28]. The comparison between the sharp corners configuration initially studied by [28] versus the rounded corners one, was undertaken by Ostermann et al. [29]. It was concluded that the sharp corners configuration was generating a more uniform velocity distribution than the one from rounded corners FO.
In a further investigation using the rounded corners configuration previously assessed by [29], Woszidlo et al. [30] observed that when increasing the mixing chamber inlet width, the output frequency tended to raise. They also noticed that rounding the feedback channels decreased the separation bubbles formation along them. Three dimensional numerical simulations using the K ω SST turbulence model were conducted by Pandey and Kim [31] to study the effect of the Mixing Chamber (MC) inlet and outlet widths. MC inlet width considerably changed the Feedback Channel (FC) flow, unlike what happened when modifying the outlet width. The impact of modifying the mixing chamber and feedback channels lengths on the FO outlet jet frequency and amplitude was numerically evaluated by Seo et al. [32]. Increasing the length of the MC resulted in a considerable decrease of the FO frequency. They observed no significant variations on the outlet frequency when elongating the FC length. The same observation was noted by [33], but in both studies the flow was considered as incompressible, which is likely to explain such outcome. In a further numerical study performed by Slupski and Kara [34], the effect of the Feedback Channels (FCs) dimensions was evaluated. Fluid was considered as turbulent and compressible and the 2D-URANS k ω SST turbulence model was used for their study. FO output frequency increased with the increase of the FC height up to a certain threshold, beyond it, frequency remained constant. A frequency decrease was observed with the increase of the FC width. The frequency response as a function of the FCs length was numerically and experimentally analyzed by Wang et al. [35], and concluded that FO output frequency decreased as the FC length increased. The same conclusion was obtained by Bergada et al. [25] using Direct Numerical Simulations (DNS) and considering the flow as compressible. It was observed that as the feedback channel length increased, the jet main oscillation amplitude kept reducing and tended to disappear, the jet was simply tending to fluctuate at high frequencies, when the FC length exceeded a certain length the jet main oscillations stooped. The origin of the forces driving the self-sustained oscillations, was investigated in Baghaei and Bergada [23], where a comprehensive analysis on the forces acting on the jet at the mixing chamber entrance was performed. In a further study [24], they analyzed the FO output frequency variations under several MC design modifications.
In the experimental study performed by [15], the modification of the mixing chamber inlet and outlet widths as well as the FO outlet width were considered. They observed that the jet spreading angle and its oscillating frequency are proportional to the MC inlet width. If the inlet width is too small no oscillating frequency is generated. The mixing chamber outlet width controls the size of the recirculation bubble, which partially controls the jet spreading angle. The FO outlet width is responsible of the MC internal pressure and partially controls the recirculation bubble in the MC. In a second paper [36] they created a novel master-slave fluidic oscillator design capable of producing adjustable spreading angles from 0 to 100°. The output frequency and spreading angle increased with the master FO flow rate. This new configuration allowed dynamic adaptation to different working conditions and impinging targets. Internal geometric parameters of a novel FO configuration capable of generating small pulsating frequencies O 10Hz was assessed in [26]. They modified a large number of internal dimensions until finding the limits of the self sustained oscillations, and realized that the width of the FO had a large impact on the outlet frequency. In the research undertaken by [37], movable feedback channels and resonators placed on both sides of a FO were numerically evaluated using k ω SST and LES turbulence models. The modification of the FC length had a little effect on the oscillation frequency, but when the relation feedback channel length versus the resonator length increased, the FO outlet frequency had a sharp increase. They obtained an equation capable of determining the output frequency as a function of the resonators dimensions.
The heat transfer effect of an oscillating jet coming out from a FO and impinging on a flat plate was recently studied by [10,11,12]. In [12] eight different fan shaped exit configurations with angles ranging between 0 and 130° were evaluated. They realized the output frequency was independent on the fan shaped angle, but the heat transfer deteriorated with the increase of the fan angle. For fan angles exceeding 70° the jet was not longer attached to the outlet walls, although a particularly good cooling uniformity was observed under these conditions. In [11] the heat transfer effect was evaluated when scaling the FO while keeping constant the outlet throat. Jet frequency increased and the heat transfer rate decreased when decreasing the scale factor. They correlated the jet frequency with the evolution of the separation bubble in the MC, obtaining a new definition of the Strouhal number which remained constant for different scaled geometries. In the experimental work performed by [10], the MC length, FC cross sectional area and the FO nozzle to plate distance were modified. The main effect of reducing the MC length was that the twin-jet structure turned into a single jet one. As in [26] they noted that oscillation stopped once dimensional modifications exceeded a certain threshold. When reducing the FC minimum width, jet oscillation amplitude decreased and frequency increased. Several geometry modifications and scale variations of a particular shaped FO were evaluated by [38] in order to enhance flow mixing. The research was mostly done using 2D-CFD simulations, comparisons with experimental results and three dimensional CFD simulations were as well presented. They defined which were the most relevant design parameters, opening a door to future design modifications. In the research performed by [39], they investigated supersonic fluidic oscillators to be used in the generation of self-sustained oscillations inside gas-pressurized chambers. They realized that 2D-CFD simulations were not able to reproduce the transients as accurately as in the three dimensional simulations. Therefore, and in order to predict the performance of the prototype, they generated a low-order fluid circuit model.
In the experimental study performed by [27], six different FC lengths and three FC sections were analyzed, three power nozzles and exit throat sections were as well considered. The Coanda effect on the FO curved or straight exit geometries and their relation with the jet oscillation angle was discussed. They defined the Aspect Ratio (AR) as the relation between exit throat width and its height, the ratio (MR) between the power nozzle area and the exit nozzle one was found to be of particular relevance when evaluating the FO outlet frequency. They obtained an equation relating the outlet frequency with the Reynolds number, the AR and MR ratios and clarified that these two rations are the most important when analyzing FOs. In the articles from [5,6], the performance of FOs with different outlet bending angles was evaluated. They observed that the outlet frequency increased with the bending angle as well as with the incoming mass flow. These particular FOs were inserted in a NACA 0015 profile and the effects of bending and pitch angles on the profile lift and drag coefficients were evaluated. Lift coefficient increased with the bending angle increase until reaching an optimum value of 35°, profile efficiency increased with the increase of both angles. The effect of using curved FOs was unveiled in [40,41]. In fact the need of evaluating these configurations arises when trying to implement FOs in turbine blades or airfoil profiles among other applications. FOs bend with different radius across the cross stream direction, and flat FOs having just the exit nozzle curved in the same direction were considered by [40]. They realized that a good out of plane motion of the exiting jet and the largest sweeping angle increase was obtained when using the exit nozzle curved configuration. FOs curved along the flow direction were evaluated in [41]. Oscillating frequency increased with the curvature while sweeping decreased. At very high curvature no sweeping angle was observed. As previously noted by [27], they realized the important effect of the FO aspect ratio and generated an equation for the Strouhal number which was highlighting the importance of this ratio.
A novel shape of (FO) at very low Reynolds numbers was numerically studied for the first time by Sarvar et al. [42]. They observed that at a given Reynolds number, the amplitude of the jet sweeping angle was more pronounced for the 2D fluidic oscillator than for the corresponding three-dimensional one. In the present research, the new configuration formerly analyzed by [42] and lately studied at a much larger Reynolds numbers by [1] is further evaluated. In fact, the present numerical study is a continuation of the work done in [1], where several MC outlet widths and inlet angles were considered. In the present paper, the combination of changing the MC inlet width and its internal angle, as well as the effect of FC dimensional modifications, are presented. The origin of the self-sustained oscillations is further clarified, concluding that the present FO configuration is pressure-driven, but mass flow forces appear to be more relevant than in former studied configurations [23,24]. Fluid is considered as incompressible and the Reynolds number is kept constant to R e = 54.595 across the entire study. The rest of the paper is designed as follows. After presenting the governing equations and the turbulence model in Section 2, the meshes and turbulence conditions employed for the 3D and 2D CFD simulations are introduced in Section 3. Section 4 and Section 5 define respectively the forces acting on the jet as it enters the MC and the different geometrical modifications considered in this study. The results and conclusions sections are to be respectively found at the end of the study.

2. Governing Equations and Turbulence Model

Under incompressible flow conditions, the continuity and momentum equations, Navier–Stokes (NS) equations, can be presented as:
u i x i = 0
u i t + u i u j x j = 1 ρ p x i + ν 2 u i x j x j
As in the present application the flow inside the FO is expected to be turbulent, the use of Unsteady Reynolds Averaged Navier–Stokes equations (URANS), as a turbulence model approach is a good option, particularly when time and or computational constrains are to be considered. The RANS and URANS turbulence models accuracy is not the same as in LES or DNS approaches, but the computational time required to perform a simulation reduces enormously.
It is interesting to recall that the variables associated to the NS equations are the three velocity components and the pressure, therefore, the discretization of the NS equations under incompressible flow conditions and in order employ a URANS turbulence model, it requires the substitution of each variable by an average ϕ ¯ and a fluctuation ϕ term. Calling ϕ a generic variable, it can be stated.
ϕ = ϕ ¯ + ϕ
After performing the mentioned substitution and considering the fluid as incompressible, the resulting NS equations take the form:
u ¯ x x + u ¯ y y + u ¯ z z = 0
u ¯ x t + u ¯ x u ¯ x x + u ¯ y u ¯ x y + u ¯ z u ¯ x z = 1 ρ p x + g x + 1 ρ x 2 μ u ¯ x x ρ ( u ¯ x ) 2 + 1 ρ y μ u ¯ x y + u ¯ y x ρ u x u y ¯ + 1 ρ z μ u ¯ x z + u ¯ z x ρ u x u z ¯
u ¯ y t + u ¯ x u ¯ y x + u ¯ y u ¯ y y + u ¯ z u ¯ y z = 1 ρ p y + g y + 1 ρ x μ u ¯ y x + u ¯ x y ρ u y u x ¯ + 1 ρ y 2 μ u ¯ y y ρ ( u ¯ y ) 2 + 1 ρ z μ u ¯ y z + u ¯ z y ρ u y u z ¯
u ¯ z t + u ¯ x u ¯ z x + u ¯ y u ¯ z y + u ¯ z u ¯ z z = 1 ρ p z + g z + 1 ρ x μ u ¯ z x + u ¯ x z ρ u z u x ¯ + 1 ρ y μ u ¯ z y + u ¯ y z ρ u z u y ¯ + 1 ρ z 2 μ u ¯ z z ρ ( u ¯ z ) 2
RANS and URANS turbulence models solve the Navier–Stokes equations via implementing the concept of turbulence viscosity ( μ t ), also called apparent viscosity, which has to be substituted into the three terms of the momentum equation just introduced, to do so it is used the Boussinesq hypothesis which reads:
μ t = ρ u x u x ¯ 2 u ¯ x x = ρ u y u y ¯ 2 u ¯ y y = ρ u z u z ¯ 2 u ¯ z z = ρ u x u y ¯ u ¯ x y + u ¯ y x = ρ u x u z ¯ u ¯ x z + u ¯ z x = ρ u y u z ¯ u ¯ y z + u ¯ z y
Usually, the nine terms characterizing the time-averaged fluctuation terms are put together in a tensor named the apparent Reynolds stress tensor ( τ a p p ), which is a 3 × 3 symmetric matrix, this is why we have represented the turbulent viscosity considering six equations.
After the substitution, the three components of the momentum equation take the form:
u ¯ x t + u ¯ x u ¯ x x + u ¯ y u ¯ x y + u ¯ z u ¯ x z = g x 1 ρ p x + 1 ρ x 2 ( μ + μ t ) u ¯ x x + 1 ρ y ( μ + μ t ) u ¯ x y + u ¯ y x + 1 ρ z ( μ + μ t ) u ¯ x z + u ¯ z x
u ¯ y t + u ¯ x u ¯ y x + u ¯ y u ¯ y y + u ¯ z u ¯ y z = g y 1 ρ p y + 1 ρ x ( μ + μ t ) u ¯ y x + u ¯ x y + 1 ρ y 2 ( μ + μ t ) u ¯ y y + 1 ρ z ( μ + μ t ) u ¯ y z + u ¯ z y
u ¯ z t + u ¯ x u ¯ z x + u ¯ y u ¯ z y + u ¯ z u ¯ z z = g z 1 ρ p z + 1 ρ x ( μ + μ t ) u ¯ z x + u ¯ x z + 1 ρ y ( μ + μ t ) u ¯ z y + u ¯ y z + 1 ρ z 2 ( μ + μ t ) u ¯ z z
The variables in the resulting momentum equations are the time averaged pressure, the three time averaged velocity components and the turbulence viscosity, to close the system a new equation is therefore needed. In the actual research we have decided to use the k ω SST turbulence model, which employs the k ω turbulence model near the wall, and the k ϵ turbulence model far away from the body, a blending function is used in the regions between these two. Therefore, the turbulence viscosity μ t can be expressed as:
μ t = ρ k ω ρ : density k : turbulent kinetic energy ω : turbulent kinetic energy specific dissipation rate
The k ω SST turbulence model requires two transport equations in order to solve k and ω variables. The corresponding transport equations for each parameter take the form:
k t + u j k x j = P k β * k ω + x j ν + σ k ν T k x j
ω t + u j ω x j = α S β ω 2 + x j ν + σ ω ν T ω x j + 2 1 F 1 σ ω 2 1 ω k x i ω x i
Two blending functions named F 1 and F 2 are needed, their value is a function of the distance of a given cell to the wall. The value of the first blending function is 0 when cells are located far away from the wall, the function takes a value of 1 when the cells are close to the wall, values between 0 and 1 are taken in the transition region. The second blending function F 2 depends on the perpendicular distance from the wall (d), based on the research undertook by [43], and due to the fact that the modification of the eddy viscosity is particularly observed in the wake region, it is essential to further extend F 2 out into the boundary layer than F 1 . This second blending function it is usually given as:
F 2 = tanh arg 2 2
arg 2 2 = max 2 k β * ω d ; 500 ν ω d 2
The constants of the arg function have to be adjusted manually. In the actual research, the values of the constants employed by the chosen turbulence model are: α 1 = 0.556 , α 2 = 0.44 , β * = 0.09 , β 1 = 0.075 , β 2 = 0.0828   σ k 1 = 0.85 , σ k 2 = 1 , σ ω 1 = 0.5 , and σ ω 2 = 0.856 . Further information regarding the k ω S S T turbulence model is to be found in [43].

3. Mesh and Boundary Conditions

3.1. Three Dimensional Baseline Model

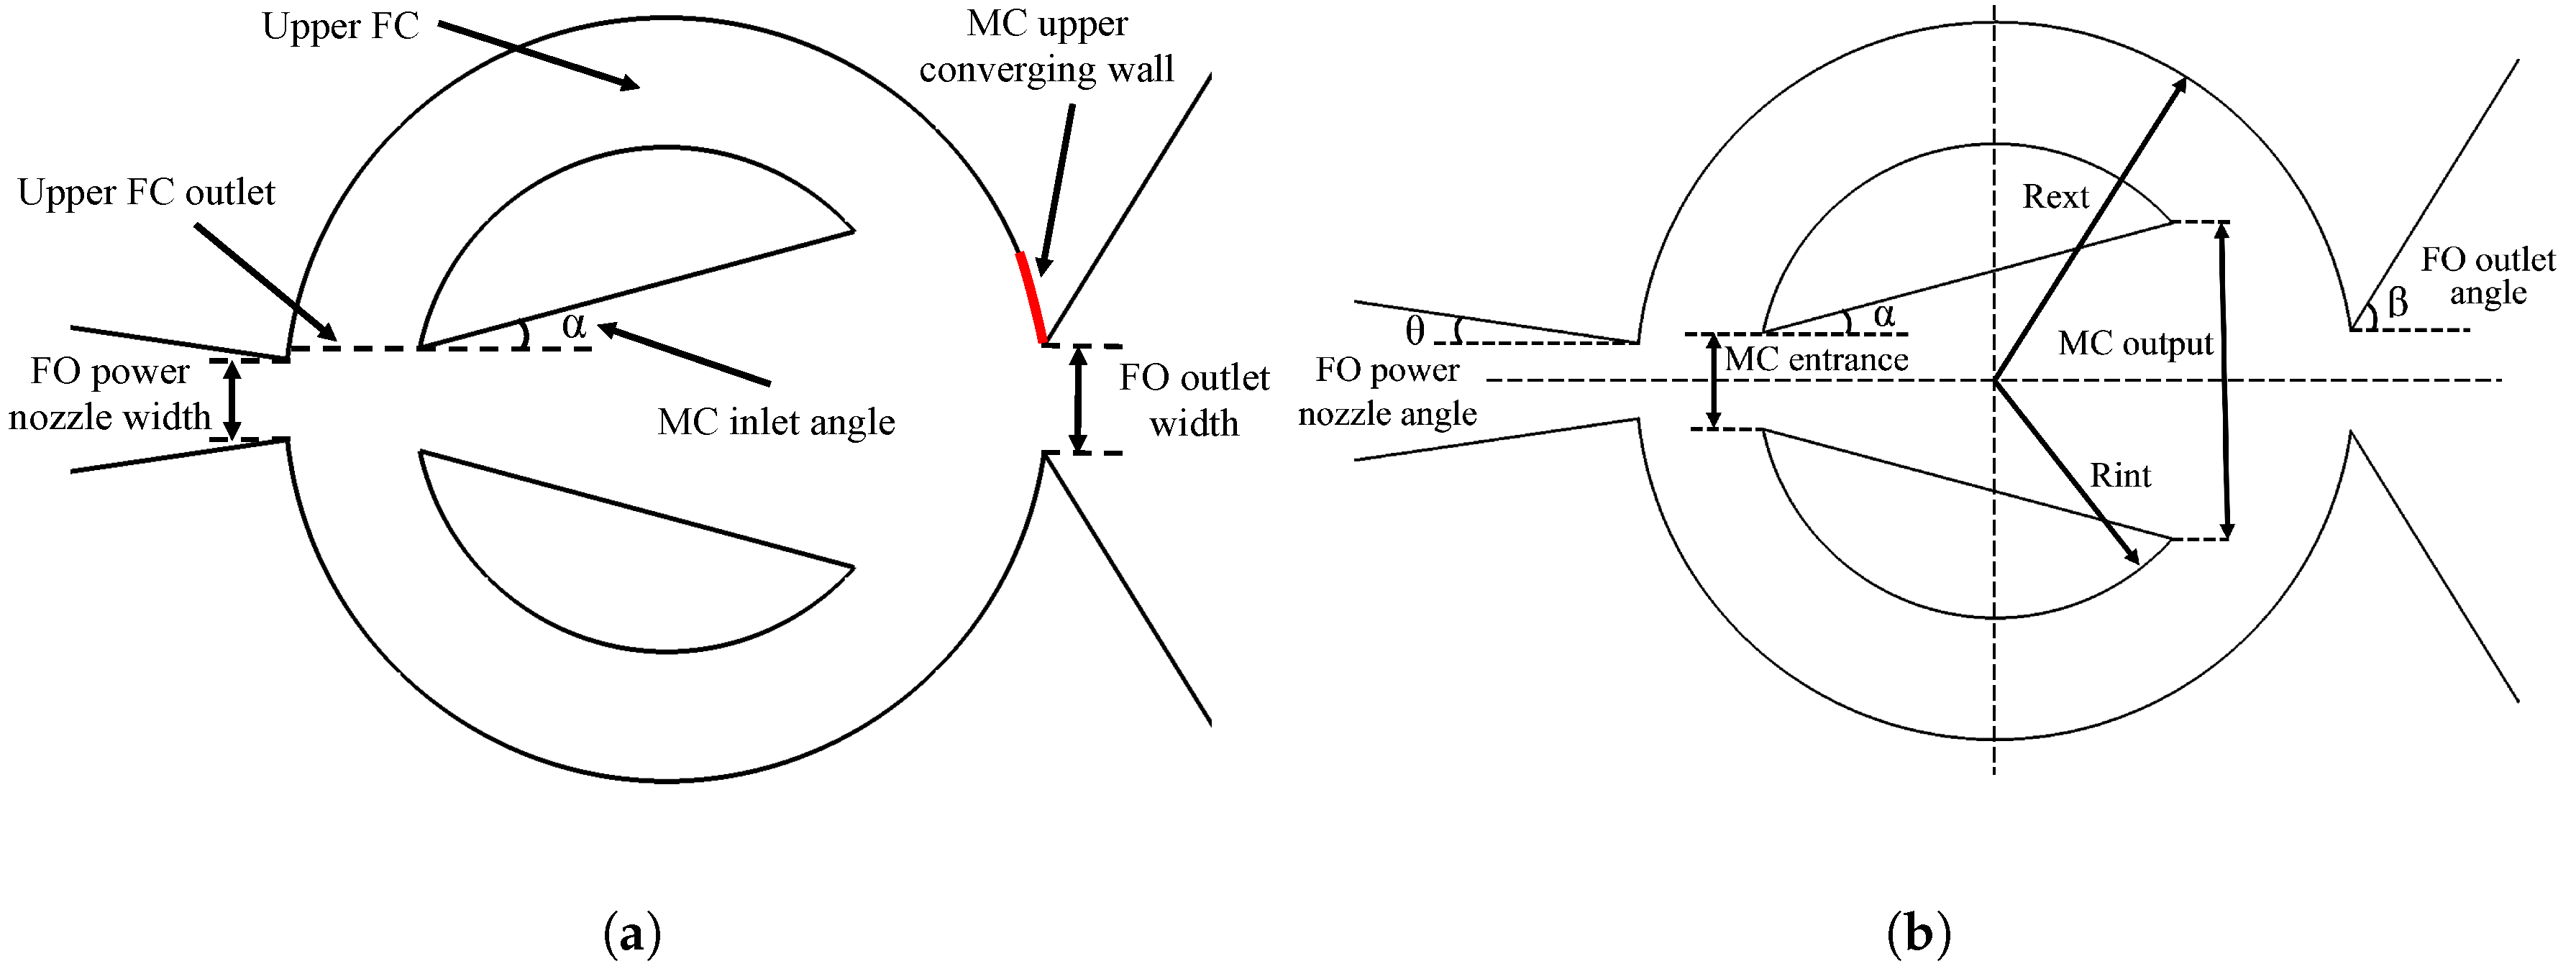
The frontal view of the FO studied is presented in Figure 1, where the main parts are introduced. An upper and lower channels, called the feedback channels (FC) are placed on both sides of the mixing chamber (MC). The fluid enters through the power nozzle (PN), located on the left side of the figure and leaves through the FO outlet width. The red line observed in the mixing chamber upper converging wall represents a line probe employed to measure the maximum pressure in this location. The same probe was also implemented on the MC lower converging wall (not labeled in the figure). The main dimensions of the different parts of the FO presented in Figure 1 are defined next. The fluidic oscillator inlet and outlet widths are of 0.02 m and 0.0266 m, respectively. The width of the MC entrance is of 0.0255 m, being the MC output width of 0.08356 m. The external and internal radius of the MC have values of Rext = 0.0949 m and Rint = 0.0627 m, respectively. The values of the different angles presented in Figure 1 are: FO power nozzle angle θ = 8.343 ° , MC inlet angle α = 14.997 ° and FO outlet angle β = 58.235 ° . The FO thickness, measured in spanwise direction is of 0.01 m. The entire computational domain, which comprises a large buffer zone at the FO outlet and an inlet channel connected to the FO inlet is presented in Figure 2a, the radius of the buffer zone is of 1.562 m, the width of the inlet channel being 0.0808 m.
Figure 1. Fluidic oscillator mixing chamber main parameters.
Preprints 119018 g001
We will call this configuration the baseline or standard (STD) case and zoomed views of the 3D mesh employed in the MC and upper FC are presented in Figure 2b and Figure 2c, respectively. The entire mesh is fully structured and consists of 7,722,120 cells distributed in 21 layers across the spanwise domain, each layer having 367,720 cells. In order to properly capture the boundary layer evolution, care was taken to increase the mesh density nearby all walls. The Reynolds number R e = 54,595 , based on the FO power nozzle width as characteristic length, was kept constant throughout the entire study.
Figure 2. Main view of the 3D computational domain used in the present study. Computational domain overall view (a). Mesh in the central part of the fluidic oscillator (b). Zoom view of the mesh at the upper feedback channel (c).
Preprints 119018 g002
The values of the minimum, maximum, and average y + values obtained after the simulations and for the different wall surfaces belonging to the FO are summarized in Table 1. It is important to highlight that for all walls, the maximum y+ value was always obtained inside the buffer zone where the mesh was more relaxed.
At the computational domain inlet, Dirichlet boundary conditions for velocity and Neumann boundary conditions for pressure were considered. Neumann boundary conditions for velocity and an absolute pressure of 105 Pa were defined at the computational domain outlet (buffer zone outlet). Dirichlet boundary conditions for velocity and Neumann for pressure were established in all walls. The URANS k ω SST turbulence model was employed across the entire study. The boundary conditions considered for the present 3D simulations are summarized in Table 2. The turbulent intensity at the domain inlet was set to I = 0.1 % , being the fluid velocity of U = 10 m/s. The following equations were used to determine the turbulence properties at the computational domain inlet: k = ( 3 / 2 ) U 2 I 2 ; ϵ = C μ ( k 3 / 2 / L ) , where C μ = 0.09 ; ω = ϵ / ( C μ k ) ; and νt = k/ω. Using these equations, the following values for the different turbulence parameters were obtained. Turbulence kinetic energy k = 1.5 × 10⁻⁴ (m2/s2), turbulence dissipation rate ϵ = 2.05 × 10⁻⁶ (m2/s3), the specific dissipation range ω = 0.152 (s−1), and the turbulence kinematic viscosity νt = 9.9 × 10⁻⁴ (m2/s).
In the present study, the fluid used was air at 15 degrees Celsius, it was considered as turbulent, incompressible, and isothermal. The fluid dynamic viscosity and its density being μ = 1.813 × 10⁻⁵ kg/(m s) and ρ = 1.225 kg/m3, respectively. The Finite volumes package OpenFOAM version 5.0 was used to perform all simulations. The Navier-Stokes equations were solved using the (PISO) pressure implicit with splitting operators (PISO) solver. The time-step employed was 4 × 10⁻⁷ s, and a second order spatial discretization was considered. In order to consider the simulations as converged, the residuals for the fluid velocity components, the turbulent kinetic energy, the specific dissipation rate, and the turbulent kinematic viscosity, had to be to the order of 10−6. After all simulations, the residuals for the pressure variable were to the order of 10−4.

3.2. Two Dimensional Baseline Model

In order to decrease the computational time for the parametric analysis, which is going to be presented in Section 6.3 and Section 6.4, we decided to employ two dimensional URANS simulations. To evaluate the accuracy of the 2D-CFD models, the baseline case at Re = 54,595 was also run in 2D and the results were compared with the full 3D simulation ones. The computational domain was the same as in the 3D case, initially presented in Figure 2a, the fully structured 2D mesh was having 367,729 cells and it was extruded using a single cell in the spanwise direction. The front and back surfaces, which were considered as walls in the 3D simulations, were now considered as empty surfaces. The computational domain boundary conditions, turbulence model as well as the inlet turbulence intensity and the rest of the turbulence parameters were the same as in the 3D simulations. As a result, the turbulence parameters defined in Table 2 are applicable for all 2D simulations presented in this manuscript, just the values of all parameters in the line where the front & back boundary conditions are defined, need to be substituted by empty boundary conditions. At this point it is interesting to note that, the mesh used for the 2D simulations presented in this manuscript is the result of a mesh independence study undertaken in [1], where the same computational domain, Reynolds number and turbulence model were employed. The resulting calculated minimum, maximum and averaged y+ values, as well as the error observed when using different mesh densities were reported in our former study [1].

4. Mass Flow and Pressure Momentum Terms Acting on the Jet at as It Enters the Mixing Chamber

One of the key points when analyzing the performance of a FO is the study of the origin of the self-sustained oscillations. This study involves the evaluation of the lateral forces acting on the jet as it enters the MC, this is why in the present research the different momentum terms on the feedback channels outlets were determined, see Figure 1. When disregarding the gravitational forces, the momentum equation considers two main terms, the pressure and the mass flow one. Both terms have been instantaneously and independently evaluated at each of the two FCs outlets. The forces considered were the ones acting on the vertical direction.
In the present research, the fluid is taken as incompressible, fluid density is time- and spatial-independent, pressure and velocity fields are spatial- and temporal-dependent. As a result, the momentum equation, once discretized and evaluated at each grid cell belonging to the corresponding surface was instantaneously applied to each feedback channel outlet. The momentum equation used is represented as:
F = F m a s s f l o w + F p r e s s u r e = ρ i = 1 i = n ( S i V i 2 ) + i = 1 i = n P i S i
The subindex i defines a generic mesh cell belonging to any of the two FC outlet surfaces. The index n characterizes the number of cells existing in a FC outlet surface. The instantaneous pressure and velocity components acting in the vertical direction and on a given mesh cell, are defined as P i and V i , respectively. S i characterizes a generic cell surface. The instantaneous momentum term due to the mass flow in any of the two FC outlets, was determined by adding the vertical components of each elementary momentum mass flow term from each cell of the chosen surface. The calculation of the vertical instantaneous momentum pressure term was performed when multiplying the static pressure by the cell surface on each cell belonging to the corresponding surface, and then adding the elemental momentum pressure terms. The net force, also called the net momentum, acting on the jet as it enters the MC, considers the application of 16 on both FC outlets at each instant. When considering just the first term of 16 instantaneously applied to both FC outlets, it is obtained the net mass flow momentum term acting on the jet, and when doing the same with the second term of 16 it is obtained the net pressure momentum term.

5. Geometrical Modifications Considered

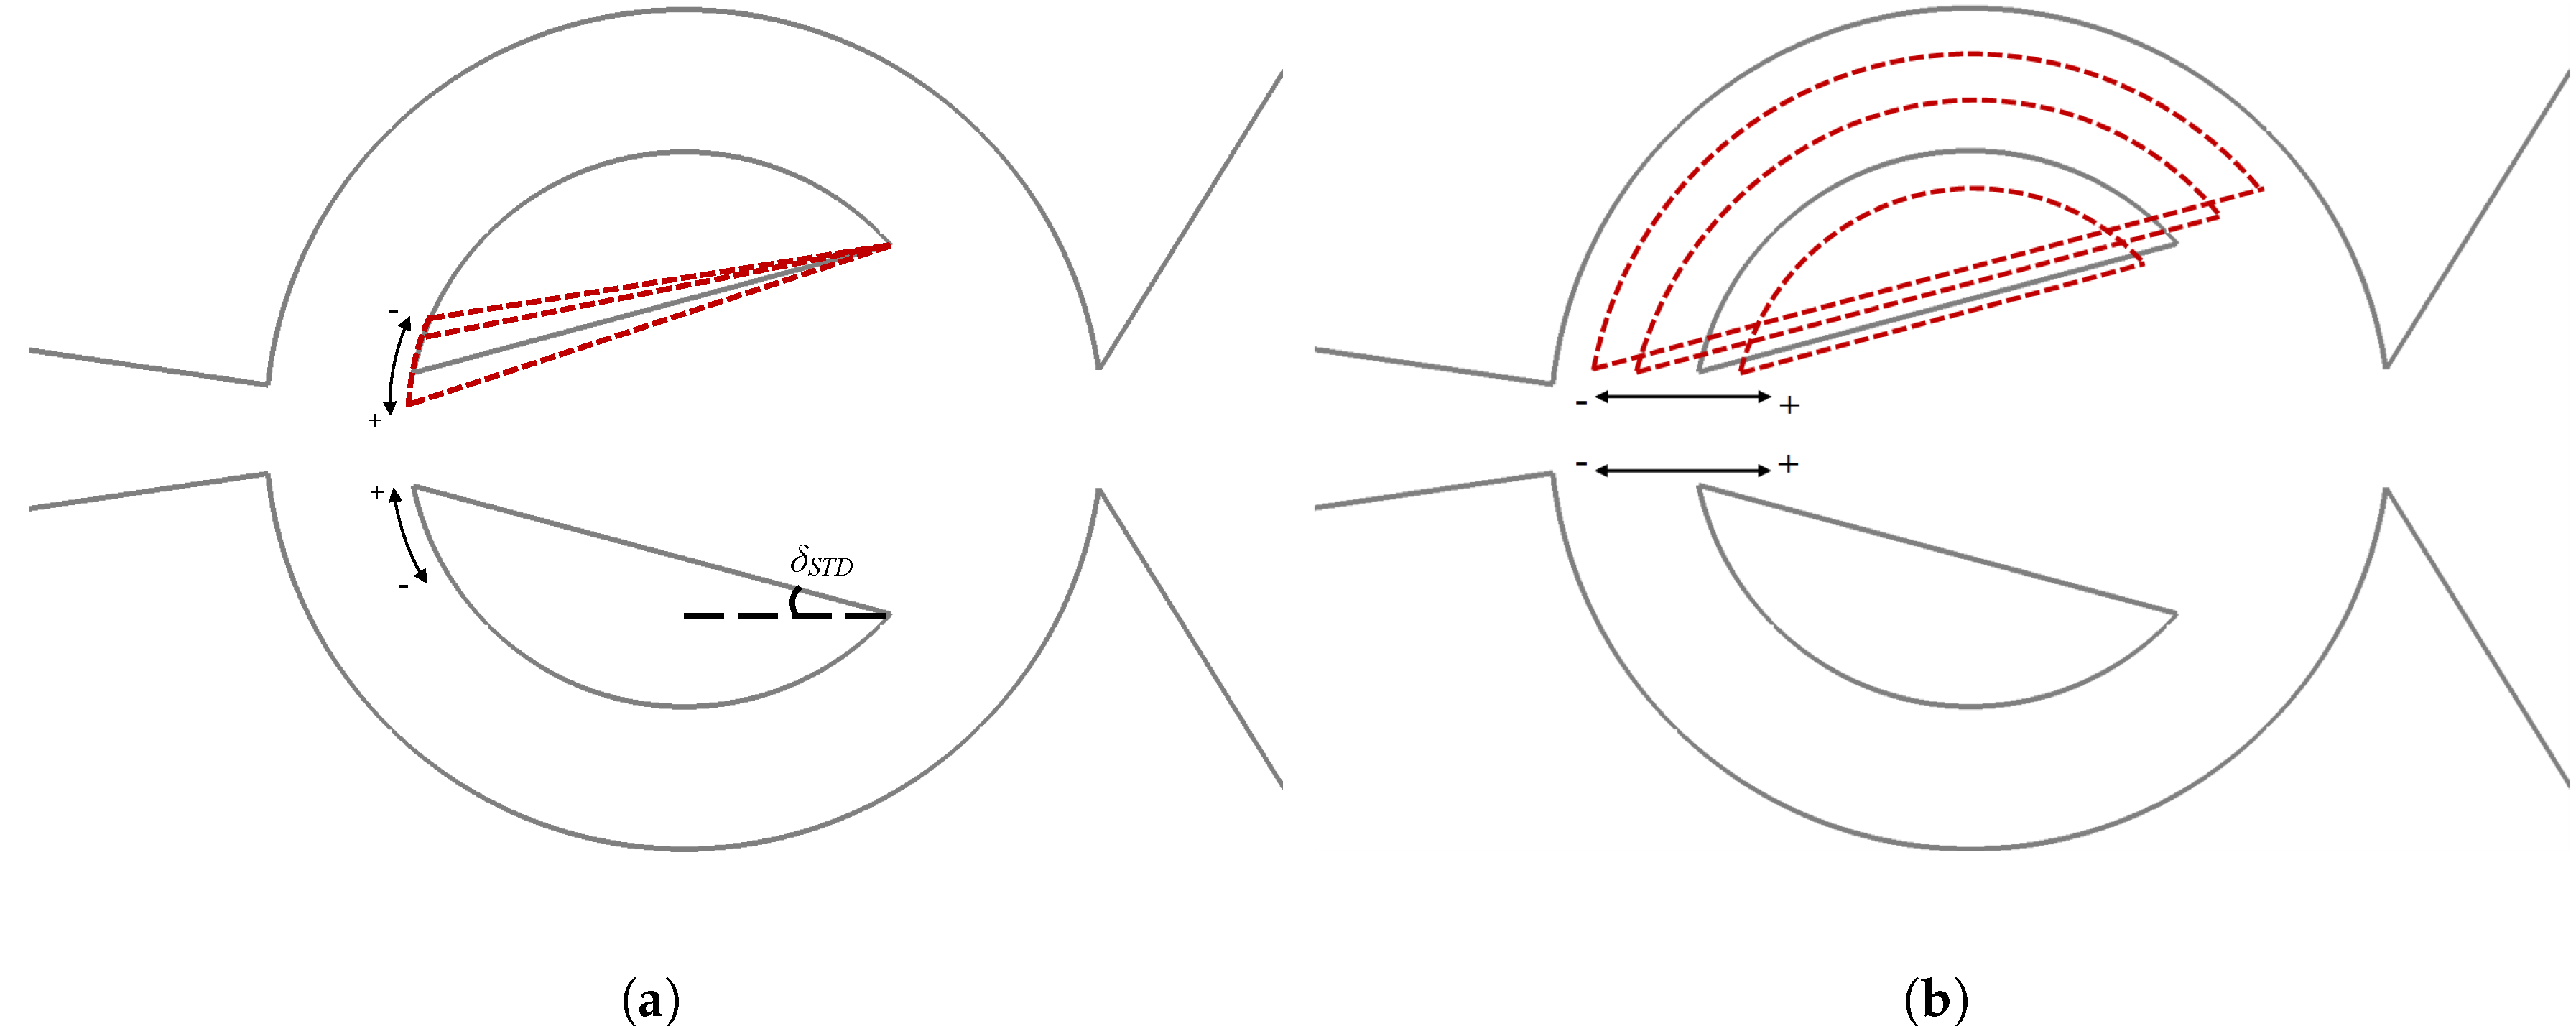
A parametric analysis based on 2D-CFD simulations was performed to evaluate the main characteristics of the fluidic oscillator at Reynolds number R e = 54,595 and when considering different geometrical modifications. Two different modifications were evaluated, the mixing chamber angle, (which mostly involves the MC entrance width variation), and the feedback channel width modification. Figure 3 schematically represents the dimensional changes studied in the present research. Although performed on both sides, the modifications are just shown on one side of the mixing chamber. In Figure 3a, it is presented the mixing chamber angular modifications considered, note that the standard angle δ S T D = δ B a s e l i n e was increased and decreased by 15°, another case where the δ S T D angle was decreased by 10° was as well studied. The details of the different angles studied as well as the new MC entrance widths obtained for each case are presented in Table 3. Figure 3b, summarizes the feedback channel modifications studied. Four different feedback channel widths were considered, the baseline case width W S T D = ( R e x t R i n t ) was reduced by W 1 = ( 1 / 3 ) W S T D and W 2 = ( 2 / 3 ) W S T D , respectively. A third case where the FC width was enlarged by W 4 = ( 4 / 3 ) W S T D was also considered. The MC entrance width was kept constant for all the FC widths studied. Table 4 is summarizing the FC dimensional modifications considered where the four different FC widths are reported. The mesh and boundary conditions used for all geometrical modifications considered are identical to the ones employed for the 2D baseline (STD) case. The mesh was simply squeezed or enlarged in the feedback channels and Mixing chamber, but the total number of cells was kept constant. For the different dimensional modifications considered, the minimum, maximum and averaged y+ suffered minor variations versus the STD case ones which were respectively 0.274, 8.047 and 0.927, see [1].

6. Results

6.1. Results from the 3D-CFD Simulation

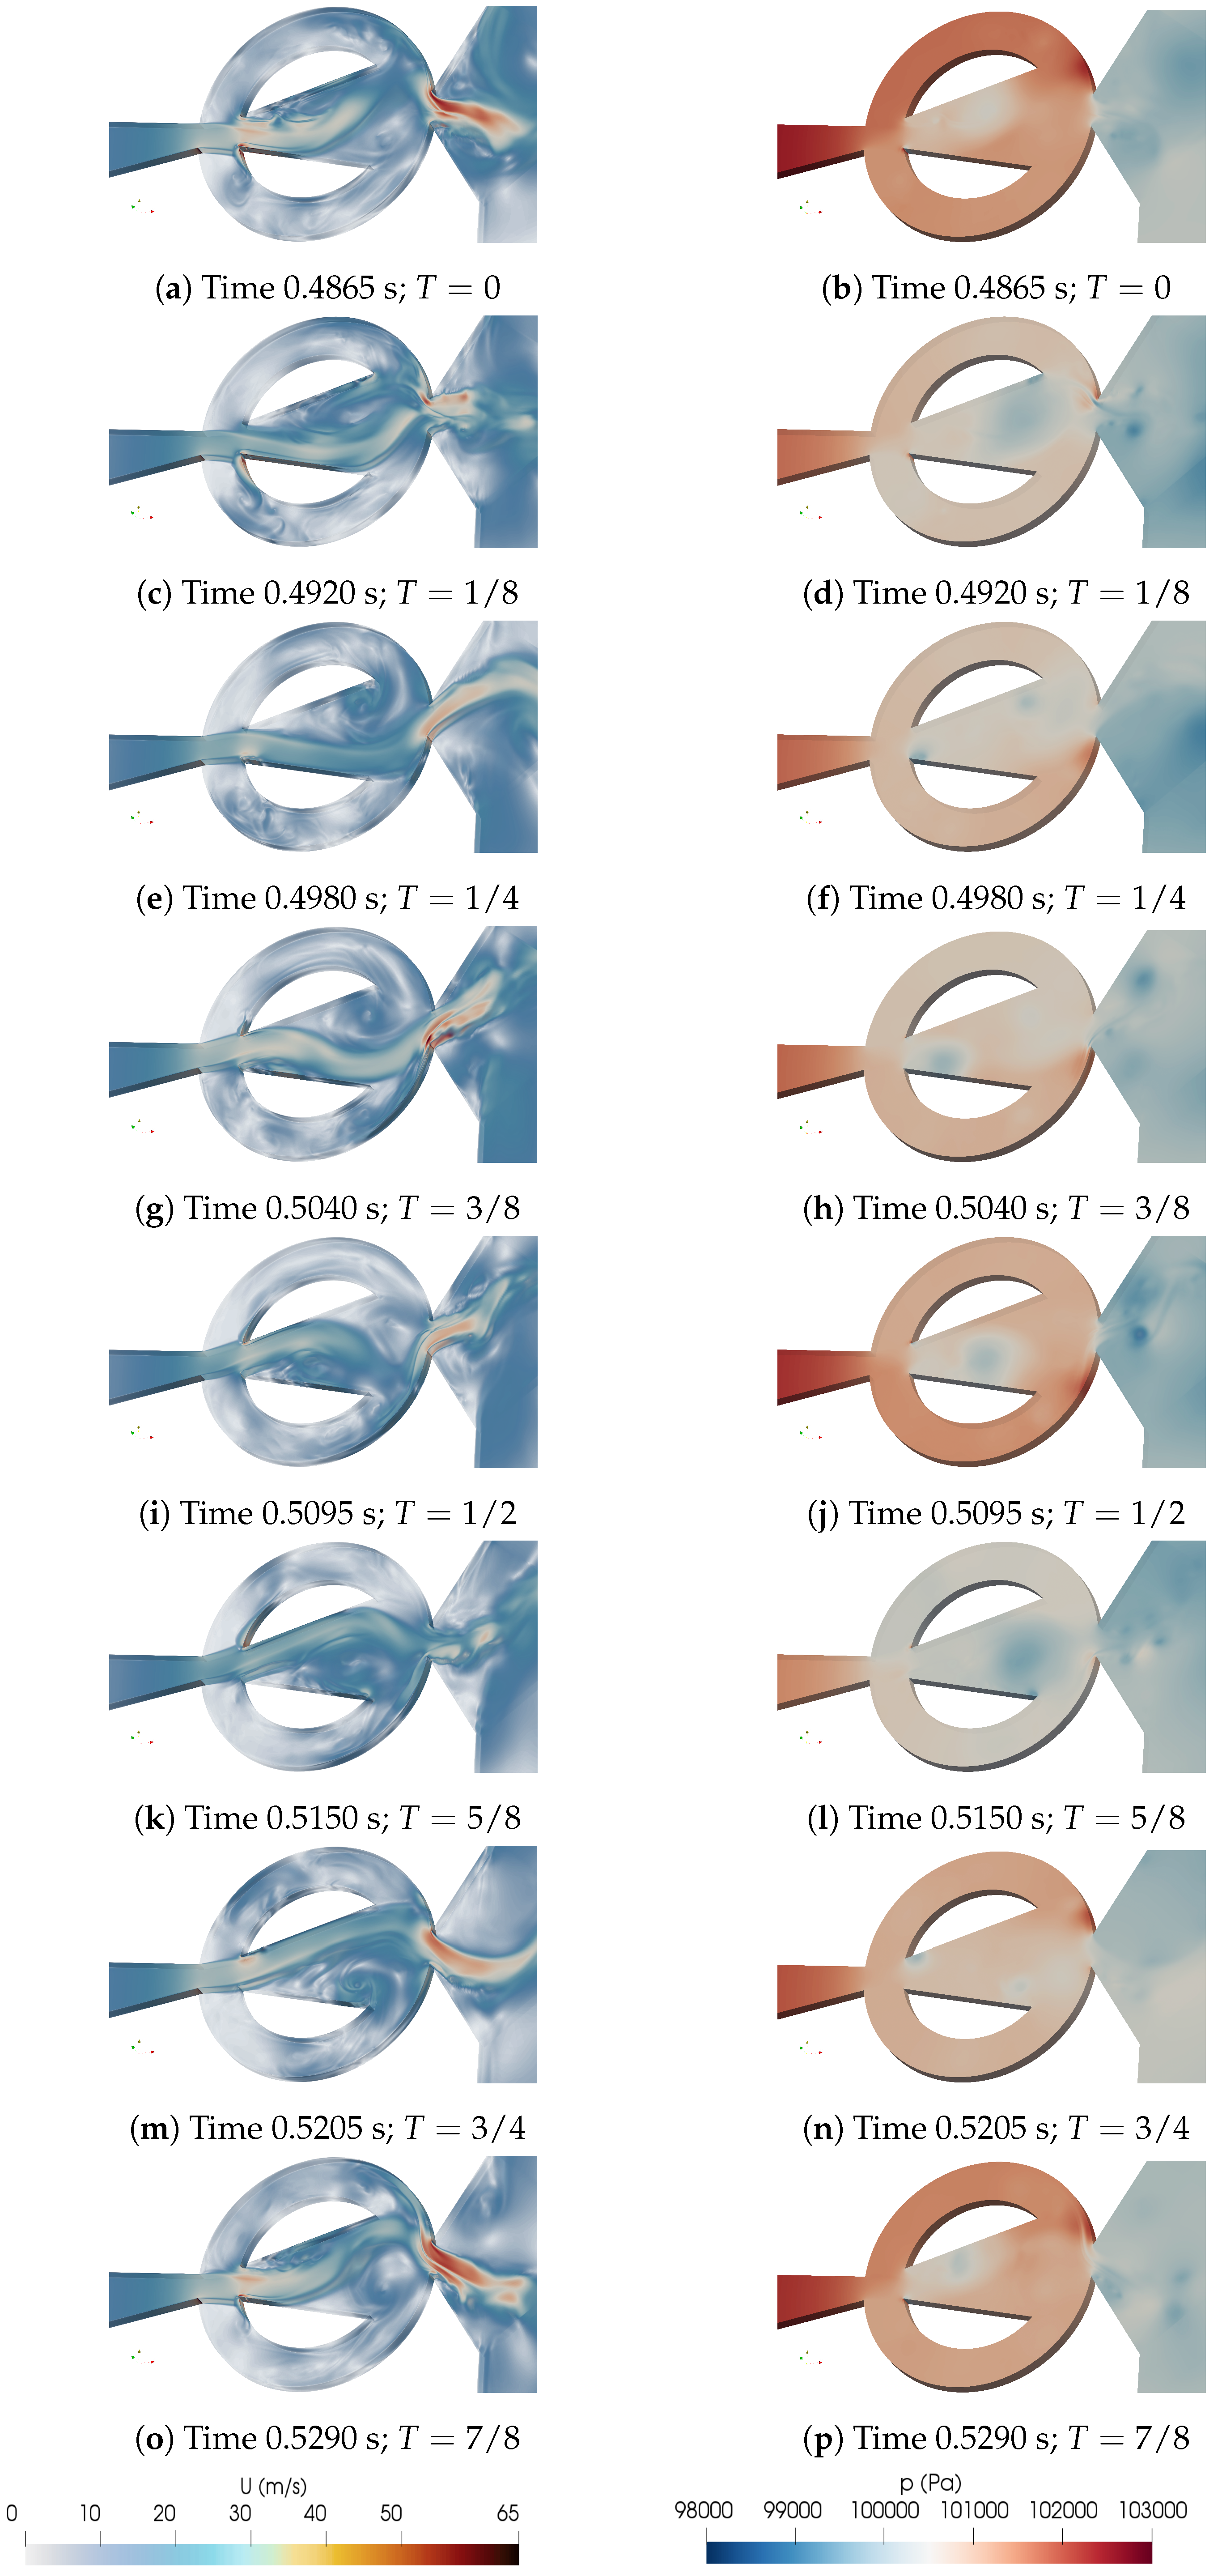
To start understanding the evolution of the jet inside the MC and at the FO outlet, we decided to divide a full oscillation cycle in eight equidistant time steps and present the corresponding velocity and pressure fields in Figure 4. We have chosen the oscillation period to start at the instant at which the pressure at the MC upper converging wall is maximum, as clearly observed in Figure 4b. At this instant (T = 0), the upper FC is pressurized and the jet inside the MC is being pushed downwards. At the next time step (T = 1/8) the jet inside the MC is about to reach its lower position, some reverse FC flow (flow going from the FC outlet towards the FC inlet) is observed at the lower FC, Figure 4c, the pressure at the upper FC is slightly higher than at the lower one Figure 4d. As we move forward to (T = 1/4), it is observed that the pressure at the MC lower converging wall starts rising and keeps rising until reaching (T = 1/2), see Figure 4f, h, j. This stagnation pressure increase is due to the jet impinging on the MC lower converging wall as observed from Figure 4e, g, i. In fact, and due to the pressure rise at the lower FC, the jet inside the MC starts moving upwards at time (T = 1/4) and keeps moving upwards until (T = 5/8), notice that at time (T = 3/4), Figure 4n, the pressure at the MC upper converging wall is clearly much higher than the one at the MC lower converging wall, which pressurizes the upper FC and pushes the jet inside the MC downwards. This process will continue until reaching (T = 1/4) where the jet at the MC has reached its lower position and the lower FC is again beginning to be pressurized. It is interesting to note that the maximum velocity exiting the FO is obtained at the instants where the pressure at the MC upper and lower converging walls is around the respective maximum value, see Figure 4a, b; o, p; g, h; and i, j.
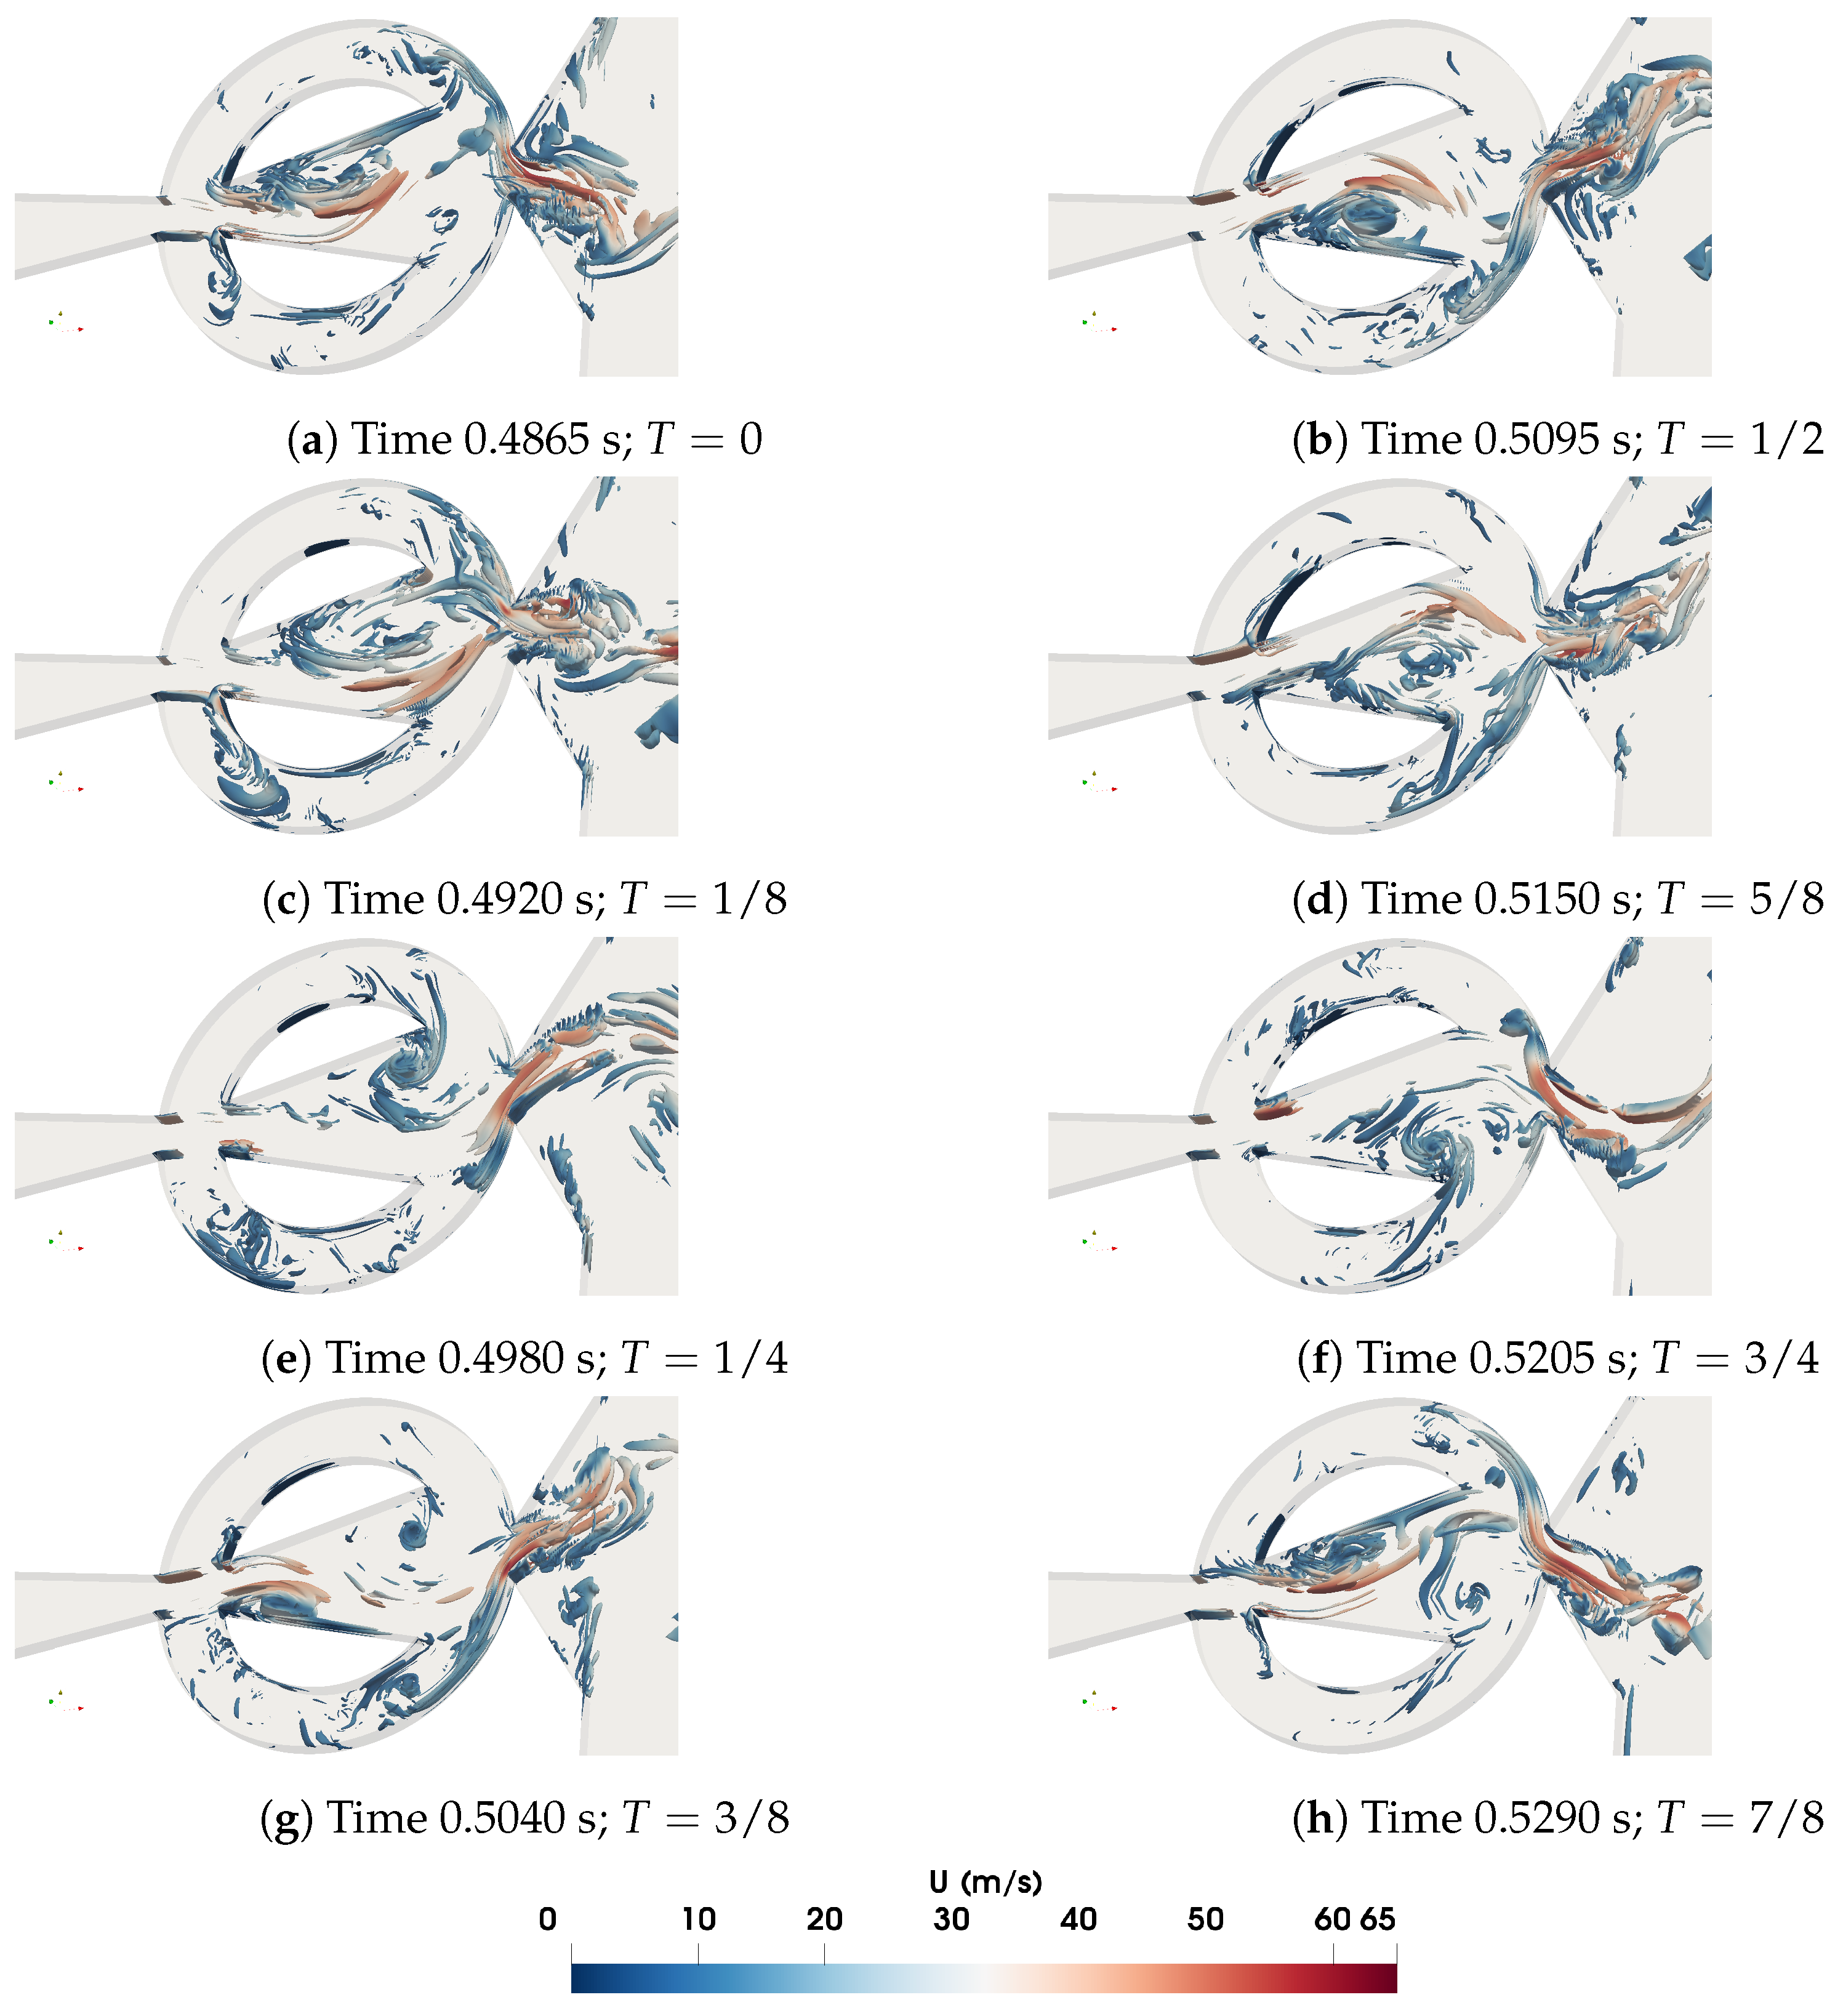
In order to further understand the FO internal 3D vortical structures formation, evolution and dimensions, the time averaged Q-criterion for a value of 2 × 10 6 is computed at each of the eight equidistant time steps we have divided the full oscillation period. Q-criterion is conventionally defined as the second invariant of the velocity gradient tensor, and it is empirically expressed as ( 1 / 2 ) ( | | Ω | | 2 | | S | | 2 ) . Where Ω is the rotation rate or vorticity tensor and S is the strain rate tensor. The iso-contours of the 3D structures are depicted in Figure 5. When comparing Figure 4a, c with Figure 5a, c, the FC reverse flow can now be more clearly seen. In fact, the vortical structures forming alternatively on both sides of the MC are now clearly observed in all figures thanks to the Q-criterion plots. The flow entering and evolving inside the FCs is as well observed in great detail, see for example Figure 5d, e, f, g. Of particular relevance is the evolution of the vortical structures associated to the jet exiting the FO. Such structures are mostly elongated flowing along the flow stream direction and breaking rather shortly downstream into smaller and more random structures. This effect is particularly relevant when willing to employ the FO to cool down a hot flat plate located perpendicularly in front of it, as in references [10,11,12] for example, then it gives a hint of the downstream distance the plate should be located to maximize heat transfer.
Figure 4. Instantaneous velocity and pressure fields cut along a full oscillation period divided in 8 equi-spaced time steps. 3D baseline case (STD).
Preprints 119018 g004
Figure 5. Q criterion fields for a value of 2 × 10⁶, shown along a full oscillation period divided in 8 equidistant time steps. 3D baseline case (STD).
Preprints 119018 g005
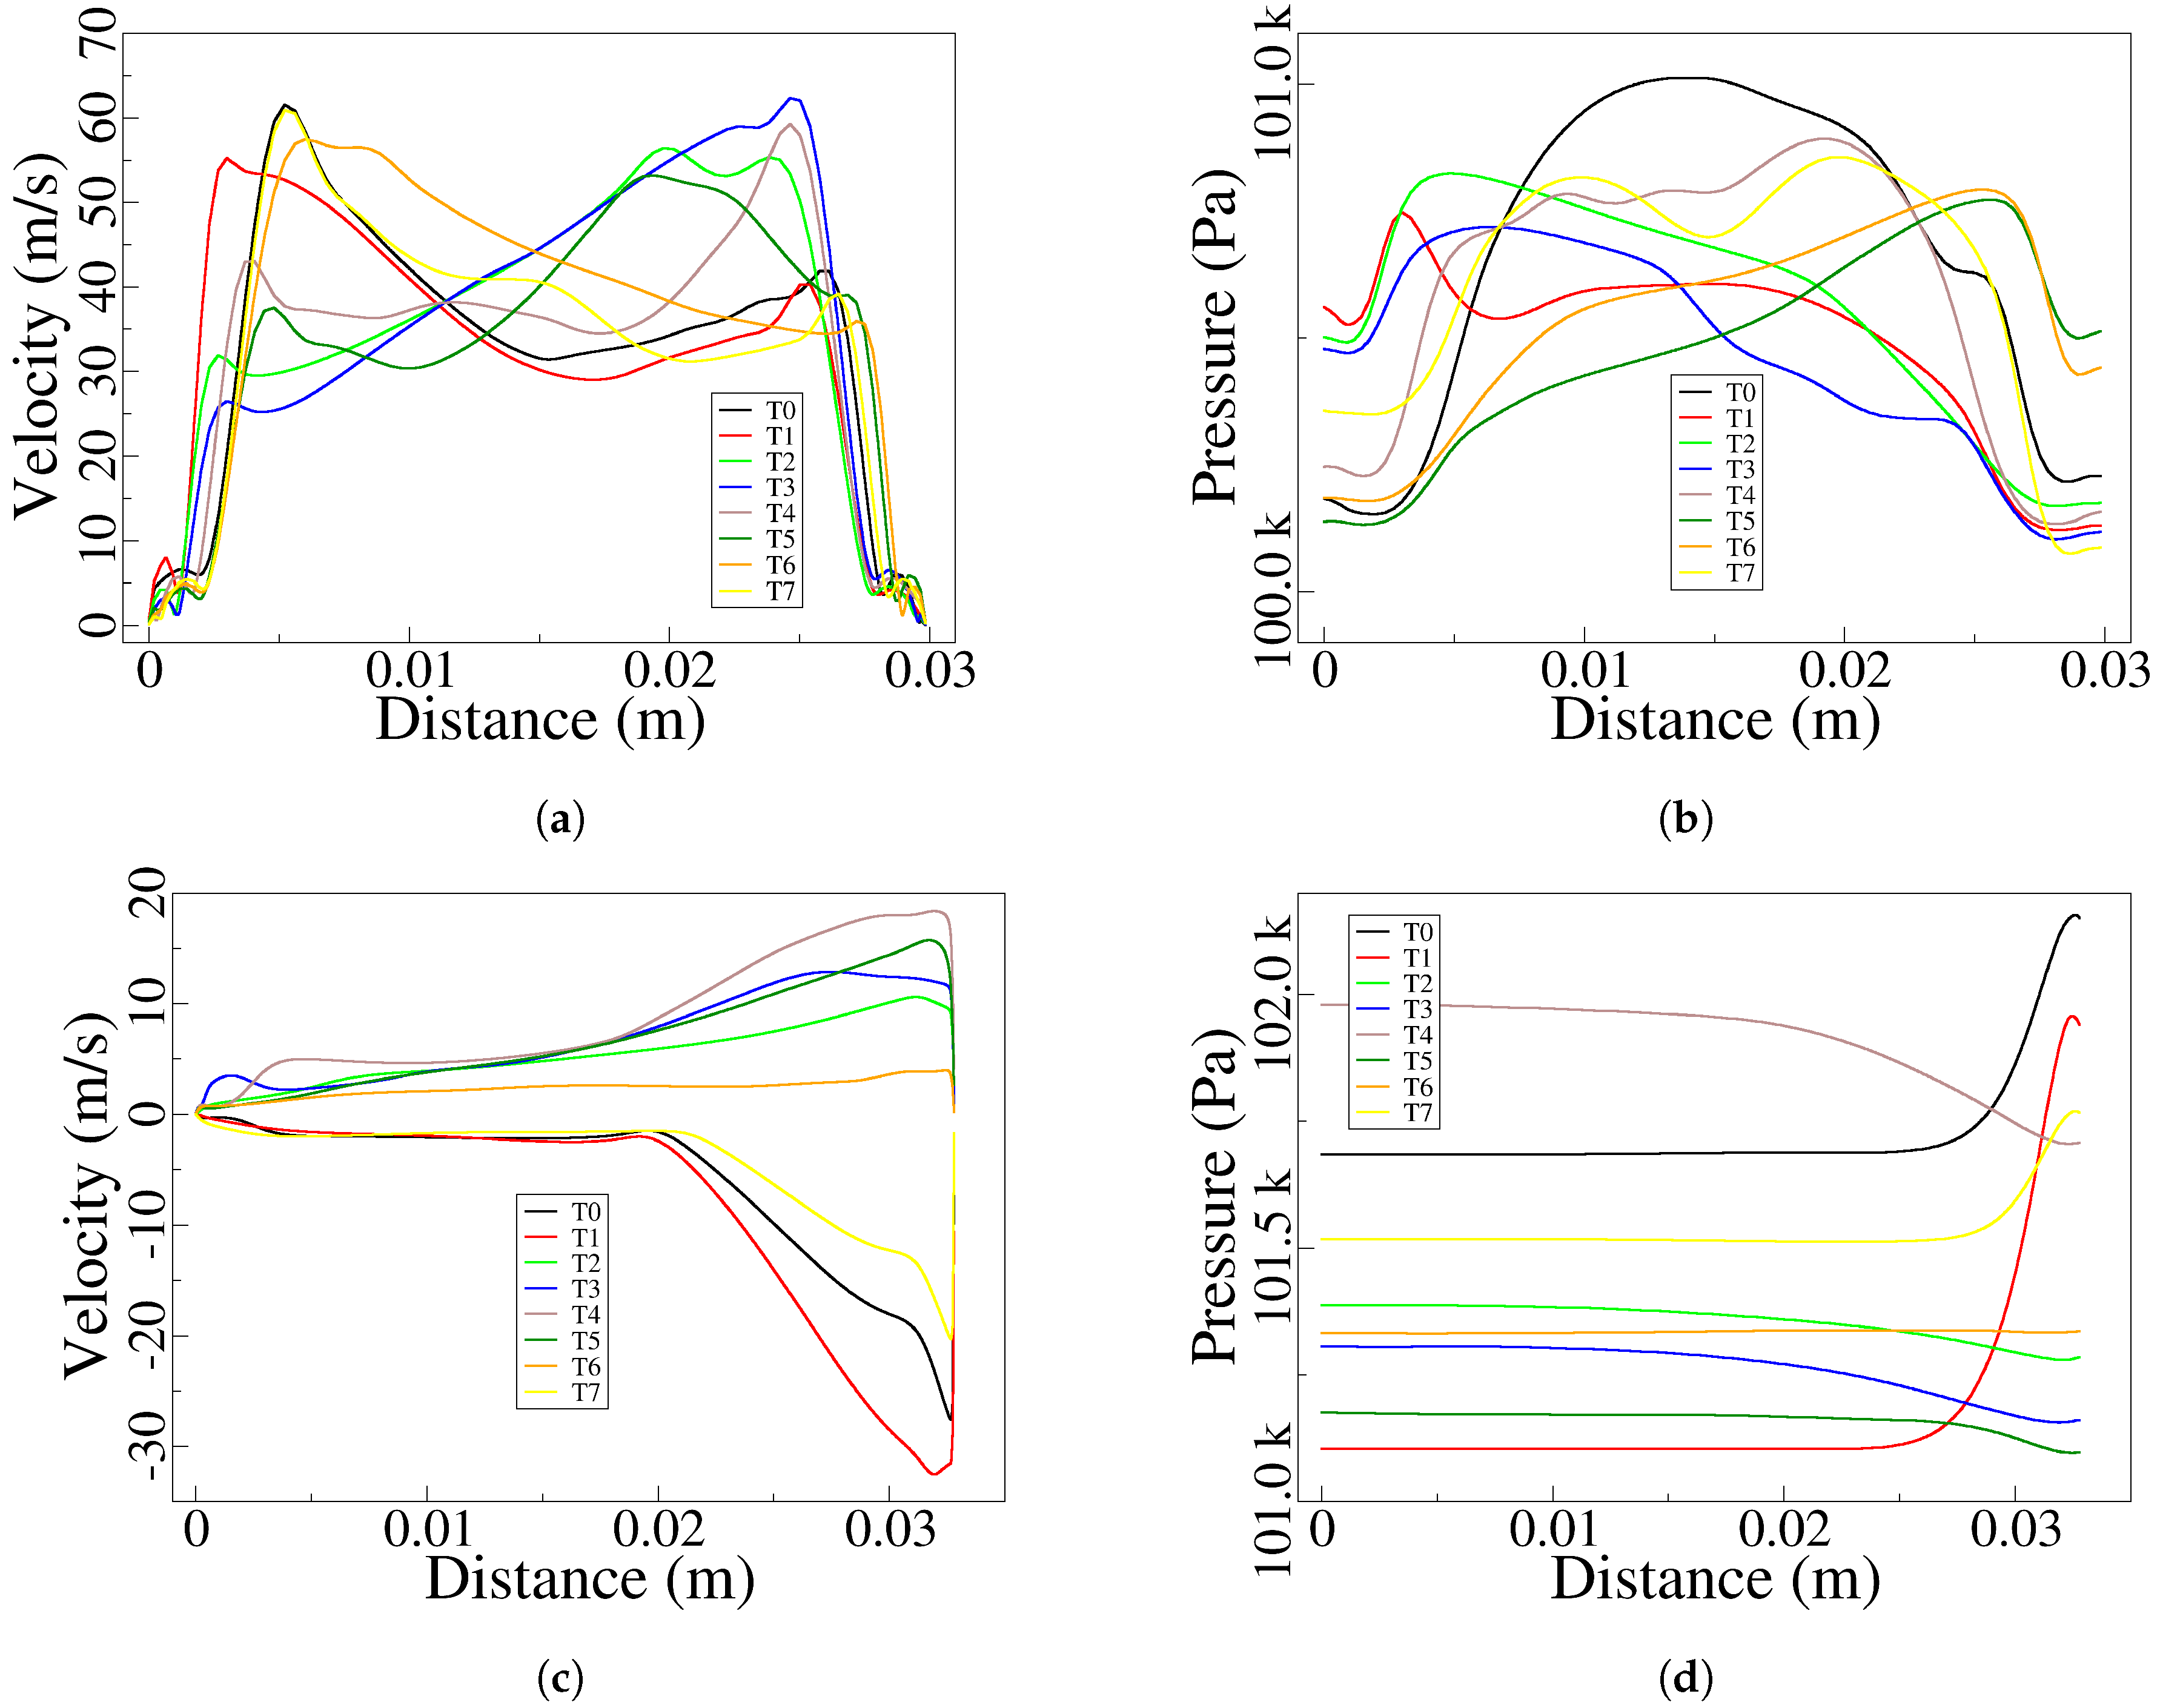
A more precise quantification of the instantaneous and spanwise averaged velocity and pressure fields measured at the FO outlet width and the lower FC outlet, is presented in Figure 6. Each graph represents the corresponding magnitude obtained at each of the eight equidistant time steps an oscillation period was divided. The first thing to note is that the FO outlet maximum velocity is of about 60 m/s being its average of around 40 m/s, Figure 6a. As expected, the maximum velocity flips from one side to the other along the FO outlet, every half oscillation period. Note that at times TO and T1, Figure 6a, which correspond to the instants defined in Figure 4a and Figure 4c, respectively, the velocity peak is located on the left hand side of Figure 6a, moving towards the right hand side at times, T2 to T5, respectively corresponding to Figure 4e, g, i, k, and returning to the left hand side at times T6 and T7, which corresponds to Figure 4m and Figure 4o, respectively.
The pressure at the FO outlet width, Figure 6b, oscillates around 100500 Pa and shows three different patterns. At T0, the jet exits the FO with rather a maximum velocity mostly concentrated on the upper side of the FO outlet, the MC outlet upper inclined wall is highly pressurized, but the pressure distribution along the FO outlet is rather uniform, showing a pronounce drop at the location where the fluid velocity is maximum, see Figure 6a,b and Figure 4a, b. At time T1, velocity and pressure maximum values are localized at the left hand side of the graph, the fact that the pressure field is moving towards the location where is the maximum velocity, precedes the flipping of the maximum velocity towards the opposite side of the FO outlet, which is happening in the next time step. At T2, the maximum velocity field has flipped towards the right hand side of Figure 6a, while the maximum pressure field is well established on the left hand side, this situation is remaining for the next time step T3. At time step T4, the maximum velocity field is still observed at the right hand side of the graph, but the pressure field starts moving towards this same location, the situation is similar to the one observed at T0, although the maximum velocity location and pressure displacement were opposite. At instant T5, maximum velocity and pressure fields are located at the right hand side of the respective graphs, situation homologous to the one observed at T1, which was preceding the flipping of the maximum velocity location. As a matter of fact, the maximum velocity has moved toward the left at T6, while the max velocity position remains at the right side. Finally, at time T7, the maximum velocity position is the same as in the previous time step and the pressure field starts displacing from the right towards the left, situation homologous to the one described at time steps T0 and T4. It is interesting to note that, the respective maximum and minimum values for the velocity and pressure fields are generally appearing at opposite positions, the side where the velocity is maximum corresponds to a minimum pressure and vice-versa, which obeys to the energy equation under incompressible flow conditions, this situation changes at the instants where velocity flipping is about to happen.
Figure 6. Instantaneous and spanwise averaged velocity and pressure fields measured at the Fluidic oscillator outlet width (a), (b), and at the lower feedback channel outlet (c), (d).
Preprints 119018 g006
When looking at the instantaneous velocity distribution along the lower FC outlet, Figure 6c, it is clearly seen that the fluid flows in both FC directions. At T0, T1 and T7, which corresponds to the instants T = 0, T = 1/8 and T = 7/8 represented in Figure 4a, Figure 4c and Figure 4o, respectively, there is reverse flow, (flow going from FC outlet towards FC inlet). The maximum reverse velocity is of about 30 m/s and it is localized rather at the right hand side of the FC outlet, as previously seen in Figure 4a, c and o. For the rest of the time sub periods, the fluid flows towards the MC and the velocity is more uniformly distributed across the FC outlet, being the maximum value of about 18 m/s. The pressure field at the FC outlet, Figure 6d, presents a considerable stability and follows the same trend as in the FO outlet, minimum pressure values are observed at the locations where the velocity is maximum, and vice-versa. In fact this behaviour is typical and obeys to the energy equation under incompressible flow conditions. Yet for the three time steps, T0, T1 and T7, where there is FC reverse flow, both, the pressure and velocity fields are having large values at the FC right hand side. For these three particular time steps, a large quantity of flow particles impinge on the MC lower wedge left hand side vertex, which raises the pressure in the vicinity of this corner, therefore explaining the unusual pressure rise.

6.2. Comparison between 3D and 2D Results

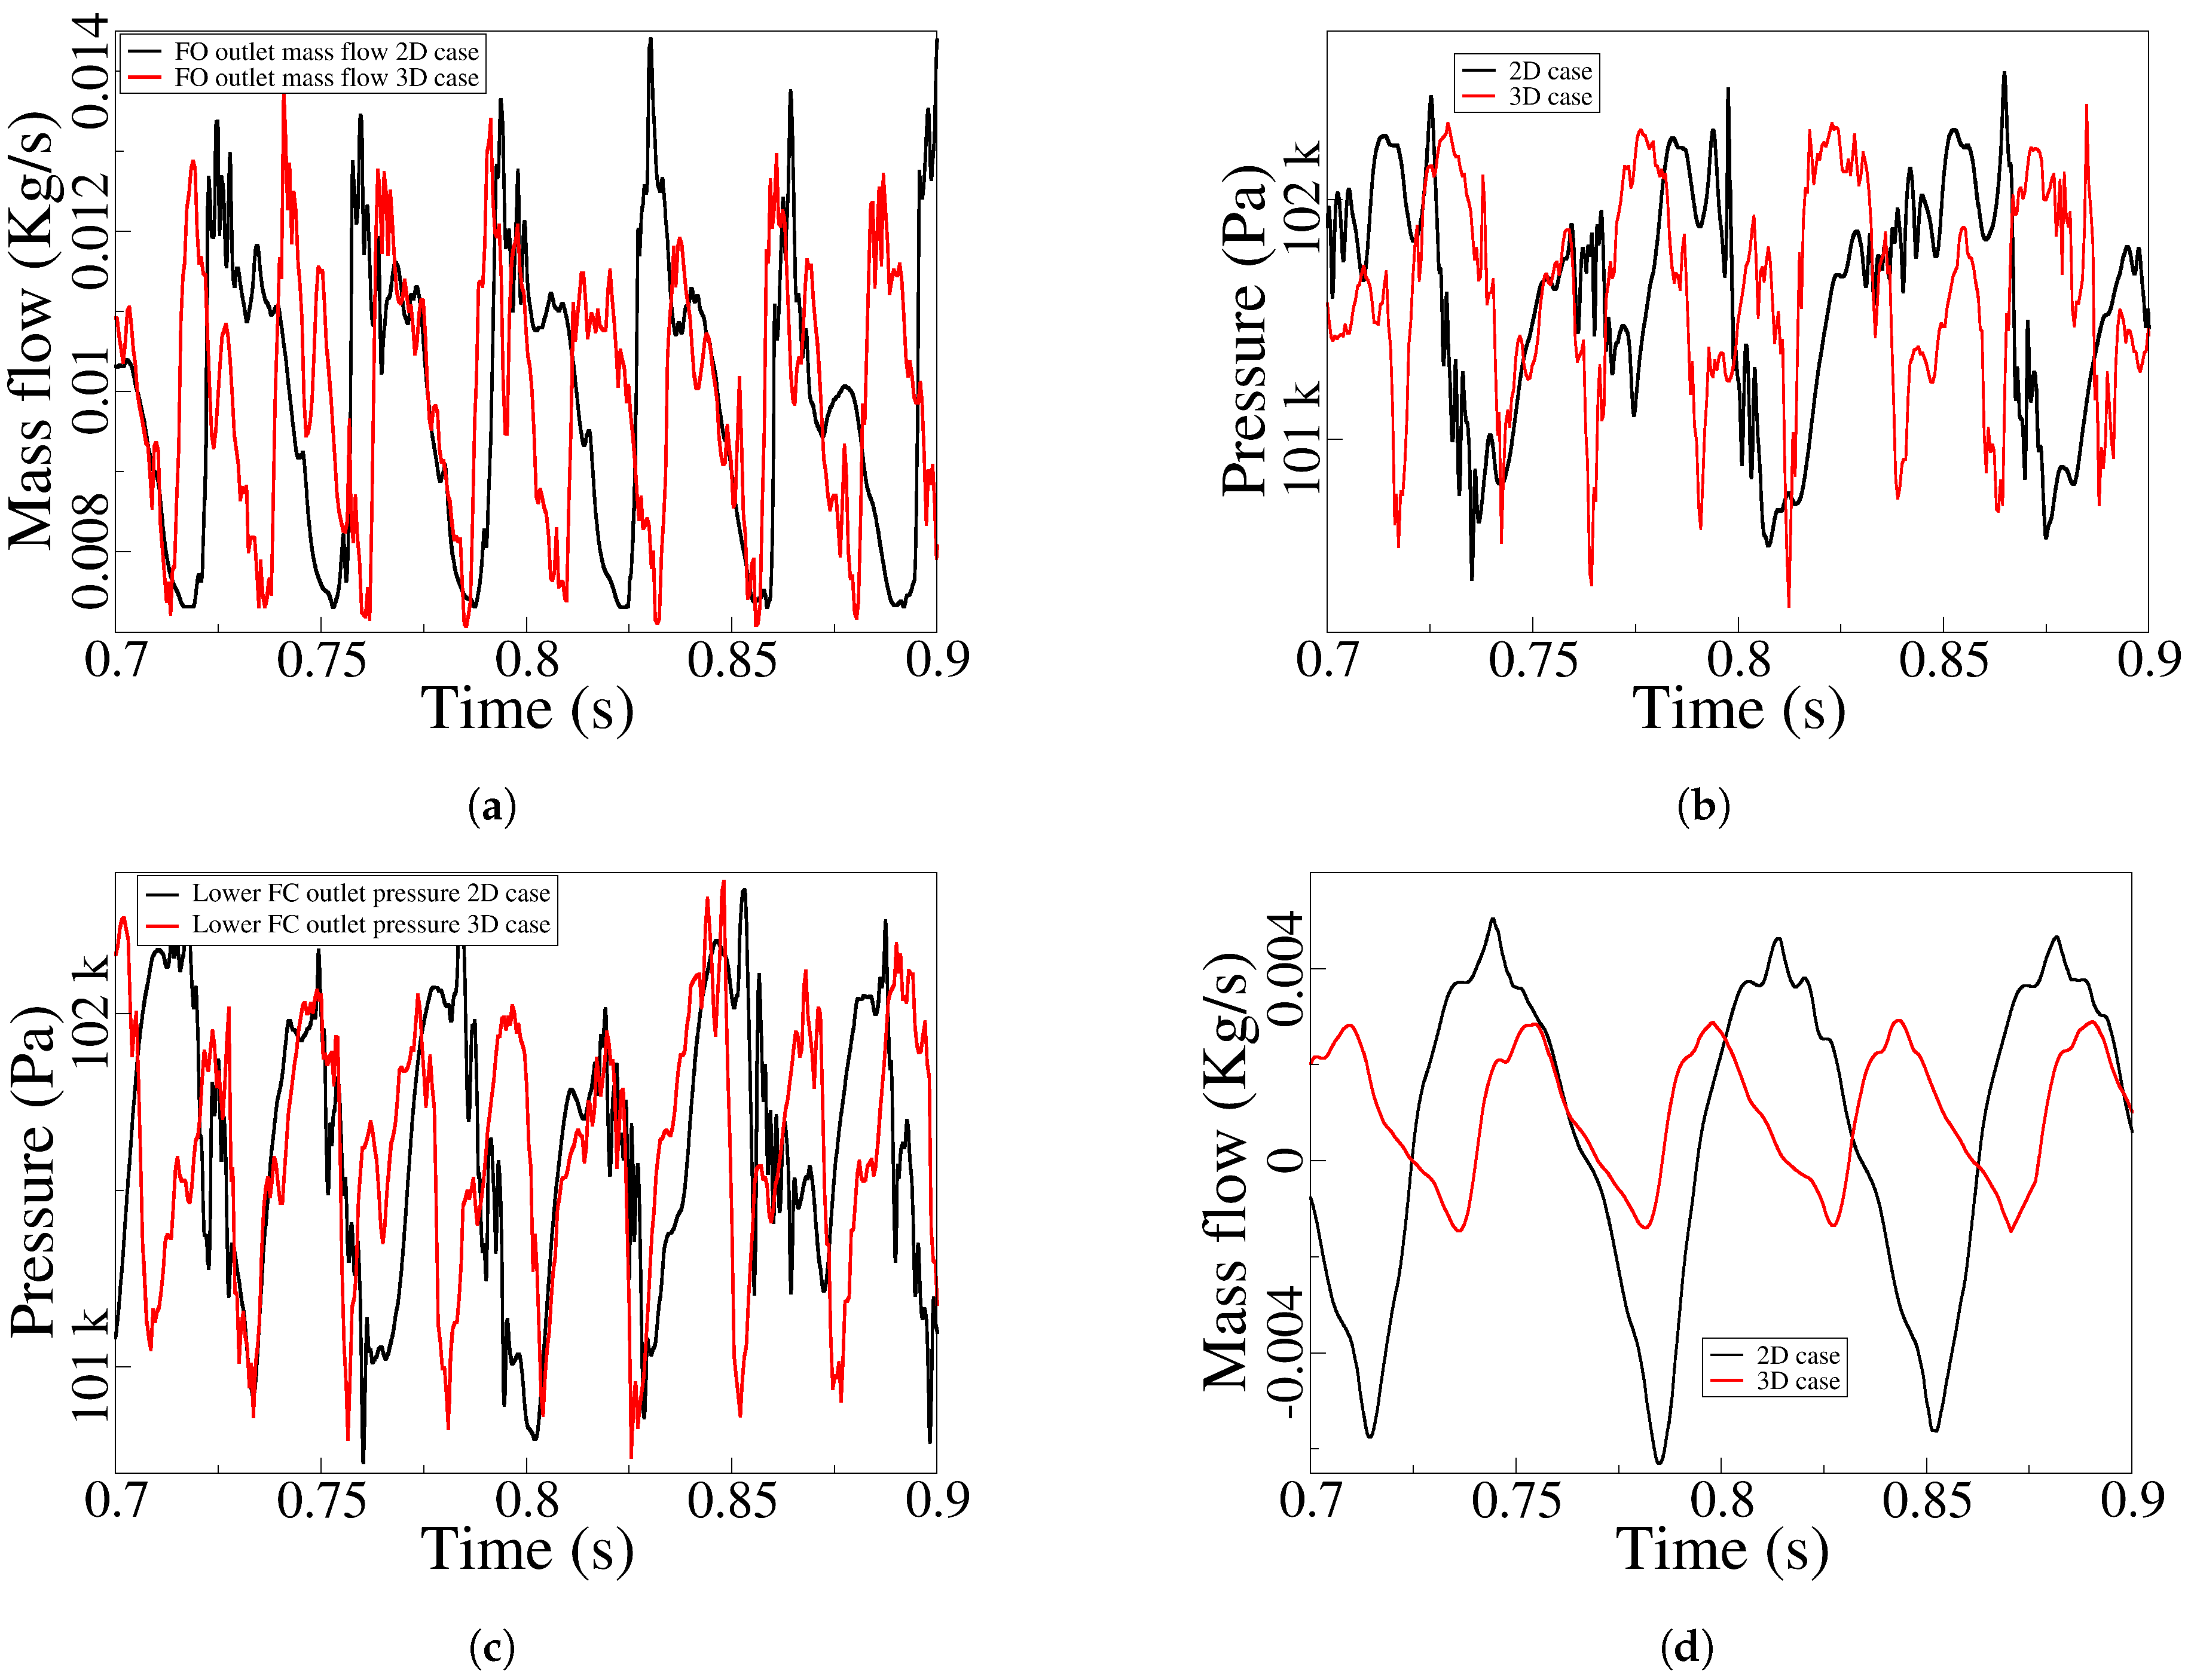
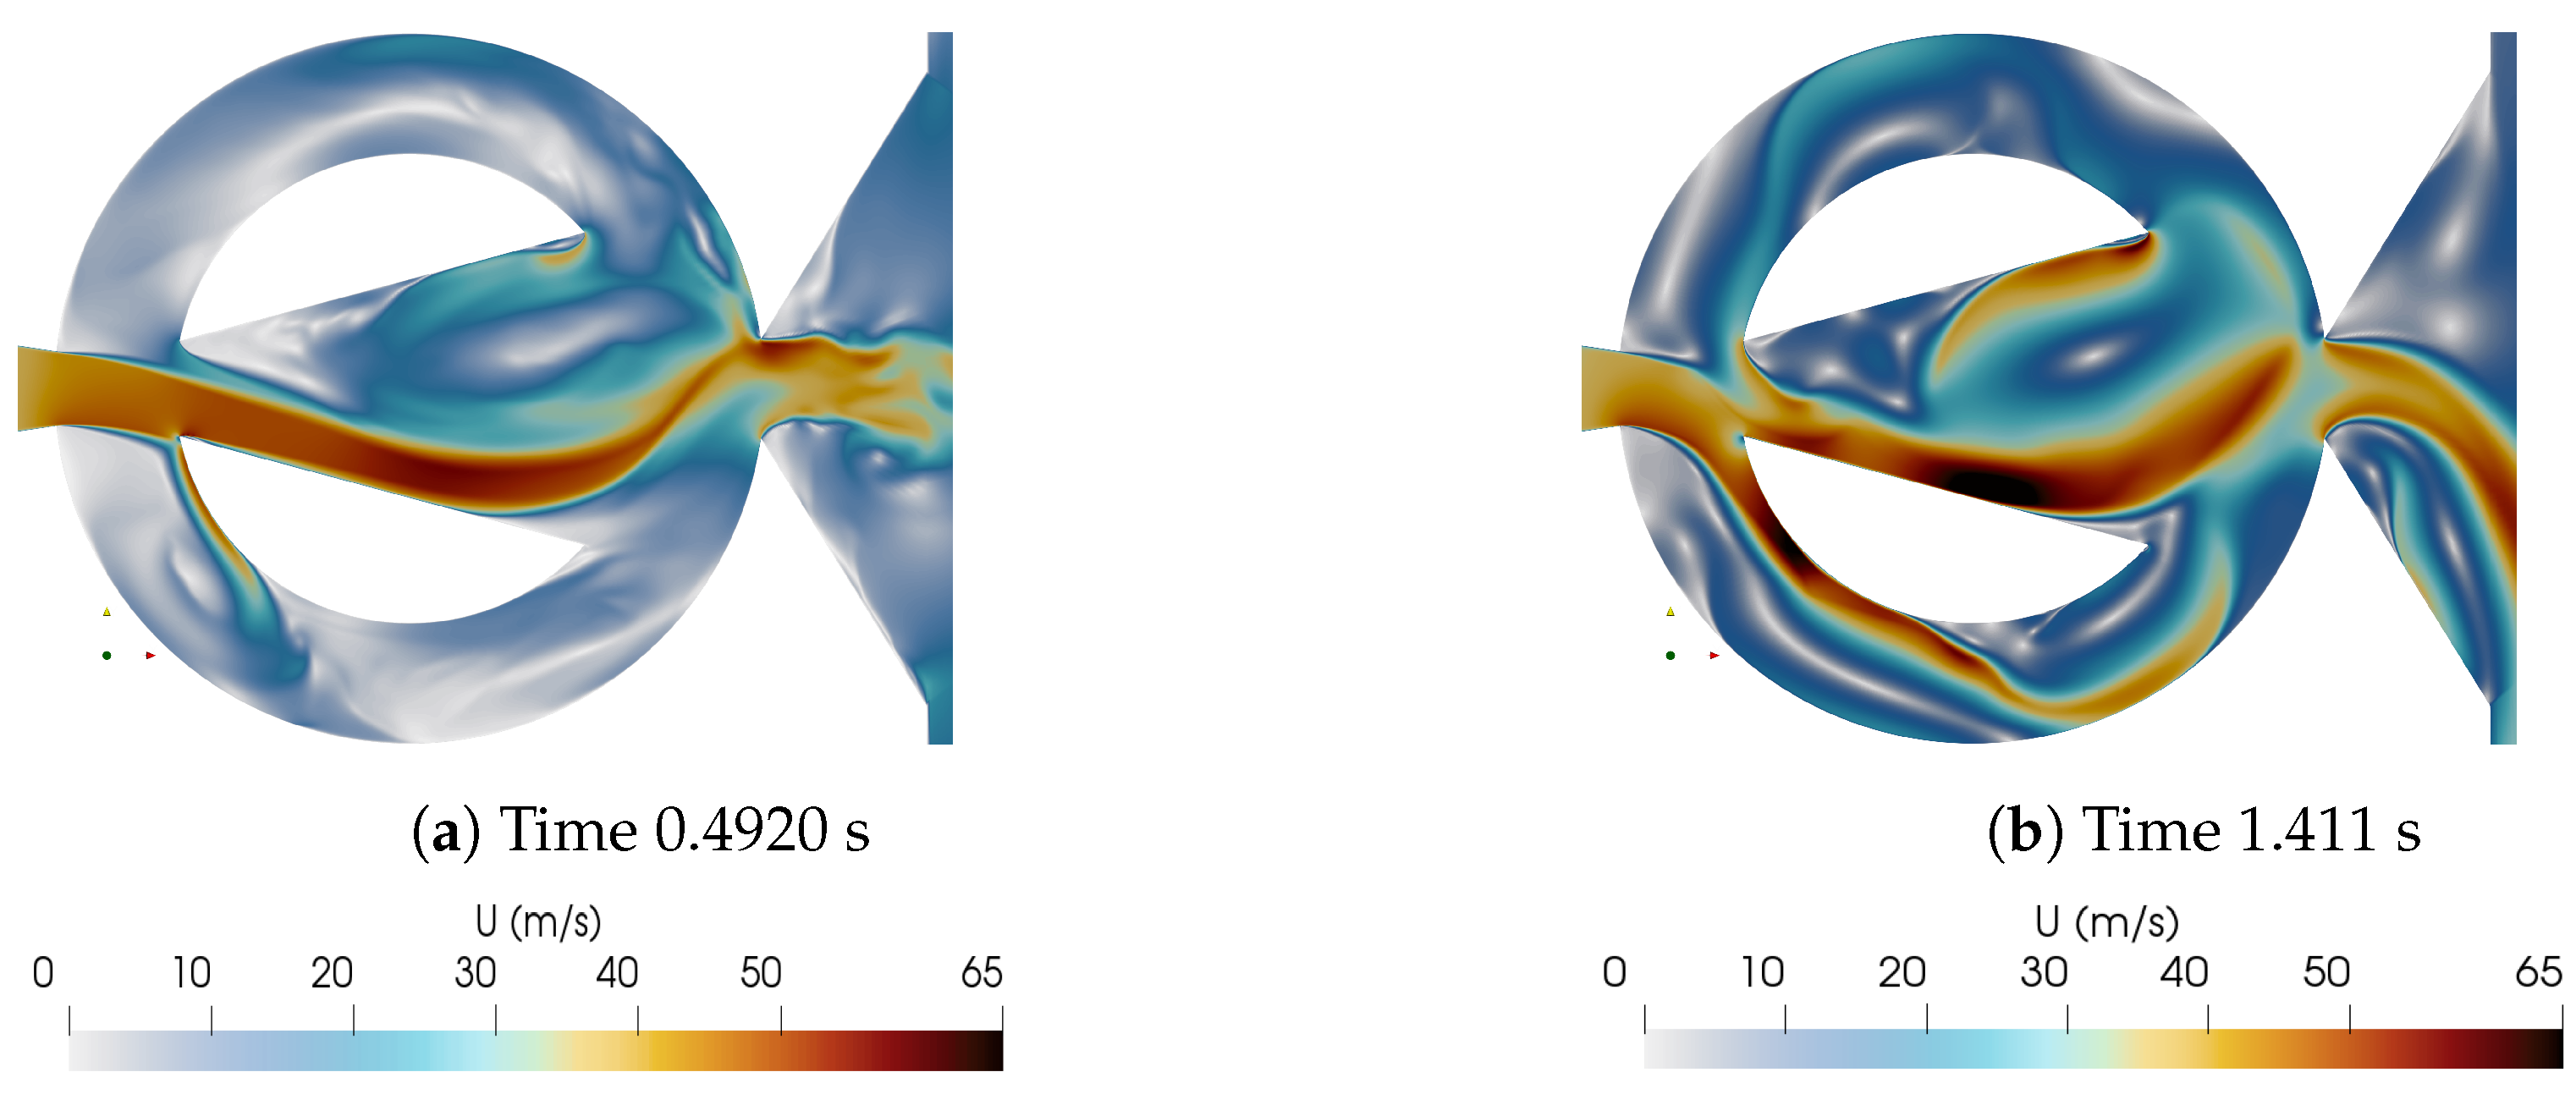
In order to further increase the reliability of the 2D-CFD simulations, the unsteady outlet mass flow, the unsteady stagnation pressure at the mixing chamber lower converging wall, and the dynamic pressure as well as the dynamic mass flow at the lower FC outlet are compared, for the standard fluidic oscillator configuration, between the two dimensional and the three dimensional simulations, Figure 7a to d, respectively introduces these comparisons. Fluidic oscillator dynamic outlet mass flow as well as the dynamic pressure at the MC lower converging wall and at the lower FC outlet, show good resemblances between the 2D and 3D models, the time averaged values and peak to peak amplitudes are very close. The main differences appearing when evaluating the dynamic mass flow and peak to peak amplitude at the FC outlet, see Figure 7d. The 3D simulations generate a much smaller FC mass flow peak to peak amplitude (about 35%) of the one obtained from the 2D simulations. The FC reverse flow is much smaller in the 3D simulations than in the 2D ones. This is likely to be due to the differences in the cross stream velocity distribution at the FO power nozzle. For the 2D simulations such velocity distribution is almost uniform at all points, while the 3D simulations generate a cross stream velocity distribution which accentuates the boundary layer effect on both cross-stream sides of the power nozzle (not shown here). As a result, less flow particles impinge on the MC upstream wedge corners and flow along the FCs in reverse direction. To clarify this point, Figure 8 introduces the MC velocity fields obtained for the 3D and 2D simulations at the respective instant the FC reverse flow is maximum. It can clearly be seen that the 2D model overestimates such reverse flow, as previously stated in Figure 7d. Four videos showing the velocity and pressure fields obtained from the 3D and 2D simulations are presented in the Appendix. Another effect of the FC reverse flow reduction is the increase of the oscillation frequency at the FO outlet. Such increase was calculated to be about 11% higher for the 3D simulations, this frequency mismatch was already reported in [1]. Based on the observations made in the present document, it appears there is a link between the FO output frequency with the FC reverse flow, the higher the reverse mass flow the smaller the frequency of the FO outlet mass flow. This point will be further assessed in the next subsections. The conclusion from the present subsection is that the 2D-CFD simulations are sufficiently accurate to compare the FO performance when several MC inclination angles as well as several FC widths are considered, which is what will be presented next.

6.3. Mixing Chamber Angular Modifications (2D-CFD)

In the present sub-section, the effects of modifying the mixing chamber angle are introduced. To properly understand the following observations, the reader should recall the information presented in Figure 3a and Table 3. Note that all information presented in this sub-section was obtained through 2D-CFD simulations.
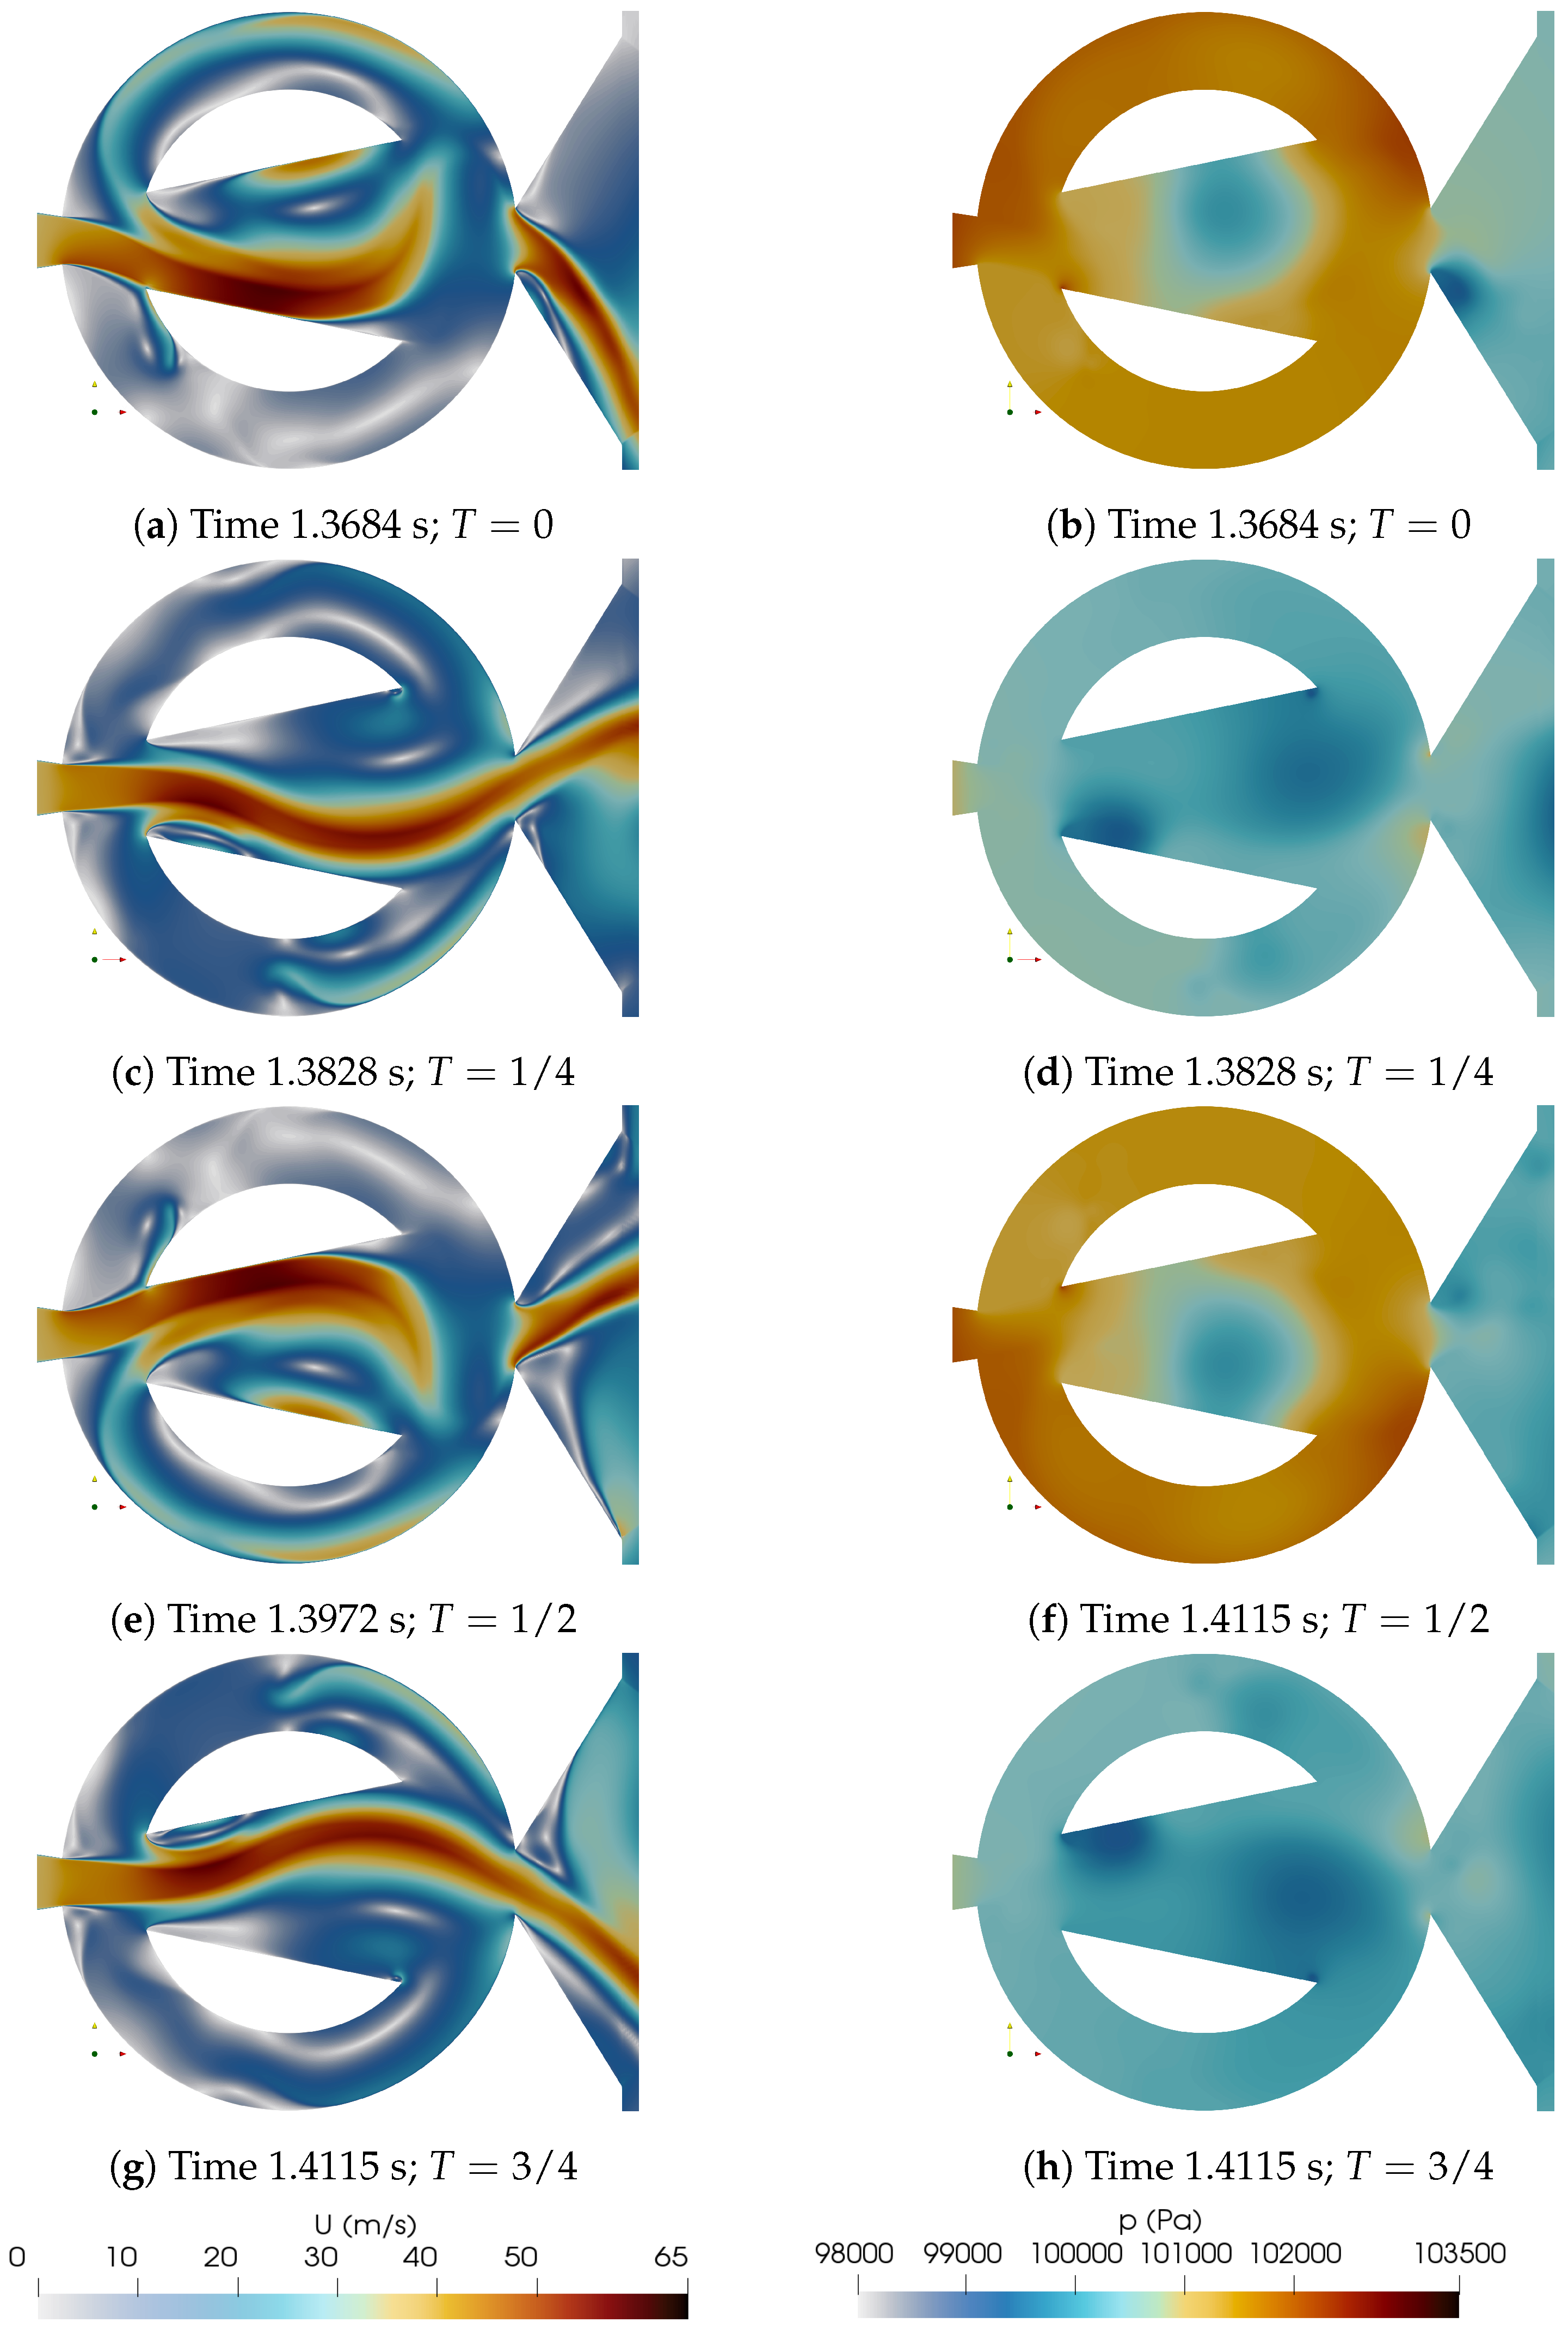
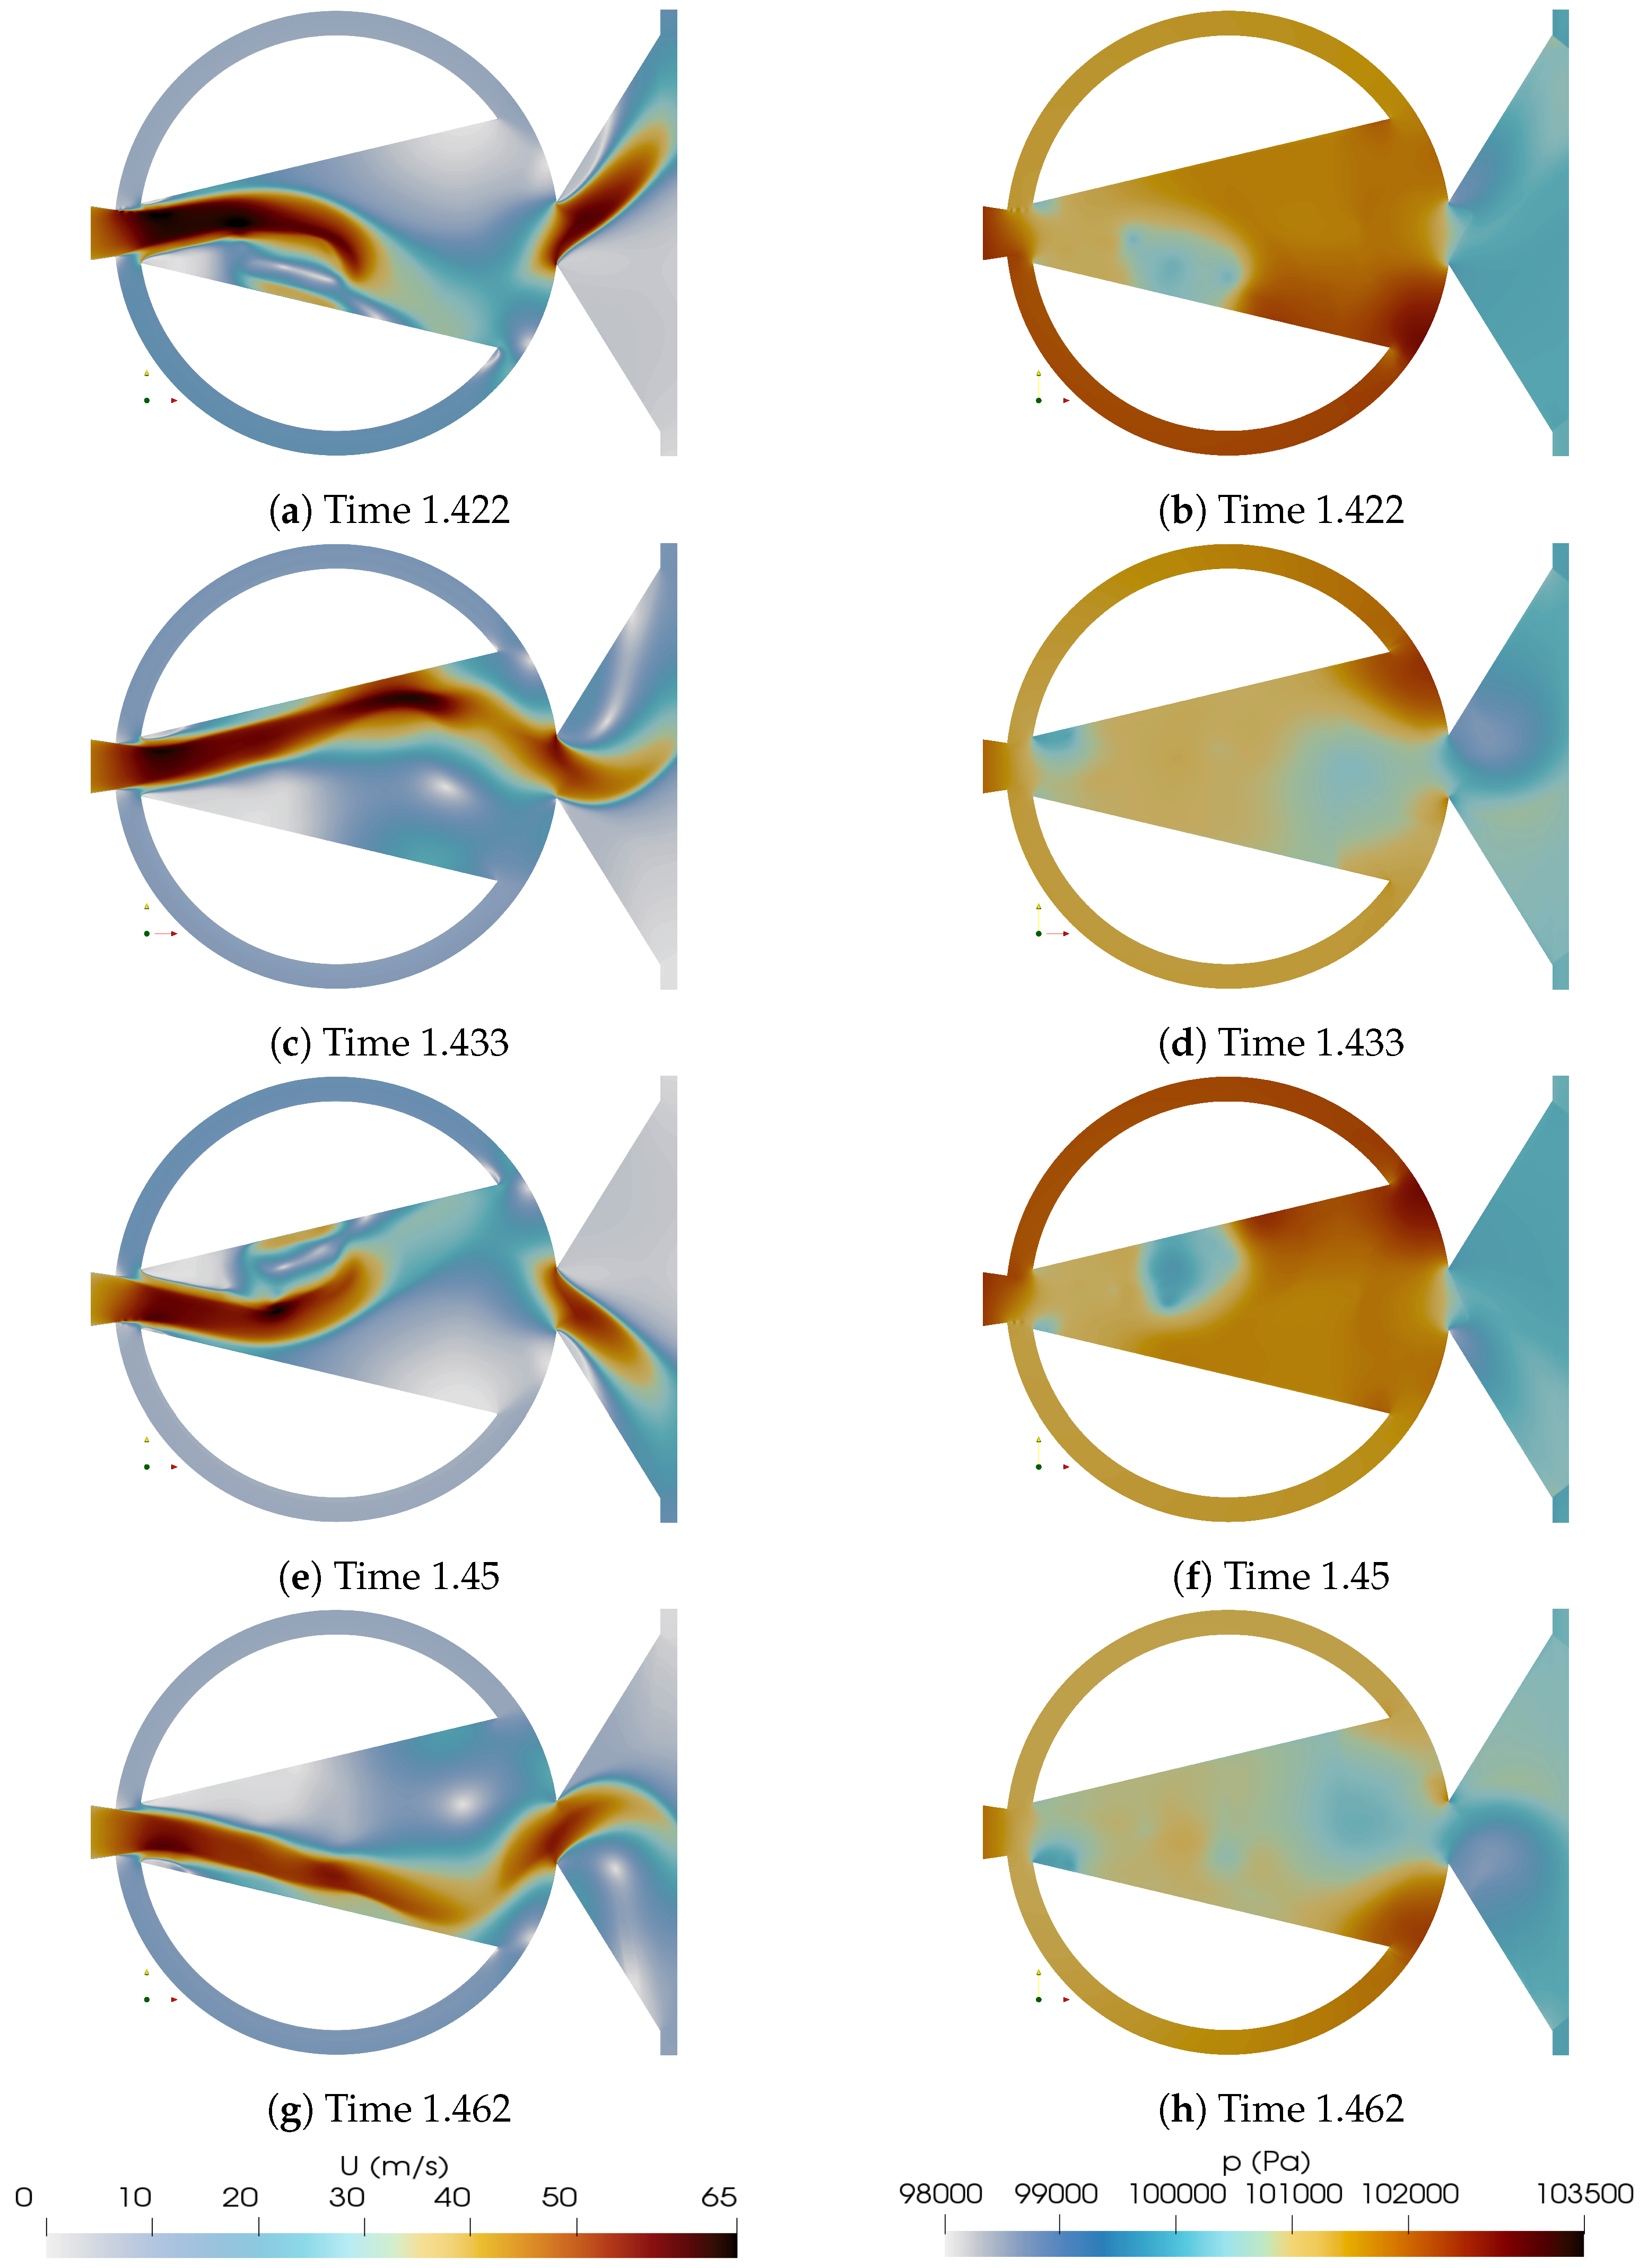
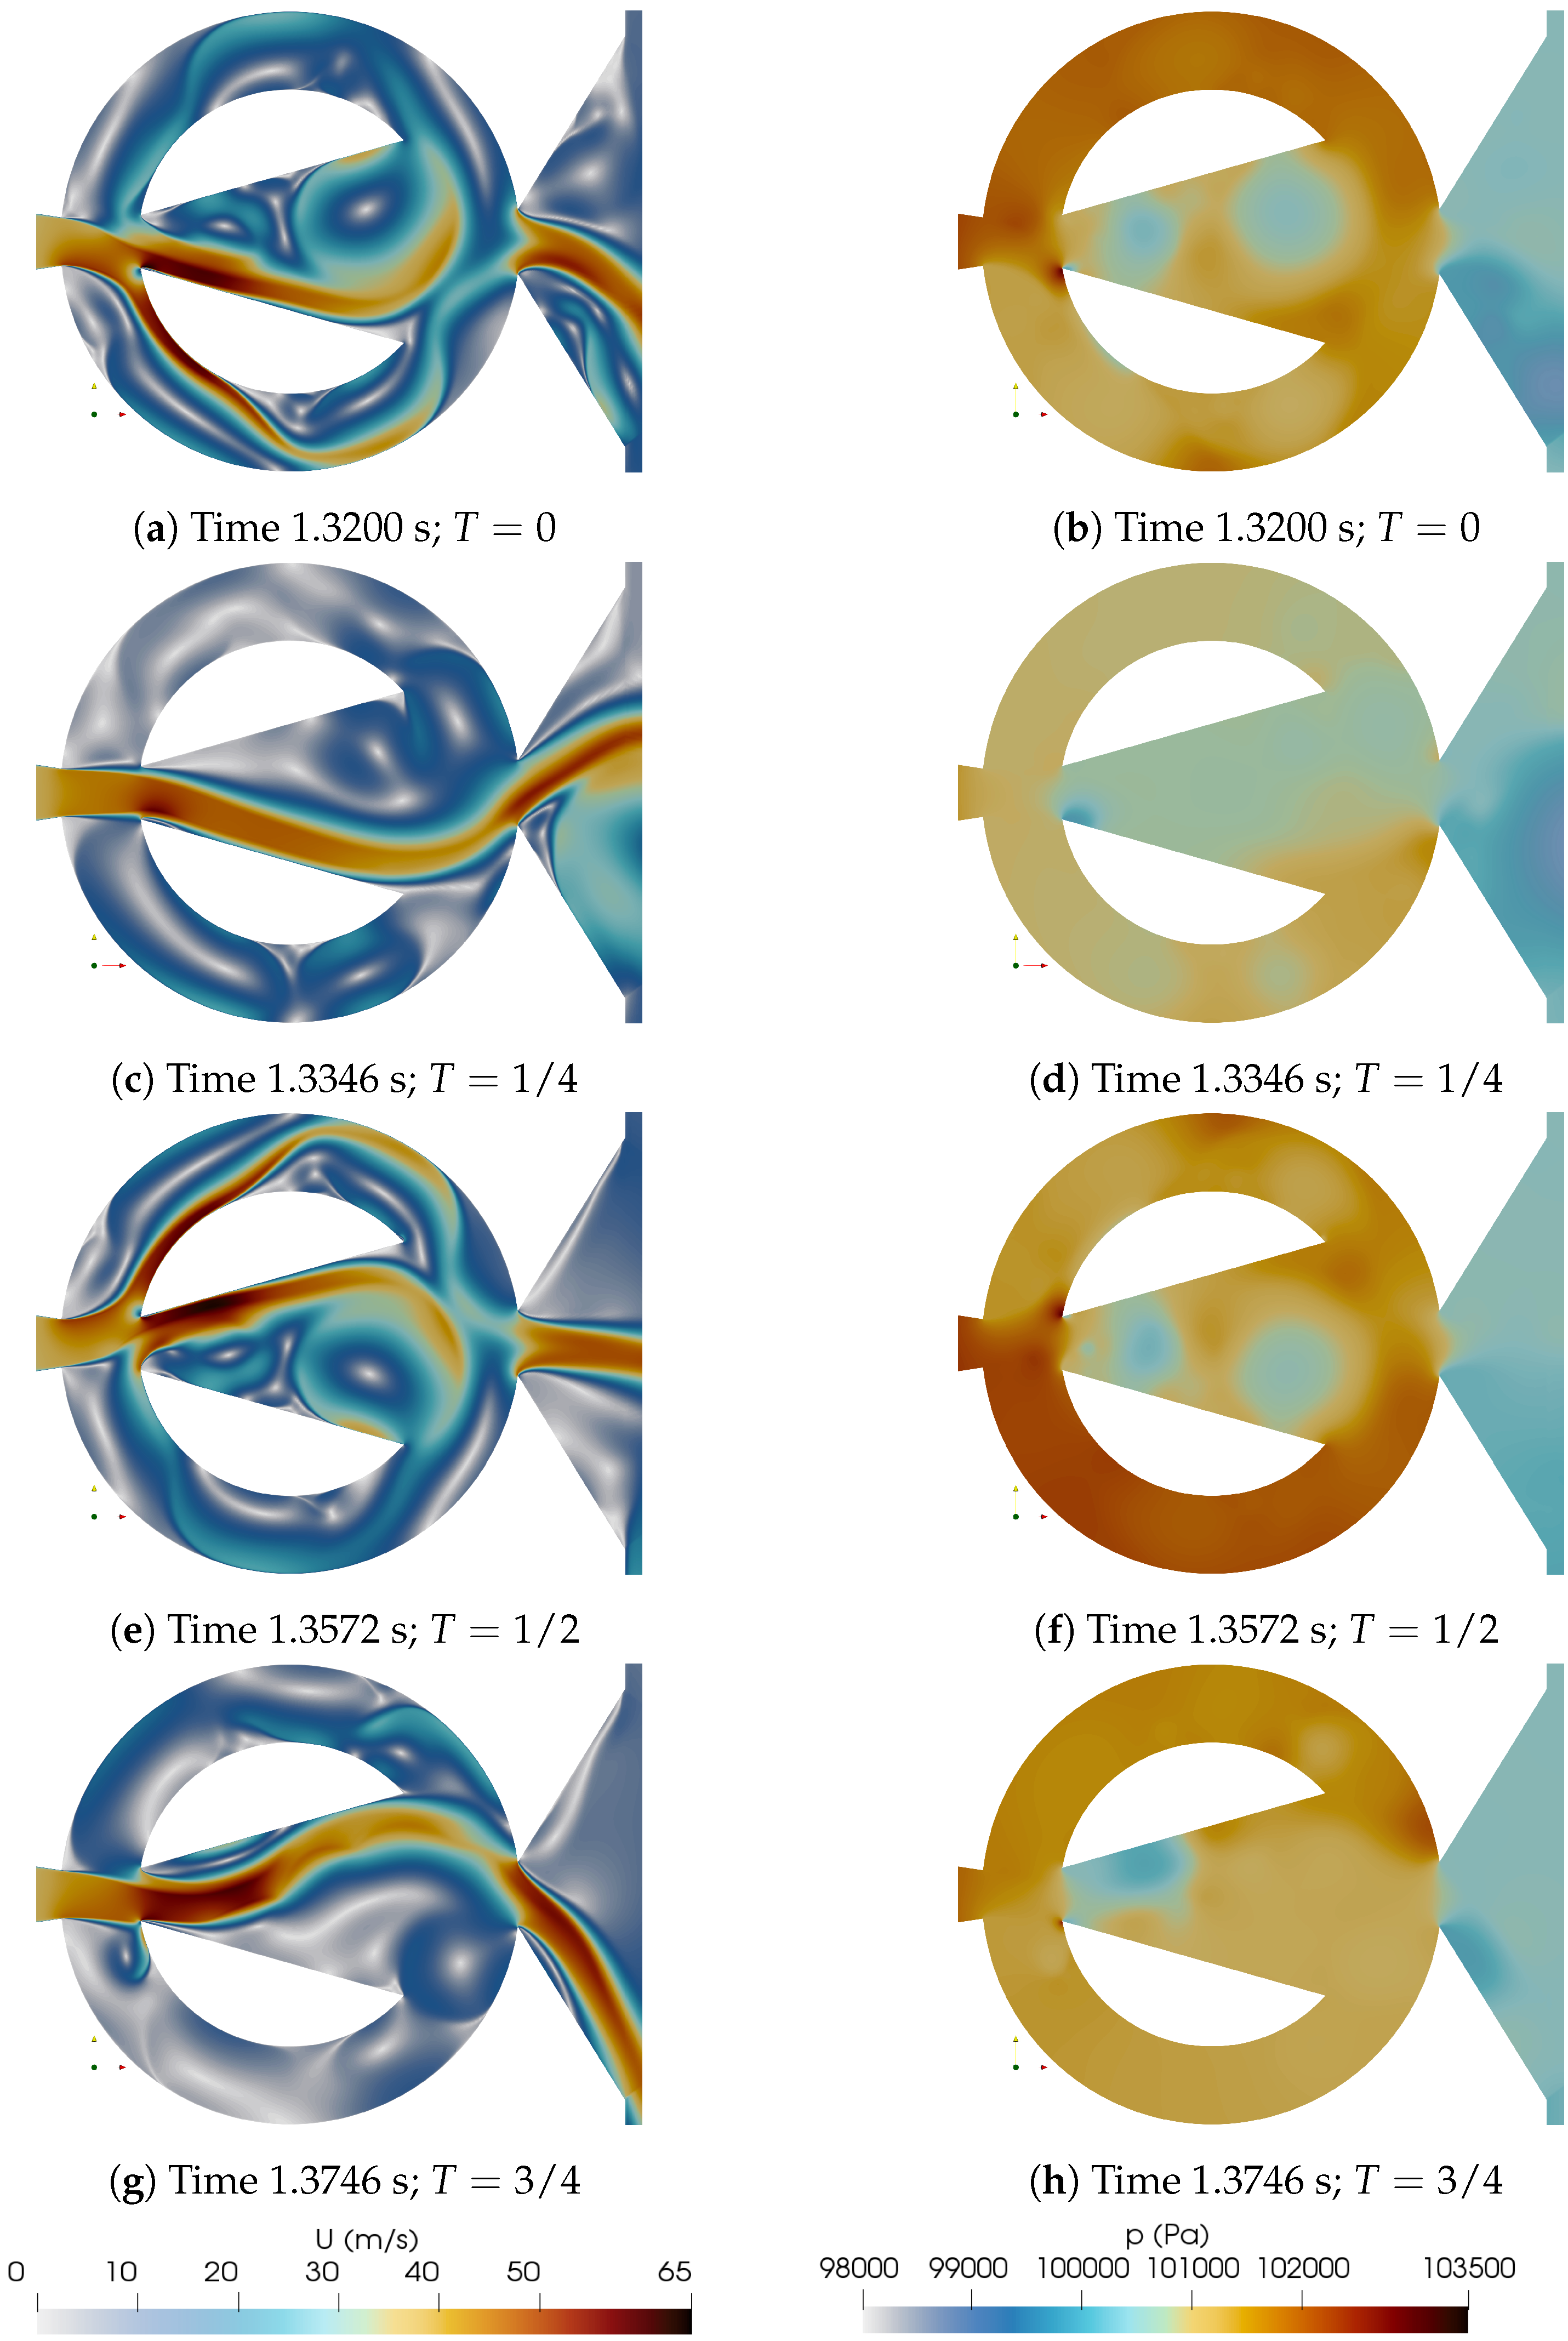
Figure 9 and Figure 10, respectively introduce the velocity and pressure fields for the maximum δ 1 = δ S T D + 15 ° (Entrance 1) and minimum δ 4 = δ S T D 15 ° (Entrance 4), studied. In both figures the oscillation period is divided in four equidistant time steps. The initial time T = 0, is taken at the instant at which the stagnation pressure at the MC upper converging wall is about its maximum, see Figure 9 and Figure 10b, the jet inside the MC is moving downwards then the upper FC is pressurized. At this particular instant, a large FC reverse flow is observed for the configuration δ 1 = δ S T D + 15 ° , Figure 9a, but a considerably smaller reverse flow is seen for the configuration δ 4 = δ S T D 15 ° , Figure 10a. In the next time step T = 1/4, Figure 9 and Figure 10c, d, the jet inside the MC has reached its down-most position and has started to move upwards, the lower FC is beginning to be pressurized, reaching its maximum pressure at T = 1/2, Figure 9 and Figure 10f. The maximum reverse flow is now observed at the upper FC, but just for the δ 1 = δ S T D + 15 ° configuration, Figure 9e, then just a minor reverse flow is observed for δ 4 = δ S T D 15 ° , Figure 10e. It is relevant to note the stagnation pressure points appearing alternatively at the MC upper and lower wedges left hand side vertices, Figure 9b, f, which are created by the jet entering the MC and partly impinging at these vertices. These stagnation pressure points are not observed in Figure 10. Finally, at T = 3/4, the jet inside the MC is already moving downwards due to the upper FC pressure increase generated by the MC jet impinging at the MC upper converging wall, see the red area in this particular location. The comparison of the vortical structures forming inside the MC and in the FCs of Figure 9 and Figure 10, serve to further understand the differences between these two FO configurations.
Four videos characterizing the velocity and pressure fields for the maximum and minimum MC internal angles studied are presented in Appendix.
Figure 10. Instantaneous velocity and pressure fields along a full oscillation period divided in four equidistant time steps. δ 4 = δ S T D 15 ° . Entrance 4.
Preprints 119018 g010
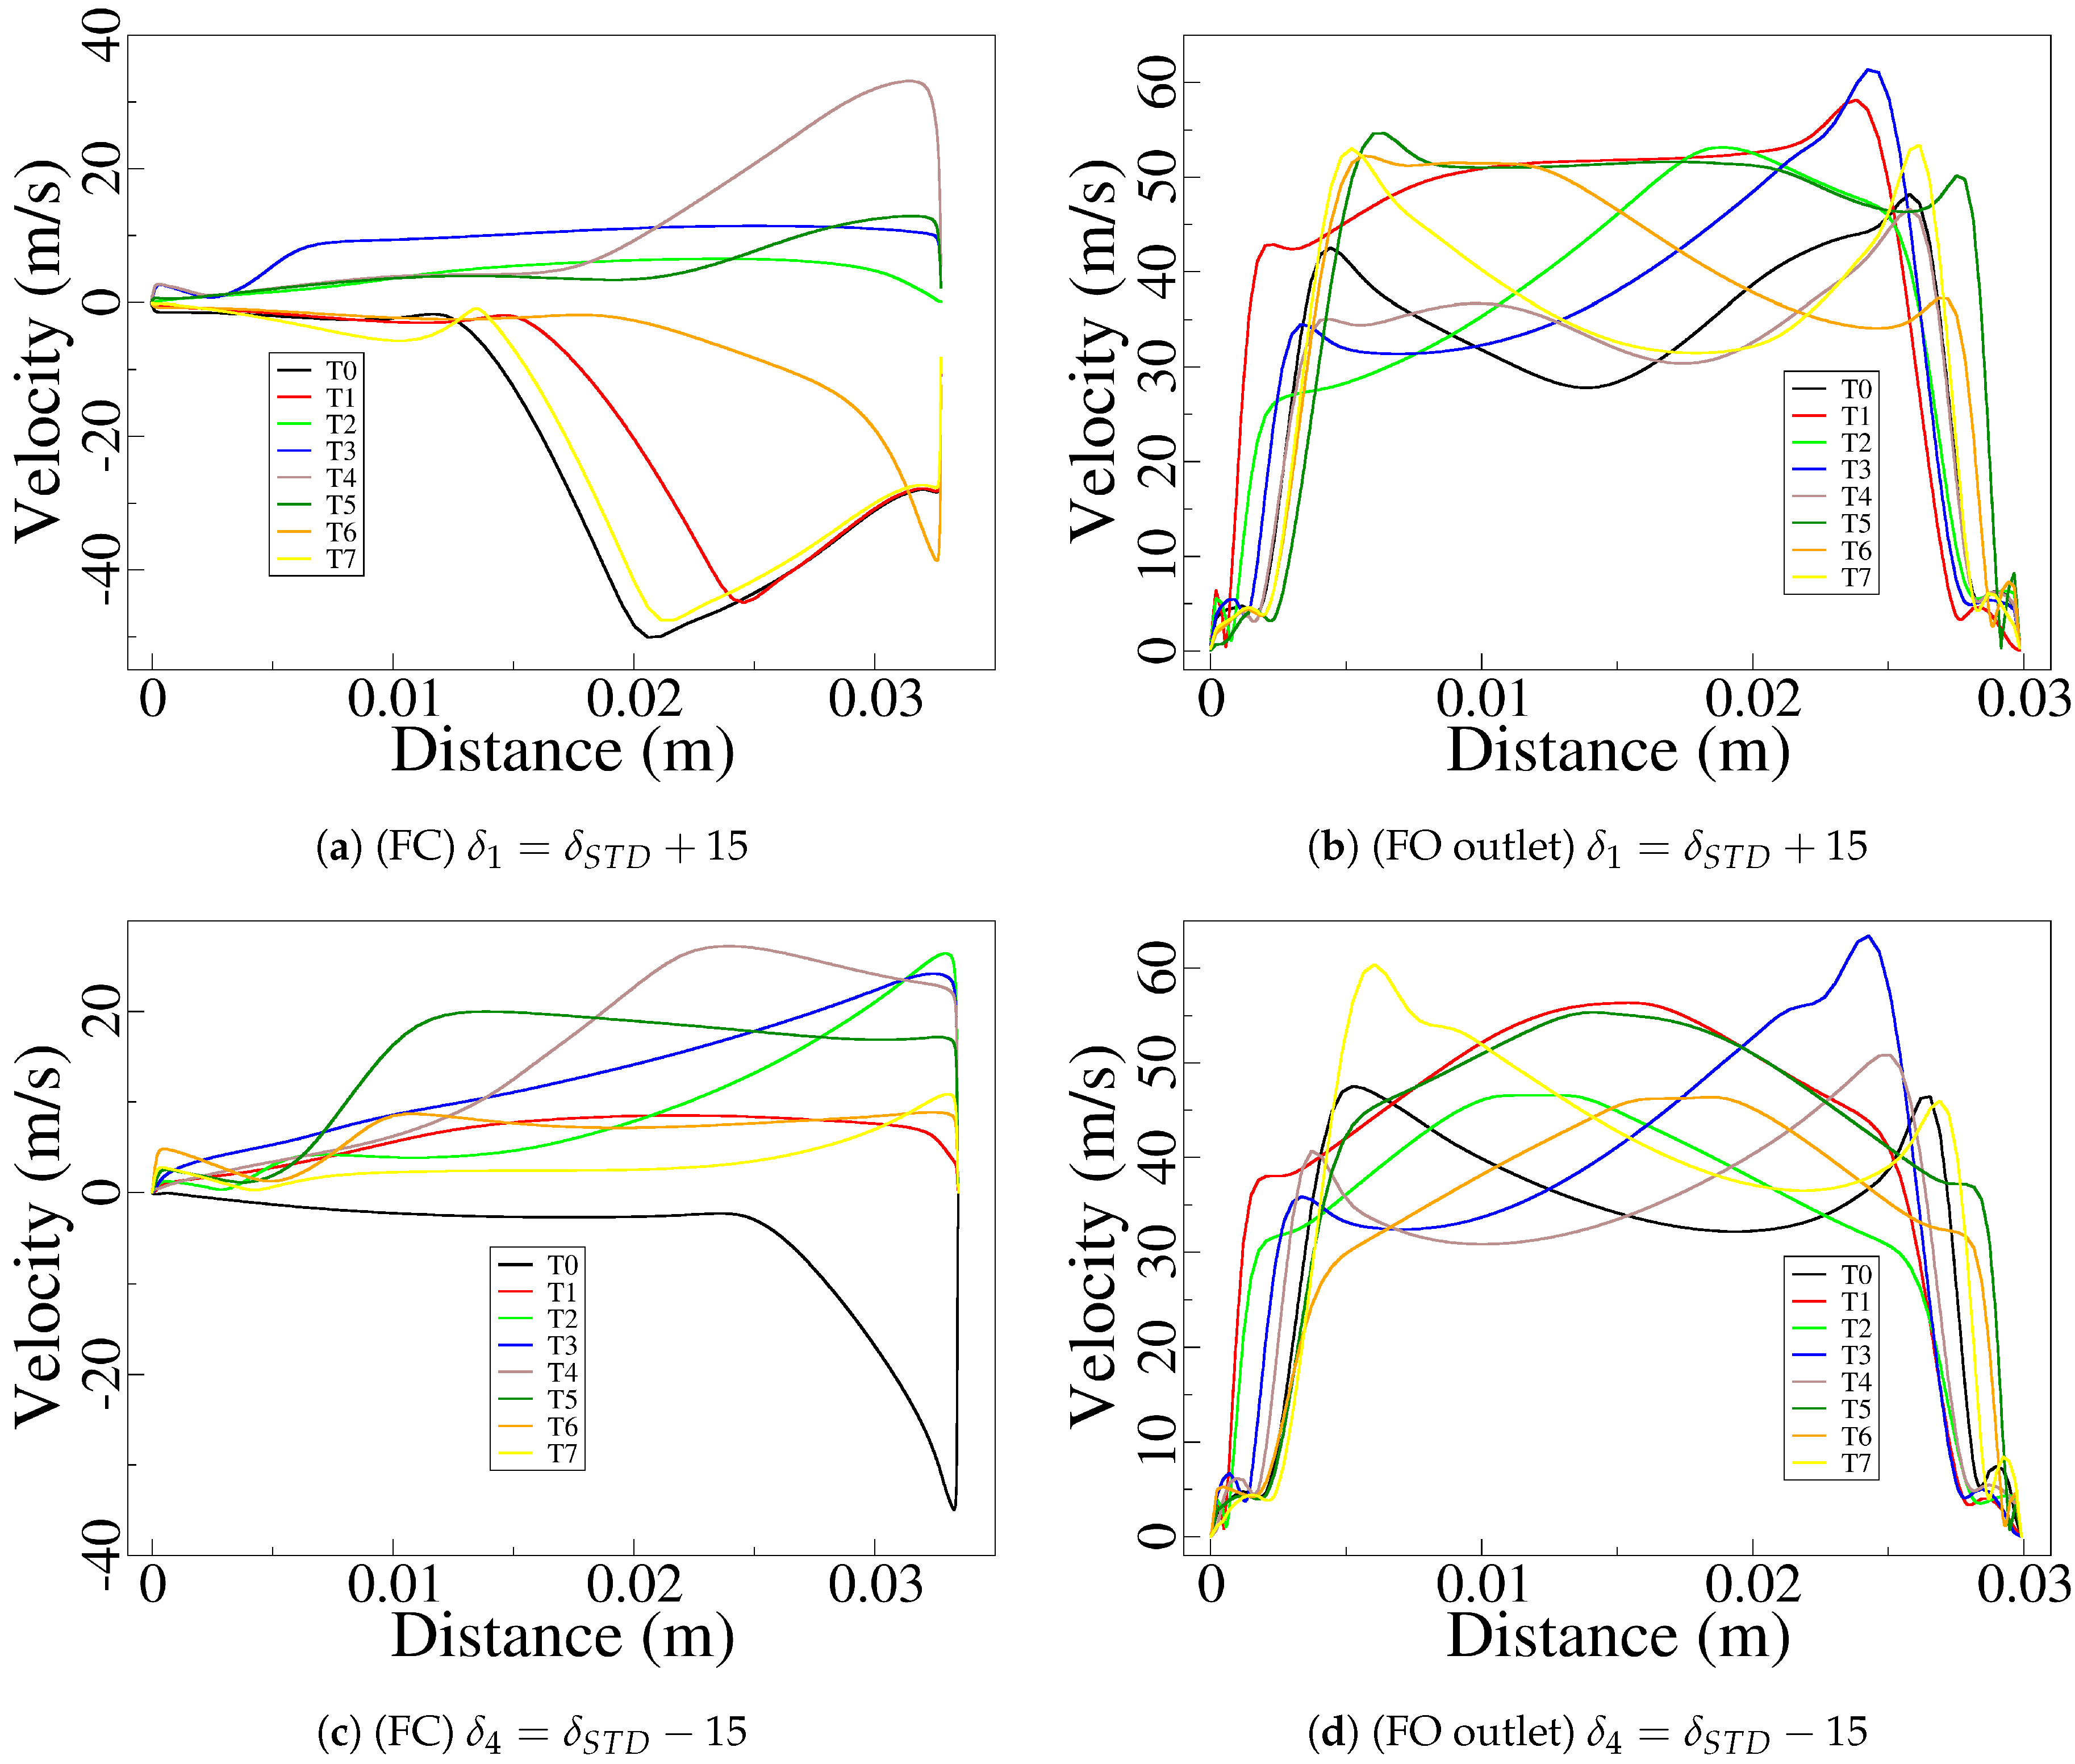
The instantaneous velocity distributions measured at the FO outlet and at the FC lower outlet are presented in Figure 11, where the results from the maximum δ 1 = δ S T D + 15 ° (Entrance 1) and minimum δ 4 = δ S T D 15 ° (Entrance 4), mixing chamber inclination angles are compared. The respective oscillation cycles are divided in eighth equidistant time steps, the first one T0 corresponding to the initial time presented in Figure 9 and Figure 10. When looking at the FO outlet velocity distributions, Figure 11b, d, and comparing them with the ones obtained from the baseline case 3D simulations presented in Figure 6a, it can be concluded that the three graphs show very similar results, the maximum and average velocities are almost identical, around 60 m/s and 40 m/s, respectively. The maximum velocity peaks appear alternatively at both sides of the FO outlet, and despite the fact the pressure field graphs are not presented in Figure 11, it can be stated that, the relation between the pressure and velocity fields show the same trend described when introducing Figure 6, which obeys to the energy equation.
The comparison of the 2D instantaneous velocity distributions at the FC lower outlet, for δ 1 = δ S T D + 15 ° , Figure 11a, δ 4 = δ S T D 15 ° , Figure 11c, and the baseline 3D results, Figure 6c, it clearly shows the existence of FC reverse flow in all three cases. As previously observed, the FC reverse flow decreases with the MC inlet angle decrease, in fact for the smallest inlet angle evaluated, the maximum reverse flow velocity magnitude is about 35 m/s and appears for a very small fraction of time, about 1/8 of the oscillation cycle, note that such velocity magnitude is about 50 m/s for the maximum MC angle considered and reverse flow exists for half oscillation cycle. The comparison of the reverse flow from the baseline case 3D results with the 2D one gathered from the maximum and minimum MC angles evaluated, shows that the 2D-CFD results overestimate the maximum reverse flow velocity, but the time period at which reverse flow exists is quite properly determined. Note that the for the 3D baseline case the existence of reverse flow last about 3/8 of the oscillation period, which is between the time for the maximum MC angle, 50% of the cycle, and the minimum FC angle, 1/8 of the oscillation period. As already observed in the 3D baseline case simulations, for the 2D ones presented in Figure 11a, c, the velocity distribution associated to the fluid coming from the FC outlets and entering the MC is much more uniform than the reverse flow one, being the maximum velocities associated also smaller.
Figure 11. Feedback channel and fluidic oscillator outlet instantaneous velocity profiles at eighth equi-distant time steps taken along a full oscillation cycle. Feedback channel lower outlet velocity profiles, case δ 1 = δ S T D + 15 (a), and case δ 4 = δ S T D 15 (c). Fluidic oscillator outlet velocity profiles, case δ 1 = δ S T D + 15 (b), and case δ 4 = δ S T D 15 (d).
Preprints 119018 g011
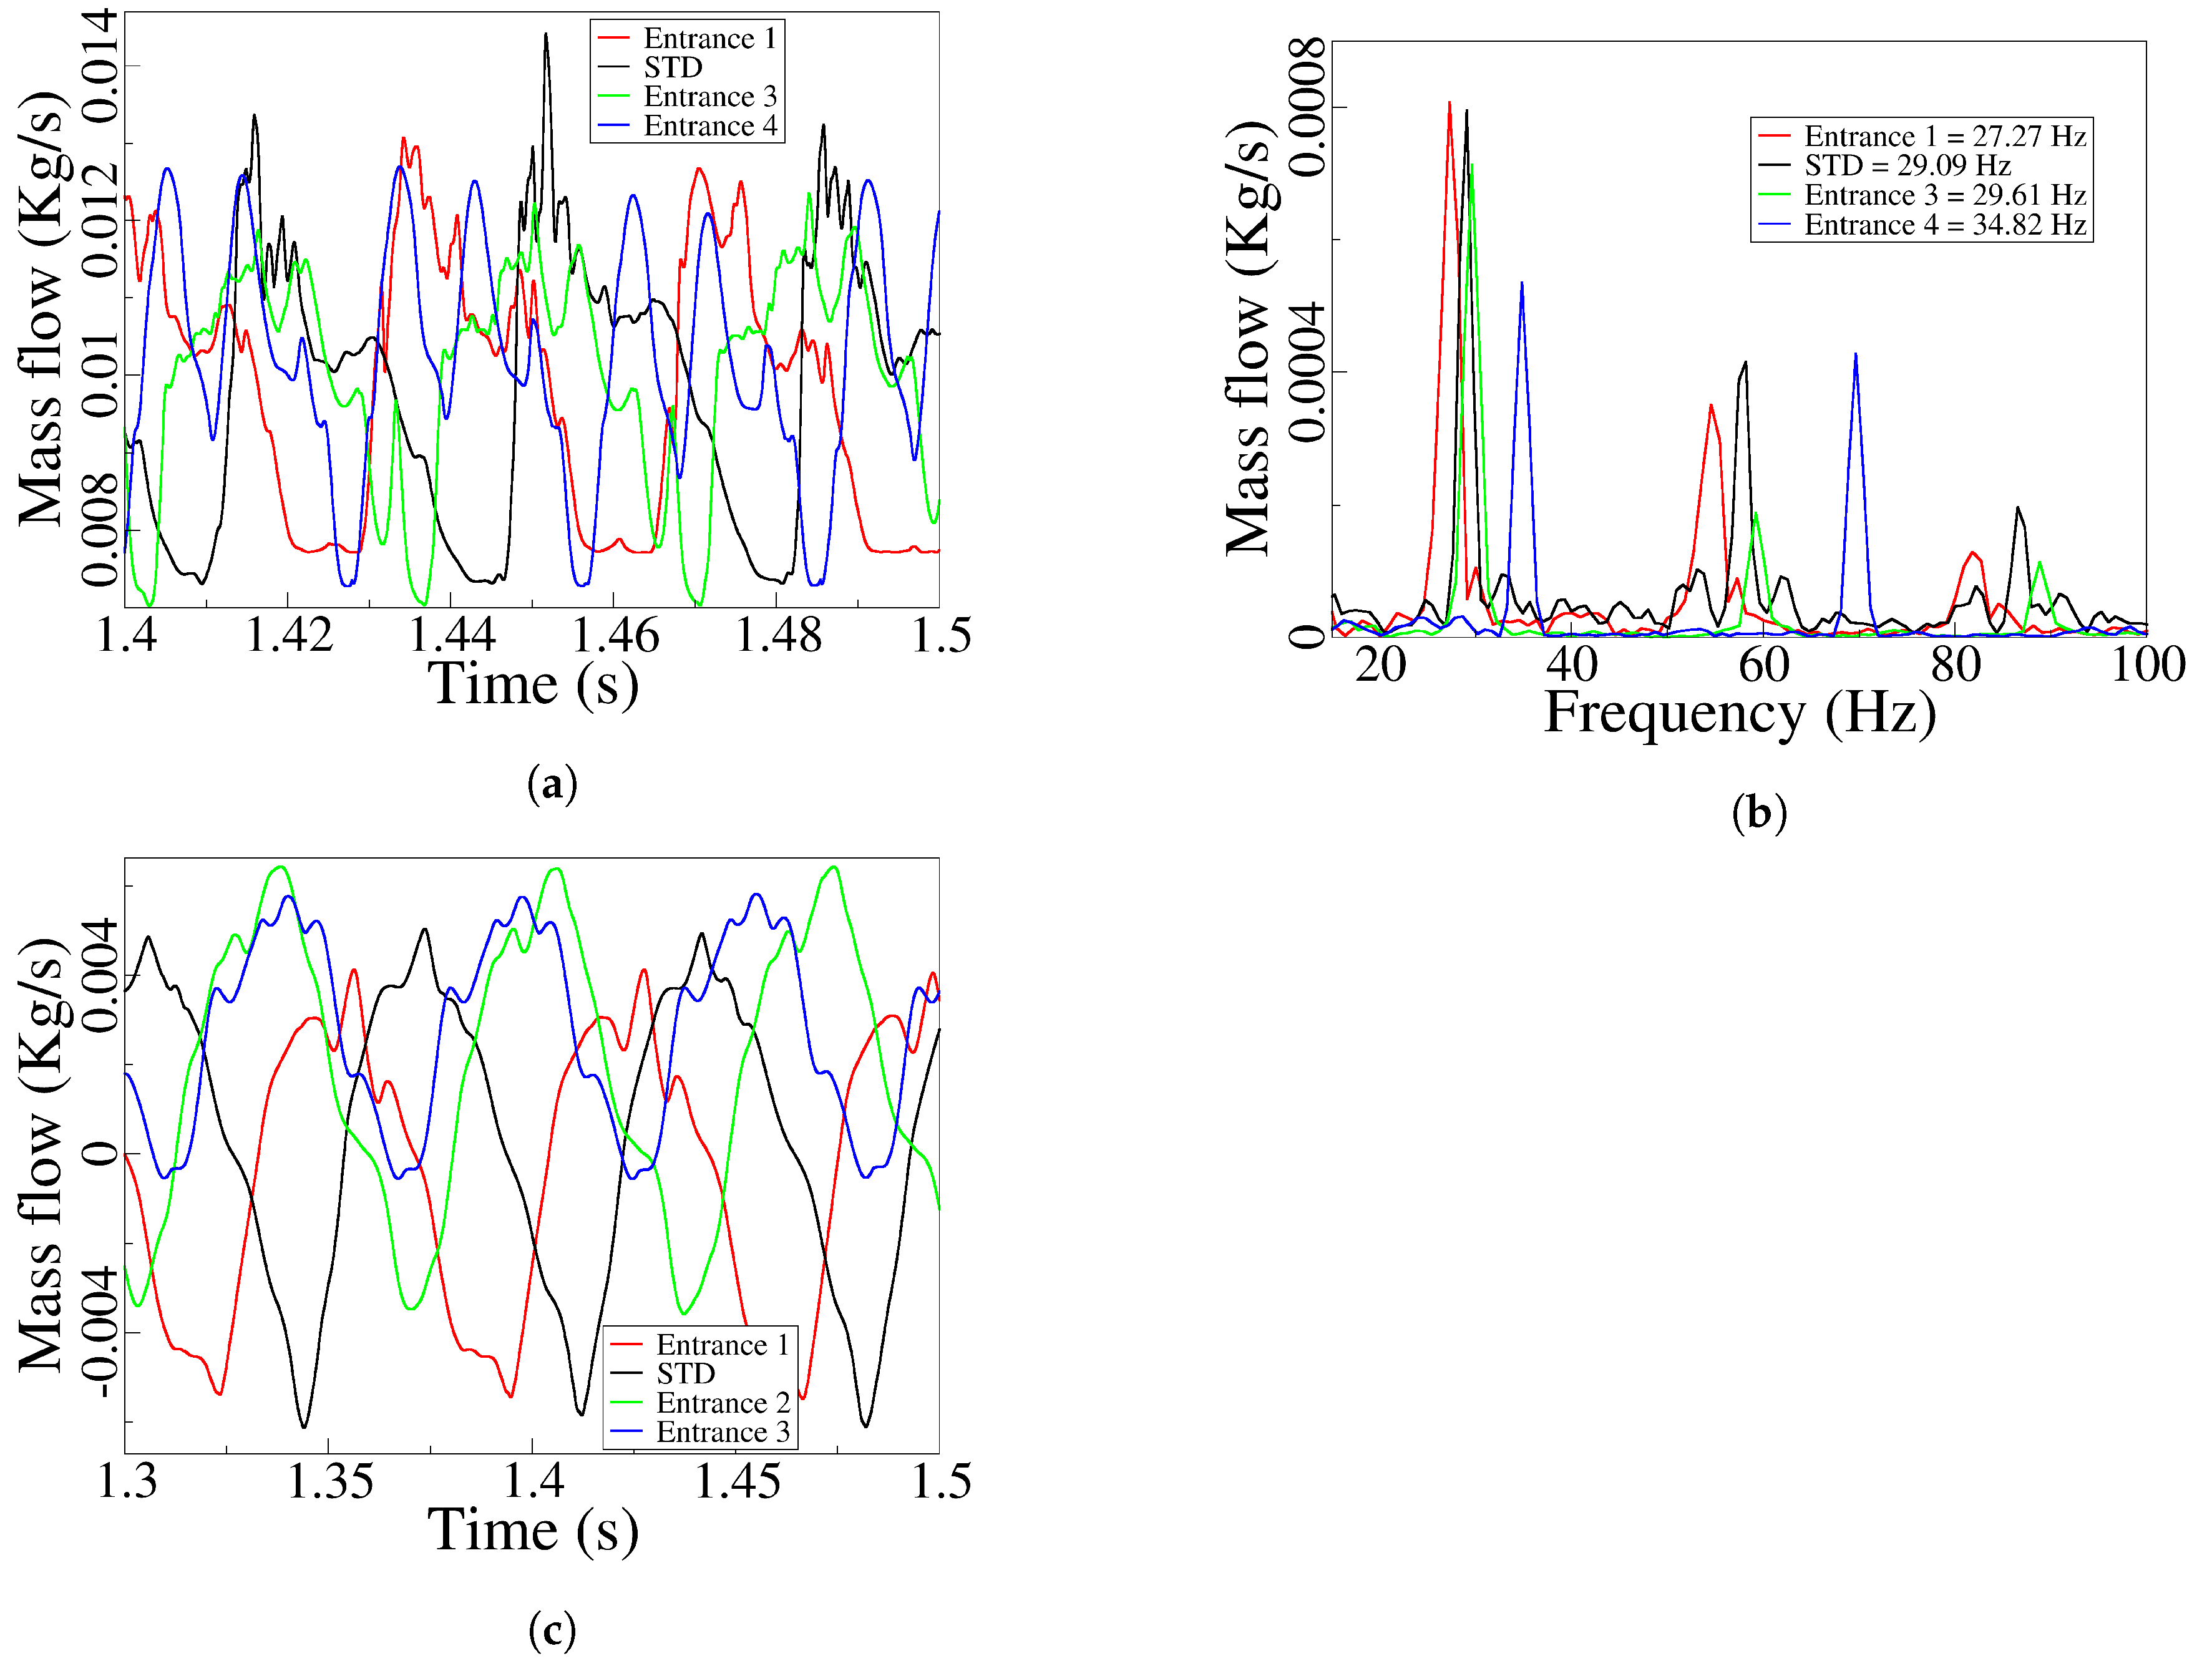
Until this point, we have studied the main generic effects of the flow inside the MC, at the FO outlet and the FC outlet, for the Entrance 1 and Entrance 4 configurations. From now on, the analysis of the four MC angular configurations is presented and discussed. For the four MC angles studied, the FO outlet mass flow dynamics and their corresponding frequency is presented in Figure 12. As expected, the average mass flow remains constant for all the four MC angles considered, the peak to peak amplitude tends to decrease with the MC internal angle decrease, a maximum variation of about 18% is observed between the maximum an minimum amplitudes evaluated, Figure 12a. In reality, the main effect on the MC angular modification is observed when evaluating the FO outlet jet oscillation frequency, then it keeps increasing with the MC inlet angle decrease (MC entrance width increase), Figure 12b. For entrance 1, δ 1 = δ S T D + 15 , the FO frequency is of 27.27 Hz and increases to 34.82 Hz when entrance 4, δ 1 = δ S T D 15 , is considered. It must as well be highlighted that as the internal angle decreases the FC reverse flow also decreases Figure 12c, therefore the FO outlet frequency increase can as well be associated to the FC reverse flow decrease. And this also applies when comparing the 3D and 2D simulations in Figure 8, where for the same internal dimensions the 3D case was generating higher frequencies than the 2D one, being the 3D FC reverse flow much smaller than the two dimensional case one.
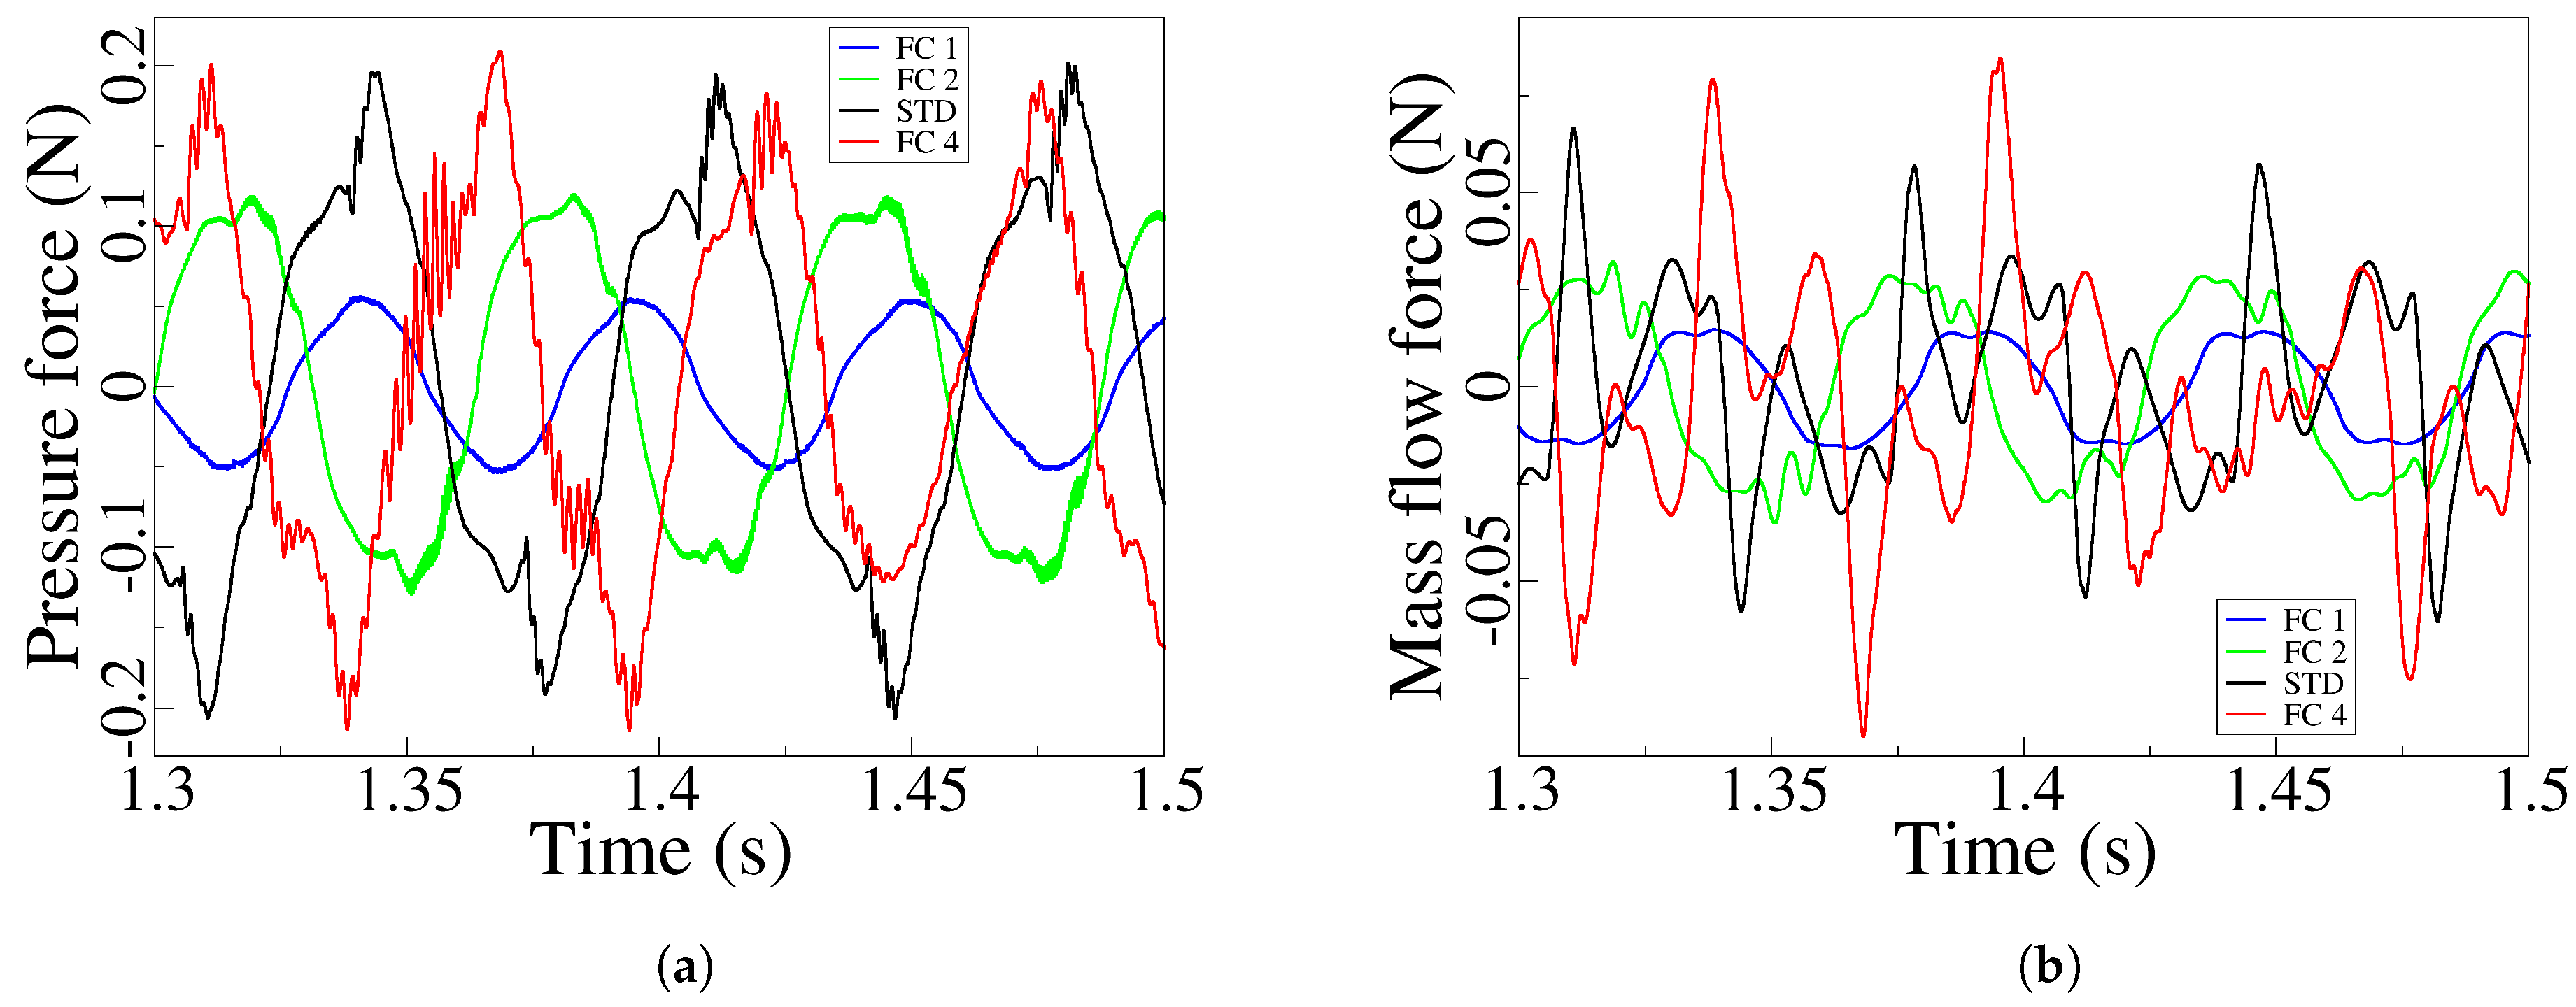
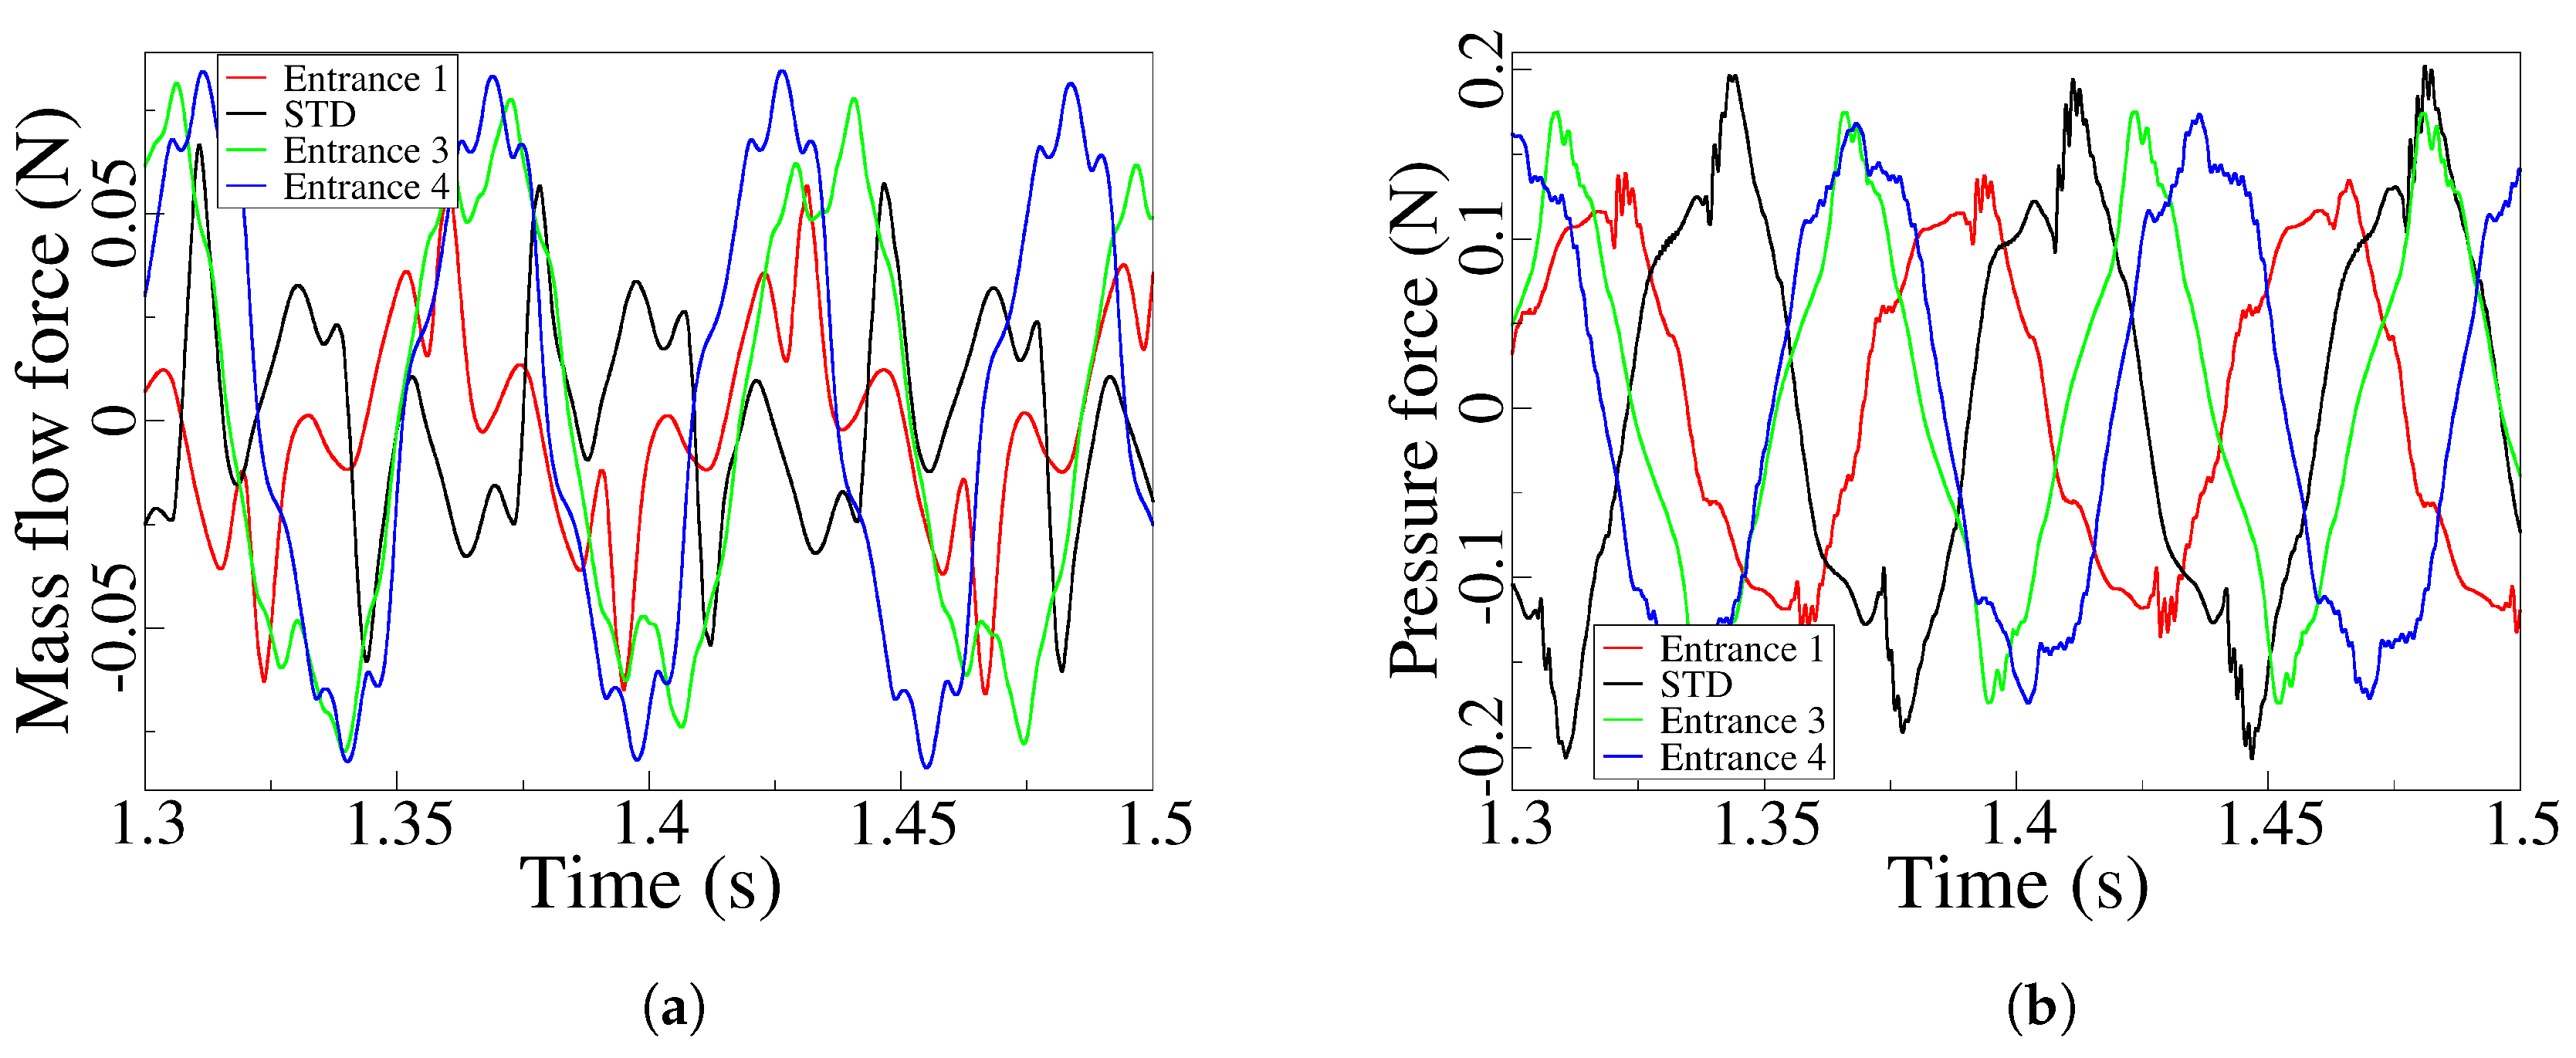
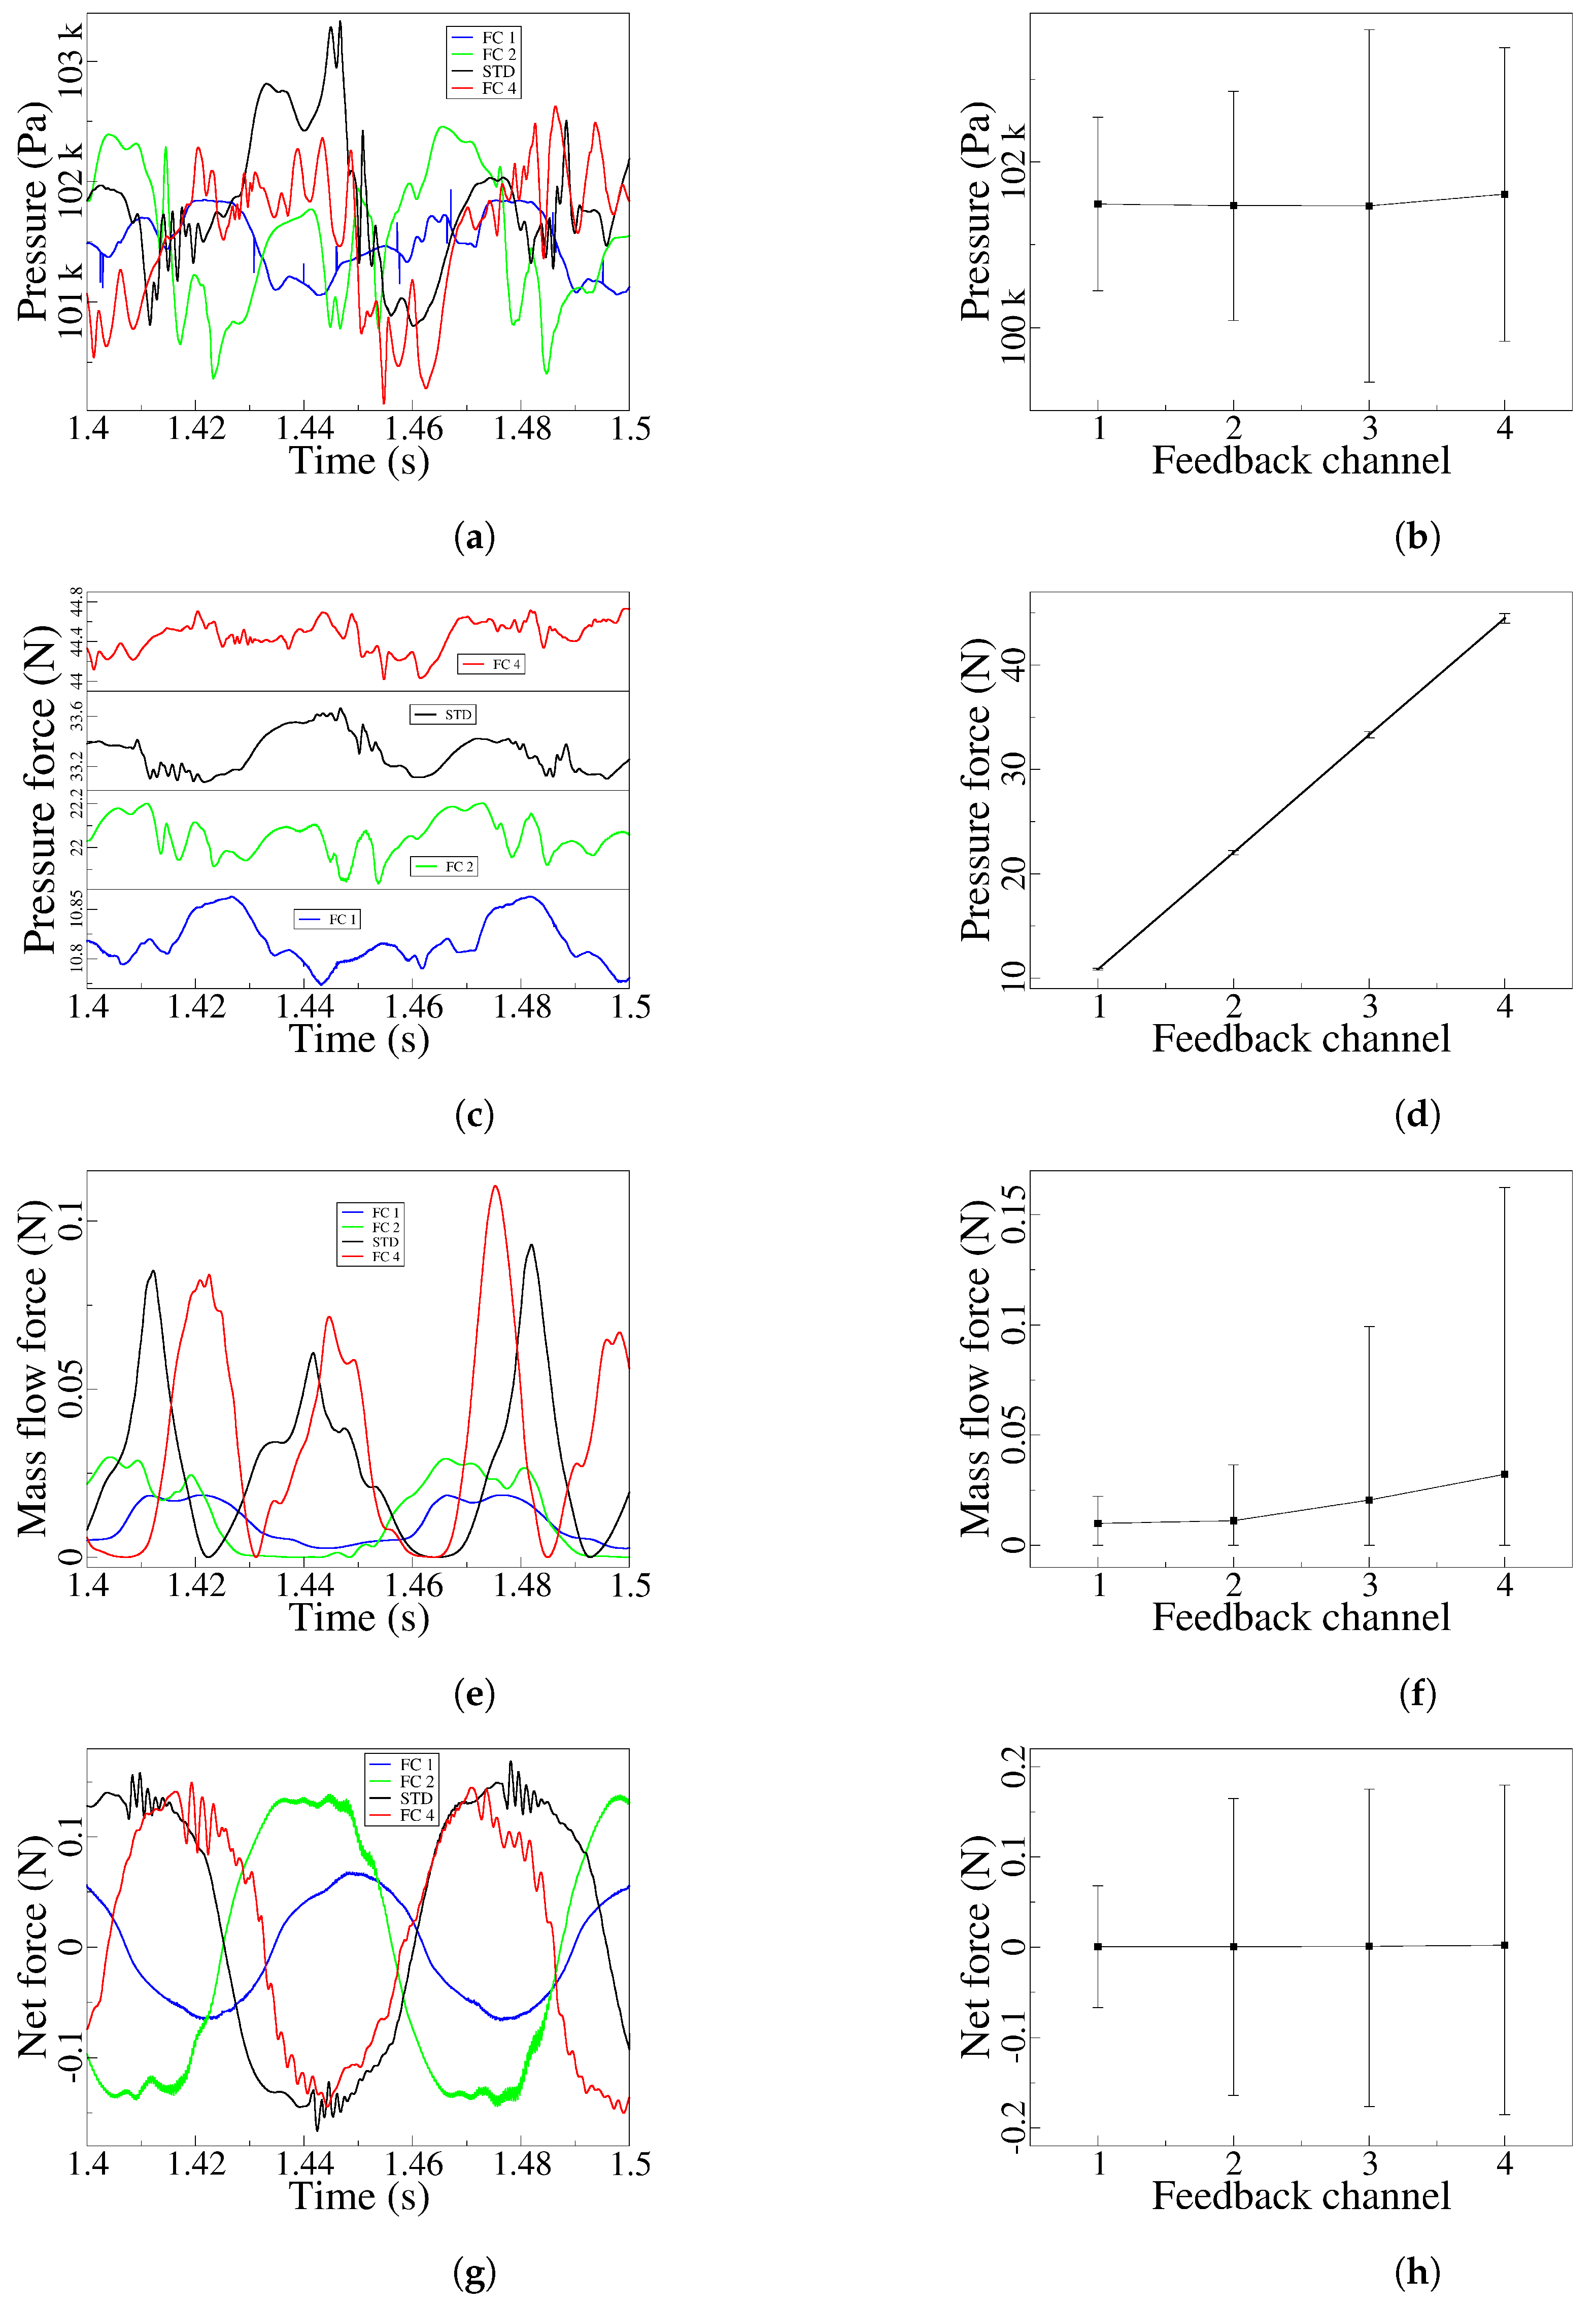
One of the key points when willing to understand the performance of any FO is the study of the origin of the self-sustained oscillations. In order to start understanding the time dependent forces acting on the jet as it enters the MC, Figure 13 introduces for the four MC inlet angles studied, the unsteady net mass flow and pressure forces acting on the jet and considering both FC outlets. Which corresponds to the instantaneous application of the first and second terms of Figure 16 on both FC outlets. The first thing to notice is that, the maximum mass flow forces magnitude is about 35% of the pressure forces one.
The peak to peak amplitude of the net mass flow forces increases with the MC inlet angle decrease. The same happens for the net pressure forces although it appears that for the STD case the peak to peak amplitude is slightly larger than for the rest of the cases, note as well that for Entrance 3 and Entrance 4 cases, the unsteady pressure amplitude remains the same. The increase of the net mass flow forces magnitude is directly linked with the increase of the FC mass flow measured at the FC outlet, while the pressure force is mostly connected to the dynamic stagnation pressure increase measured at the MC outlet converging walls, which in turn depends on the jet inside the MC impinging on such converging walls. Therefore a higher peak to peak amplitude it indicates that the jet is impinging more perpendicularly to the MC converging walls, rising the pressure along the corresponding FC. When comparing the pressure and mass flow forces from Figure 13a, b, it is observed a phase lag between both parameters. It seams the mass flow forces actuate about 0.02 seconds after the pressure ones. This delay is likely to be the time needed for the mass flow to travel from the FC inlet to the FC outlet.
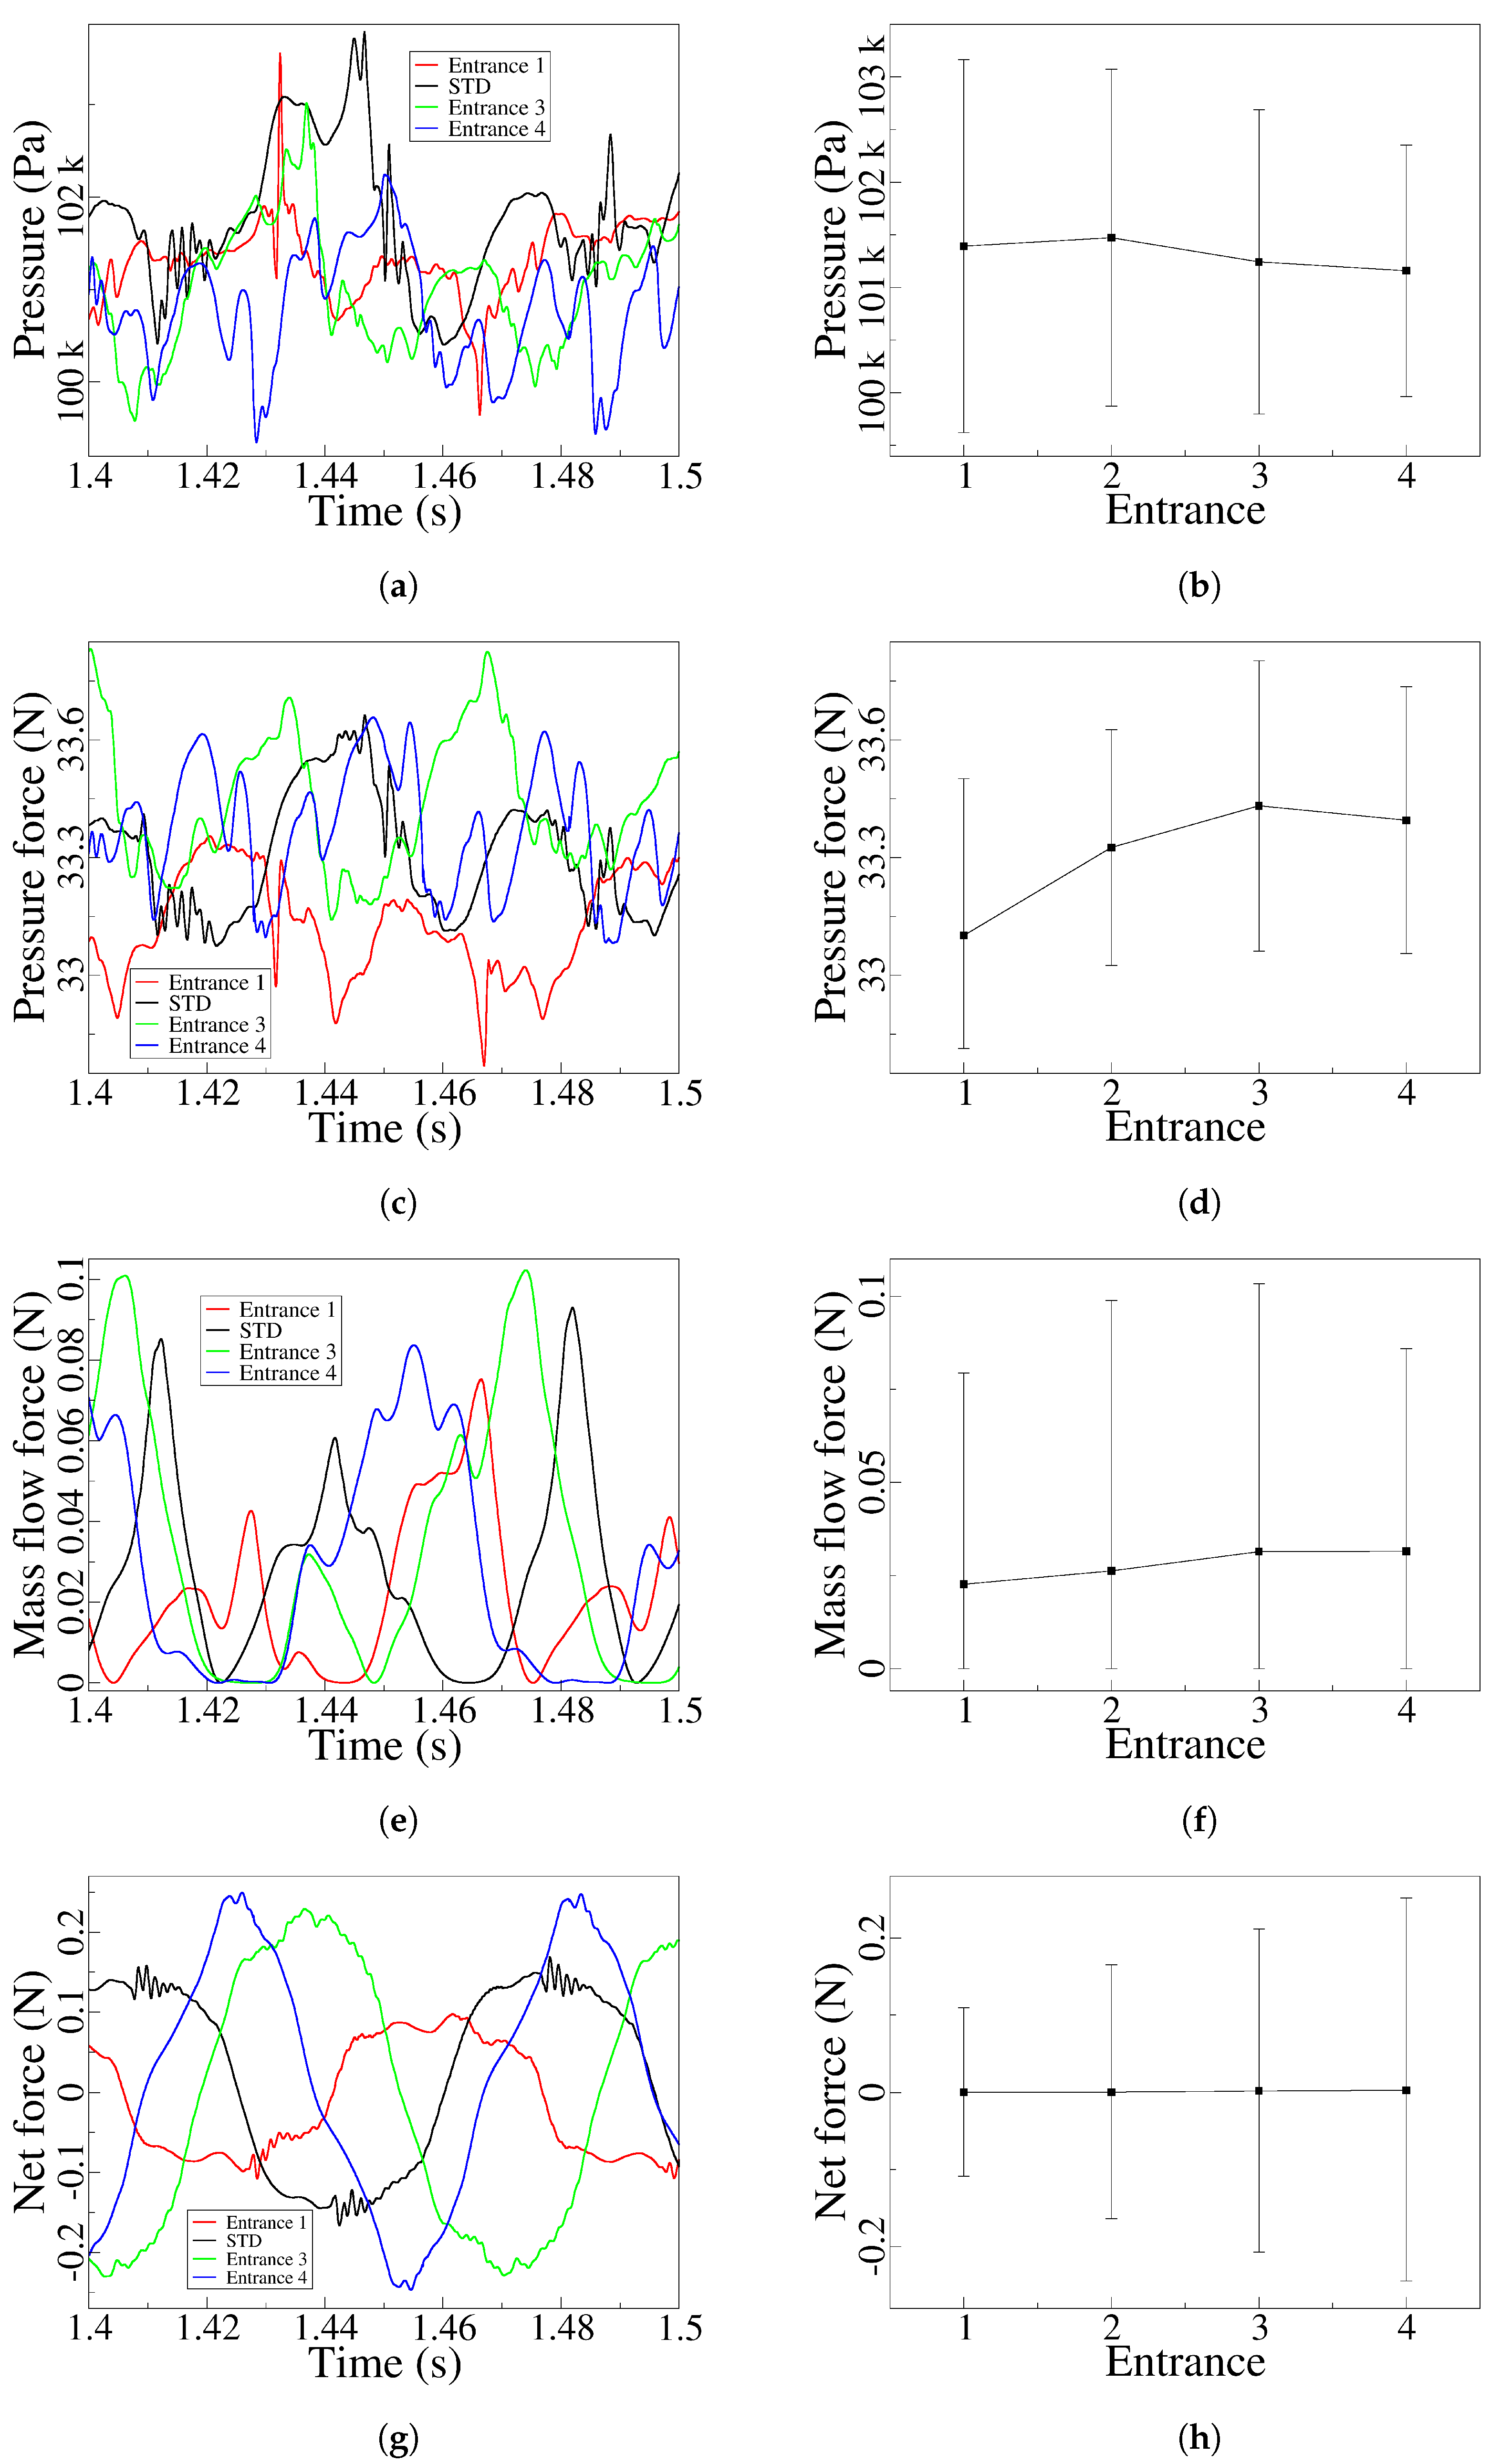
The left hand side column of Figure 14, respectively represents for the four different MC angular positions evaluated, the stagnation pressure unsteady value measured at the MC lower converging wall, the time dependent pressure and mass flow forces measured at the lower FC outlet, and the instantaneous net force evaluated on both FC outlets. The graphs introduced on the right hand side column, characterize the time averaged and peak to peak amplitude of the respective time dependent values introduced on the left hand side column. Perhaps the first thing to point out is that, there is no a direct link between the stagnation pressure variations measured at the MC lower converging walls and the rest of the parameters, as previously noted in [1] for different Reynolds numbers. In reality, we must consider that when modifying the MC internal angle, we are modifying the MC entrance width as well as the FCs outlet width, also the FC length is being modified. This combined effect is what makes Figure 14 particularly difficult to follow. When analyzing the stagnation pressure evolution at the MC lower converging wall, Figure 14a, b, it is observed that its time averaged value as well as the peak to peak amplitude, tends to decrease with the MC internal angle decrease, compare Entrance 1 and Entrance 4 results. But this trend is not followed by the pressure forces measured at the lower FC outlet, Figure 14c, d, since the time averaged value of such pressure forces initially grow and finally suffer a small decrease. This evolution is mostly due to the FC outlet area variation generated when going from Entrance 1 to entrance 4, then the initial FC outlet area increase appearing between Entrance 1 and 2, is slightly smaller between Entrance 2 and Entrance 3, becoming almost negligible between Entrance 3 and 4. In fact, the pressure force decrease observed in Entrance 4, Figure 14c, d, is due to the time averaged stagnation pressure decrease observed at the MC lower converging wall, Figure 14a, b. From the analysis of the mass flow forces acting on the lower FC outlet, Figure 14e, f, it can as well be observed the change of tendency between Entrance 3 and 4.
The time averaged as well as the peak to peak amplitude keeps growing from Entrance 1 to Entrance 3, mostly due to the FC outlet area increase, the averaged value suffers a negligible variation when moving from Entrance 3 to Entrance 4 and the peak to peak amplitude decreases. The peak to peak values are related with the maximum/minimum FC mass flow values presented in Figure 12c, the higher the peak values the higher the mass flow forces amplitude. From the observation of Figure 14c and e, it is clear that pressure forces on a FC outlet are over two orders of magnitude higher than the mass flow forces, which makes the jet oscillations particularly depended on pressure variations. The overall resulting forces acting on the jet as it enters the MC are introduced in Figure 14g, h. The peak to peak amplitude of these forces increase as the MC angle decreases. Note that, although the time averaged stagnation pressure at the MC converging wall decreases when moving from Entrance 2 to Entrance 3 and Entrance 4, Figure 14b, the maximum overall forces on the jet keep increasing.

6.4. Feedback Channel Dimensional Modifications (2D-CFD)

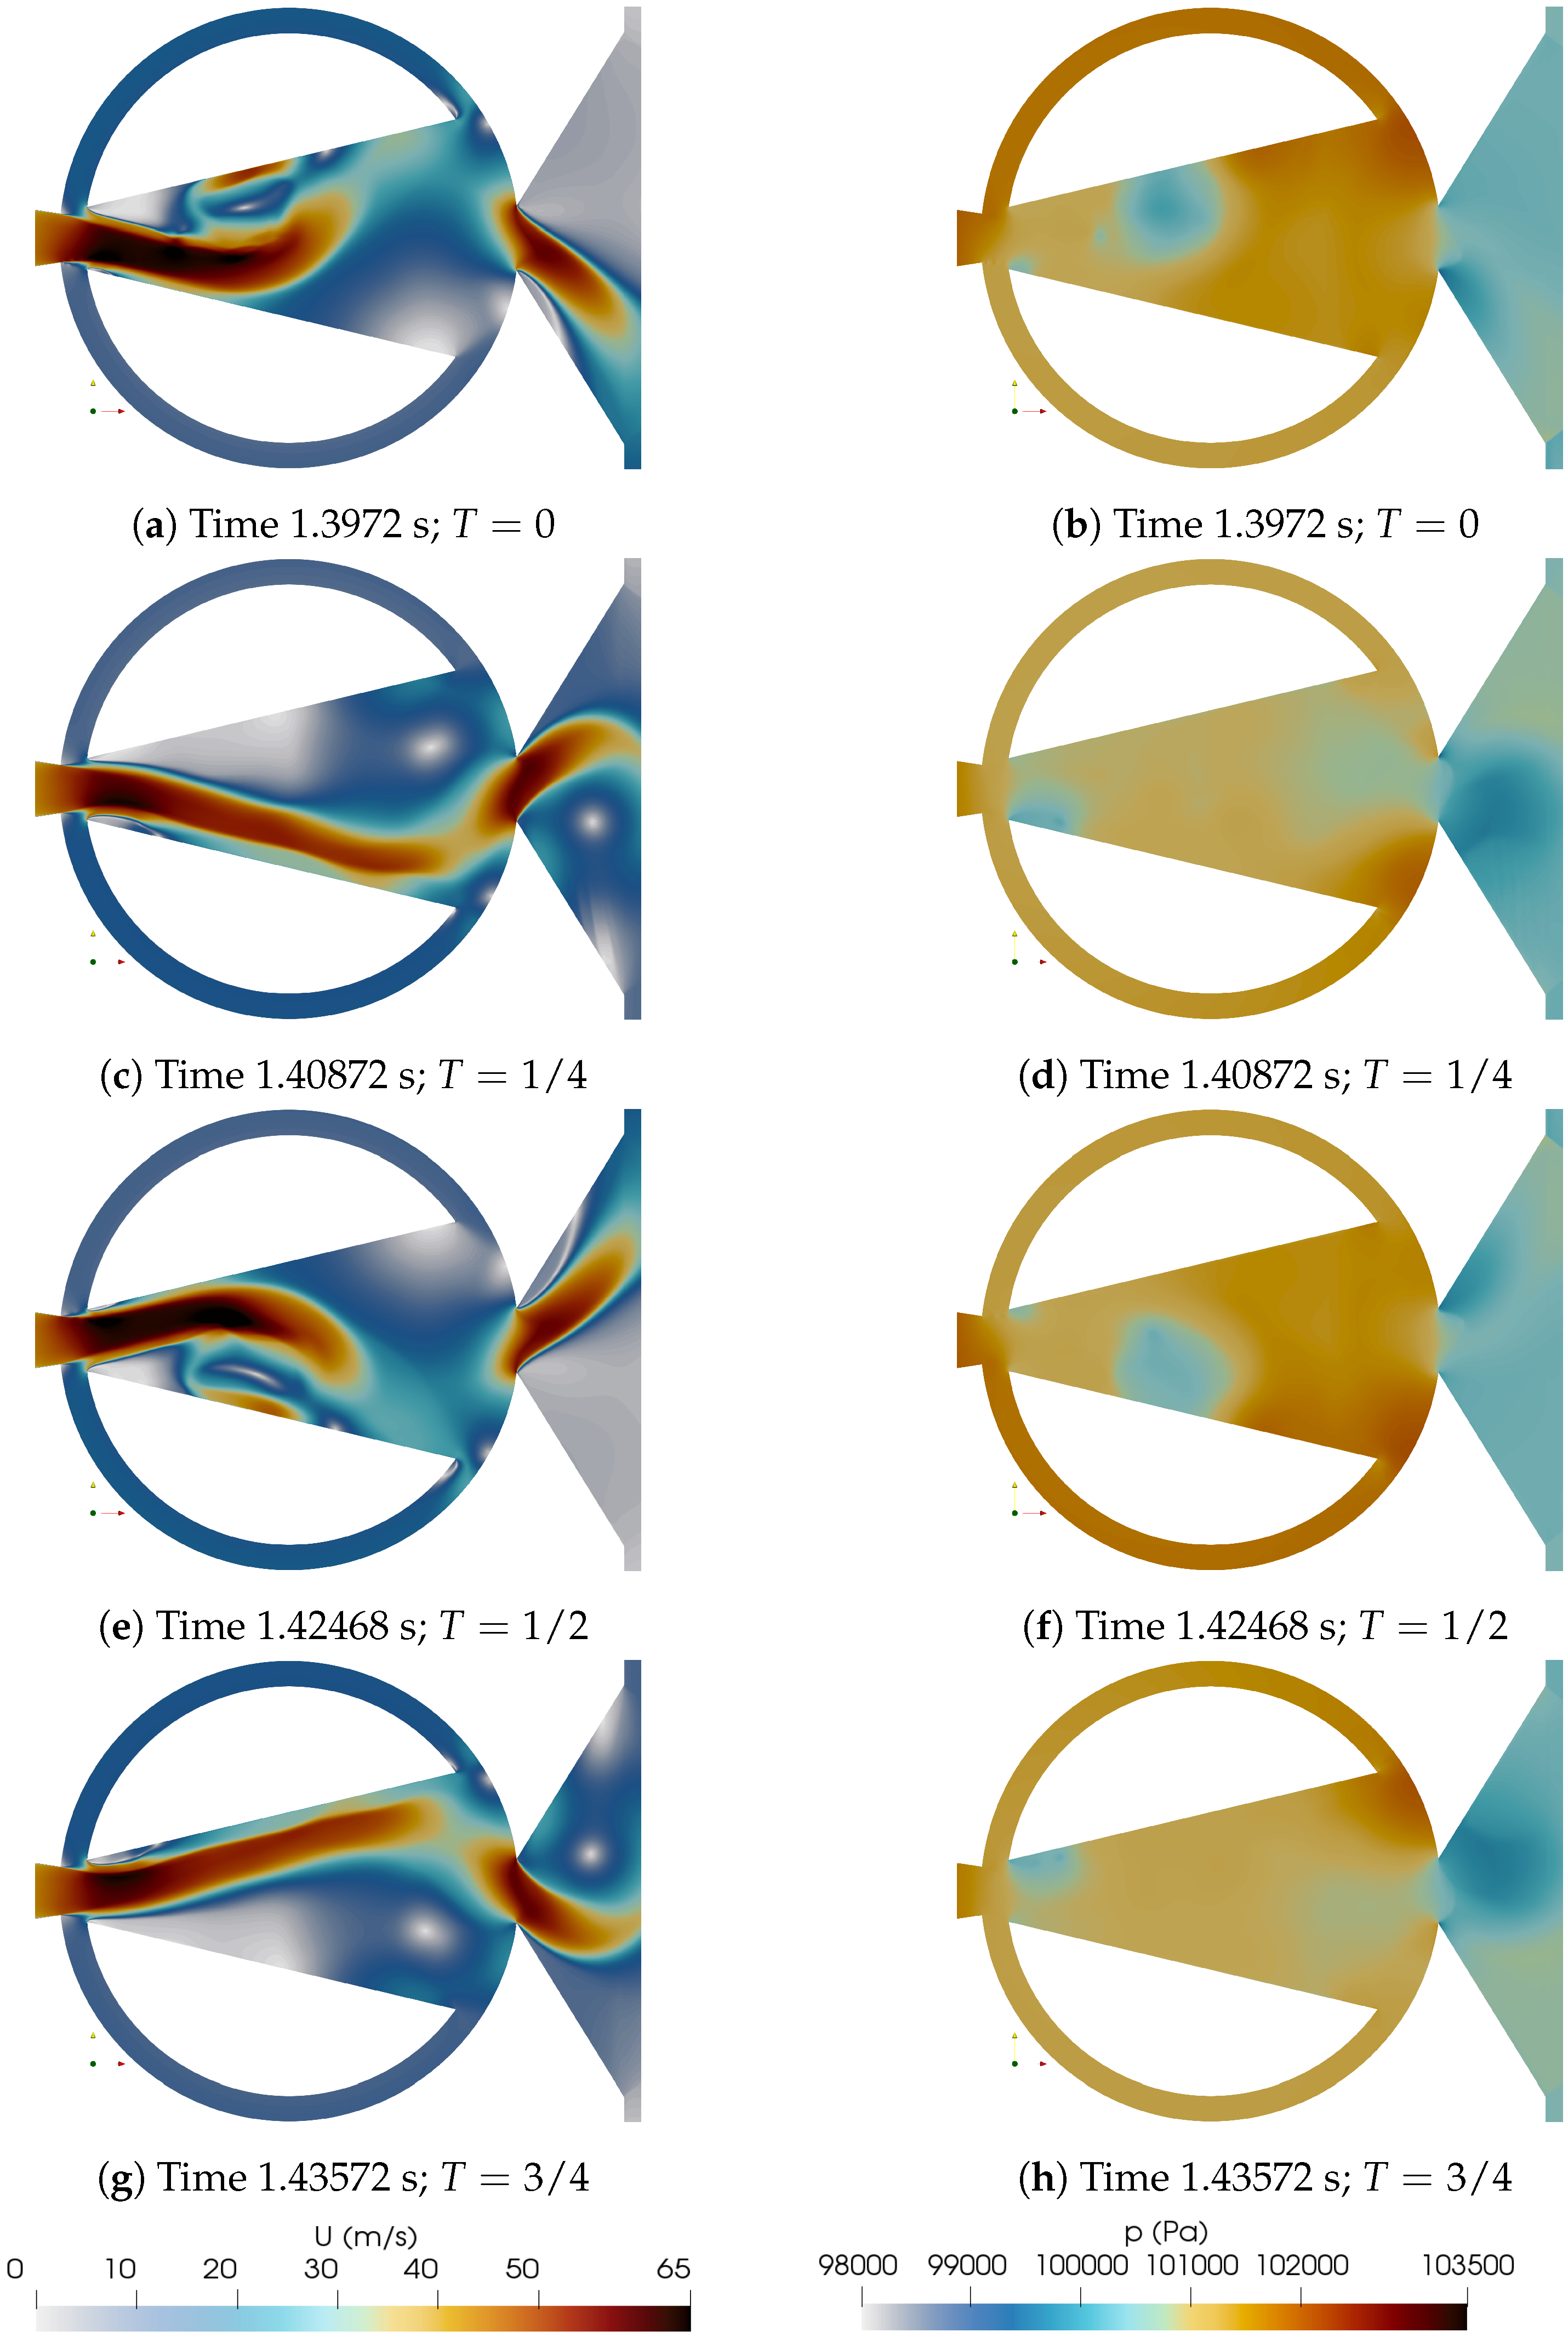
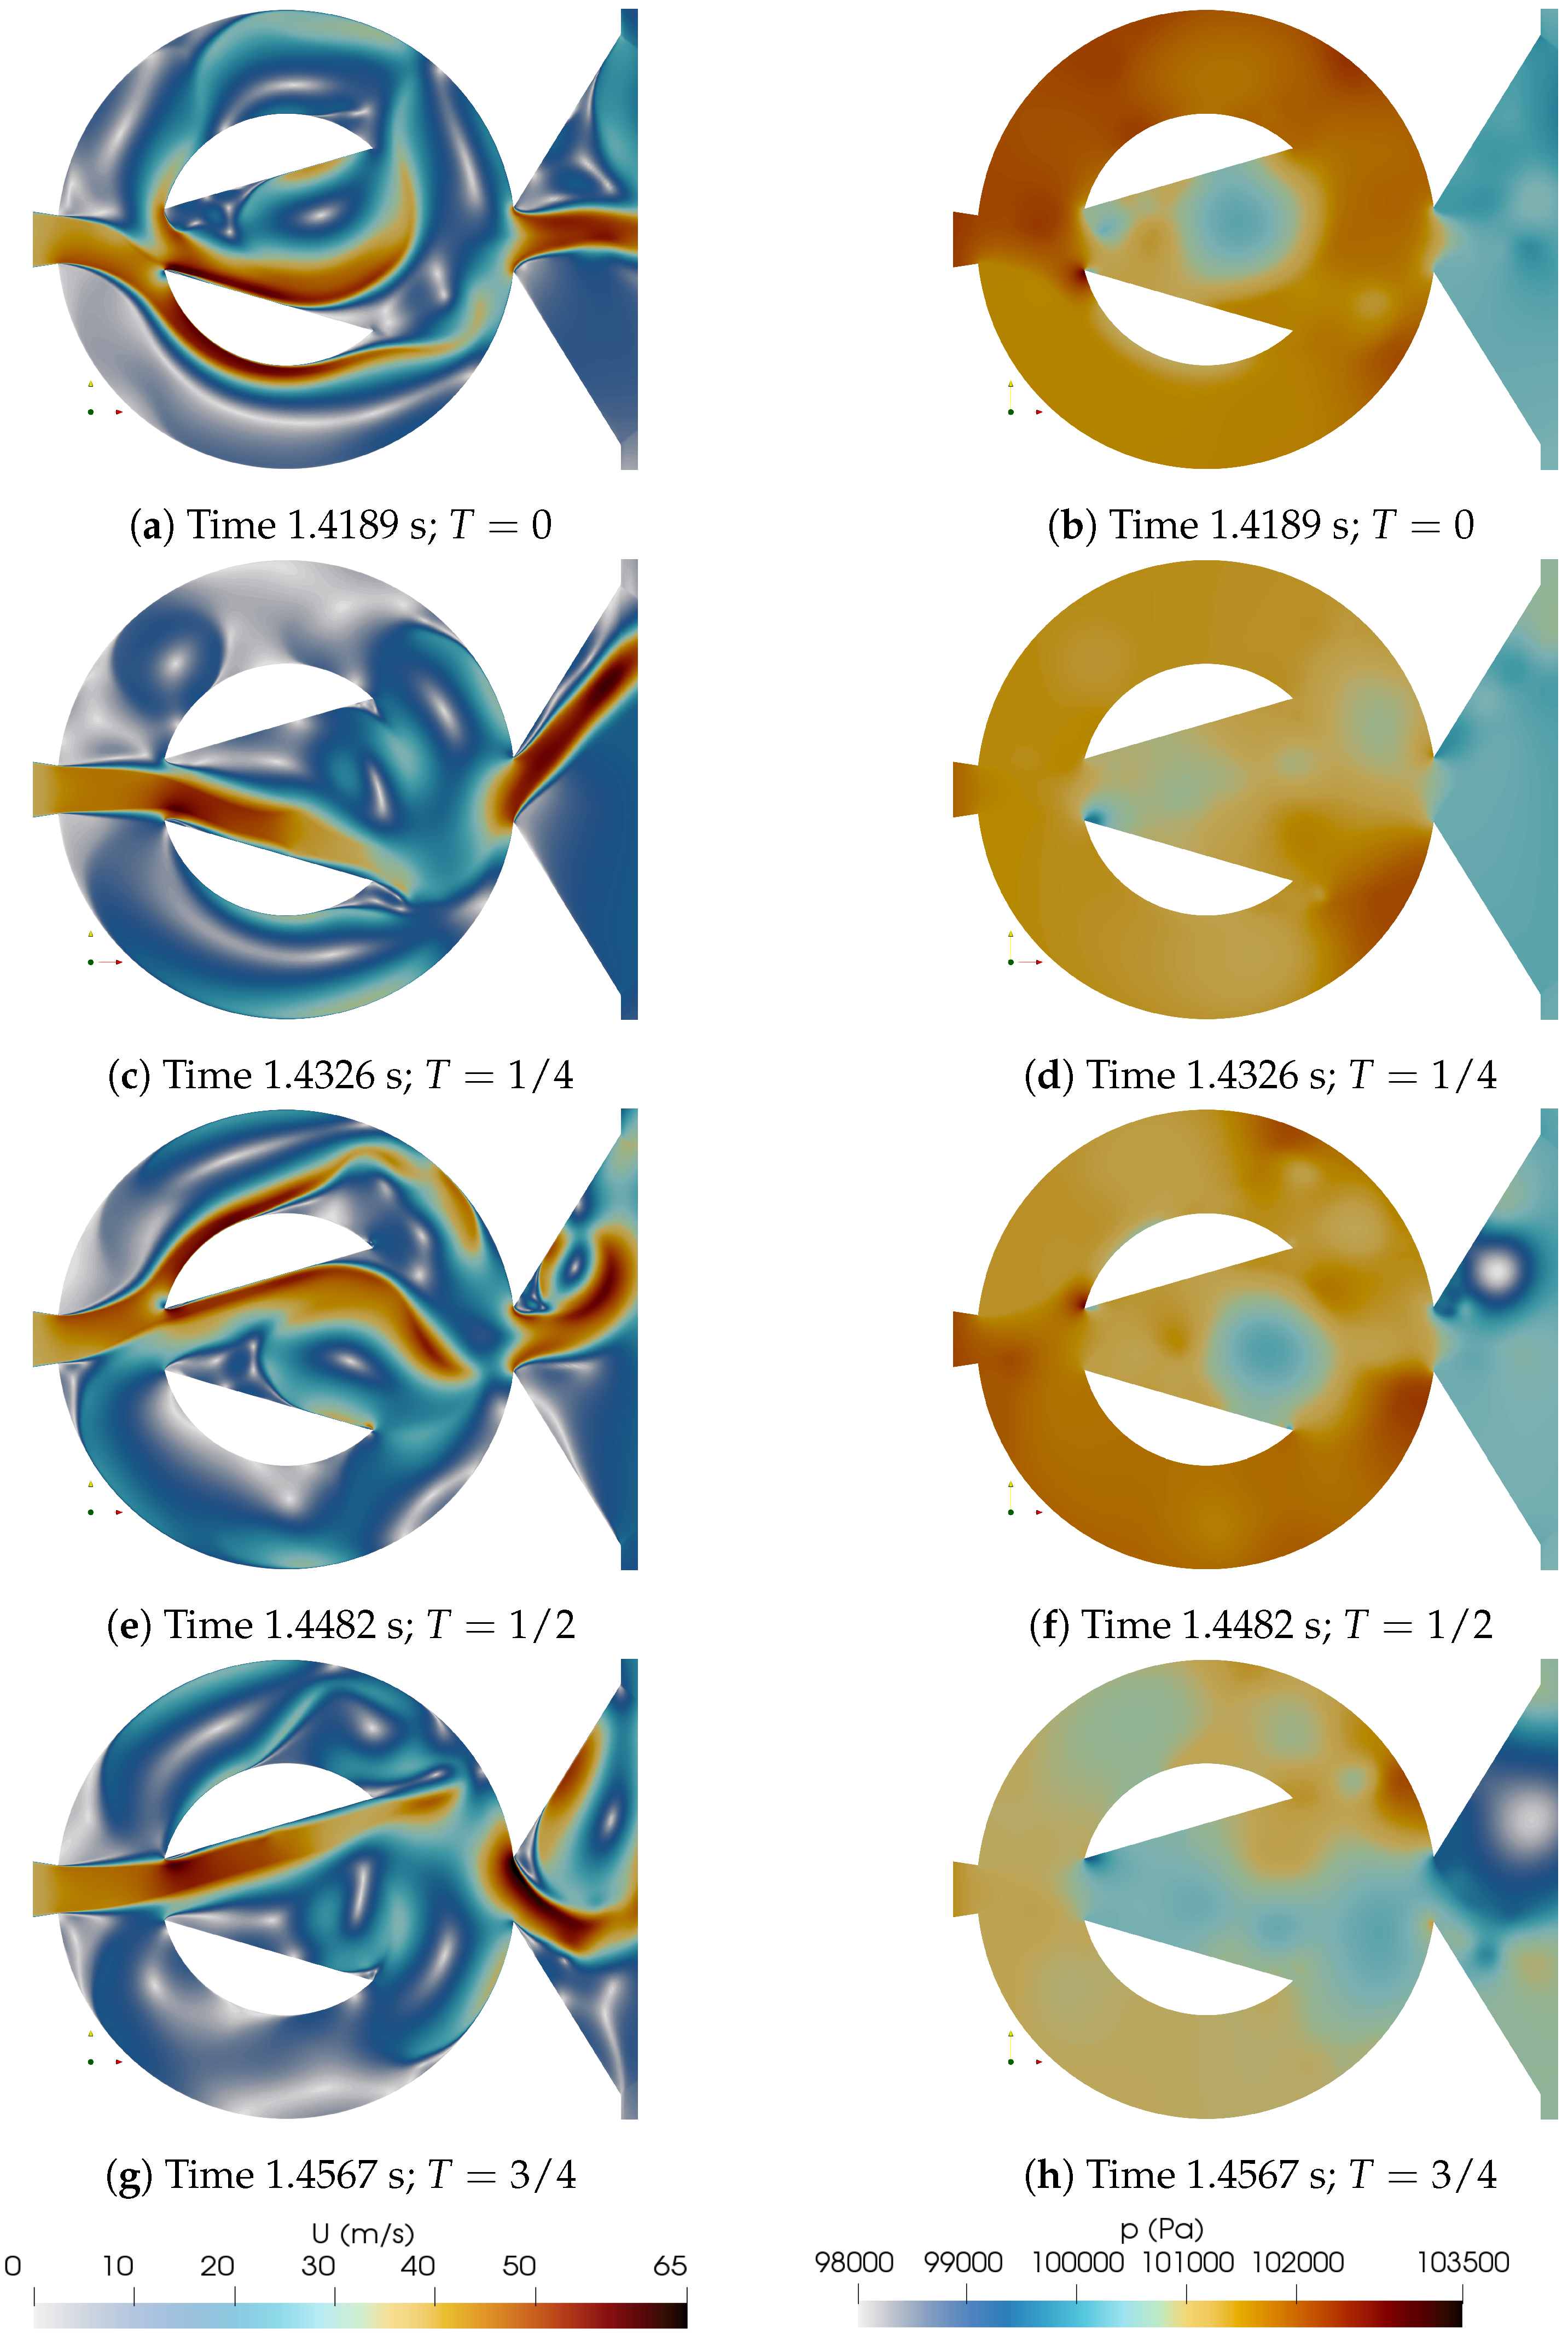
Pressure and velocity fields for the minimum FC1 and maximum FC4 feedback channel widths evaluated are presented in Figure 15 and Figure 16, respectively. In both figures, the respective oscillation cycle is divided in four equidistant time steps. The first thing that catch the eye is that for the smallest FC width there is no FC reverse flow, while a large reverse flow is observed in the FC4 case, in fact for this case, large flow in both FC directions is clearly observed. The jet inside the MC in FC1 is more uniform, the fluid follows the long MC internal walls. On the other hand a considerable random movement of the jet inside the MC is observed in FC4, the wide FC width favours such randomness. Pressure fields are very similar in both cases, but due to the major stability of the jet for case FC1, the periodic vortical structures forming inside the MC are much smoothly defined in this particular case. Four videos presenting the velocity and pressure fields for the minimum and maximum FC widths evaluated are provided in Appendix.
The major flow stability observed in the FC1 velocity fields, is further noted when evaluating the net pressure and mass flow forces acting on the jet as it enters the MC, Figure 17a, b, respectively. See that the net pressure force curve for the FC1 case is much smoother than the rest of the curves, see as well that the peak to peak amplitude is the smallest one from the four cases evaluated, such amplitude grows with the FC width, although for the largest FC width, FC4, is becoming much more random. Clearly for the maximum FC width studied, the degree of freedom of jet inside the MC is too large, generating a higher degree of oscillation randomness observed in the scattered pressure curve. Similar conclusions are obtained when evaluating the net mass flow forces acting on the jet at the FC outlets, the peak to peak amplitude grows with the FC width and suffer a considerable increase at FC4, increasing as well the randomness associated. Regardless of the FC width studied, the net mass flow forces are about 1/3 of the corresponding pressure ones.
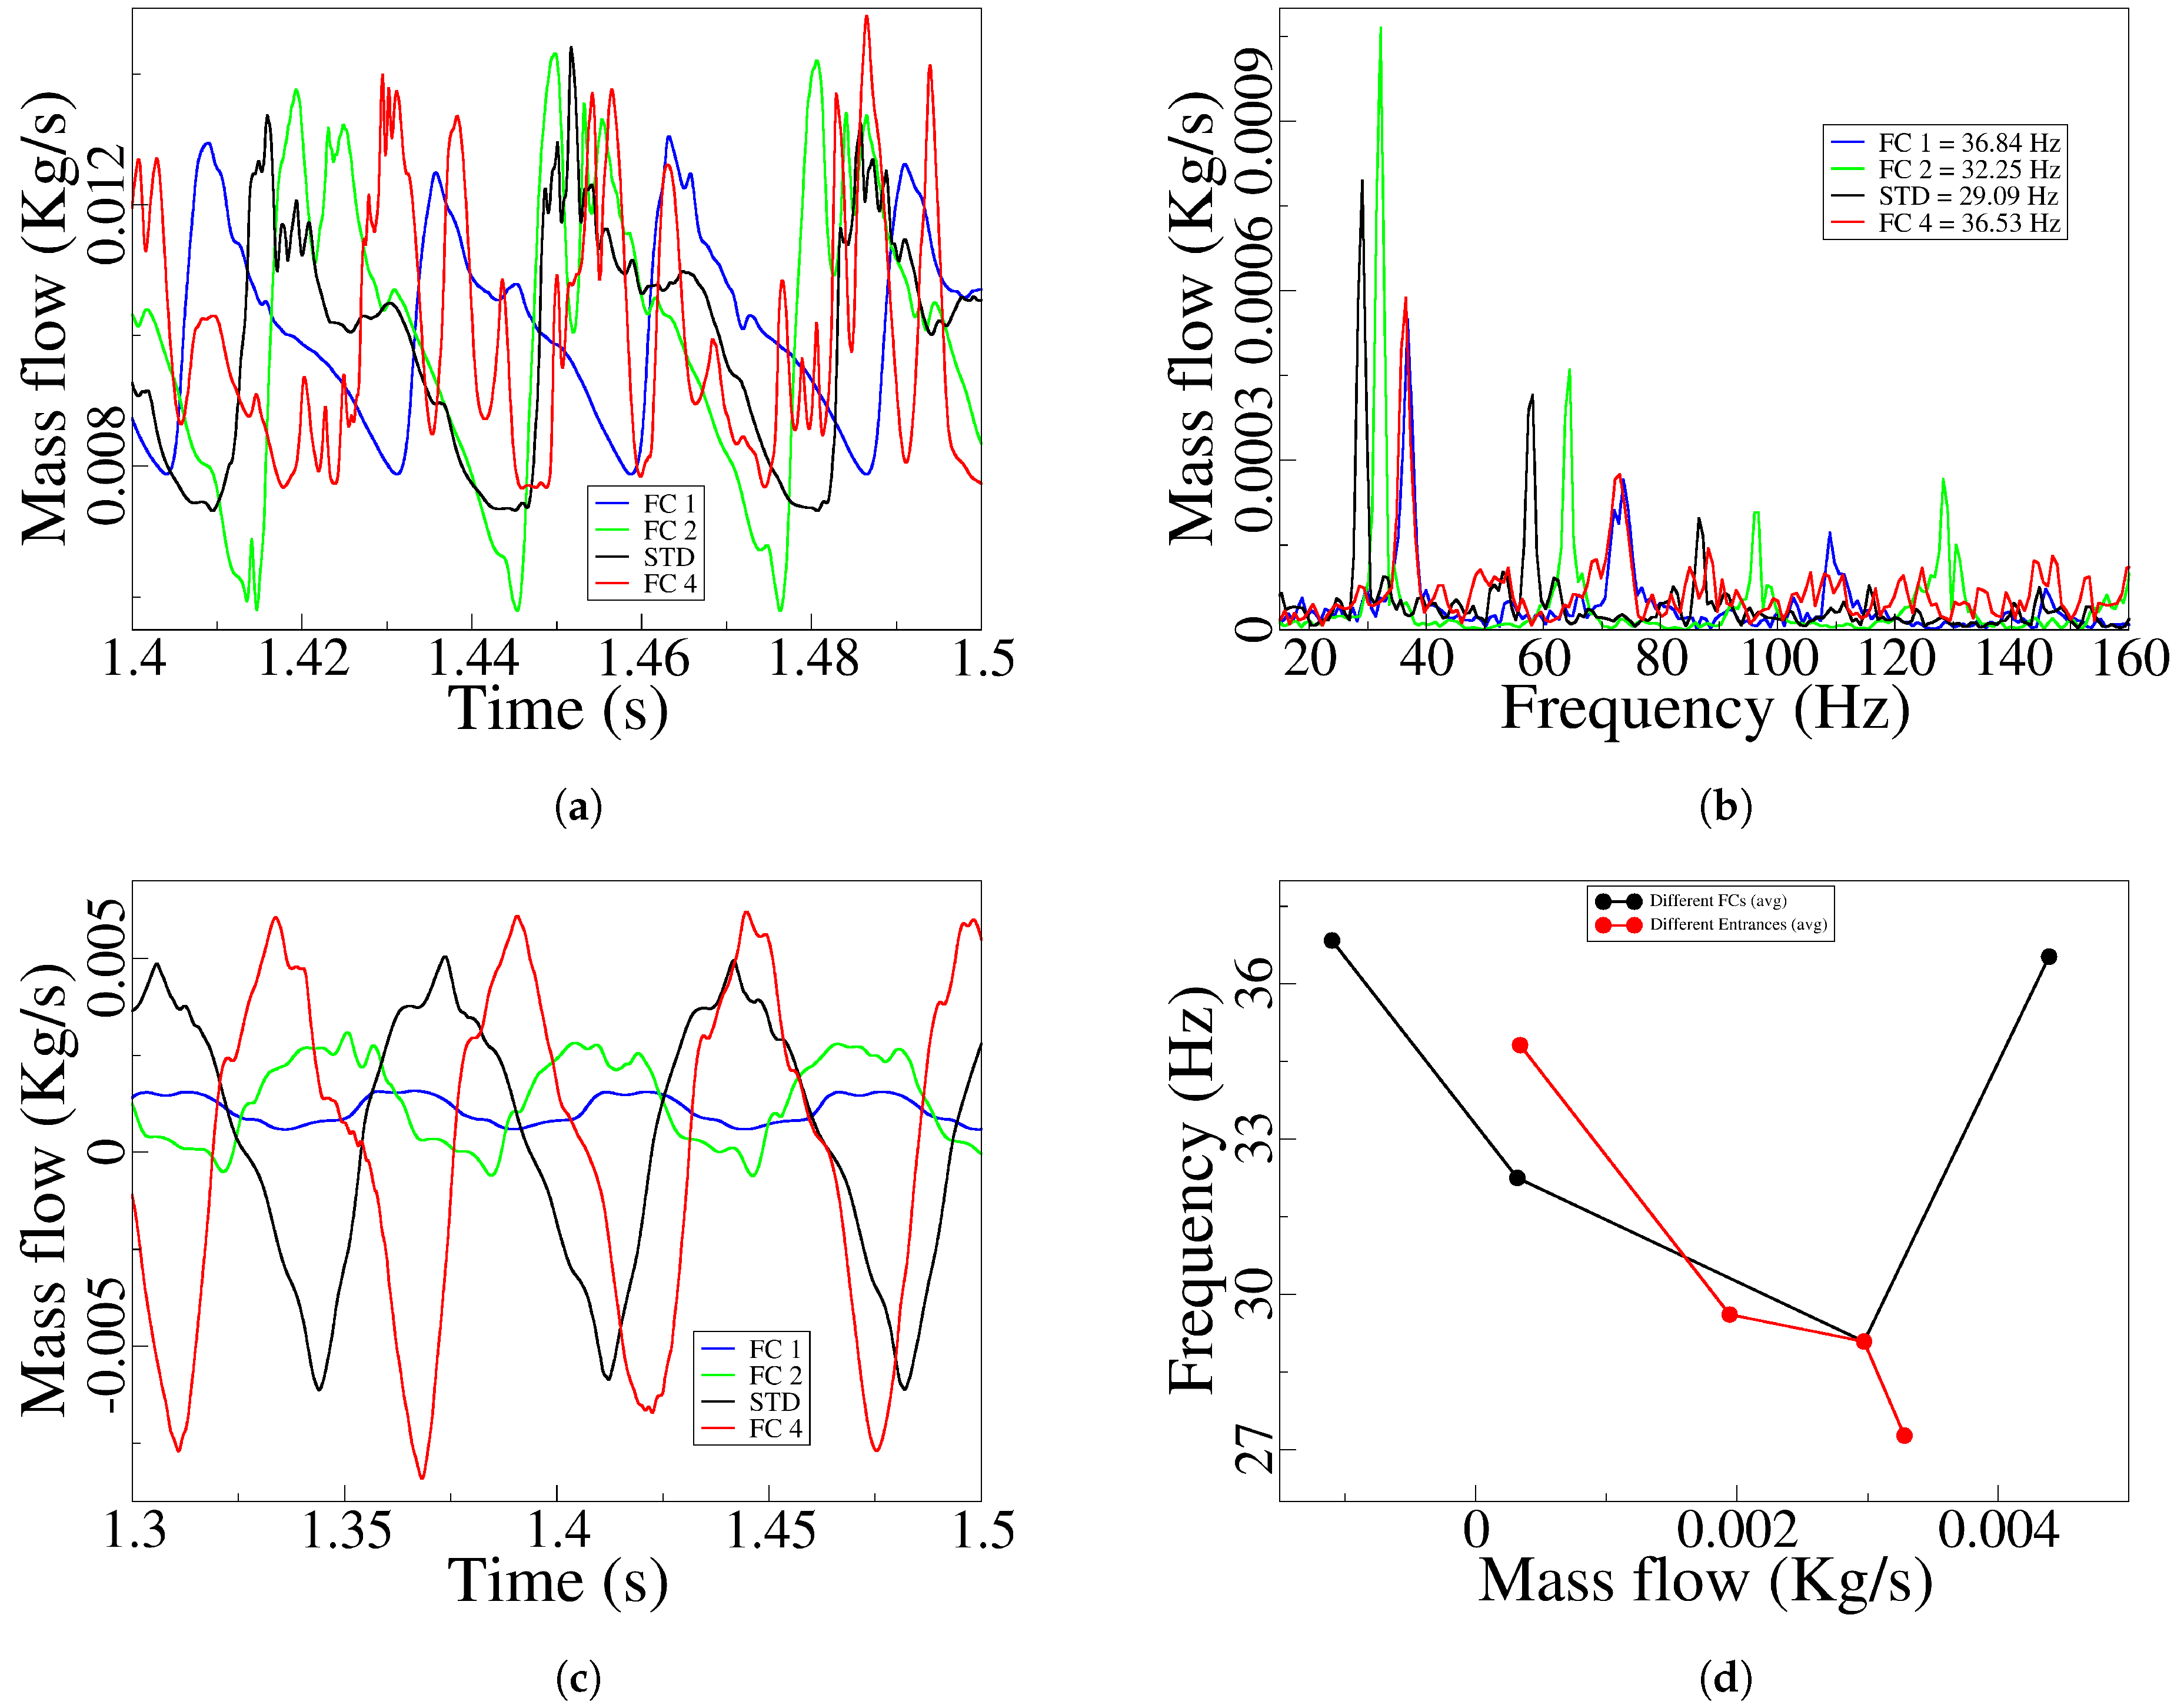
The FO and FC outlet mass flows for the four FC widths studied are presented in Figure 18a, c, respectively. Focusing on the FC mass flow, it can clearly be seen that for the FC1 case, there is no reverse flow, a small amount of fluid is always flowing from the feedback channels towards the mixing chamber, notice as well the small peak to peak amplitude associated. As the FC width increases to FC2, there is an almost negligible FC reverse flow, being the peak to peak amplitude slightly higher than in the FC1 case. A further increase of the FC width to FC3 and FC4, generates a drastic increase of the feedback channel reverse flow as well as its peak to peak amplitude, the FC reverse mass flow maximum value being higher than the direct FC one. When observing the variations of the FO outlet mass flow, Figure 18a, it is seen that the oscillation amplitude keeps growing with the FC width. In fact, the oscillation amplitude considerably grows when comparing the FC1 and FC2 cases, but a further increase of the FC width to FC3 = STD slightly reduces the amplitude, such FO outlet mass flow peak to peak amplitude remains rather similar for the FC4 and FC3 cases, yet the randomness associated to the oscillations for the FC4 case (maximum FC width studied), is considerably higher than for the rest of the FC widths studied. Note that a higher FO outlet mass flow peak to peak amplitude, involves a higher swept angle of the jet at the oscillator outlet. Regarding the FO outlet mass flow oscillating frequency, Figure 18b, the frequency tends to decrease with the FC width increase. Yet, for the maximum FC width studied, FC4, there is a sudden increase of frequency, note that for this particular case the FO outlet mass flow peak to peak amplitude suffered a decrease while increasing its randomness, very likely due to the large degree of freedom associated to the jet inside the MC.
Figure 15. Instantaneous velocity and pressure fields along a full oscillation period divided in 4 equidistant time steps. Minimum feedback channel width, FC1.
Preprints 119018 g015
Figure 16. Instantaneous velocity and pressure fields along a full oscillation period divided in 4 equidistant time steps. Maximum feedback channel width, FC4.
Preprints 119018 g016
Figure 17. Feedback channel outlet net pressure forces (a) and net mass flow forces (b), as a function of the different Feedback channel widths evaluated.
Preprints 119018 g017
At this point it is interesting to recall the work done by [15,27,36] among others, then they emphasized the effect of the FO outlet frequency with the variation of the MC entrance and outlet widths, as well as the FO outlet width. In fact in [36] they highlighted the ratios (FO outlet width/MC entrance width) and the (MC entrance width/FO power nozzle) as two of the relations which were having a particular relevant effect on the FO dynamic performance. Based on the 2D-CFD simulations presented in Section 6.3, we have studied the FO outlet mass flow frequency in (Hz) as a function of the (FO outlet width/MC entrance width) = ( F O o / M C e ) , the relation being F ( H z ) = 26.9845 × ( F O o / M C e ) 2 62.945 × ( F O o / M C e ) + 64.3368 , the coefficient of determination was of ( R 2 = 0.9194 ), equation showing a small decrease in frequency as a function of the (FOo/MCe) ratio increase. We also studied the FO outlet mass flow frequency (Hz) as a function of the (MC entrance width/FO power nozzle) = ( M C e / F O p w ) , obtaining the relation F ( H z ) = 7.0742 × ( M C e / F O p w ) 2 14.2213 × ( M C e / F O p w ) + 34.8239 ) , the coefficient of determination being ( R 2 = 0.9564 ). Showing that the FO outlet frequency tends to increase with the ( M C e / F O p w ) ratio increase. In order to find out an equation which summarizes the FO outlet mass flow frequency as a function of the dimensional modifications presented in Section 6.3 and Section 6.4, we decided to link the FO frequency with the time averaged reverse FC outlet mass flow, and we noticed that the trend is the same as the one observed for different MC internal angles variation and it is also the same observed when comparing the 3D with the 2D simulations. This is, as the time averaged FC reverse flow increases the FO outlet frequency decreases. This information is summarized in Figure 18d, note that regardless of the dimensional modification considered the frequency decreases with the FC time averaged reverse mass flow increase, with the exception of the maximum FC width studied. See that, the FC reverse mass flow is taken as positive in Figure 18d. For this particular case there was a pretty random oscillation of the main jet inside the MC. When considering all the results obtained in the 2D-CFD simulations, with the exception of the point characterizing the maximum FC width case, the FO outlet mass flow frequency can be estimated as a function of the FC time averaged reverse mass flow, according to the equation: F ( H z ) = 114321.23899 × ( R f ) 2 2329.3142 × ( R f ) + 34.1836 ) , ( R f ) being the time averaged FC reverse mass flow, which is taken as positive. The coefficient of determination was ( R 2 = 0.9316 ). We can conclude saying that, for the present FO configuration, the evaluation of the FC reverse mass flow allows to estimate the FO outlet frequency.
Figure 18. Fluidic Oscillator outlet mass flow (a), its associated frequency (b), and the lower feedback channel outlet mass flow (c), as a function of the different Feedback channel widths evaluated. Fluidic oscillator outlet mass flow frequency as a function of the Feedback channel time averaged reverse mass flow (d).
Preprints 119018 g018
For the four FC widths evaluated, the time dependent stagnation pressure at the MC lower converging wall, its time averaged value and peak to peak amplitude is respectively presented in Figure 19a, b. As FC width increases, the peak to peak amplitude oscillation grows until reaching the maximum FC width, where the amplitude decreases and the oscillation becomes more random due to the large freedom the MC internal jet is having under these conditions. In Figure 19c, d, it is shown the time dependent force, its time averaged value and the associated peak to peak amplitude at the FC lower outlet due to the fluid pressure and for the four FC widths considered. The force appears to be linearly increasing with the FC width, but in reality such linearly increase is due to the FC width increase, then the average pressure at the MC converging walls is suffering a minor variation for the different FCs considered. Pressure force peak to peak amplitude also grows with the FC width. It is relevant to highlight that specially for the FC4 case, the pressure force curve is particularly scattered which obeys to the highly random fluctuations associated to this maximum FC width. The evaluation of the time dependent mass flow force, its time averaged and peak to peak amplitude at the FC lower outlet is shown in Figure 19e, f. The mass flow force follows the same trend as the FC lower outlet mass flow Figure 18c, the mass flow force average value and peak to peak amplitude, grows with the FC width. The time dependent overall force acting on the jet as in enters the MC as well as its peak to peak amplitude is introduced in Figure 19g, h. The amplitude considerably grows when going from FC1 to FC2, but remains rather constant for the rest of the FC widths evaluated. Note as well that for the FC4 case the net force curve is particularly scattered, following the trend shown by the time dependent stagnation pressure measured at the MC lower converging wall, Figure 19a.

6.5. Forces Assessment Acting on the Jet at the Mixing Chamber Entrance

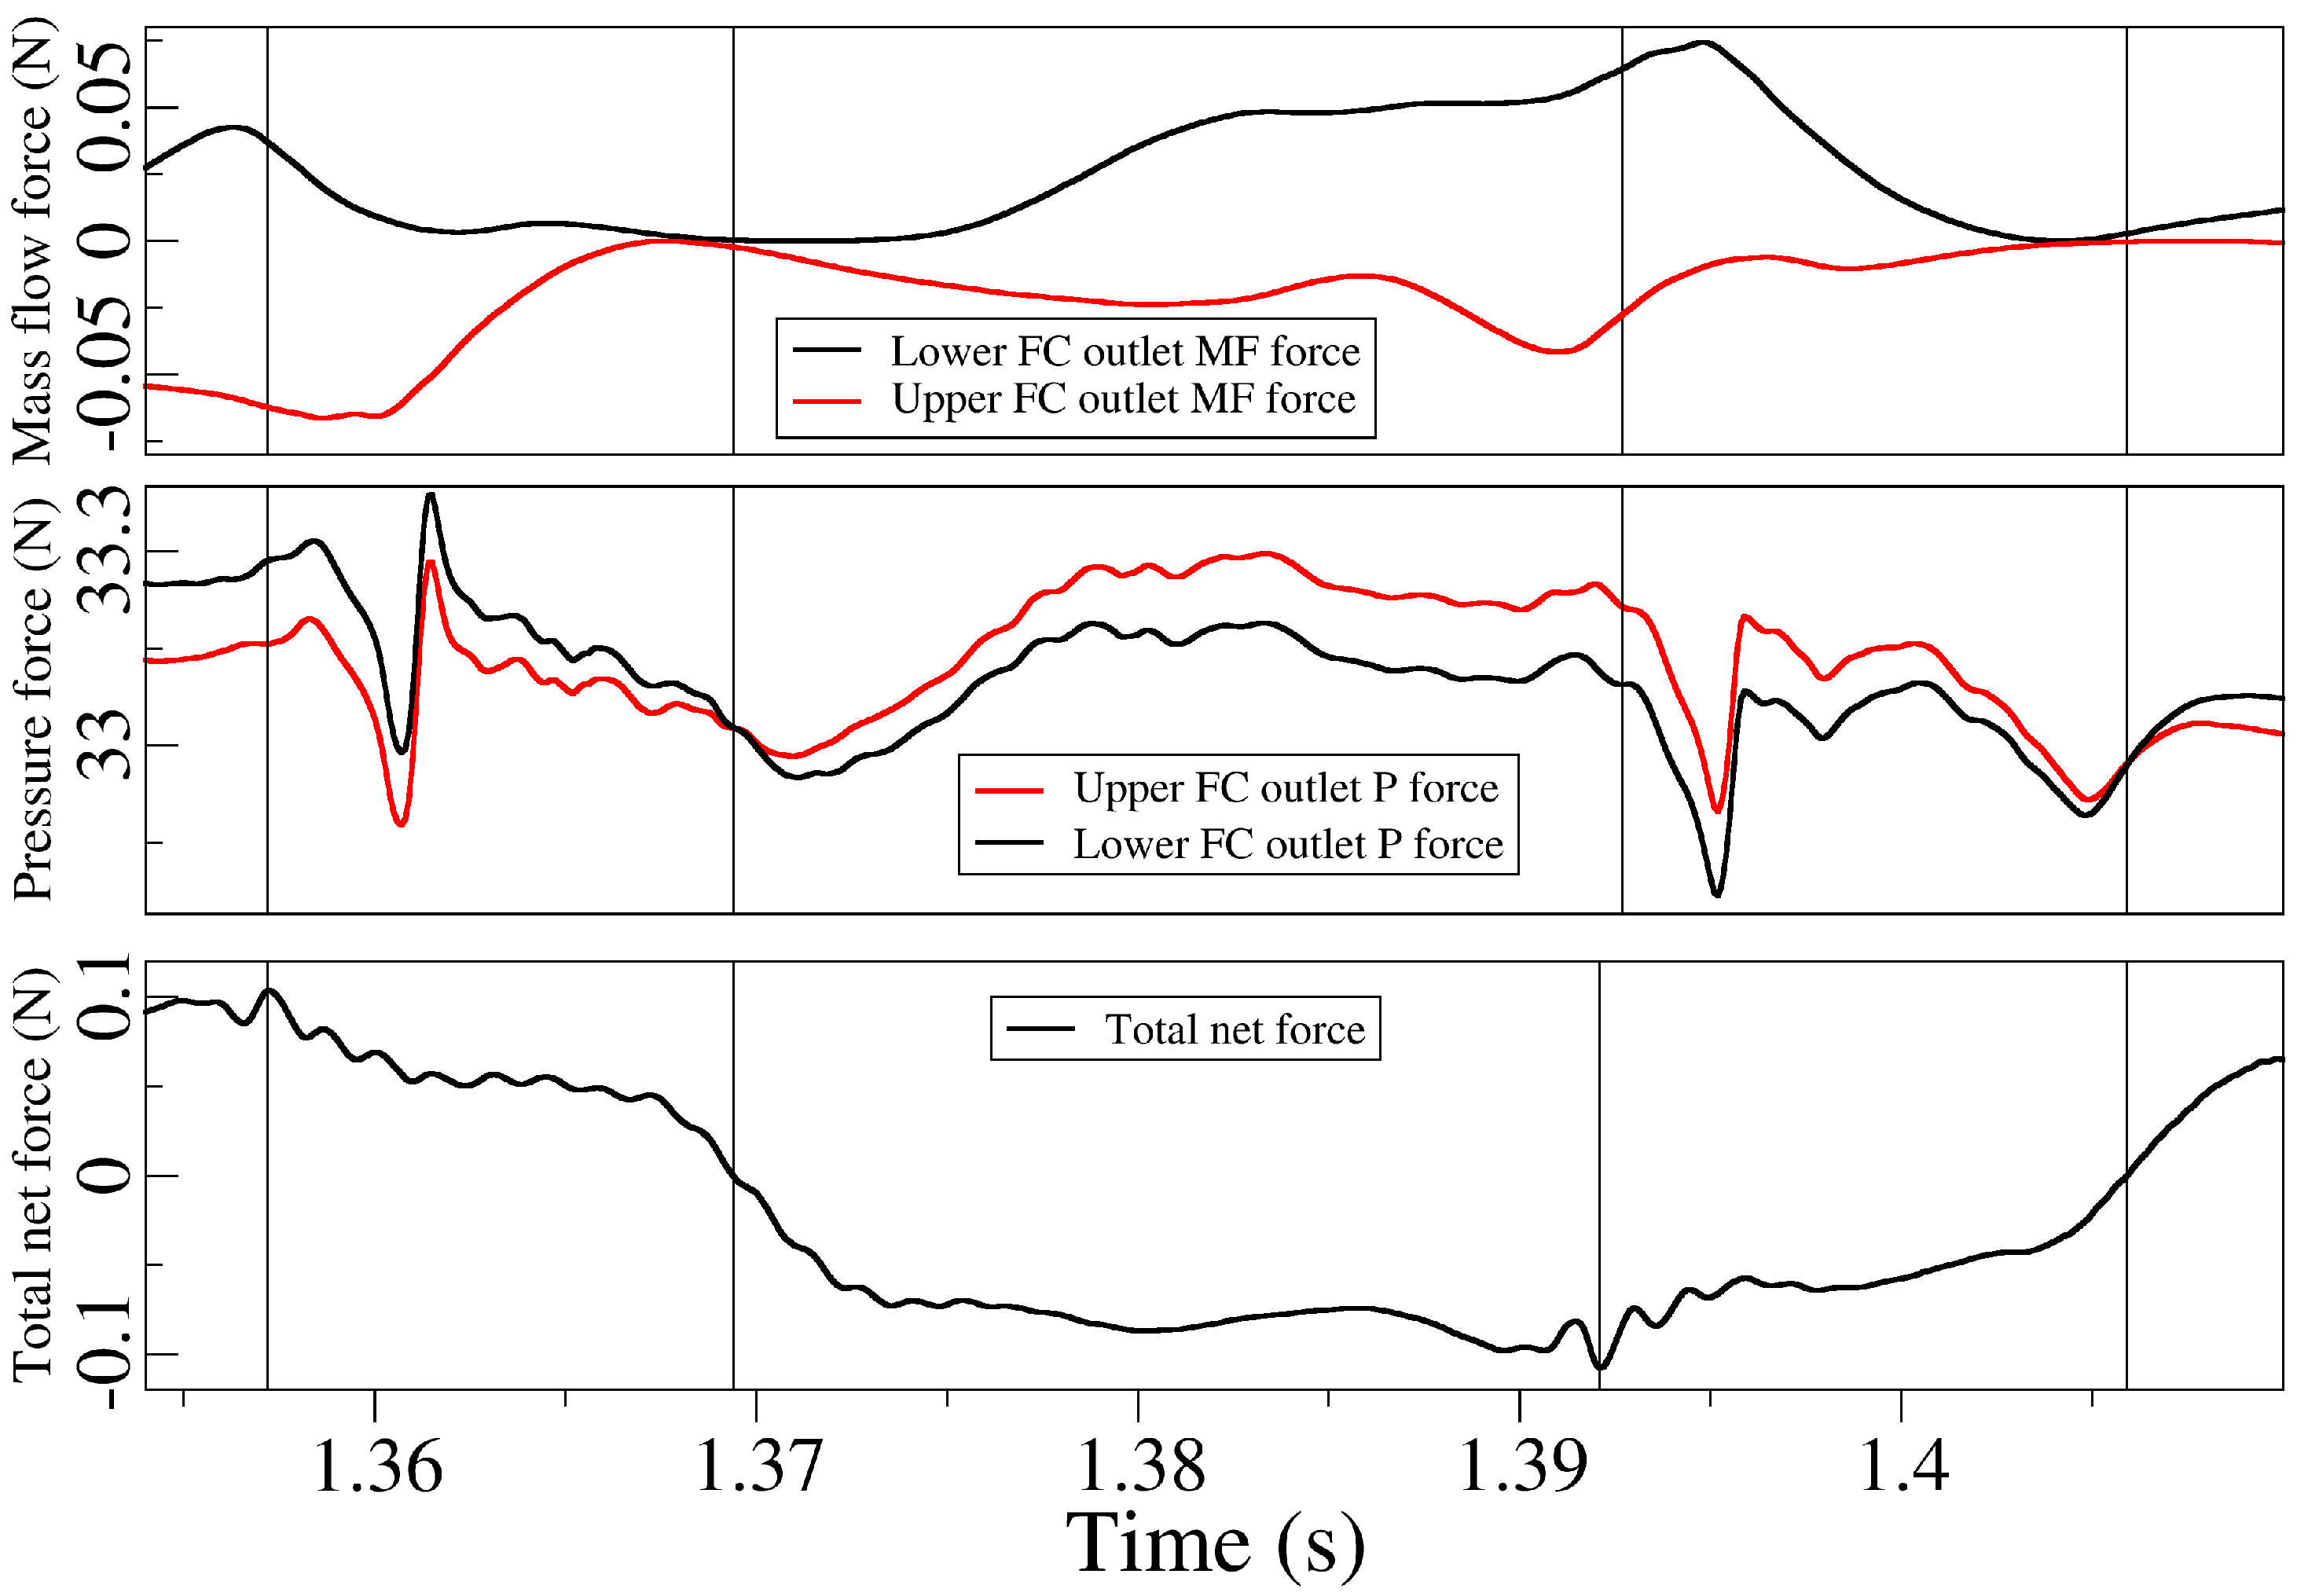
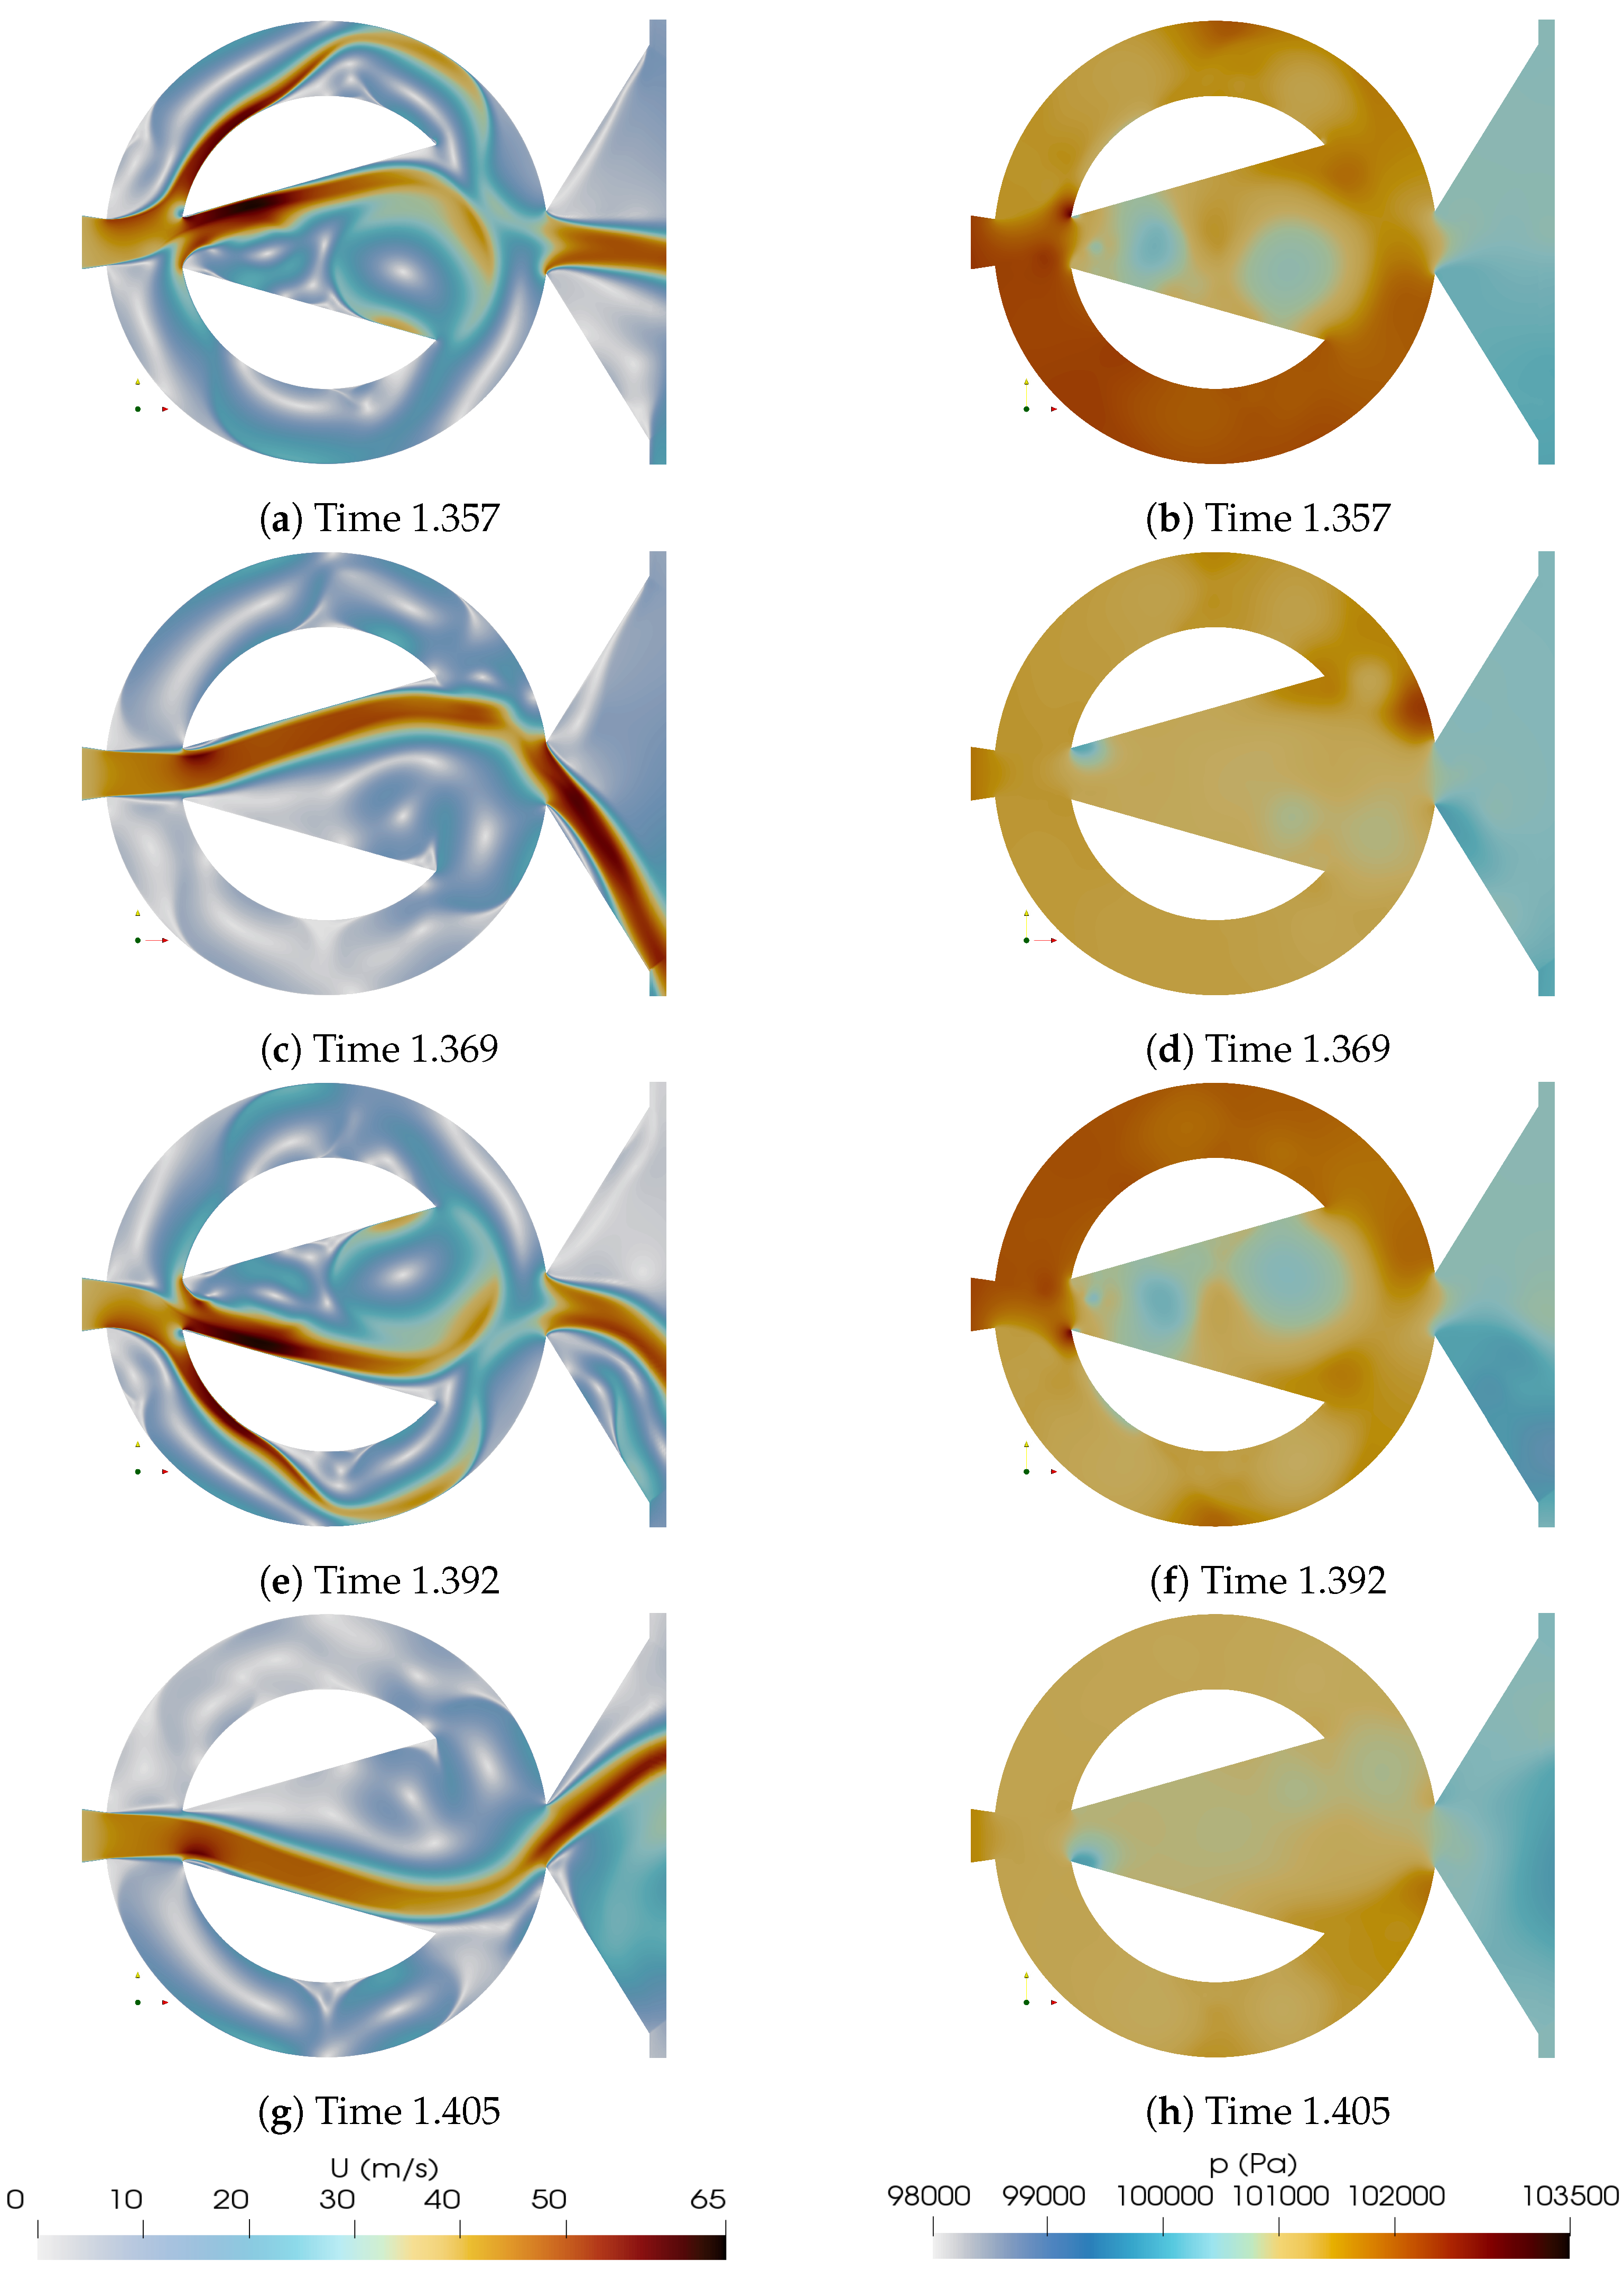
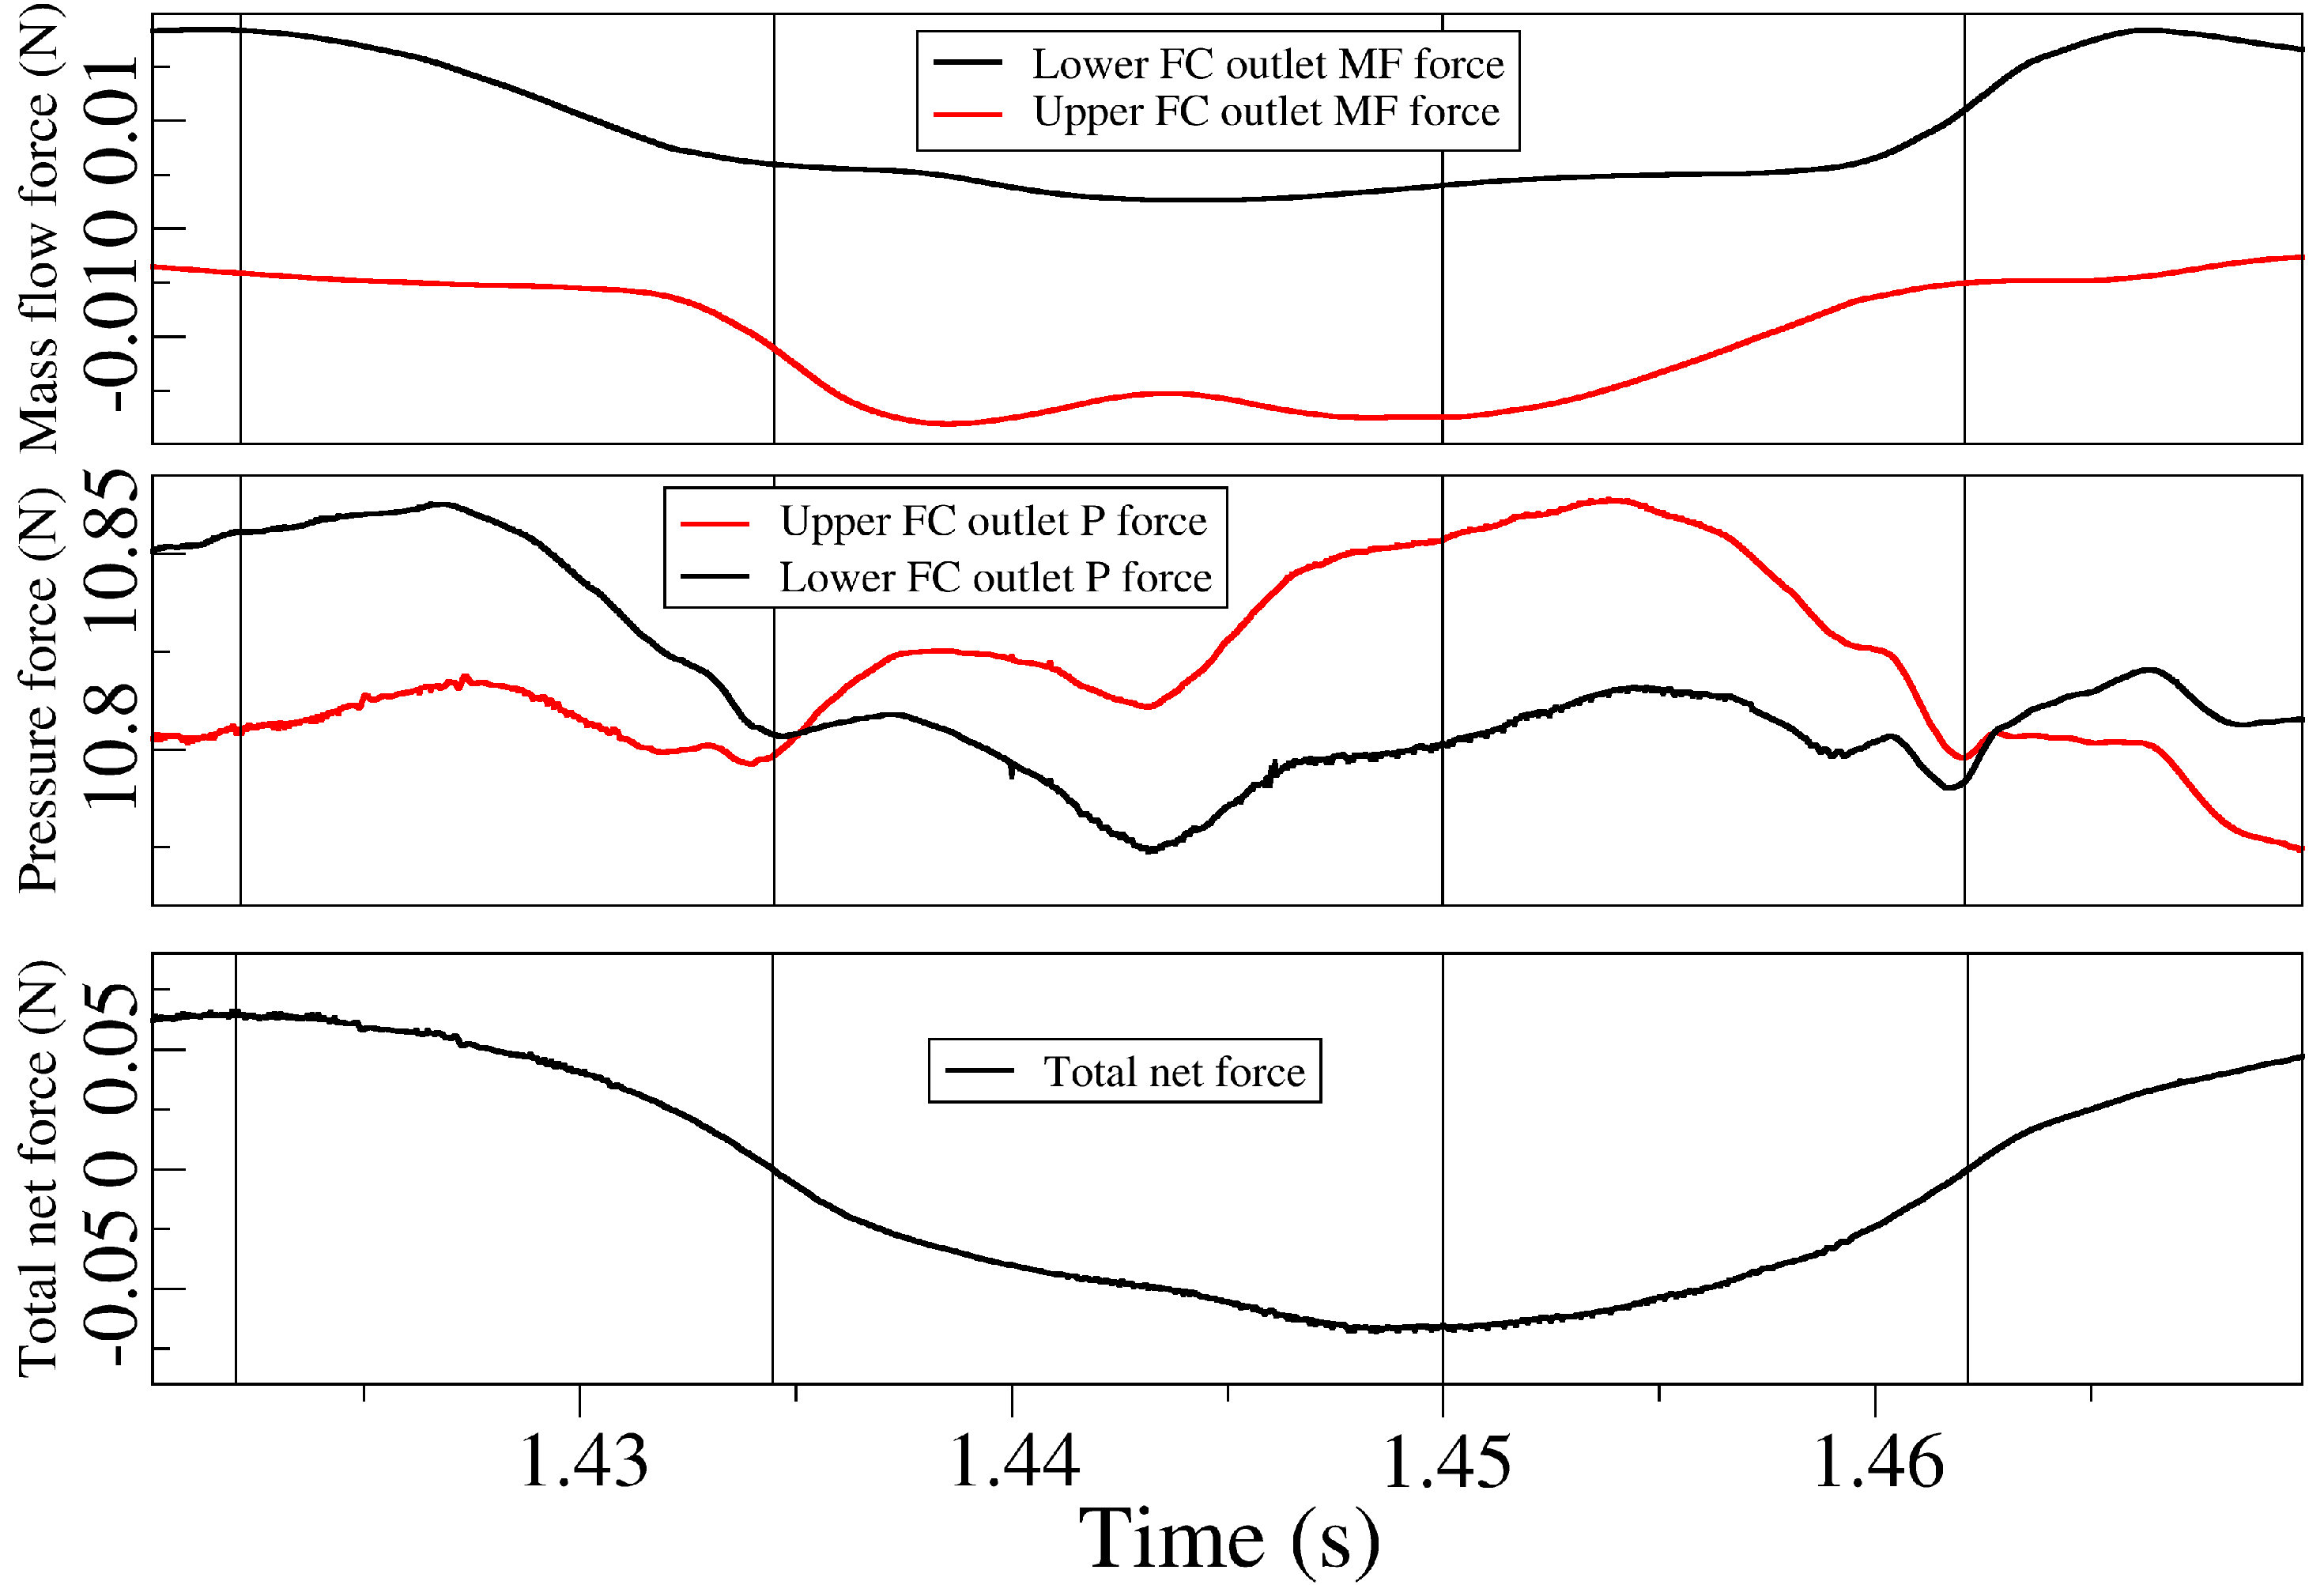
To illustrate the effect of the forces acting on the jet as it enters the mixing chamber, we have chosen two cases, the minimum FC width case, FC1, and the Entrance 1 one, where the angle was δ 1 = δ S T D + 15 . We have chosen these two cases because they properly clarify the variations of the unsteady force curves when there is no FC reverse flow and when there is a large FC reverse flow. For the smallest FC width, FC1, Figure 20 introduces for over half an oscillation cycle, the unsteady forces acting on the feedback channels outlets. The upper graph, represents the mass flow forces acting over the jet on each FC outlet. The central graph characterizes the pressure forces acting on the same FC outlets, for convenience the pressure force acting on the upper FC outlet was represented as positive. The lower graph introduces the overall forces acting on the jet as it enters the MC. The same information, but for the Entrance 1 case, characterized by δ 1 = δ S T D + 15 is presented in Figure 21.
Regardless of the case studied, the mass flow forces at the lower FC outlet always push the jet upwards, these forces always push the jet downwards on the upper FC outlet. The mass flow forces for the Entrance 1 case, due to the larger FC mass flow associated, are about five times larger than the ones observed in the FC1 case. When comparing the pressure forces from Figure 20 and Figure 21, it is seen that for the FC1 case, the curves oscillate rather smoothly, while the periodic-like oscillation observed in the Entrance 1 case, has associated a ripple superimposed to the pressure curves. This pressure ripple is observed in all cases where large FC reverse flow exist. As a consequence, this pressure ripple is as well observed in the total net force curve presented at the bottom of Figure 21, see that this curve is rather smooth in Figure 20. Note as well that pressure forces are always several orders of magnitude higher than mass flow ones, therefore indicating that smaller variations of pressure fields generate large forces on the jet. To understand the origin of the pressure ripple it is necessary to compare the velocity and pressure fields in the FO, see Figure 22 and Figure 23, with the pressure forces acting on the jet. At time 1.357 s, Figure 23a,b, the lower FC is pressurized the jet is being pushed upwards, the pressure forces on the lower FC outlet are higher than the ones at the upper one as shown in Figure 21. At this instant a large FC reverse flow is observed at the upper FC. Few milliseconds later, at about 1.36 s, see Figure 21, the upper FC reverse flow is meeting the MC central jet at the MC upper converging wall (upper FC inlet), at this instant the pressure oscillations are particularly large and keep decreasing as the MC jet reaches its upmost position and starts moving downwards, see for example Figure 23c,d and the corresponding pressure force curves in Figure 21 at time around 1.37 s. In fact, from this time and until around 1.405 s, the pressure force at the upper FC outlet is pushing the jet downwards, see the stagnation point at the upper MC converging wall, Figure 23d and the pressurization of the upper FC in Figure 23f. Note as well that the upper FC pressure force is higher than the lower one, Figure 21. See as well that, from time 1.392 s and until 1.405 s, the pressure forces have associated a considerable ripple, then the main jet at the MC and the lower FC reverse flow are going to meet at the MC outlet lower converging wall. The exact time the two jets meet is likely to be the instant at which the pressure curves suffer a drop, 1.395 s for the lower FC and 1.361 s for the upper one, see Figure 21.
Figure 21. Unsteady mass flow and pressure forces measured at both feedback channel outlets and the overall forces acting on the jet; about half of a cycle is presented here. Case Entrance 1, δ 1 = δ S T D + 15 .
Preprints 119018 g021
Finally, from the comparison of Figure 22 and Figure 23, it can be concluded that despite the fact that the upper and lower feedback channels are alternatively being pressurized, the no existence of FC reverse flow in the FC1 case, brings a major stability of the jet in the MC, generating smoother force curves, see Figure 20. Note that this major smoothness was already observed in the stagnation pressure curve previously introduced in Figure 19a.
Figure 22. Velocity and pressure fields at different time steps along a half oscillation period. Smallest FC width, FC1.
Preprints 119018 g022
Figure 23. Velocity and pressure fields at different time steps along a half oscillation period. Case Entrance 1, δ 1 = δ S T D + 15 .
Preprints 119018 g023

7. Conclusions

A rather new Fluidic Oscillator configuration, previously studied in [1,42], is further analyzed in the present manuscript. The baseline case configuration is initially evaluated based on 3D and 2D URANS simulations and using the k ω SST turbulence model. The modification of the MC internal angle and the feedback channels width is later studied based on 2D-CFD simulations. The results highlight that large MC angles have associated small variations of the FO frequencies, these ones increase with the MC angle decrease. When considering the net forces acting on the jet as it enters the MC, it is seen that mass flow forces are about one third of the pressure ones, this ratio is about the same regardless of the MC angle or FC width considered. Jet oscillations inside the MC are much uniform for small FC widths, the increase of FC width increases the freedom of the jet inside the MC resulting in a much higher degree of oscillation randomness. The feedback channel reverse and direct flow, grow with the FC width increase, while decreasing the FO oscillating frequency. The jet oscillation inside the MC and at the FO outlet stabilizes when reducing the FC width, on the other hand, when exceeding a certain FC width, the oscillation of the jet becomes much more random due to the very high degree of freedom associated to the small MC and large FC widths employed, the FO outlet mass flow frequency increases under these conditions. The evaluation of the forces acting on the jet as it enters the MC has clarified the origin of the pressure fluctuations superimposed on the unsteady periodic-like pressure curves, the instant at which the main jet in the MC meets the FC reverse flow jet being the source of pressure field instabilities. A completely novel equation relating the FO outlet mass flow frequency with the time averaged FC reverse flow is also presented and discussed.

Supplementary Materials

The following supporting information can be downloaded at: https://www.youtube.com/playlist?list= PLmecOqgRXYhF0UTDooESvZRxG6Li9OzG. Four videos introduce the velocity and pressure fields for the standard case analyzed via 3D and 2D simulations. A set of eight videos present the velocity and pressure fields for the maximum and minimum MC internal angles evaluated and for the maximum and minimum FC widths considered. The Reynolds number was kept constant at 54,595 for all cases studied.

Author Contributions

Conceptualization, J.M.B.; methodology, K.K. and J.M.B.; software, K.K.; validation, K.K. and J.M.B.; formal analysis, K.K. and J.M.B.; investigation, K.K. and J.M.B.; data curation, K.K.; writing—original draft preparation, J.M.B. and K.K.; writing—review and editing, J.M.B.; visualization, K.K. and J.M.B.; supervision, J.M.B.; project administration, J.M.B.

Funding

This research was supported by the Universitat Politècnica de Catalunya under the grant OBLEA-2024, and by the Spanish Ministerio de Ciencia, Innovacion y Universidades with the project PID2023-150014OB-C21. We also want to acknowledge the Red Española de Supercomputación (RES), Spanish supercomputer network for the project IM-2024-2-0008, which helped in generating this paper.

Institutional Review Board Statement

Not applicable.

Informed Consent Statement

Not applicable.

Data Availability Statement

Data are contained within the article.

Conflicts of Interest

The authors declare no conflicts of interest.

References

  1. Karimzadegan, K.; Mirzaei, M.; Bergada, J.M. Analysis of a Novel Fluidic Oscillator under Several Dimensional Modifications. Applied Sciences 2024, 14, 1690. [Google Scholar] [CrossRef]
  2. Kim, S.H.; Kim, K.Y. Effects of installation location of fluidic oscillators on aerodynamic performance of an airfoil. Aerospace Science and Technology 2020, 99, 105735. [Google Scholar] [CrossRef]
  3. Cerretelli, C.; Wuerz, W.; Gharaibah, E. Unsteady separation control on wind turbine blades using fluidic oscillators. AIAA journal 2010, 48, 1302–1311. [Google Scholar] [CrossRef]
  4. Tousi, N.; Coma, M.; Bergadà, J.; Pons-Prats, J.; Mellibovsky, F.; Bugeda, G. Active flow control optimisation on SD7003 airfoil at pre and post-stall angles of attack using synthetic jets. Applied Mathematical Modelling 2021, 98, 435–464. [Google Scholar] [CrossRef]
  5. Kim, N.H.; Kim, K.Y. Effects of Bending of Fluidic Oscillators on Aerodynamic Performance of an Airfoil with a Flap. Processes 2021, 9, 1429. [Google Scholar] [CrossRef]
  6. Kim, N.H.; Kim, K.Y. Effects of Bent Outlet on Characteristics of a Fluidic Oscillator with and without External Flow. Energies 2021, 14, 4342. [Google Scholar] [CrossRef]
  7. Tousi, N.; Bergadà, J.; Mellibovsky, F. Large Eddy Simulation of optimal Synthetic Jet Actuation on a SD7003 airfoil in post-stall conditions. Aerospace Science and Technology 2022, 127, 107679. [Google Scholar] [CrossRef]
  8. Kim, M.; Kim, D.; Yeom, E.; Kim, K.C. Experimental study on heat transfer and flow structures of feedback-free sweeping jet impinging on a flat surface. International Journal of Heat and Mass Transfer 2020, 159, 120085. [Google Scholar] [CrossRef]
  9. Mohammadshahi, S.; Samsam-Khayani, H.; Cai, T.; Nili-Ahmadabadi, M.; Kim, K.C. Experimental study on flow characteristics and heat transfer of an oscillating jet in a cross flow. International Journal of Heat and Mass Transfer 2021, 173, 121208. [Google Scholar] [CrossRef]
  10. D’Angelo, C.; Paolillo, G.; Greco, C.S.; Cardone, G.; Astarita, T. On the behaviour of impinging sweeping jets: effects of the mixing chamber length, the feedback channel minimum cross-sectional area and the nozzle-to-plate distance. Experimental Thermal and Fluid Science 2024, 155, 111197. [Google Scholar] [CrossRef]
  11. Joulaei, A.; Nili-Ahmadabadi, M.; Ha, M.Y. Numerical study of the effect of geometric scaling of a fluidic oscillator on the heat transfer and frequency of impinging sweeping jet. Applied Thermal Engineering 2023, 221, 119848. [Google Scholar] [CrossRef]
  12. Hossain, M.A.; Ameri, A.; Gregory, J.W.; Bons, J. Effects of fluidic oscillator nozzle angle on the flowfield and impingement heat transfer. AIAA Journal 2021, 59, 2113–2125. [Google Scholar] [CrossRef]
  13. Ostermann, F.; Woszidlo, R.; Nayeri, C.N.; Paschereit, C.O. Properties of a sweeping jet emitted from a fluidic oscillator. Journal of Fluid Mechanics 2018, 857, 216–238. [Google Scholar] [CrossRef]
  14. Zeleke, D.S.; Huang, R.F.; Hsu, C.M. Effects of Reynolds number on flow and mixing characteristics of a self-sustained swinging jet. Journal of Turbulence 2020, 21, 434–462. [Google Scholar] [CrossRef]
  15. Wen, X.; Liu, J.; Li, Z.; Peng, D.; Zhou, W.; Kim, K.C.; Liu, Y. Jet impingement using an adjustable spreading-angle sweeping jet. Aerospace Science and Technology 2020, 105, 105956. [Google Scholar] [CrossRef]
  16. Li, Z.; Liu, Y.; Zhou, W.; Wen, X.; Liu, Y. Thermal pollution level reduction by sweeping jet-based enhanced heat dissipation: A numerical study with calibrated Generalized k-ω (GEKO) model. Applied Thermal Engineering 2022, 204, 117990. [Google Scholar] [CrossRef]
  17. Länge, K.; Blaess, G.; Voigt, A.; Götzen, R.; Rapp, M. Integration of a surface acoustic wave biosensor in a microfluidic polymer chip. Biosensors and Bioelectronics 2006, 22, 227–232. [Google Scholar] [CrossRef]
  18. Sakong, J.; Roh, H.; Roh, Y. Surface acoustic wave DNA sensor with micro-fluidic channels. Japanese Journal of Applied Physics 2007, 46, 4729. [Google Scholar] [CrossRef]
  19. De Giorgi, M.; De Luca, C.; Ficarella, A.; Marra, F. Comparison between synthetic jets and continuous jets for active flow control: Application on a NACA 0015 and a compressor stator cascade. Aerospace Science and Technology 2015, 43, 256–280. [Google Scholar] [CrossRef]
  20. Traficante, S.; De Giorgi, M.; Ficarella, A. Flow separation control on a compressor-stator cascade using plasma actuators and synthetic and continuous jets. Journal of Aerospace Engineering 2016, 29, 04015056. [Google Scholar] [CrossRef]
  21. Zhang, H.; Chen, S.; Gong, Y.; Wang, S. A comparison of different unsteady flow control techniques in a highly loaded compressor cascade. Proceedings of the Institution of Mechanical Engineers, Part G: Journal of Aerospace Engineering 2019, 233, 2051–2065. [Google Scholar] [CrossRef]
  22. Baghaei, M.; Bergadà, J.M.; Del Campo Sud, D. Fluidic actuator performance variation via internal dimensions modifications. In Proceedings of the 17th International Conference on Computational and Mathematical Methods in Science and Engineering, CMMSE 2017, Costa Ballena (Rota), Cádiz, Spain, 4–8 July 2017; pp. 166–176. [Google Scholar]
  23. Baghaei, M.; Bergada, J.M. Analysis of the Forces Driving the Oscillations in 3D Fluidic Oscillators. Energies 2019, 12, 4720. [Google Scholar] [CrossRef]
  24. Baghaei, M.; Bergada, J.M. Fluidic Oscillators, the Effect of Some Design Modifications. Applied Sciences 2020, 10, 2105. [Google Scholar] [CrossRef]
  25. Bergadà, J.M.; Baghaei, M.; Prakash, B.; Mellibovsky, F. Fluidic oscillators, feedback channel effect under compressible flow conditions. Sensors 2021, 21, 5768. [Google Scholar] [CrossRef] [PubMed]
  26. Yang, J.; Zhang, X.; Luo, Y.; Tang, L.; Liang, B. Numerical parametric study of a sweeping-vortex low-frequency fluidic oscillator. International Journal of Mechanical Sciences 2024, 271, 109115. [Google Scholar] [CrossRef]
  27. Claus, G.C.; Hatton, A.; Bohan, B.T.; Polanka, M.D. Internal geometry and external wall effects on fluidic oscillator behavior. Journal of Fluids Engineering 2020, 142, 111212. [Google Scholar] [CrossRef]
  28. Bobusch, B.C.; Woszidlo, R.; Bergada, J.M.; Nayeri, C.N.; Paschereit, C.O. Experimental study of the internal flow structures inside a fluidic oscillator. Experiments in fluids 2013, 54, 1559. [Google Scholar] [CrossRef]
  29. Ostermann, F.; Woszidlo, R.; Nayeri, C.; Paschereit, C.O. Experimental comparison between the flow field of two common fluidic oscillator designs. In Proceedings of the 53rd AIAA Aerospace Sciences Meeting; 2015; p. 0781. [Google Scholar]
  30. Woszidlo, R.; Ostermann, F.; Nayeri, C.; Paschereit, C. The time-resolved natural flow field of a fluidic oscillator. Experiments in Fluids 2015, 56, 125. [Google Scholar] [CrossRef]
  31. Pandey, R.J.; Kim, K.Y. Numerical modeling of internal flow in a fluidic oscillator. Journal of Mechanical Science and Technology 2018, 32, 1041–1048. [Google Scholar] [CrossRef]
  32. Seo, J.; Zhu, C.; Mittal, R. Flow Physics and Frequency Scaling of Sweeping Jet Fluidic Oscillators. AIAA Journal 2018, 1–12. [Google Scholar] [CrossRef]
  33. Bobusch, B.C.; Woszidlo, R.; Krüger, O.; Paschereit, C.O. Numerical Investigations on Geometric Parameters Affecting the Oscillation Properties of a Fluidic Oscillator. In Proceedings of the 21st AIAA Computational Fluid Dynamics Conference; 2013; p. 2709. [Google Scholar]
  34. Slupski, B.Z.; Kara, K. Effects of Geometric Parameters on Performance of Sweeping Jet Actuator. In Proceedings of the 34th AIAA Applied Aerodynamics Conference; 2016; p. 3263. [Google Scholar]
  35. Wang, S.; Baldas, L.; Colin, S.; Orieux, S.; Kourta, A.; Mazellier, N. Experimental and numerical study of the frequency response of a fluidic oscillator for active flow control. In Proceedings of the 8th AIAA Flow Control Conference; 2016; p. 4234. [Google Scholar]
  36. Wen, X.; Li, Z.; Zhou, L.; Yu, C.; Muhammad, Z.; Liu, Y.; Wang, S.; Liu, Y. Flow dynamics of a fluidic oscillator with internal geometry variations. Physics of Fluids 2020, 32. [Google Scholar] [CrossRef]
  37. Yan, Z.; Lu, Y.; Yang, X.; Deng, Q.; Lu, W. Characteristics of a novel fluidic oscillator with movable feedback channels and resonators. Frontiers in Energy Research 2023, 11, 1236087. [Google Scholar] [CrossRef]
  38. Madane, K.; Ranade, V. Jet Oscillations and Mixing in Fluidic Oscillators: Influence of Geometric Configuration and Scale. Industrial & Engineering Chemistry Research 2023, 62, 19274–19293. [Google Scholar]
  39. Xu, S.; Peirone, C.; Ryzer, E.; Rankin, G.W. An investigation of a supersonic fluidic oscillator generating pulsations in chambers during pressurization. European Journal of Mechanics-B/Fluids 2024, 103, 100–115. [Google Scholar] [CrossRef]
  40. Bohan, B.T.; Polanka, M.D.; Kim, I.J.; Layng, J.M. The Effect of Curved Geometry on Exiting Flow of Fluidic Oscillators. Journal of Fluids Engineering 2024, 146. [Google Scholar] [CrossRef]
  41. Spens, A.; Brandt, P.J.; Bons, J.P. Characterization of Out-of-Plane Curved Fluidic Oscillators. AIAA Journal 2024, 62, 1563–1573. [Google Scholar] [CrossRef]
  42. Sarwar, W.; Bergadà, J.M.; Mellibovsky, F. Onset of temporal dynamics within a low reynolds-number laminar fluidic oscillator. Applied Mathematical Modelling 2021, 95, 219–235. [Google Scholar] [CrossRef]
  43. Menter, F. Zonal two equation kw turbulence models for aerodynamic flows. In Proceedings of the 23rd fluid dynamics, plasmadynamics, and lasers conference; 1993; p. 2906. [Google Scholar]
Figure 3. Dimensional parametric modifications considered in the present study. Mixing chamber angle modification (a). Feedback channel dimensions modification (b).
Preprints 119018 g003
Figure 7. Comparison between 2D and 3D CFD simulations. Fluidic oscillator outlet mass flow (a). Stagnation pressure dynamics at the MC lower converging wall (b). Unsteady pressure at the lower feedback channel outlet (c). Lower feedback channel outlet mass flow (d).
Preprints 119018 g007
Figure 8. Instantaneous velocity fields obtained at the respective time at which reverse FC mass flow was maximum. Baseline case. 3D simulations (a). 2D simulations (b).
Preprints 119018 g008
Figure 9. Instantaneous velocity and pressure fields along a full oscillation period divided in four equidistant time steps. δ 1 = δ S T D + 15 ° . Entrance 1.
Preprints 119018 g009
Figure 12. For the four MC internal angles considered, this figure introduces the fluidic oscillator outlet dynamic mass flow (a), its associated frequency (b), and the FC lower outlet mass flow (c).
Preprints 119018 g012
Figure 13. Feedback channel outlet net mass flow forces (a) and net pressure forces (b) as a function of the different mixing chamber angles studied.
Preprints 119018 g013
Figure 14. All graphs consider the four Mixing chamber angular modifications studied. Unsteady stagnation pressure measured at the mixing chamber lower inclined wall (a), time-averaged values and peak-to-peak amplitudes (b). Pressure momentum terms measured at the FC lower outlet (c) and their respective average values and peak-to-peak amplitudes (d). Dynamic mass flow momentum terms measured at the FC lower outlet (e), and their respective average values and peak-to-peak amplitudes (f). Instantaneous net momentum obtained when considering pressure and mass flow momentum terms at both FC outlets (g), average values, and the peak-to-peak amplitudes (h).
Preprints 119018 g014
Figure 19. All graphs introduce the variations for the four feedback channel widths studied. Unsteady stagnation pressure measured at the mixing chamber lower inclined wall (a), time-averaged values and peak-to-peak amplitudes (b). Pressure momentum terms measured at the FC lower outlet (c) and their respective average values and peak-to-peak amplitudes (d). Dynamic mass flow momentum terms measured at the FC lower outlet (e), and their respective average values and peak-to-peak amplitudes (f). Instantaneous net momentum obtained when considering pressure and mass flow momentum terms at both FC outlets (g), average values, and the peak-to-peak amplitudes (h).
Preprints 119018 g019
Figure 20. Unsteady mass flow and pressure forces measured at both feedback channel outlets and the overall forces acting on the jet; about half of a cycle is presented here. Case smallest feedback channel width, FC1.
Preprints 119018 g020
Table 1. y+ values from the 3D simulation at different walls belonging to the FO. R e = 54,595 .
Wall Min y+ Average y+ Max y+
Front & Back 1.717e-03 1.397 8.822
Internal walls 9.347e-04 6.512e-01 2.178e+01
Table 2. Summary of the boundary conditions for the 3D standard case (STD), also called the baseline case. R e = 54,595 .
k (m2/s2) Omega (s−1) Nut (m2/s) P (Pa) U (m/s)
inlet 1.5 · 10−4 0.152 9.9 · 10−4 zeroGradient 10
outlet zeroGradient zeroGradient zeroGradient 105 zeroGradient
Front & Back 10−20 omegaWallFunction value = 10−5 nutWallFunction value = 10−7 zero Gradient 0
Internal walls 10−20 omegaWallFunction value = 10−5 nutWallFunction value = 10−7 zero Gradient 0
Table 3. The different mixing chamber inlet angles δ considered in the present study.
Inlet angles Evaluated
Inlet angle δ δ 1 = δ S T D + 15 ° δ 2 = δ S T D δ 3 = δ S T D 10 ° δ 4 = δ S T D 15 °
MC entrance width ( m ) 0.022 0.0255 0.032 0.04
Inlet section name Entrance 1 STD = Entrance 2 Entrance 3 Entrance 4
Table 4. The different feedback channel modifications considered in the present study.
Feedback channel dimensions evaluated
FC modifications W 1 = ( 1 / 3 ) W S T D W 2 = ( 2 / 3 ) W S T D W 3 = W S T D = ( R e x t R i n t ) W 4 = ( 4 / 3 ) W S T D
FC width ( m ) 0.01073 3 ^ 0.02146 6 ^ 0.0322 0.0429 9 ^
FC name FC 1 FC 2 STD = FC 3 FC 4
Disclaimer/Publisher’s Note: The statements, opinions and data contained in all publications are solely those of the individual author(s) and contributor(s) and not of MDPI and/or the editor(s). MDPI and/or the editor(s) disclaim responsibility for any injury to people or property resulting from any ideas, methods, instructions or products referred to in the content.
Copyright: This open access article is published under a Creative Commons CC BY 4.0 license, which permit the free download, distribution, and reuse, provided that the author and preprint are cited in any reuse.
Prerpints.org logo

Preprints.org is a free preprint server supported by MDPI in Basel, Switzerland.

Subscribe

© 2024 MDPI (Basel, Switzerland) unless otherwise stated