Preprint
Article

Analysis of Cow Milk Fatty Acid and Protein Composition in Different Breeds and Regions

Altmetrics

Downloads

65

Views

24

Comments

0

A peer-reviewed article of this preprint also exists.

Submitted:

23 September 2024

Posted:

24 September 2024

You are already at the latest version

Alerts
Abstract
Cow milk is rich in proteins, fats, carbohydrates, and minerals, and its nutrient content depends on various factors. We tested differences in fatty acid and protein contents of milk from seven breeds and regions, including three dairy breed samples: Holstein milk from Beijing, China (BH); Holstein milk from Hebei province, China; Jersey milk (JS); and four dairy/meat cow samples: Sanhe milk, Xinjiang brown milk (XH), Simmental milk, and Shu Xuanhua milk. Breed significantly affected total fat, fatty acid, and protein contents. The region significantly affected the contents of different fatty acids, α-lactalbumin, and lactoferrin. JS had the highest total fat, most fatty acids, and casein contents. XH performed well with significantly higher unsaturated fatty acid content than BH, which was not significantly different from JS, and its protein composition of low β-lactoglobulin and high lactoferrin was more similar to breast milk, which may thus be favorable to the growth and development of children. Our results may inform the development of dairy products from different cow breeds and advance the process of accurate breed identification.
Keywords: 
Subject: Biology and Life Sciences  -   Other

1. Introduction

Milk is a complex fluid produced by the mammary glands. It meets the nutritional needs of newborn mammals during the early critical period of physical development and provides essential nutrients for growth and development. Cow milk has long been the predominant source of milk and dairy products, with over 95% of dairy products originating from cow milk, except in the Mediterranean Basin countries [1]. Cow milk is a rich source of essential nutrients, including proteins, lipids, lactose, vitamins, and minerals, and is known as "white blood". Therefore, it constitutes a significant component of many individuals’ diets. Milk is a high-quality source of dietary proteins for humans, which are predominantly categorized into casein and whey proteins. In addition, because of its unique amino acid composition, cow milk protein is a source of various bioactive peptides [2]. Milk lipids are the major components of milk, and triacylglycerols comprise approximately 98% of the lipid composition and consist of fatty acids of different lengths and saturations [3]. Cow milk composition is influenced by various factors including season, feed, cow breed, lactation period, and individual’s age and health condition [4].
Holstein cows are a globally popular breed of dairy cows, with the highest milk production and largest number of cows bred [5]. Chinese Holstein cows are bred by crossbreeding local Chinese yellow cows with imported Holstein cows [6]. More than 85% of the nearly 10.44 million dairy cows raised in China are Holstein dairy cows, with a small number of Jersey cows [7]. Jersey is one of the oldest dairy breeds and is known for high rates of milk fat and milk protein [8]. Apart from Holstein and Jersey, there are several dairy/meat cows in China, such as Sanhe, Xinjiang brown, Simmental, and Shu Xuanhua cows. Sanhe cows, originating from the Inner Mongolia Autonomous Region of China, are a local breed with high tolerance to roughage, high adaptability, disease resistance, and stable genetic properties [9]. Xinjiang brown cows are highly adaptable and resistant to extreme weather conditions and are therefore commonly kept grazing in the northern part of Xinjiang, China [10]. One of the largest Simmental farms in China is also located in Xinjiang. The Ministry of Agriculture considers Simmental cattle the main breed of cows in the country because of their high milk production, good meat quality, disease resistance, and tolerance of roughage [11]. The pedigree of Shu Xuanhua cows includes yellow, Simmental, and Holstein cows, and they are adapted to the high temperatures and humidity of the natural climate and a high proportion of roughage in the diet and management conditions of the agricultural areas in southern China [12].
These dairy/meat cows are an important source of meat and milk for people living in different regions of China; however, data on the main nutritional components of their milk are lacking. These data may inform dairy processing to increase the amounts of certain active compounds in milk. Moreover, such information also lays the foundation for accurately identifying different cow breeds. Therefore, it is essential to understand the contents and functions of the major proteins and fatty acids in milk of the various breeds. We thus examined the contents of major proteins and fatty acids in the milk of different breeds to inform improved utilization of these breeds.

2. Results

This section may be divided by subheadings. It should provide a concise and precise description of the experimental results, their interpretation, as well as the experimental conclusions that can be drawn.

2.1. Fat Content of Milk per Breed/Region

The fat contents of the different milk samples are shown in Figure 1. JS had the highest fat content (47.3±1.0 mg/mL), which was significantly higher than the milk of the other breeds and 1.3-fold higher than BH. SX had the lowest fat content (19.9±1.7 mg/mL), which was significantly lower than that of BH, HH, JS, SH, and XH. No significant differences were observed between the fat contents of BH, HH, SH, and XH and in the fat content of Holstein milk from different regions (BH vs. HH). SH and XH had significantly higher fat contents than SI. Overall, the total fat content of milk of the four dairy/meat breeds was not higher than that of Holstein cows.
Differences in fat content were observed between the breeds of dairy cows, and they varied in size. Table 1 shows the coefficients of variation of fat content in different milk samples. The coefficient of variation of the fat content in milk was the highest in SX, with the maximum value being 10-fold higher than the minimum. The coefficient of variation of fat content in the BH was the smallest, and the maximum value was three times the minimum value. It can also be observed from the box scatter plot in Figure 1 that the data distribution was tighter for BH and more dispersed for SX.

2.2. Fatty Acid Content of Different Dairy Breeds

The types and contents of the 17 fatty acids in different milk samples are shown in Table 2, indicating that the content of different fatty acids in milk varied significantly among breeds. The most abundant fatty acids in the milk of the different breeds were C14:0, C16:0, C18:0, and C18:1, and the less abundant fatty acids were C20:1, C20:4, C20:5, and C22:6.
Among dairy cows, all fatty acid contents of JS, except for C22:6, were significantly higher than those of BH. JS had significantly higher C6:0, C8:0, C10:0, C12:0, C14:0, C16:0, C18:0, C18:1, C20:1, and C20:5 contents than HH, and there were no significant differences in other fatty acids. In Holstein milk from different regions, all fatty acids were significantly different, except for C8:0, C10:0, C12:0, C14:0, C18:0, and C20:5.
In the milk of dairy/meat cows, XH had the highest content of C18:0, C18:1, C18:3, C20:1, C20:5, and C22:6, which was significantly higher than that of the other breeds. The fatty acid content of SH was significantly higher than those of SI and SX, except for C18:0, C18:1, C18:3, C20:1, and C22:6. That of SI was significantly higher than that of SX only with regard to C8:0, and the remaining fatty acids were not significantly different.
Compared with BH, XH was significantly higher in all fatty acids except C6:0, and SH was significantly higher in all fatty acids except C6:0, C18:0, C18:2, and C18:3. The content of C14:1, C18:3, C20:1, C20:5, and C22:6 in XH and C14:1 in SH were more than twice as high as those in BH; however, the C6:0, C10:0, C12, C14:0, and C18:2 contents in SI were significantly lower than those in BH. Similar results were obtained for SX. In addition, the C22:6 content in the SI was significantly higher than that in BH. The C12:0, C14:0, C16:0, C18:0, and C18:2 contents were significantly lower in JS than in the milk of the four dairy/meat cows. In particular, XH had significantly higher levels of C18:3, C20:5, and C22:6 than JS, whereas the levels of C22:6 in SI and SX were not significantly different from those in JS. Among the seven cow milk samples, XH showed the highest levels of C20:5 and C22:6.
Differences also occurred in the fatty acid content of different varieties of milk. Table 3 shows the coefficient of variation of fatty acid content in the different milk samples. The larger coefficients of variation for the milk of different breeds were concentrated in C20:5 and C22:6. The coefficients of variation for C16:1 in SX, C20:5 in JS, SI, and SX, and C22:6 in HH, SH, and SX exceeded 90%. SX had the largest coefficient of variation for C22:6, with 149-fold the difference between the maximum and minimum values. JS had the smallest coefficient of variation for C14:0, with the maximum value being four times the minimum. The coefficients of variation for all fatty acids were less than those of HH, except for C14:1 and C20:5. In Holstein milk from different regions, the coefficients of variation for all fatty acids were smaller in BH than in HH. The coefficients of variation for all fatty acids were greater in SX than in SH and XH. SX had coefficients of variation greater than SI for all fatty acids, except C10:0, C18:0, C18:1, and C18:2. The coefficients of variation for all fatty acid contents were greater than those for BH in the milk of the four dairy/meat cows, indicating greater intraspecific variation than BH.

2.3. Different Types of Fatty Acids per Breeds/Region

Fatty acids can be categorized as saturated fatty acids (SFA), monounsaturated fatty acids (MUFA), or polyunsaturated fatty acids (PUFA) according to the degree of saturation. SFA do not contain double bonds, MUFA have only one double bond, and PUFA are straight-chain fatty acids containing two or more double bonds with a carbon chain length of 18 to 22 carbon atoms [13]. Table 4 shows the types of fatty acids in different milk types, indicating that breed has a significant effect on the content of different types of fatty acids.
All milk varieties had the highest content of SFA and the lowest content of PUFA. Among dairy cows, there were significant differences in the SFA, MUFA, and PUFA contents in Holstein milk from different regions. JS had significantly higher SFA and MUFA contents than Holstein milk; however, MUFA was significantly higher in JS than in BH, with no significant difference from HH. In dairy cow milk, SFA, MUFA, and PUFA contents were significantly higher in XH and SH than in SI and SX. XH had significantly higher levels of MUFA than SH. No significant differences were found between SI and SX in SFA, MUFA, or PUFA.
Compared to BH, XH and SH had significantly higher levels of SFA, MUFA, and PUFA, and SI and SX had significantly lower levels of SFA. In addition, SI contained significantly lower levels of PUFA than BH. The contents of different types of fatty acids in the milk of the three dairy/meat cows were significantly lower than those of JS, with the exception of XH. XH exhibited significantly lower SFA levels than JS. SI and SX had significantly lower levels of SFA than the milk from the three dairy cows. The SI and PUFA contents were significantly lower than those in the three dairy cow milk samples.
PUFA molecules with the first double bond located on the third carbon atom from the methyl end are termed n—3 fatty acids, whereas those where it is located on the sixth carbon atom are called n-6 fatty acids [13]. In the milk of dairy cows, there were significant differences in the contents of n-3 and n-6 PUFA in Holstein milk from different regions. Both the n-3 and n-6 PUFA contents of JS were significantly higher than those of BH and were not significantly different from those of HH. In the dairy/meat cows, the content of n-6 PUFA was significantly higher in XH and SH than in SI and SX, whereas the n-3 PUFA content was significantly higher in XH than in SH, SI, and SX. There was no significant difference between SI and SX in either n-6 or n-3 PUFA content.
XH and SH contained significantly higher levels of n-6 PUFA than BH. In addition, the n-3 PUFA content in XH was significantly higher than that in BH. The n-6 PUFA content was significantly lower in SI and SX than in BH, and the n-3 PUFA content in SI and SX was not significantly different from BH. The n-6 and n-3 PUFA contents of dairy/meat cow milk were significantly lower than those of JS, except for the n-3 PUFA content in XH.

2.4. Proportions of Different Types of Fatty Acids per Breed/Region

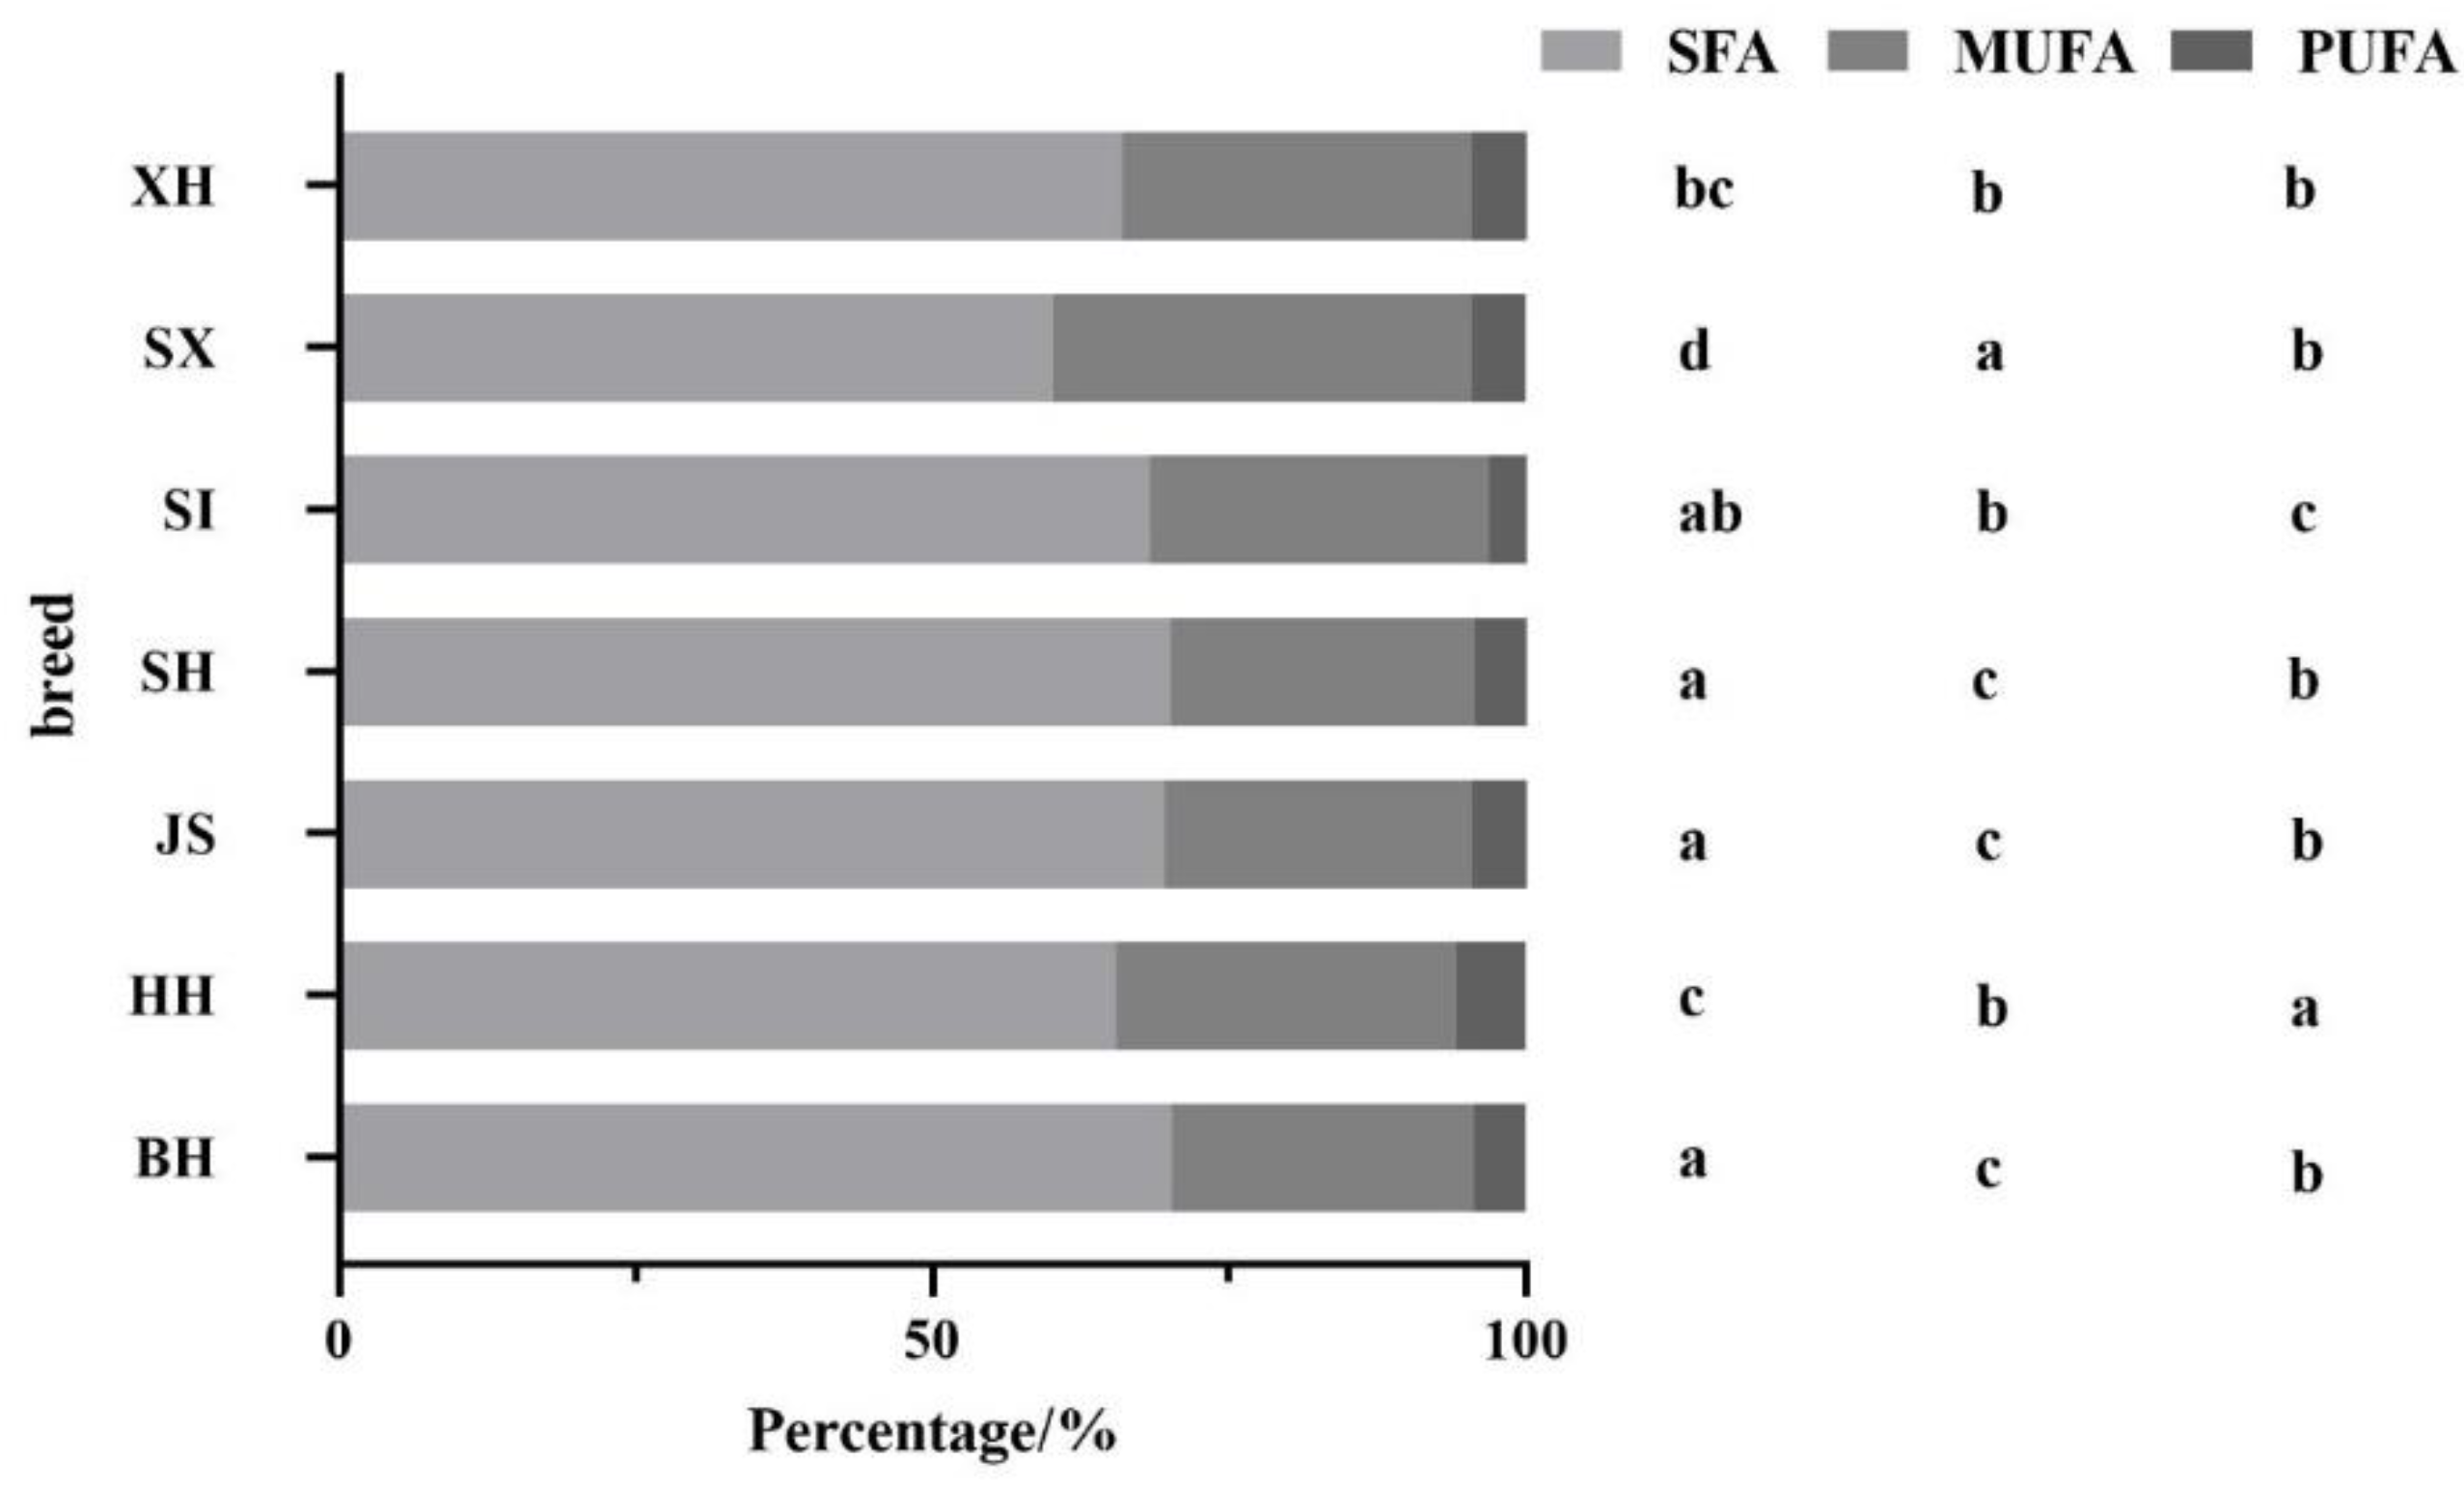
Figure 2 shows the percentages of different types of fatty acids in relation to total fatty acids in different milk samples. The samples showed the highest percentage of SFA and the lowest percentage of PUFA. Among dairy cow milk samples, the percentages of SFA, MUFA, and PUFA in JS differed significantly from those in HH, but there was no significant difference from those in BH. There were significant differences in the percentages of SFA, MUFA, and PUFA in Holstein milk samples from the different regions. In dairy cow milk, SX had the lowest percentage of SFA and the highest percentage of MUFA. SI had the lowest percentage of PUFA, which was significantly lower than that of the other three dairy cow milk samples.
Compared with dairy cow milk, SX and XH had significantly lower percentages of SFA than BH and JS. SI, SX, and XH contained significantly higher percentages of MUFA than BH and JS. The percentage of PUFA in the milk of dairy/meat cows was not significantly different between BH and JS but was significantly lower in SI. Overall, neither the SFA nor the PUFA percentage of dairy/meat cow milk was higher than that of BH, and the PUFA percentage, in particular, was not higher than that of any of the three dairy cow milk samples.
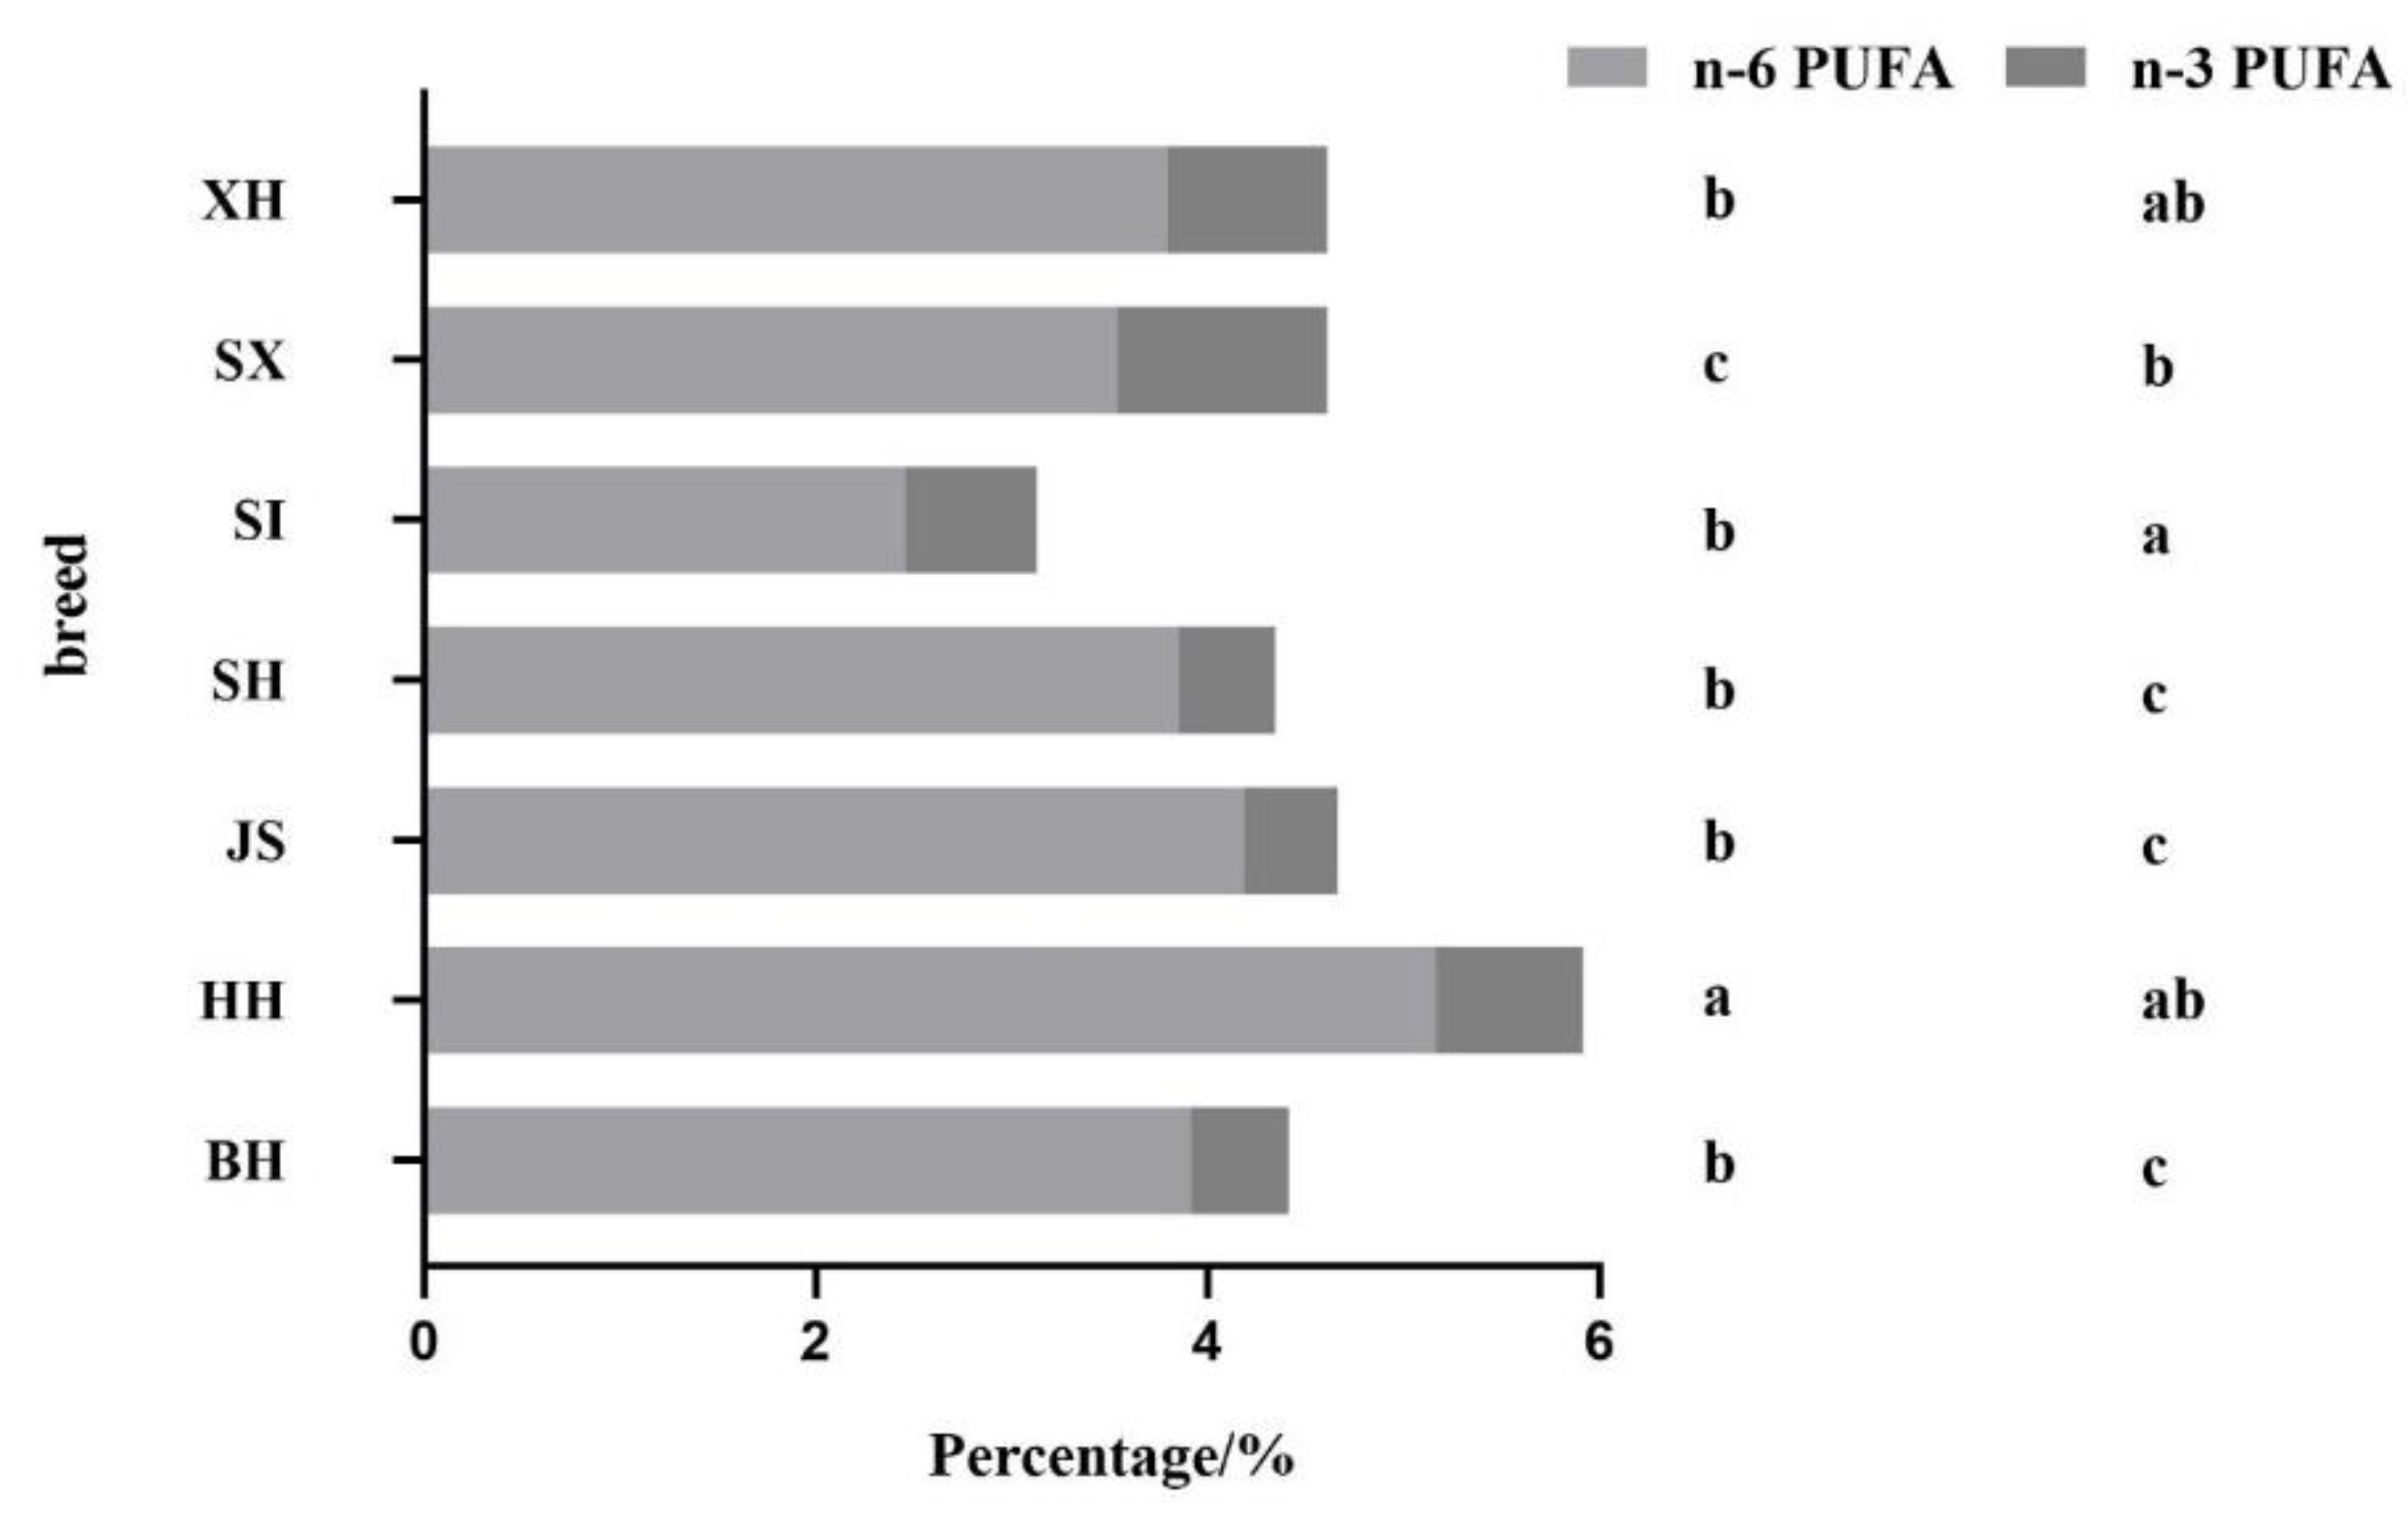
Figure 3 shows the ratios of different types of polyunsaturated fatty acids to total fatty acids in different milk samples. HH had the highest percentage of n-6 PUFA (5.17%), which was significantly higher than that in milk from other breeds. SI had the lowest percentage of n-6 PUFA (2.47%), which was significantly lower than that in milk from other breeds. There were no significant differences in the percentages of n-6 PUFA in BH, JS, SH, XH, and SX. SX had the highest percentage of n-3 PUFA (1.08%), which was significantly higher than that of BH, JS, and SH. JS had the lowest value (0.48%), which was significantly lower than that of HH, XH, SI, and SX. In Holstein cow milk from different regions, HH had a significantly higher percentage of n-6 and n-3 PUFA than BH. Overall, milk from dairy cows did not have as high a percentage of n-6 PUFA as milk from dairy cows, but the percentage of n-3 PUFA was higher than that in BH.

2.5. Protein Content per Breed/Region

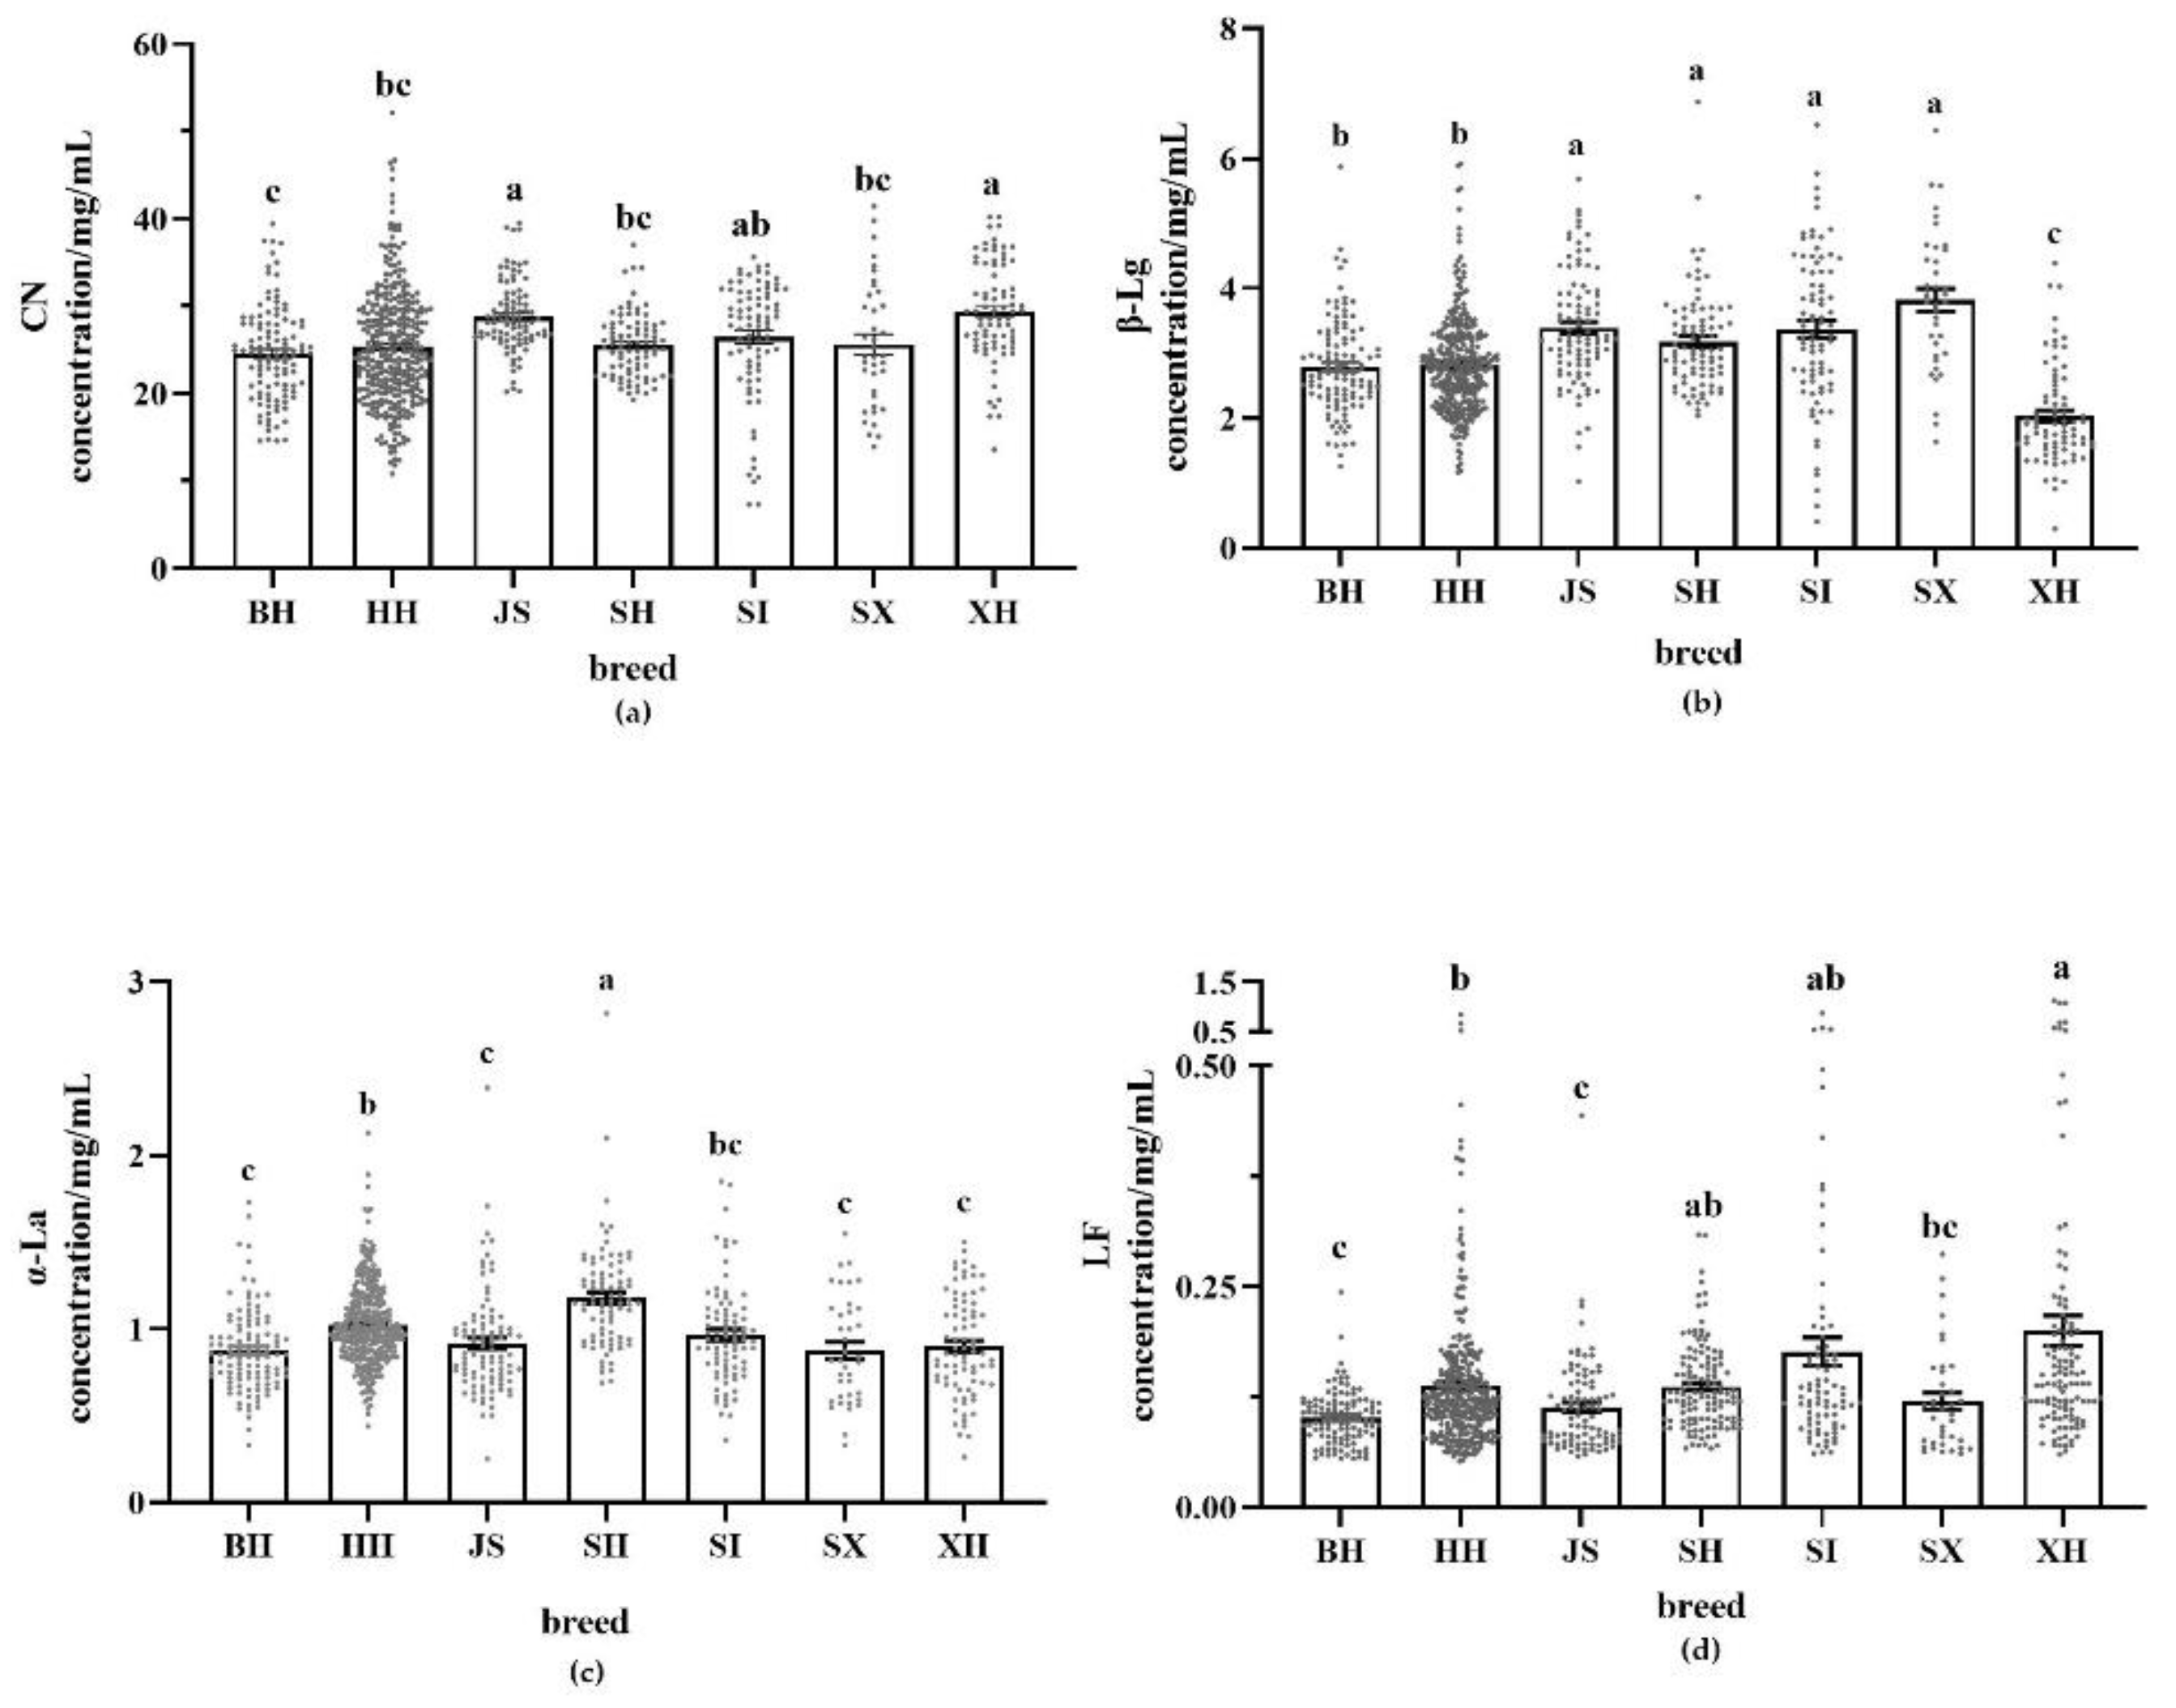
Figure 4 shows the contents of the four proteins in different milk samples. The content of different proteins in milk varies significantly among breeds. In all types of milk, CN was the most abundant protein. In whey protein, the most abundant fraction was β-Lg and the least abundant LF.
XH had the highest CN content (29.41 mg/mL), significantly higher than Holstein milk, and the lowest β-Lg content (2.03 mg/mL), significantly lower than the other breeds. In addition, XH had the highest LF content (0.20 mg/mL), which was significantly higher than that in the milk of the three dairy cows and twice as high as that in BH. The highest β-Lg content was SX (3.82 mg/mL), which was significantly higher than Holstein milk. SH had the highest α-La content (1.18 mg/mL), which was significantly higher than that of the other breeds. In Holstein milk from different regions, the content of α-La and LF was significantly higher in HH than in BH. Both CN and β-Lg contents were significantly higher in JS than in Holstein milk, while α-La and LF contents were significantly higher in HH than in BH and JS. There were no significant differences in the contents of any of the four proteins in SH, SI, and SX. Overall, the LF content in dairy cow milk was higher than that of dairy cow milk.
Table 5 shows the coefficient of variation of protein content in the different milk samples. LF had the largest coefficient of variation among all the proteins tested. XH had the largest LF coefficient of variation, with the maximum value being 17 times the minimum value, suggesting that the LF content of XH varied individually within the species. The coefficients of variation for all four proteins of SI and SX were greater than those of BH, indicating that their protein contents were more strongly affected by individual differences than in BH. JS had smaller coefficients of variation for the more abundant proteins (CN and β-Lg) than Holstein milk, but larger coefficients of variation for the less abundant proteins (α-La and LF) than Holstein milk.

2.6. Proportions of Different Types of Proteins per Breeds/Region

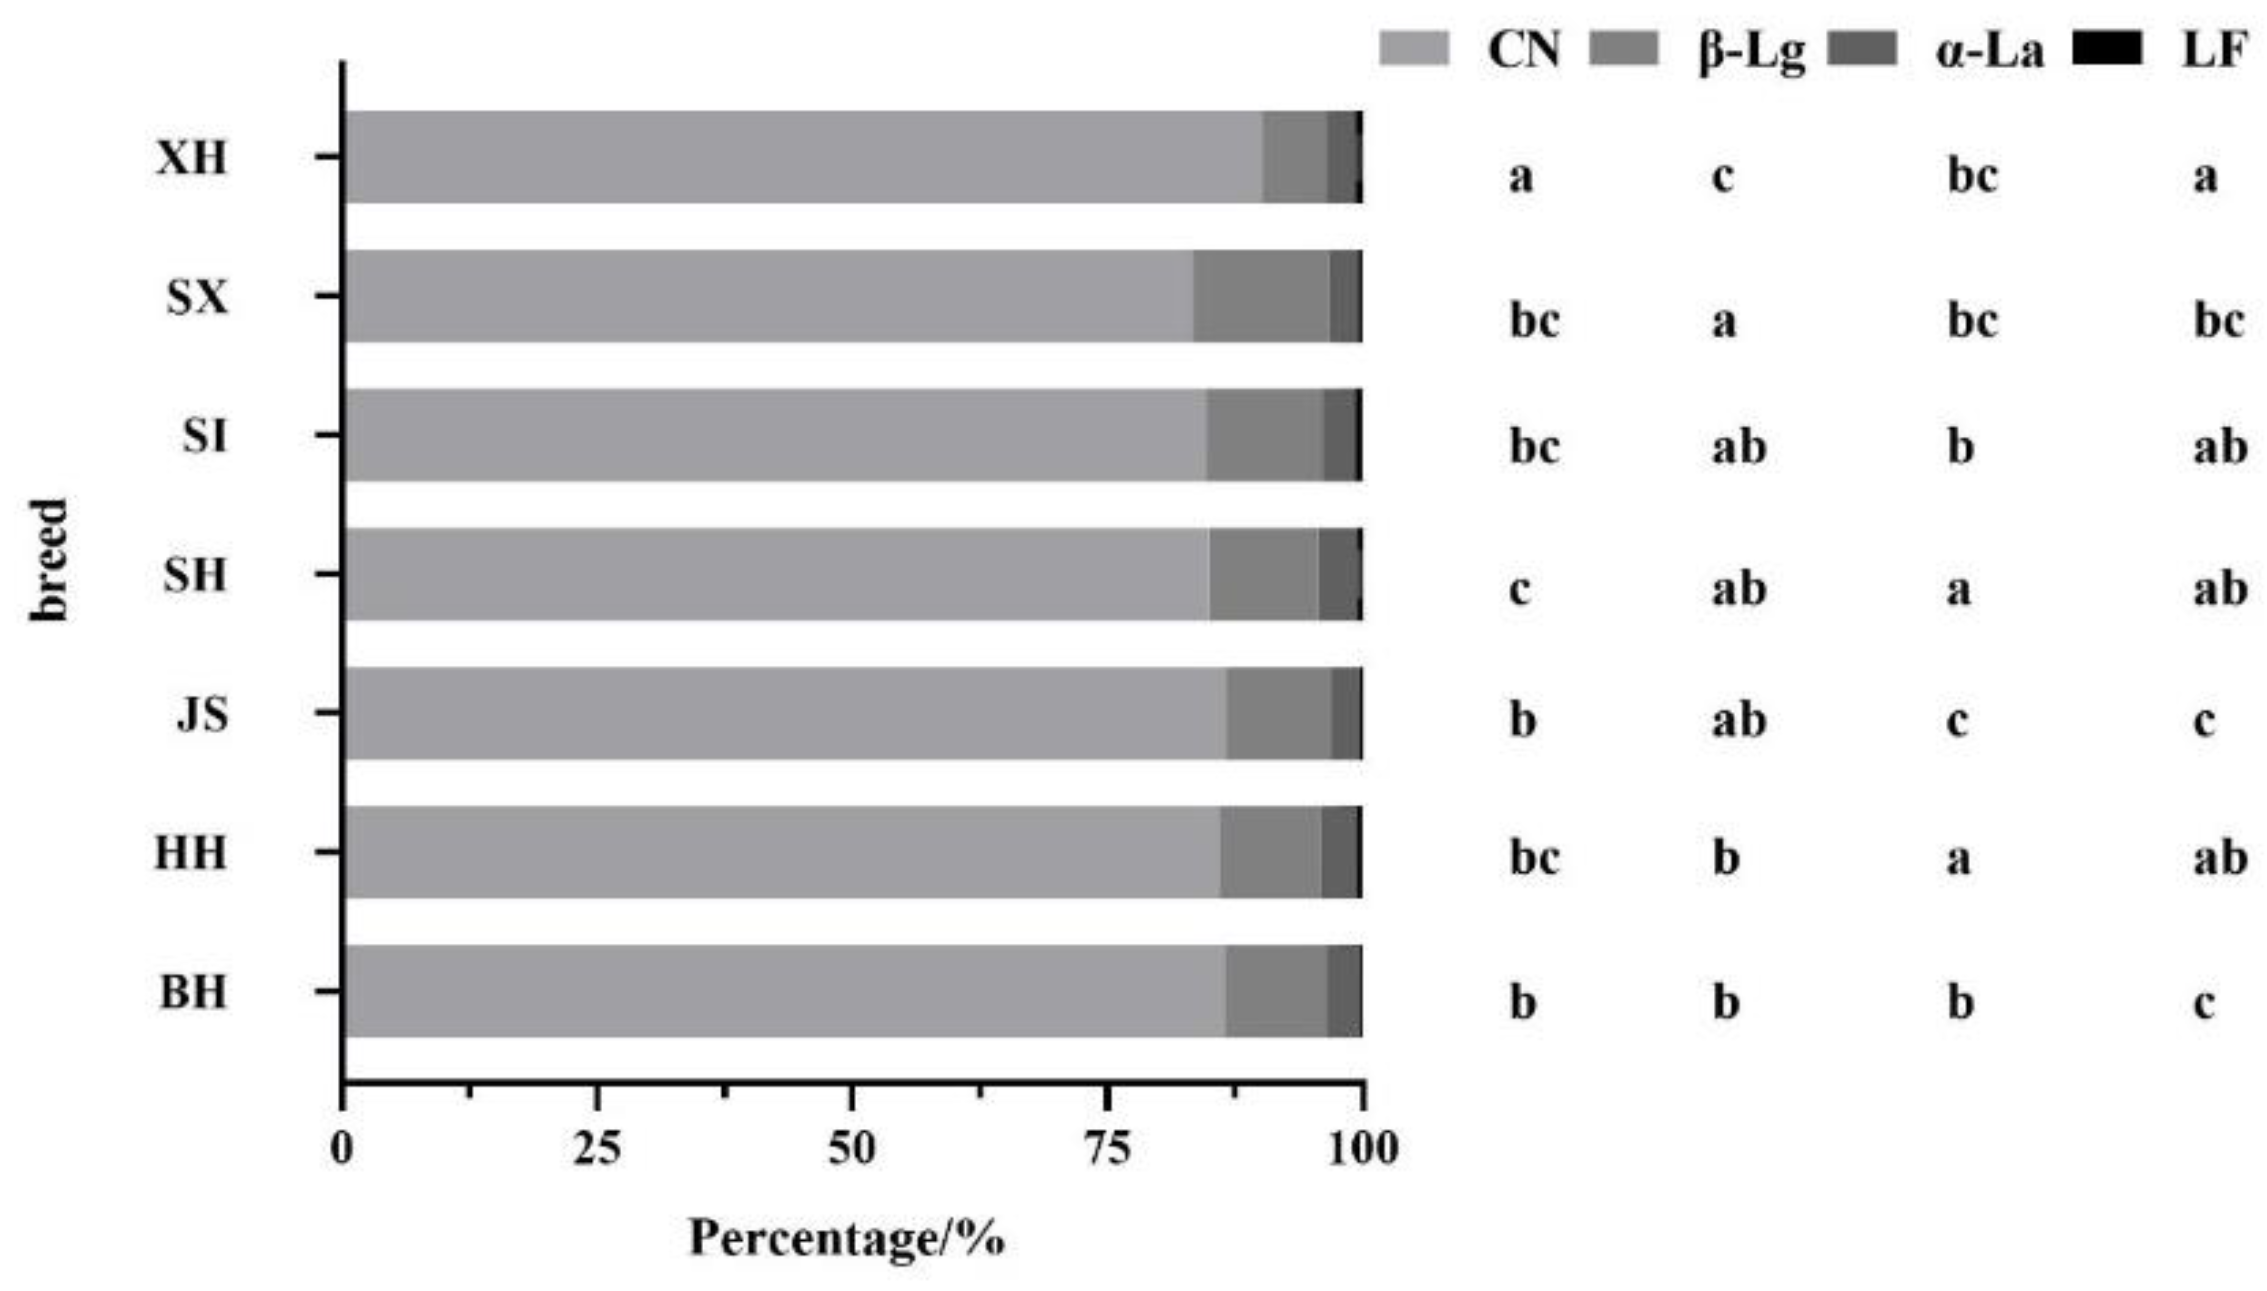
Figure 5 shows the ratio of different types of proteins to total proteins in different milk samples. JS had the lowest percentage of α-La, significantly lower than Holstein milk. The lowest LF content was observed in JS and was significantly lower than that in HH. In Holstein milk from different regions, the percentage of α-La and LF was significantly higher in HH than in BH. XH had the highest percentage of CN, significantly higher than the milk of other breeds, and the lowest percentage of β-Lg, which was significantly lower than the milk of other breeds. There was no significant difference in the percentage of the four proteins between SI and SX groups.
Compared to BH, SH and XH had a significantly higher percentage of LF, and SI and SX had a significantly higher percentage of β-Lg. SH and SI had significantly higher percentages of both α-La and LF than JS.

3. Discussion

Few studies have compared the nutrients in Holstein milk with those in milk of other Chinese dairy cow breeds. The present study showed a highly significant effect of breed on fat, fatty acid, and protein contents. The region had a significant effect on different types of fatty acid content, α-La, and LF. HH performed better than BH.
Milk fat is a high-value component containing numerous fat-soluble vitamins. It has a digestibility of more than 98% in the human gastrointestinal tract and is an important indicator of milk quality [14]. The mean fat content of the milk of all dairy cows was higher than that of the dairy/meat cows. JS had the highest mean fat content compared to the other types, and the distribution of data was more concentrated, with less individual variation. The mean fat content of XH was second only to that of JS but varied widely among individuals, with one individual reaching 109.3 mg/mL. The region did not affect the milk fat content as much as the breed. There was no significant difference in the milk fat content of Holstein cows from the different regions; however, HH showed greater individual variation in fat content than BH, with one individual reaching 108.4 mg/mL.
Unlike human milk, bovine milk contains higher levels of SFA than MUFA and PUFA. With regard to the fat content results, JS had the highest C16:0 content, which is the most abundant SFA in cow milk; however, the highest C16:0 content was observed in HH (33.015 mg/mL). Oleic acid, the most abundant MUFA in milk, has beneficial anti-inflammatory effects in autoimmune diseases, protective effects against cancer, and improves immune system function [15]. In contrast to the fat content results, the highest mean content of C18:1 was found in XH, with one individual reaching 28.763 mg/mL. PUFA can regulate a wide range of homeostatic and inflammatory processes associated with various diseases, either directly or through conversion into locally acting bioactive metabolites. Among these, n-6 and n-3 PUFA are essential fatty acids that cannot be synthesized by the human body and can only be obtained from external sources. They have many beneficial effects, are essential for brain and vision development, act as natural lipid-lowering agents, reduce the risk of cardiovascular syndromes, and may prevent the progression of insulin resistance and obesity [16,17]. JS had the highest mean levels of PUFA and n-6 PUFA, but the highest percentage occurred in HH. SX had the highest percentage of n-3 PUFA, although the average n-3 PUFA content was not high. It is generally accepted that the greater the proportion of PUFA in milk, the better the fat composition and the stronger the beneficial effects on human health. Therefore, HH and SX were found to be superior to the other milk varieties in this study. In addition to the levels of n-6 and n-3 PUFA, the ratio of n-6 to n-3 PUFA has received widespread attention and is recognized as an important determinant of health. An increased ratio of n-6 PUFA to n-3 PUFA is highly pro-thrombotic and pro-inflammatory and contributes to the prevalence of atherosclerosis, obesity, diabetes, and inflammatory autoimmune diseases; however, the optimal ratio may vary depending on the disease. In general, a lower ratio of n-6 to n-3 PUFA is favorable for reducing the risk of many chronic diseases that are highly prevalent in Western societies and developing countries [18]. Interestingly, JS, which performed well in previous studies, had the highest ratio of n-6 to n-3 PUFA. In contrast, SI, which was considered mediocre previously, had the lowest ratio of n-6 PUFA to n-3 PUFA and may be more beneficial for human health. The region had a significant effect on the milk fatty acid content of the fraction, but the n-6 PUFA to n-3 PUFA ratio of Holstein milk did not differ significantly between regions.
The dietary levels of milk proteins play a key role in both infant and adult health. The main protein in cow milk is CN, which represents approximately 80% of the total protein and 20% of whey protein. β-Lg represents approximately 50% of whey protein and can bind to fatty acids and stimulate lipase activity; [19] however, as it is not present in human milk, β-Lg is the main allergen in infants [20]. α-La is the major protein in human milk, accounting for approximately 22% of bovine whey protein, and it binds metal ions and participates in the process of lactose synthesis [21]. LF is a functional protein present in milk, and studies have reported its beneficial effects, including antibacterial, antiviral, antifungal, anti-inflammatory, and anticancer effects [22]. Human milk is an ideal food for newborns; however, breastfeeding may not be an option because of the mother's health or social reasons. Then, infant formula is the primary food source for newborns. Infant formulas have been formulated as substitutes for breast milk to mimic breast milk in terms of nutrients. Currently, proteins in infant formulas on the market are mainly derived from cow milk or bovine whey powder. Therefore, it is essential to identify cow's milk that is more comparable to human milk. In this study, it was found that the low β-Lg content of XH was accompanied by its high LF content, which is more beneficial for infant health. The mean α-La content of SH was the highest, with an individual content of 2.82 mg/mL. Some individuals from the HH, XH, and SI groups had LF levels above 0.5 mg/mL. One individual from XH had the highest LF level of 1.13 mg/mL, which is similar to the LF level in normal human milk [23].

4. Materials and Methods

4.1. Milk Collection

Milk samples from seven cow breeds/regions were collected in China from September 2022 through February 2023. Holstein milk was collected from Beijing (BH) and Hebei provinces (HH). Jersey milk (JS) was collected from Hebei province; Sanhe milk (SH) was collected from the Inner Mongolia Autonomous Region; Xinjiang brown milk (XH) and Simmental milk (SI) were collected in the Xinjiang Uygur Autonomous Region; and Shu Xuanhua milk (SX) was collected in Sichuan province. All milk samples were placed on dry ice immediately after collection and were tested within 1 month.

4.2. Reagents

Seventeen types of fatty acid methyl ester standards were used: methyl caproate, methyl caprylate, methyl caprate, methyl laurate, methyl myristate, methyl pentadecanoate, methyl palmitate, methyl stearate, methyl cis-9-myristoleate, methyl cis-9-palmitoleate, methyl cis-9-oleate, methyl cis-9-12-linoleate, methyl cis-9-12-15-linolenate, methyl cis-11-gondoate, methyl cis-5-8-11-14-arachidonate, methyl cis-4-7-10-13-16-19-eicosapentaenoate, and methyl cis-5-8-11-14-docosahexaenoic acid (J&K Scientific, Beijing, China). Three types of whey protein standards were used: β-lactoglobulin, α-lactalbumin, and lactoferrin (Sigma-Aldrich, Beijing, China). Other reagents included anhydrous ethanol, ammonia (25%–28%), petroleum ether (boiling range 30–60 °C), ethyl ether, sodium hydroxide, anhydrous sodium sulfate, sodium chloride, boron trifluoride methanol solution (10%), methanol, n-heptane, ultrapure water, hydrochloric acid, acetonitrile, trifluoroacetic acid (Macklin, Shanghai, China).

4.3. Milk Fat Measurement

Milk fat was determined using the third method, alkaline hydrolysis, of the “GB 5009.6-2016 National Standard for Food Safety - Determination of Fat in Foods [24]” with slight modifications as follows: frozen cow milk was thawed in a refrigerator at 4 °C and vortexed to mix. then, 1 mL milk was thoroughly mixed with 1 mL anhydrous ethanol and 1 mL ammonia. The solution was placed in a water bath at 55 °C for 20 minutes for hydrolysis. After hydrolysis, the samples were removed from the water bath and cooled to room temperature. Next, 3 mL ethanol was mixed thoroughly with the hydrolyzed milk, followed by adding 5 mL ether and shaking for 1 min. Then, 5 mL petroleum ether was added followed by shaking for 30 seconds. The solution was thoroughly mixed to extract the fat. Then, it was allowed to stand for 30 min to separate the layers, and the upper layer of the solution was collected. The extraction process was repeated, the extracts were combined, and the mixture was placed in a boiling water bath to evaporate the solvent, with the residue being milk fat. The samples were dried to constant weight, and the fat content was recorded.

4.4. Milk Fatty Acid Measurement

Milk fatty acid determination was performed using the second external standard method of the “GB 5009.168-2016 National Standard for Food Safety - Determination of Fatty Acids in Foods [25]”, with slight modifications, as indicated below.

4.4.1. Methylation of Milk Fatty Acids

To 2.3 extracted milk fat, 10 mL of 2% sodium hydroxide methanol solution was added, followed by heating in a metal bath at 81 °C until the oil droplets disappeared. Then, 7 mL of a 10% boron trifluoride methanol solution was added, and heating was continued for 2 min for methyl esterification. After heating, 10 mL n-heptane and 5 mL saturated sodium chloride solution were added, followed by thorough mixing, shaking, and leaving it to stratify. Then, 3 mL of the extract above was added to 2 g anhydrous sodium sulfate to remove the water. The layers were then allowed to separate, and the upper layer of the clarified solution was collected and filtered.

4.4.2. Milk Fatty Acid Measurement

Fatty acid methyl esters were used for gas chromatograph detection of 17 fatty acids, including caproic acid (C6:0), caprylic acid (C8:0), capric acid (C10:0), lauric acid (C12:0), myristic acid (C14:0), pentadecanoic acid (C15:0), palmitic acid (C16:0), stearic acid (C18:0), myristoleic acid (C14:1), palmitoleic acid (C16:1), oleic acid (C18:1), linoleic acid (C18:2), linolenic acid (C18:3), gondoic acid (C20:1), arachidonic acid (C20:4), eicosapentaenoic acid (C20:5), and docosahexaenoic acid (C22:6). The gas chromatograph was equipped with a hydrogen flame ionization detector. The capillary column model was a DB-WAX (30 m × 0.25 mm × 0.25 μm). The temperature of the inlet was 250 °C, and the temperature of the detector was 280 °C. Nitrogen was used as a carrier gas at a flow rate of 1 mL/min. The injection volume was 1 μL. The initial temperature was 50 °C for 1 min, which then increased at 25 °C/min to 200 °C, and then at 3 °C/min to 230 °C for 10 min. Different concentrations of fatty acid standards were prepared using n-heptane and detected under the same chromatographic conditions. A standard curve was established with the concentration as the horizontal coordinate and the peak area as the vertical coordinate. The external standard method was used to characterize the standard based on its retention time and quantify the peak area.

4.5. Milk Protein Measurement

4.5.1. Extraction of Milk Proteins

Frozen buttermilk was thawed in the refrigerator at 4 ℃ and vortexed to mix. Then, 5 mL milk was adjusted to pH 4.60±0.01 using 1 mol/L HCL. After precipitation at room temperature for 1 h, the milk was centrifuged at 4 °C and 15,000 r/min for 30 min. The upper-fat layer was removed, and the milk was centrifuged again under the same conditions.

4.5.2. Casein Content Measurement

The method of casein (CN) determination was based on that of Han et al., with minor modifications [26]. The lower layer of the precipitate was washed sequentially with 1 mL of distilled water, followed by ethanol, an ethanol-ether 1:1 mixture, and finally with ether., and dried at 60 °C in a drying oven for 2 h. The mixture was then cooled in a glass desiccator for 30 min to obtain CN.

4.5.3. Whey Protein Measurement

The whey protein determination method was used as per Ostertag et al., with minor modifications [27]. A volume of 100 μL of the upper layer of the clear solution was diluted tenfold, filtered, and subjected to high-performance liquid chromatography for the detection of three kinds of whey proteins, including β-lactoglobulin (β-Lg), α-lactalbumin (α-La), and lactoferrin (LF).
High-performance liquid chromatography was performed with a UV detector. A ZORBAX SB 300 C8 column (4.6 mm × 250 mm × 5 µm) was used. The temperature of the column oven was 45 °C. The detection wavelength was 210 nm. The detection wavelength was 210 nm, and mobile phase A was a 0.1% trifluoroacetic acid-water solution. Mobile phase B was a 0.1% trifluoroacetic acid-acetonitrile solution. The flow rate was 0.8 mL/min, and the injection volume was 20 μL. Gradient elution was performed, and the initial mobile phase B ratio was 35% for 1 min, increased to 60% at 8 min, and increased to 70% at 9 min for 1 min. Whey protein standards of different concentrations were prepared in ultrapure water and analyzed under the same chromatographic conditions. The standard curve was established with the concentration as the horizontal coordinate and the peak area as the vertical coordinate. The external standard method was used to characterize the standard based on its retention time and quantify the peak area.

4.6. Statistical Analyses

Microsoft Excel was used to process the data; the results were expressed as means ± standard error. SPSS 27 statistical software was used to analyze the data, and statistical significance is reported at p < 0.05.

5. Conclusions

Our results show that XH is a promising type of milk with more favorable protein composition and PUFA content for infant health than JS. Compared to Holstein milk, XH had significantly higher SFA, MUFA, PUFA, CN, and LF levels than BH. In conclusion, the region did not have a significant effect on total fat and major protein (CN and β-Lg) content but did have a significant effect on mainly fatty acid content (C16:0 and C18:1), α-La, and LF in Holstein cows. Breed had a significant effect on fatty acid and protein content and ratio. Individuals producing high functional fatty acid and protein contents are of particular interest and may be further examined for better exploitation in the future.

Author Contributions

Conceptualization, Y.X.Z. and Y.L.Z.; methodology, Y.X.Z.; software, Y.X.Z.; validation, Y.X.Z., Y.F.C. and Y.L.Z.; formal analysis, Y.X.Z.; investigation, Y.X.Z.; resources, Y.C.W.; data curation, Y.X.Z.; writing—original draft preparation, Y.X.Z.; writing—review and editing, Y.X.Z., Q.Y.M., Y.C.W. and Y.L.Z; visualization, Y.X.Z., Y.C.W. and Y.L.Z.; supervision, Y.C.W. and Y.L.Z.; project administration, Y.L.Z.; funding acquisition, Y.L.Z. All authors have read and agreed to the published version of the manuscript.

Funding

This research was funded by the National Key R&D Program of China (2021YFD1200903), the China Agriculture Research System of MOF, and MARA.

Institutional Review Board Statement

Not applicable.

Informed Consent Statement

Not applicable.

Data Availability Statement

No new data were created or analyzed in this study. Data sharing is not applicable to this article.

Conflicts of Interest

The authors declare no conflicts of interest.

References

  1. Park, Y. W.; Haenlein, G. F. W.; Wendorff, W. L., Overview of Milk of Non-Bovine Mammals (Second Edition). In Handbook of Milk of Non-Bovine Mammals, 2017; pp 1-9.
  2. Lin, T. T.; Meletharayil, G.; Kapoor, R.; Abbaspourrad, A., Bioactives in bovine milk: chemistry, technology, and applications. Nutrition Reviews 2021, 79, (2), 48-69. [CrossRef]
  3. Tzompa-Sosa, D. A.; Meurs, P. P.; van Valenberg, H. J. F., Triacylglycerol Profile of Summer and Winter Bovine Milk Fat and the Feasibility of Triacylglycerol Fragmentation. European Journal of Lipid Science and Technology 2018, 120, (3). [CrossRef]
  4. Khastayeva, A. Z.; Zhamurova, V. S.; Mamayeva, L. A.; Kozhabergenov, A. T.; Karimov, N. Z.; Muratbekova, K. M., Qualitative indicators of milk of Simmental and Holstein cows in different seasons of lactation. Vet World 2021, 14, (4), 956-963. [CrossRef]
  5. Rezagholivand, A.; Nikkhah, A.; Khabbazan, M. H.; Mokhtarzadeh, S.; Dehghan, M.; Mokhtabad, Y.; Sadighi, F.; Safari, F.; Rajaee, A., Feedlot performance, carcass characteristics and economic profits in four Holstein-beef crosses compared with pure-bred Holstein cattle. Livestock Science 2021, 244. [CrossRef]
  6. LIU, B., Comparative Analysis of Nutrient Contents, Fatty Acid Content and Composition of Raw Milk from Dairy Cattle of Different Breeds. Animal Husbandry and Feed Science 2022, 43, (5), 93-97.
  7. ZHANG, S. L.; SUN, D. X., Past, now, and future of Dairy breeding Industry. China Livestock Industry 2021, (15), 22-26.
  8. Huson, H. J.; Sonstegard, T. S.; Godfrey, J.; Hambrook, D.; Wolfe, C.; Wiggans, G.; Blackburn, H.; VanTassell, C. P., A Genetic Investigation of Island Jersey Cattle, the Foundation of the Jersey Breed: Comparing Population Structure and Selection to Guernsey, Holstein, and United States Jersey Cattle. Frontiers in Genetics 2020, 11. [CrossRef]
  9. Zhang, X. Y.; Wang, W.; Cao, Z. J.; Yang, H. J.; Wang, Y. J.; Li, S. L., Effects of altitude on the gut microbiome and metabolomics of Sanhe heifers. Frontiers in Microbiology 2023, 14. [CrossRef]
  10. Zhou, J. H.; Liu, L. Y.; Chen, C. J.; Zhang, M. H.; Lu, X.; Zhang, Z. W.; Huang, X. X.; Shi, Y. G., Genome-wide association study of milk and reproductive traits in dual-purpose Xinjiang Brown cattle. Bmc Genomics 2019, 20, (1). [CrossRef]
  11. Wei, C.; Luo, H. P.; Wang, Y. C.; Huang, X. X.; Zhang, M. H.; Zhang, X. X.; Wang, D.; Ge, J. J.; Xu, L.; Jiang, H.; Ju, X., Analyses of the genetic relationships between lactose, somatic cell score, and growth traits in Simmental cattle. Animal 2021, 15, (1). [CrossRef]
  12. FU, M. Z.; Wang, W.; Yi, J., New dairy cattle breed Shu Xuanhua Cattle. Rural Pundit 2023, (3), 35.
  13. Tvrzicka, E.; Kremmyda, L. S.; Stankova, B.; Zak, A., Fatty acids as biocompounds: their role in human metabolism, health and disease--a review. Part 1: classification, dietary sources and biological functions. Biomed Pap Med Fac Univ Palacky Olomouc Czech Repub 2011, 155, (2), 117-30.
  14. Mohan, M. S.; O'Callaghan, T. F.; Kelly, P.; Hogan, S. A., Milk fat: opportunities, challenges and innovation. Crit Rev Food Sci Nutr 2021, 61, (14), 2411-2443.
  15. Sales-Campos, H.; de Souza, P. R.; Peghini, B. C.; da Silva, J. S.; Cardoso, C. R., An Overview of the Modulatory Effects of Oleic Acid in Health and Disease. Mini-Reviews in Medicinal Chemistry 2013, 13, (2), 201-210.
  16. Zárate, R.; el Jaber-Vazdekis, N.; Tejera, N.; Pérez, J. A.; Rodríguez, C., Significance of long chain polyunsaturated fatty acids in human health. Clinical and Translational Medicine 2017, 6. [CrossRef]
  17. D'Angelo, S.; Motti, M. L.; Meccariello, R., ω-3 and ω-6 Polyunsaturated Fatty Acids, Obesity and Cancer. Nutrients 2020, 12, (9). [CrossRef]
  18. Simopoulos, A. P., The importance of the ratio of omega-6/omega-3 essential fatty acids. Biomedicine & Pharmacotherapy 2002, 56, (8), 365-379.
  19. Goulding, D. A.; Fox, P. F.; O'Mahony, J. A., Milk proteins: An overview. 2020; p 21-98.
  20. Pastuszka, R.; Barlowska, J.; Litwinczuk, Z., Allergenicity of milk of different animal species in relation to human milk. Postepy Higieny I Medycyny Doswiadczalnej 2016, 70, 1451–1459. [CrossRef]
  21. Layman, D. K.; Lönnerdal, B.; Fernstrom, J. D., Applications for α-lactalbumin in human nutrition. Nutrition Reviews 2018, 76, (6), 444-460. [CrossRef]
  22. Wang, B.; Timilsena, Y. P.; Blanch, E.; Adhikari, B., Lactoferrin: Structure, function, denaturation and digestion. Critical Reviews in Food Science and Nutrition 2019, 59, (4), 580-596.
  23. Antoshin, A. A.; Shpichka, A. I.; Huang, G.; Chen, K.; Lu, P.; Svistunov, A. A.; Lychagin, A. V.; Lipina, M. M.; Sinelnikov, M. Y.; Reshetov, I. V.; Timashev, P. S., Lactoferrin as a regenerative agent: The old-new panacea? Pharmacol Res 2021, 167, 105564.
  24. GB5009.6-2016, National Food Safety Standards Determination of fat in food. The National Health and Family Planning Commission of the People's Republic of China and the State Food and Drug Administration: Beijing, 2016; pp 7-9.
  25. GB5009.168—2016, National Food Safety Standards Determination of Fatty Acids in Food. The National Health and Family Planning Commission of the People's Republic of China and the State Food and Drug Administration: Beijing, 2016; pp 8-11.
  26. HAN, Z. Q.; FANG, J. H., Technology of Extracting Casein from Milk in Laboratory. Animal Husbandry and Feed Science 2010, 31, (08), 83-85.
  27. Ostertag, F.; Schmidt, C. M.; Berensmeter, S.; Hinrichs, J., Development and validation of an RP-HPLC DAD method for the simultaneous quantification of minor and major whey proteins. Food Chemistry 2021, 342. [CrossRef]
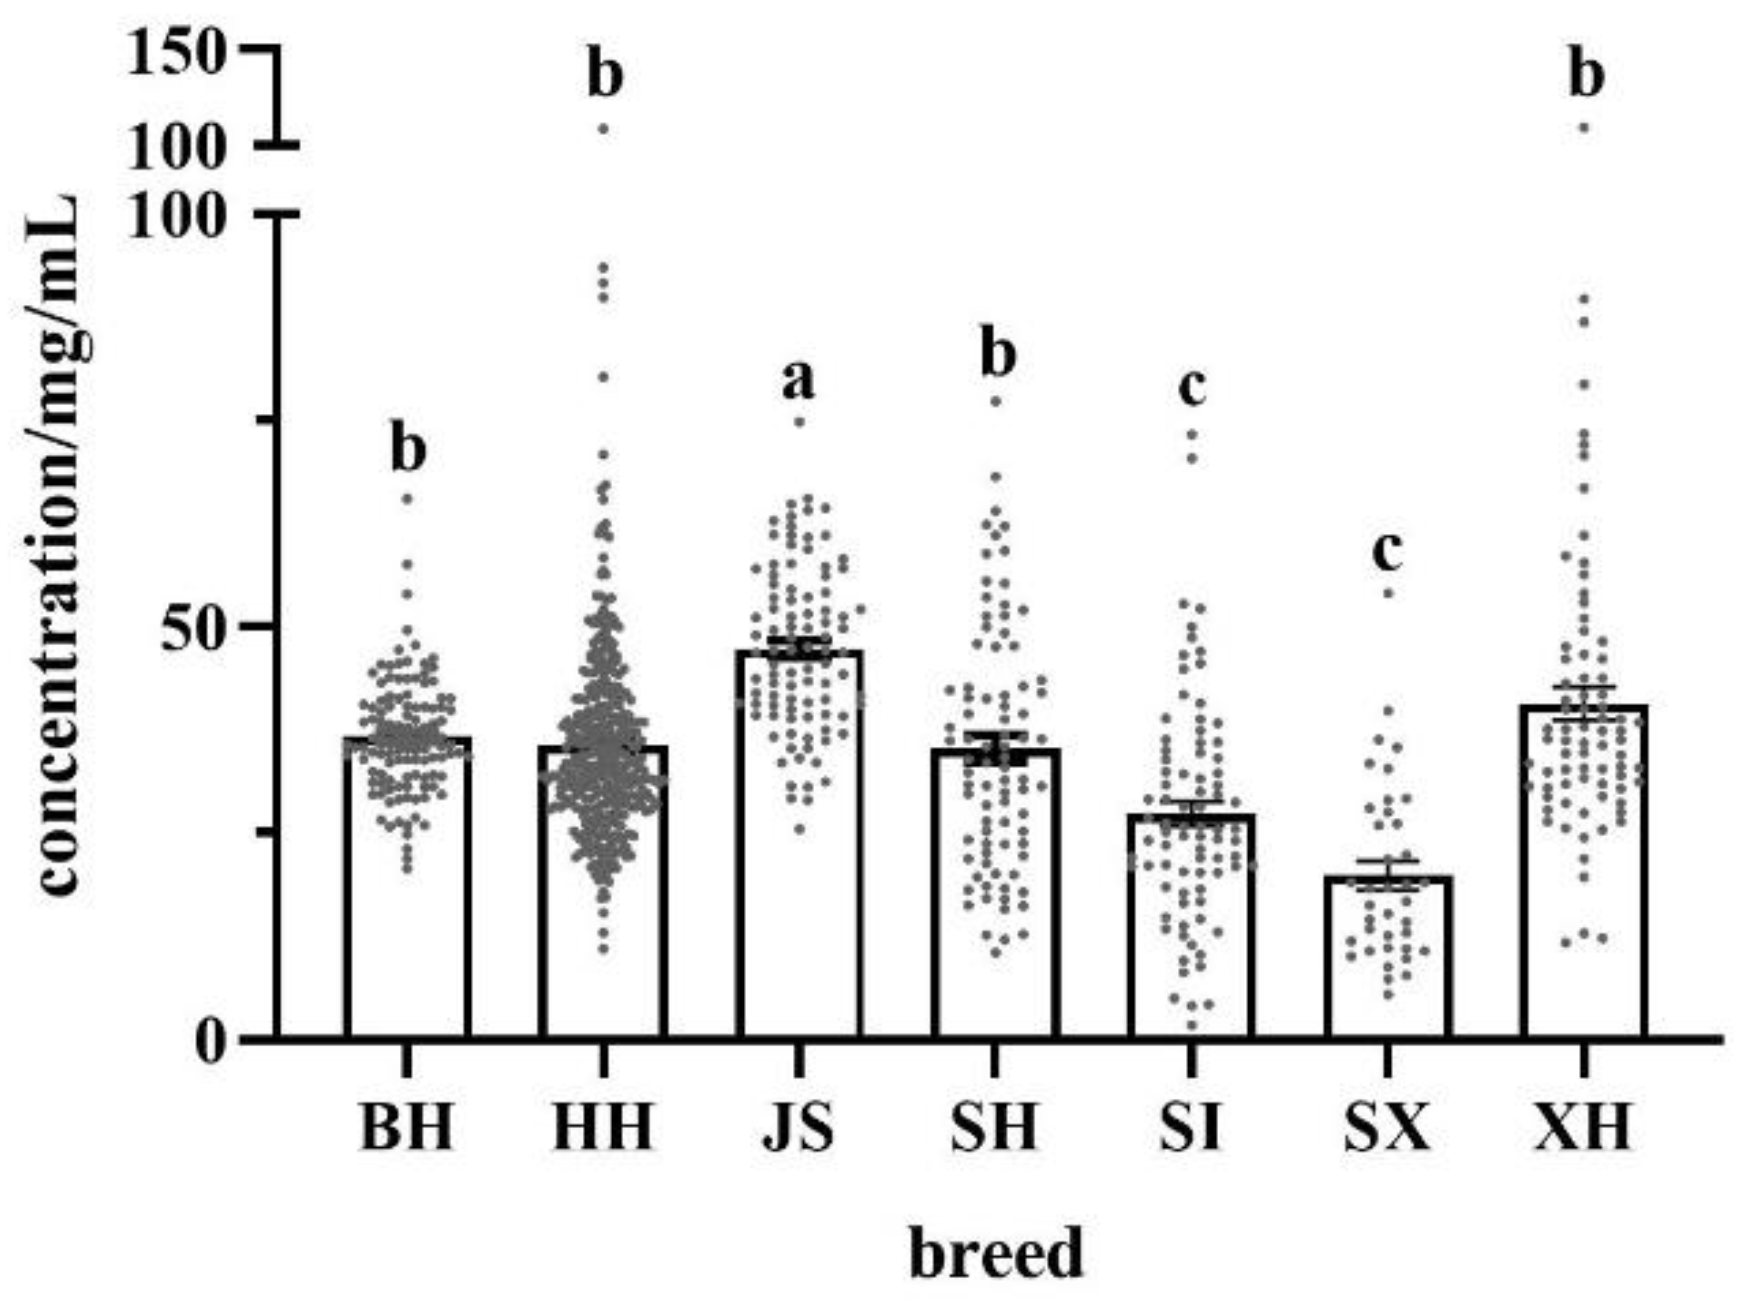
Figure 1. Fat content of different breeds/regions of milk. BH (n=115); HH (n=348); JS (n=94); SH (n=84); SI (n=82); SX (n=38); XH (n=78). Different letters indicate significant differences at p < 0.05. BH = Beijing Holstein milk, HH = Hebei Holstein milk, JS = Jersey milk, SH = Sanhe milk, SI = Simmental milk, SX = Shu Xuanhua milk, XH = Xinjiang brown milk.
Preprints 119037 g001
Figure 2. Percentages of different types of fatty acids to total fatty acids per breed/region. BH(n=115); HH(n=348); JS(n=94); SH(n=84); SI(n=82); SX(n=38); XH(n=78). Different letters indicate significant differences at p < 0.05.
Preprints 119037 g002
Figure 3. The percentage of different types of polyunsaturated fatty acids to total fatty acids in different breeds/regions of milk. BH (n=115); HH (n=348); JS (n=94); SH (n=84); SI (n=82); SX (n=38); XH (n=78). Values with different letters are significantly different at p < 0.05. BH = Beijing Holstein milk, HH = Hebei Holstein milk, JS = Jersey milk, PUFA = polyunsaturated fatty acids, SH = Sanhe milk, SI = Simmental milk, SX = Shu Xuanhua milk, XH = Xinjiang brown milk.
Preprints 119037 g003
Figure 4. Protein content in milk of different breeds. (a): CN content; (b): β-Lg content; (c): α-La content; (d): LF content; BH (n=112); HH (n=341); JS (n=93); SH (n=84); SI (n=82); SX (n=38); XH (n=78). Values with different letters are significantly different at p < 0.05. BH = Beijing Holstein milk, CN = casein, HH = Hebei Holstein milk, JS = Jersey milk, LF = lactoferrin, SH = Sanhe milk, SI = Simmental milk, SX = Shu Xuanhua milk, XH = Xinjiang brown milk, α-La = α-lactalbumin, β-Lg = β-lactoglobulin.
Preprints 119037 g004
Figure 5. The percentage of different types of proteins to total proteins in different breeds/regions of milk. BH(n=112); HH(n=341); JS(n=93); SH(n=84); SI(n=82); SX(n=38); XH(n=78). Values with different letters are significantly different at p < 0.05. BH = Beijing Holstein milk, CN = casein, HH = Hebei Holstein milk, JS = Jersey milk, LF = lactoferrin, SH = Sanhe milk, SI = Simmental milk, SX = Shu Xuanhua milk, XH = Xinjiang brown milk, α-La = α-lactalbumin, β-Lg = β-lactoglobulin.
Preprints 119037 g005
Table 1. Coefficient of variation of fat content in different breeds/regions of milk.
Breed Coefficient of variation/%
BH (n=115) 19.19
HH (n=348) 33.73
JS (n=94) 21.11
SH (n=84) 41.79
SI (n=82) 49.37
SX (n=38) 53.28
XH (n=78) 42.41
* BH = Beijing Holstein milk, HH = Hebei Holstein milk, JS = Jersey milk, SH = Sanhe milk, SI = Simmental milk, SX = Shu Xuanhua milk, XH = Xinjiang brown milk.
Table 2. Table 2. Fatty acid content of different breeds/regions of milk (in mg/mL)
Fatty acid Breed
BH
(n=115)
HH
(n=348)
JS
(n=94)
SH
(n=84)
SI
(n=82)
SX
(n=38)
XH
(n=78)
C6:0 0.467±0.013b 0.384±0.010c 0.590±0.016a 0.553±0.026ab 0.236±0.015d 0.143±0.014d 0.555±0.030ab
C8:0 0.410±0.014c 0.422±0.010c 0.668±0.019a 0.610±0.028ab 0.340±0.019c 0.154±0.013d 0.634±0.036a
C10:0 0.686±0.025c 0.640±0.017c 1.190±0.045a 0.942±0.046b 0.417±0.027d 0.210±0.020d 0.995±0.060ab
C12:0 0.902±0.029c 0.877±0.026c 1.699±0.069a 1.268±0.066b 0.553±0.037d 0.293±0.028d 1.340±0.087b
C14:0 2.392±0.063c 2.739±0.078c 4.437±0.109a 3.369±0.148b 1.760±0.113d 1.072±0.113d 3.720±0.218b
C14:1 0.196±0.006b 0.396±0.010a 0.431±0.024a 0.468±0.023a 0.159±0.011b 0.120±0.015b 0.459±0.032a
C15:0 0.194±0.006b 0.275±0.010a 0.335±0.014a 0.357±0.018a 0.189±0.013b 0.158±0.022b 0.309±0.019a
C16:0 7.120±0.194c 9.786±0.242b 10.913±0.281a 9.277±0.429b 5.758±0.365cd 3.971±0.397d 9.547±0.503b
C16:1 0.329±0.010b 0.630±0.017a 0.518±0.017a 0.536±0.028a 0.261±0.017b 0.302±0.046b 0.537±0.031a
C18:0 1.995±0.057cd 2.402±0.081c 3.869±0.126a 2.119±0.110cd 1.744±0.136d 1.467±0.127d 3.208±0.169b
C18:1 4.571±0.127c 6.510±0.169b 7.742±0.242a 5.821±0.348b 4.140±0.283bc 4.046±0.392c 7.934±0.458a
C18:2 0.738±0.020c 1.298±0.031a 1.356±0.051a 0.923±0.039bc 0.345±0.022d 0.379±0.033d 1.055±0.051b
C18:3 0.094±0.002c 0.194±0.006ab 0.148±0.005b 0.116±0.005c 0.099±0.007c 0.124±0.016c 0.231±0.015a
C20:1 0.044±0.001c 0.071±0.002b 0.086±0.004a 0.068±0.004b 0.052±0.005c 0.061±0.009bc 0.091±0.005a
C20:4 0.0458±0.0018b 0.0710±0.0020a 0.0821±0.004a 0.0712±0.0039a 0.0308±0.0029c 0.0411±0.0058bc 0.0820±0.0046a
C20:5 0.0040±0.0002c 0.0047±0.0002c 0.0085±0.0008b 0.0060±0.0005b 0.0022±0.0003d 0.0044±0.0010cd 0.0121±0.0009a
C22:6 0.0019±0.0001d 0.0030±0.0002bc 0.0028±0.0002bcd 0.0034±0.0003b 0.0030±0.0002bc 0.0028±0.0007cd 0.0047±0.0003a
* values with different letters are significantly different at p < 0.05. BH = Beijing Holstein milk, HH = Hebei Holstein milk, JS = Jersey milk, SH = Sanhe milk, SI = Simmental milk, SX = Shu Xuanhua milk, XH = Xinjiang brown milk.
Table 3. Coefficient of variation Fatty acid content in different breeds/regions of milk (in percent).
Fatty acid Breed
BH
(n=115)
HH
(n=348)
JS
(n=94)
SH
(n=84)
SI
(n=82)
SX
(n=38)
XH
(n=78)
C6:0 30.80 47.06 26.19 43.08 57.41 59.67 48.11
C8:0 37.92 44.30 28.11 41.73 51.80 53.48 49.88
C10:0 38.34 48.69 37.06 45.14 59.31 57.81 53.68
C12:0 34.46 54.81 39.50 47.53 60.10 60.01 57.31
C14:0 28.47 53.39 23.72 40.26 58.02 64.80 51.80
C14:1 34.53 47.37 54.34 45.11 64.21 76.27 60.78
C15:0 32.75 66.13 41.54 47.54 63.65 86.47 53.31
C16:0 29.25 46.05 24.94 42.36 57.35 61.68 46.55
C16:1 33.91 51.78 32.58 47.40 59.17 93.26 51.47
C18:0 30.57 63.14 31.55 47.79 70.59 53.29 46.55
C18:1 29.86 48.31 30.29 54.72 61.94 59.69 51.03
C18:2 28.36 45.02 36.12 38.67 56.71 52.89 42.50
C18:3 26.08 57.98 29.82 41.24 59.58 79.85 57.38
C20:1 30.96 58.60 45.64 53.66 84.96 93.24 49.59
C20:4 42.68 52.85 47.01 50.58 84.69 87.75 49.81
C20:5 58.94 73.95 96.20 74.30 109.70 144.81 62.17
C22:6 53.67 95.30 75.64 90.62 69.73 158.64 54.37
* BH = Beijing Holstein milk, HH = Hebei Holstein milk, JS = Jersey milk, SH = Sanhe milk, SI = Simmental milk, SX = Shu Xuanhua milk, XH = Xinjiang brown milk.
Table 4. Different types of fatty acids per breed/region (in mg/mL)
Fatty acid Breed
BH
(n=115)
HH
(n=348)
JS
(n=94)
SH
(n=84)
SI
(n=82)
SX
(n=38)
XH
(n=78)
SFA 14.165±0.354c 17.523±0.435b 23.701±0.552a 18.494±0.819b 10.997±0.699d 7.467±0.698d 20.308±1.074b
MUFA 5.139±0.139d 7.607±0.191b 8.777±0.269a 6.893±0.385c 4.612±0.311d 4.530±0.438d 9.022±0.517ab
PUFA 0.884±0.023c 1.571±0.038a 1.598±0.056a 1.119±0.046b 0.480±0.030d 0.551±0.051cd 1.384±0.067ab
n-6 PUFA 0.784±0.021d 1.369±0.033ab 1.438±0.053a 0.994±0.042c 0.376±0.024e 0.420±0.037e 1.137±0.055bc
n-3 PUFA 0.100±0.002c 0.201±0.006b 0.160±0.005b 0.125±0.006c 0.105±0.007c 0.131±0.016c 0.247±0.016a
n-6/n-3 7.8 7.5 9.4 8.2 3.8 4.1 5.0
* SFA: C6:0, C8:0, C10:0, C12:0, C14:0, C15:0, C16:0, C18:0; MUFA: C14:1, C16:1, C18:1, C20:1; PUFA: C18:2, C18:3, C20:4, C20:5, C22:6. n-6 PUFA: C18:2, C20:4; n-3 PUFA: C18:3, C20:5, C22:6. Different letters indicate significant differences at p < 0.05.BH = Beijing Holstein milk, HH = Hebei Holstein milk, JS = Jersey milk, SH = Sanhe milk, SI = Simmental milk, SX = Shu Xuanhua milk, XH = Xinjiang brown milk.
Table 5. Coefficient of variation of protein content per breed/region (in percent).
Protein Milk type
BH
(n=112)
HH
(n=341)
JS
(n=93)
SH
(n=84)
SI
(n=82)
SX
(n=38)
XH
(n=78)
CN 21.98 26.08 13.91 14.17 25.59 27.86 19.42
β-Lg 26.13 25.66 25.22 23.91 35.23 27.56 36.82
α-La 27.18 22.39 32.96 26.03 29.59 34.44 32.05
LF 29.92 59.80 46.55 36.30 79.02 48.07 91.80
* BH = Beijing Holstein milk, CN = casein, HH = Hebei Holstein milk, JS = Jersey milk, LF = lactoferrin, SH = Sanhe milk, SI = Simmental milk, SX = Shu Xuanhua milk, XH = Xinjiang brown milk, α-La = α-lactalbumin, β-Lg = β-lactoglobulin.
Disclaimer/Publisher’s Note: The statements, opinions and data contained in all publications are solely those of the individual author(s) and contributor(s) and not of MDPI and/or the editor(s). MDPI and/or the editor(s) disclaim responsibility for any injury to people or property resulting from any ideas, methods, instructions or products referred to in the content.
Copyright: This open access article is published under a Creative Commons CC BY 4.0 license, which permit the free download, distribution, and reuse, provided that the author and preprint are cited in any reuse.
Prerpints.org logo

Preprints.org is a free preprint server supported by MDPI in Basel, Switzerland.

Subscribe

© 2024 MDPI (Basel, Switzerland) unless otherwise stated