Preprint
Article

Protonation Is Part of Dielectric Relaxation upon Reduction of Bacteriopheophytin in Reaction Center of Photosynthetic Bacterium Rhodobacter sphaeroides

Altmetrics

Downloads

49

Views

26

Comments

0

A peer-reviewed article of this preprint also exists.

This version is not peer-reviewed

Submitted:

24 September 2024

Posted:

25 September 2024

You are already at the latest version

Alerts
Abstract
The pH dependence of the free energy level of the flash induced primary charge pair P+IA– was determined by combination of the results from indirect charge recombination of P+QA– and from delayed fluorescence of the excited dimer (P*) in reaction center of photosynthetic bacterium Rhodobacter sphaeroides where the native ubiquinone at the primary quinone binding site QA was replaced by low potential anthraquinone derivatives. The following observations were made: 1) The free energy state of P+IA– was pH independent below pH 10 (–370 ± 10 meV relative to that of the excited dimer P*) and showed remarkable decrease (about 20 meV/pH unit) above pH 10. A not insignificant part of the dielectric relaxation of the P+IA– charge pair (about 120 meV) should come from protonation related changes. 2) The single exponential decay character of the kinetics proves that the protonated/unprotonated P+IA– and P+QA– states are in equilibria and the rate constants of protonation konH +koffH is much larger than that of the charge back reaction kback ~103 s-1. 3) Highly similar pH profiles were measured for the free energy states of P+QA– and P+IA–, indicating that the same acidic cluster around QB should response to both anionic species. This was supported by model calculations based on anticooperative proton distribution in the cluster with key residues of GluL212, AspL213, AspM17 and GluH173 and on effect of polarization of the aqueous phase on the electrostatic interaction. The larger distance of IA– from the cluster (25.2 Å) than that of QA‒ (14.5 Å) is compensated by smaller effective dielectric constant (6.5 ± 0.5 and 10.0 ± 0.5, respectively). 4) The P* → P+QA− and IA‒QA → IAQA− electron transfers are enthalpy driven reactions with exemption of very large (>60%) or negligible entropic contributions in cases of substitution by 2,3-dimethyl-AQ or 1-chloro-AQ, respectively. The possible structural consequences are discussed.
Keywords: 
Subject: Biology and Life Sciences  -   Biophysics

1. Introduction

Photosynthesis utilizes the solar energy absorbed by pigments and transferred in form of electronic excitation energy to photosynthetic reaction center (RC) [1,2,3,4,5], common to all photosynthetic species, where it is converted into a charge gradient needed for long term storage of solar energy. The RC from the purple bacterium Rhodobacter (Rba.) sphaeroides includes eight pigment molecules classified into four groups: special pair of bacteriochlorophylls (P), two accessory BChls (B), two bacteriopheophytins (I) and two ubiquinones (Q) (Figure 1, [6]). While P and B are located at the periplasmic side of the membrane, and Q at the cytoplasmic side, I is placed approximately half-way across the membrane. A slight asymmetry in the structure of the RC leads to a similar asymmetry in the energy levels of the pigments leading to a highly dominant (A branch) and a non-dominant (B branch) path for charge separation. However, the design can be nearly completely reversed by changes of some crucial amino acids [7]. The proximity between the BChls in the special pair and between the BA and IA pigments suggests strong interaction between their excited states, leading to coherent sharing of the excitation energy [8,9]. Similarly, the charge separated state produced initially (~3 ps) after decay of P* is a mixture of vibrationally hot P+BA and P+IA states, which then relaxes within ~1 ps into the cool P+IA state [10]. The subsequent electron transfer to QA with a lifetime of ~200 ps produces a membrane-spanning radical pair P+QA that is stable on a millisecond timescale.
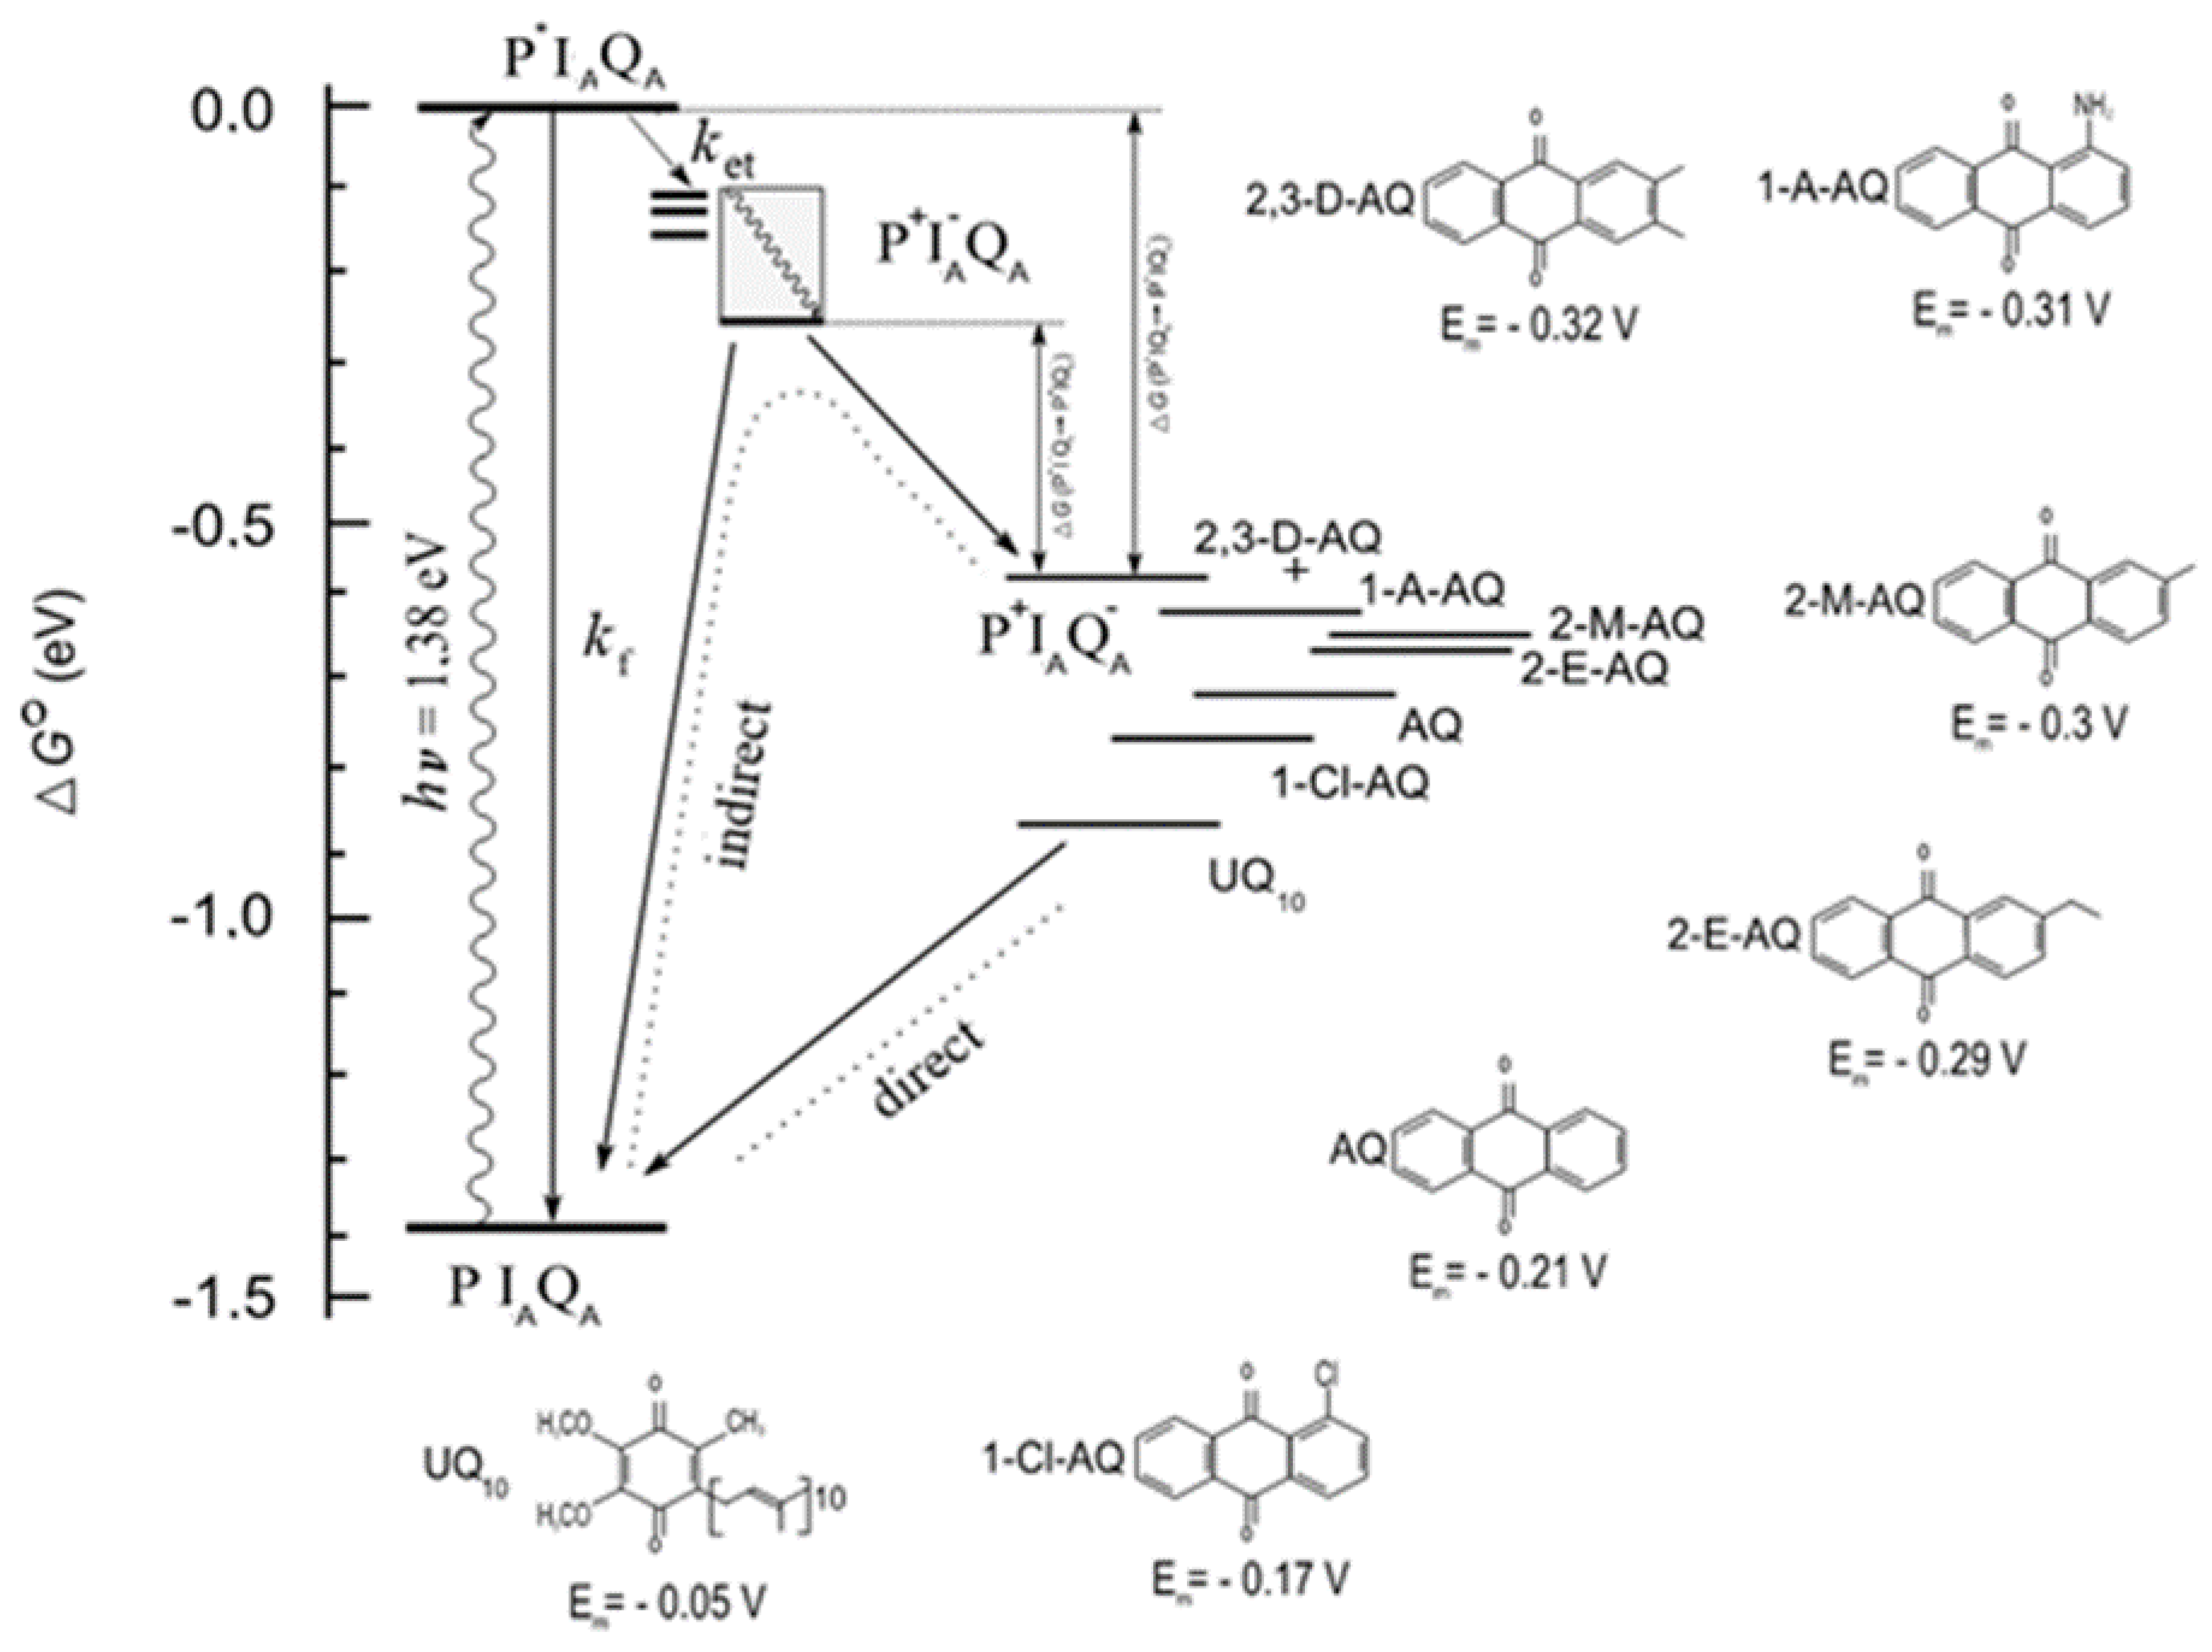
The energetics, kinetics and pathway of electron transfer centred at IA are exposed to protein environment and dynamics [11]. Several evidence have been accumulated in favour of time-dependent relaxations of the P+IA state (Figure 2). Based on very fast (1-10 ns) decay of fluorescence, the free energy difference between P* and P+IA was estimated between 210 and 260 meV in accordance with 250-260 meV obtained from effects of magnetic fields and temperature on the fast (~ 50 μs) decay of the excited 3P triplet state [12]. Quinone replacement studies indicated that RCs may undergo on the micro- and millisecond time scale further relaxations which increase the free energy difference up to 340 meV after initial charge separation [13]. However, additional studies are required to test the upper limit of energetic relaxation of the P+IA state and to distinguish from those of the P+QA states.
The anionic states formed during electron transfer induce not only reorganization of the protein environment [14], but also out-of-plane distortion of the chlorin ring [15]. Two distinct conformations of IA•– were reported in spectroscopic studies of RC from Rba. sphaeroides [16]. Recently, the XFEL (X-ray free electron) structures revealed how the charge separation process was stabilized by protein conformational dynamics [17].
The perturbation of the free energy level of the P+IA charge-separated state can be attributed to nearby amino acids whose contributions have been thoroughly studied [18] but not always fully understood [19]. One highly examined residue has been the tyrosine at site M210 because it lies between P and the initial electron acceptors and is a key residue involved in the initial forward electron transfer. Mutant RCs have altered rates of the initial electron transfer (reviewed in [20,21]). Theoretical studies indicates that the magnitude and orientation of the hydroxyl dipole of tyrosine M210 may play an important role in energetic stabilization of P+IA [22]. Indeed, changes of the orientation of this tyrosine’s hydroxyl dipole slowed the electron transfer significantly [23]. Different mutations at M214 near IA decreased the rate of IA → QA electron transfer resulted in competition with the charge recombination between P+ and IA and in a drop of the overall yield of charge separation [24]. The effects correlated with the volume of the mutant amino acid side chains. Similar results were obtained when the native bacteriopheophytin was replaced by BChl [25]. The perturbation of the electronic environment in the vicinity of P+IA, and QA, affected both the extent and time scale of the dielectric relaxation. A 4-fold decrease in the electron transfer rate from IA to QA and similar decrease in the recombination rate P+QA → PQA were observed in RC lacking the H subunit (LM dimer). It was interpreted as the increased flexibility in the region around QA and the associated shifts in the reorganization energy of the electron transfers relative to that of the native RC [26].
The light-induced P+I and P+Q dipoles are stabilized both by release of H+ ions to the periplasmic side, by uptake of H+ ions from the cytoplasmic side of the RC and by internal proton rearrangement, which processes have not only energetic, but temporal and structural constrains, as well. The flash-induced P+ state results in very limited proton release [27] and consequently in very small energetic stabilization of the dipole. Continuous illumination, however, produces significant release of protons, up to six protons per RC for a 300 s light exposure [28]. The observed very slow charge recombination and proton release/uptake kinetics pointed to cascade of lengthy conformational changes together with suspected formation of a hydrogen-bond network between P+ and the periplasmic aqueous phase [29,30]. On the other end of the dipole, the H+ uptake in response to the immediate (within 200 ps) formation of P+QA was found to be rate-limited by intraprotein conformational process [31]. In native RC, the lifetime of P+IA (τI~13 ns) is much shorter than the time required for protonation to accommodate the dipole. The relatively slow response of protonation prohibits the stabilization via proton rearrangement. In AQ substituted RC, however, the lifetime of P+IA is increased significantly to τI·(1+K2)~1 ms, where K2 (~ exp(ΔGAI/kBT) denotes the equilibrium constant between P+QA and P+IA states [32]. Although in small fraction of RCs, the increased lifetime of P+IA state makes possible to observe the stabilization through protonation.
The kinetics and stoichiometry of flash-induced proton uptake upon formation of either QA or QB are correlated, suggesting that the same residues respond to the generation of both semiquinone species [33,34,35]. The QB domain is rich of protonatable residues that can account for uptake of protons in response to appearance of negative charges on QB and QA [36,37,38]. The substoichiometric proton uptake and/or internal redistribution of H+ ions arise largely from the same cast of characters in the QB domain and supports the lack of ionizable residues around QA and IA [37,39]. However, the interactions within the ionization states of the individual residues in the complex network and between the acidic cluster and the semiquinones are still not reliably accounted for by existing computational and spectroscopic methods. Discrepancies between calculations and experiments (particularly FTIR) remain unresolved for some key residues in the cluster [40,41].
Whether IA can interact with the remote acidic cluster and what are the possible consequences of this interaction are open questions. There are some experimental indications that the acidic cluster may cooperate with the appearance of the negative charge on IA. QA-induced red shift of the Qy absorption band of IA was observed that was pH-dependent and showed the involvement of proton transfer in the protein relaxation [42]. The absence of the 400 μs component in the relaxation kinetics of the L212Glu-Ala mutant suggested that this residue of the cluster was involved in the relaxation mechanism. The low effective dielectric allows the spread of electric field from IA in the membrane further to the QB region featured by an unusually high density of ionizable residues with a striking excess of acidic groups. In this way, the cluster of ionizable residues around QB should contribute substantially to the partial shielding and stabilization of the light-induced P+IA dipole. However, the direct experimental proof, the mechanism and the extent of the cross-talk have remained unresolved.
Here, we set the aim to get direct experimental evidence to this interaction. The protonation changes in the acidic cluster around QB upon appearance of P+QA and P+IA was probed by substitution of the native UQ10 by several low potential analogues of anthraquinone (AQ) and by combined measurements of the delayed fluorescence and charge recombination attributed to P+QA → PQA. With AQ, as opposed to UQ, the charge recombination occurs through indirect pathway via P+IA and the rate is sensitive to small perturbations of the free energy states of P+QA and P+IA. It is revealed that the free energy levels of P+IA states were pH-dependent at high (> 10) pH values indicating the participation of residues of high pKa values in the interaction between the acidic cluster around QB and IA. Relative to P*, the stabilization of the relaxed (ms) state of the P+IA dipole compared to that of the hot (ns) state increased more than 50% due to this coupling and to the protonation coupled slow conformational changes.

2. Materials and Methods

2.1. Bacterial Strain, Media and Chemicals

The carotenoidless Rba. sphaeroides R-26 was inoculated after incubation in the dark for 5–7 hrs in Siström minimal medium. The cells were cultivated anaerobically in 1 L screw top flasks under continuous illumination of about 13 W/m2 provided by tungsten lamps (40 W), as described earlier in [43]. The assay solution contained 2 μM RCs with 0.03% LDAO, 100 mM NaCl, and 5 mM buffer, depending on the pH. The following buffers were used: 2-(N-morpholino)-ethanesulfonic acid (MES; Sigma) between pH 5.5 and pH 6.5; 1,3-bis[tris(hydroxymethyl) methylamino] propane (Bis–Tris propane; Sigma) between pH 6.3 and pH 9.5; Tris–HCl (Sigma) between pH 7.5 and pH 9.0; and 3-(cyclohexylamino) propanesulfonic acid (CAPS; Calbiochem) and 2-(cyclohexylamino) ethanesulfonic acid (Ches, Sigma) above pH 9.5.

2.2. Anthraquinone (AQ) Substitutions (Figure 2)

To remove the primary ubiquinone (UQ10) of native RC from wild-type Rba. sphaeroides, standard method [44] was used with some modifications [13,45,46]. The absorption ratio of A280/A802 of the QA-depleted RCs was in the range 1.28-1.32. About 90-95% of the RCs were depleted of QA checked by flash-induced absorption change measurement at 430 nm. In the remaining 5-10% of the RCs, the native UQ10 was not removed. The anthraquinone analogues (Fluka) were dissolved in ethanol and used in 10-fold excess. Final ethanol concentration in the solution was < 2% (v/v). Compared to the UQ10 reconstituted RCs, the yields of P+QA formation were 80-90% in AQ (Anthraquinone (AQ), 1-chloroanthraquinone (1-Chloro-AQ), 2-methylanthraquinone (2-Methyl-AQ), 2-ethylanthraquinone (2-Ethyl-AQ), 1-aminoathraquinone (1-Amino-AQ) and 2,3-dimethylanthraquinone (2,3-Dimethyl-AQ)) reconstituted RCs.

2.3. Optical Measurements

The photochemical function of RC of each AQ reconstituted RCs was characterized by the near-infrared absorbance spectrum and by the Xe-flash-induced absorbance changes recorded on a home-built spectrophotometer [27]. The P/P+ signal amplitude and P+QA → PQA charge recombination kinetics were recorded at 430 nm and decomposed into exponentials. The eventually remaining secondary quinone activity of the RC was inhibited by addition of 100 μM terbutryn that blocked the interquinone electron transfer. The RC concentration was determined from the steady-state optical densities at 802 nm or 865 nm, using extinction coefficients of ε802 = 0.288 µM-1 cm-1 or ε865 = 0.135 µM-1 cm-1. The charge recombination to the ground state may occur via direct and indirect (thermally accessed through P+I-) tunnelling pathways. The observed rate constant is
k obs = k A + k I exp ( Δ G o / k B T ) ,
where kA represents the P+QA- → PQA direct charge recombination and kI represents the quinone independent decay rate constant of the P+IA → PIA charge recombination taken here 7.7·107 s-1 [47]. ΔGo is the free energy difference between one of the relaxed states of P+IA and P+QA and kBT is the Boltzmann term.
Delayed fluorescence of the BChl dimer was measured by a home-built kinetic fluorometer equipped with a frequency-doubled and Q-switched Nd:YAG laser (Quantel YG 781-10, wavelength 532 nm, energy 20 mJ, duration 5 ns). The photomultiplier was protected by an electronically controlled mechanical shutter (Uniblitz VS25) [48,49,50,51,52], or by electronic switching of the dynodes [53] using analogue or time correlated single photon counting signal processing, respectively. The free energy change between P* and P+QA, ΔGo, was calculated by comparison of the delayed and prompt fluorescence yields, according to [54]:
G o = k B T · F d · d t F p · d t · k d k f l · η f l η p h .
Here ∫Fd(t)dt and ∫Fp(t)dt are the integrated intensities of delayed and prompt fluorescence, respectively, measured in the same sample but at very different excitation intensities (both in the linear region) to give similar emission intensities, kBT (= 25 meV at room temperature) is the Boltzmann factor, kfl (= 8·107 s−1) is the radiative rate constant of prompt fluorescence, kd is the decay rate constant of the delayed fluorescence, ηph (≈ 1.0) is the quantum yield of photochemical trapping, and ηfl (= 4·10−4) is the quantum yield of the prompt fluorescence.
The temperature of the sample was controlled by a thermostat in the physiological temperature range and measured by a thermocouple to a precision of 0.3 oC [38].

2.4. Models of the Electrostatic Interactions

2.4.1. Calculation of the pH-Dependence of the Free Energy Change due to QA/QA and IA/IA Transitions

The cluster consisting of n closely connected acidic residues interacts with nearby (QB) or remote (QA and IA) redox centers leading to slight stabilisation of the free energy in the alkaline pH region [34,36,55,56,57,58]. The protonation pattern in the acidic cluster can be calculated according to an anticooperative model (i.e. the proton binding of one residue in the cluster disfavours additional proton binding to a second residue) [59]. The residues are neutral when protonated (with binary number 0) and anionic when deprotonated (with binary number 1). The probability of a particular protonation configuration of the cluster (k) is given by
P k p H = 10 B k · ( M ( p H ) · B k ) i = 0 2 n 1 10 B i · ( M ( p H ) · B i ) ,
where Bi is the vector, whose elements are the binary digits of number i, M(pH) is the n×n matrix whose diagonal elements are (pH‒pKi) and nondiagonal elements are Eij/2. Here pKi denotes the intrinsic pKa value of residue i and Eij denotes the mutual interaction energy between charged groups i and j expressed in units of RT·ln(10) ≈ 60 meV (at room temperature) that increases the intrinsic pKi to (“dark” sate) pKiD. In the presence of a light-induced negative charge on the interacting redox center (QA, QB or IA), the pKiD of the i-th residue in the cluster is shifted further due to the Coulombic interaction energy (Vi): pKiL = pKiD + Vi. The (right and left) scalar products with vector B (indicated by dots) select the interaction terms corresponding to all couples of charged groups. The probability of protonation of a selected residue in the cluster can be determined from the calculated probabilities of all k configurations. The number of protonated groups in the cluster is n i = 1 n ( ( B k ) i ) and
H p H = n k = 0 2 n 1 P k ( p H ) i = 1 n ( ( B k ) i )
gives the proton uptake of the cluster at arbitrary pH. The light-induced proton uptake is the difference of the protonation of the cluster in the “light” and “dark” states:
H ( p H ) = H L p H H D p H
The integrated proton uptake associated with appearance of a negative charge on the redox center reflects the influence of the protonation on the energetics of the light-dark process, according to
Δ G H o p H = k B T · l n 10 · p H p H 0 H ( p H ) d p H ,
where kB is the Boltzmann constant, and T is the temperature. ΔGoH represents the pH-dependent contribution to the free energy of the charge separation, relative to a reference pH at which the integration is started.

2.4.2. Screening of the Electrostatic Interaction between Charge Pairs in the RC

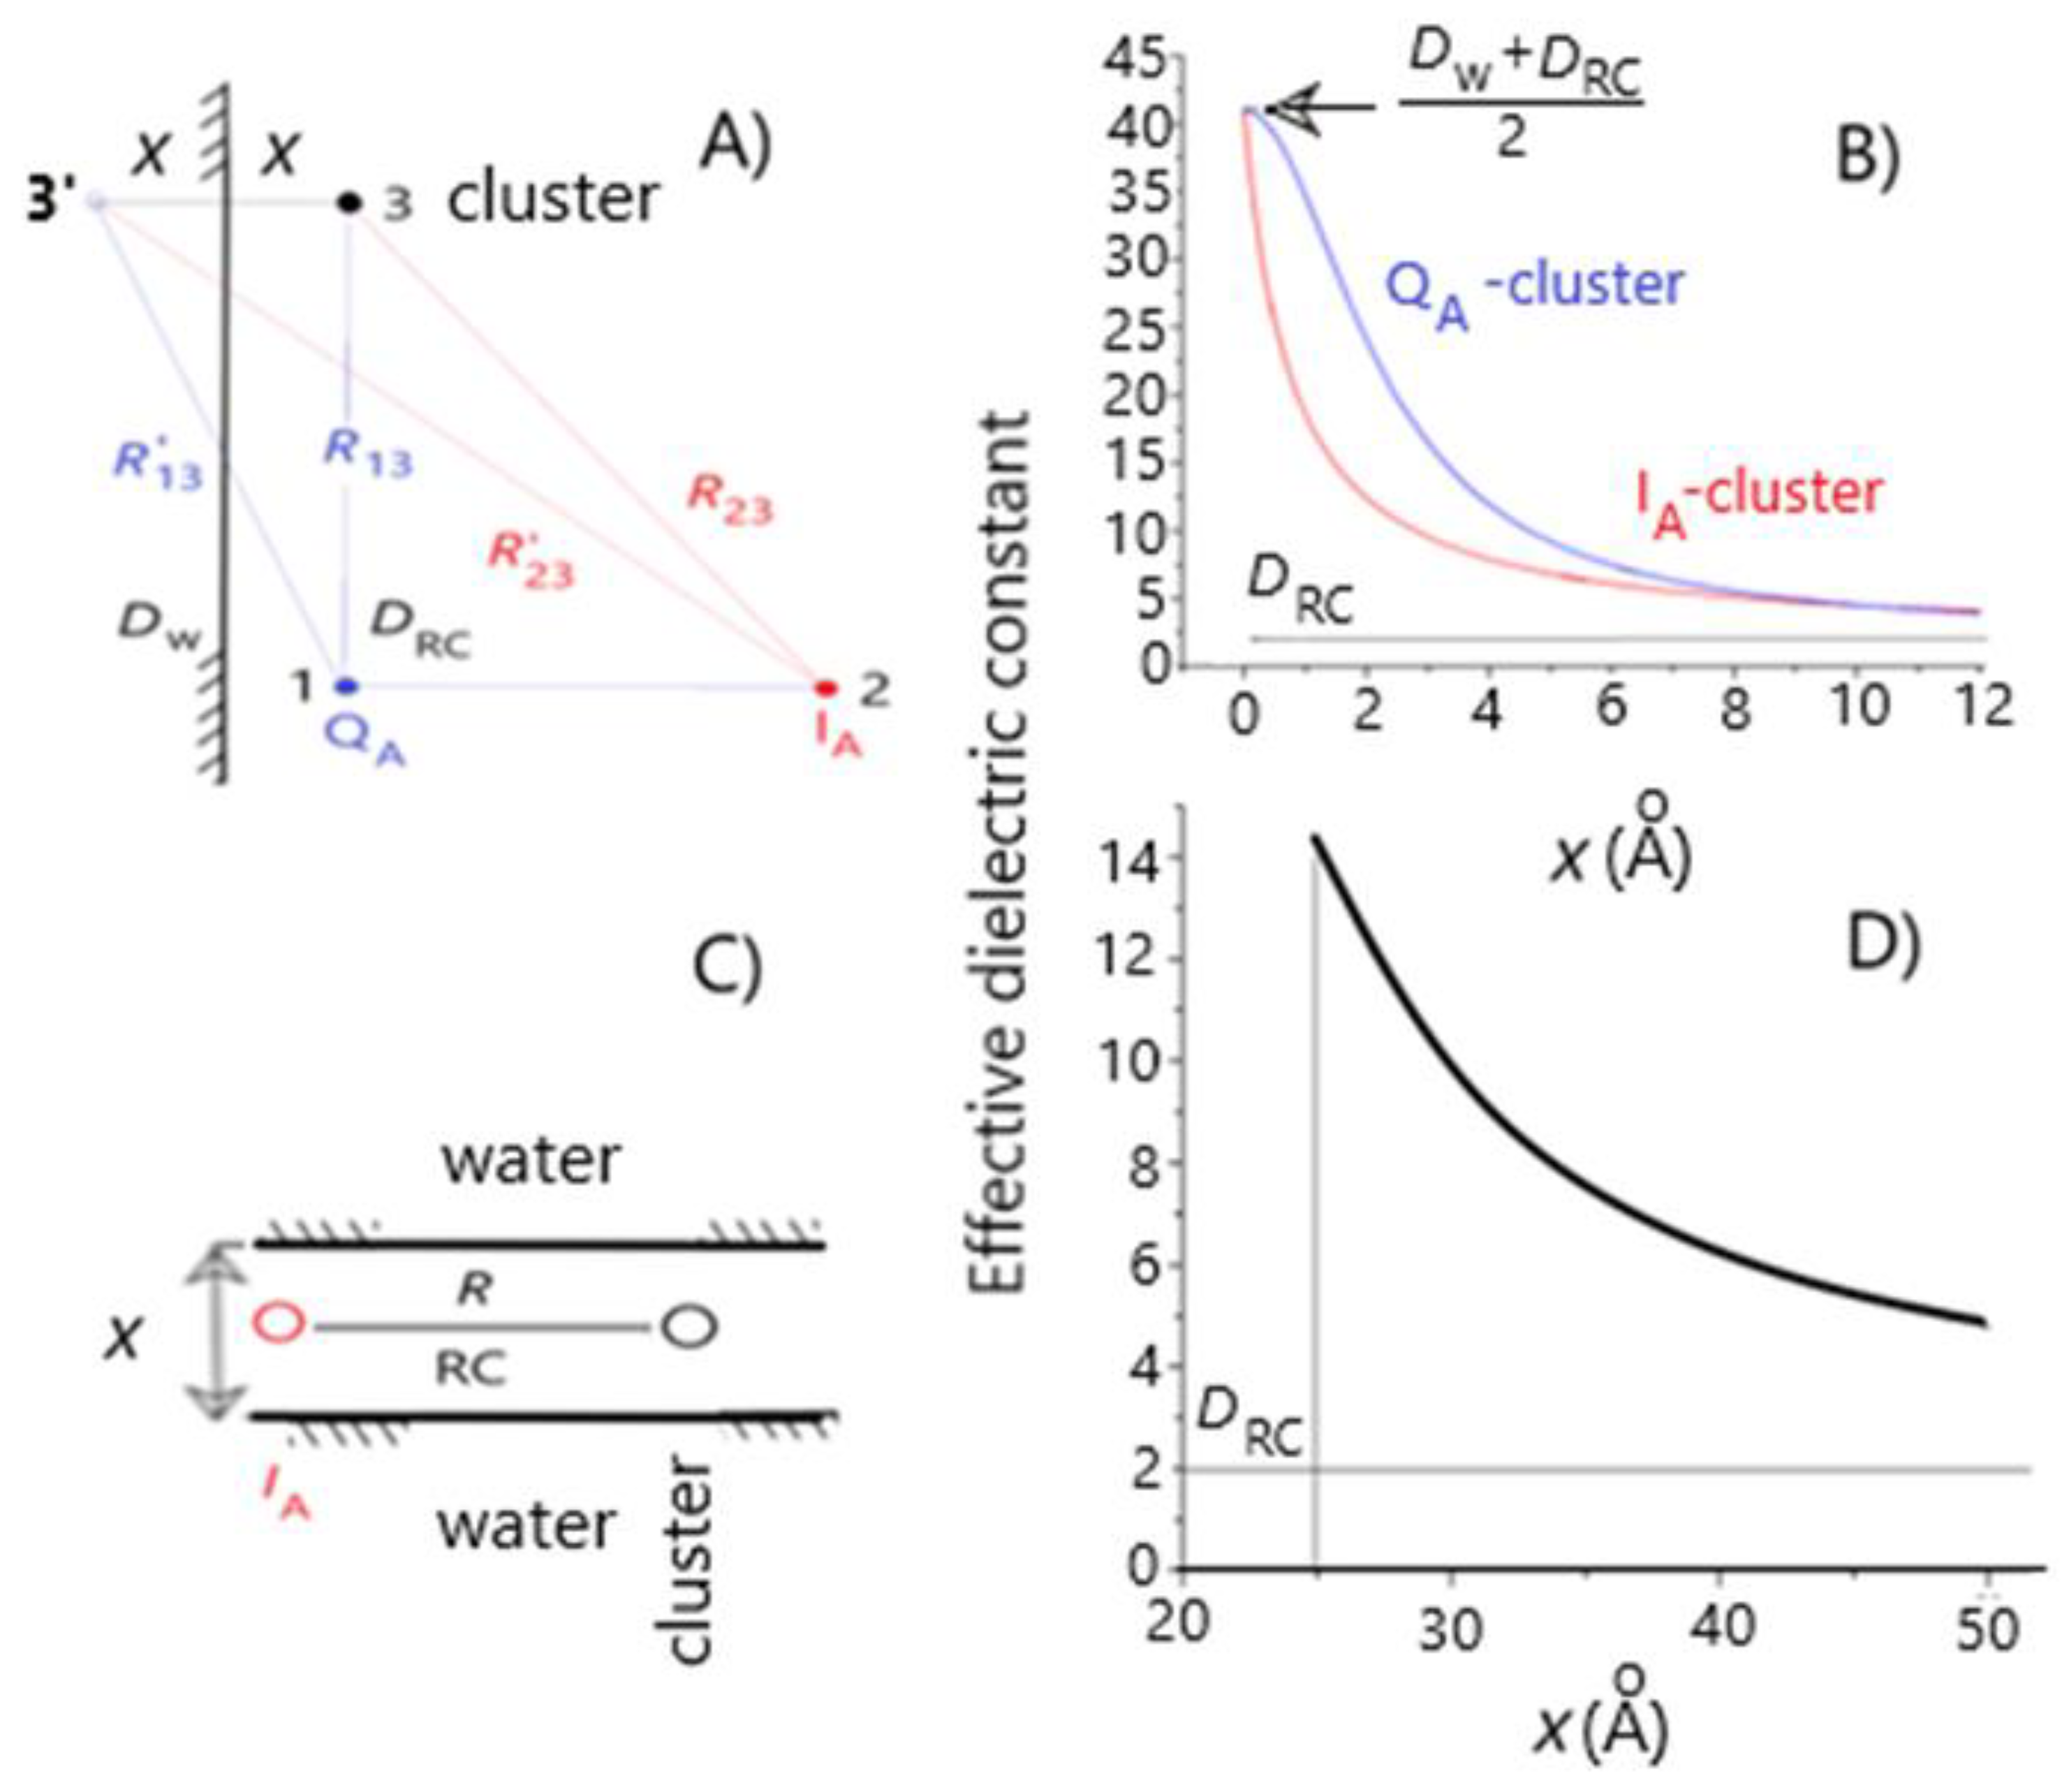
a) Single planar boundary (Figure 3A,B). The interacting point charges on QA and the acidic cluster (QA ↔ cluster, distance R=R13 = 14.5 Å) and on IA and the cluster (IA ↔ cluster, distance R=R23 = 25.2 Å) are in the RC (dielectric constant DRC) separated from the aqueous phase (with no electrolyte, dielectric constant Dw) by a flat boundary. The polarization term can be handled by the method of image charges [60]. The solvent screening effect is incorporated into the effective dielectric constant between the two charges as
D eff = D RC 1 + R R ' · D RC D w D RC + D w ,
where R’ denotes the distance of the charge on QA or on IA from the image of the charge of the cluster located at a distance x from the dielectric boundary. R’ can be expressed by x. The effective dielectric constant is a monotonously decreasing function of x from Deff = (Dw + DRC)/2 (if x/R → 0) to Deff = DRC (if x/R >>1) (Figure 3B).
b) Sandwich planar boundaries (Figure 3C,D). The two point-charges on IA and the cluster are separated by distance R (= 25.2 Å) and are in the middle of the hydrophobic part of the RC of width x and dielectric constant DRC. The RC is sandwiched by aqueous phases of dielectric constant Dw on the cytoplasmic and periplasmic sides by the protein. The interaction between the charges can be described by an infinite set of discrete image charges of alternating sign and separation x. The image charges are associated with one of the two point-charges so that the other point charge interacts not only with its original partner but also with all of its images [61]. The effective dielectric constant is
D eff = D R C 1 + 2 · n = 1 D R C D w D R C + D w n 1 + x R 2 · n 2
and describes the decrease of the interaction energy between the two charges due to screening of the aqueous phases around the RC. The effective dielectric constant is a monotonously decreasing function of x from Deff = Dw at x=0 to Deff = DRC at x >> R (Figure 3D).
MathCad 14.0 was used for the numerical calculations.

3. Results

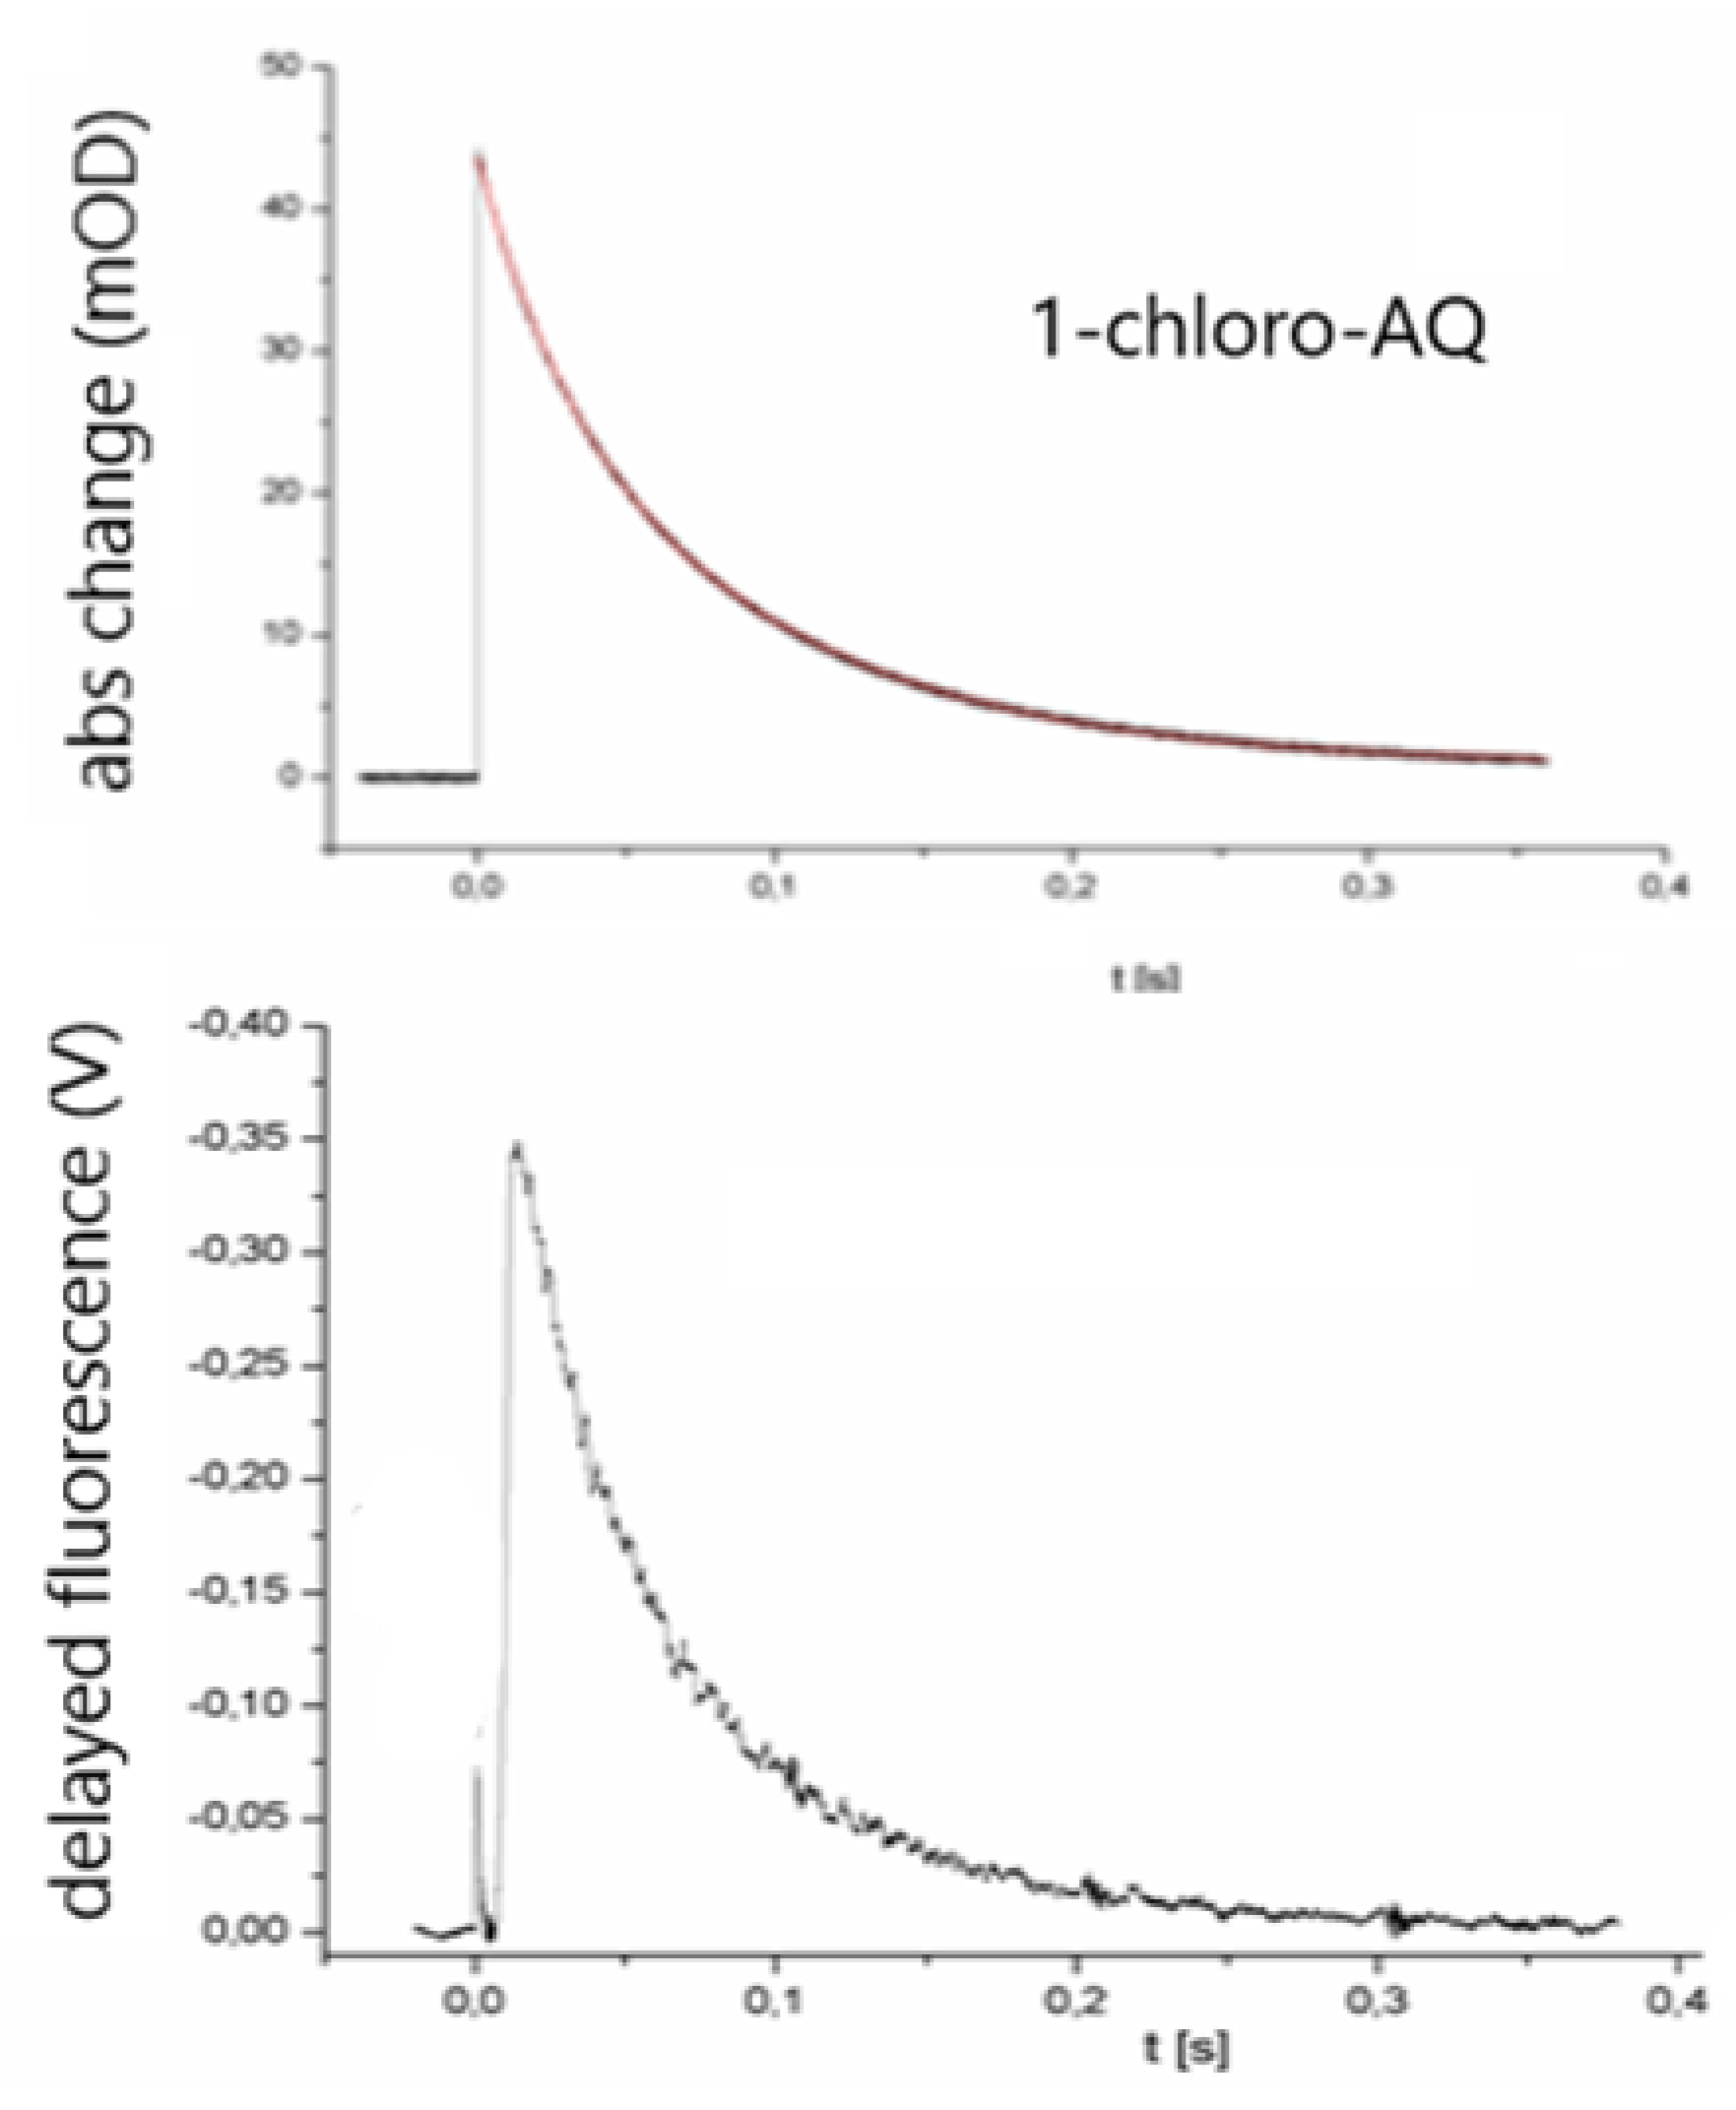
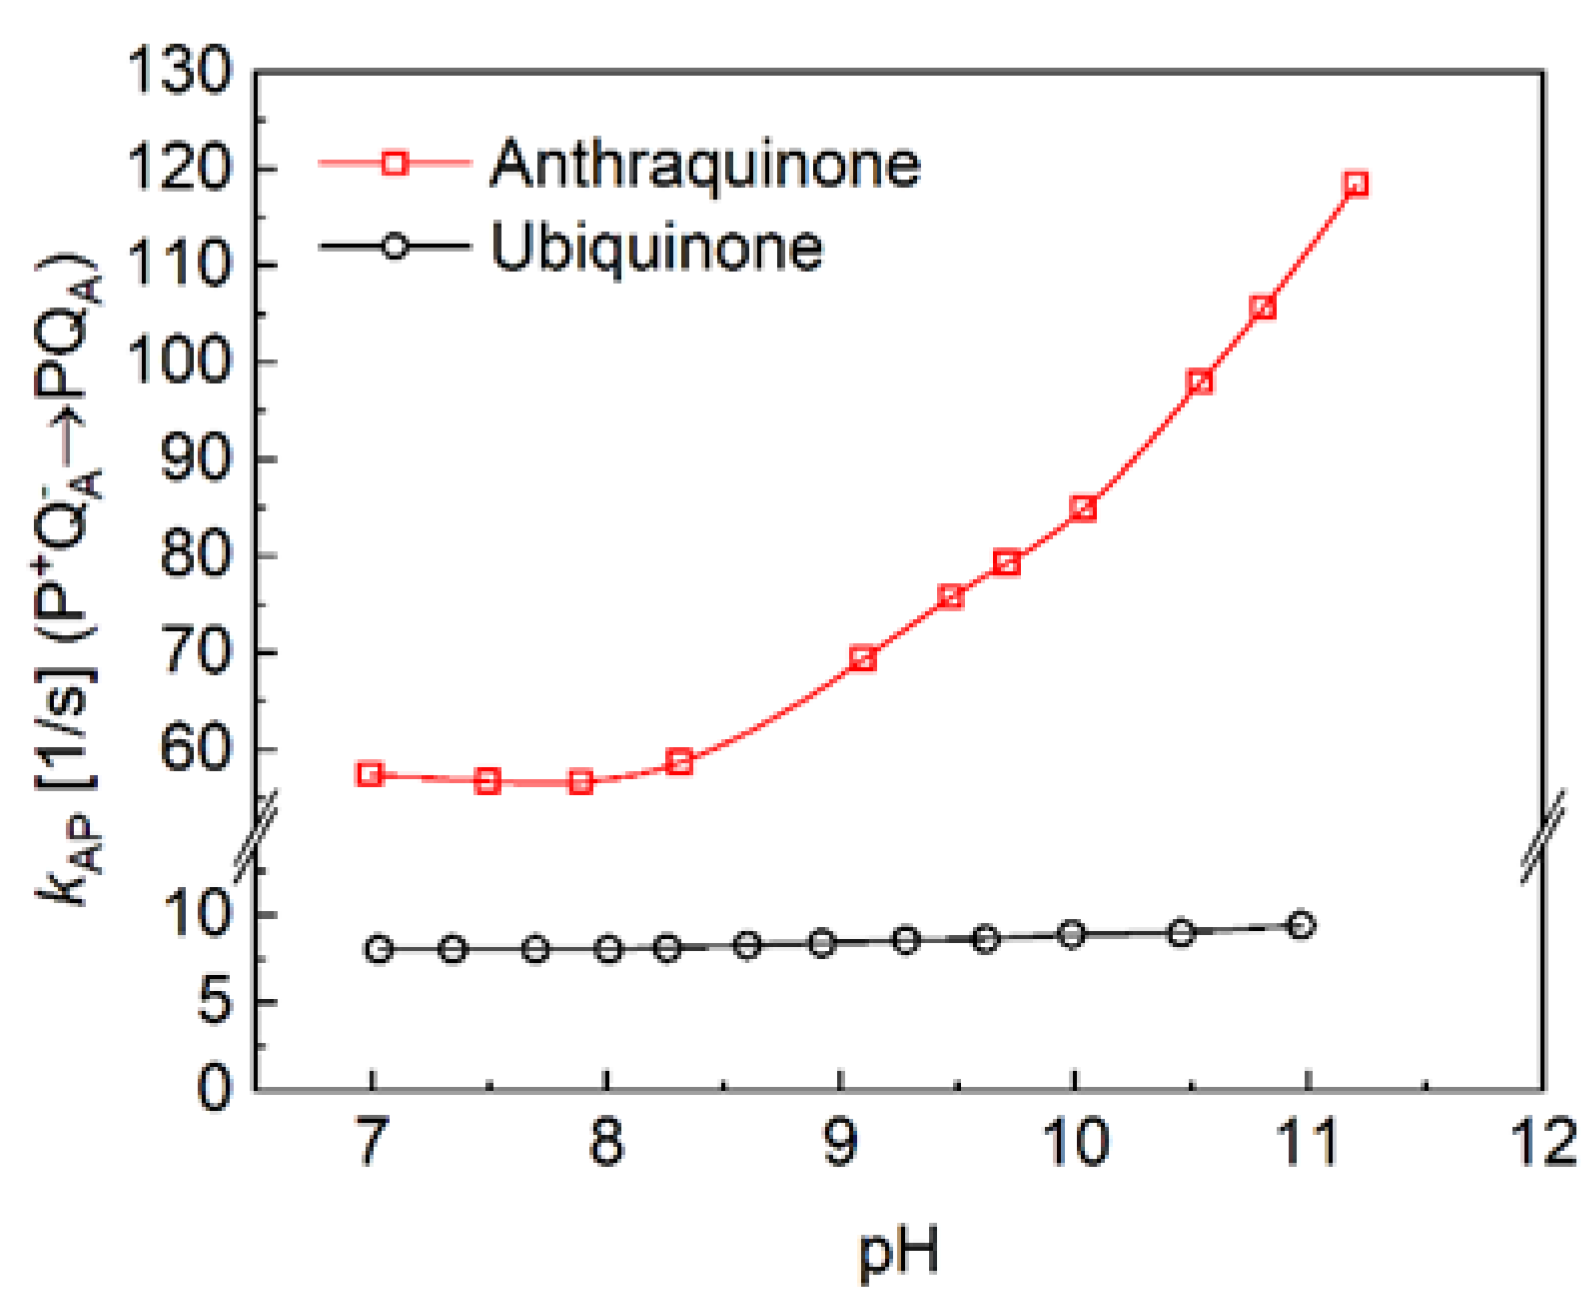
The kinetics of charge recombination were measured in RCs of purple bacterium Rba. sphaeroides where the native ubiquinone10 was replaced by low potential anthraquinones at the primary quinone binding site (Figure 4 top). The charge recombination from the P+QA state can follow two parallel routes, and the rate of the observed reaction will be the sum of the rates of the two reactions ([62], Eq. (1)). The first reaction is a direct tunnelling to the ground state, and the second one is an uphill (indirect) reaction to P+IA, where P+QA pre-equilibrates with P+IA before decaying to the ground state (Figure 2). By replacement of various quinones of very different midpoint redox potentials for the native QA (UQ10), P+QA will recombine indirectly via P+IA if ΔG*<0.8 eV, and directly if ΔG*>0.8 eV [13]. The free energy level of the P+QA state relative to that of the P+IA state can be determined from the relative contribution of the uphill reaction [13,48,63,64,65]. In all our cases, faster kinetics were obtained than that with UQ10 at the QA site indicating the contribution of the indirect way of the charge recombination. The lower is the midpoint potential of the anthraquinone, the more significant is the Boltzmann term in Eq. (1), therefore the increase of the rate constant of the back reaction. As the energy gap for the indirect way of recombination depends on the interactions with protonatable groups, the observed rate constants depend not only on the temperature but on the pH, as well. The sharp difference between the pH-dependence of the charge recombination rates for AQ and UQ10 are demonstrated in Figure 5. Because the rate of direct charge recombination is hardly controlled by the driving force, very slight pH-dependence can be observed if QA is the native ubiquinone. However, if UQ10 is replaced by AQ, the RC will perform increasing rate of the back reaction upon increasing pH. In contrast to earlier work [66], no signs of saturation can be seen in the pH range studied here.
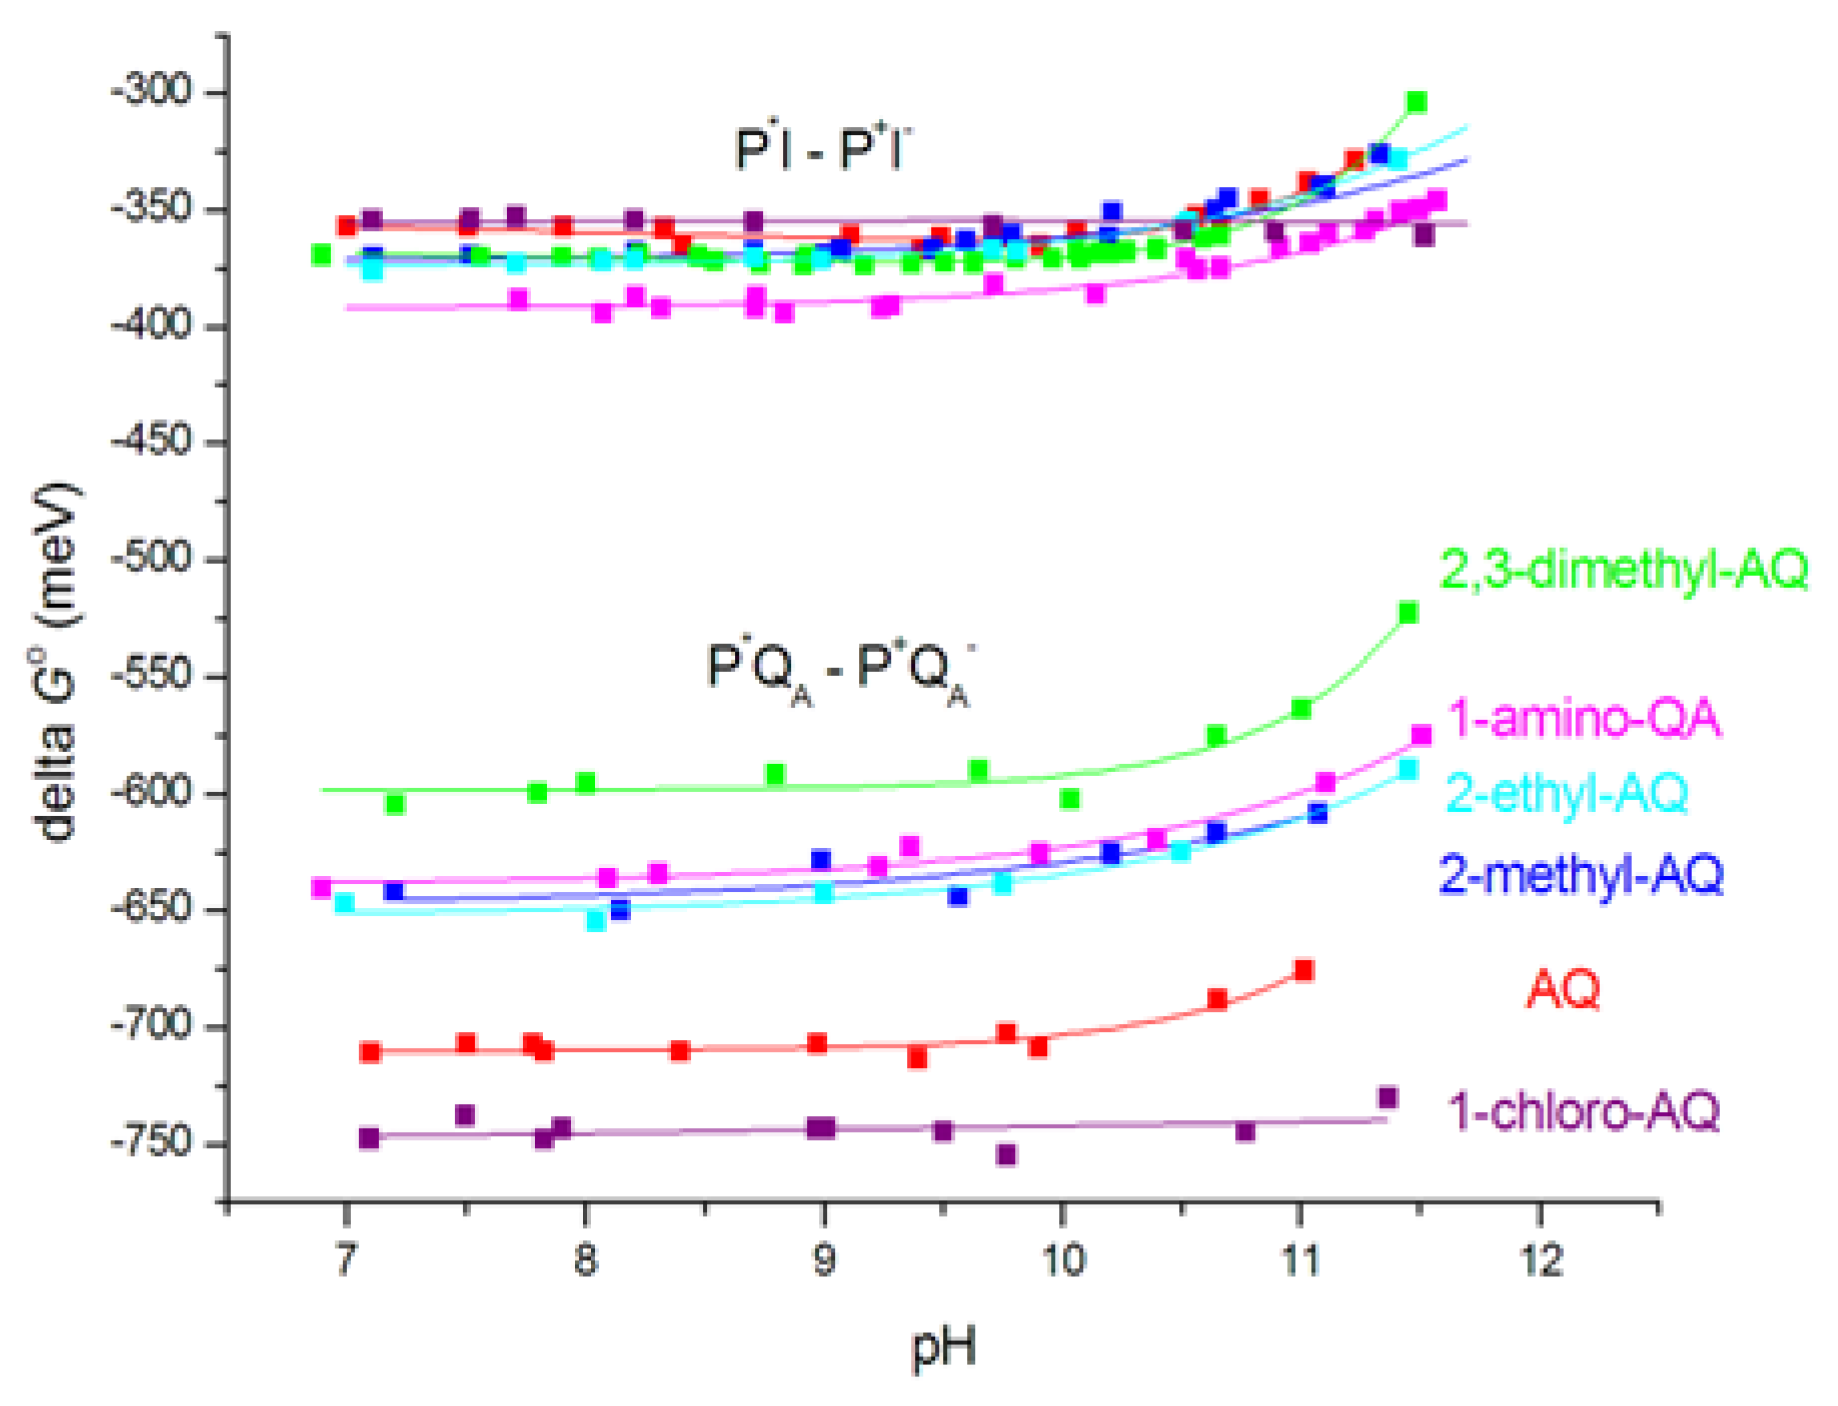
According to Eq. (1), the free energy gap of the thermal activation ΔGo(P+IAQA → P+IAQA) is worth to be introduced instead of the rate constants. The van’t Hoff analysis of the temperature dependence of the measured rate constants offers the difference of the free energy levels of P+IAQA and P+IAQA that proves to be slightly pH-dependent in the alkaline pH region (Figure 6). This is a strong indication that either QA or IA or both are in interaction with protonatable residues in the RC and the interactions are slightly different. The van’t Hoff analysis of the rate constants of the charge recombination gives information about the pH-dependence of the difference of the free energy levels but not about the pH-shifts of the individual P+IAQA and P+IAQA states. The observed difference may come exclusively from stabilization of the QA state at low pH or from stabilizations of both states but in different extents. If we intend to distinguish the two effects and to determine the pH-induced displacement of the state of IA separately, the measured values should be corrected to those attributed to QA. We need a different and independent method for the separation. The delayed fluorescence of the bacteriochlorophyll dimer is an appropriate assay. By comparison of the yields of the prompt and delayed fluorescence of P*, the absolute values of the free energy states of the low potential quinones can be obtained.
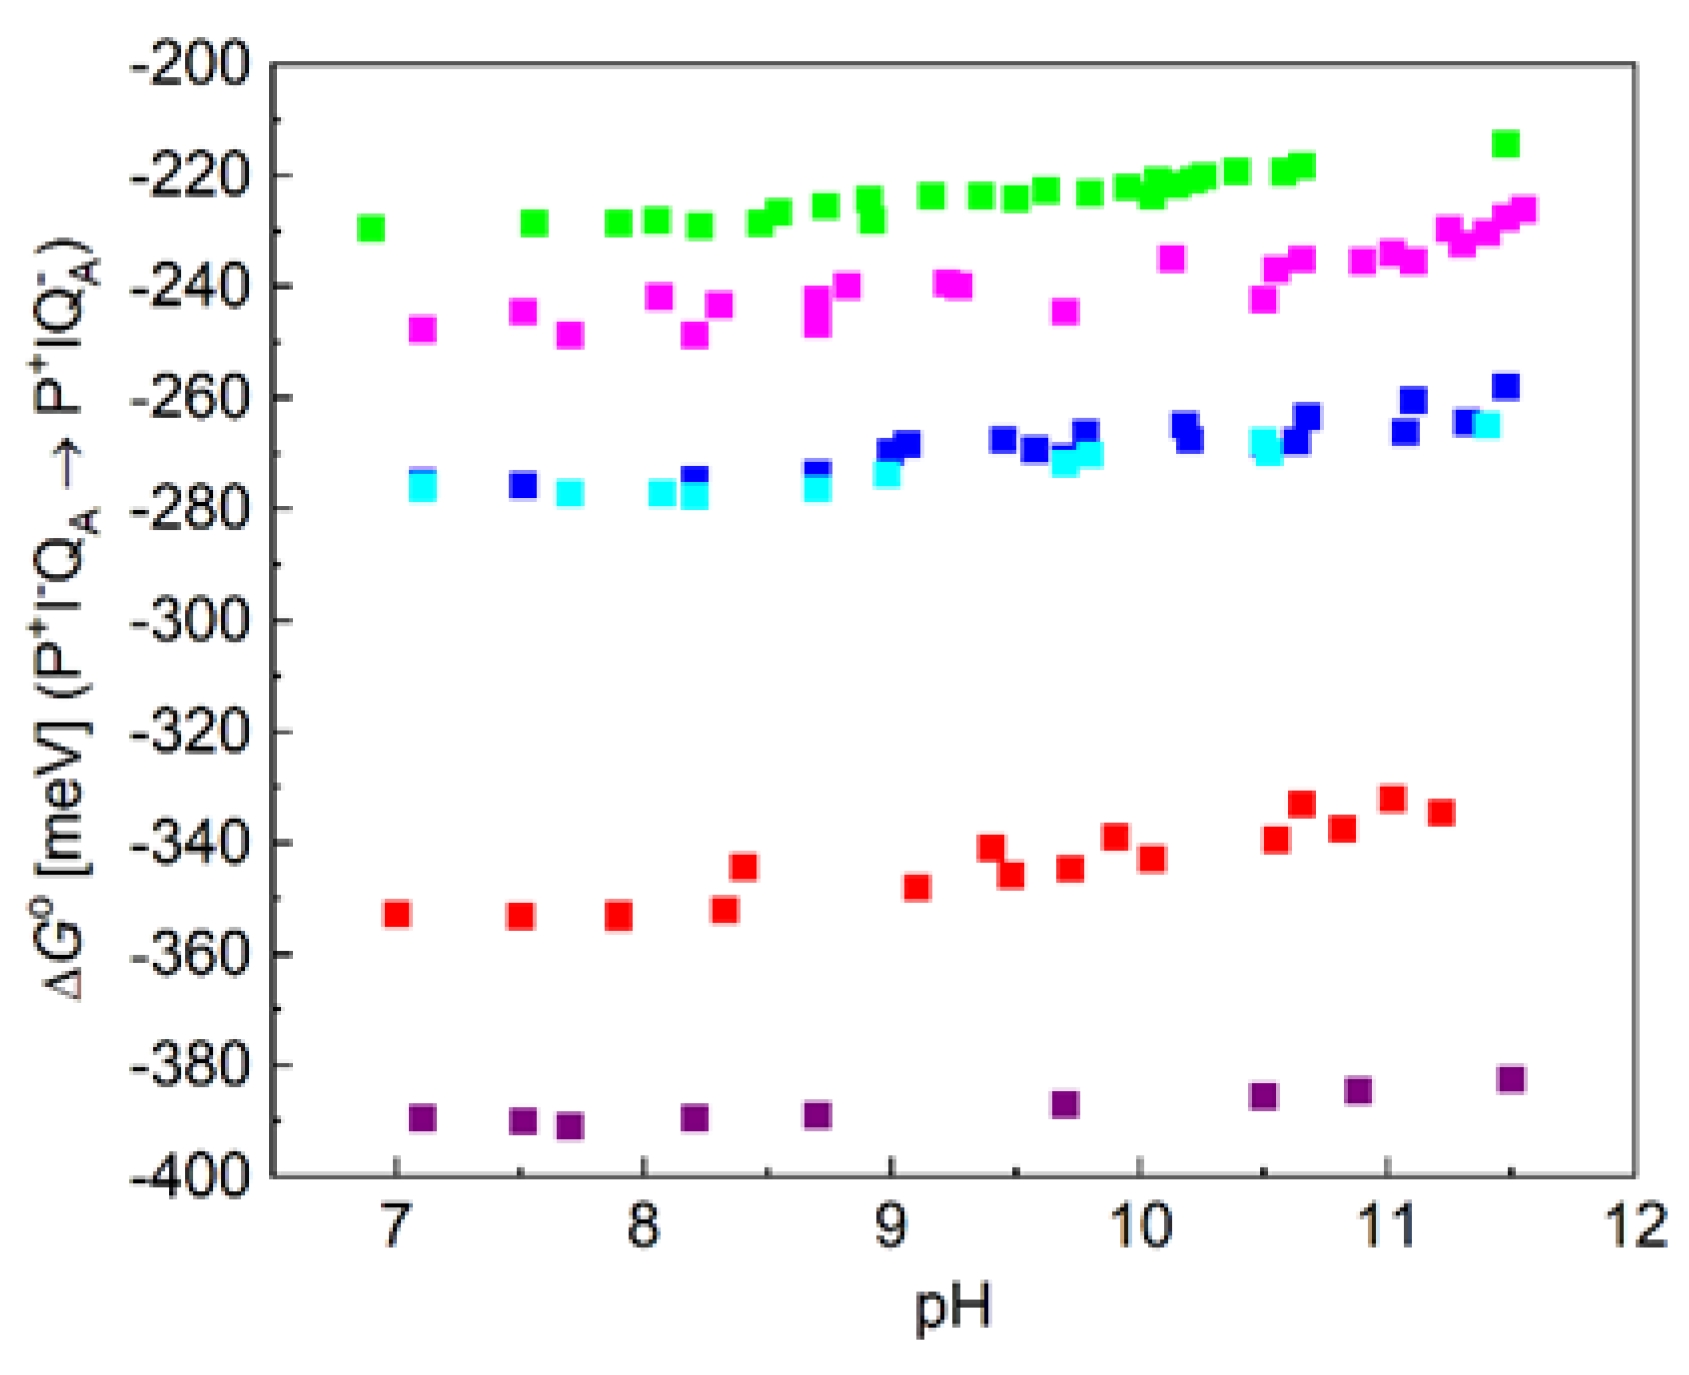
As the delayed fluorescence comes from the leakage of the charge separated state P+QA, it will follow the kinetics of charge recombination (Figure 4 bottom). Because of the relatively slow (about 100 ms) back reaction of RC with native ubiquinone10, the delayed fluorescence can be measured by mechanical shutter with good signal-to-noise ratio. However, the recombination times become much smaller (in the ms time range) upon replacement UQ10 by low potential quinones and accordingly the kinetics of the delayed fluorescence will be faster. The slow response of the mechanical shutter will limit the time resolution of the kinetics. The electronic switching of the photomultiplier and time-correlated single photon counting of the signal was used to avoid the artifacts caused by the intense prompt relative to the very weak delayed fluorescence of the sample [50,53]. With this method, the charge recombination kinetics can be resolved in the sub millisecond time scale and the free energy level of the P+QA state relative to that of P*QA can be determined from the measurement of the delayed fluorescence of the BChl dimer (see Eq. (2)). Figure 7 demonstrates these values for RCs where the native UQA was substituted by a series of low potential AQ derivatives. The free energies perform either no (1-chloro-AQ) or (above pH 10) slight ( 10-15 meV/pH unit) pH dependence. These values are in good accordance with those of previous measurements [13,48]. To verify that the pH dependence observed for rates of charge recombination and intensity of delayed fluorescence were not artifacts of the quinone removal and reconstitution process, they were also measured for RCs reconstituted with UQ10. The essential pH independence for kAP(UQ10) and slight pH-dependence for ∆GP*A(UQ10) were in good agreement with those presented earlier [48,49,67].
If the free energy gap between P+IAQA → P+IAQA is subtracted from the free energy level of P+QA, the free energy state of IA would be obtained. Comparing the two set of curves for different AQ substituents, the following conclusions can be drawn. 1) It is not expected that the free energy state of IA would depend on the chemical nature of the substituent at the QA binding site. However, the free energy levels of IA for different substituents are not unified into a single trace but constitute a narrow branch of curves. This will indicate that the lowest level of P+IA relaxation will depend slightly on the chemical nature of QA. Different QAs will cause different degree of relaxation of P+IA. 2) The free energy levels of P+IA show definite pH-decrease at the highly alkaline pH range (pH > 10) in an extent comparable to that of P+QA. Similar residues of high pKa values may participate in the pH-dependent interaction with the negative charge on QA and IA. Likewise, as for P+QA, 1-chloro-AQ performs no pH-dependence indicating the possibility of unique binding structure at the QA site which may reduce (block) the electrostatic interactions with the cluster of residues.
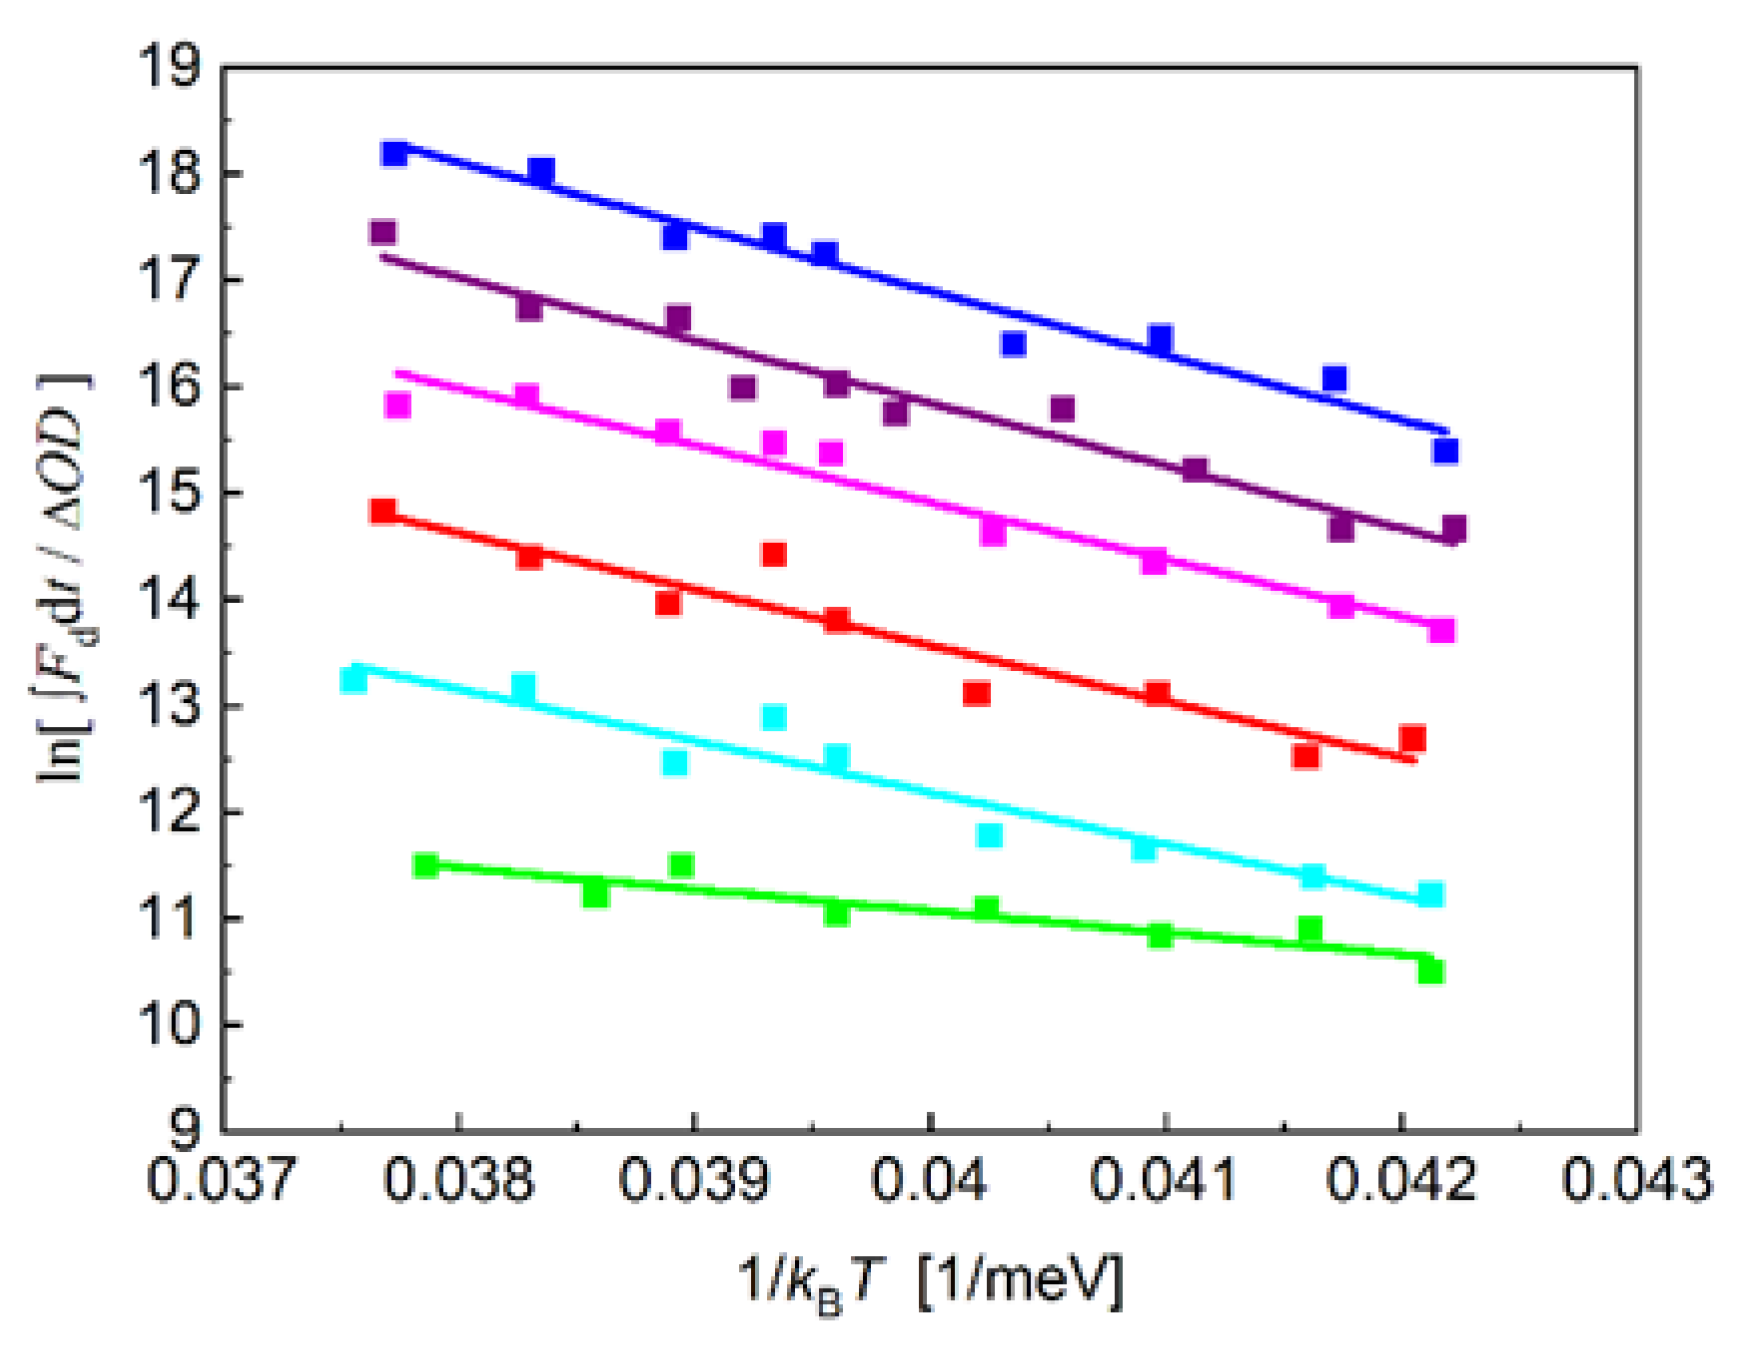
The standard free energies between P+QA/P* and P+QA/P+IA obtained from direct measurements of the intensity of the DL and the rates of charge recombination consist of enthalpic (ΔHo) and entropic (T·ΔSo) terms: ΔGo = ΔHo - T·ΔSo that can be determined from temperature-change measurements [38]. The enthalpy changes can be obtained from the temperature-dependence of the amplitude (integral) of the decay of the delayed fluorescence as the slopes of the straight lines offer the enthalpy change of the charge separation (van’t Hoff plot, Figure 8). The thermodynamic parameters for the different quinones in the QA site are summarized in Table 1. The changes of the free energy and the enthalpy of the P* → P+QA and P+IA → P+QA transitions are negative for all quinone analogues indicating spontaneous and exothermic reactions, respectively. The entropy changes perform large variations upon quinone substitution and are positive (with assumption of 1-chloro-AQ in the P+IA → P+QA transition) representing increase in the disorder of the system.

4. Discussion

The bacterial RC presents exceptional opportunities for studying charge compensation and conformational relaxation in proteins. Immediately after charge separation, the RC begins to reorganize around the newly formed anion and cation via protein relaxation [68,69] and/or static distribution of conformational heterogeneity [70], resulting in a time-dependent decrease in the standard free energy of the P+IA (Figure 2). Additionally, our results above demonstrated the role of protonation in the early steps of the charge stabilization that will be set in the focus of the discussion.
The novelty of our investigation was the experimental determination of the drop of the free energy level of the P+IA state in the alkaline pH range that demonstrated similarities with those of the P+QA and P+QB semiquinone states both in 1) pH-dependence and in 2) magnitude. 1) This observation calls for common origin, explicitly for the interaction of P+IA with the acidic cluster in the QB binding domain. 2) Compared to the semiquinones, the interaction with P+IA could be more complex due to the hydrophobic location and to the short lifetime of the P+IAstate that may rise kinetic constraint of the internal protonation processes in the cluster. However, the replacement of the native UQA by low potential quinones increases the lifetime of P+IA by about 5 orders of magnitude (from 10 ns to 1 ms) in expense of corresponding decrease of its apparent concentration. The electrostatic and kinetic control of the interaction between P+IA and the acidic cluster around QB will be surveyed.

4.1. Interaction of the P+IA State with the Acidic Cluster at QB

The RC shows similar H+ responses (pH-dependence of the free energy states) to establishment of QA, QB and I which means that many of the same groups experience the bulk of the conformational changes and pKa shifts despite the different locations of the charge and by the fact that all are closer to the QB site. This is because the local hydrophobic dielectric around QA and IA is rather ineffective in screening the negative charge which have long-range electrostatic influence [71]. On the other side, the charges in the acidic cluster might be well screened by the mainly hydrophilic character of the environment. The X ray structure of the RC demonstrates several (up to 6) water molecules in the QB site when QB is absent [41,72,73] suggesting the invasion of water molecules into the QB site if it is not occupied by the ubiquinone. This is the case in our experiments, as the QB activity of the RC is not restored after UQA replacement by quinone analogues, therefore the charges in the acidic cluster nearby the QB binding site should be screened greatly by the invaded water molecules. The electrostatic pattern is further complicated by a loose cluster of water molecules extending almost from QA site to QB site. The water molecules in the cluster are sufficiently ordered to be well defined in the X-ray structure [74] and the linkage (as “wire”) between the two quinone sites was used to understand the modification of flash-induced proton binding in various mutants of the RC [33,75]. The chain of water molecules might function as a polarizable transmitter of the electric potential of QA to the acidic cluster. Studies on charge-charge interactions between P+ and ionizable amino acid residues introduced by mutations at selected sites demonstrated strong electrostatic screening [76]. Counterions made major contributions to this screening, but penetration of water molecules or other relaxation processes could also play substantial role.
Despite the highly complex nature of the electrostatic interaction, we try to apply minimum electrostatic model to get quantitative support of the observed phenomena.

4.1.1. Comparison of the Measured and Calculated Free Energies of QA/QA and IA/IA at High pH

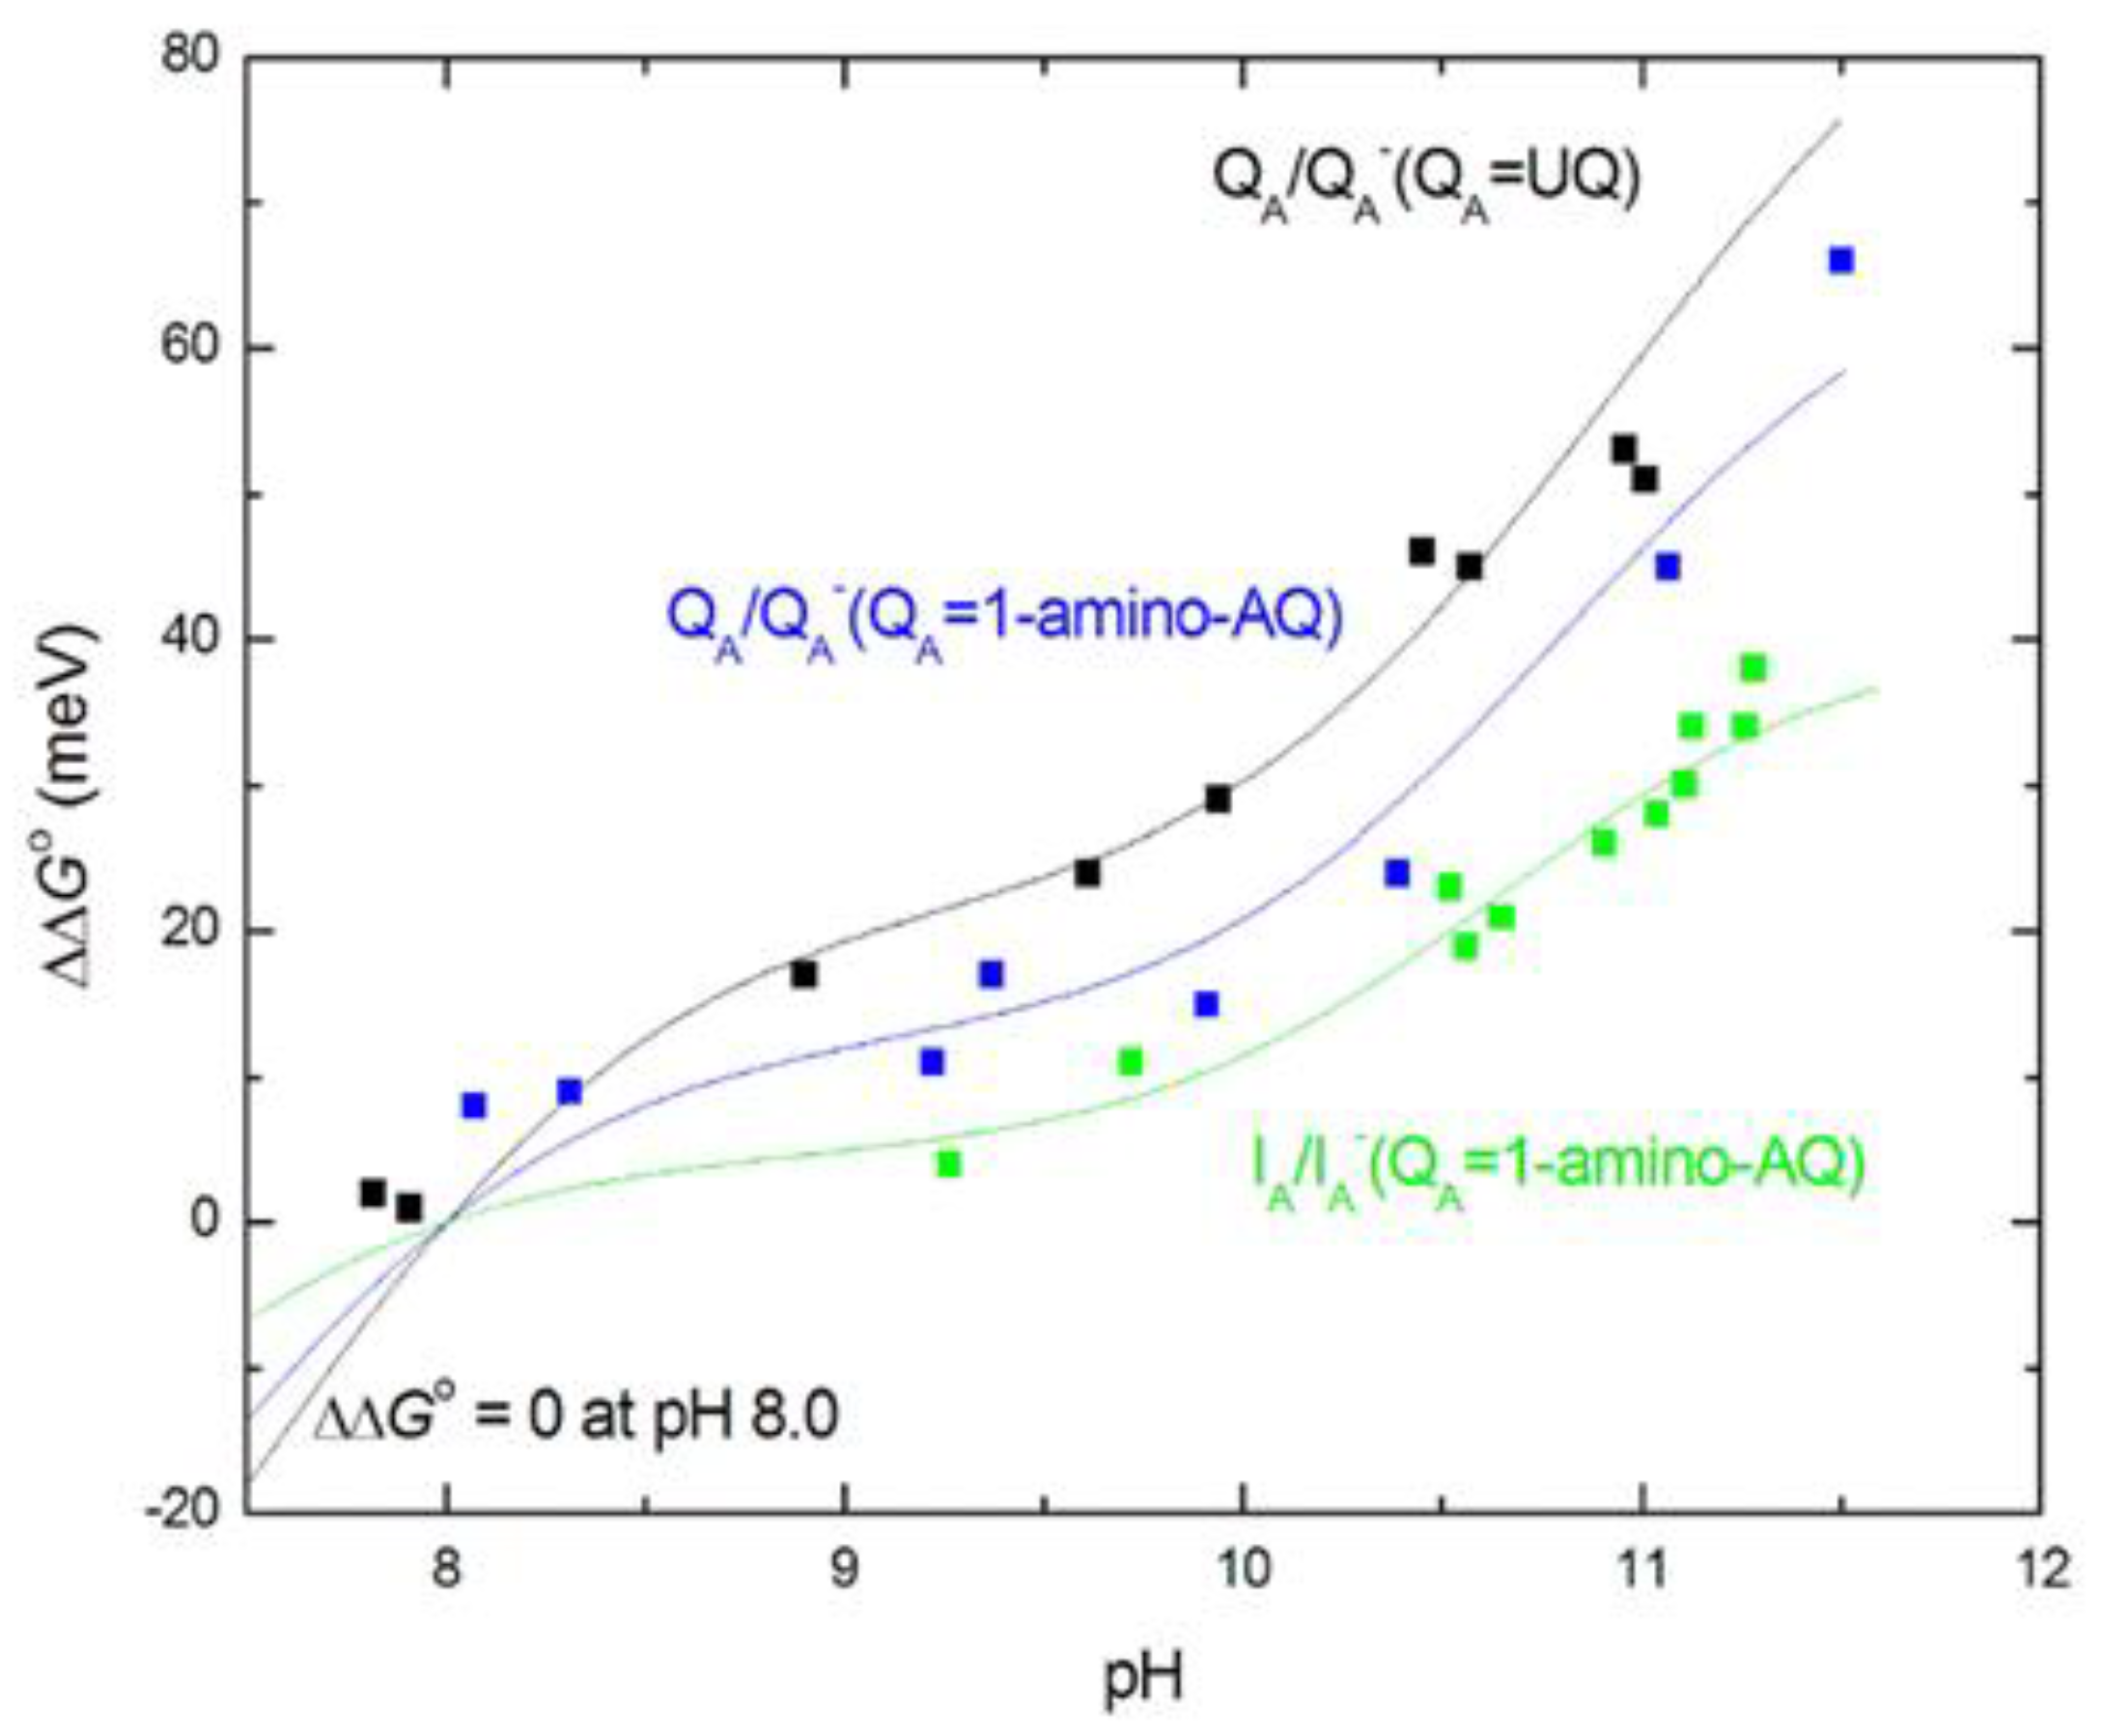
The observed slight increase of the free energies at high pH (Figure 7) can be well described by the anticooperative proton binding model of the acidic cluster ([59], see in M&M) using reasonable assumptions. 1) The intrinsic pKa values of all acidic residues in the cluster (Asp and Glu) were taken 4.5. 2) The interaction energies among all couples (within and outside the cluster) are inversely proportional to their distances. 3) The pair energies in the cluster are not affected by substitution of the quinone analogues to the QA binding site. Figure 9 demonstrates how well the calculated model with 4 amino acids in the cluster approaches the measured points when the native ubiquinone and 1-amino-AQ are on the QA binding site. The data for all quinone substitutes used in this study are collected in Table 2.
Similarly to spectroscopic [77] and FTIR [40] studies on site-specific mutants, our results identified GluL212 (in interaction with AspL213) as major contributor in this process. These two acids have different accessibility to the protein surface that determines which is ionized first. GluL212 is the residue that binds a proton when QB is reduced [40,78]. As AspL213 is ionized at the lower pH, it suppresses the ionization of GluL212 resulting in an unusually high pKa (≈10). Since, the net charge on the two acids remains the same, with only one being ionized up to pH 9, the precise distribution of cluster protonation has only modest effects on the interaction with surrounding groups [79]. The closely spaced and strongly interacting residues in the cluster result in decrease of the slope of the high pH-dependence of the free energy change and the pH-titration deviates markedly from the classical Henderson-Hasselbalch titration.
The observed interaction energies of the cluster with the light-induced QA and IA anions showed strong dependence on the chemical structure of the quinone analogue at the QA site (Table 2). This can be considered as manifestation of cross-talk between the sites. Signalling of structural information introduced at the QA binding site occurs from one site to the other via long-distance influence on the ionization and conformational states of the cluster. Isoprenyl ubiquinones induced relatively large protonation/conformational configuration [64]. In contrast, the planar naphthoquinones could allow a small structural relaxation only. Additionally, some mutations of RCs where the naphthoquinones were used as QA, appeared to “break” the linkage between the two quinone sites. Most notable of these were mutations of ProL209 to Phe, Tyr and Trp [75], which were characterized by X-ray diffraction analysis. Similarly, great reduction and even elimination of the high pH proton uptake to the QA state was observed when certain naphthoquinones (e.g. menadione (2-methylnaphtoquinone)) were substituted for the native ubiquinone (Q-10) in the QA site [46]. Similarly, the lack of protonation/deprotonation of the cluster in the alkaline pH range was observed in this study when 1-chloro-AQ occupied the QA binding site. The elimination of the pH-dependence of the free energy both of QA and IA redox states indicated that 1-chloro-AQ at QA site broke the (dynamic and/or energetic) cross-talk with the acidic cluster.
All these observations reflect connection among the QA and IA binding sites and the remote acidic cluster resulting in a structurally sensitive communication. The interaction can be mediated by possible contact between the redox centers and essential amino acids in the binding pockets (e.g. methionine M218 [49] and tryptophane M252) and by extended network of internal cavities in the RC. Thus, the perturbation caused by quinone replacement can spread out to the IA binding pocket and to the acidic cluster via histidine M219 and the His-iron complex. The result indicates that the energy landscape is both complex and subtle and requires greater experimental resolution than is currently available, as well as correlation with more structurally informative methods (e.g. mapping surface cavities by CASTp, see below) [80].

4.1.2. Role of Protein in Determination of the Interaction Energies

Several observations indicate that the electrostatic interaction between charges in the RC is governed not by simple electrostatics in homogeneous medium (the energy of point charge is proportional to 1/(D·r)), but the picture is shaded by local polarizations. It turned out that the acidic cluster had similar interaction energy with IA and with QA (Table 2), although they are in different environments with highly different dielectric constants and at comparable distances from the cluster (Figure 1). The problem is similar when the free energies of the QA and QB states are compared: although the distances to the cluster are significantly different, the free energy gap is even smaller (60 meV at neutral pH, which gradually disappears with increasing pH at pH ≈11). To the introduction of a charge on QA, QB or IA, the RC gives delocalized responses which are coordinated by an interactive network that links the electron acceptors, polarizable and protonatable residues, and numerous water molecules that are located at the cytoplasmic region of the RC [27,33].
Simple models of single (Figure 3A) and double planar interface (Figure 3C) between the hydrophobic and aqueous phases were used to consider the effects of polarization on the effective dielectric constant in analytical forms. Although the models were highly simplified and served as minimum approach to the actual arrangement, they offered quantitative approximation of the variation of the effective dielectric constant in the vicinity of the aqueous phase. Taking reasonable values for the distances (QA from the aqueous phase x ≈ 5 Å (model A) [66] and thickness of the hydrophobic belt of the RC x ≈ 42 Å (model C) PDB ID: 3I4D), Deff =10.0 ± 0.5 and Deff =6.5 ± 0.5 effective dielectric constants represent the QA↔cluster and IA↔cluster electrostatic interactions. These values are in good agreement with estimates from [71]. As the products of Deff·R are very close in the two cases, the interaction energies should be similar in good accordance with the experimental results (Figure 7 and Figure 9). The hydrophobic region around QA decreases and the vicinity of the aqueous phase around IA increases the effective dielectric constant to keep the QA↔cluster and IA↔cluster electrostatic interactions on similar levels.
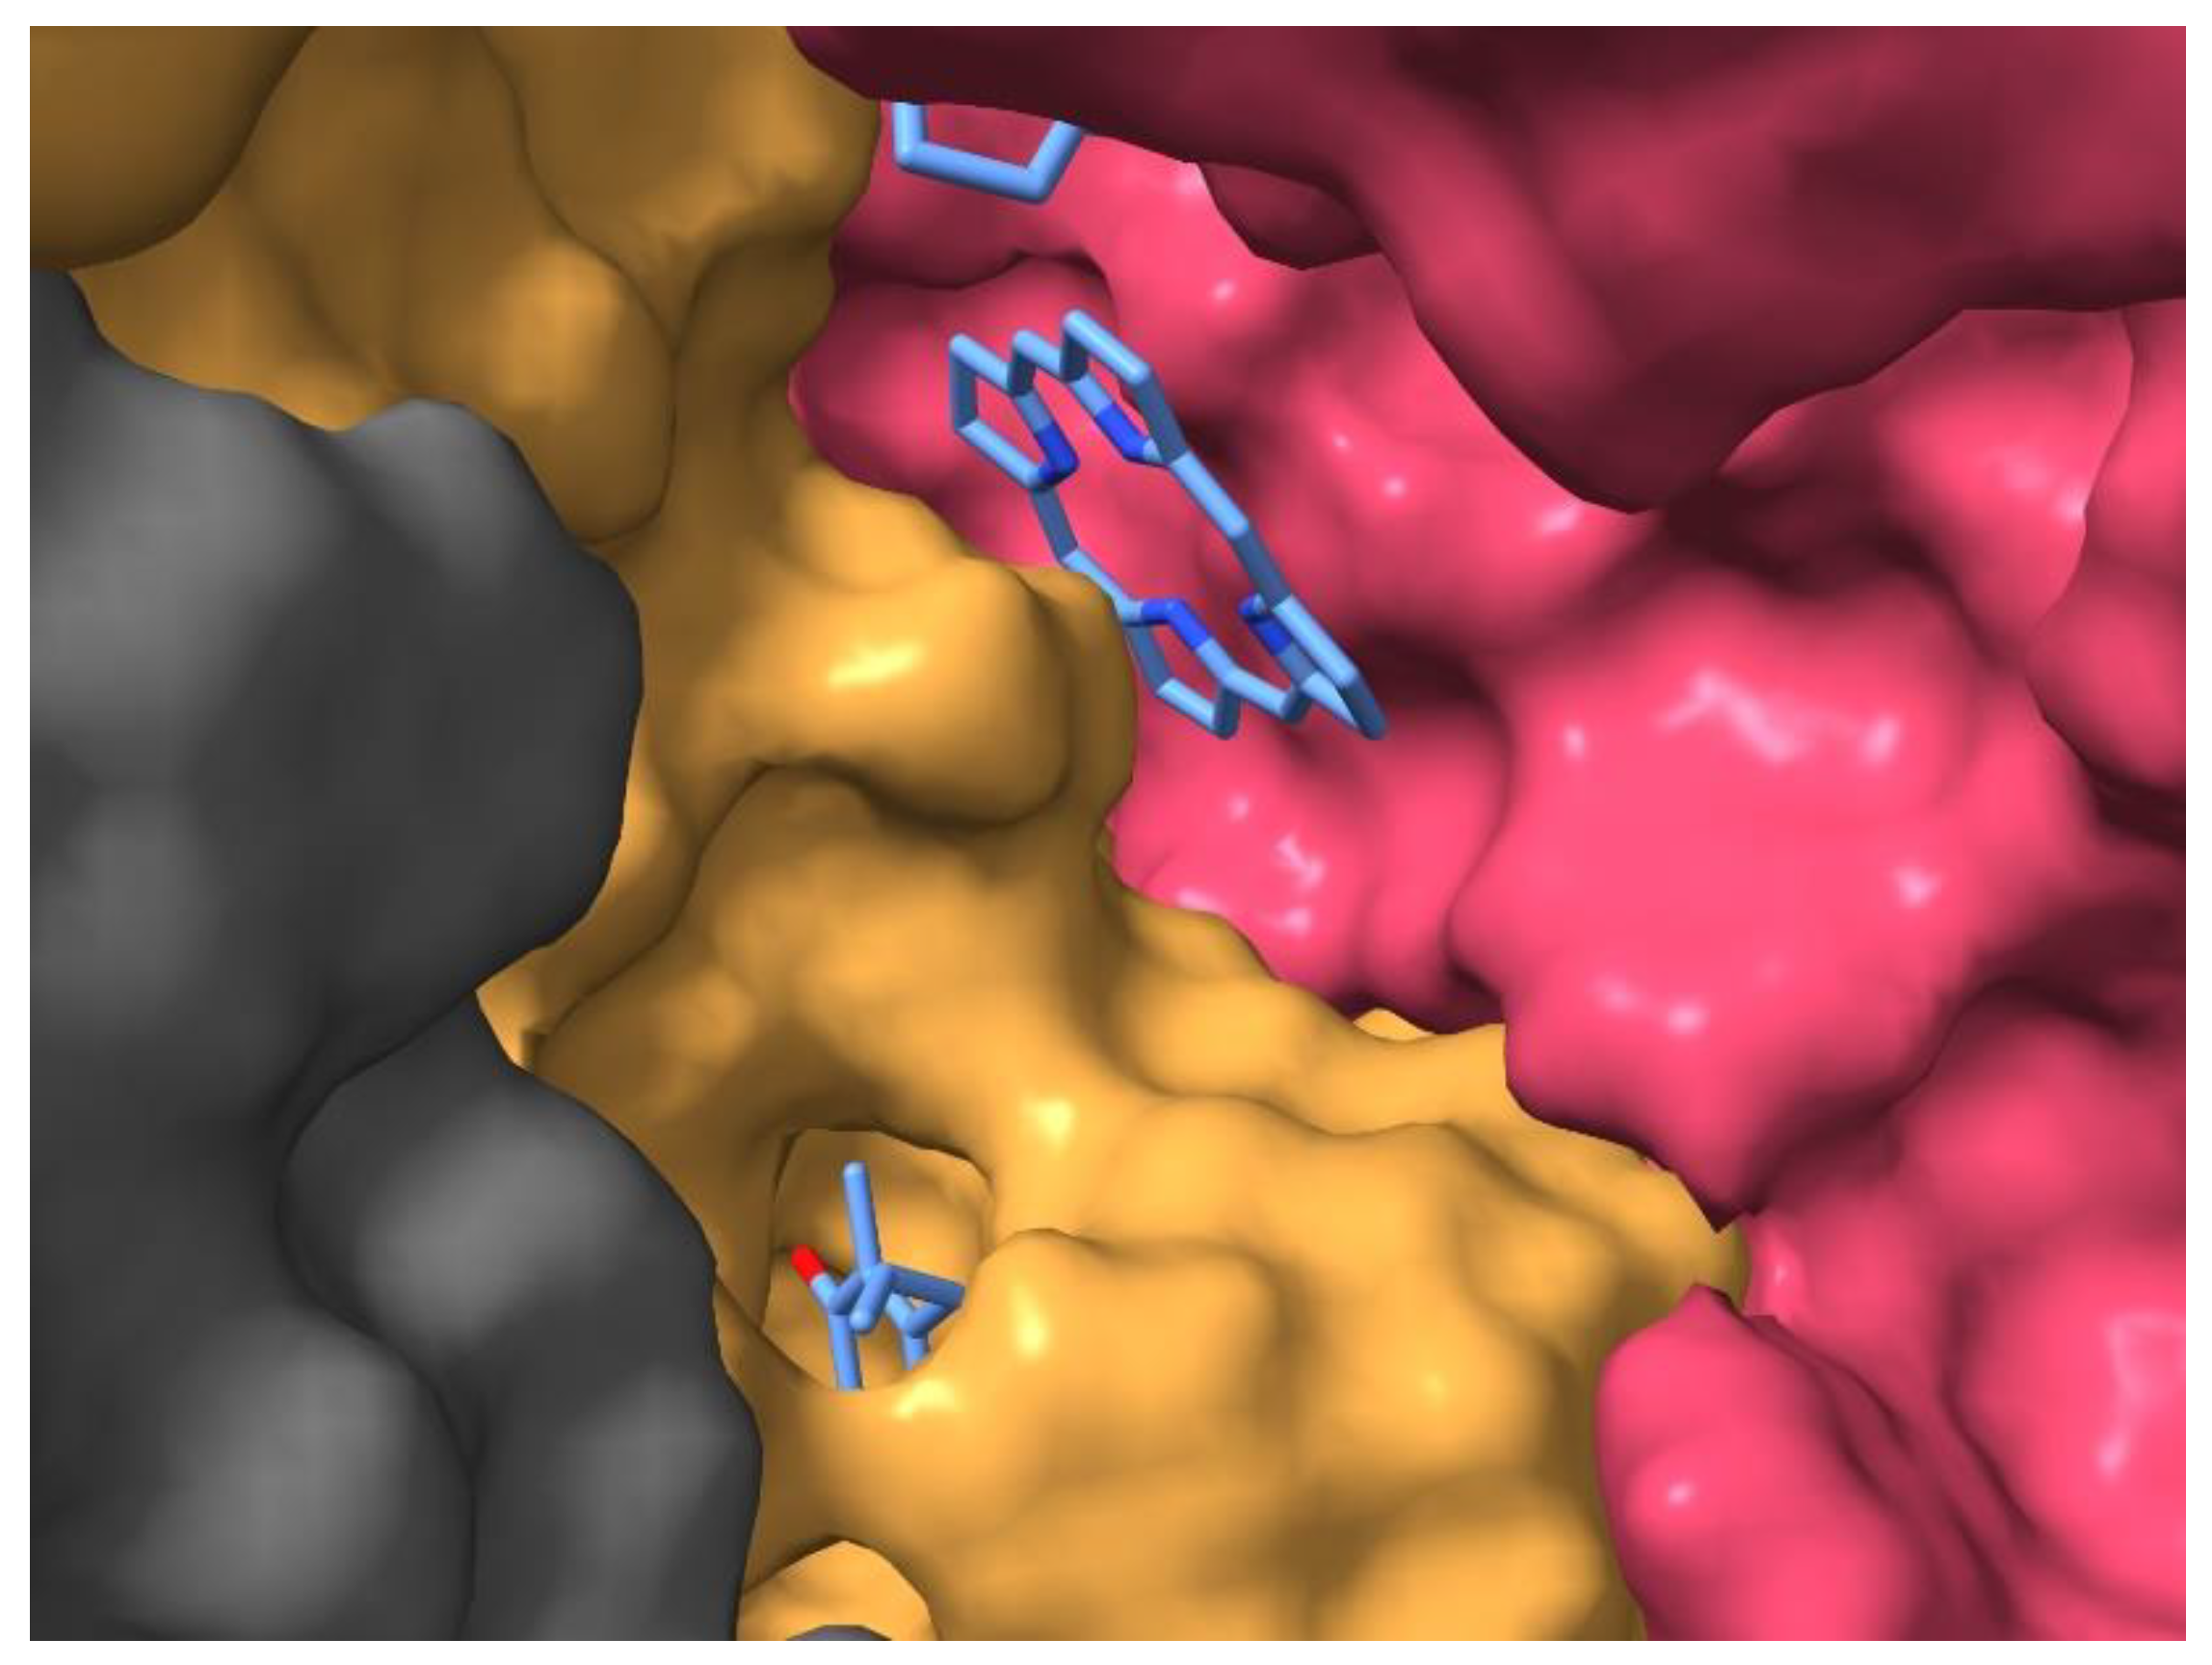
A closer look at the structure of the RC will support this conclusion. The isolated (membrane free) RC protein is not tightly packed by the cofactors and amino acids but has extended cavities accessible for solute molecules. Remarkable cavities can be observed in the hydrophobic belt of the RC connecting the QA binding pocket with those of the two bacteriopheophytins and the QB (Figures S1–S6 in Supplementary Information). Part of the porphyrin ring of IA is at the entrance of the surface cavity, thus exposed to the solute (Figure 10).
The arrangement gives opportunity for electrostatic screening of the charge on IA in aqueous solution resulting in increases of the effective dielectric constant as handled in the simplified electrostatic models.

4.1.3. Dielectric Relaxation of the Free Energy of the P+IA State

When the native ubiquinone is substituted by quinones with substantially more negative midpoint potentials, the decay of P+QA proceeds via a thermally accessible intermediate state (Figure 2). A long-standing question is the nature of the intermediate state. As the energetics of the relaxation does not depend strongly on the nature of the substituted quinones, the intermediate state cannot be an activated form of P+QA. According to electrostatic interaction energy calculations in Rhodopseudomonas viridis, the P+IA radical-pair is found to lie about 87 meV below the lowest excited singlet state of the dimer (P*), when the radical-pair is formed in the static crystallographic structure [81]. The reorganization energy for the subsequent relaxation of P+IA is calculated to be 217 meV, so that the relaxed radical-pair lies about 304 meV below P*. Here, we observed somewhat larger stabilization energy of the P+IA charge separated state of RCs from Rba. sphaeroides. The dielectric relaxation is deeper and depends slightly on the chemical nature of the substituting quinone: the average free energy level is ─370 ± 20 meV. The drop of the free energy of the slow dielectric relaxation relative to P* is comparable to the free energy level of the (unrelaxed) state of the P+IA radical-pair right after its formation (~ 210 meV, [12]). It can be concluded that the transient state is not identical with an activated form of P+QA nor is it a hot P+IA state (PF) identified on the nanosecond time scale from fluorescence measurements but is a highly relaxed form of the P+IA state formed via substantial (≈ (370 ± 20) meV) relaxation after the initial charge separation on the long (millisecond) time scale.
Our experiments clearly showed that a small part of this substantial dielectric relaxation was pH dependent (Figure 7). In the alkaline pH range above pH 10, a slight increase of the free energy of the P+IA state was observed, which was attributed to the interaction with the distal acidic cluster around QB. This pH-dependent interaction energy adds up to not negligible part of the total relaxation energy of 370 meV. Due to the lack of reliable measured data at extreme high (>11.5) pH values, the maximum energy attributed to protonation cannot be obtained experimentally as the initial rise and not the plateau can be measured in the very alkaline pH range. We can make a lower estimate of 60-80 meV, which means that the (full) protonation includes a stabilisation energy of about 20% of the total relaxation energy. This is roughly the same magnitude as observed for stabilization of the P+QA charge pair (Figure 7).

4.2. Thermodynamics of P+QA and P+IA Formation.

The driving force of the chemical reaction is the Gibbs free energy, which is composed of enthalpic and entropic components and their ratio has been always matter of debate in photosynthetic systems. Although the Marcus theory of electron transfer omits the entropic contribution, recent experimental results pointed out the crucial role of the entropy change [38,47,82]. The detection of delayed fluorescence and indirect charge recombination (Eqs. (1) and (2)) offered the change of the free energy between the P* → P+QA and IAQA → IAQA transitions directly and the changes of the enthalpy and entropy could be derived straightforwardly (Table 1.) The reactions are driven mostly by the enthalpy changes, and the entropy change plays minor role only. However, the estimation of the entropy change is important because it informs about the possible structural changes caused by insertion of quinone derivatives to the QA binding site.
In native RC (UQ10 is at the QA binding site), the formation of P+QA appears to involve a small (≈ 9 % of free energy change) positive entropy change reflecting the increase of disorder due to the charge separation rather than to mobility of QA. It remained in the same orientation upon illumination according to ENDOR experiments [83] and the structure of IA was found very similar to the structure of BPhe a in solution [84]. The hydrogen bonds to QA were significantly shorter in the QA•− state compared to the neutral quinone state leading to a stabilization of the radical anion [85]. Similar shortening effect was seen in the H-bond distances of the pathway to QB upon reduction of QB. The cofactors IA and QA appear to be electronically close to their free forms as there is no evidence for packing effects from the protein matrix and are not tuned in a special manner by their surroundings. The overall architecture of the QA binding site is designed to provide structural rigidity. The protein framework (Trp M252 and Ile M265 in van der Waals contact) and the H-bonds (with Ala M260 and His M219) limit the mobility of QA, holding it in a position optimized for electron transfer to and from the quinone.
The reconstitution includes radical steps involving opening the pocket with high concentration of ionic detergent followed by insertion of a one ring ubiquinone by a three ring AQ in the binding pocket. These treatments may lead to various changes of the structure resulting in changes of the entropy. While the tighter packing and loss of isoprenoid side chain decrease the observed entropy of the system, the possible increased flexibility of the pocket including changes of the conformation of the backbone and residues, and looser binding and heterogeneity in the orientation of QA enhance the entropy (Figure S7 in SI). Depending on the actual modifications, the observed entropy changes may show up large variations for both transitions. They are mostly small but can display deviations in both directions. The small entropy change means that the electron transfer is not accompanied with essential rearrangements of the structure and the two electron sinks as redox centers operate under optimal conditions. However, the contribution of the entropic change to the free energy change is very large (≈ 65 %) in RC reconstituted by 2,3 dimethyl-AQ. Both transitions are driven almost entropically when 2,3-dimethyl-AQ occupies the QA site. On the other hand, the substitution of UQA with 1-chloro-AQ decreases the disorder of the IAQA → IAQA reaction (T·ΔS is negative), indicating the loss (freezing) of dynamics of the connection between IA and QA. Similarly unusual consequences of the 1-chloro-AQ replacement were experienced when the cross-talk between QA (or IA) and the acidic cluster was blocked (see above). Unfortunately, generally accepted (in PDB deposited) structural data which would support these possible changes are not available [86].

4.3. Comparison of the Rates of Protonation and Electron Transfer Back Reaction

The charge recombination and the proton binding/unbinding reactions are combined in a way represented in Figure 7 and Figure S8 in SI. We observed that the electron back reaction from the charge separated state to the ground state followed single exponential decay kinetics in all cases of quinone substitutions. This proves that the protonated/unprotonated P+IA and P+QA states are in equilibria and the rate constants of protonation konH +koffH is much larger than that of the charge back reaction kback ~103 s-1.
In photosynthetic RC, the degree of utilization of light energy for photosynthetic purposes is determined by the efficiency of electron transfer from IA to QA. The large ratio of rates of protonation to that of backward recombination favours the high efficiency of the free energy storage. In the forward process (electron transfer from IA to QA), the reorganization energy (including protonation) and the free energy gap are finely tuned making the process activation-less. The matching is due to the low dielectric constant of the RC protein core because the low dielectrics affects strongly the electrostatic polarization components of both the reorganization energy and the equilibrium free energy of the reaction [71,87]. In the back reaction, however, these quantities are mismatching and cause large activation energy. If the protein and membrane were replaced by a homogeneous medium with a high dielectric constant, the effective energy storage would be negligible.
The method of substitution of quinone analogues at QA binding site used in this study offers unique advantages for comparison IA and QA related electron and proton transfer reactions. As the lifetime of reduced IA is very short in the presence (≈200 ps) or absence (≈14 ns) or pre-reduced form (≈8 ns) of native QA [88], the accomplishment of protonation processes in the QB cluster is not facilitated. However, the lifetime can be increased significantly (by several orders of magnitudes) by replacement of the native ubiquinone at QA by high potential quinone which enables the detection of the interaction with the acidic cluster around QB. The cost of that is the similarly large decrease of the amount of IA participating in the interaction. Additional advantage of the replacement is the simultaneous and direct detection of the interactions of QA and IA with the acidic cluster by omission of the complexity originating from different kinetics of protonation and relaxation of the RC states.

5. Summary

The bacterial RC is an ideal protein to study protonation dependent redox reactions since the electron and proton transfer to QB are closely coupled. By the combination of different experimental approaches, such as charge recombination and delayed fluorescence based on replacement of the native ubiquinone to high potential anthraquinones at the QA binding site, the interaction between the acidic cluster around the QB binding site and the negative charge on either QA or IA was revealed. Thus, new aspects of the coupling of the proton and electron transfer reactions based on remote interactions were discovered. These studies provide potential for a deeper understanding of the mechanisms of electron transfer and proton-coupled electron transfer in other chemical and biological systems.

Supplementary Materials

The following supporting information can be downloaded at the website of this paper posted on Preprints.org. 1) Network of surface and internal cavities of the isolated reaction center protein of Rhodobacter sphaeroides; 2) Simulation of substitution of ubiquinone by anthraquinone in the QA binding pocket; 3) Scheme of the free energy levels of the different redox and protonation states of IA and QA with possible electron and proton transitions of different rates leading to quasi-stationary equilibria.

Author Contributions

Conceptualization, P.M.; Methodology, P.M and G.S; Software, G.S; Formal Analysis, G.S.; Investigation, G.S.; Resources, P.M.; Data Curation, G.S.; Writing—Original Draft Preparation, P.M.; Writing—Review and Editing, P.M.; Visualization, P.M. and G.S.; The authors have read and agreed to the published version of the manuscript.

Data Availability Statement

The raw data supporting the conclusions of this article will be made available by the authors upon request.

Acknowledgments

We appreciate the support from Prof. Dr. S. Szatmári, Institute of Experimental Physics, University of Szeged, Hungary.
Declaration of interests: The authors declare that they have no known competing financial interests or personal relationships that could have appeared to influence the work reported in this paper.

References

  1. Blankenship, R.E. Molecular Mechanisms of Photosynthesis, 3rd ed.; John Wiley & Sons: 2021.
  2. Croce, R.; van Grondelle, R.; van Amerongen, H.; van Stokkum, I. (Eds.) Light Harvesting in Photosynthesis; CRC Press: 2018.
  3. Mirkovic, T.; Ostroumov, E.E.; Anna, J.M.; van Grondelle, R.; Govindjee; Scholes, G.D. Light absorption and energy transfer in the antenna complexes of photosynthetic organisms. Chem. Rev. 2016, 117, 249–293. [Google Scholar] [CrossRef] [PubMed]
  4. Maróti, P.; Kovács, I.A.; Kis, M.; Smart, J.L.; Iglói, F. Correlated clusters of closed reaction centers during induction of intact cells of photosynthetic bacteria. Nature Sci Reports 2020, 10, 14012. [Google Scholar] [CrossRef] [PubMed]
  5. Li, Q.; Orcutt, K.; Cook, R.L.; Sabines-Chesterking, J.; Tong, A.L.; Schlau-Cohen, G.; Zhang, X.; Fleming, G.R.; Whaley, K.B. Single-photon absorption and emission from a natural photosynthetic complex. Nature 2023, 619, 300–304. [Google Scholar] [CrossRef] [PubMed]
  6. Pettersen, E.F.; Goddard, T.D.; Huang, C.C.; Meng, E.C.; Couch, G.S.; Croll, T.I.; Morris, J.H.; Ferrin, T.E. UCSF ChimeraX: Structure visualization for researchers, educators, and developers. Protein Sci. 2021, 30, 70–82. [Google Scholar] [CrossRef]
  7. Laible, P.D.; Hanson, D.K.; Buhrmaster, J.C.; Tira, G.A.; Faries, K.M.; Holten, D.; Kirmaier, C. Switching sides - Reengineered primary charge separation in the bacterial photosynthetic reaction center. Proc Natl Acad Sci U S A. 2020, 117, 865–871. [Google Scholar] [CrossRef] [PubMed] [PubMed Central]
  8. Lee, H.; Cheng, Y.C.; Fleming, G.R. Coherence dynamics in photosynthesis: Protein protection of excitonic coherence. Science 2007, 316, 1462–1465. [Google Scholar] [CrossRef]
  9. Strümofer, J.; Schulten, K. Excited state dynamics in photosynthetic reaction center and light harvesting complex 1. J. Chem. Phys. 2012, 137. [Google Scholar] [CrossRef]
  10. Zhu, J.; van Stokkum, I.H.; Paparelli, L.; Jones, M.R.; Groot, M.L. Early bacteriopheophytin reduction in charge separation in reaction centers of Rhodobacter sphaeroides. Biophys. J. 2013, 104, 2493–2502. [Google Scholar] [CrossRef]
  11. Dubas, K.; Szewczyk, S.; Białek, R.; Burdziński, G.; Jones, M.R.; Gibasiewicz, K. Antagonistic Effects of Point Mutations on Charge Recombination and a New View of Primary Charge Separation in Photosynthetic Proteins. J. Phys. Chem. B. 2021, 125, 8742–8756. [Google Scholar] [CrossRef] [PubMed] [PubMed Central]
  12. Parson, W.W.; Warshel, A. Mechanism of Charge Separation in Purple Bacterial Reaction Centers. In: The Purple Phototrophic Bacteria, Eds.: Hunter, C.N.; Daldal, F.; Thurnauer, M.C.; Beatty, J.T. Springer-Verlag, Dordrecht, 2009, pp 355–377.
  13. Woodbury, N.W.; Parson, W.W.; Gunner, M.R.; Prince, R.C.; Dutton, P.L. Radical-pair energetics and decay mechanisms in reaction centers containing anthraquinones, naphthoquinones or benzoquinones in place of ubiquinone. Biochim. Biophys. Acta 1986, 851, 6–22. [Google Scholar] [CrossRef]
  14. Marcus, R.A.; Sutin, N. Electron transfers in chemistry and biology. Biochim. Biophys. Acta 1985, 811, 265–322. [Google Scholar] [CrossRef]
  15. Nishikawa, G.; Sugo, Y.; Saito, K.; Ishikita, H. Absence of electron-transfer-associated changes in the time-dependent X-ray free-electron laser structures of the photosynthetic reaction center. eLife 2023, 12, RP88955. [Google Scholar] [CrossRef] [PubMed]
  16. Müh, F.; Williams, J.C.; Allen, J.P.; Lubitz, W. A conformational change of the photoactive bacteriopheophytin in reaction centers from Rhodobacter sphaeroides. Biochemistry 1998, 37, 13066–13074. [Google Scholar] [CrossRef] [PubMed]
  17. Dods, R.; Båth, P.; Morozov, D.; Gagnér, V.A.; Arnlund, D.; Luk, H.L.; Kübel, J.; Maj, M.; Vallejos, A.; Wickstrand, C.; Bosman, R.; Beyerlein, K.R.; Nelson, G.; Liang, M.; Milathianaki, D.; Robinson, J.; Harimoorthy, R.; Berntsen, P.; Malmerberg, E.; Johansso, L.; et al. Ultrafast structural changes within a photosynthetic reaction centre. Nature 2021, 589, 310–314. [Google Scholar] [CrossRef] [PubMed]
  18. Weaver, J.B.; Lin, C.-Y.; Faries, K.M.; Mathews, I.; Russi, S.; Holten, D.; Kirmaier, C.; Boxer, S. Photosynthetic Reaction Center Variants Made via Genetic Code Expansion Show Tyr at M210 Tunes the Initial Electron Transfer Mechanism. Proc. Nat. Acad. Sci. 2021, 118, e2116439118. [Google Scholar] [CrossRef]
  19. Saggu, M.; Fried, S.D.; Boxer, S.G. Local and Global Electric Field Asymmetry in Photosynthetic Reaction Centers. J. Phys. Chem. B 2019. [Google Scholar] [CrossRef]
  20. Williams, J.C.; Allen, J.P. Directed modification of reaction centers from purple bacteria. In: The Purple Phototrophic Bacteria, Eds.: Hunter, C.N.; Daldal, F.; Thurnauer, M.C.; Beatty, J.T., Springer-Verlag, Dordrecht, 2009, pp 337–353.
  21. Jones, M.R. Structural plasticity of reaction centers from purple bacteria. In: The Purple Phototrophic Bacteria, eds.: Hunter, C.N.; Daldal, F.; Thurnauer, M.C.; Beatty, J.T., Springer-Verlag, Dordrecht, The Netherlands, 2009, pp 295–321.
  22. Alden, R.; Parson, W.; Chu, Z.; Warshel, A. Orientation of the OH Dipole of Tyrosine (M)210 and its Effect on Electrostatic Energies in Photosynthetic Bacterial Reaction Centers. J. Phys. Chem. 1996, 100, 16761–16770. [Google Scholar] [CrossRef]
  23. Saggu, M.; Carter, B.; Zhou, X.; Faries, K.; Cegelski, L.; Holten, D.; Boxer, S.G.; Kirmaier, C. Putative hydrogen bond to tyrosine M208 in photosynthetic reaction centers from Rhodobacter capsulatus significantly slows primary charge separation. J. Phys. Chem. B 2014, 118, 6721–6732. [Google Scholar] [CrossRef]
  24. Pan, J.; Saer, R.G.; Lin, S.; Guo, Z.; Beatty, J.T.; Woodbury, N.W. The Protein Environment of the Bacteriopheophytin Anion Modulates Charge Separation and Charge Recombination in Bacterial Reaction Centers. J. Phys. Chem. B 2013, 117, 7179–7189. [Google Scholar] [CrossRef]
  25. Pan, J.; Saer, R.; Lin, S.; Beatty, J.T.; Woodbury, N.W. Electron Transfer in Bacterial Reaction Centers with the Photoactive Bacteriopheophytin Replaced by a Bacteriochlorophyll through Coordinating Ligand Substitution. Biochemistry 2016, 55, 4909–4918. [Google Scholar] [CrossRef]
  26. Sun, C.; Carey, A.M.; Gao, B.R.; Wraight, C.A.; Woodbury, N.W.; Lin, S. Ultrafast Electron Transfer Kinetics in the LM Dimer of Bacterial Photosynthetic Reaction Center from Rhodobacter sphaeroides. J. Phys. Chem. B 2016, 120, 5395–5404. [Google Scholar] [CrossRef] [PubMed]
  27. Maróti, P.; Wraight, C.A. Flash-induced H+ binding by bacterial photosynthetic reaction centers - comparison of spectrophotometric and conductimetric methods. Biochim. Biophys. Acta 1988, 934, 314–328. [Google Scholar] [CrossRef]
  28. Kálmán, L.; Maróti, P. Conformation-activated protonation in reaction centers of the photosynthetic bacterium Rhodobacter sphaeroides. Biochemistry 1997, 36, 15269–15276. [Google Scholar] [CrossRef] [PubMed]
  29. Deshmukh, S.S.; Williams, J.C.; Allen, J.P.; Kálmán, L. Light-induced conformational changes in photosynthetic reaction centers: Dielectric relaxation in the vicinity of the dimer. Biochemistry 2011, 50, 340–348. [Google Scholar] [CrossRef] [PubMed]
  30. Deshmukh, S.S.; Kálmán, L. Tuning the redox potential of the primary electron donor in bacterial reaction centers by manganese binding and light-induced structural changes. Biochim. Biophys. Acta - Bioenergetics 2020, 1861, 148285. [Google Scholar] [CrossRef]
  31. Maróti, P.; Wraight, C.A. Kinetics of H+ ion binding by the P+QA- state of bacterial photosynthetic centers: Rate limitation within the protein. Biophys. J. 1997, 73, 367–381. [Google Scholar] [CrossRef]
  32. Sebban, P. pH effect on the biphasicity of the P+QA charge recombination kinetics in the reaction centers from Rhodobacter sphaeroides, reconstituted with anthraquinones. Biochim. Biophys. Acta 1988, 936, 124–132. [Google Scholar] [CrossRef]
  33. Miksovska, J.; Schiffer, M.; Hanson, D.K.; Sebban, P. Proton uptake by bacterial reaction centers: The protein complex responds in a similar manner to the reduction of either quinone acceptor. P. Natl. Acad. Sci. USA 1999, 96, 14348–14353. [Google Scholar] [CrossRef]
  34. Wraight, C.A. Proton and electron transfer in the acceptor quinone complex of bacterial photosynthetic reaction centers. Frontiers Biosci. 2004, 9, 309–327. [Google Scholar] [CrossRef]
  35. Wraight, C.A.; Gunner, M.R. The Acceptor Quinones of Purple Photosynthetic Bacteria - Structure and Spectroscopy. In: The Purple Phototrophic Bacteria, Eds.: Hunter, C.N.; Daldal, F.; Thurnauer, M.C.; Beatty, J.T. Springer-Verlag, Dordrecht, 2009, pp 379-405.
  36. Okamura, M.Y.; Paddock, M.L.; Graige, M.S.; Feher, G. Proton and electron transfer in bacterial reaction centers, Biochim. Biophys. Acta 2000, 1458, 148–163. [Google Scholar] [CrossRef]
  37. Maróti, P. Chemical rescue of H+ delivery in proton transfer mutants of reaction center of photosynthetic bacteria. Biochim. Biophys. Acta 2019, 1860, 317–324. [Google Scholar] [CrossRef] [PubMed]
  38. Maróti, P. Thermodynamic view of proton activated electron transfer in the reaction center of photosynthetic bacteria. J. Phys. Chem. B 2019, 123, 5463–5473. [Google Scholar] [CrossRef] [PubMed]
  39. Maróti, P. Govindjee Energy conversion in photosynthetic bacteria. Photosynth. Res. 2016, 127, 257–271. [Google Scholar] [CrossRef] [PubMed]
  40. Nabedryk, E.; Breton, J. Coupling of electron transfer to proton uptake at the Q(B) site of the bacterial reaction center: A perspective from FTIR difference spectroscopy. Biochim. Biophys. Acta 2008, 1777, 1229–1248. [Google Scholar] [CrossRef]
  41. Sugo, Y.; Saito, K.K.; Ishikita, H.H. Mechanism of the formation of proton transfer pathways in photosynthetic reaction centers. Proc. Natl. Acad. Sci. USA 2021, 118, e2103203118. [Google Scholar] [CrossRef]
  42. Tiede, D.M.; Hanson, D.K. Protein Relaxation Following Quinone Reduction in Rhodobacter capsulatus - Detection of Likely Protonation-Linked Optical Absorbency Changes of the Chromophores. In: Photosynthetic Bacterial Reaction Center II, Eds.: Breton, J.; Verméglio, A., vol 237. NATO ASI Series (Series A: Life Sciences). Springer, Boston, MA, 1992, pp 341-350. [CrossRef]
  43. Sipka, G.; Maróti, P. Photoprotection in intact cells of photosynthetic bacteria: Quenching of bacteriochlorophyll fluorescence by carotenoid triplets. Photosynth. Res. 2018, 136, 17–30. [Google Scholar] [CrossRef]
  44. Okamura, M.Y.; Isaacson, R.A.; Feher, G. Primary acceptor in bacterial photosynthesis: Obligatory role of ubiquinone in photoactive reaction centers of Rhodopseudomonas spheroides. P. Natl. Acad. Sci. USA 1975, 72, 3491–3495. [Google Scholar] [CrossRef]
  45. Liu, B.L.; Yang, L.H.; Hoff, A.J. On the depletion and reconstitution of both QA and metal in reaction centers of the photosynthetic bacterium Rb. sphaeroides R-26. Photosynth. Res. 1991, 28, 51–58. [Google Scholar] [CrossRef]
  46. Kálmán, L.; Maróti, P. Stabilization of reduced primary quinone by proton uptake in reaction centers of Rhodobacter sphaeroides. Biochemistry 1994, 33, 9237–9244. [Google Scholar] [CrossRef]
  47. Xu, Q.; Gunner, M.R. Temperature dependence of the free energy, enthalpy, and entropy of P+QA charge recombination in Rhodobacter sphaeroides R-26 reaction centers. J. Phys. Chem. B, 2000, 104, 8035–8043. [Google Scholar] [CrossRef]
  48. Turzó, K.; Laczkó, G.; Filus, Z.; Maróti, P. Quinone-dependent delayed fluorescence from the reaction center of photosynthetic bacteria. Biophys. J. 2000, 79, 14–25. [Google Scholar] [CrossRef] [PubMed]
  49. Rinyu, L.; Martin, E.W.; Takahashi, E.; Maróti, P.; Wraight, C.A. Modulation of the free energy of the primary quinone acceptor (QA) in reaction centers from Rhodobacter sphaeroides: Contributions from the protein and protein-lipid(cardiolipin) interactions. Biochim. Biophys. Acta-Bioenergetics 2004, 1655, 93–101. [Google Scholar] [CrossRef] [PubMed]
  50. Onidas, D.; Sipka, G.; Asztalos, E.; Maróti, P. Mutational control of bioenergetics of bacterial reaction center probed by delayed fluorescence. Biochim. Biophys. Acta 2013, 1827, 1191–1199. [Google Scholar] [CrossRef] [PubMed]
  51. Trotta, M.; Maróti, P. Delayed fluorescence in anoxygenic photosynthesis. Photochemistry, 2024, 52, 329–343. [Google Scholar]
  52. Maróti, P. Bacteriochlorophyll Fluorescence as a Monitor of Electronic States and Processes in Photosynthetic Bacteria, In: Handbook of Photosynthesis, ed. Pessarakli, M., CRC Press, Boca Raton, 2025, pp. 359–387.
  53. Filus, Z.; Laczkó, G.; Wraight, C.A.; Maróti, P. Delayed fluorescence from the photosynthetic reaction center measured by electronic gating of the photomultiplier. Biopolymers 2004, 74, 92–95. [Google Scholar] [CrossRef]
  54. Arata, H.; Parson, W.W. Delayed fluorescence from Rhodopseudomonas sphaeroides reaction centers: Enthalpy and free energy changes accompanying electron transfer from P870 to quinones. Biochim. Biophys. Acta 1981, 638, 201–209. [Google Scholar] [CrossRef]
  55. Maróti, Á.; Wraight, C.A.; Maróti, P. The rate of second electron transfer to QB in bacterial reaction center of impaired proton delivery shows hydrogen-isotope effect. Biochim. Biophys. Acta 2015, 1847, 223–230. [Google Scholar] [CrossRef]
  56. Kaur, D.; Khaniya, U.; Zhang, Y.; Gunner, M.R. Protein Motifs for Proton Transfers That Build the Transmembrane Proton Gradient. Front. Chem. 2021, 9, 660954. [Google Scholar] [CrossRef]
  57. Khaniya, U.; Mao, J.; Wie, R.; Gunner, M.R. Characterizing protein protonation microstates using Monte Carlo sampling, Biorxiv. org 2022. [Google Scholar] [CrossRef]
  58. Maróti, Á.; Wraight, C.A.; Maróti, P. Protonated rhodosemiquinone at the QB binding site of the M265IT mutant reaction center of photosynthetic bacterium Rhodobacter sphaeroides. Biochemistry 2015, 54, 2095–2103. [Google Scholar] [CrossRef]
  59. Cheap, H.; Tandori, J.; Derrien, V.; Benoit, M.; de Oliveira, P.; Köpke, J.; Lavergne, J.; Maróti, P.; Sebban, P. Evidence for delocalized anticooperative flash induced proton binding as revealed by mutants at the M266His iron ligand in bacterial reaction centers. Biochemistry 2007, 46, 4510–4521. [Google Scholar] [CrossRef] [PubMed]
  60. Gilson, M.K.; Rashin, A.; Fine, R.; Honig, B. On the Calculation of Electrostatic Interactions in Proteins. J. Mol. Biol. 1985, 183, 503–516. [Google Scholar] [CrossRef] [PubMed]
  61. Bossa, G.V.; May, S.S. Integral Representation of Electrostatic Interactions inside a Lipid Membrane. Molecules 2020, 25, 3824. [Google Scholar] [CrossRef] [PubMed]
  62. Feher, G.; Arno, T.R.; Okamura, M.Y. The Effect of an Electric Field on the Charge Recombination Rate of D+QA → DQA in Reaction Centers from Rhodobacter sphaeroides R-26. In: The Photosynthetic Bacterial Reaction Center (Eds.: Breton, J. et al.) 1988, pp 271-287. [CrossRef]
  63. Gunner, M.R.; Dutton, P.L. Temperature and ‒ΔGo dependence of the electron transfer from BPh to QA in reaction center protein from Rhodobacter sphaeroides with different quinones as QA. J. Am. Chem. Soc. 1989, 11, 3400–3412. [Google Scholar] [CrossRef]
  64. Mccomb, J.C.; Stein, R.R.; Wraight, C.A. Investigations on the Influence of Headgroup Substitution and Isoprene Side-Chain Length in the Function of Primary and Secondary Quinones of Bacterial Reaction Centers. Biochim. Biophys. Acta 1990, 1015, 156–171. [Google Scholar] [CrossRef]
  65. Schelvis, J.P.M.; Liu, B.L.; Aartsma, T.J.; Hoff, A.J. The Electron-Transfer Rate from Bpha to Qa in Reaction Centers of Rhodobacter-Sphaeroides R-26 - Influence of the H-Subunit, the Qa and Fe2+ Cofactors, and the Isoprene Tail of Qa. Biochim. Biophys. Acta 1992, 1102, 229–236. [Google Scholar] [CrossRef]
  66. Kleinfeld, D.; Okamura, M.Y.; Feher, G. Charge recombination kinetics as a probe of protonation of the primary acceptor in photosynthetic reaction centers. Biophys. J. 1985, 48, 849–852. [Google Scholar] [CrossRef]
  67. Maróti, P.; Wraight, C.A. The redox midpoint potential of the primary quinone of reaction centers in chromatophores of Rhodobacter sphaeroides is pH independent. Eur. Biophys. J. 2008, 37, 1207–1217. [Google Scholar] [CrossRef]
  68. Woodbury, N.W.; Parson, W.W. Nanosecond fluorescence from isolated photosynthetic reaction centers of Rhodopseudomonas sphaeroides. Biochim. Biophys. Acta 1984, 767, 345–361. [Google Scholar] [CrossRef]
  69. Peloquin, J.M.; Williams, J.C.; Lin, X.; Alden, R.G.; Taguchi, A.K.W.; Allen, J.P.; Woodbury, N.W. Time-Dependent Thermodynamics During Early Electron-Transfer in Reaction Centers from Rhodobacter Sphaeroides. Biochemistry 1994, 33, 8089–8100. [Google Scholar] [CrossRef]
  70. Woodbury, N.; Peloquin, J.M.; Alden, R.G.; Lin, X.; Lin, S.; Taguchi, A.K.W.; Williams, J.; Allen, J. Relationship between Thermodynamics and Mechanism during Photoinduced Charge Separation in Reaction Centers from Rhodobacter sphaeroides. Biochemistry, 1994, 33, 8101–8112. [Google Scholar] [CrossRef] [PubMed]
  71. Chamorovsky, C.S.; Chamorovsky, S.K.; Semenov, A.Y. Dielectric and photoelectric properties of photosynthetic reaction centers. Biochemistry (Moscow) 2005, 70, 257–263. [Google Scholar] [CrossRef] [PubMed]
  72. Lancaster, C.R.D.; Michel, H. The coupling of light-induced electron transfer and proton uptake as derived from crystal structures of reaction centres from Rhodopseudomonas viridis modified at the binding site of the secondary quinone, QB. Structure 1997, 5, 1339–1359. [Google Scholar] [CrossRef] [PubMed]
  73. Wei, R.J.; Zhang, Y.; Mao, J.; Kaur, D.; Khaniya, U.; Gunner, M.R. Comparison of Proton Transfer Paths to the QA and QB Sites of the Rb. sphaeroides Photosynthetic Reaction Centers. Photosynth. Res. 2022. [Google Scholar] [CrossRef]
  74. Fritzsch, G.; Ermler, U.; Michel, H. The water chains around QA and QB and other structural aspects of the reaction center from Rb. sphaeroides. In: Photosynthesis: From Light to Biosphere. Ed., Mathis, P., Kluwer Academic Publishers, Dordrecht, 1995, pp 599-602.
  75. Tandori, J.; Maróti, P.; Alexov, E.; Sebban, P.; Baciou, L. Key role of proline L209 in connecting the distant quinone pockets in the reaction center of Rhodobacter sphaeroides. Proc. Natl. Acad. Sci. USA 2002, 99, 6702–6706. [Google Scholar] [CrossRef]
  76. Johnson, E.T.; Parson, W.W. Electrostatic interactions in an integral membrane protein. Biochemistry 2002, 41, 6483–6494. [Google Scholar] [CrossRef]
  77. Maróti, P.; Hanson, D.K.; Baciou, L.; Schiffer, M. ; Sebban, Proton conduction within the reaction centers of Rhodobacter capsulatus: The electrostatic role of the protein. P. Proc. Natl. Acad. Sci. USA 1994, 91, 5617–5621. [Google Scholar] [CrossRef]
  78. Hienerwadel, R.; Grzybek, S.; Fogel, C.; Kreutz, W.; Okamura, M.Y.; Paddock, M.L.; Breton, J.; Nabedryk, E.; Mantele, W. Protonation of Glu L212 following QB formation in the photosynthetic reaction center of Rhodobacter sphaeroides: Evidence from time-resolved infrared spectroscopy. Biochemistry 1995, 34, 2832–2843. [Google Scholar] [CrossRef]
  79. Zhu, Z.; Gunner, M.R. Energetics of quinone-dependent electron and proton transfers in Rhodobacter sphaeroides photosynthetic reaction centers. Biochemistry 2005, 44, 82–96. [Google Scholar] [CrossRef]
  80. Tian, W.; Chen, C.; Lei, X.; Zhao, J.; Liang, J. CASTp 3.0: Computed atlas of surface topography of proteins. Nucleic Acids Research, 2018, 46, (W1), pp W363–W367. [CrossRef]
  81. Parson, W.W.; Chu, Z.T.; Warshel, A. Electrostatic Control of Charge Separation in Bacterial Photosynthesis. Biochim Biophys Acta 1990, 1017, 251–272. [Google Scholar] [CrossRef]
  82. Hou, H.J.M. Enthalpy, Entropy, and Volume Changes of Electron Transfer Reactions in Photosynthetic Proteins. In: Application of Thermodynamics to Biological and Materials Science, Ed.: Tadashi, M. 2011, InechOpen, pp.93-110.
  83. Flores, M.; Savitsky, A.; Paddock, M.L.; Abresch, E.C.; Dubinskii, A.A.; Okamura, M.Y.; Lubitz, W.; Mobius, K. Electron-nuclear and electron-electron double resonance spectroscopies show that the primary quinone acceptor Q(A) in reaction centers from photosynthetic bacteria Rhodobacter sphaeroides remains in the same orientation upon light induced reduction. J. Phys. Chem. B 2010, 114, 16894–16901. [Google Scholar] [CrossRef] [PubMed]
  84. Sankar, S.; Gupta, K.B.; Alia, A.; Buda, F.; de Groot, H.J.M.; Matysik, J. Bacteriopheophytin a in the Active Branch of the Reaction Center of Rhodobacter sphaeroides Is Not Disturbed by the Protein Matrix as Shown by 13C Photo-CIDNP MAS NMR. J. Phys. Chem. B 2013, 117, 3287–3297. [Google Scholar] [CrossRef] [PubMed]
  85. Flores, M.; Isaacson, R.; Abresch, E.; Calvo, R.; Lubitz, W.; Feher, G. Protein-cofactor interactions in bacterial reaction centers from Rhodobacter sphaeroides R-26: II. Geometry of the hydrogen bonds to the primary quinone QA.− by 1H and 2H ENDOR spectroscopy. Biophys. J. 2006, 90, 3356–3362. [Google Scholar] [CrossRef] [PubMed]
  86. Kuglstatter, A.; Ermler, U.; Michel, H.; Baciou, L.; Fritzsch, G. Structure of the photosynthetic reaction center from Rhodobacter sphaeroides reconstituted with anthraquinone as primary quinone QA. FEBS Letter 2000, 472, 114–116. [Google Scholar] [CrossRef]
  87. Krishtalik, L.I. Role of the protein's low dielectric constant in the functioning of the photosynthetic reaction center. Photosynth. Res. 1999, 60, 241–246. [Google Scholar] [CrossRef]
  88. Gibasiewicz, K.; Pajzderska, M.; Białek, R.; Jones, M.R. Temperature dependence of nanosecond charge recombination in mutant Rhodobacter sphaeroides reaction centers: Modelling of the protein dynamics. Photochemical & Photobiological Sciences 2021, 20, 913–922. [Google Scholar] [CrossRef]
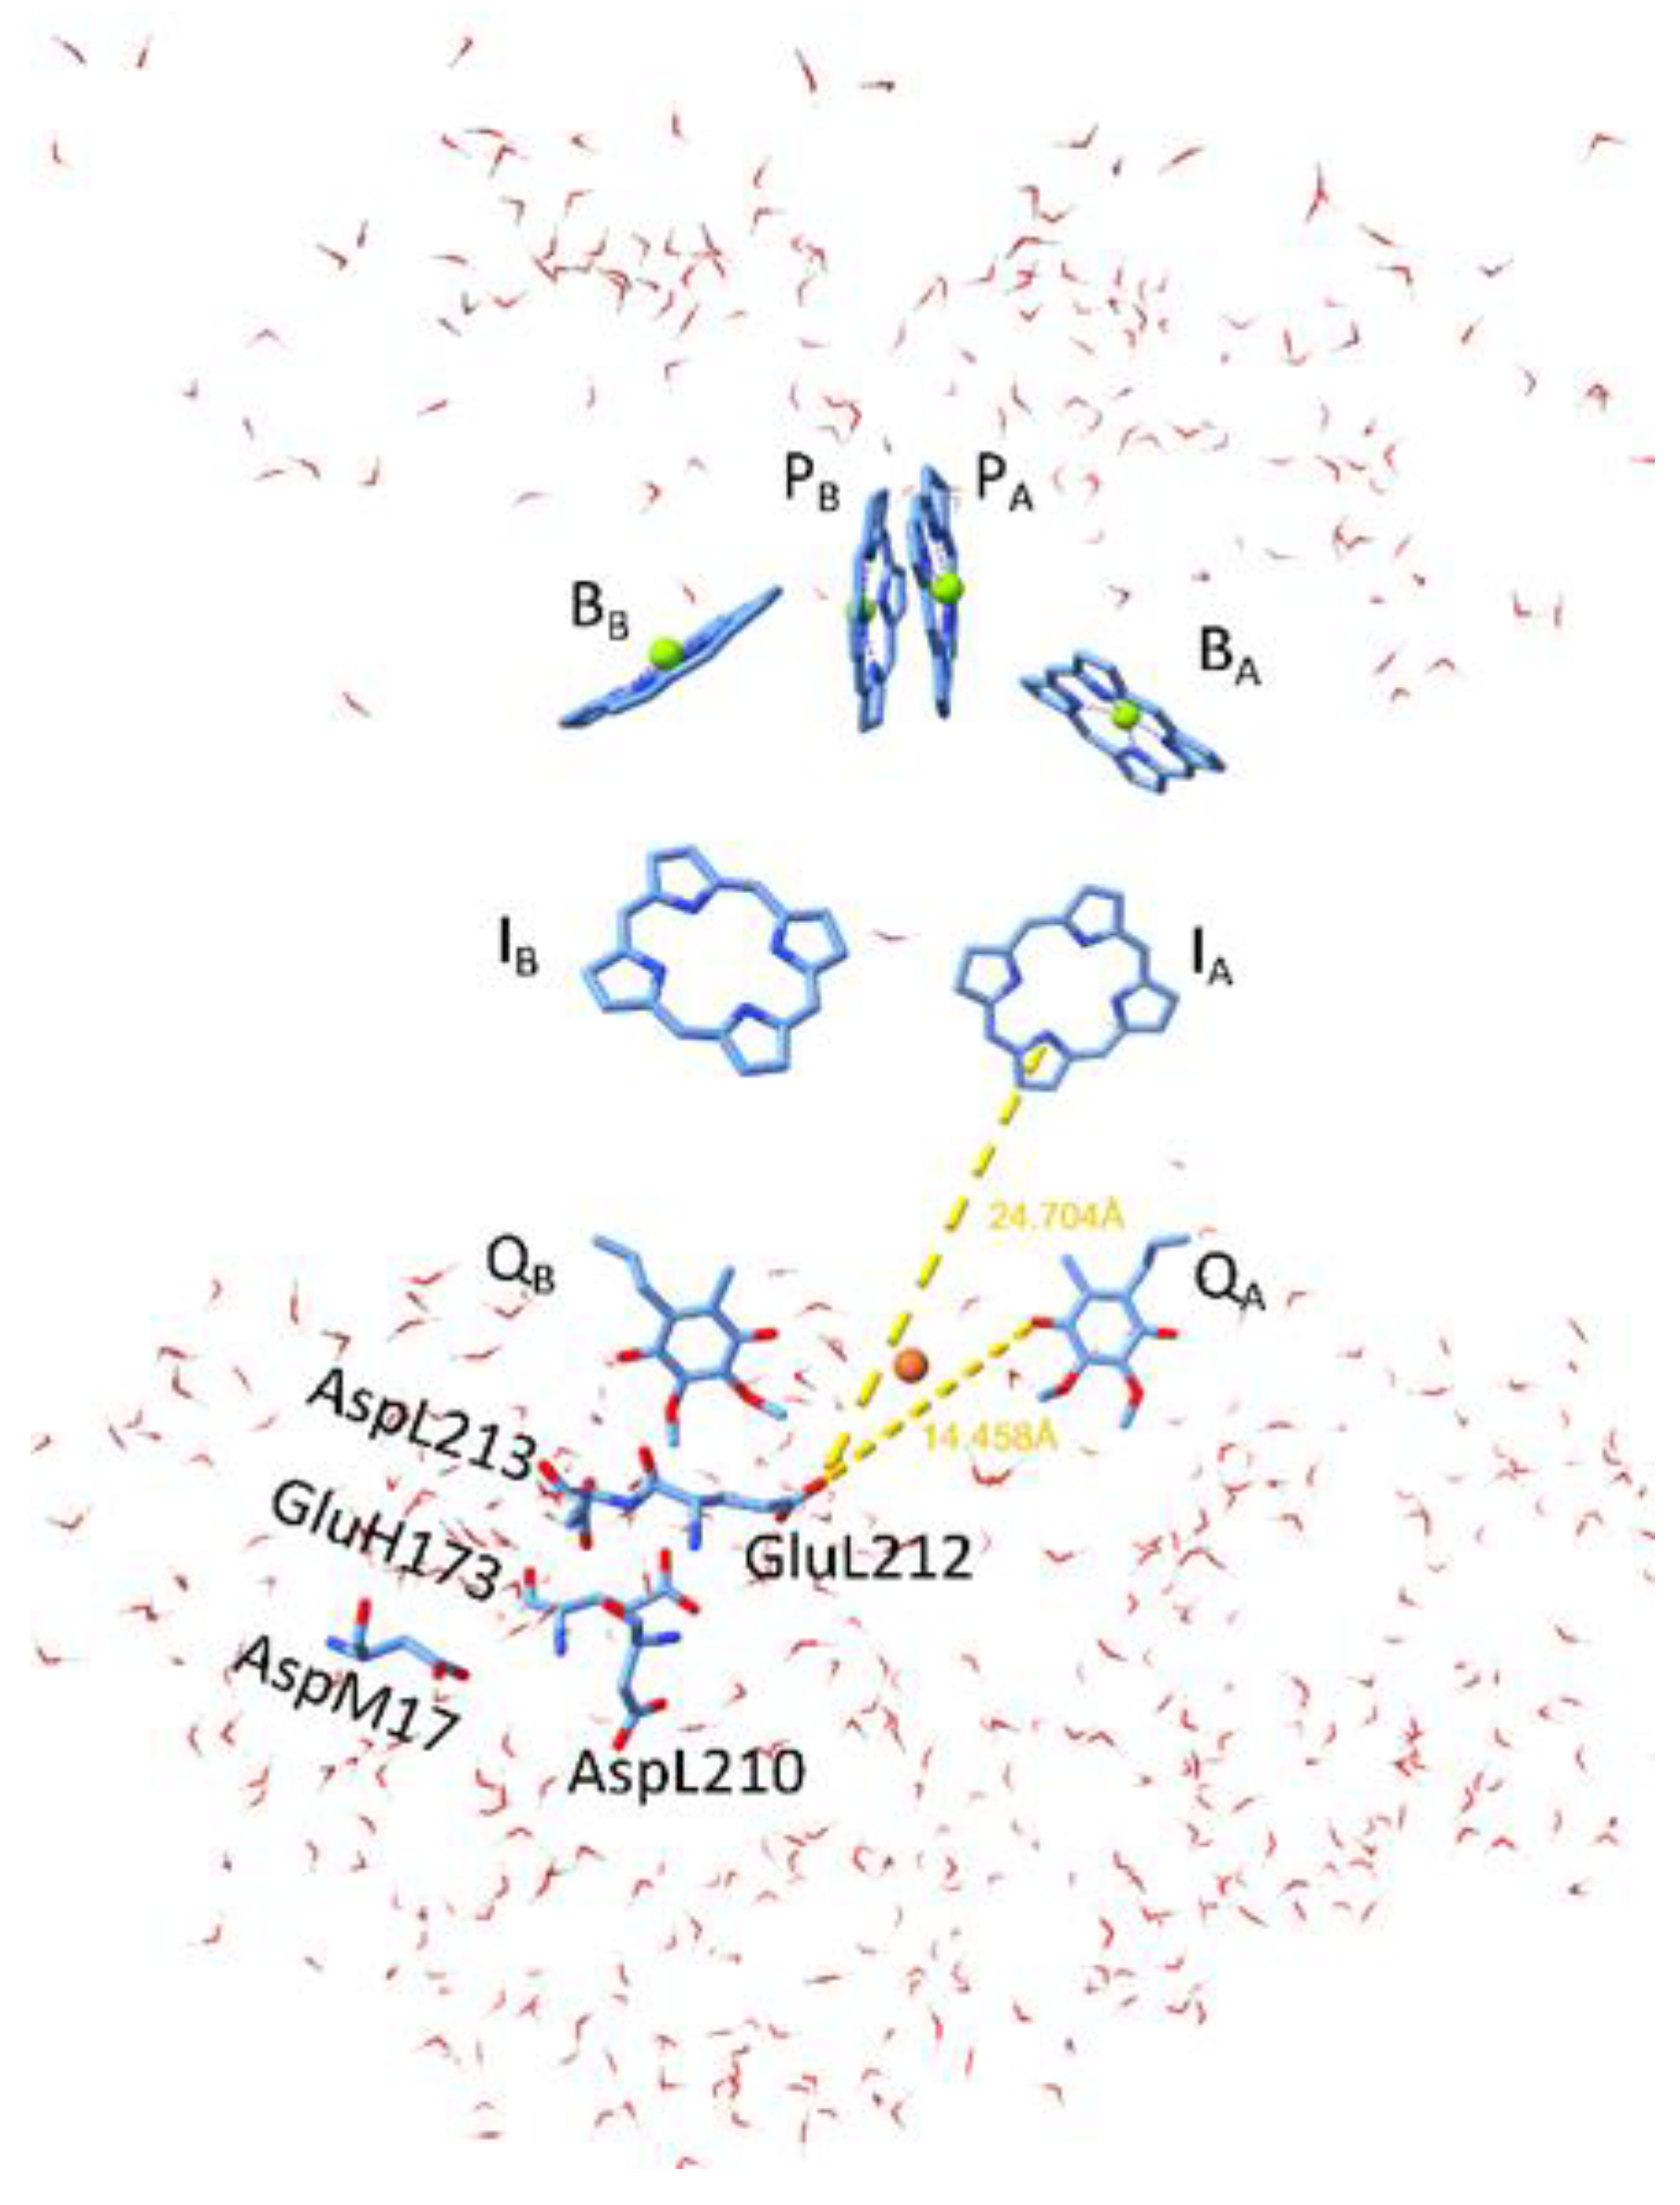
Figure 1. Structural view of the hydrophobic belt of the isolated RC from anoxygenic photosynthetic bacterium Rhodobacter sphaeroides sandwiched by aqueous phases (water molecules) at the cytoplasmic and periplasmic sides. The pairs of cofactors BChl dimer (P), monomeric BChls (B), bacteriopheophytins (I) and quinones (Q)) are arranged in active (A) and passive (B) branches. The protonation of the acidic cluster around QB plays crucial role in stabilization of light-induced anions in the RC. The distances of IA and QA from the key residue in the cluster GluL212 are indicated. ChimeraX was used to visualize the RC of the model organism Rb. sphaeroides (PDB ID: 3I4D) [6].
Preprints 119225 g001
Figure 2. The standard free energy levels of ground (PIQA) and charge separated (P+I and P+QA) states referred to that of the photoexcited singlet BChl dimer (P*) and the possible transitions between different states in the RC from purple photosynthetic bacterium Rba. sphaeroides. The native ubiquinone (UQ10) at the primary quinone binding site is substituted by a series of low potential quinones whose chemical structures and in situ midpoint electrochemical potentials (Em) at pH 8.0 are demonstrated. The dimer P is photoexcited (wavy arrow) and the main path of P* decay is electron transfer (ket) to QA via transient reduction of IA. The charge pair can be stabilized by conformational heterogeneity (closely spaced thick lines), protein relaxation (shaded area) and proton uptake. The separated charges of the P+IAQA state can be either recombined through direct or indirect pathways or repopulate P* that can decay by fluorescence emission with intrinsic rate constant kf (delayed fluorescence).
Preprints 119225 g002
Figure 3. Models and demonstration of the drop of the effective dielectric constant between interactive groups (QA (1), IA (2) and the acidic cluster (3)) in the RC upon increase of the characteristic distance (x) from the aqueous phase. The dielectric (water) interface is represented either by a single planar boundary (panel A) or by a sandwich-type double parallel sheet (panel C). Panels B and D show the calculated results of models A and C, respectively. The variable x denotes either the distance of QA and the cluster from the dielectric (water) interface (model A) or the width of the RC between the parallel boundaries (model C). Numerical values: R13 = 14.5 Å (distance between QA and GluL212), R23 = 25.2 Å (distance between IA and GluL212) and the dielectric constants of water (Dw) and RC (DRC) are 80 and 2, respectively.
Preprints 119225 g003
Figure 4. Kinetics of flash-induced absorption change (at 430 nm, top) and delayed fluorescence (at 910 nm, bottom) of RC (concentration 1.5 μM) where the native ubiquinone at QA was replaced by 1-chloro-AQ.
Preprints 119225 g004
Figure 5. The pH dependence of the rate constant of the P+QA → PQA charge recombination of RCs with native quinone (ubiquinone) (bottom) and anthraquinone (top) at the QA binding site. Conditions as in Figure 4, except for varying pH and buffers given in M&M.
Preprints 119225 g005
Figure 6. pH-dependence of the free energy states of P+IQA relative to that of P+IAQA determined from rate constants of the temperature-dependent P+IAQA → PQA indirect charge recombination kinetics via P+IAQA. The native UQ10 at QA was replaced by derivatives of the low potential AQ: 2,3-dimethyl-AQ; 1-amino-AQ; 2-methyl-AQ; 2-ethyl-AQ; AQ; ■1-chloro-AQ;.Conditions: 1 μM RC, 0,4 mM puffer (Mes, Tris, Caps, Ches, Mops), 0,03 % LDAO and 100 mM NaCl.
Preprints 119225 g006
Figure 7. pH-dependence of the free energy states of P+QA relative to that of P*QA determined from measurement of the delayed fluorescence of the BChl dimer (set of lower traces) and pH-dependence of the free energy states of P+IA relative to that of P*IA determined from difference of the lower traces and data in Figure 3: ΔGo(P*IA → P+IA) = ΔGo(P*QA → P+QA) – ΔGo(P+IAQA → P+IAQA) (set of upper traces) in RCs of substituted different AQ derivatives at the QA binding site. 2,3-dimethyl-AQ; 1-amino-AQ; 2-methyl-AQ; 2-ethyl-AQ; AQ; ■1-chloro-AQ; Conditions as in Figure 3.
Preprints 119225 g007
Figure 8. Temperature-dependence of the delayed fluorescence of the BChl dimer (van’t Hoff plot) in RCs where the native UQ10 at the QA binding site is replaced by different low potential forms of AQ: 2-methyl-AQ; ■1-chloro-AQ; 1-amino-AQ; AQ; 2-ethyl-AQ; 2,3-dimethyl-AQ.
Preprints 119225 g008
Figure 9. High pH-dependence of the measured (data points from Figure 7) and calculated (solid lines, M&M) free energies of QA/QA and IA/IA referred to those at pH 8 when QA is the native UQ (black) or substituted by 1-amino-AQ (blue for QA/QA and green for IA/IA). The parameters of the calculated curves are given in Table 2.
Preprints 119225 g009
Figure 10. Surface exposure of IA and its connection to the QA pocket. The solvent-accessible cavities of the RC of Rhodobacter sphaeroides (PDB ID: 3I4D) were visualized with ChimeraX [6]. For clarity, the pythol tail of the IA and the isoprenyl subunits of the QA are not shown.
Preprints 119225 g010
Table 1. Thermodynamic (enthalpy, ∆Ho and entropy, T∙∆So) costs of P* → P+QA and IAQA → IAQA transitions in RCs substituted by different low potential AQs at the primary quinone binding site QA. The thermodynamic parameters of the P* → P+QA transition were determined from the temperature-dependence of the free energy difference of the states (see Figure 7) and of the van’t Hoff plots of the delayed fluorescence (Figure 8). The thermodynamic characteristics of the IAQA → IAQA reaction were derived from the temperature-dependence of the rate constants of the charge recombination (Figure 6). The relative standard deviations of the mean values are typically 10-15%. The temperature was changed in the physiological range between 2 oC and 40 oC. The data for native ubiquinone10 were taken from [48].
P* → P+QA IAQA → IAQA
QA Go (meV) Ho (meV) T∙∆So (meV) Go (meV) Ho (meV) T∙∆So (meV)
Ubiquinone10 -910 -830 +80
2-Methyl-AQ -625 -605 +20 -357 -330 +27
1-Amino-AQ -625 -535 +90 -390 -273 +17
AQ -700 -585 +115 -360 -267 +93
1-Chloro-AQ -750 -600 +150 -363 -410 ‒55
2-Ethyl-AQ -635 -485 +150 -368 -188 +180
2,3-Dimethyl-AQ -585 -205 +380 -365 -72 +293
Table 2. Distances (in brackets, measured in Å) and interaction energy (in meV) within the amino acids of the cluster and between the cluster and the negative charges on QA and IA calculated from the fit of the model in M&M to the measured high pH-dependence of the free energy change.
GluL212 AspL213 AspM17 GluH173
GluL212 (9.65) (13.81) (8.56)
AspL213 ‒168 (8.46) (10.0)
AspM17 ‒118 ‒192 (9.28)
GluH173 ‒190 ‒162 ‒174
UQ QA (14.46) (22.42) (25.69) (16.74)
‒96 ‒61 ‒54 ‒83
BPheoA (25.20) (30.91) (35.63) (27.11)
1-amino-AQ QA ‒75 ‒48 ‒42 ‒65
BPheoA ‒41 ‒34 ‒30 ‒38
2-3 dimethyl-AQ QA ‒84 ‒54 ‒47 ‒72
BPheoA ‒14 ‒11 ‒10 ‒13
AQ QA ‒48 ‒31 ‒27 ‒41
BPheoA ‒45 ‒37 ‒32 ‒41
2-methyl-AQ QA ‒84 ‒54 ‒47 ‒72
BPheoA ‒55 ‒45 ‒39 ‒51
2-ethyl-AQ QA ‒87 ‒56 ‒49 ‒75
BPheoA ‒53 ‒44 ‒38 ‒49
Disclaimer/Publisher’s Note: The statements, opinions and data contained in all publications are solely those of the individual author(s) and contributor(s) and not of MDPI and/or the editor(s). MDPI and/or the editor(s) disclaim responsibility for any injury to people or property resulting from any ideas, methods, instructions or products referred to in the content.
Copyright: This open access article is published under a Creative Commons CC BY 4.0 license, which permit the free download, distribution, and reuse, provided that the author and preprint are cited in any reuse.
Prerpints.org logo

Preprints.org is a free preprint server supported by MDPI in Basel, Switzerland.

Subscribe

© 2024 MDPI (Basel, Switzerland) unless otherwise stated