Preprint
Article

Effects of Hydrogen Dissociation during Gas Flooding on Formation of Metal Hydride Cluster Secondary Ions in SIMS

Altmetrics

Downloads

44

Views

32

Comments

0

A peer-reviewed article of this preprint also exists.

Submitted:

25 September 2024

Posted:

27 September 2024

You are already at the latest version

Alerts
Abstract
The application of hydrogen flooding was recently shown to be a simple and effective approach towards improved layer differentiation and interface determination during SIMS depth profiling of thin films as well as an approach with a potential in the field of quantitative SIMS analyses. To further study the effects of hydrogen, the flooding of H2 molecules was compared to the reactions of the atomic H on the samples of pure metals and their alloys. H2 was introduced into the analytical chamber via a capillary which was, to achieve the dissociation, heated to approximately 2200 K. Dissociation of H2 up to 30% resulted in a significant increase in the intensity of the metal hydride cluster secondary ions originating from the metallic samples. Comparison of time scales of possible processes provided an insight into the mechanism of the hydride cluster secondary ion formation. Cluster ions presumably form during the recombination of the atoms and molecules from the sample and adsorbed atoms and molecules from the gas. This process occurs on the surface or just above it during the sputtering process. These findings coincide with the previous mechanistic and computational studies.
Keywords: 
Subject: Chemistry and Materials Science  -   Surfaces, Coatings and Films

1. Introduction

Secondary ion mass spectrometry (SIMS) is a widely used analytical method that provides the user with information about the elemental, molecular, and isotopic composition of the sample [1]. Analytes are detected as secondary ions formed as a consequence of the surface bombardment with the primary ions [2]. The method is primarily surface sensitive (topmost few nm) and offers measurements of mass spectra, and mapping of the chemical composition of the analyte on the surface (imaging) [1,3]. If the ion current density of the primary ions is high enough, depth profiling via the application of one or two ion beams (dual-beam depth profiling) can be performed [4]. By combining 2D imaging and depth profiling, the generation of 3D representations becomes possible [3].
SIMS also has its limitations with one of the more complex ones being the matrix effect that can be described as a dependence of the ionization yield of sputtered material on the substrate composition [5,6,7]. The intensity of the secondary ion current (Im) is a function of the current of the primary ions (Ip), the sputter yield (Ym), the ionization probability (α+/–), the concentration of an analyzed compound (θm), and the transmission of the analytical system (η). Their relation is described by Equation (1) [1].
Im = IpYmα+/–θmη
The ionization probability is significantly influenced by the effect of the electronic properties of the substrate and changes, as a consequence of the matrix effect, for even a few orders of magnitude [5]. The matrix effect notably affects the detection limits and almost entirely prevents quantification of the measured spectra [6]. Different approaches, such as the relative sensitivity factor (RSF) method incorporating internal standards [8,9], and MCs+ and MCs2+ analysis (M being a metal of interest) combined with the reactive Cs+ sputtering [10,11], were developed for at least semi-quantitative analysis. Other SIMS variations target the improvement of the ionization yield and reduction of the matrix effect. These are laser [12,13,14] and electron beam [15,16,17] postionization of sputtered neutrals (secondary neutral mass spectrometry, SNMS), metal-assisted SIMS utilizing deposition of very thin metallic layers on the surface of the sample [18,19,20], matrix-enhanced SIMS improving ionization with an overlayer of MALDI (matrix-assisted laser desorption/ionization) matrices or ionic liquids [21,22,23], dynamic reactive ionization (DRI) combining Ar clusters, HCl and H2O molecules [24,25], and reactive gas flooding with gases such as O2 and XeF2 [26,27,28].
H2 and O2 atmospheres were recently proven by our group to improve SIMS quantification capabilities significantly by reducing the matrix effect [29]. The novel H2 flooding approach substantially improves SIMS capabilities concerning depth profiling of metals, metal oxides, and alloys by providing an unambiguous identification of different layers which is otherwise impossible as a consequence of the matrix effect [30]. The presence of H2 during depth profiling also reduced ion-sputtering-induced surface roughening [31]. The differentiation between layers of metals and their oxides, interface clarity, and depth resolution is of high importance during research of corrosion processes [32,33], analysis of thin films and multilayered samples [34,35,36], characterization of nanomaterials and nanoparticles [37,38], evaluation of protective surface (oxide) layers formed during metal and alloy treatments [39,40], and study of catalytic processes [41].
To further improve the positive effects of the hydrogen presence during SIMS analyses and to gain insight into the mechanism of the cluster secondary ion formation, we studied the influence of atomic hydrogen on metals, metal oxides, and alloys. H radicals (neutral hydrogen atoms in the ground electronic state) are more reactive than H2 molecules, so they are often used for enhancing the intensity of surface reactions [42,43,44,45]. Higher intensities of the metal hydride cluster secondary ions at the same pressure of the gas were expected due to the enhanced adsorption of H atoms as compared to H2 molecules. The results confirmed our hypothesis of increased intensity of the hydride secondary ions. The mechanism of the cluster secondary ion formation upon treatment with a mixture of atomic and molecular hydrogen is discussed and evaluated in this article.

2. Materials and Methods

2.1. Preparation of the Samples

We used two different alloys with a homogenous distribution of elements. The composition in atomic percentages was 50% Ni and 50% Ti for the NiTi alloy, and 65% Fe, 19% Cr, 12% Ni, 1.5% Mn, 1.5% Mo, and 1% Si for the stainless steel sample. The NiTi sample was characterized by the producer Alfa Aesar (Thermo Fisher) while the composition of the stainless steel sample was determined with the EDXS method [29]. Both samples had their surfaces sufficiently polished during the process of their formation (NiTi sheet and stainless steel cube) to enable a successful SIMS analysis. Alloys were also covered with a thin layer of native oxide, which was removed by the 1 keV Cs+ ion sputtering prior to the study of the effects of hydrogen dissociation.

2.2. Secondary Ion Mass Spectrometry Measurements

The ToF-SIMS analyses were performed using the TOF.SIMS 5 instrument produced by the IONTOF. Bi+ primary ion beam with a lateral resolution of approximately 5 µm was used for the analysis. The energy of the Bi+ ions was 30 keV, and the current was between 1.1 and 1.5 pA. The ion beam was pulsed with a pulse length of 7 ns, providing the mass resolution m/Δm between 4000 and 15000, depending on the type of the secondary ion detected.
All the analyses were performed during dual-beam depth profiling with the Cs+ ions used as a sputtering ion beam. Their energy was 1 keV, and their current was between 60 and 69 nA. Sputtering with the Cs+ ions was performed over the 400 µm × 400 µm area, while the analysis with the Bi+ ions was performed over the 50 µm × 50 µm area located in the center of the depth profiling crater.
H2 used for the gas flooding had a purity of 99.9999%. It was introduced into the analysis chamber via the hydrogen atom beam source. The pressure of the hydrogen in the analytical chamber during the measurements was 7 × 10⁻⁷ mbar and the pressure before the capillary of the atom beam source (driving pressure) was approximately 0.1 mbar. The pressure, before the hydrogen flooding, was always approximately 1 × 10⁻⁸ mbar. Pressures were determined with the cold cathode gauges.

2.3. Principles of the Hydrogen Atom Beam Source Operation

In these experiments, we used a commercial Hydrogen Atom Beam Source (HABS) from MBE Komponenten GmbH (http://www.mbe-components.com/products/gas/habs.html) [46]. The HABS is a thermal gas cracker that produces an ion-free hydrogen gas beam. The atomic hydrogen is generated in a hot tungsten capillary, heated by the thermal radiation from a surrounding tungsten filament up to 2200 K. The tungsten filament around the tungsten tube is resistively heated to heat the tube by thermal radiation. The heat loss is minimized by the thermal shield made of Ta. The shield is then surrounded by a water-cooled copper housing. The temperature of the source is measured by a free-standing thermocouple (TC) mounted inside the thermal shield. The capillary has an approximately 100–200 higher temperature than measured by the TC. The W capillary of 1 mm inner diameter and 10 mm length is the only hot part of the HABS with direct contact to the hydrogen gas. The forming of a narrow-shaped atomic hydrogen beam results from the long heated area of the W tube. The tube's inner diameter allows a gas flux of up to 0.5-1.0 standard cubic centimeters per minute (sccm). The gas flow within the W tube forms a narrow angled gas jet with a FWHM of about 15-30o, dependent on the flow rate. At low rates, the gas beam is more focused. The basic description of the source with some results of its characterization is published in other literature [46,47,48].
The hydrogen atom beam source is equipped with a tantalum recombinator that can be placed in front of the atom beam orifice, 15 mm away, without disturbing the flow. If the recombinator is opened, H atoms are directed to the sample. If the recombinator is closed, the H atoms cannot hit a sample directly but experience a few collisions with the recombinator and the metallic walls of the analysis chamber. The H atoms are likely to stick on the metallic surfaces and recombine if the fluence of atoms is large enough [49]. Therefore, the recombinator suppresses the flux of H-atoms on a sample surface significantly. On the other hand, the molecules that drifted from the capillary are not affected much by the recombinator, except that they are thermalized at elastic collisions with surfaces, so their temperature is supposed to be lower if the recombinator is placed close to the exhaust of the capillary.
When the capillary is not heated, the molecules experience free adiabatic expansion from the capillary to the analysis chamber, so they are close to room temperature. If the capillary is heated and the recombinator is absent, they are at relatively high temperatures. In the case that the capillary is heated and the recombination is positioned in between the exhaust and the sample, the temperature of hydrogen molecules is moderate. However, it was not possible to measure the gas temperature close to the sample during these experiments.

3. Results

3.1. Comparison of the Effects of Hot H2 Molecules and H Atoms on the SIMS Signals

In the first step, the effects of the heated H2 molecules and H atoms were compared. Their influence on the SIMS signals was controlled via the opening and closing of the recombinator in front of the hydrogen atom beam source. The effects of hydrogen dissociation were evaluated for the NiTi sample. As seen in Figure 1, the opening of the recombinator at 800 s caused an intensity increase of all metal hydride secondary ions. The closing of the recombinator at 1150 s resulted in a decrease in their intensities. The relative intensity change is the highest for the secondary ions that contain two or three hydrogen atoms/ions (NiH2 and TiH3) and it is approximately 50%. In the case of secondary ions with only one H atom/ion (Ni2H, NiH, and TiH), this change is only between 20% and 25%. Such observations correspond to the fact that increased reactivity of the H atoms in comparison to the H2 molecules and consequent faster adsorption on the sample surface will most significantly influence the intensity of the secondary ions containing the highest number of H atoms/ions. The high density of hydrogen atoms on the surface is the most important for the recombination of metal atoms with numerous H atoms. Without the presence of H2, the signal intensity of the metal hydride secondary ions is close to zero as already shown previously with the pressure-dependence experiments [29]. The intensity of the Ni2 signal shows no observable change as a consequence of the opening or closing of the recombinator, so it can be concluded that its formation is not influenced by the increased reactivity of the H atoms. Careful monitoring of the green curve in Figure 1 might lead to the conclusion that the Ni2 signal is even lowered when the recombination is open and recovers to the initial value when the recombination is closed, but the difference is marginal, so it cannot be conclusive.
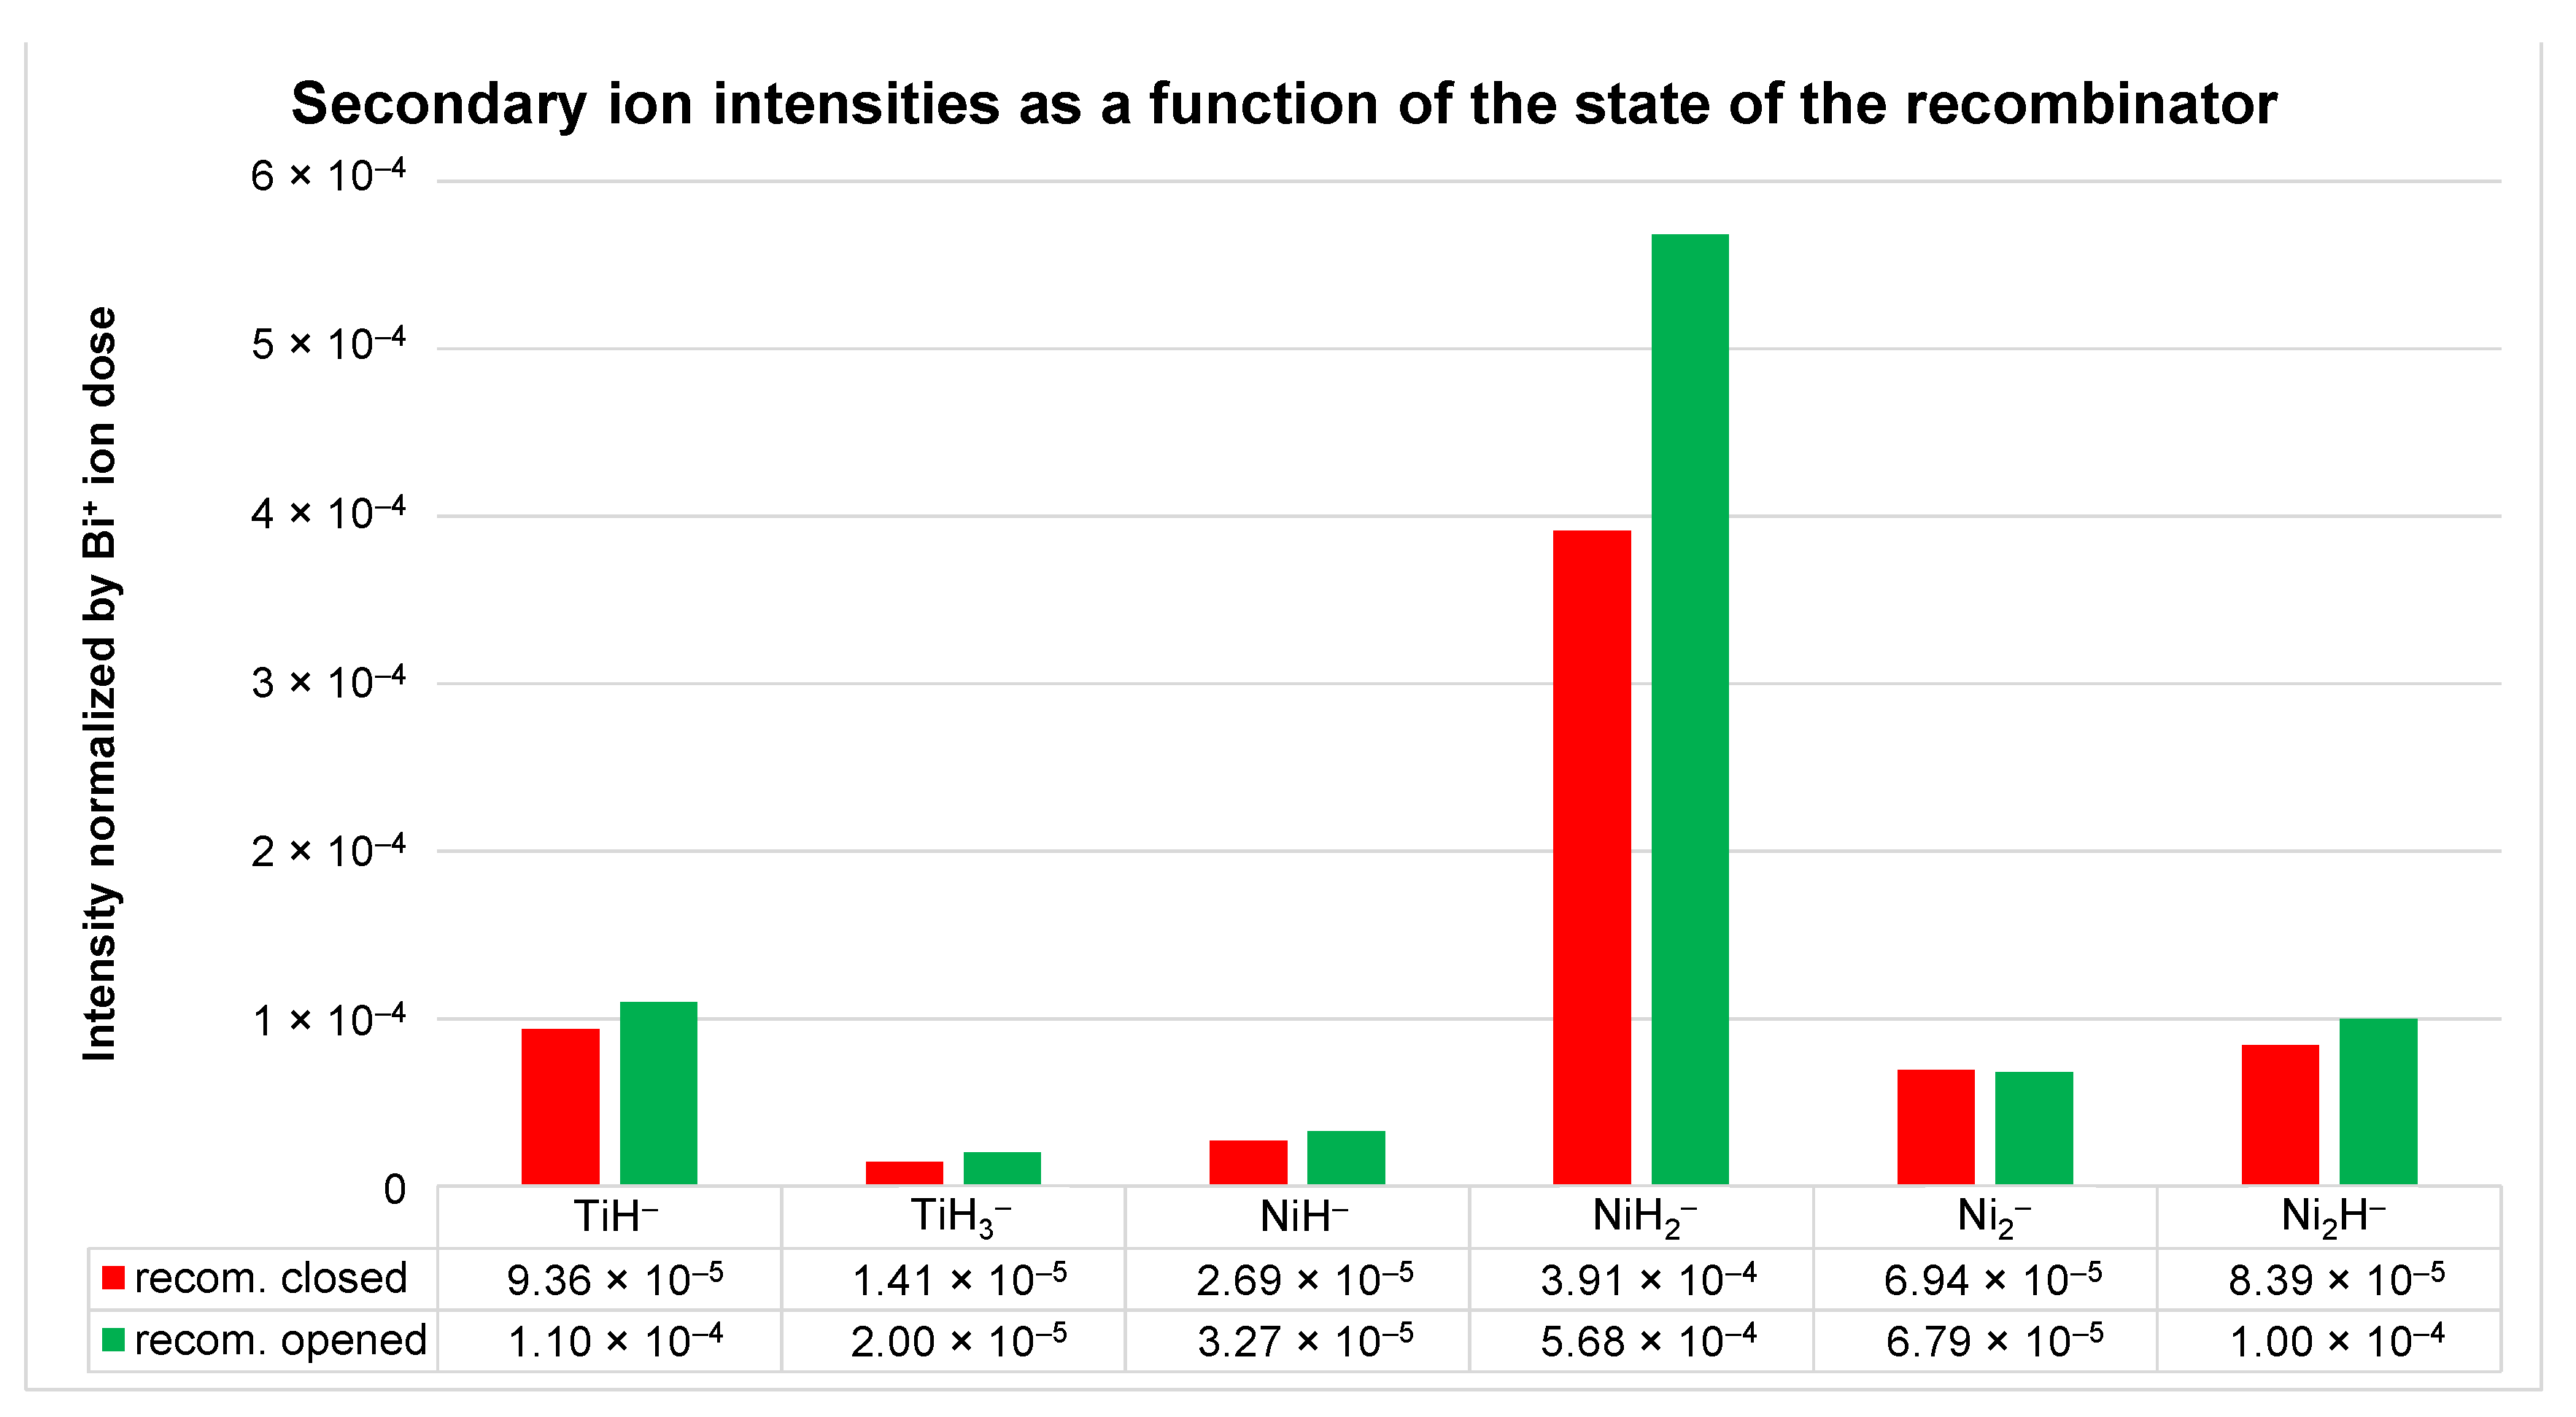
The normalized intensities of the NiH2, Ni2H, NiH, TiH, TiH3, and Ni2 ions are also plotted in Figure 2. Their intensities were integrated over the sputter time between 600 and 750 s (closed recombinator) and the sputter time between 900 and 1050 s (opened recombinator) at the hydrogen pressure of 7 × 10⁻⁷ mbar and the hydrogen atom beam source power of 200 W. The intensity changes of different secondary ions depending on the state of the recombinator clearly indicate already noted observation of larger intensity differences present in the cases of hydride cluster ions containing two or three hydrogen atoms/ions.
Here, it is worth mentioning that the analyses of both the NiTi and the stainless steel samples were performed during SIMS depth profiling by using Bi+ and Cs+ ion beams. This approach was necessary to remove the surface oxide layer. That’s why the x-axis in Figure 1 does not originate at the sputtering time of 0 s. It is also well known that depth profiling with the Cs+ ions results in the implantation of cesium into the sample's surface. Cesium presence causes a reduction of the work function and consequent enhancement of ionization of negative secondary ions [27,50]. Since metal hydrides more efficiently ionize in the negative polarity than in the positive one, Cs+ sputtering increases the intensity of the MHn signals, with M being a metal, thus increasing the signal-to-noise ratio.

3.2. Effect of the Hydrogen Atom Beam Source Power on the Secondary Ion Intensity

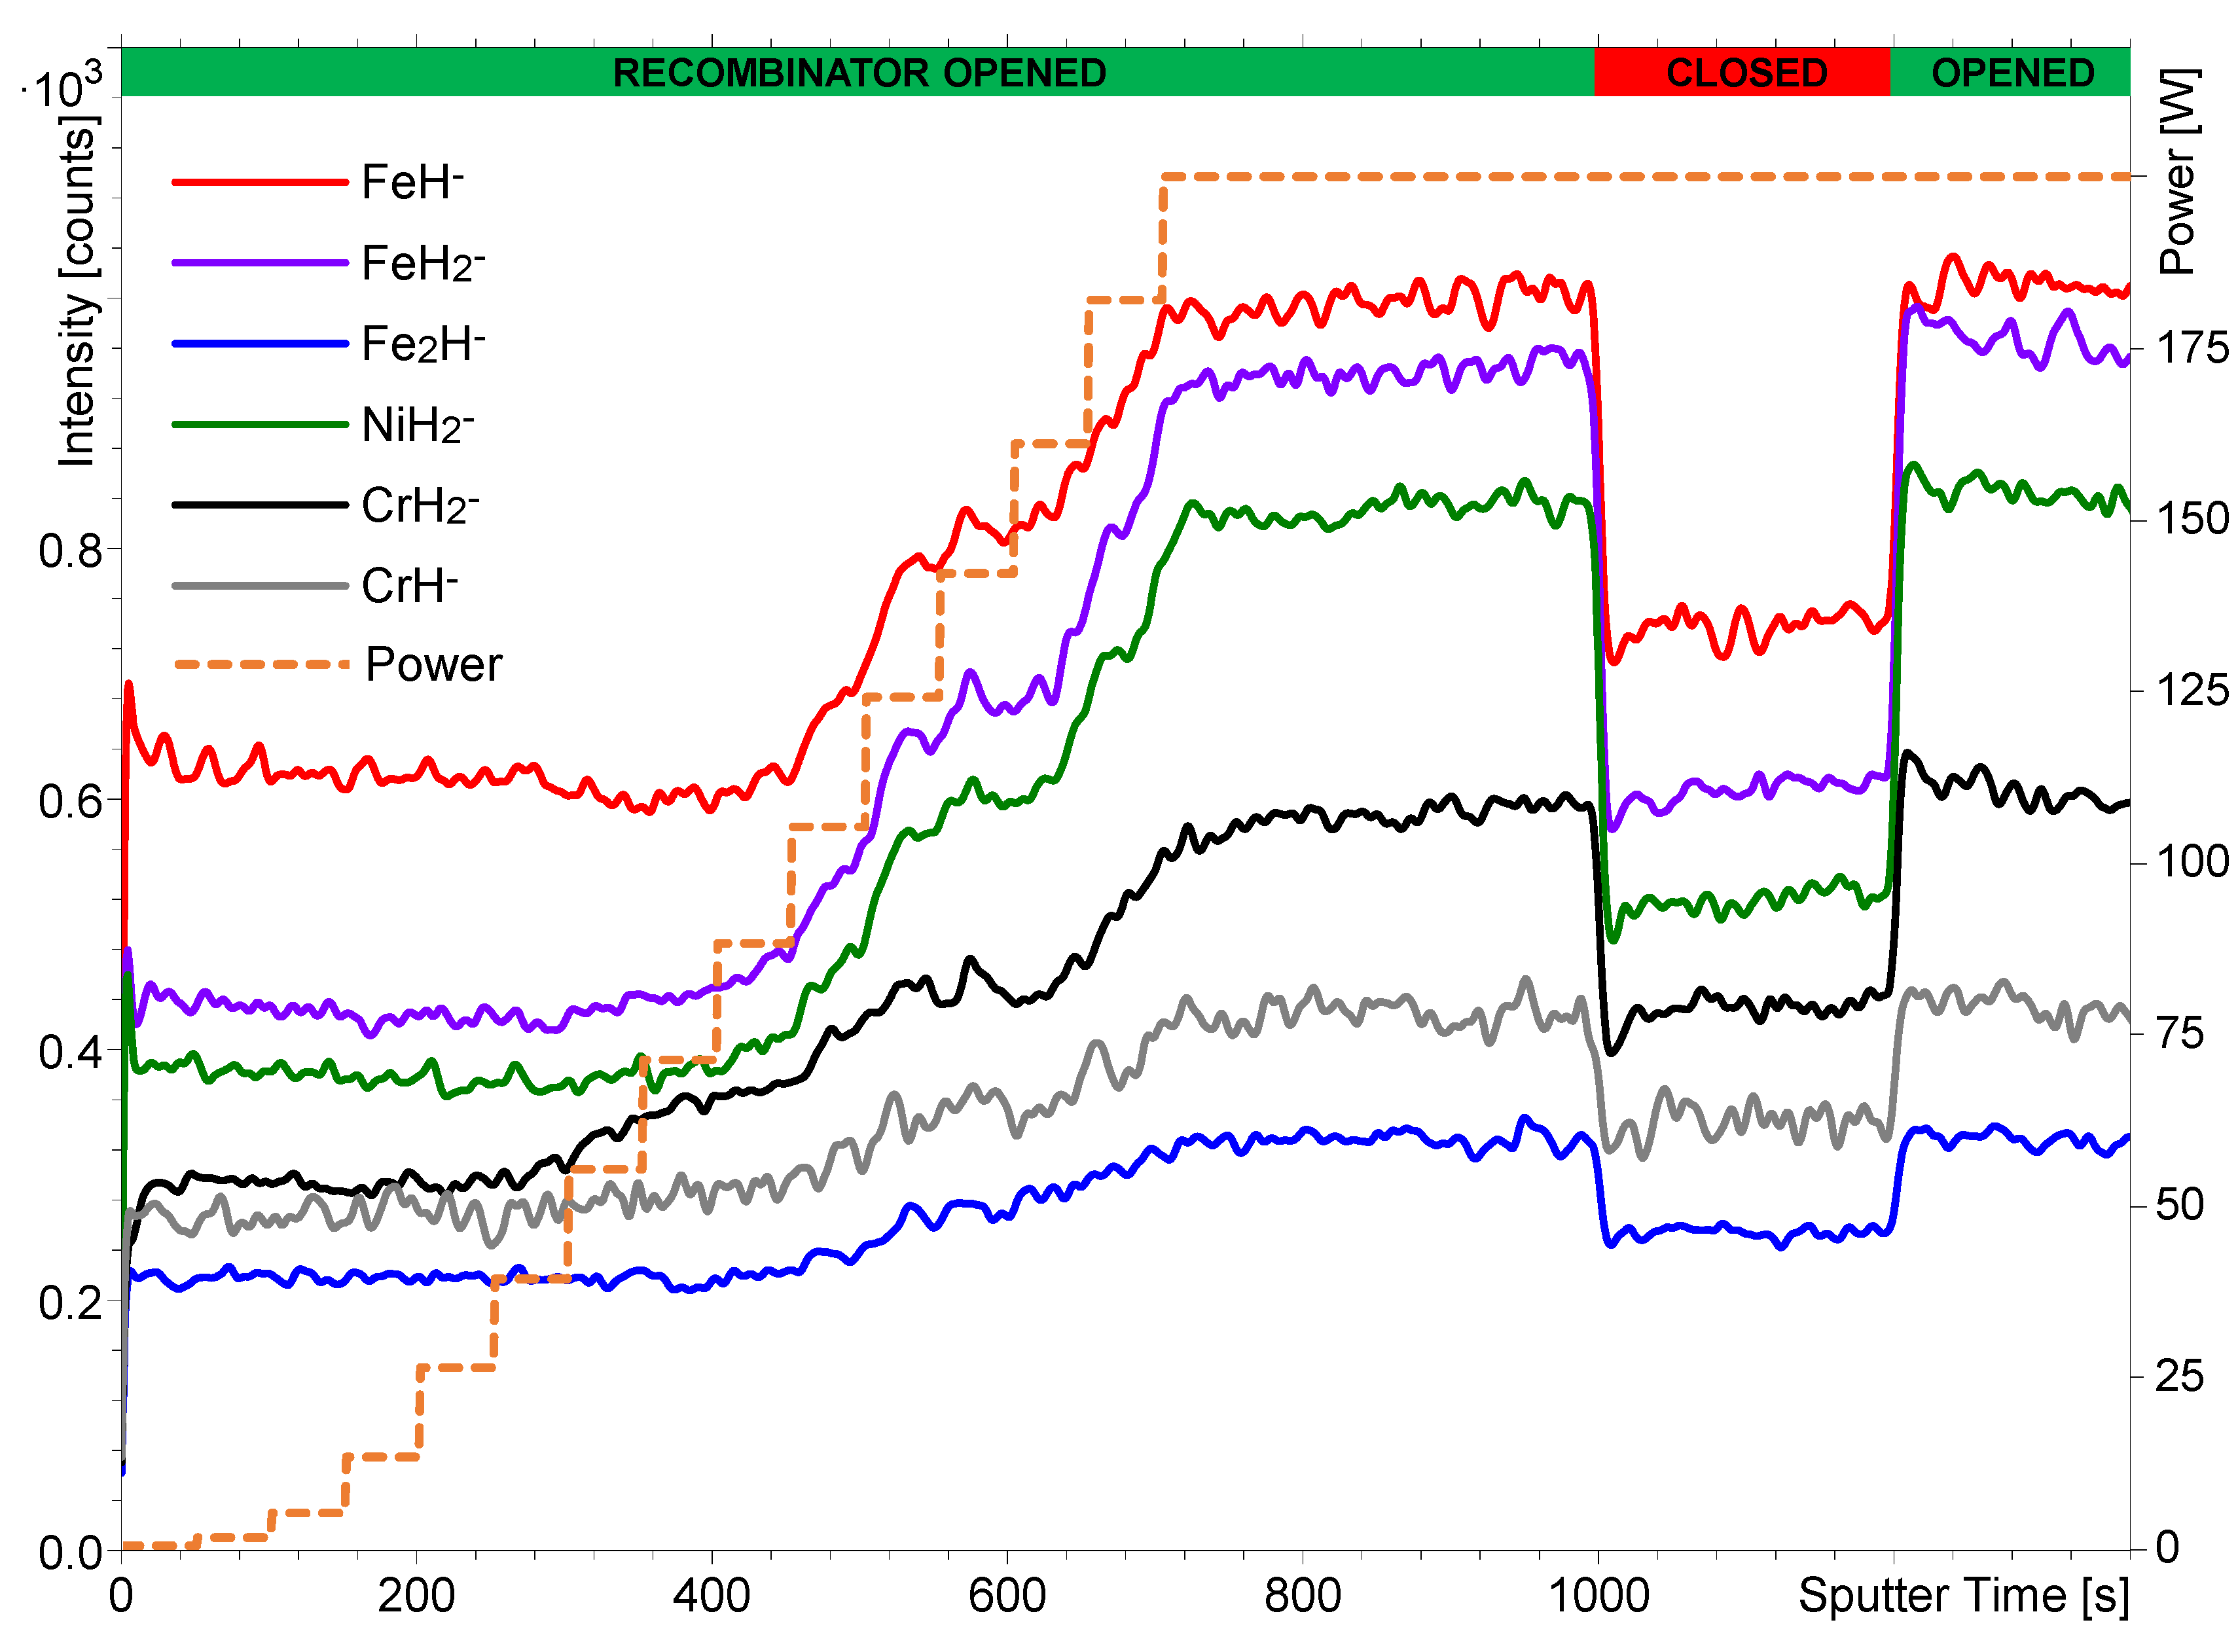
The next set of experiments was performed using the stainless steel sample. The intensity of the metal hydride cluster secondary ions formed during H2 flooding depends on the pressure of the H2 in the analytical chamber [29]. Similar dependence was expected on the proportion of the atomic H compared to the molecular H2. Since the ratio of the molecular and atomic hydrogen depends on the working power of the hydrogen atom beam source, the intensity of metal hydride signals was measured versus the power at the constant hydrogen pressure of 7 × 10⁻⁷ mbar. The hydrogen atom beam source power was gradually increased from 0 to 200 W, which means the temperature of the capillary is gradually increased. The H2 starts to dissociate into H atoms when the temperature is above 1500 K. At the maximum power of 200 W, the expected fraction of the H2 dissociation is approximately 30% [46]. Figure 3 shows the intensities of different hydride cluster secondary ions as a function of hydrogen atom beam source power and state of the recombinator. The source power versus the sputtering time is also presented in Figure 3 and corresponds accordingly to the lower temperature limit required for the H2 dissociation.
The increase in the intensity of the metal hydride ions can be indeed observed during the increase in the atom beam source power. The most pronounced change in intensity is present between 100 and 200 W, which corresponds to the sputtering time between 450 and 700 s. Below 100 W, when the temperature is below or around 1000 K, the changes are minimal. The effect of closing (1000 s) and again opening (1200 s) the hydrogen atom beam source recombinator was tested, and the results were qualitatively the same as observed when using the NiTi sample (Figure 1). The same trend was also observed regarding the relative intensity change in dependence on the number of the H atoms/ions building the secondary ion. However, a slight difference in the intensity of the secondary ions from Figure 3 can be observed if the power is 0 W and the recombinator is opened (sputter time between 0 and 50 s), and if the power is 200 W and the recombinator is closed (sputter time between 1000 and 1200 s). A slightly higher intensity at 200 W can be explained by the incomplete recombination of the H atoms despite the closure of the recombinator and/or by the higher kinetic energy of the heated H2 molecules as a result of the hydrogen atom beam source heating at approximately 2200 K. The incomplete recombination of H atoms on the surface of solid materials (recombination coefficient < 1) has been reported by numerous authors on numerous materials [51,52,53,54]. The coefficient for other atoms like O was never reported above 0.1 and is typically of the order of 0.1 for many metals and alloys [55].
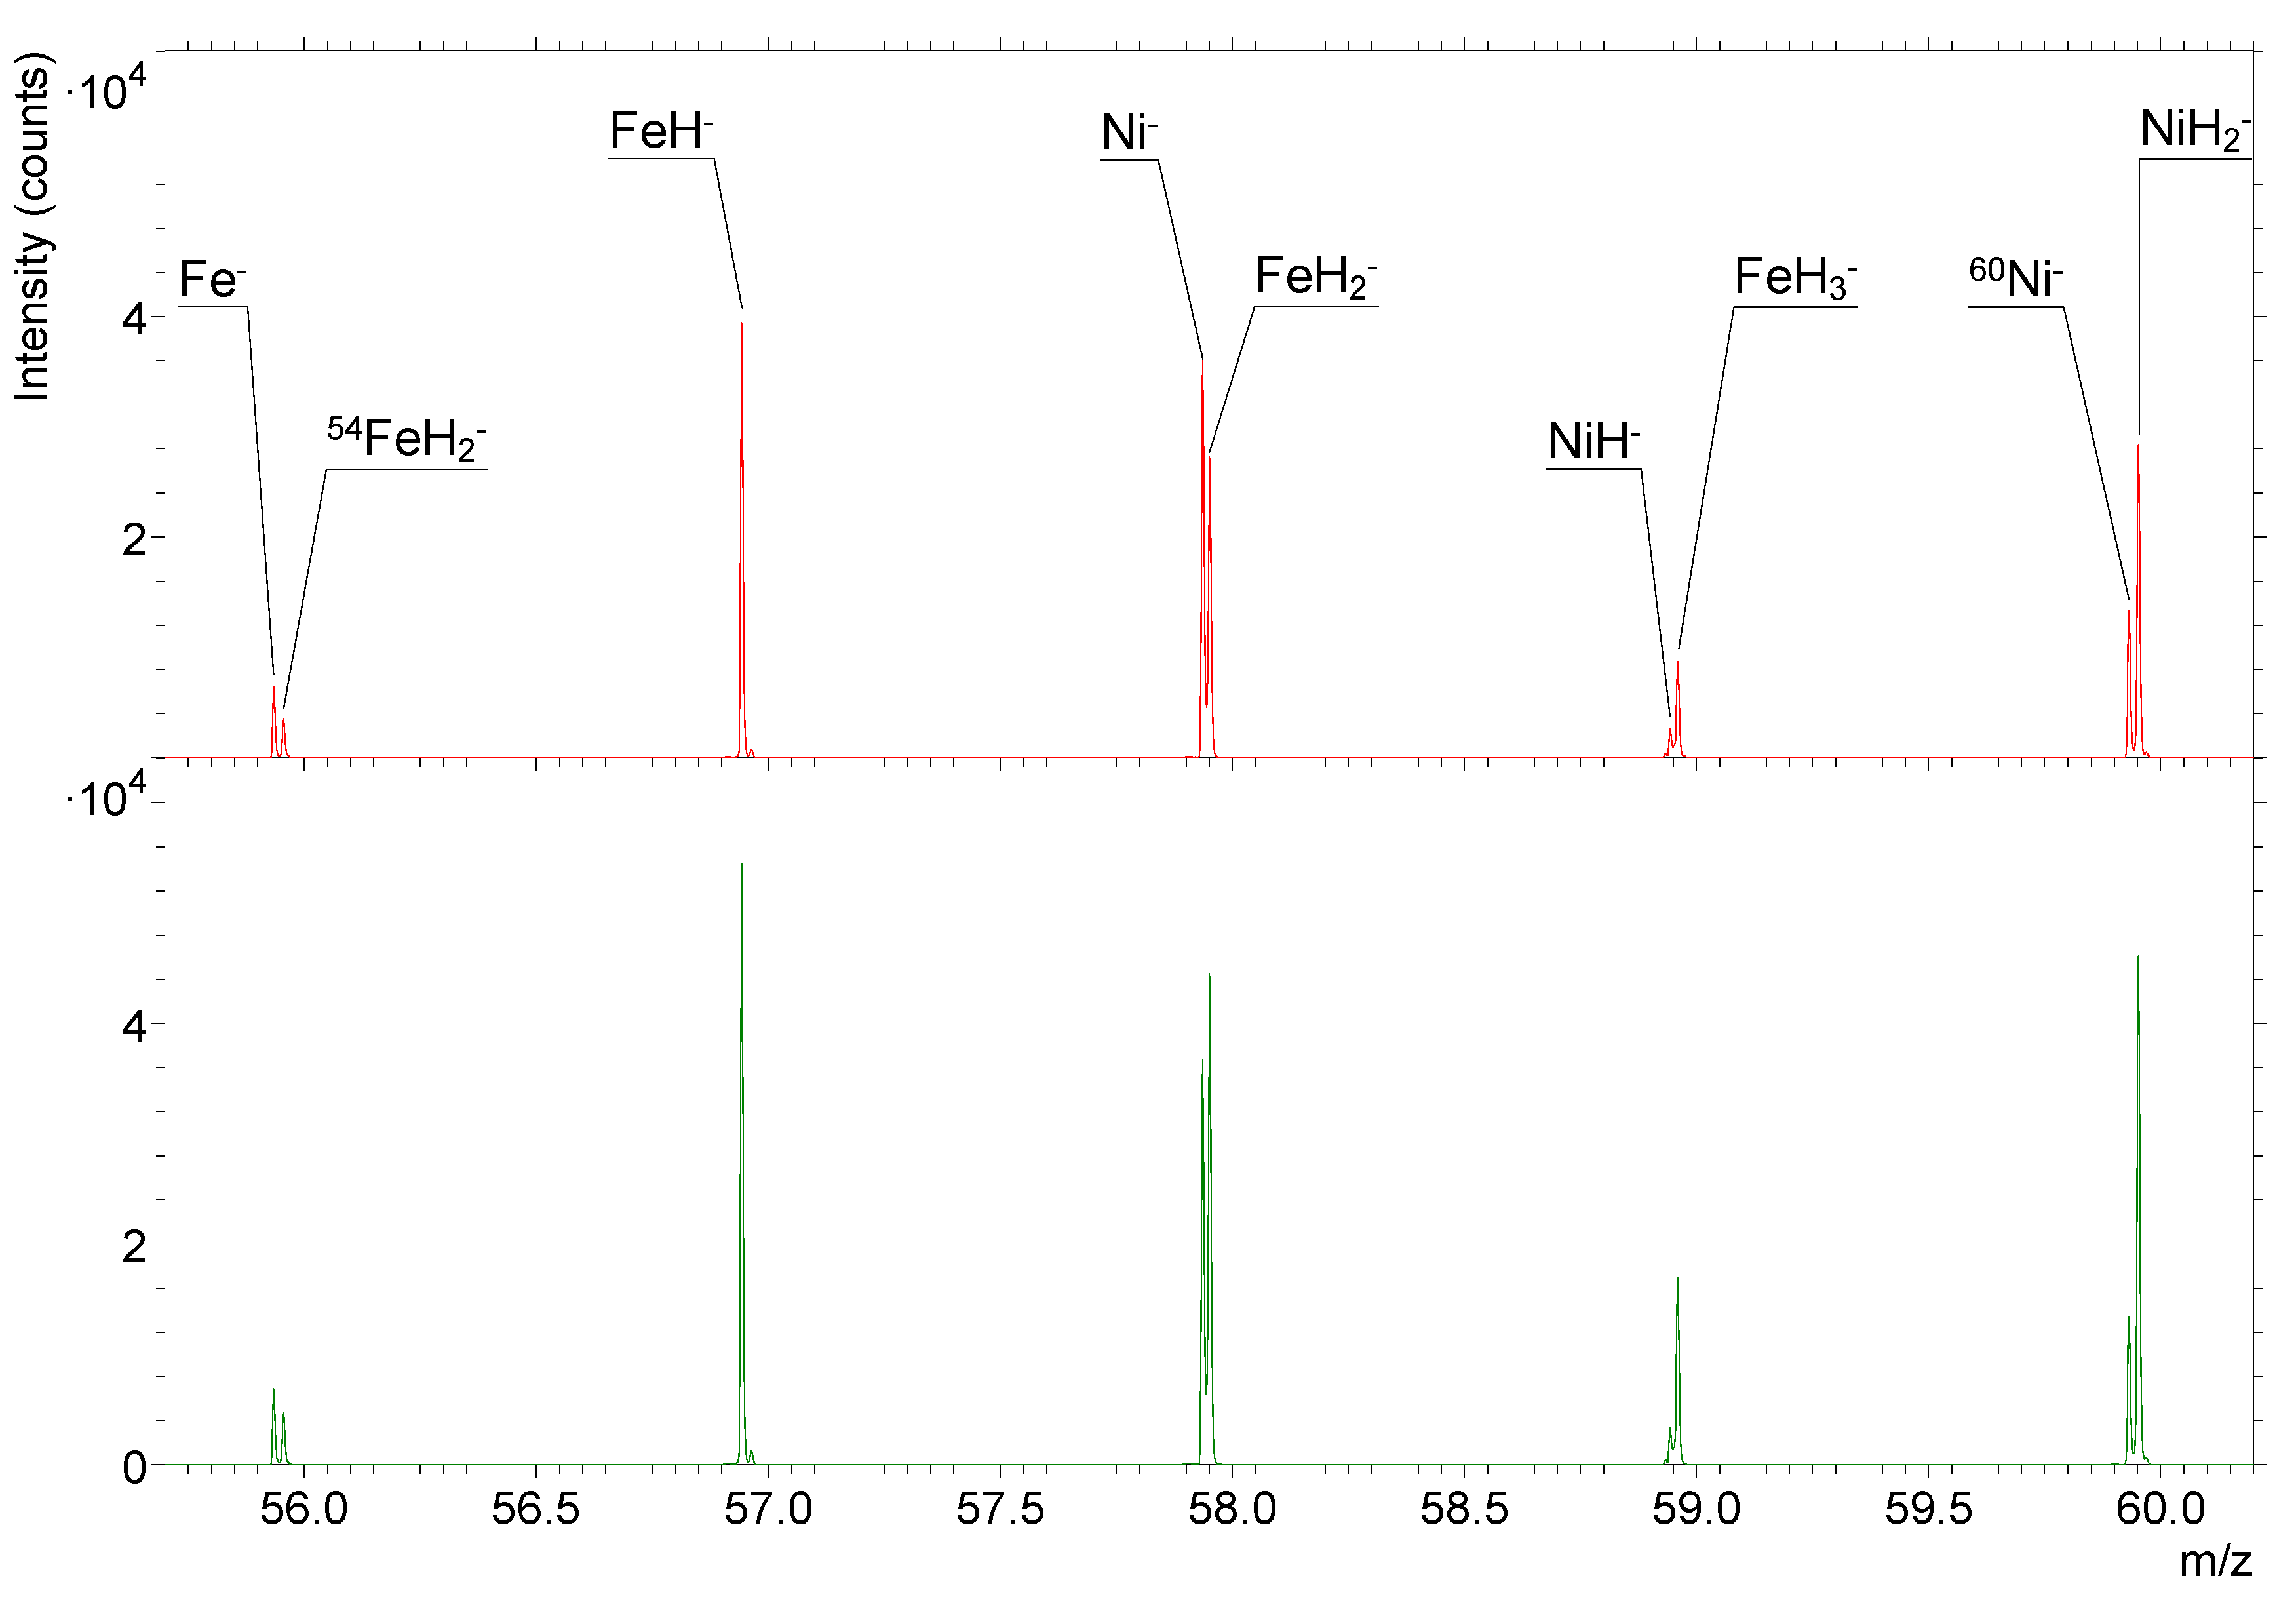
In Figure 4, mass spectra in the m/z range between 55.7 and 60.2 are presented. The Fe and Ni signals from the stainless steel sample analyzed at the hydrogen pressure of 7 × 10⁻⁷ mbar and atom beam source power of 200 W are shown. The upper, red spectrum was measured when the recombinator was closed, and the lower, green spectrum when the recombinator was opened. It can be clearly seen that the opening of the recombinator causes an increase in the intensity of the larger-exact-mass signal for each nominal mass pair (Fe and 54FeH2, Ni and FeH2, NiH and FeH3–, and 60Ni and NiH2). The signals with the larger mass (the ones on the right) always have the larger number of hydrogen atoms/ions, thus proving that the highest intensity increase is observed for the secondary ions with the larger number of hydrogen atoms/ions.

4. Discussion

4.1. Adsorption Affinity of H2 and H

Figure 1, Figure 2, Figure 3, and Figure 4 clearly show that the dissociation of hydrogen molecules causes an increase in the intensity of the metal hydride secondary ions. The reason is most probably the higher adsorption rate of atomic H due to its higher reactivity. Figure 3 also indicates that heating of the H2, despite it remaining in the molecular form, will also have a similar effect, but to a much smaller extent. By increasing the kinetic energy of molecules, their reactivity becomes higher, and the probability of successful adsorption increases. However, the effect of heating applied during our experiments affects metal hydride secondary ion formation probability to a significantly lesser extent than dissociation and formation of H radicals. As already described, hydrogen dissociation influences metal hydride secondary ion formation to different extents also regarding the number of H atoms/ions constituting that metal hydride ion. The requirement of the higher surface hydrogen density for the formation of secondary ions composed of numerous H atoms/ions (MHn, n > 1) is a reason for their higher relative intensity change in comparison to the monohydride ions (MH).

4.2. Mechanism of Metal Hydride Secondary Ion Formation

Cluster secondary ions can theoretically form on the surface or just above it during the sputtering process, or in the plum of the sputtered particles in the vacuum after completion of the sputtering process while colliding with gaseous atoms and molecules. Previous studies indicate that the recombination process indeed happens on the surface [56,57,58] or just above it [56,59,60], and similar conclusions can be obtained from the results of the hydrogen flooding experiments. Firstly, the formation of high-intensity secondary ions such as TiH3 in the vacuum would require a high-rate occurrence of successful three-particle collision reactions, which is highly unlikely. In the case of atomic H, a three-particle reaction would be partially required for the formation of dihydride ions as well, although not completely necessary due to the incomplete dissociation of hydrogen. If the in-vacuum formation of cluster secondary ions would indeed be their main formation pathway, then, according to the particle collision reaction, dissociation of hydrogen would most significantly increase the intensity of the monohydride secondary ions. This is not the case since H2 dissociation results in the most pronounced intensity increase of hydride secondary ions composed of numerous H atoms/ions. Already based on this, we can conclude that the formation of hydride cluster secondary ions originating from the metallic surfaces primarily does not occur in the vacuum.
The next argument against the in-vacuum formation of hydride cluster ions is the time scale of collisions and the time available for the successful reaction to occur. The latter corresponds to the time frame between the primary ion pulse and the end of the extraction into the analyzer, which is a few µs at most. The average time, required for the collisions to occur, can be calculated via the kinetic theory of gases. The root mean square (RMS) speed of the gas can be calculated via Equation (2)
v RMS = 3 RT M
where vRMS is the RMS speed of the gas particle, R is the molar gas constant of 8.31 J/molK, T is the temperature in K, and M is the molar mass. The thermal temperature of hydrogen molecules exiting the hydrogen atom beam source depends on the heating power and can be up to 2200 K. When H atoms or H2 molecules hit the recombinator they lose some of their kinetic energy and they cool down. The same thing happens when molecules hit the chamber walls. Therefore, it is practically impossible to determine the temperature of the molecules when they reach the sample. Nevertheless, if we estimate the gas temperature of approximately 1000 K, the speed of H2 molecules can be calculated as approximately 3500 m/s and the speed of H atoms as 5000 m/s. According to Equation (3)
l = k B T 2 π d 1 d 2 p ,
the mean free path of the gaseous particle can be calculated as well. Here, l denotes the mean free path, kB the Boltzmann constant of 1.38 × 10⁻²³ J/K, d the diameter of the colliding particles, and p the pressure in Pa which was 7 × 10⁻⁵ Pa. Since the collisions of H2 molecules or H atoms with metal atoms are of interest, d1 and d2 should correspond to the diameters of the metal atom and H2 molecule or H atom. There are also possible deviations in diameters due to the ionization of any of the atoms or molecules, but for the purpose of this discussion, these will be disregarded. Fe, with an atomic diameter of 248 pm [61], can be chosen as a common example of a metal atom. Kinetic and van der Waals diameters of the H2 molecule and H atom are 289 [62] and 220 pm [63], respectively. Therefore, the mean free paths of 610 m for the H2 molecules and 800 m for the H atoms can be calculated. The average times required for the metal – H2/H collision (t) can be determined via Equation (4)
t = l v .
The values of 170 ms (H2) and 160 ms (H) are more than four orders of magnitude larger than the time frame during which the collision reactions can occur. This is another indicator of the low probability that in-vacuum collision reactions represent a significant pathway of the metal hydride cluster ion formation.
The hydride cluster ion formation on the surface of sputtered samples will be consequently considered in the following. A comparison of the monolayer formation via gas adsorption and its removal via sputtering indicates a high probability of this mechanism being the most important one. While continuing the analysis considering iron, its numerical density of 8.5 × 1028 atoms/m3 can be calculated via Equation (5)
ρ N = ρ m N A M
where ρN represents the numerical density, ρm the mass density, and NA the Avogadro constant of 6.02 × 10²³ mol–1. The number of Fe atoms per meter can be obtained from the ρN and it is 4.4 × 10⁹ atoms/m. This value can be further transformed to the size of the atom, although, due to the arrangement of the atoms in the crystal structure of the metal, it is closer to the thickness of the monolayer which is 230 pm. Due to the tightly packed atoms in the solid Fe, this value corresponds appropriately to the slightly larger diameter of the Fe atom of 248 pm [61]. The sputter rate of iron in the H2 atmosphere with 1 keV Cs+ ions and under the same analysis conditions was measured to be 84 pm/s, which can be translated to 0.37 monolayer/s. Therefore, approximately 2.7 s are needed to sputter one monolayer of Fe with adsorbed hydrogen.
The time needed for the complete formation of hydrogen monolayer can be determined as well. If the sticking coefficient of 1 (each atom that hits the surface is also adsorbed) and adsorption of one gas particle per atom on the surface are assumed, then Equation (6)
τ = 4 D k B T p v RMS
can be applied. τ is the time needed for the monolayer formation, and D is the dose of gas particles that, by the assumption, equals the surface density of Fe atoms (1.9 × 10¹⁹ atoms/m2). At a temperature of 1000 K and a pressure of 7 × 10⁻⁵ Pa, τ equals 4.3 s for the H2 molecules and 3.0 s for the exclusively H atoms. Equation (6) is derived from Equation (7)
D = j τ
where j represents the current of gas molecules and is defined via Equation (8) as
j = ρ G v RMS 4 .
vRMS is defined by Equation (2) and ρG is the density of the gas in particles/m3 defined by Equation (9)
ρ G = p k B T .
In the case of the opened recombinator of the hydrogen atom beam source, Equation (6) does not describe the process of adsorption completely since gas is introduced via the point source. However, considering the distance from the source to the sample and the driving pressure of the atom beam source in relation to the previously measured gas currents [64], it can be concluded that the gas current of this system is even lower if the point source is considered instead of the random distribution. The latter gives the value of j in the range of 1018 m–2s–1 while the calculation via point source approximation has the j value in the range of 1017 m–2s–1. A lower current of gas molecules j results in even loner monolayer formation time τ.
Furthermore, the assumption of dose D being equal to the surface density of the metal ions is not necessarily correct. The comparison with Equation (10)
τ = 3.2   ×   10 4   Pa   ×   s p
which represents an approximation of the time needed for gas molecules to form one monolayer, that is monolayer formation time [65], is consequently sensible. Approximation Equation (10) also assumes the sticking coefficient of 1. At the pressure of 7 × 10⁻⁵ Pa, τ calculated via Equation (10) equals 4.6 s for both H2 and H. The monolayer formation time is in this case slightly longer than while assuming equal values of gas dose and surface density of metal ions. It is consequently possible to conclude that slightly more than one H atom gets adsorbed to each Fe atom. Such a conclusion corresponds to the notable size difference between Fe and H atoms. Furthermore, although hydrogen is a relatively reactive gas and freshly sputtered surfaces are proven to adsorb gaseous species at a high rate [66], the sticking coefficient of 1, especially in the case of H2, is too high. Since the dissociation ratio of H2 molecules reaches approximately 30%, a sticking coefficient below 1 can be expected during SIMS analyses in combination with the hydrogen atom beam source as well.
The consequence of a lower sticking coefficient is even longer monolayer formation time. When accounting for all of the above effects, it is possible to conclude with a relatively high degree of certainty that monolayer formation time at the given conditions, especially concerning H2 molecules, is notably longer (almost 2-fold) than the time needed for the removal of one monolayer of Fe with adsorbed hydrogen which accounts for 2.7 s. Dissociation accelerates the monolayer formation by adsorption of more reactive H atoms with a higher sticking coefficient, therefore creating a larger portion of the monolayer before the latter is sputtered away. Since molecule dissociation also causes an increase in the intensity of metal hydride secondary ions, it can be concluded that a higher degree of hydrogen adsorption and a higher percentage of hydrogen monolayer formation increase the formation rate of hydride secondary ions. This correlation proves the importance of the adsorbed species and indicates that cluster secondary ions are preferentially formed on the surface or just above it during the sputtering process with a mechanism being the recombination of sample particles with pre-adsorbed atoms and molecules.

5. Conclusions

A significant increase in the intensity of metal hydride secondary ions was observed after the dissociation of hydrogen molecules with much lesser effects caused by the heated, but not dissociated H2. The increased formation rate of the metal hydride secondary ions is a consequence of the higher reactivity of the H atoms in comparison to the H2 molecules. H atoms are more easily adsorbed on the freshly sputtered surface with the consequence being faster hydrogen monolayer formation. The correlation of the monolayer formation and the sputter rate with the intensity of the hydride secondary ions indicates that cluster secondary ions are formed by the recombination of the atoms and molecules from the sample with the adsorbed atoms and molecules from the gas on the surface or just above it during the sputtering process. The portion of cluster secondary ions being formed in the vacuum after the sputtering is minimal if present at all. However, these mechanistic explanations would benefit from the additional studies to evaluate them further. The most straightforward approach, planned for future publication, is a comparison of the effects of different sputter rates controlled via sputtering parameters and different monolayer formation times controlled via gas pressure.

Author Contributions

Conceptualization, J.E., M.M. and J.K.; methodology, J.E., S.M. and R.Z.; formal analysis, J.E. and R.Z.; investigation, J.E., S.M. and R.Z.; resources, J.E., S.M., M.M., R.Z. and J.K.; data curation, J.E.; writing—original draft preparation, J.E. and S.M.; writing—review and editing, J.E., S.M., M.M., R.Z. and J.K.; visualization, J.E., S.M. and M.M.; supervision, R.Z. and J.K.; project administration, J.E., S.M. and J.K.; funding acquisition, S.M., M.M., R.Z. and J.K.

Funding

This research was funded by the Slovenian Research and Innovation Agency (ARIS) through the Program P2-0082 and Project PR-09757.

Data Availability Statement

The additional data in the form of the original SIMS spectra and depth profiles will be available on request. The reason for this is the format in which measurements are encoded. If the potential user does not have the appropriate software at their disposal, we will discuss with them in what form they want the data (for example, ASCII). Furthermore, measurements are accompanied by written notes considering changes in the output power of the hydrogen atom beam source and closing or opening of the recombinator at specific times. Since the hydrogen atom beam source is not an original part of the TOF.SIMS 5 instrument, such information is not recognized and recorded by the IONTOF software. We consider explaining the data interpretation details to a potential user to be much more effective and can prevent unwanted misunderstandings, so we decided to prefer this approach including our help.

Conflicts of Interest

The authors declare no conflicts of interest. The funders had no role in the design, execution, interpretation, or writing of the study.

References

  1. Vickerman, J.C. Prologue: ToF-SIMS—An evolving mass spectrometry of materials. In ToF-SIMS: Materials Analysis by Mass Spectrometry, 2nd Ed., Editors D. Vickerman, J. C. & Briggs, Publisher: IM Publications LLP and SurfaceSpectra Limited, Chichester, Manchester, United Kingdom, 2013; pp. 1–37.
  2. van der Heide, P. Sputtering and Ion Formation. In Secondary Ion Mass Spectrometry – An Introduction to Principles Practices, Publisher: John Wiley & Sons, Hoboken, New Jersey, USA, 2014; pp. 44–143.
  3. van der Heide, P. The Art of Measurement. In Secondary Ion Mass Spectrometry – An Introduction to Principles Practices, Publisher: John Wiley & Sons, Hoboken, New Jersey, USA, 2014; pp. 195–208.
  4. Niehuis, E.; Grehl, T. Depth profiling of inorganic materials. In ToF-SIMS: Materials Analysis by Mass Spectrometry, 2nd Ed., Editors D. Vickerman, J. C. & Briggs, Publisher: IM Publications LLP and SurfaceSpectra Limited, Chichester, Manchester, United Kingdom, 2013; pp. 613–635.
  5. van der Heide, P. Secondary Ion Yields. In Secondary Ion Mass Spectrometry – An Introduction to Principles Practices, Publisher: John Wiley & Sons, Hoboken, New Jersey, USA, 2014; pp. 93–121.
  6. Grasserbauer, M. Quantitative Secondary Ion Mass Spectrometry. J. Res. Natl. Bur. Stand. 1988, 93, 510–518. [Google Scholar] [CrossRef]
  7. Priebe, A.; Xie, T.; Bürki, G.; Pethö, L.; Michler, J. The matrix effect in TOF-SIMS analysis of two-element inorganic thin films. J. Anal. At. Spectrom. 2020, 35, 1156–1166. [Google Scholar] [CrossRef]
  8. Karki, V.; Singh, M. Quantitative depth distribution analysis of elements in high alloy steel using MCs+-SIMS approach. Int. J. Mass Spectrom. 2018, 430, 22–30. [Google Scholar] [CrossRef]
  9. Satoh, H.; Owari, M.; Nihei, Y. Relative sensitivity factors for submicron secondary ion mass spectrometry with gallium primary ion beam. Jpn. J. Appl. Phys. 1993, 32, 3616–3620. [Google Scholar] [CrossRef]
  10. Hongo, C.; Tomita, M.; Suzuki, M. Quantitative secondary ion mass spectrometry analysis of impurities in GaN and AlxGa1−xN films using molecular ions MCs+ and MCs2+. Appl. Surf. Sci. 1999, 144–145, 306–309. [Google Scholar] [CrossRef]
  11. Jang, Y.J.; Kim, S.H.; Kim, K.J.; Kim, D.; Lee, Y. Comparison of quantitative analyses using SIMS, atom probe tomography, and femtosecond laser ablation inductively coupled plasma mass spectrometry with Si1−XGeX and Fe1−XNiX binary alloys. J. Vac. Sci. Technol. B. 2020, 38, 034009. [Google Scholar] [CrossRef]
  12. Wucher, A. Laser post-ionisation—fundamentals. In ToF-SIMS: Materials Analysis by Mass Spectrometry, 2nd Ed., Editors D. Vickerman, J. C. & Briggs, Publisher: IM Publications LLP and SurfaceSpectra Limited, Chichester, Manchester, United Kingdom, 2013; pp. 217–246.
  13. Breuer, L.; Tian, H.; Wucher, A.; Winograd, N. Molecular SIMS Ionization Probability Studied with Laser Postionization: Influence of the Projectile Cluster. J. Phys. Chem. C. 2019, 123, 565–574. [Google Scholar] [CrossRef]
  14. Breuer, L.; Popczun, N.J.; Wucher, A.; Winograd, N. Reducing the Matrix Effect in Molecular Secondary Ion Mass Spectrometry by Laser Post-Ionization. J. Phys. Chem. C. 2017, 121, 19705–19715. [Google Scholar] [CrossRef]
  15. Kopnarski, M.; Jenett, H. Electron-Impact (EI) Secondary Neutral Mass Spectrometry (SNMS). In Surface and Thin Film Analysis, Publisher: Wiley-VCH Verlag GmbH & Co. KGaA, Weinheim, Germany, 2011; pp. 161–177.
  16. Wilson, R.; Van Den Berg, J.A.; Vickerman, J.C. Quantitative surface analysis using electron beam SNMS: Calibrations and applications. Surf. Interface Anal. 1989, 14, 393–400. [Google Scholar] [CrossRef]
  17. Oechsner, H. Secondary Ion Mass Spectrometry SIMS V, Proceedings of the Fifth SIMS International Conference, Washington, DC, USA, September 30 – October 4, 1985, Publisher: Springer, Berlin, Germany, 1986.
  18. Debord, J.D.; Prabhakaran, A.; Eller, M.J.; Verkhoturov, S.V.; Delcorte, A.; Schweikert, E.A. Metal-assisted SIMS with hypervelocity gold cluster projectiles. Int. J. Mass Spectrom. 2013, 343–344, 28–36. [Google Scholar] [CrossRef]
  19. Dunham, S.J.B.; Comi, T.J.; Ko, K.; Li, B.; Baig, N.F.; Morales-Soto, N.; Shrout, J.D.; Bohn, P.W.; Sweedler, J.V. Metal-assisted polyatomic SIMS and laser desorption/ionization for enhanced small molecule imaging of bacterial biofilms. Biointerphases. 2016, 11, 02A325. [Google Scholar] [CrossRef] [PubMed]
  20. Yamazaki, A.; Tobe, T.; Akiba, S.; Owari, M. Metal-Assisted SIMS for three-dimensional analysis using shave-off section processing. Surf. Interface Anal. 2014, 46, 1215–1218. [Google Scholar] [CrossRef]
  21. Lanni, E.J.; Dunham, S.J.B.; Nemes, P.; Rubakhin, S.S.; Sweedler, J.V. Biomolecular imaging with a C60-SIMS/MALDI dual ion source hybrid mass spectrometer: Instrumentation, matrix enhancement, and single cell analysis. J. Am. Soc. Mass Spectrom. 2014, 25, 1897–1907. [Google Scholar] [CrossRef] [PubMed]
  22. Locklear, J.E.; Guillermier, C.; Verkhoturov, S.V.; Schweikert, E.A. Matrix-enhanced cluster-SIMS. Appl. Surf. Sci. 2006, 252, 6624–6627. [Google Scholar] [CrossRef]
  23. Fitzgerald, J.J.D.; Kunnath, P.; Walker, A.V. Matrix-enhanced secondary ion mass spectrometry (ME SIMS) using room temperature ionic liquid matrices. Anal. Chem. 2010, 82, 4413–4419. [Google Scholar] [CrossRef]
  24. Tian, H.; Wucher, A.; Winograd, N. Dynamic Reactive Ionization with Cluster Secondary Ion Mass Spectrometry. J. Am. Soc. Mass Spectrom. 2016, 27, 285–292. [Google Scholar] [CrossRef]
  25. Tian, H.; Wucher, A.; Winograd, N. Reducing the Matrix Effect in Organic Cluster SIMS Using Dynamic Reactive Ionization. J. Am. Soc. Mass Spectrom. 2016, 27, 2014–2024. [Google Scholar] [CrossRef]
  26. Priebe, A.; Utke, I.; Pethö, L.; Michler, J. Application of a Gas-Injection System during the FIB-TOF-SIMS Analysis - Influence of Water Vapor and Fluorine Gas on Secondary Ion Signals and Sputtering Rates. Anal. Chem. 2019, 91, 11712–11722. [Google Scholar] [CrossRef]
  27. Kudriatsev, Y.; Villegas, A.; Gallardo, S.; Ramirez, G.; Asomoza, R.; Mishurnuy, V. Cesium ion sputtering with oxygen flooding: Experimental SIMS study of work function change. Appl. Surf. Sci. 2008, 254, 4961–4964. [Google Scholar] [CrossRef]
  28. Williams, P.; Franzreb, K.; Sobers, R.C.; Lörinčík, J. On the effect of oxygen flooding on the detection of noble gas ions in a SIMS instrument. Nucl. Instruments Methods Phys. Res. Sect. B Beam Interact. with Mater. Atoms. 2010, 268, 2758–2765. [Google Scholar] [CrossRef]
  29. Ekar, J.; Kos, S.; Kovač, J. Quantitative aspects of ToF-SIMS analysis of metals and alloys in a UHV, O2 and H2 atmosphere. Surfaces and Interfaces 2024, 49, 104408. [Google Scholar] [CrossRef]
  30. Ekar, J.; Panjan, P.; Drev, S.; Kovač, J. ToF-SIMS Depth Profiling of Metal, Metal Oxide, and Alloy Multilayers in Atmospheres of H2, C2H2, CO, and O2. J. Am. Soc. Mass Spectrom. 2022, 33, 31–44. [Google Scholar] [CrossRef] [PubMed]
  31. Ekar, J.; Kovač, J. AFM Study of Roughness Development during ToF-SIMS Depth Profiling of Multilayers with a Cs+ Ion Beam in a H2 Atmosphere. Langmuir 2022, 38, 12871–12880. [Google Scholar] [CrossRef]
  32. Kozlica, D.K.; Ekar, J.; Kovač, J.; Milošev, I. Roles of Chloride Ions in the Formation of Corrosion Protective Films on Copper. J. Electrochem. Soc. 2021, 168, 031504. [Google Scholar] [CrossRef]
  33. Abe, Y.; Komatsu, M.; Okuhira, H. Estimation of ToF-SIMS information depth in micro-corrosion analysis. Appl. Surf. Sci. 2003, 203–204, 859–862. [Google Scholar] [CrossRef]
  34. Kia, A.M.; Haufe, N.; Esmaeili, S.; Mart, C.; Utriainen, M.; Puurunen, R.L.; Weinreich, W. ToF-SIMS 3D Analysis of Thin Films Deposited in High Aspect Ratio Structures via Atomic Layer Deposition and Chemical Vapor Deposition. Nanomater. 2019, 9, 1035. [Google Scholar] [CrossRef]
  35. Cwil, M.; Konarski, P.; Ciosek, J. Ion mass interferences and matrix effects on SIMS depth profiling of thin Ti/Si multilayer films induced by hydrogen, carbon and oxygen contaminations. Int. J. Mass Spectrom. 2007, 263, 54–58. [Google Scholar] [CrossRef]
  36. Kovač, J.; Ekar, J.; Čekada, M.; Zajíčková, L.; Nečas, D.; Blahová, L.; Wang, J.Y.; Mozetič, M. Depth profiling of thin plasma-polymerized amine films using GDOES in an Ar-O2 plasma. Appl. Surf. Sci. 2022, 581, 152292. [Google Scholar] [CrossRef]
  37. Veith, L.; Böttner, J.; Vennemann, A.; Breitenstein, D.; Engelhard, C.; Meijer, J.; Estrela-Lopis, I.; Wiemann, M.; Hagenhoff, B. Detection of ZrO2 Nanoparticles in Lung Tissue Sections by Time-of-Flight Secondary Ion Mass Spectrometry and Ion Beam Microscopy. Nanomater. 2018, 8, 44. [Google Scholar] [CrossRef]
  38. Radnik, J.; Kersting, R.; Hagenhoff, B.; Bennet, F.; Ciornii, D.; Nymark, P.; Grafström, R.; Hodoroaba, V.D. Reliable Surface Analysis Data of Nanomaterials in Support of Risk Assessment Based on Minimum Information Requirements. Nanomater. 2021, 11, 639. [Google Scholar] [CrossRef]
  39. Wang, Z.; Charly, C.; Antoine, S.; Sandrine, Z.; Dimitri, M.; Philippe, M. XPS and ToF-SIMS Investigation of Native Oxides and Passive Films Formed on Nickel Alloys Containing Chromium and Molybdenum. J. Electrochem. Soc. 2021, 168, 041503. [Google Scholar] [CrossRef]
  40. Jovičević-Klug, P.; Lipovšek, N.; Jovičević-Klug, M.; Mrak, M.; Ekar, J.; Ambrožič, B.; Dražić, G.; Kovač, J. Podgornik. Assessment of deep cryogenic heat-treatment impact on the microstructure and surface chemistry of austenitic stainless steel. Surfaces and Interfaces 2022, 35, 102456. [Google Scholar] [CrossRef]
  41. Omerzu, A.; Peter, R.; Jardas, D.; Turel, I.; Salamon, K.; Podlogar, M.; Vengust, D.; Badovinac, I.J.; Piltaver, I.K.; Petravic, M. Large enhancement of photocatalytic activity in ZnO thin films grown by plasma-enhanced atomic layer deposition. Surfaces and Interfaces 2021, 23, 100984. [Google Scholar] [CrossRef]
  42. Lee, J.Y.; Kim, J.H.; Jung, Y.; Shin, J.C.; Lee, Y.; Kim, K.; Kim, N.; van der Zande, A.M.; Son, J.; Lee, G.H. Evolution of defect formation during atomically precise desulfurization of monolayer MoS2. Commun. Mater. 2021, 2, 1–10. [Google Scholar] [CrossRef]
  43. Kim, B.; Kim, M.; Yoo, S.; Nam, S.K. Atomistic insights on hydrogen plasma treatment for stabilizing High-k/Si interface. Appl. Surf. Sci. 2022, 593, 153297. [Google Scholar] [CrossRef]
  44. Marinov, D.; de Marneffe, J.F.; Smets, Q.; Arutchelvan, G.; Bal, K.M.; Voronina, E.; Rakhimova, T.; Mankelevich, Y.; El Kazzi, S.; Mehta, A.N.; Wyndaele, P.J.; Heyne, M.H.; Zhang, J.; With, P.C.; Banerjee, S.; Neyts, E.C.; Asselberghs, I.; Lin, D.; De Gendt, S. Reactive plasma cleaning and restoration of transition metal dichalcogenide monolayers. Npj 2D Mater. Appl. 2021, 5, 1–10. [Google Scholar] [CrossRef]
  45. Lee, D.H.; Kang, H.; Kim, Y.; Song, H.; Lee, H.; Choi, J.; Kim, K.T.; Song, Y.H. Plasma-assisted hydrogen generation: A mechanistic review. Fuel Process. Technol. 2023, 247, 107761. [Google Scholar] [CrossRef]
  46. Tschersich, K.G.; Fleischhauer, J.P.; Schuler, H. Design and characterization of a thermal hydrogen atom source. J. Appl. Phys. 2008, 104, 34908. [Google Scholar] [CrossRef]
  47. Tschersich, K.G. Intensity of a source of atomic hydrogen based on a hot capillary. J. Appl. Phys. 2000, 87, 2565–2573. [Google Scholar] [CrossRef]
  48. Tschersich, K.G.; Von Bonin, V. Formation of an atomic hydrogen beam by a hot capillary. J. Appl. Phys. 1998, 84, 4065–4070. [Google Scholar] [CrossRef]
  49. Mozetič, M.; Drobnič, M.; Zalar, A. Recombination of neutral hydrogen atoms on AISI 304 stainless steel surface. Appl. Surf. Sci. 1999, 144–145, 399–403. [Google Scholar] [CrossRef]
  50. Cong, Z.; Fu, X.; Liu, S.; Wang, W.; Liu, H.; Lei, G.; Zhao, B.; Wu, H.; Gao, C. Enhancing the organic solar cells performances by elevating cesium carboxylate content of graphene oxide based cathode interface layer. Surfaces and Interfaces 2022, 31, 102068. [Google Scholar] [CrossRef]
  51. Sode, M.; Schwarz-Selinger, T.; Jacob, W.; Kersten, H. Surface loss probability of atomic hydrogen for different electrode cover materials investigated in H2-Ar low-pressure plasmas. J. Appl. Phys. 2014, 116, 013302. [Google Scholar] [CrossRef]
  52. Zyryanov, S.M.; Kovalev, A.S.; Lopaev, D.V.; Malykhin, E.M.; Rakhimov, A.T.; Rakhimova, T.V.; Koshelev, K.N.; Krivtsun, V.M. Loss of hydrogen atoms in H2 plasma on the surfaces of materials used in EUV lithography. Plasma Phys. Reports. 2011, 37, 881–889. [Google Scholar] [CrossRef]
  53. Rutigliano, M.; Santoro, D.; Balat-Pichelin, M. Hydrogen atom recombination on tungsten at high temperature: Experiment and Molecular Dynamics Simulation. Surf. Sci. 2014, 628, 66–75. [Google Scholar] [CrossRef]
  54. Wood, B.J.; Wise, H. Kinetics of hydrogen atom recombination on surfaces. J. Phys. Chem. 1961, 65, 1976–1983. [Google Scholar] [CrossRef]
  55. Paul, D.; Mozetic, M.; Zaplotnik, R.; Primc, G.; Đonlagić, D.; Vesel, A. A Review of Recombination Coefficients of Neutral Oxygen Atoms for Various Materials. Mater. 2023, 16, 1774. [Google Scholar] [CrossRef]
  56. Vlekken, J.; D’Olieslaeger, M.; Knuyt, G.; Vandervorst, W.; De Schepper, L. Investigation of the formation process of MCs+-molecular ions during sputtering. J. Am. Soc. Mass Spectrom. 2000, 11, 650–658. [Google Scholar] [CrossRef]
  57. Honda, F.; Lancaster, G.M.; Fukuda, Y.; Rabalais, J.W. SIMS study of the mechanism of cluster formation during ion bombardment of alkali halides. J. Chem. Phys. 1978, 69, 4931–4937. [Google Scholar] [CrossRef]
  58. Lancaster, G.M.; Honda, F.; Fukuda, Y.; J. W. Rabalais. Secondary Ion Mass Spectrometry of Molecular Solids. Cluster Formation During Ion Bombardment of Frozen Water, Benzene, and Cyclohexane. J. Am. Chem. Soc. 1979, 101, 1951–1958. [Google Scholar] [CrossRef]
  59. Saha, B.; Chakraborty, P. Secondary ion mass spectrometry of MCsn+ molecular ion complexes. Nucl. Instruments Methods Phys. Res. Sect. B Beam Interact. with Mater. Atoms. 2007, 258, 218–225. [Google Scholar] [CrossRef]
  60. Vlekken, J.; Wu, T.D.; D’Olieslaeger, M.; Knuyt, G.; De Schepper, L.; Stals, L.M. Monte Carlo simulation of the formation of MCs+ molecular ions. Int. J. Mass Spectrom. Ion Process. 1996, 156, 61–66. [Google Scholar] [CrossRef]
  61. Callister, W.D.; Rethwisch, D.G. Materials Science and Engineering – An Introduction, Publisher: John Wiley & Sons, Hoboken, New Jersey, USA, 2018; pp. III.
  62. Ismail, A.F.; Khulbe, K.C.; Matsuura, T. Fundamentals of Gas Permeation Through Membranes. In Gas Separation Membranes: Polymeric and Inorganic, Publisher: Springer, Berlin, Germany, 2015; pp. 14.
  63. Mantina, M.; Chamberlin, A.C.; Valero, R.; Cramer, C.J.; Truhlar, D.G. Consistent van der Waals Radii for the Whole Main Group. J. Phys. Chem. A. 2009, 113, 5806–5812. [Google Scholar] [CrossRef] [PubMed]
  64. Markelj, S.; Schwarz-Selinger, T.; Založnik, A.; Kelemen, M.; Vavpetič, P.; Pelicon, P.; Hodille, E.; Grisolia, C. Deuterium retention in tungsten simultaneously damaged by high energy W ions and loaded by D atoms. Nucl. Mater. Energy. 2017, 12, 169–174. [Google Scholar] [CrossRef]
  65. Marquardt, N. Introduction to the principles of vacuum physics. Cern Accel. Sch. Vac. Technol. 1999, 1–24. [Google Scholar] [CrossRef]
  66. Sameshima, J.; Numao, S. Behavior and process of background signal formation of hydrogen, carbon, nitrogen, and oxygen in silicon wafers during depth profiling using dual-beam TOF-SIMS. Surf. Interface Anal. 2022, 54, 165–173. [Google Scholar] [CrossRef]
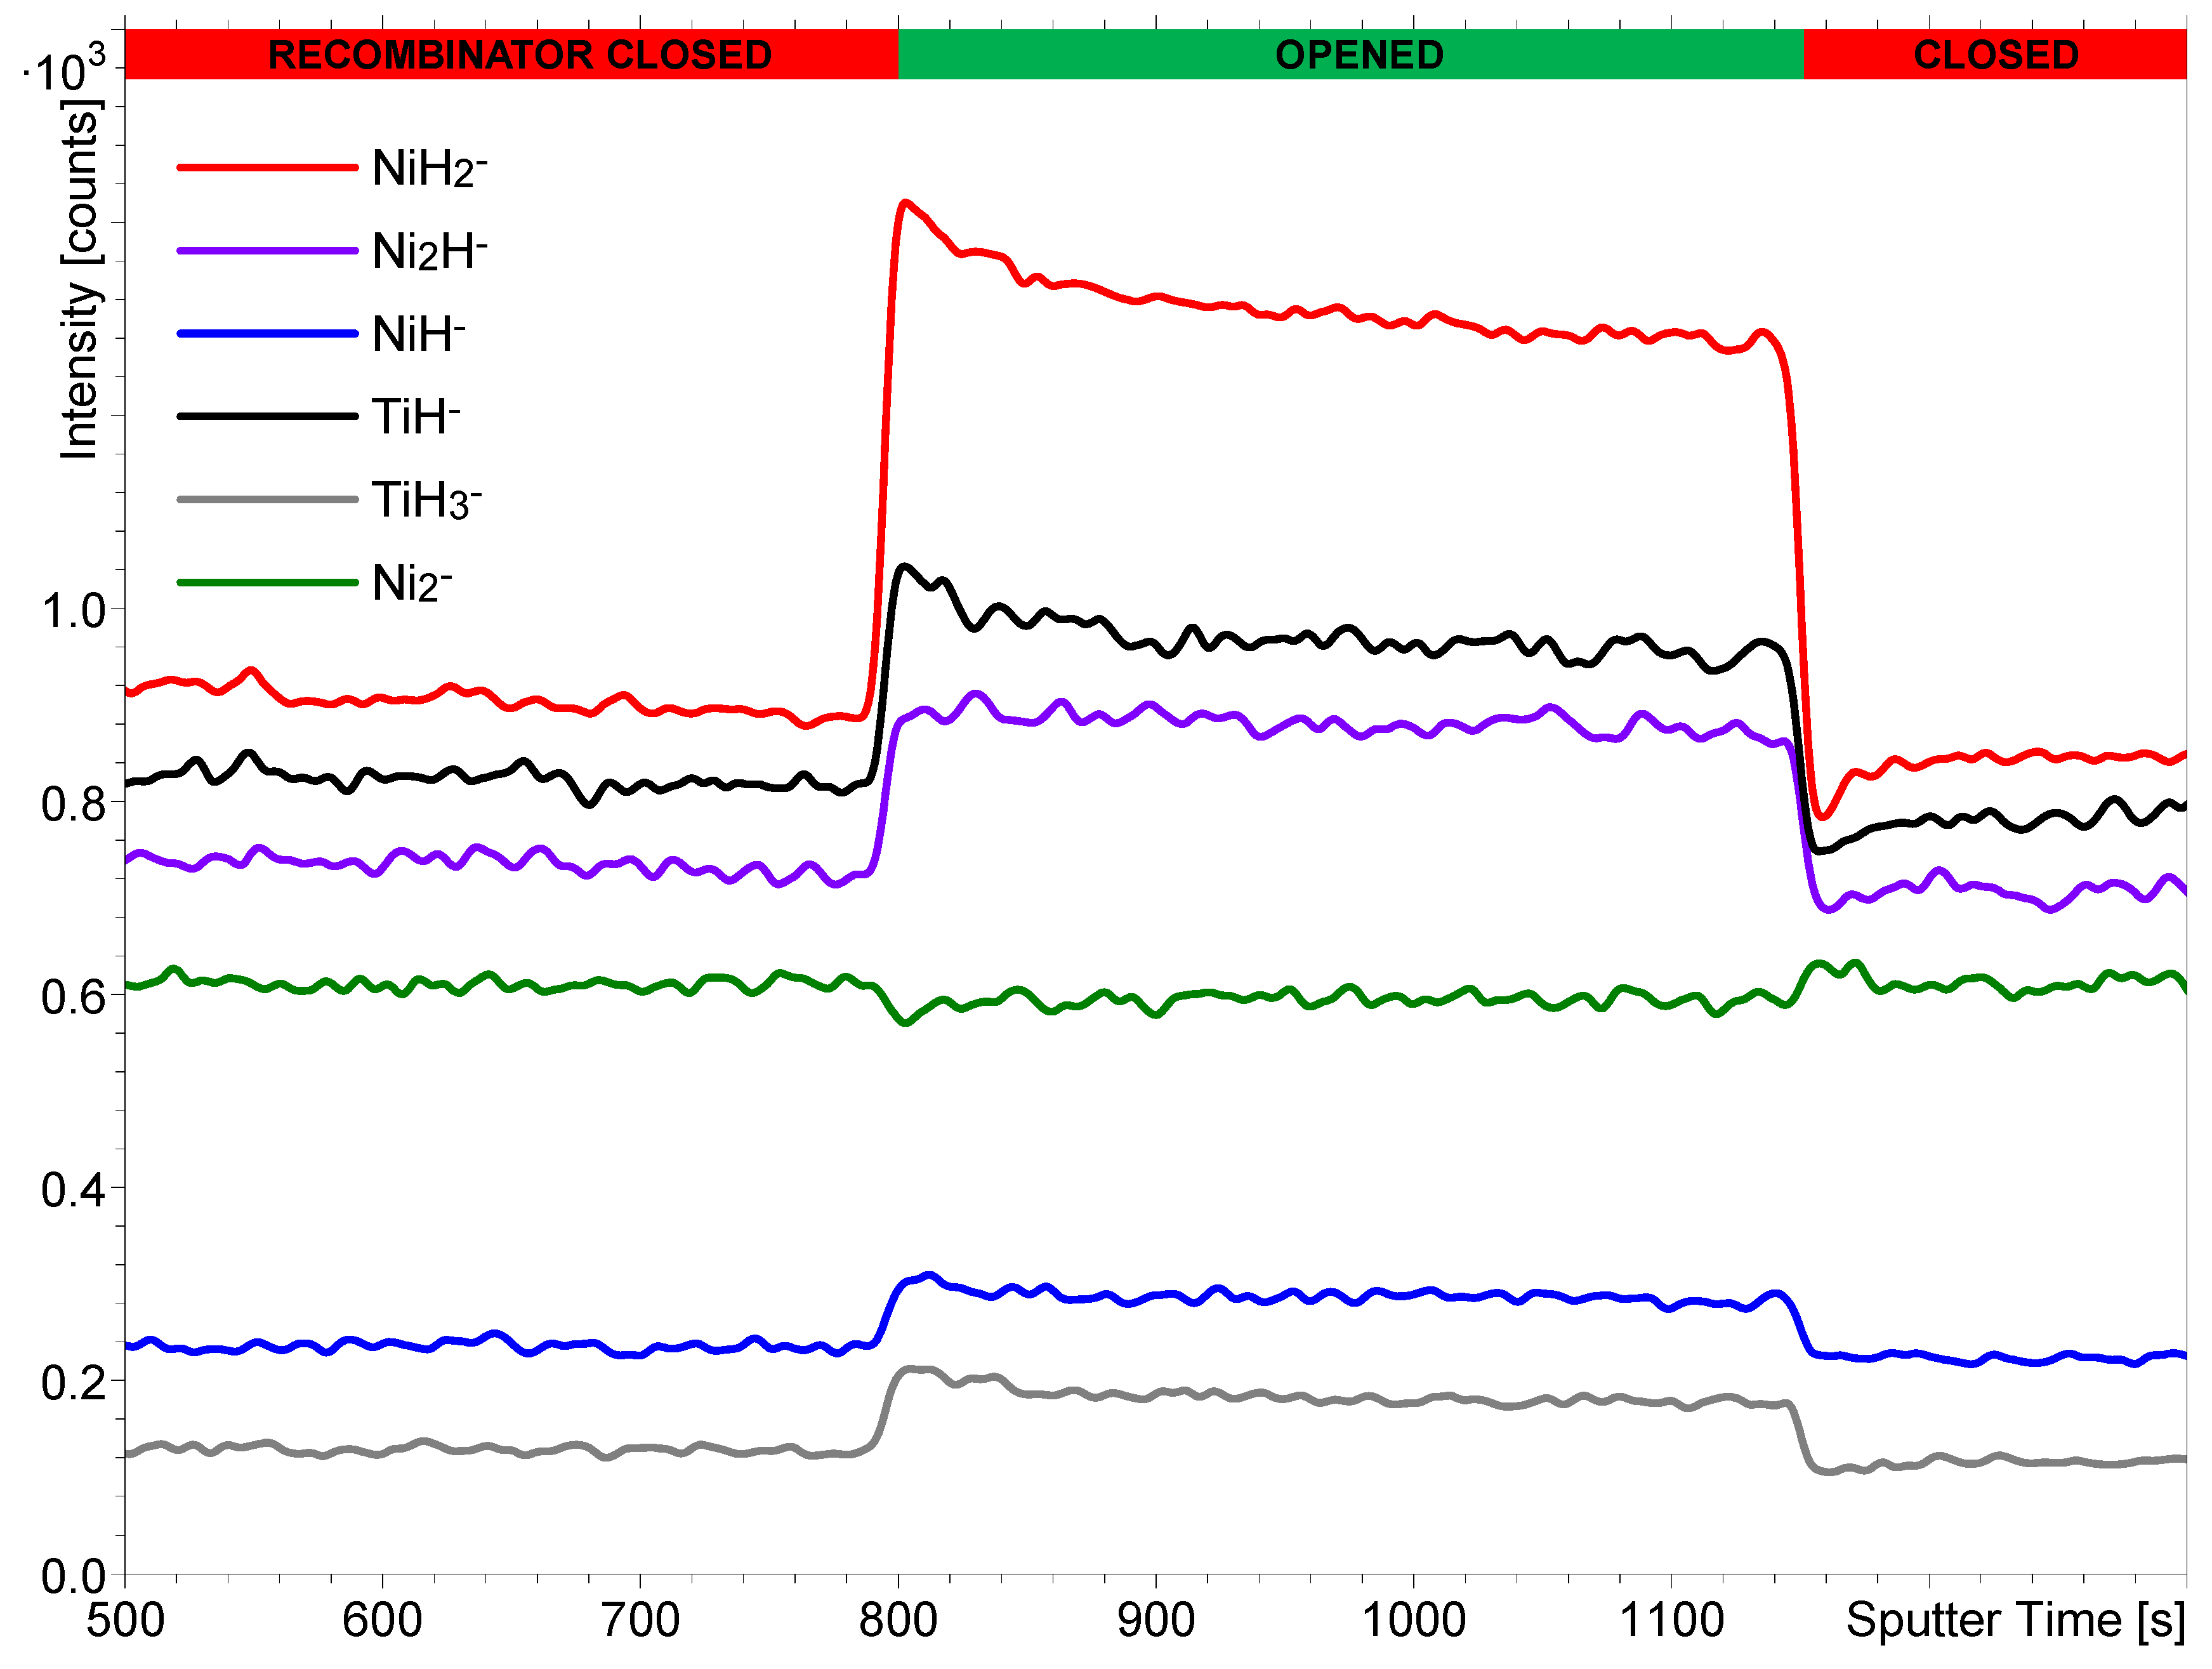
Figure 1. The intensity of different secondary ions in the SIMS depth profile from the NiTi sample as a function of opening or closing the recombinator in front of the hydrogen atom beam source. The profile was measured at the hydrogen pressure of 7 × 10⁻⁷ mbar and the hydrogen atom beam source power of 200 W. Sputter time on the x-axis corresponds to the measurement performed in the SIMS depth profiling mode, i.e. when using both Bi+ and Cs+ beams. The intensities of some of the secondary ions were multiplied by different factors to reduce the width of the y-axis.
Preprints 119319 g001
Figure 2. The normalized intensities of the NiH2, Ni2H, NiH, TiH, TiH3, and Ni2 ions integrated over the sputter times between 600 and 750 s (closed recombinator) and between 900 and 1050 s (opened recombinator) from the depth profile in Figure 1. Secondary ions were normalized by the total dose of primary Bi+ ions.
Preprints 119319 g002
Figure 3. The intensity changes of different hydride secondary ions from the stainless steel sample as a function of increasing the hydrogen atom beam source power from 0 to 200 W, and opening or closing the recombinator in front of the hydrogen atom beam source. The powers and the state of the recombinator are noted on the upper x-axis. The profile was measured at the hydrogen pressure of 7 × 10⁻⁷ mbar. The intensities of some of the secondary ions were multiplied by different factors to reduce the width of the y-axis.
Preprints 119319 g003
Figure 4. The intensities of Fe and Ni signals from the stainless steel sample in the m/z range from 55.7 to 60.2. The upper, red spectrum was measured between 1025 and 1175 s of the depth profile from Figure 3 (recombinator closed). The lower, green spectrum was measured between 1225 and 1375 s of that same depth profile (recombinator opened). The hydrogen pressure was 7 × 10⁻⁷ mbar and the power of the hydrogen atom beam source was 200 W.
Preprints 119319 g004
Disclaimer/Publisher’s Note: The statements, opinions and data contained in all publications are solely those of the individual author(s) and contributor(s) and not of MDPI and/or the editor(s). MDPI and/or the editor(s) disclaim responsibility for any injury to people or property resulting from any ideas, methods, instructions or products referred to in the content.
Copyright: This open access article is published under a Creative Commons CC BY 4.0 license, which permit the free download, distribution, and reuse, provided that the author and preprint are cited in any reuse.
Prerpints.org logo

Preprints.org is a free preprint server supported by MDPI in Basel, Switzerland.

Subscribe

© 2024 MDPI (Basel, Switzerland) unless otherwise stated