1. Introduction
The airport has been the hot-target of military attack owing to its large footprint, obvious targets and prominent military status, which can effectively neutralize the enemy’s capability to conduct air operations [
1]. Mainly composed of a surface layer, a base layer and a compacted soil layer, the airport runway is a typical layered structure [
2]. Although some studies proved that asphalt concrete surfaces could absorb the impact energy [
3], the concrete pavements is widely used in the airports due to the fact that the high temperature and aircraft load generated by takeoffs of jet airplanes can damage and deteriorate asphalt surfaces [
4].
Calcareous sand is a sediment primarily composed of the skeletal remains of marine organisms, with calcium carbonate accounting for over 97% of its weight [
5,
6]. It is widely found in the coral reefs of the Nansha Islands in the South China Sea and is characterized by high intragranular porosity, significant particle angularity, irregular shape, and a tendency to break easily [
7,
8,
9]. Moreover, calcareous sand exhibits higher apparent cohesion than quartz sand and demonstrates considerable load-bearing capacity after compaction [
10], making it an ideal backfilling material for the subgrade of airport runways in marine engineering. Additionally, due to the remote location of the South China Sea islands, using calcareous sand as a foundation material for island construction projects effectively reduces transportation costs and minimizes the reliance on expensive imported materials [
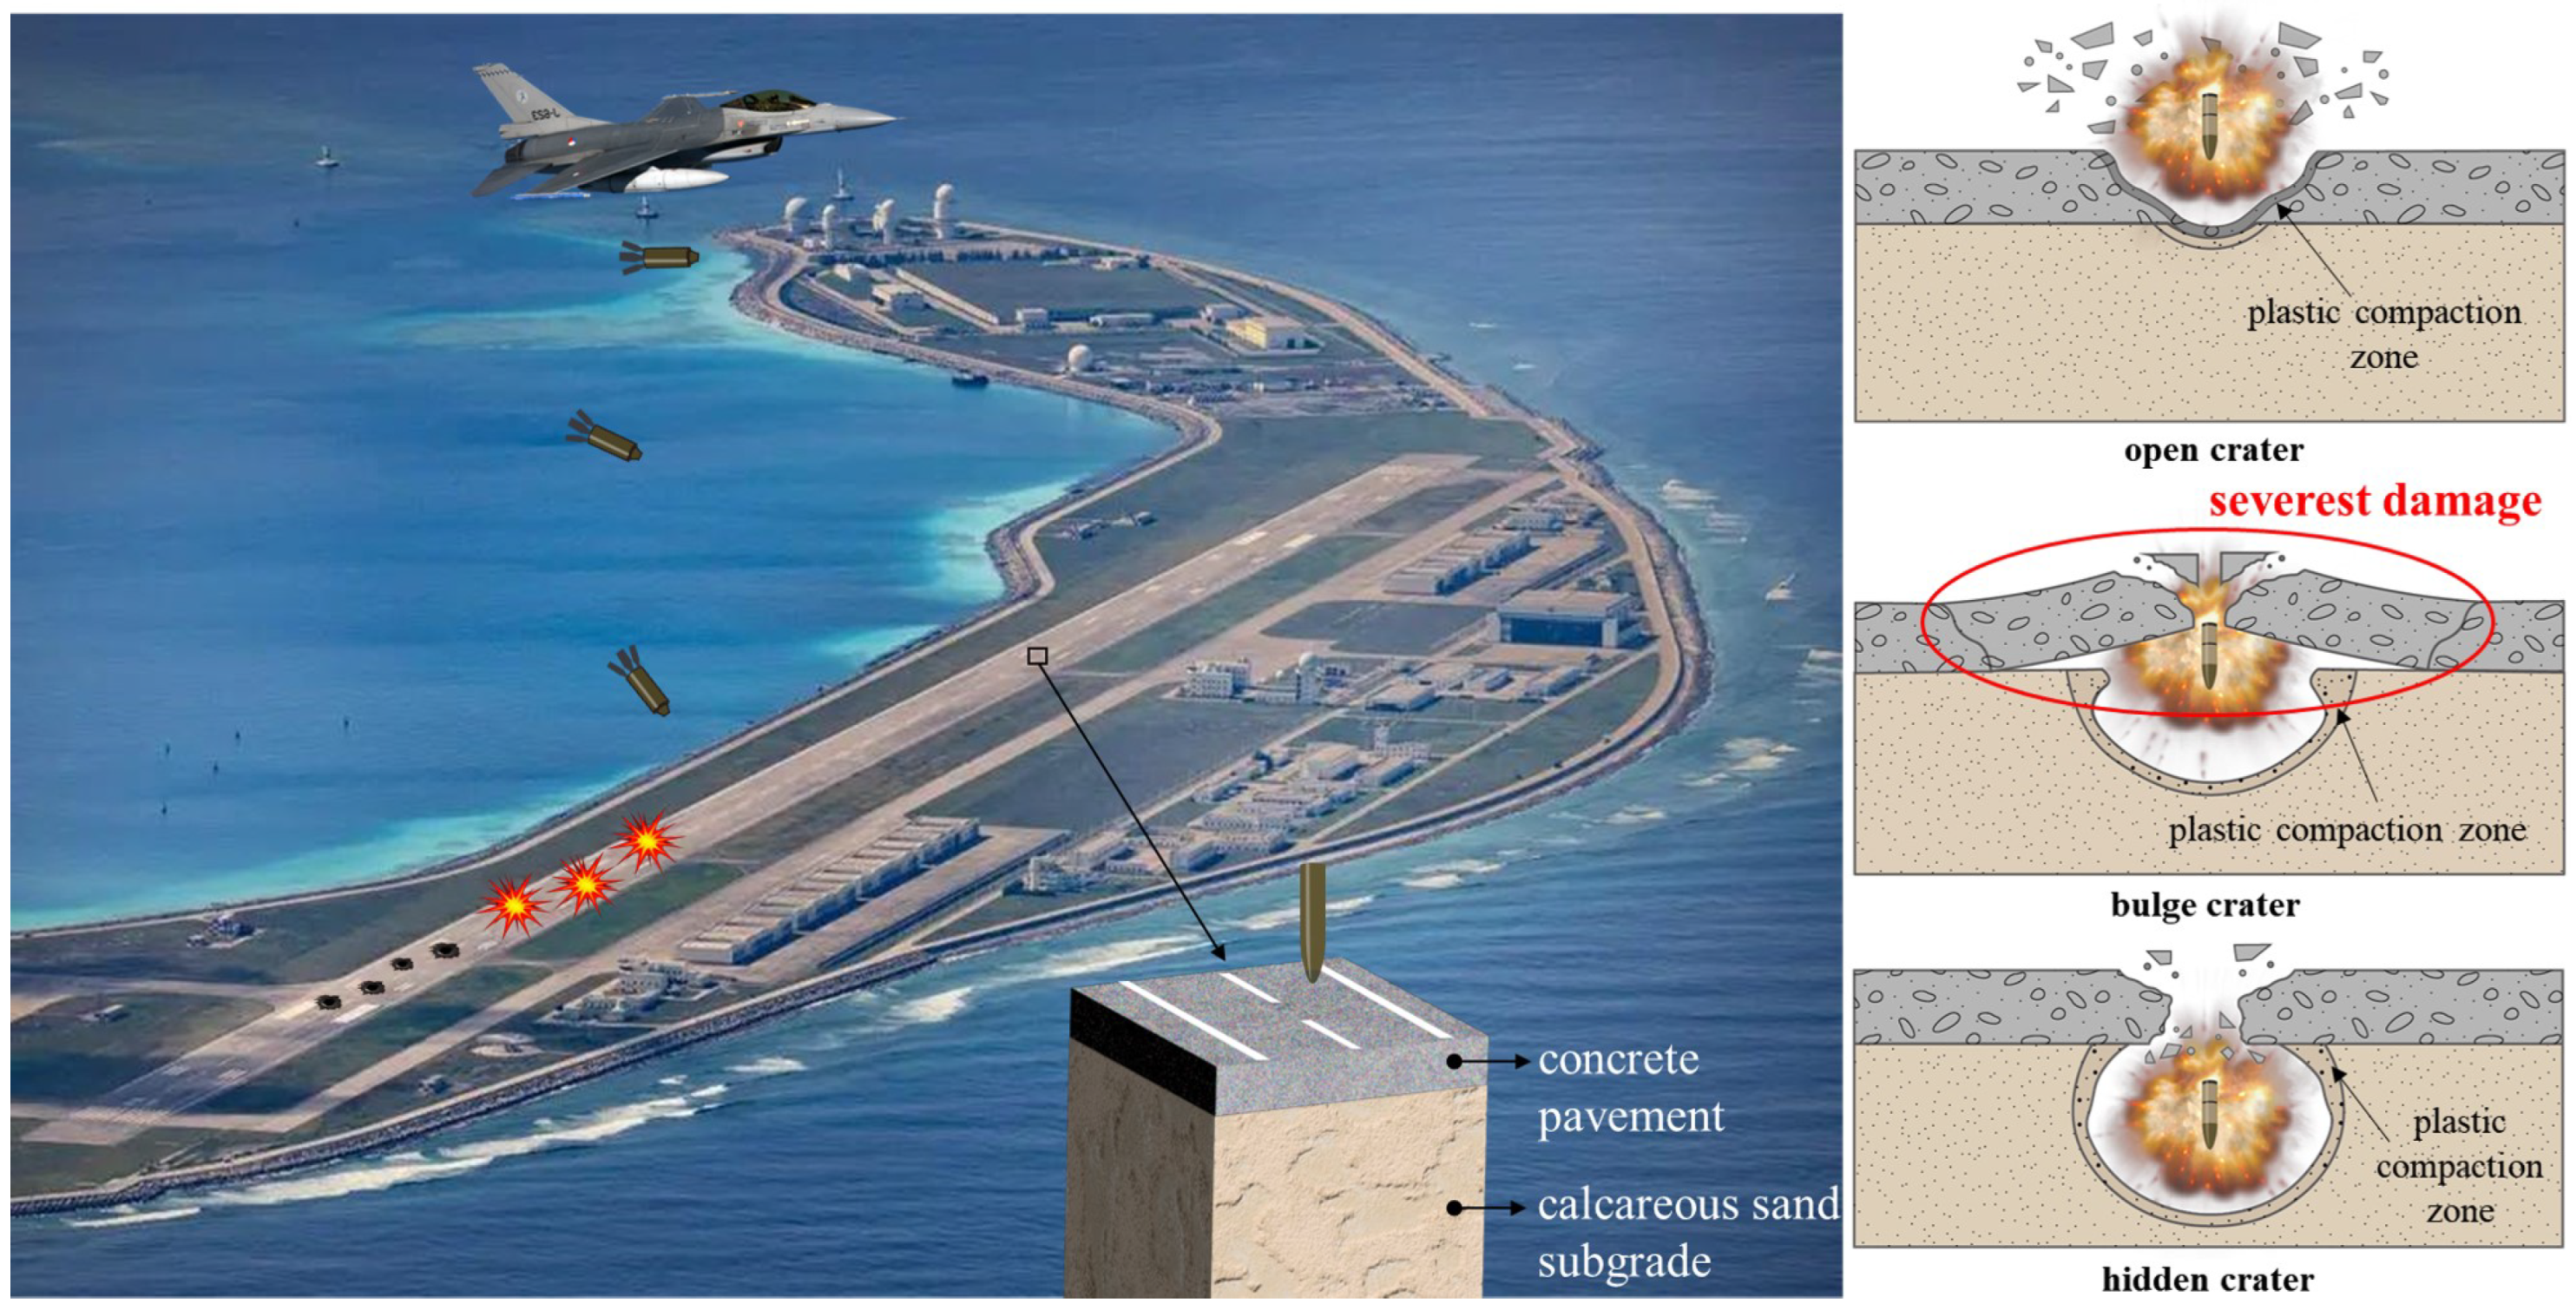
11]. It is believed that the island airport with calcareous sand subgrade runway pavement structure is vulnerable to cluster munitions, whereby the projectile penetrate to a certain depth with detonation as shown in
Figure 1. The firt stage damage composed of penetration is critical for the second stage internal explosion, which needs to be comprehensively studied for damage evalutation and munition optimization.
The destructive effect and impact resistance performance of airport runways structured with multi-layer pavements under impacting loads have been a significant area of research. Han et al. conducted the field penetration and blast tests on airport pavements subjected to blast loading from a cluster bomb unit and assessed the condition of damage by numerical simulation, suggesting the rapid hardening high-strength concrete for the damaged concrete pavements repair [
12]. Wu et al. developed a new muti-layer pavement system consisting of asphalt concrete layer reinforced with geogrid, high strength concrete layer and engineered cementitious composites layer, and the system was compared with conventional concrete pavements through field blast tests and numerical modeling, revealing that the new multi-layer pavement had better blast resistance [
3]. Zha et al. used the finite element simulation to compare the damage contours and dynamic responses of the anti-blasting asphalt pavement with a reinforced concrete layer and the conventional asphalt pavement, which showed that the additional reinforced concrete layer improved the blast resistance performance by about 20% [
13]. To investigate the damage of scaled-down target of the airport runway, Wei et al. carried out experiment and numerical simulation to analyze the destructive effect of static explosion of charge after penetration and explosion of prefabricated hole, which showed that the crater size produced by the former explosion mode was obviously larger than that produced by the latter under the same explosion depth and explosive charge [
14]. A three-dimensional graphics processing unit (GPU)-accelerated smoothed particle hydrodynamics (SPH) method was developed by Chen et al. [
15,
16], and was applied to the simulation of soil fragmentation and fracture propagation of the concrete-soil multilayered medium subjected to underground explosion involving millions of particles. Comparing with the experimental data, the SPH model was able to reproduce the damage pattern of concrete slabs with different depths of explosives burial. Although the dynamic impact responses of airport runway with multi-layer pavements has been extensively studied through experiments and numerical simulation, there is still a knowledge gap in the research on pavement structures with calcareous sand as the subgrade, which hinders the development of island infrastructure engineering.
As the pavement structure surface layer, the concrete panel or plate under the impactive loading conditions has been extensively studied [
17,
18,
19,
20]. The experiments and numerical simulations of the structural behavior of full-scale reinforced concrete slabs under blast loading were conducted by Castedo et al. [
21], finding that the addition of steel fibers or polypropylene fibers to concrete slabs could effectively improve the tensile strength and blast resistance compared to simple reinforced concrete slabs. Feng et al. introduced the impact resistance theory to establish a semi-empirical analytical model for projectile perforation on steel-concrete-steel sandwich panels and an analytical model for perforation on steel-concrete panels, respectively, to predict the residual velocities and the target damage patterns, analyzing the dynamic response of the projectile on concrete-steel panels of different thicknesses [
22,
23]. The fiber reinforced concrete runway pavement proposed by Ali et al. [
24] was proved much better than the normal concrete pavement, and the researchers came up with finite element model to analyze the performance of improved concrete runway pavement under impact loading based on the results of drop weight impact test. Hardened steel ovoid nose projectiles with 19 mm diameter and 3 caliber-radius-head of 0.5 and 1 kg mass and 11.8 and 23.7 length-to-diameter ratios were used to impact plain and reinforced concrete targets in conjunction with numerical simulations in order to find out the behavior of the concrete against the impact loading as well as to explore the length-to-diameter ratio of the projectile effect on the ballistic performance [
25].
Discrete Element Method (DEM) has been widely adopted to quantitatively analyze the deformation and damage processes occurring in concrete or geotechnical materials under both macro and micro mechanical regimes [
26,
27]. The unique advantage of DEM is that it is independent of numerical mesh and allows large deformation and fracture of particles from the microscopic layer without deformation constraints, which is suitable for dealing with discontinuous problems [
28,
29]. Geng et al. applied DEM to analyze the infiltration distribution changes of tailings slopes and tailings landslides in different rainy seasons by constructing discrete units with specific elastic modulus and strength properties with the combination of the conversion formulas for the discrete units and numerical simulation experiments, realizing the automatic modeling of the discrete units [
30]. Mechtcherine and Shyshko presented a numerical approach based on DEM to establish a link between the yield stress of the simulated concrete and the model parameters as a parametric reference for modeling the behavior of fresh concrete in different working processes, which showed that the numerical analysis agreed well with the final shape of the concrete in the slump-flow test [
31]. DEM can also be used to study the physical process of impact-induced rock fragmentation in rockfall analysis [
32]. A normal impact fragmentation model of synthetic spherical rock block under different impact loading rates was carried out by Shen et al. [
33], which could reproduce the whole process of rock fragmentation under the impact, being in good agreement with the experimental observations. Geng et al. used matDEM software to develop an asteroid impact sampling model under microgravity conditions to explore the effects of the initial impact velocity and projectile shape on the internal characteristics of regolith and ejecta after impact, verifying the feasibility of discrete element simulation of the impact process [
34]. Lattice Discrete Particle Model (LDPM) was proposed to simulate concrete at the aggregate level and characterize the formation and evolution of cracks in concrete under loading, investigating the structural size and geometry effect on the strength and fracture process of concrete, which was proved to have a good agreement with experimental data and performed well in the prediction of splitting test results [
35]. Therefore, it is advisable to apply DEM to model and investigate the dynamic responses of the airport runways with concrete and calcareous sand layers with matDEM as an effective tool.
Over the past decades, extensive research has been conducted on the damage caused by various weapons to airport runways [
36]. However, nowadays, the use of cluster munitions to create multiple craters on the runways, achieving the blockade of airports, has become the primary attacking strategy [
37]. Based on the analysis of the crater characterization and the mechanism of implosion in the runways obtained from the experiments and simulations, the damage modes of implosion in airfield runways can be classified into three categories: open crater mode, bulge crater mode and hidden crater mode [
38], as shown in
Figure 1. In particular, for anti-runway munitions, the bulge crater, cuased by explosion near interface, is the severest damage of the above three destruction modes, creating a relatively long blockade of the runway and being the most difficult and time-consuming to repair. Hence, the critical striking velocity corresponding to the interface location DOP is deemed to be the optimal penetration scenario.
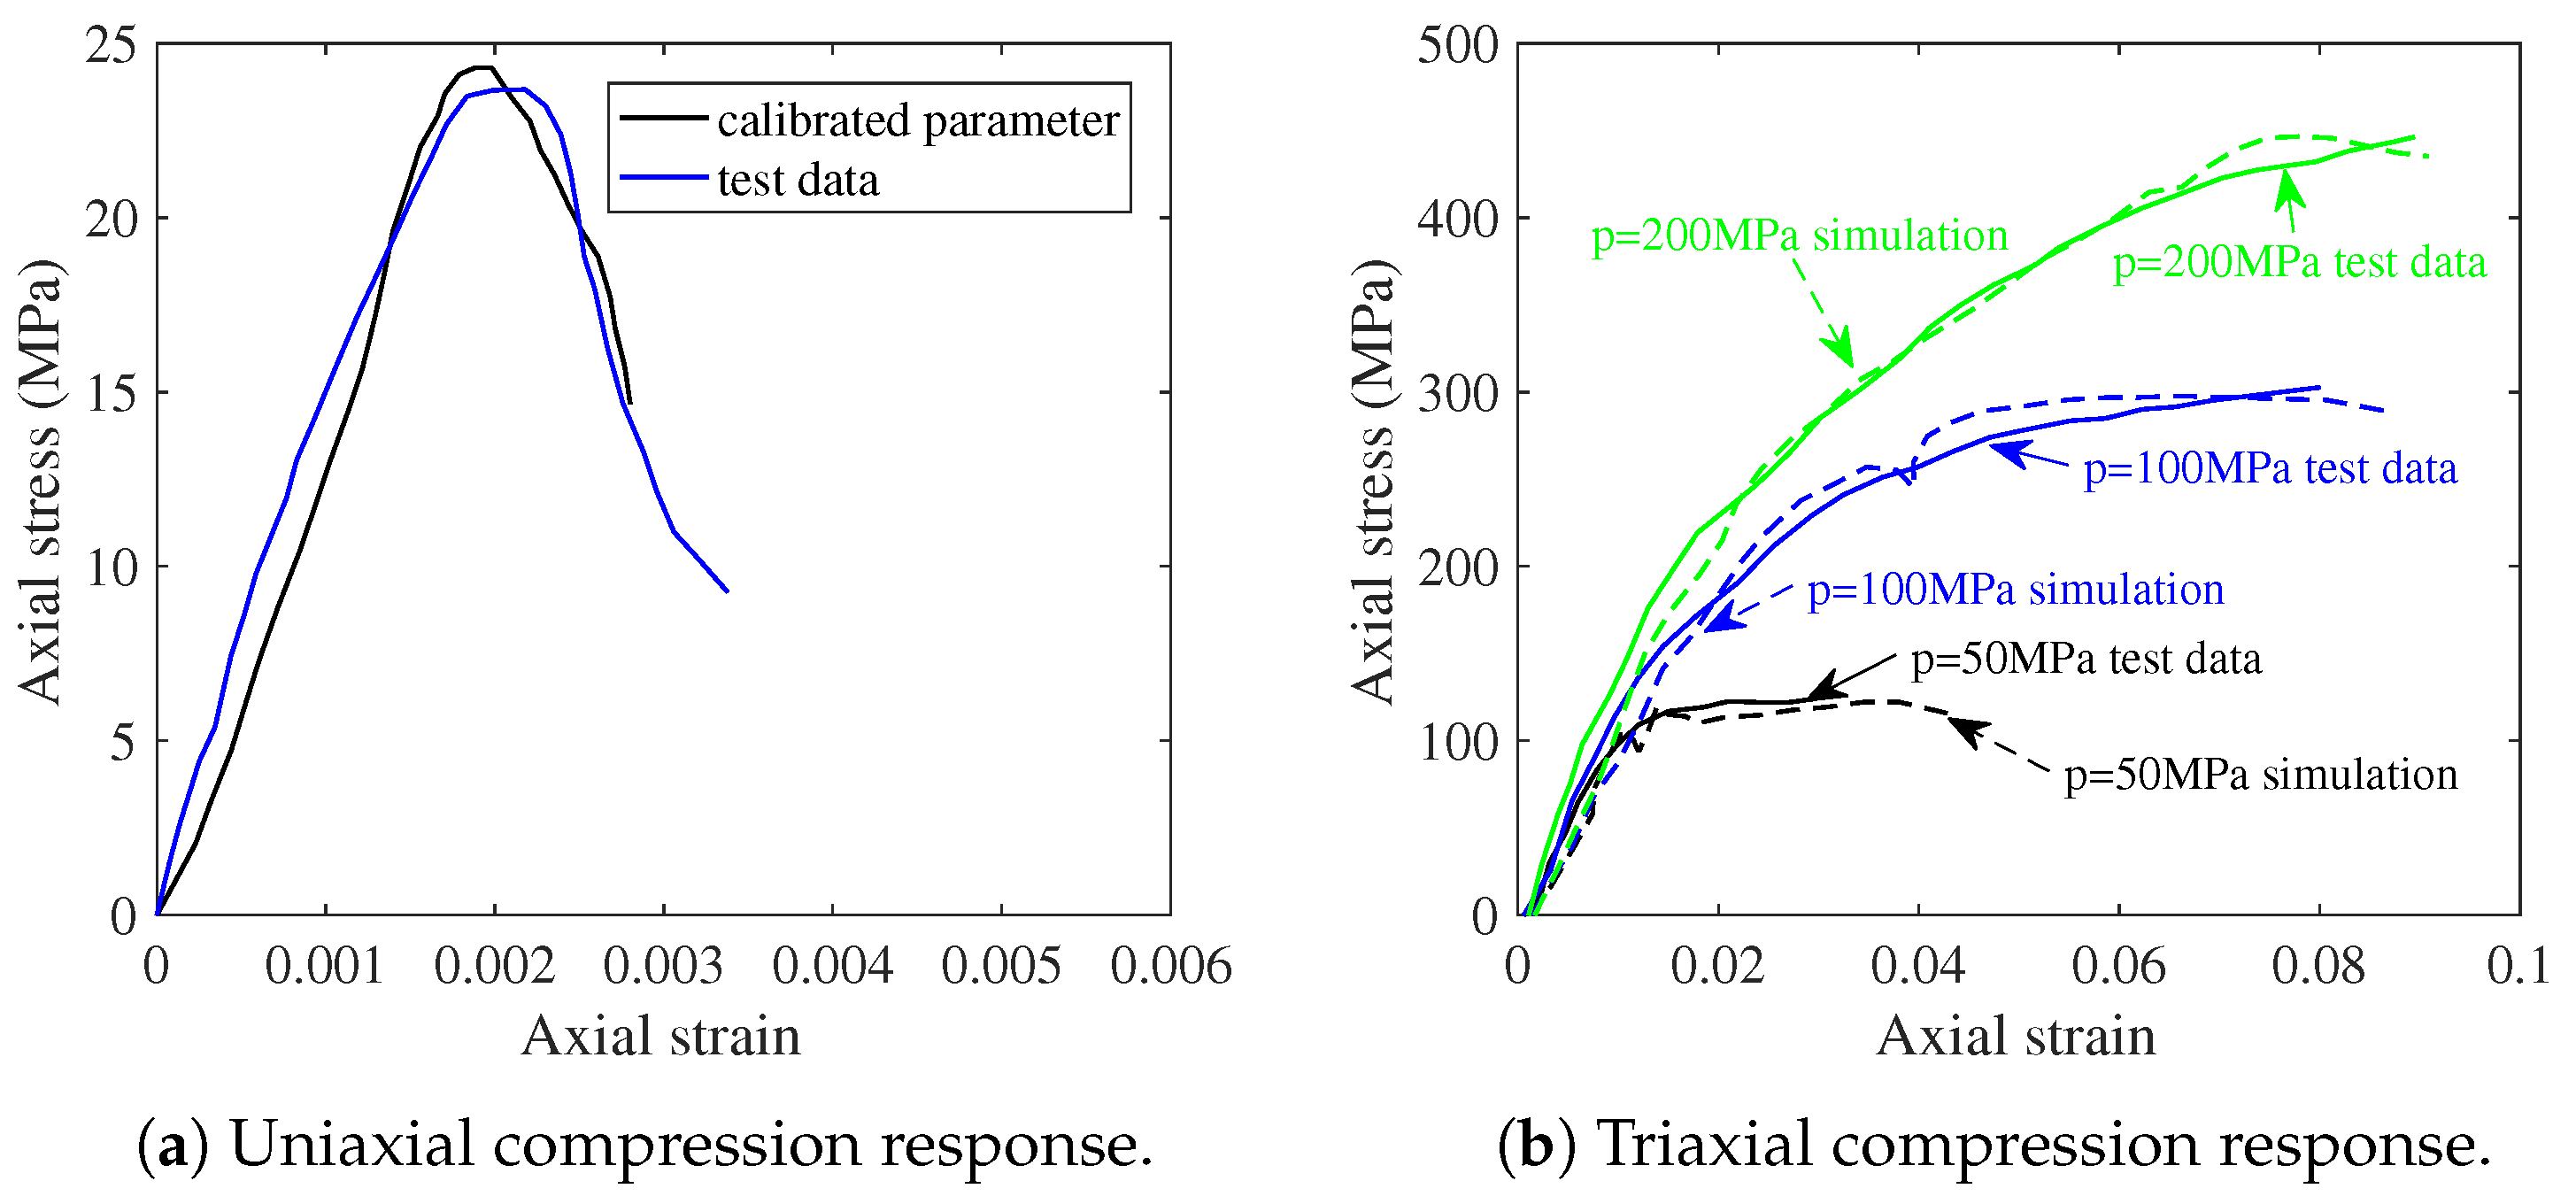
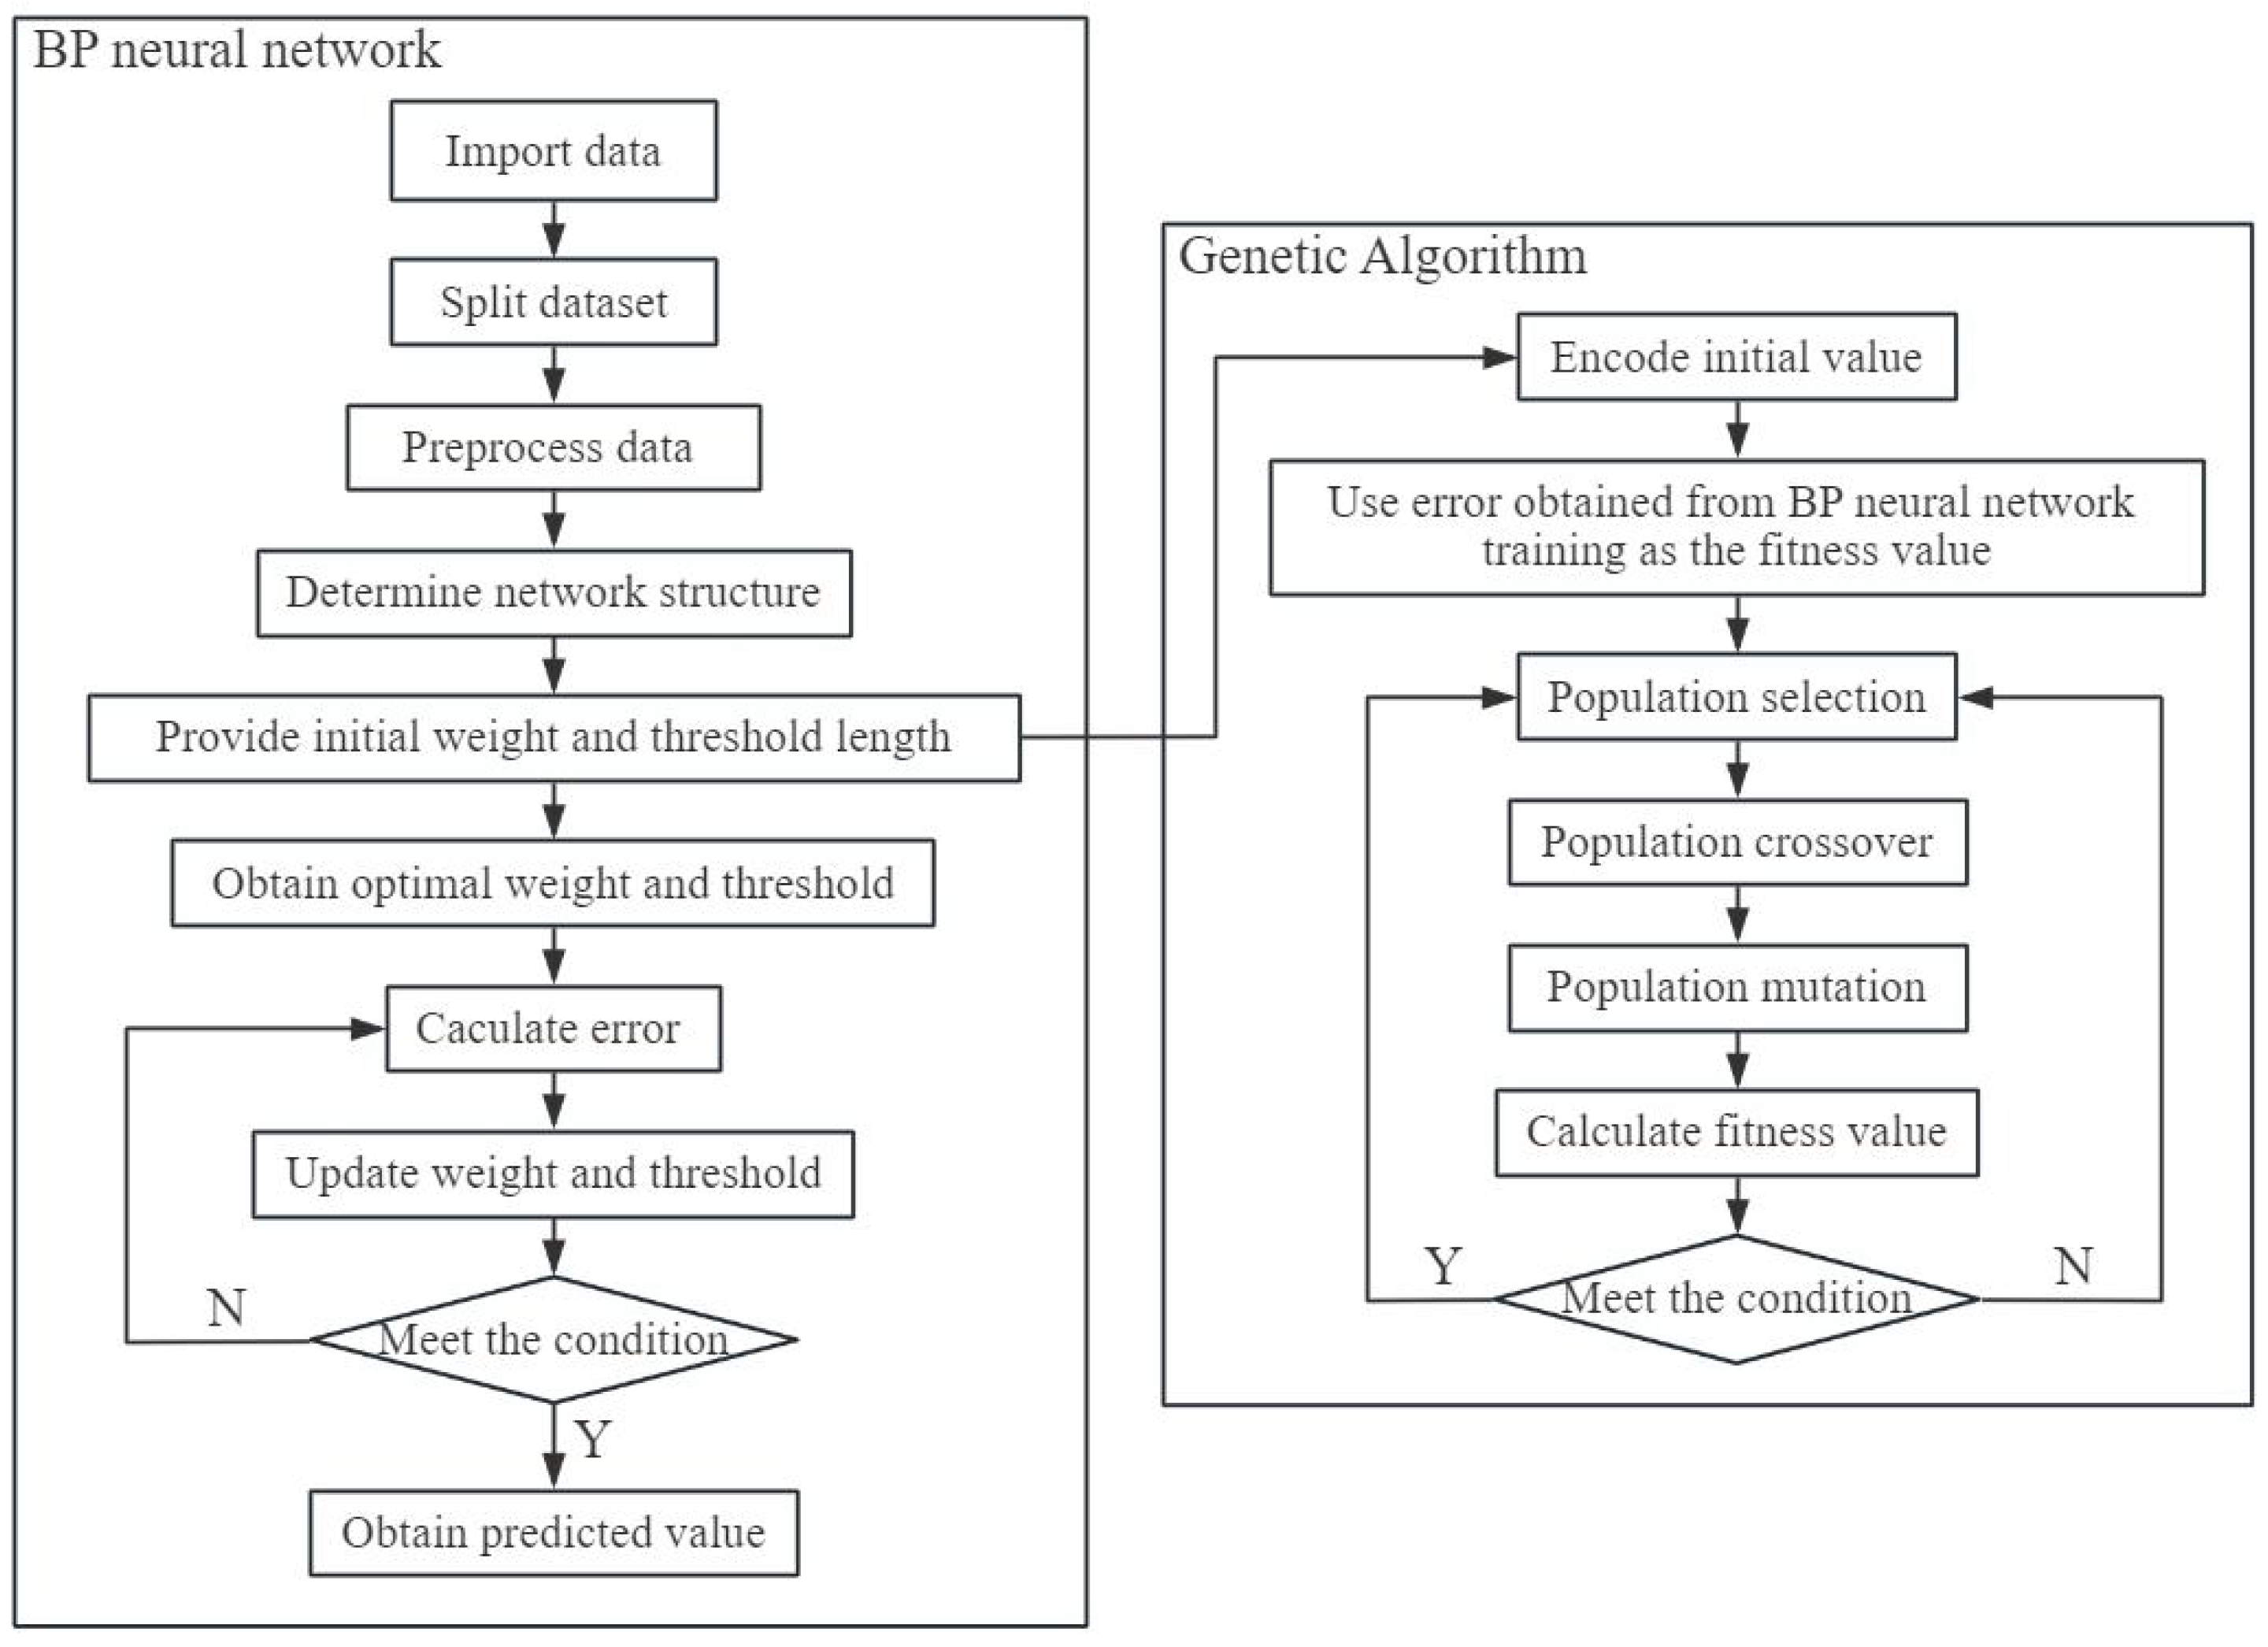
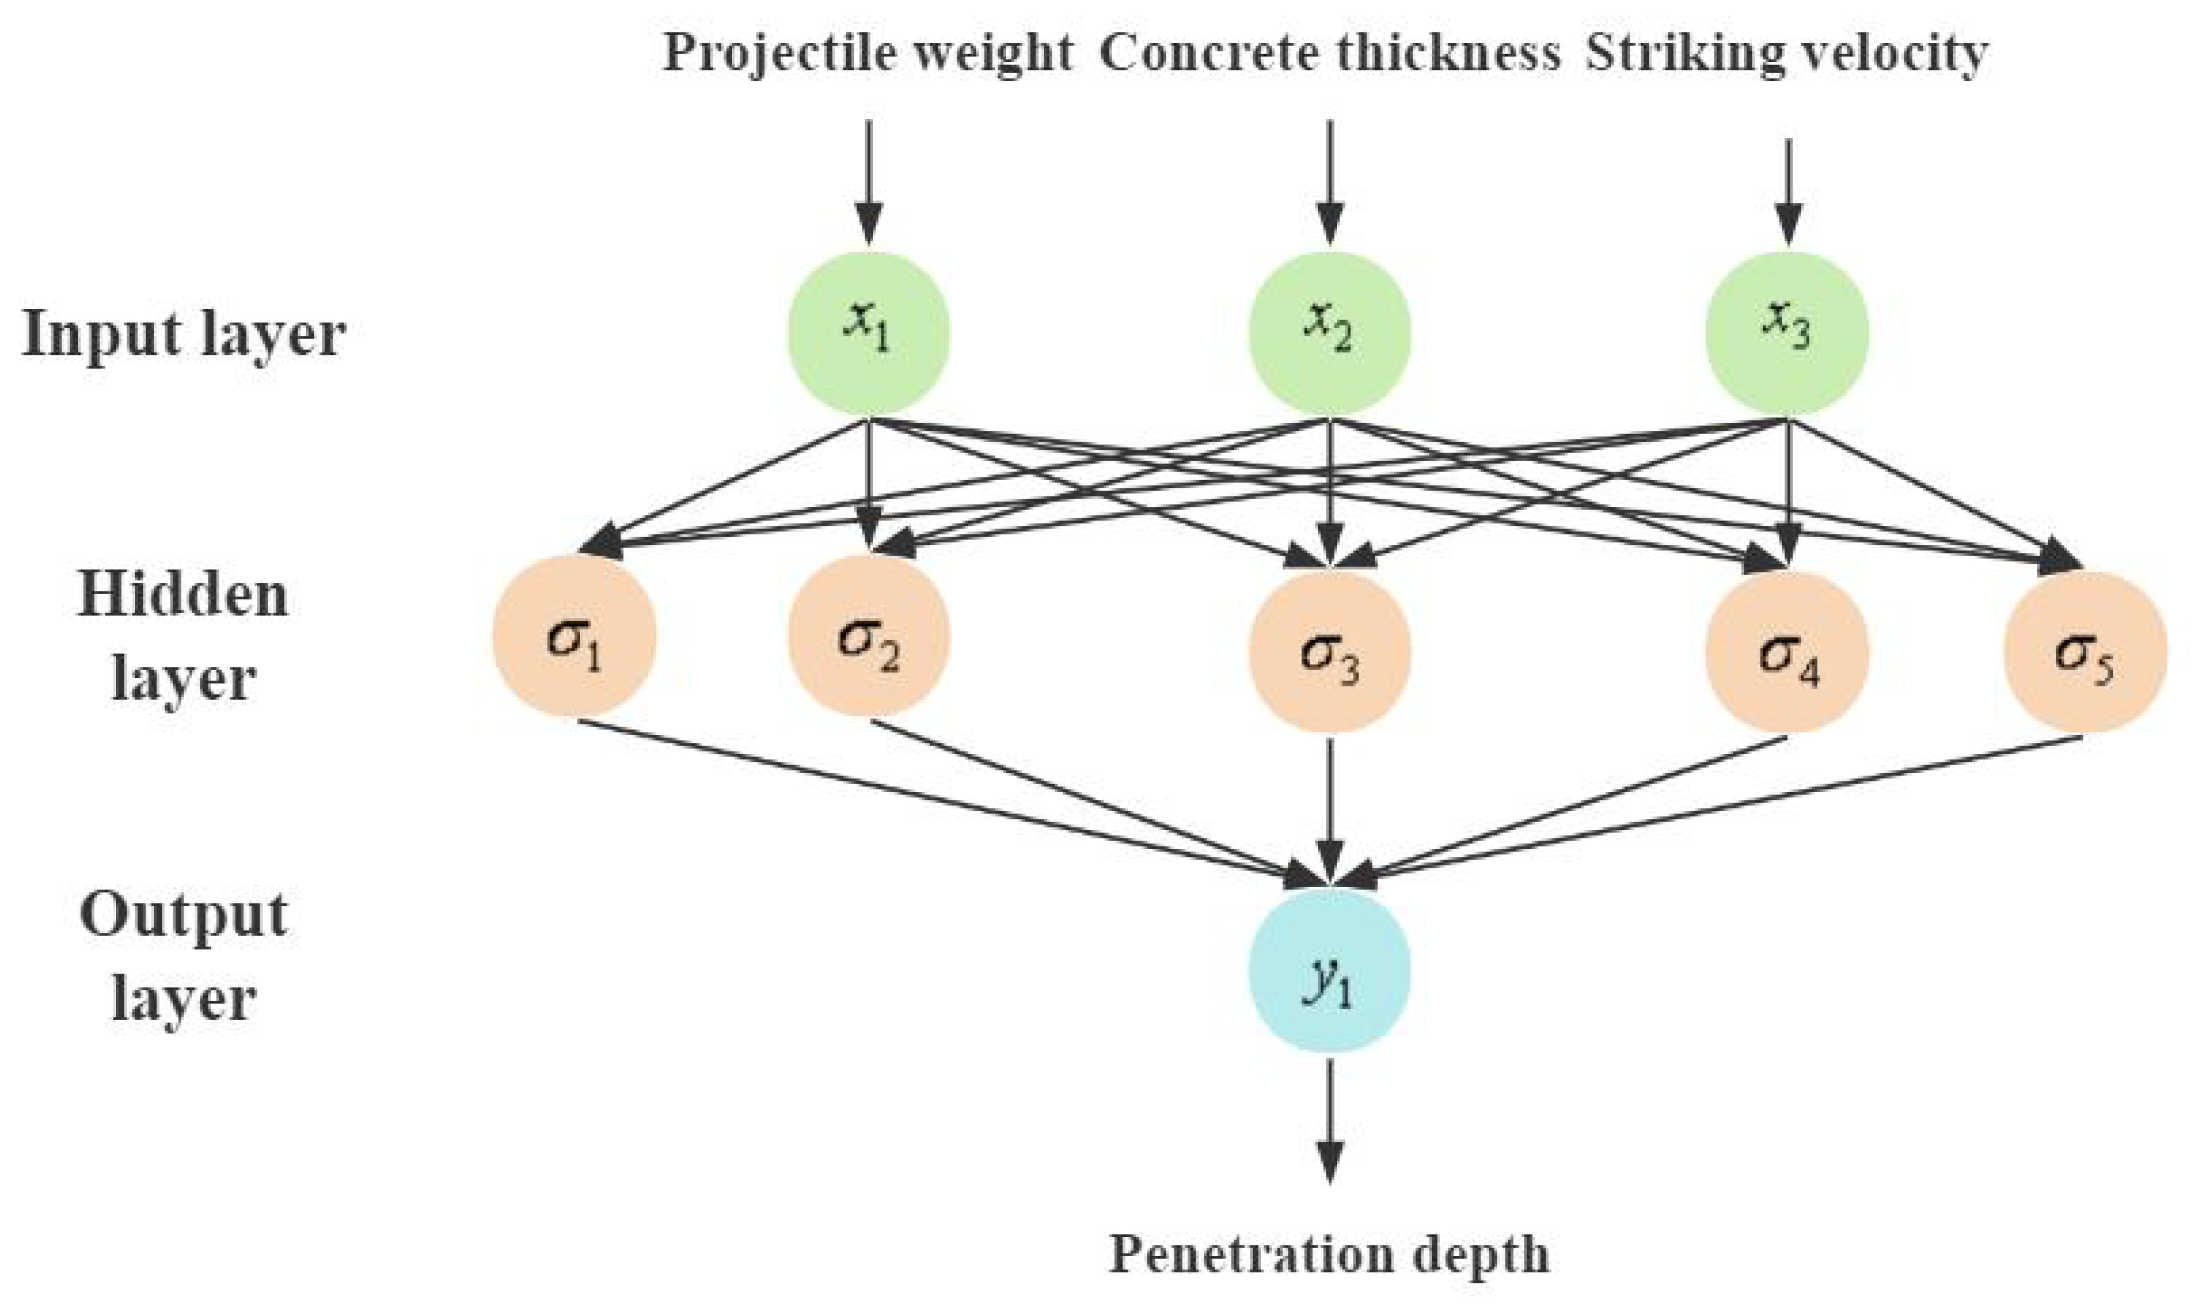
In order to assess the damage effects of island airport runway pavements under projectile penetration, this paper adopted DEM simulation to numerically model the penetration of rigid projectiles into runway pavements with calcareous sand subgrade. The material parameters were calibarated with uniaxial compression and triaxial compression tests for sequent penetration model validation. Furthermore, the penetration depth of airport runway structures with concrete pavement and calcareous sand base were numerically evaluated. Combining with back-propagation (BP) neural network and genetic algorithm, the critical velocity of airport runway penetration was predicted via intelligent optimization of pavement penetration. The results may shed some light on damage assessment as well as anti-airfield runway cluster munitions design.
3. Pavement Structure Penetration Simulation
Given the specific characteristics of the airport runway, the penetration process is divided into two distinct phases: the concrete penetration phase and the calcareous sand penetration phase. In this section, the previously validated DEM model was employed to conduct numerical simulations of runway pavement penetration with various striking velocities and concrete thicknesses, with the aim of providing a comprehensive assessment of the airport runway structure under impact.
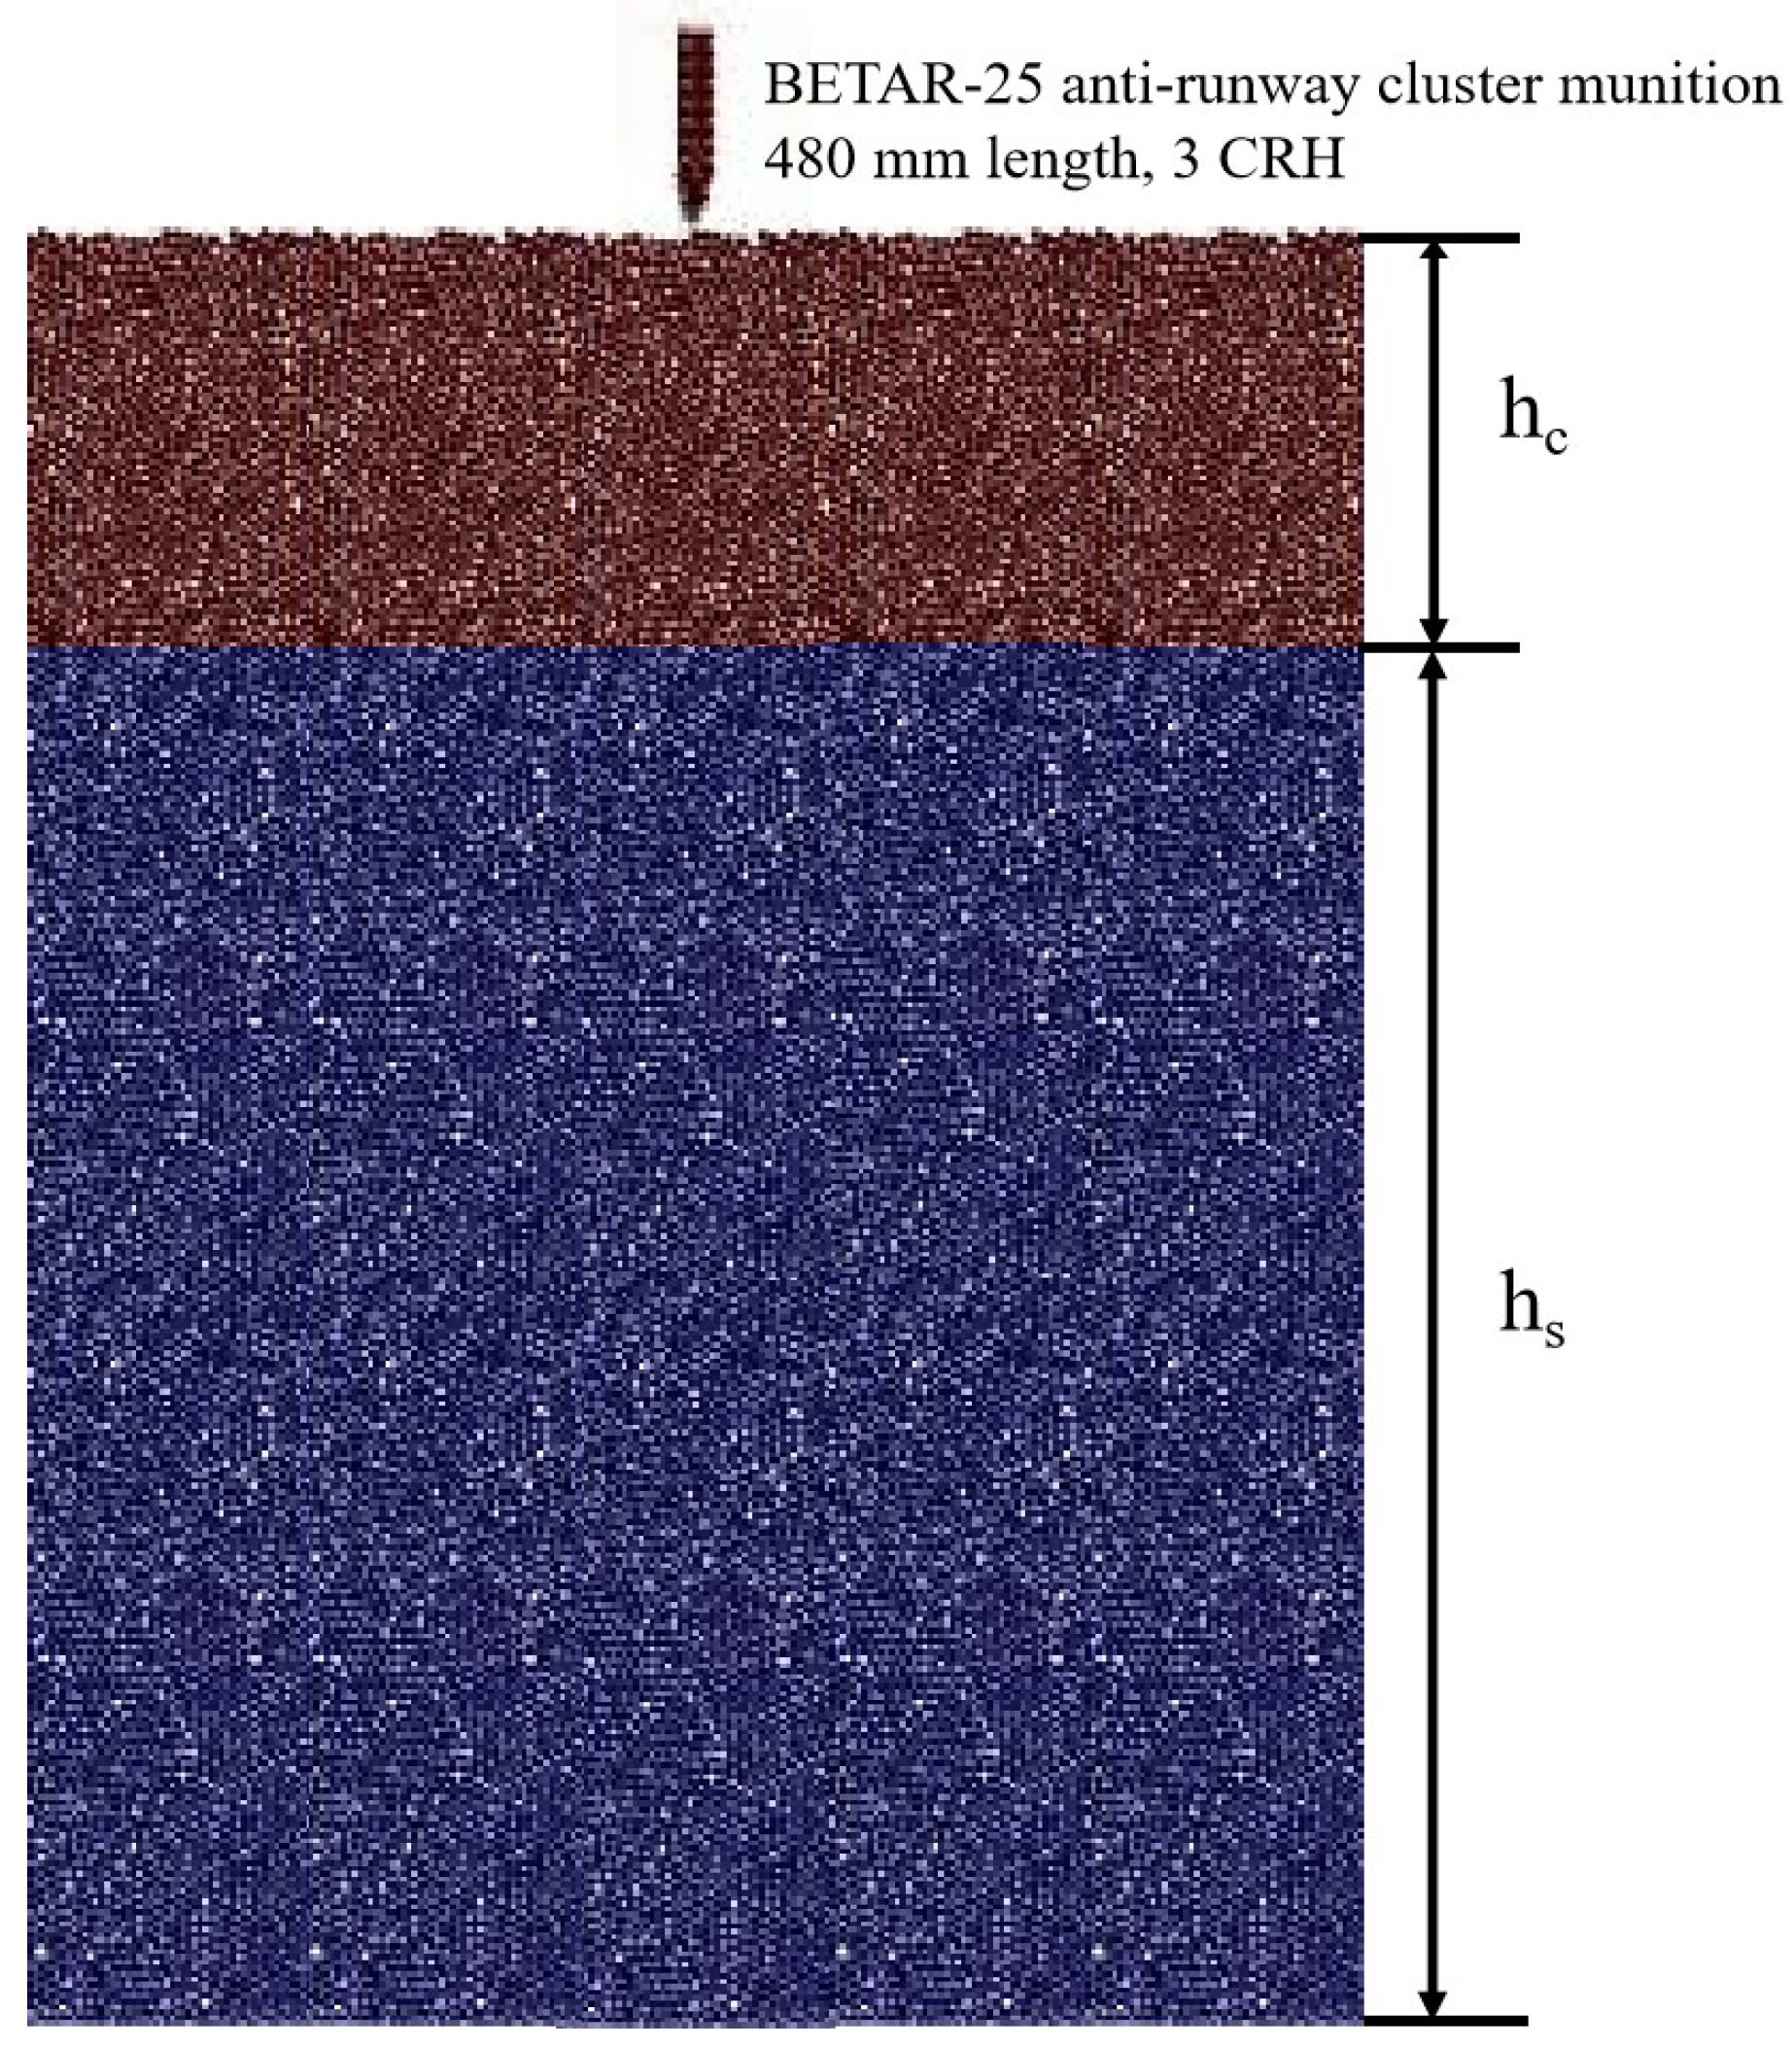
The model of projectiel penetration into airport runway pavement structure is depicted as
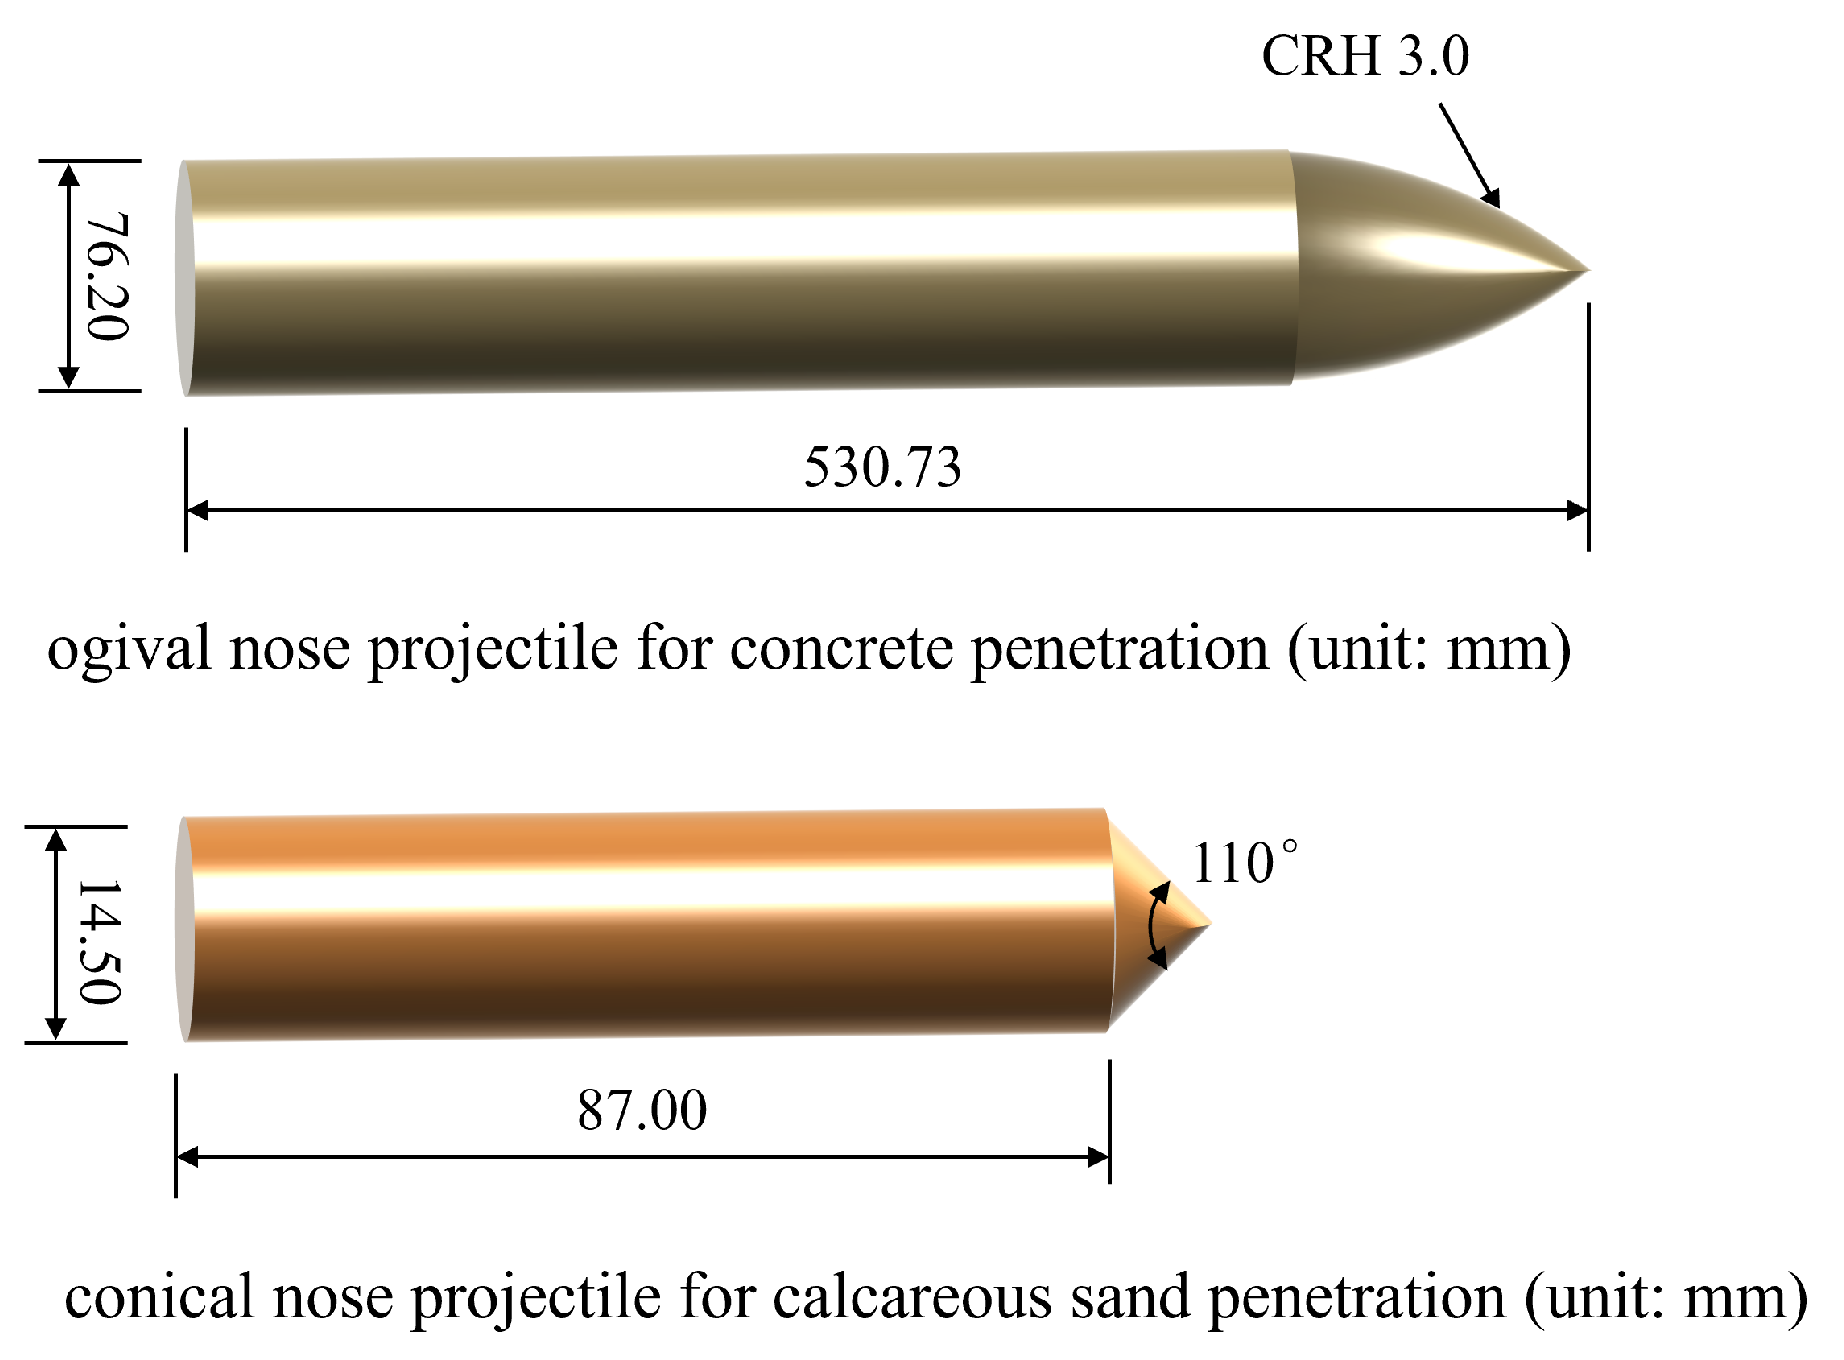
Figure 10. In this paper, the Russian-made BETAR-25 anti-runway cluster munition was selected for numerical simulation, with ogival nose projectile body with a total weight of 9-13 kg, a diameter of 76 mm, 3.0 CRH, and an overall length of 480 mm [
50]. With stricking velocity of 170 m/s-280 m/s, the projectile is supposed to impact the target with normal penetration.
The island airport runway model was constructed as a two-layer composite structure with a concrete layer for the surface and a calcareous sand layer for the base, measuring 1.8 m × 1.8 m area, with lateral constraints. The model particles were randomly generated using Fuller’s coefficient 0.5 in the range of aggregate particle size of 5-15 mm.
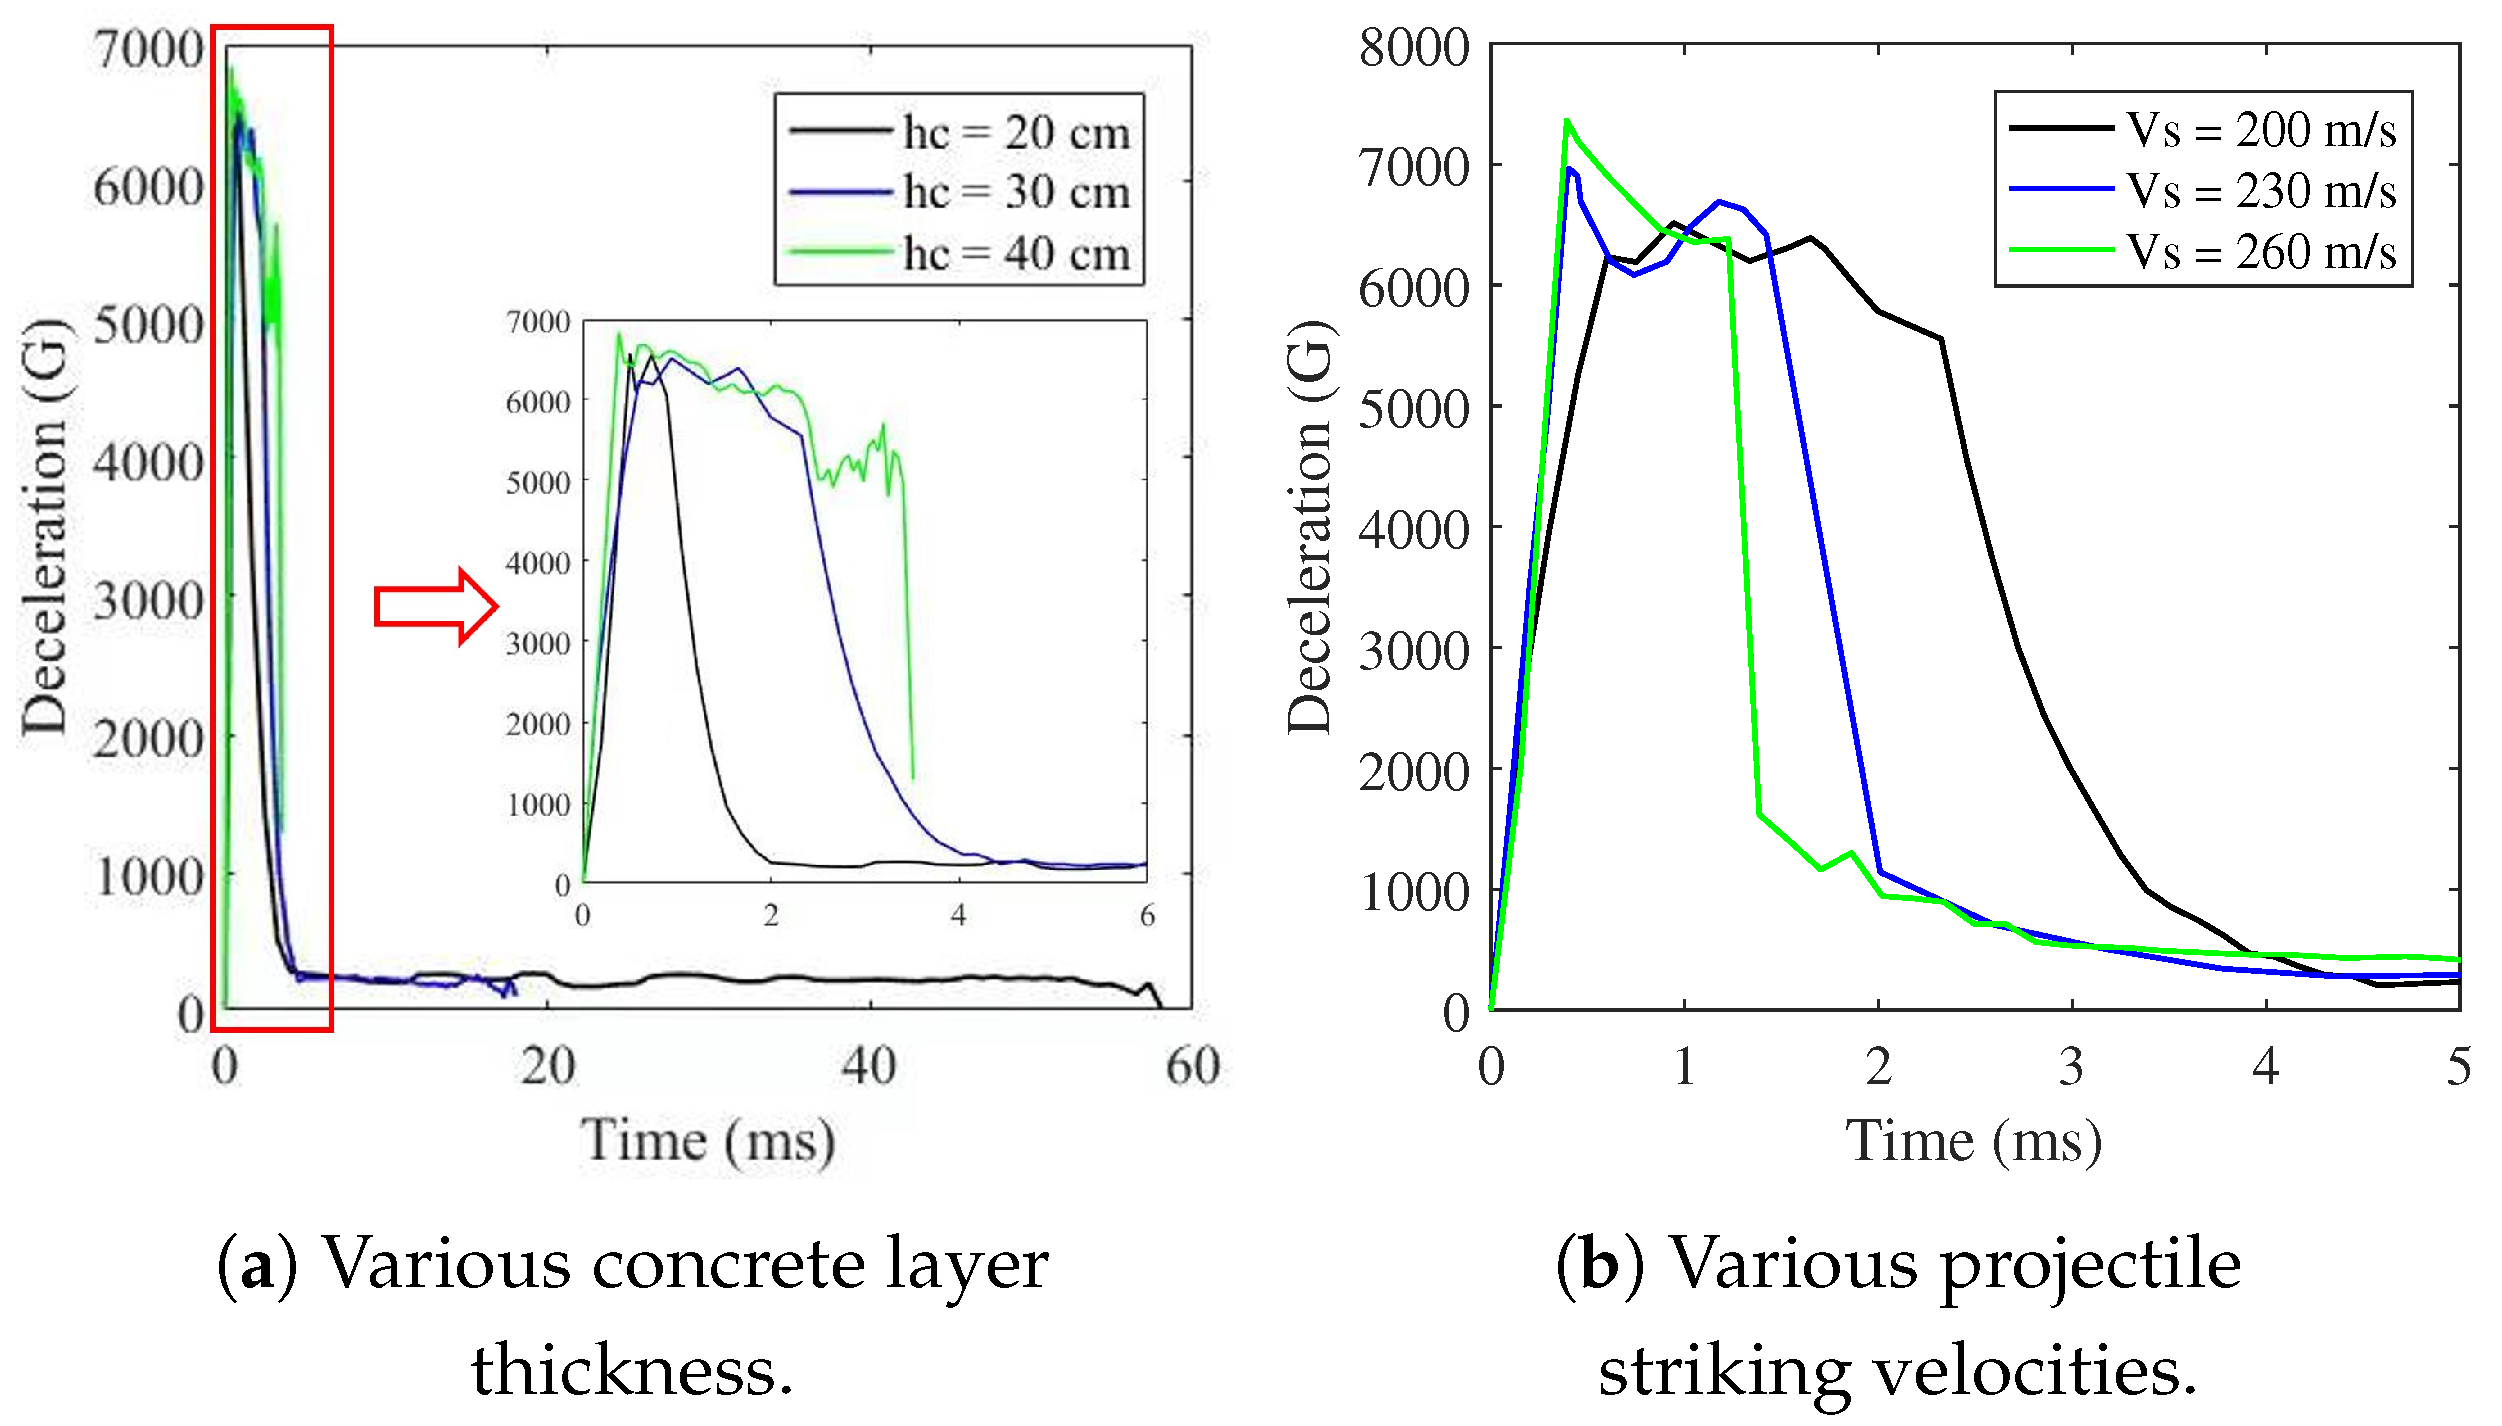
Table 5 shows the simulation results of DOP of various velocities of projectile and thickness of concrete layer. Among all the results, three representitive striking velocities (200 m/s, 230 m/s and 260 m/s) as well as three different concrete thickness (20 cm, 30 cm, 40 cm) have been selected and plotted in
Figure 11 with 3 different colors. During the surface penetration phase, the velocity of the projectile into the concrete decreased while the deceleration initially increased. As the resistance reached its maximum value, the deceleration also peaked and was maintained in a short plateau period with slight fluctuations. However, as the projectile penetrated deeper, it was subjected to the resistance, leading to the decline of velocities and decelerations. After entering the calcareous sand layer, which offered significantly lower resistance than concrete, the reduction in velocities became slow down. In addition, when the projectile navigated through the pit-opening stage in the calcareous sand layer, the deceleration rose slightly, and after the pit-opening stage, the resistance acting on the projectile head became smaller due to the degradation of the tensile stress between the surface of the projectile body and the calcareous sand particles [
45]. On the other hand, the lower striking velocities further reduced the resistant force. These two main factors both contribute to the decrease of the deceleration at a low rate and the stabilization with slight fluctuations.
Since the impact velocity and mass of the projectile were constant, the peak of the deceleration curves remained almost unchanged regardless of the target thickness, although thicker targets led to longer penetration durations. However, the projectile was unable to penetrate the concrete layer at a thickness of 40 cm. Variations in striking velocities resulted in changes to peak deceleration, with higher velocities producing greater peak deceleration values and shorter penetration durations.
5. Concluding Remarks
It is of great interest to assess the damage of the island airport pavement with multi-layer structures under impact loading. In this study, DEM was employed to model rigid projectile penetration through runway pavements composed of concrete and calcareous sand, with the model calibrated using uniaxial and triaxial compression tests. The critical impact velocity causing maximum explosion damage was determined using GA optimization via GABP proxy model. The main conclusions are drawn as follows:
(1) Based on analysis of normal and shear interactions between adjacent particles by DEM, the numerical model for hard projectile penetration on concrete and calcareous sand targets could be validated against the test data.
(2) Deceleration history of projectile penetration in concrete pavement and calcareous sand subgrade multi-layer structure suggested a pulse due to concrete layer peforation resistance which is followed by a long tail resulting from low strength calcareous sand medium static resistance.
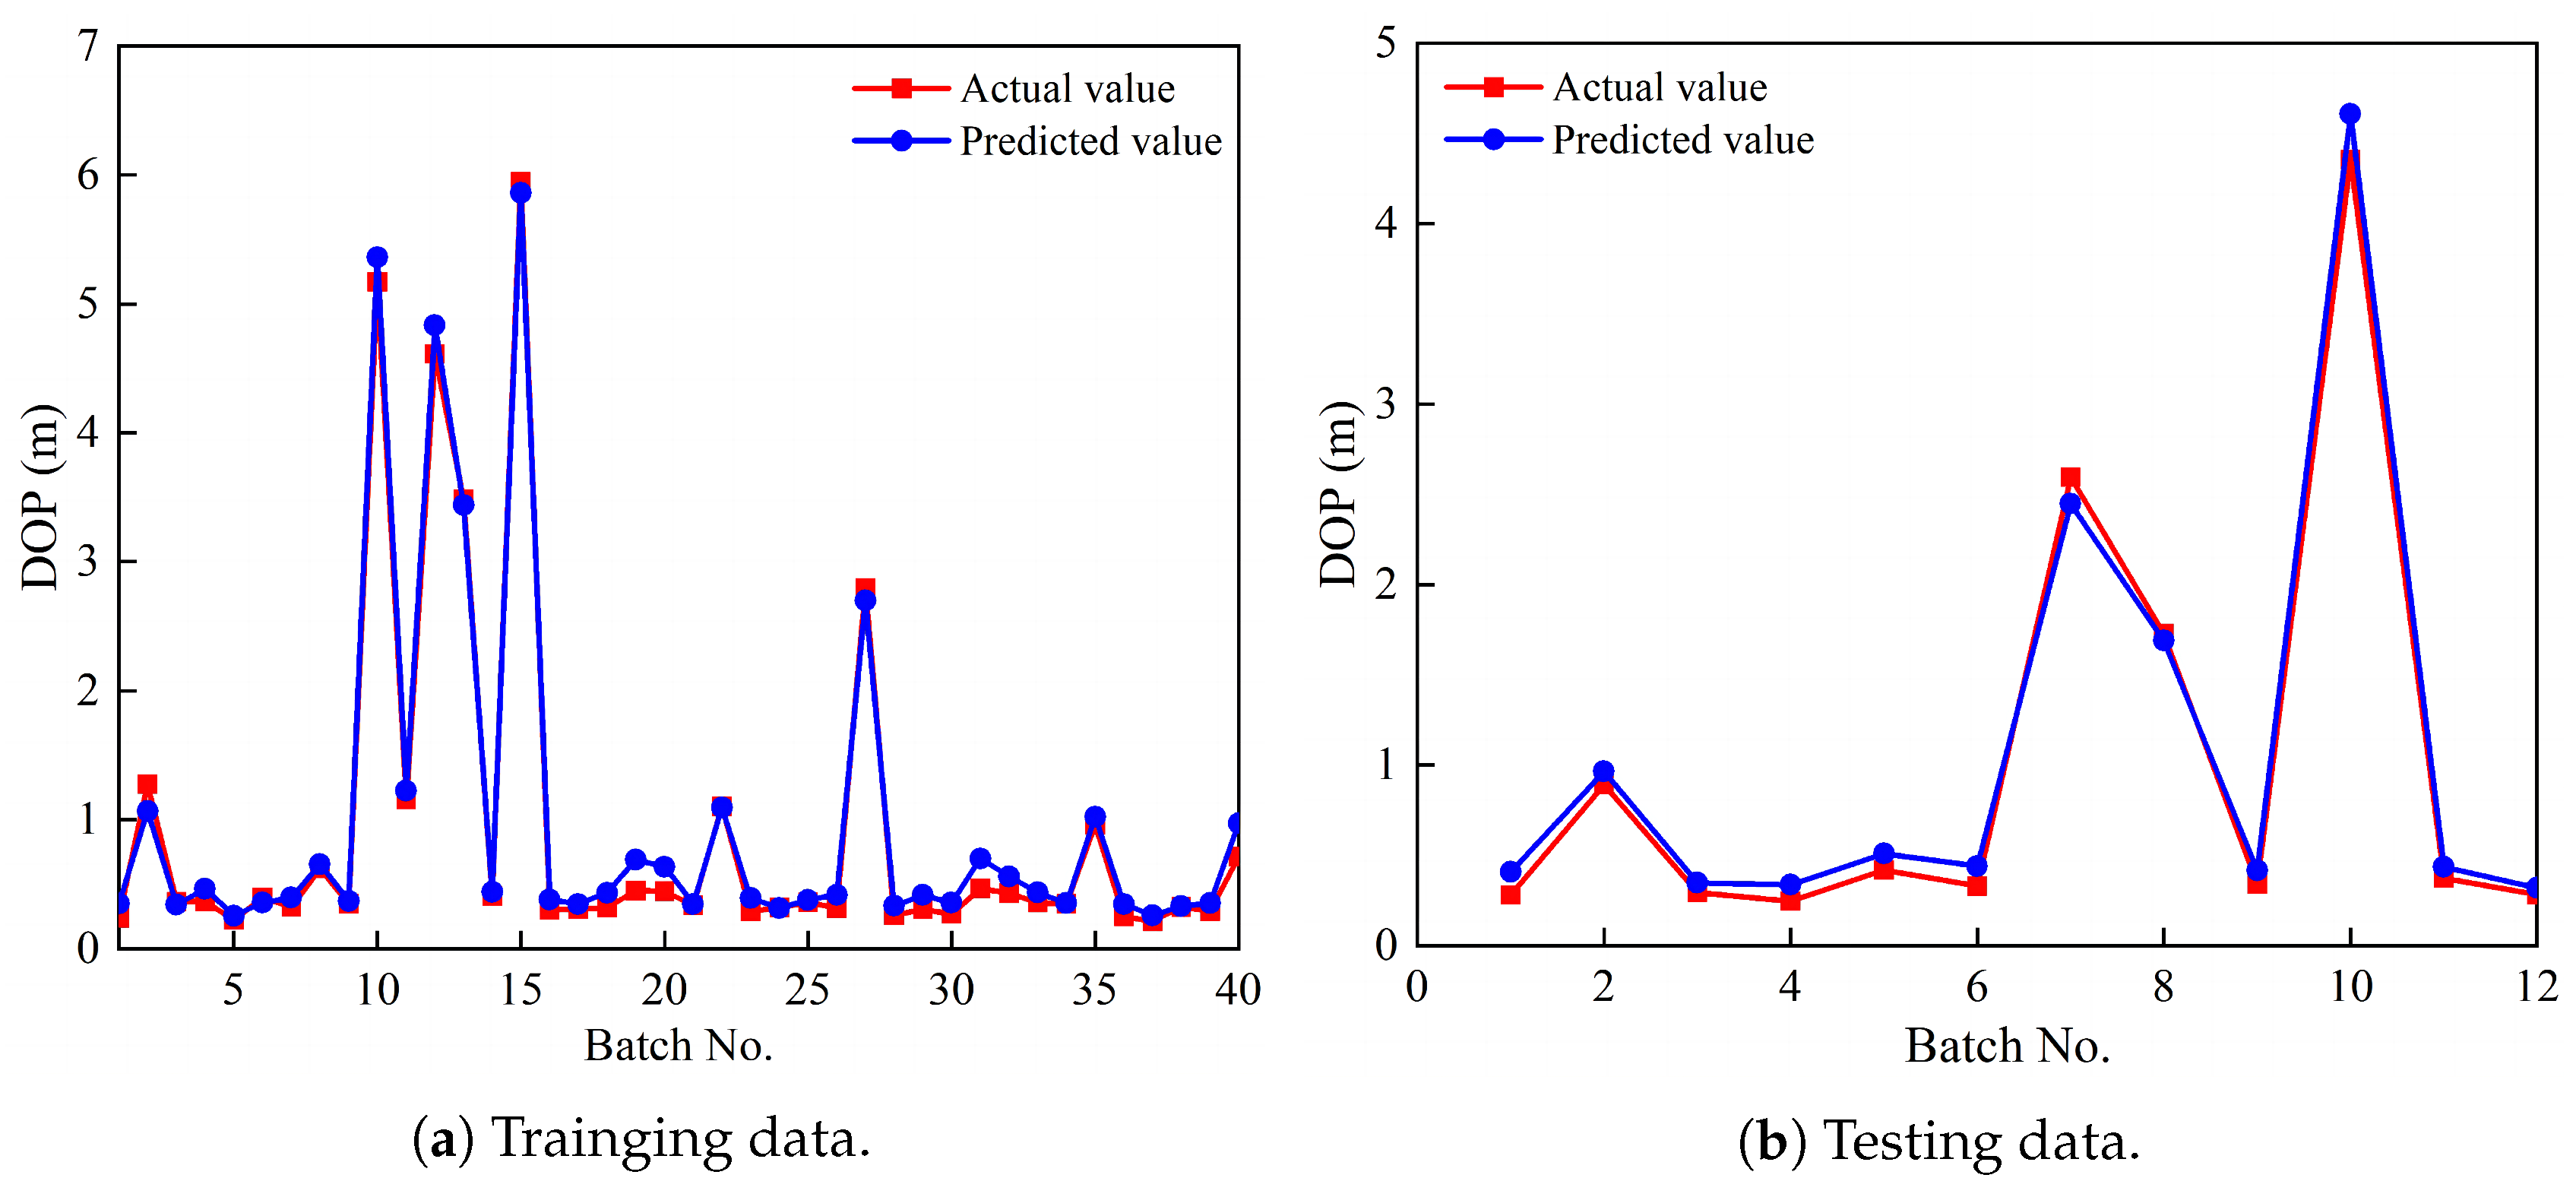
(3) The BP neural network optimized by the GA algorithm was capable of predicting the depth of penetration of airport runways pavement structures with high accuracy.
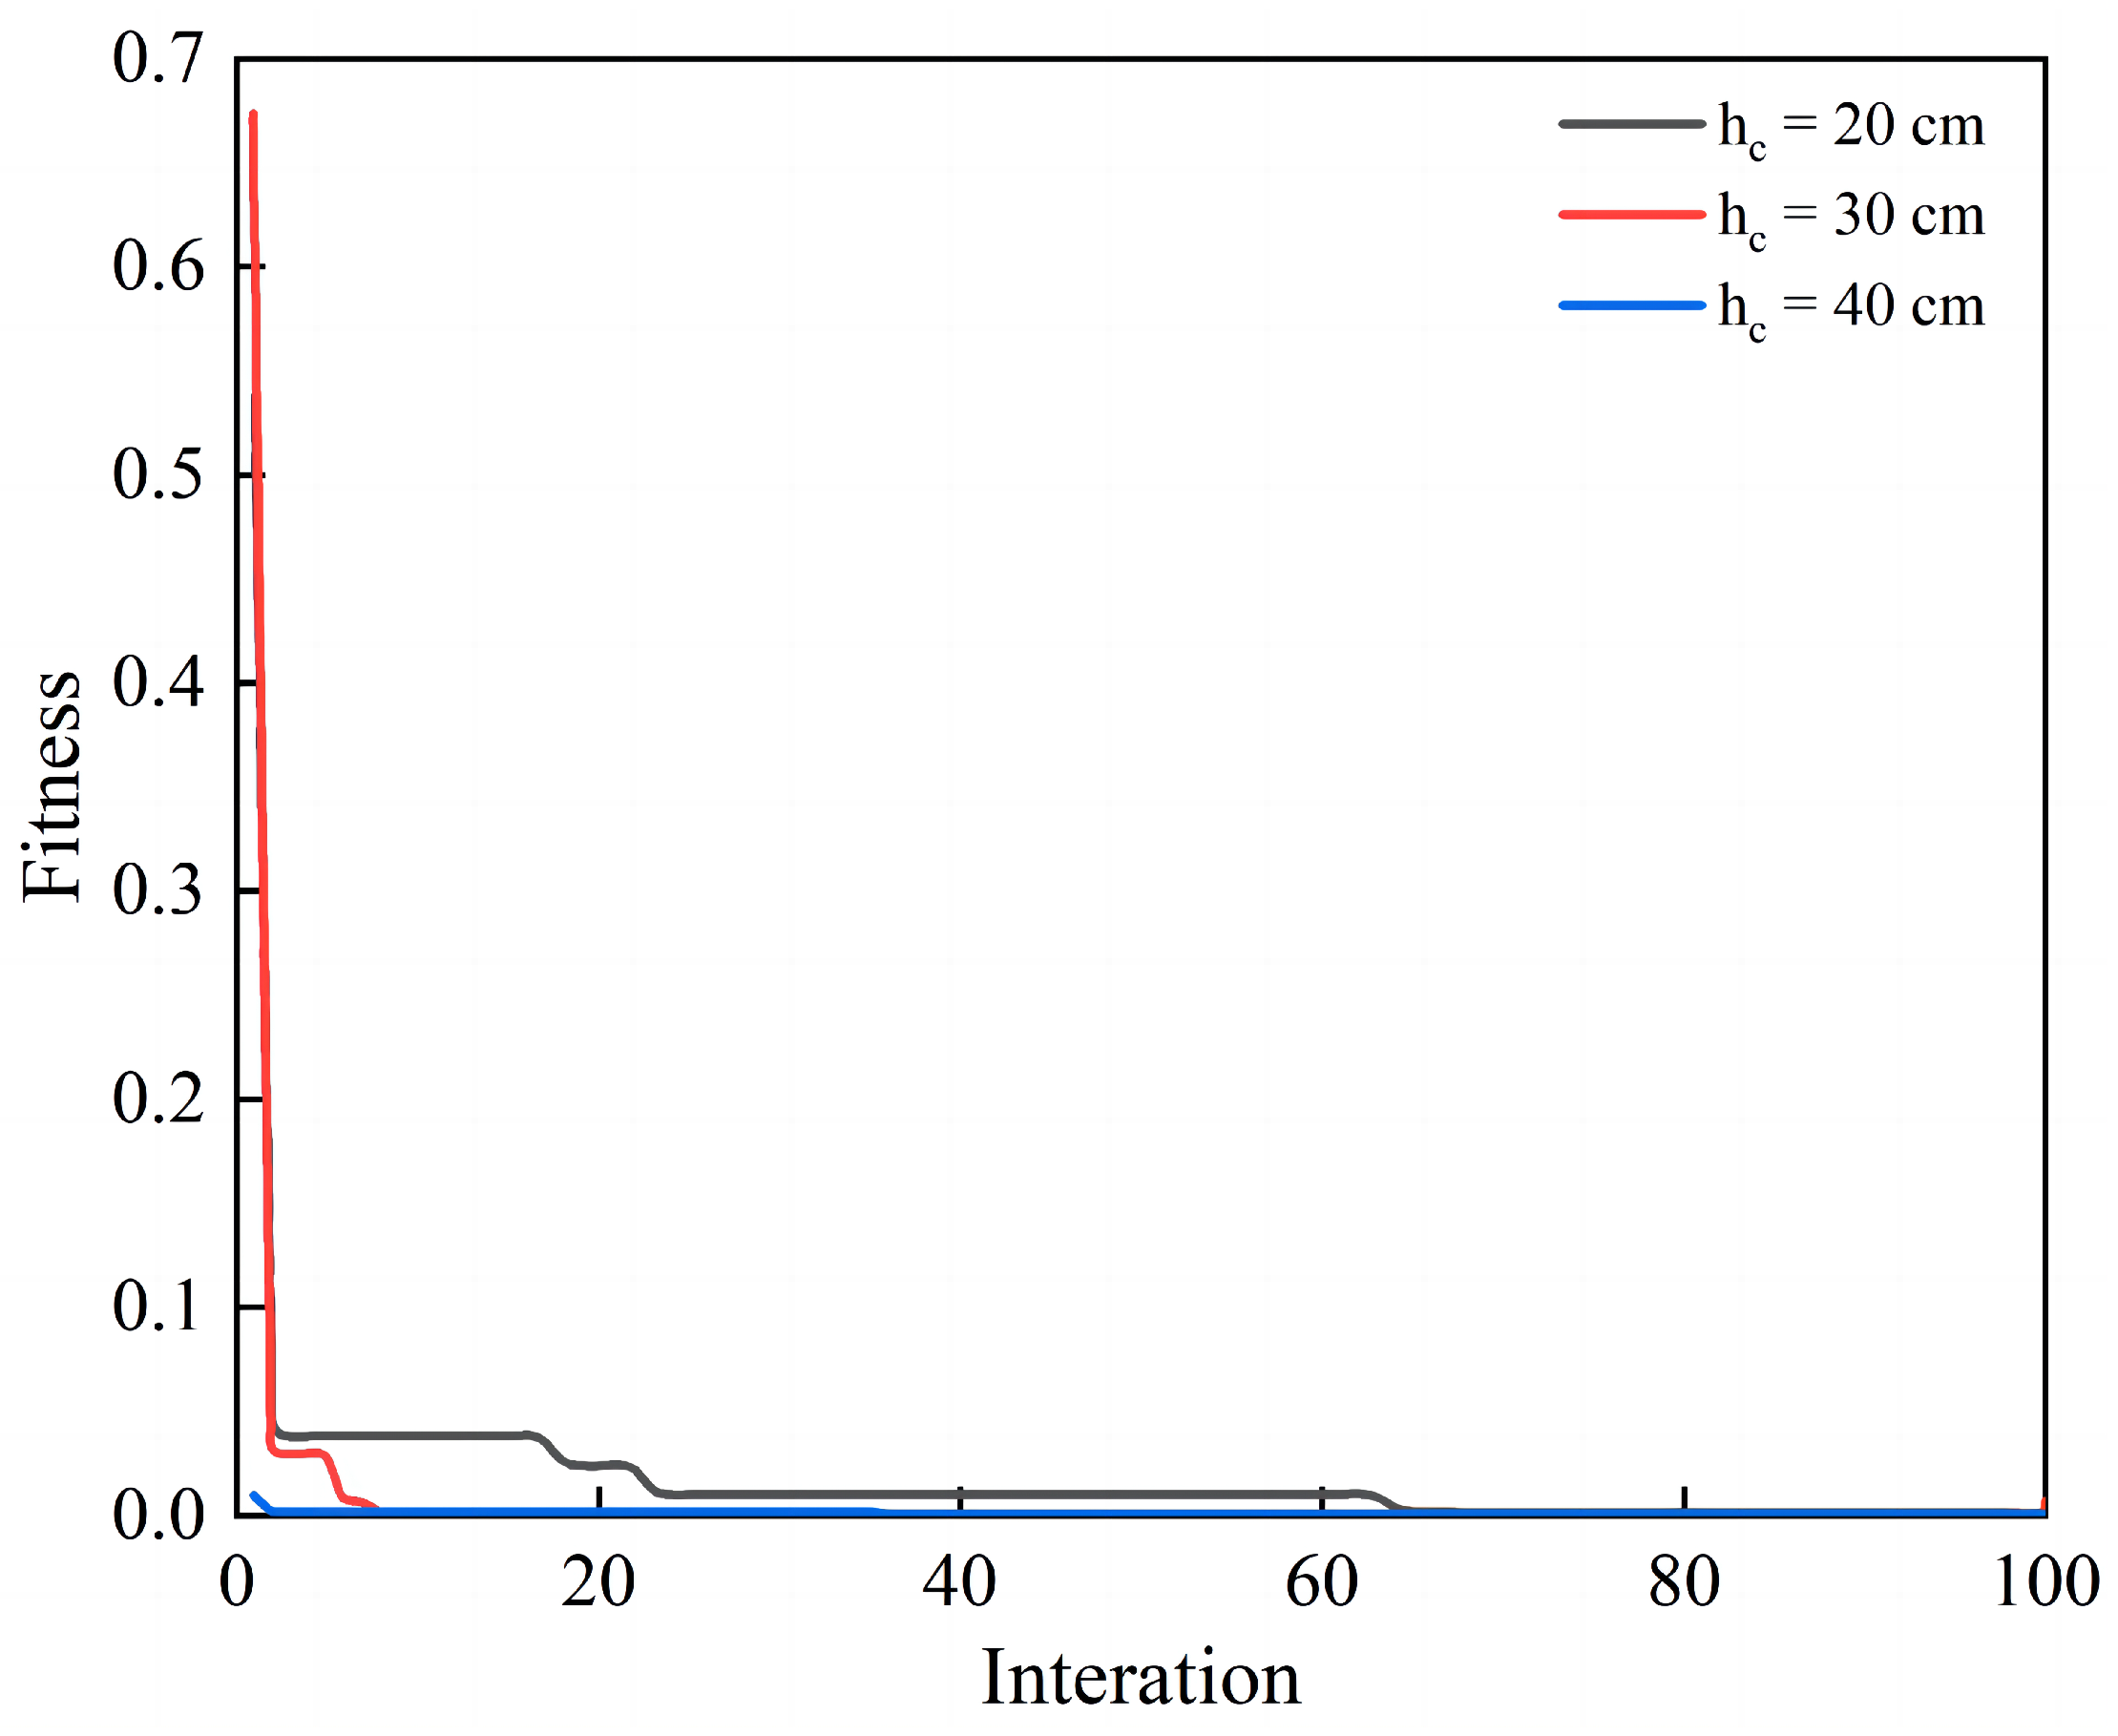
(4) Calling the GABP proxy model, the GA optimization was performed for most destructive effect of concrete surface layer with thickness of 20 cm, 25 cm, 30 cm, 35 cm and 40 cm whereby the critical velocities were predicted as 282.19 m/s, 308.79 m/s, 328.68 m/s, 345.34 m/s, 378.39 m/s, respectively.
[custom]
Figure 1.
Island airport runway under cluster munitions attack.
Figure 1.
Island airport runway under cluster munitions attack.
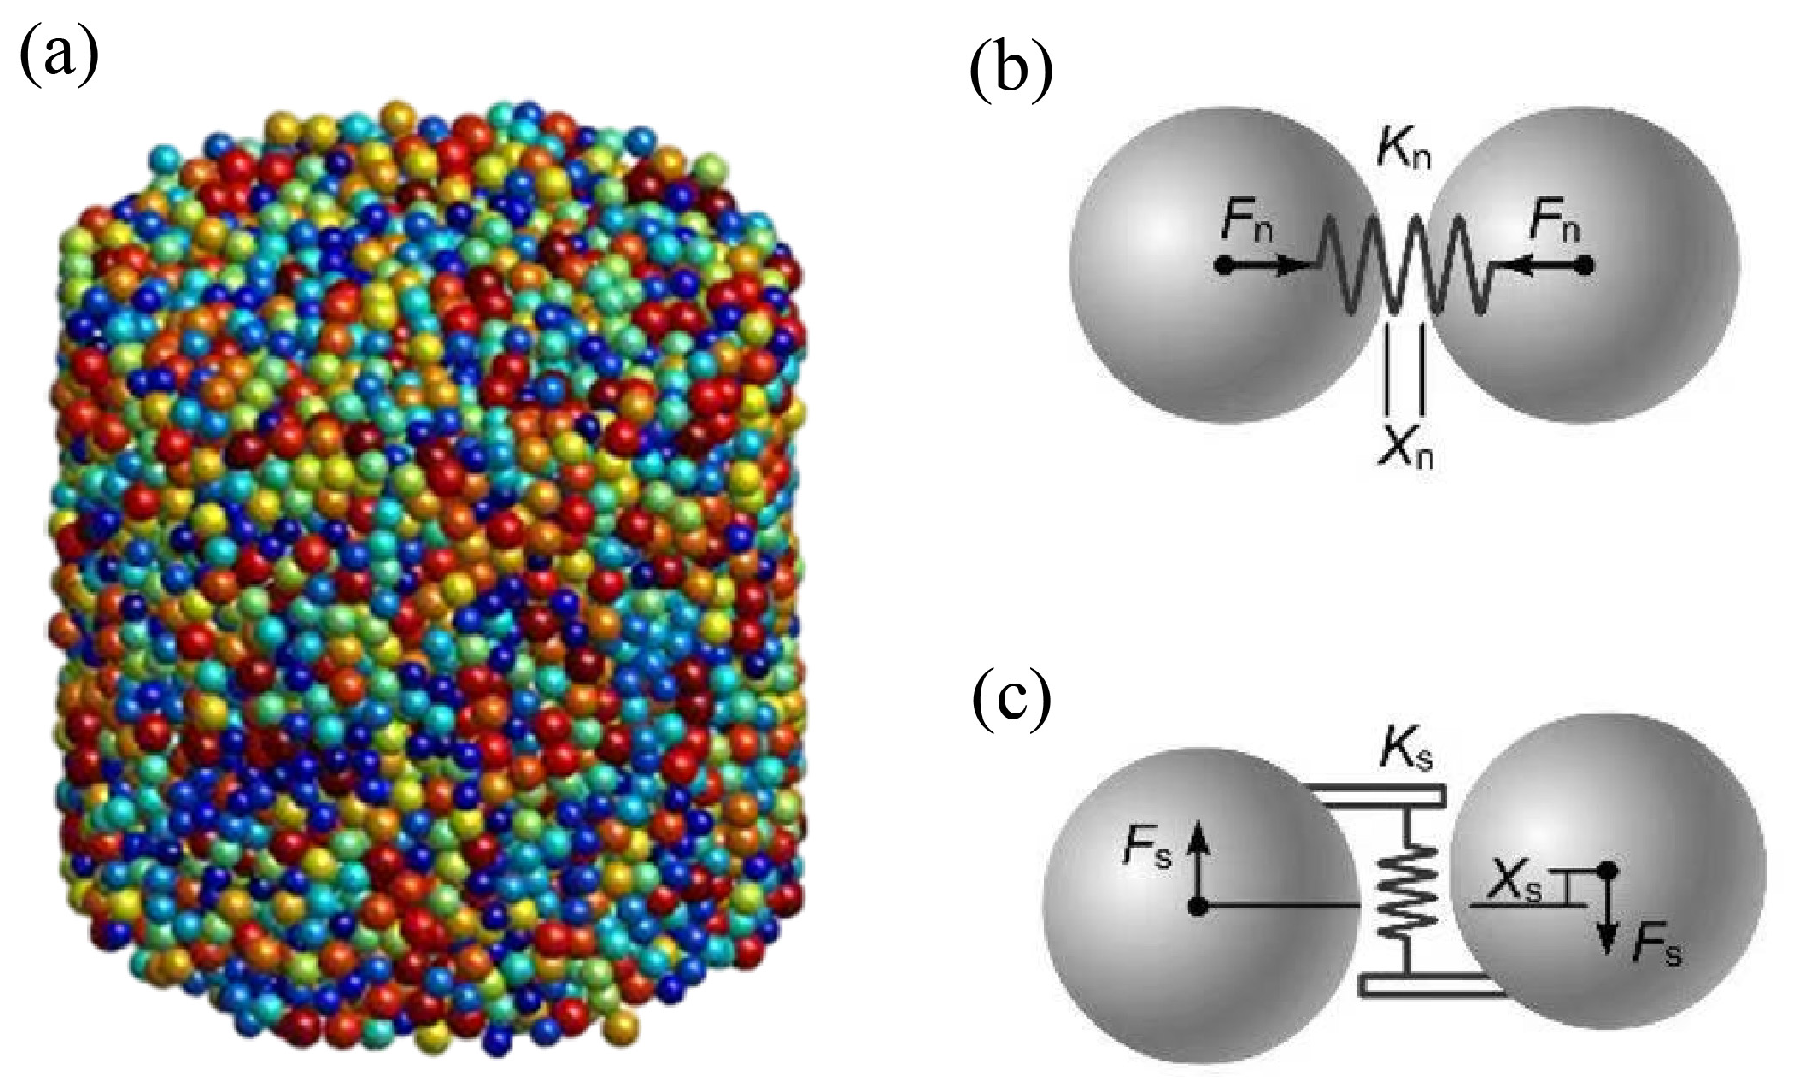
Figure 2.
A 3D discrete element model with normal and shear spring force.
Figure 2.
A 3D discrete element model with normal and shear spring force.
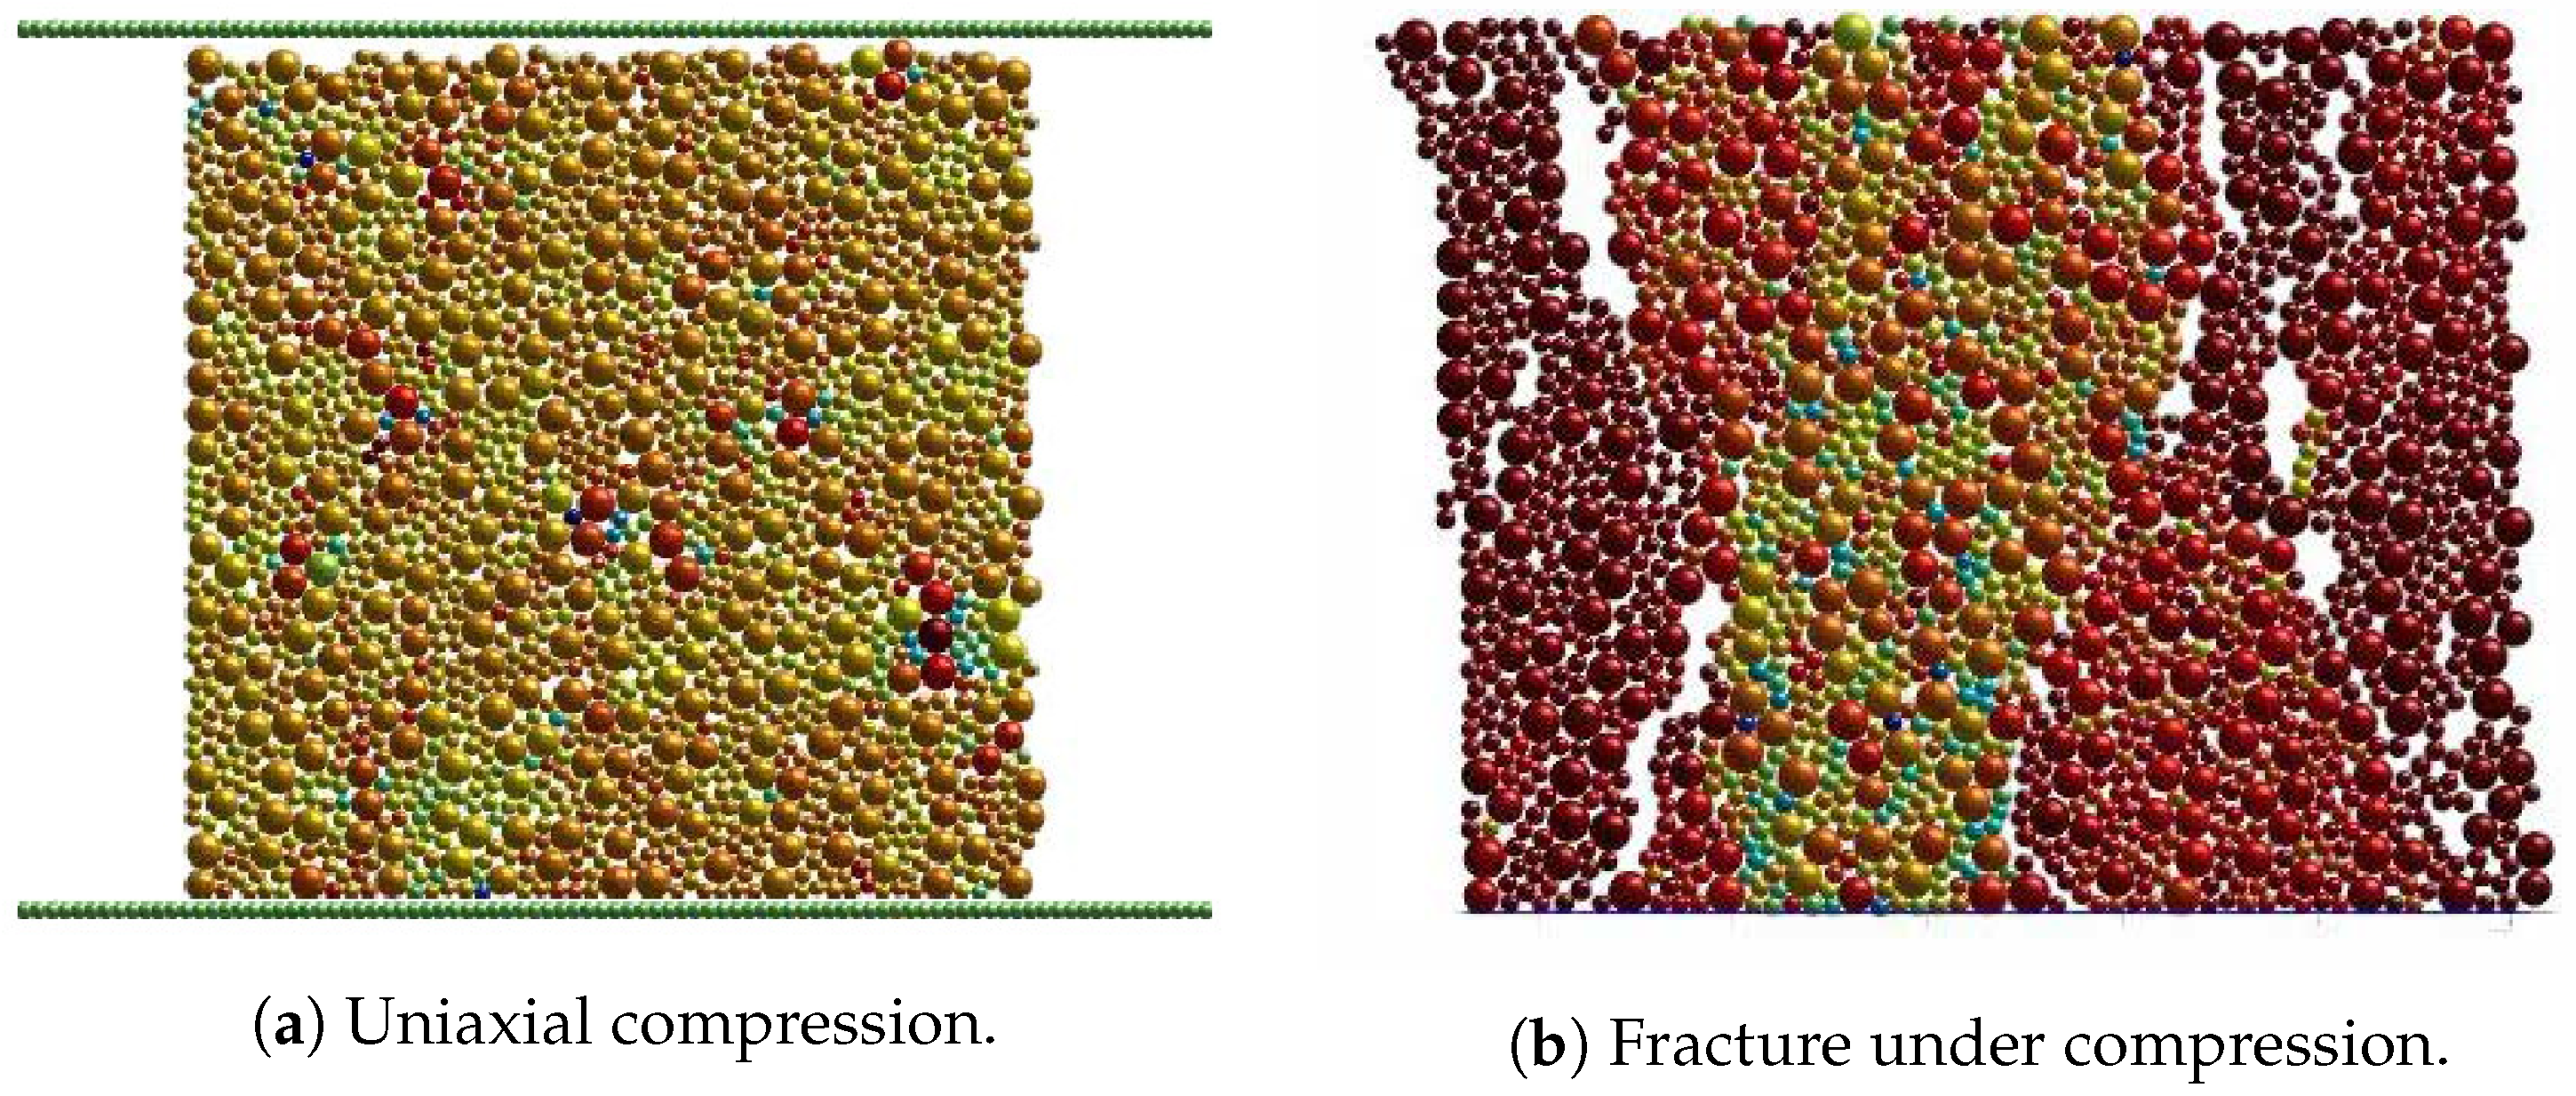
Figure 3.
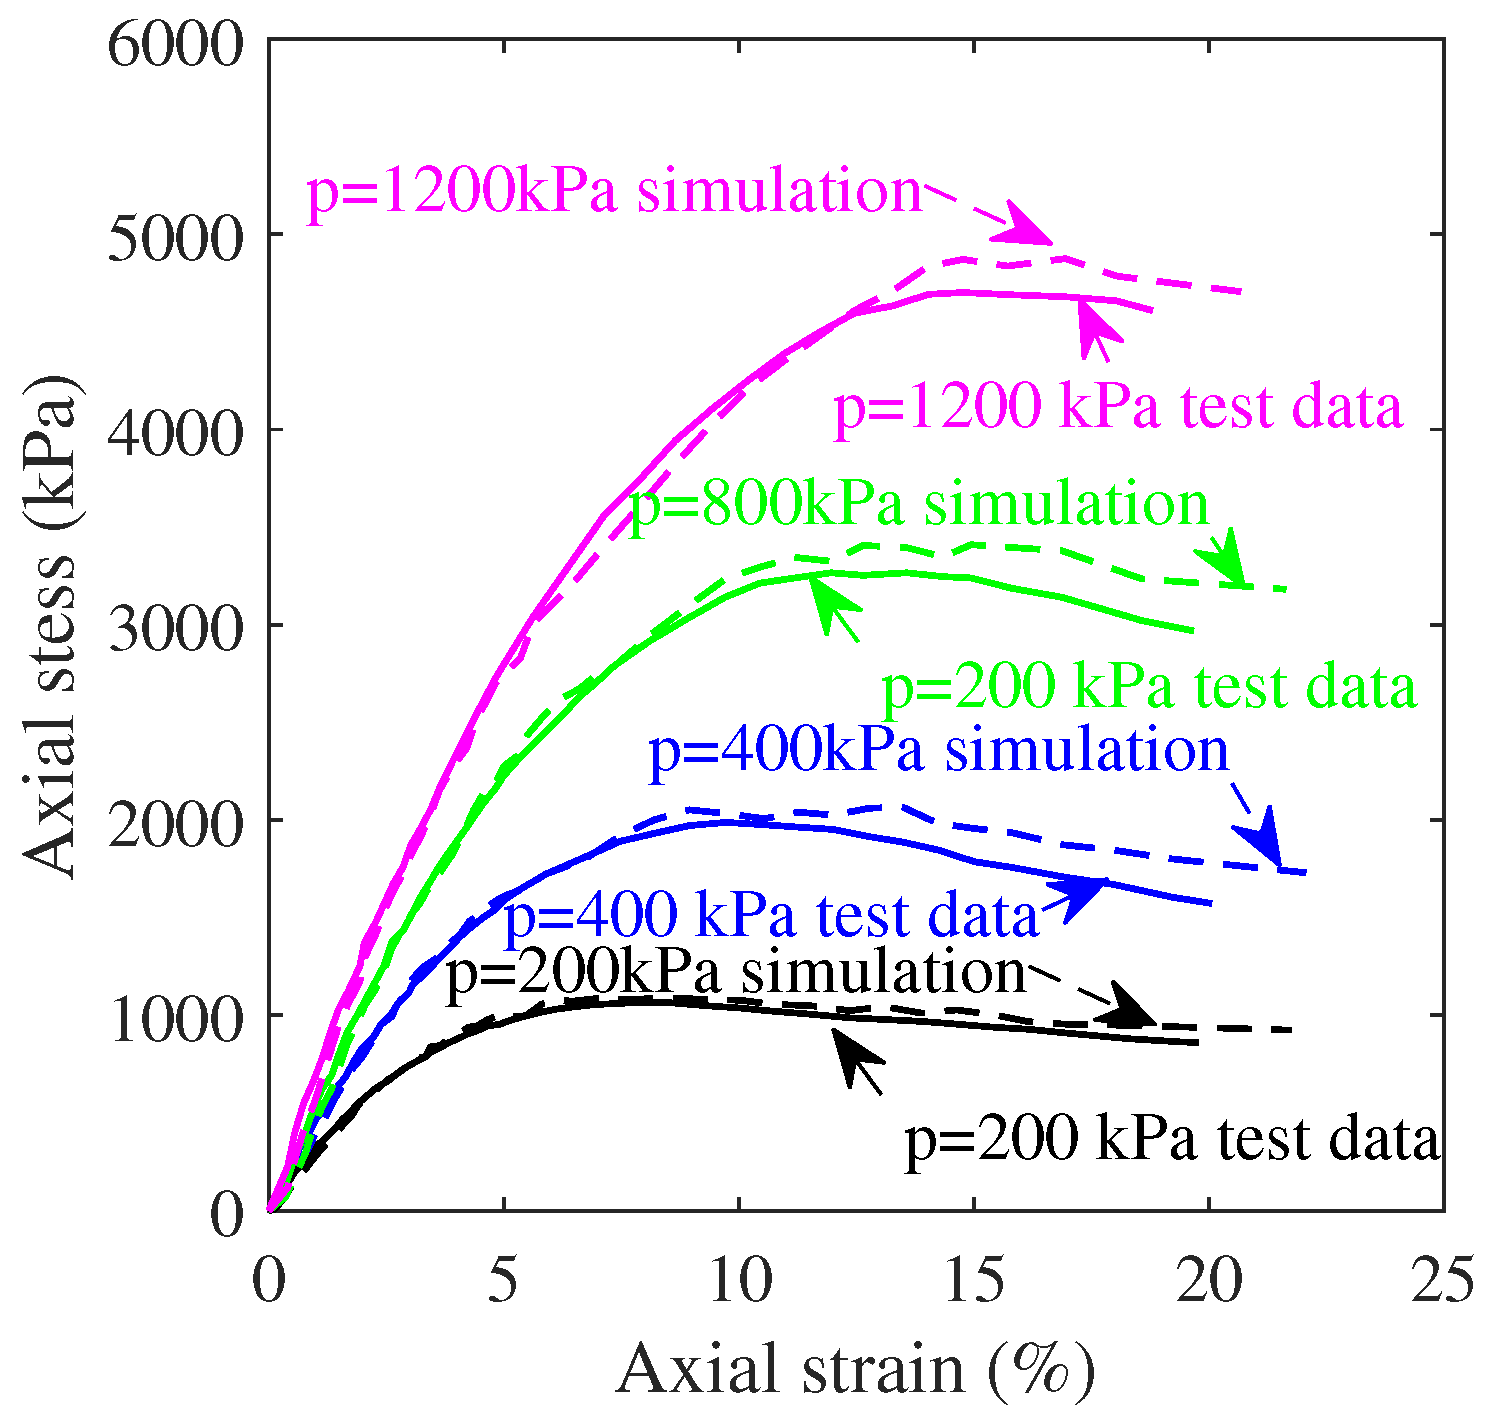
DEM parameter calibration for concrete.
Figure 3.
DEM parameter calibration for concrete.
Figure 4.
DEM parameter calibration for concrete.
Figure 4.
DEM parameter calibration for concrete.
Figure 5.
Calibrated model of calcareous triaxial compression.
Figure 5.
Calibrated model of calcareous triaxial compression.
Figure 6.
Dimension of projectiles for penetration simulation validatioin.
Figure 6.
Dimension of projectiles for penetration simulation validatioin.
Figure 7.
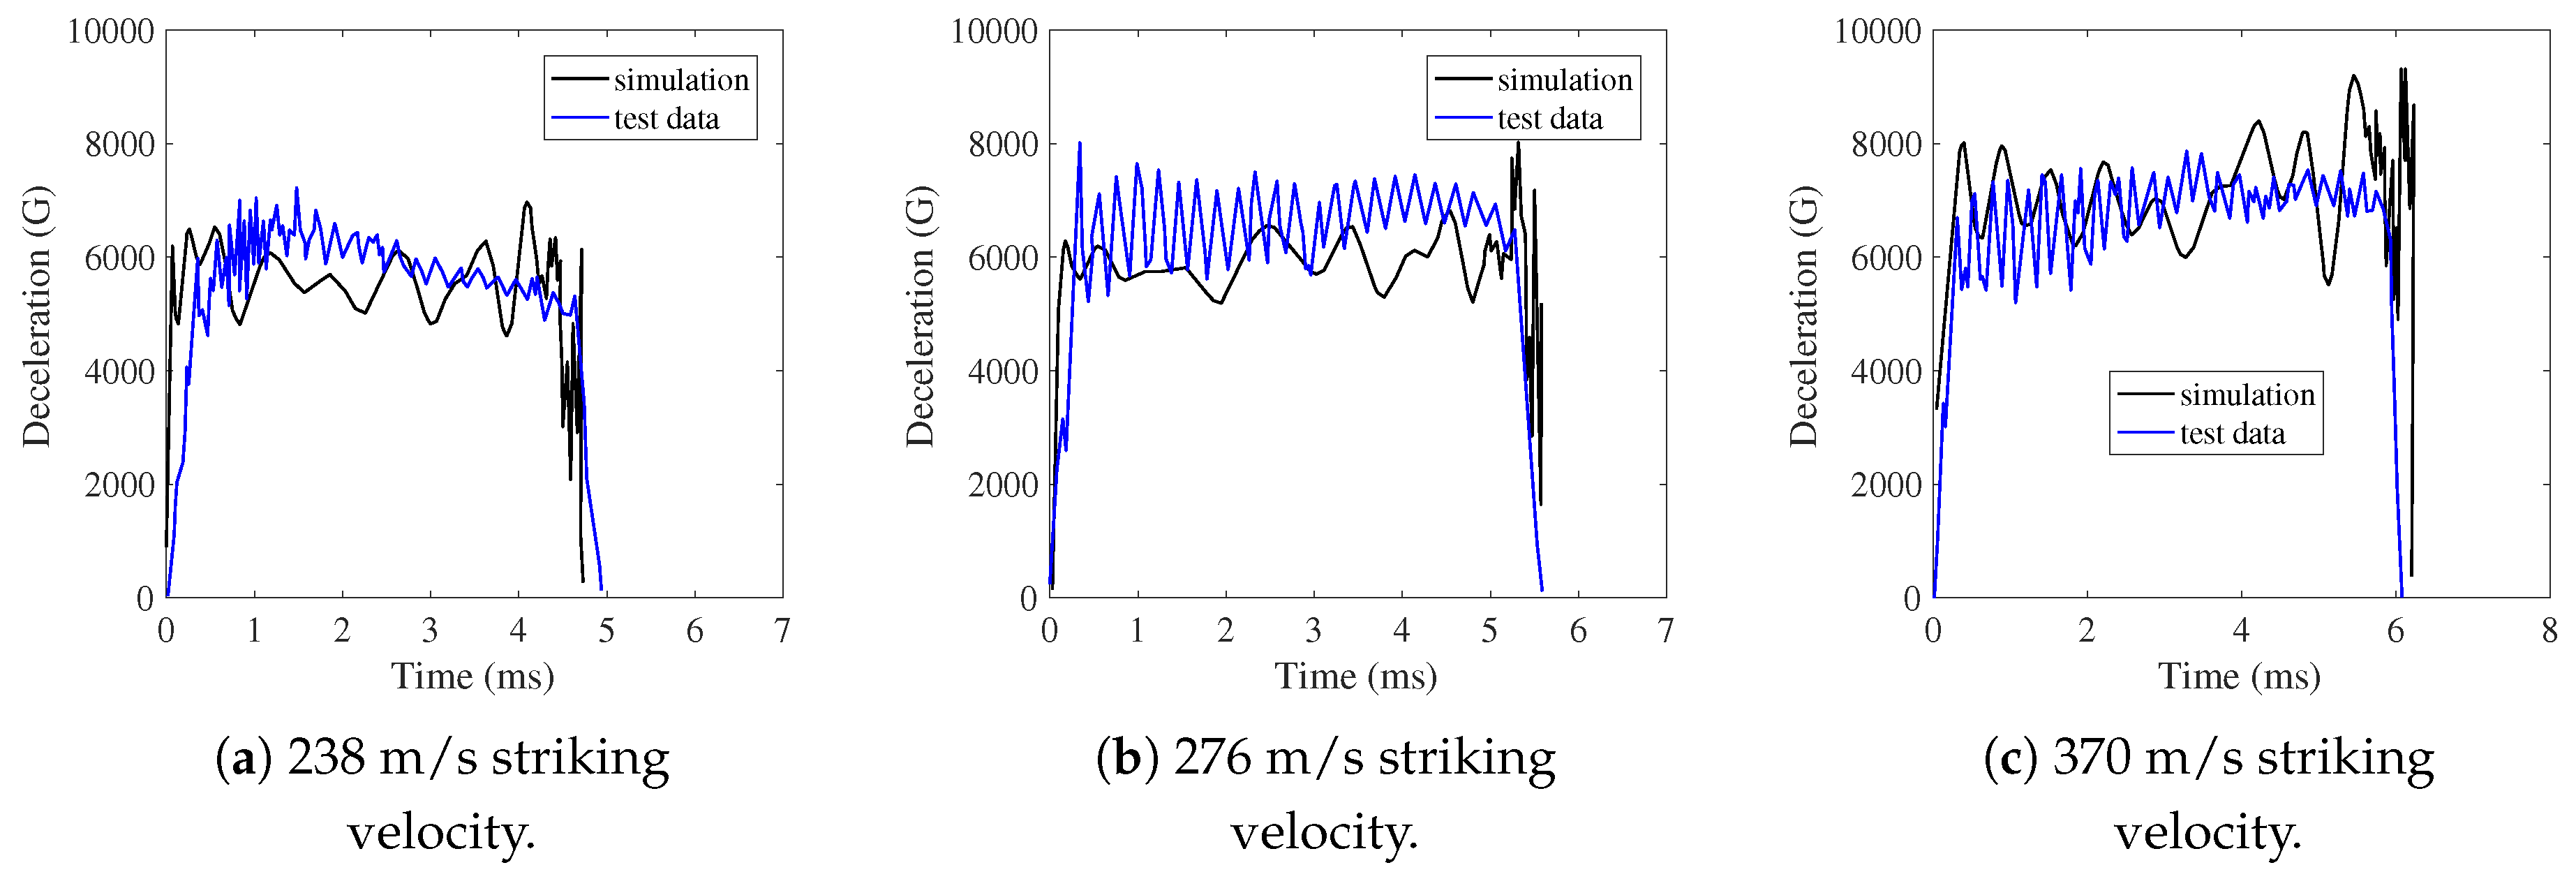
Simulation and test deceleration curves of penetration for concrete with different striking velocities.
Figure 7.
Simulation and test deceleration curves of penetration for concrete with different striking velocities.
Figure 8.
Particle velocity contour of concrete penetration simulation.
Figure 8.
Particle velocity contour of concrete penetration simulation.
Figure 9.
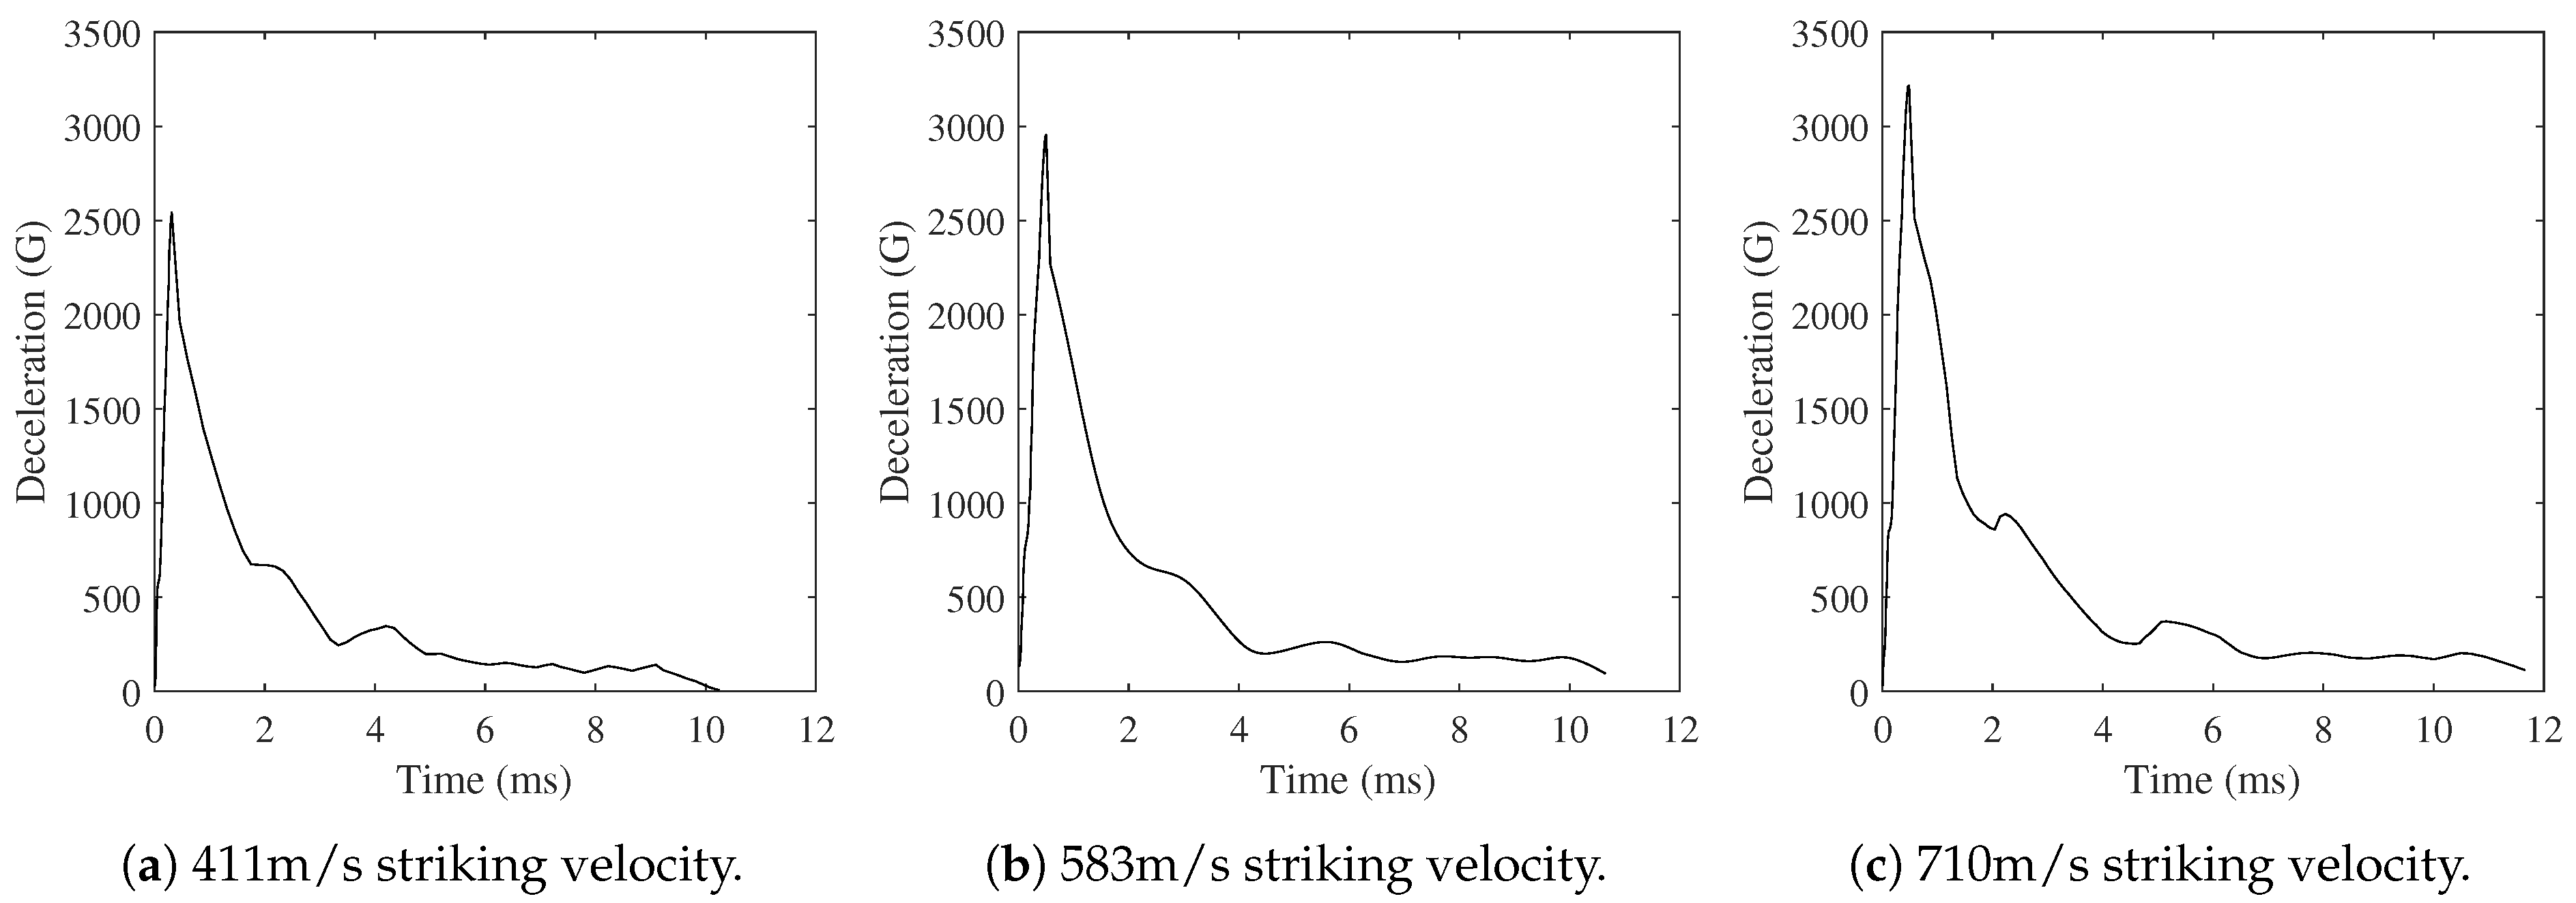
Simulation deceleration curves of penetration for calcareous sand with different striking velocities.
Figure 9.
Simulation deceleration curves of penetration for calcareous sand with different striking velocities.
Figure 10.
Simulation model of projectile penetration into Pavement structure.
Figure 10.
Simulation model of projectile penetration into Pavement structure.
Figure 11.
Projectile deceleration during penetration into runway pavement structure.
Figure 11.
Projectile deceleration during penetration into runway pavement structure.
Figure 12.
Flowchart of GABP proxy model.
Figure 12.
Flowchart of GABP proxy model.
Figure 13.
Structure of BPNN.
Figure 13.
Structure of BPNN.
Figure 14.
Output of model data.
Figure 14.
Output of model data.
Figure 15.
The convergence graph of GA.
Figure 15.
The convergence graph of GA.
Table 1.
Macroscopic mechanical properties of concrete and calcareous sand.
Table 1.
Macroscopic mechanical properties of concrete and calcareous sand.
| Material |
Density |
Young’s modulus |
Poisson’s ratio |
Tensile strength |
Compressive strength |
| Concrete |
2.38 g/cm3
|
30 GPa |
0.283 |
3 MPa |
23 MPa |
| Calcareous sand |
1.48 g/cm3
|
0.38 MPa |
0.363 |
1 kPa |
0.283 kPa |
Table 2.
Mesoscopic inter-particle mechanical parameters of concrete and calcareous sand for MatDEM.
Table 2.
Mesoscopic inter-particle mechanical parameters of concrete and calcareous sand for MatDEM.
| Parameter |
Concrete |
Calcareous sand |
| Normal stiffness, (N · m−1) |
5.42 ×
|
1.01 ×
|
| Shear stiffness, (N · m−1) |
5.38 ×
|
1.14 ×
|
| Fracture displacement, (m) |
3.76 ×
|
3.02 ×
|
| Initial shear resistance, (N) |
6.31 ×
|
2.87 ×
|
| Coefficient of friction,
|
0.19 |
0.14 |
Table 3.
Discrete simulation prediction of concrete penetration depth (unit: m).
Table 3.
Discrete simulation prediction of concrete penetration depth (unit: m).
| No. |
Striking velocity (m/s) |
Experimenal DOP[48] |
Numerical DOP |
Relative error |
| 1 |
250 |
0.62 |
0.59 |
5.6% |
| 2 |
337 |
0.93 |
0.89 |
4.5% |
| 3 |
379 |
1.18 |
1.15 |
3.0% |
Table 4.
Discrete simulation prediction of calcareous sand penetration depth (unit: m).
Table 4.
Discrete simulation prediction of calcareous sand penetration depth (unit: m).
| No. |
Striking velocity (m/s) |
Experimenal DOP[46] |
Numerical DOP |
Relative error |
| 4 |
411 |
1.06 |
1.01 |
4.7% |
| 5 |
583 |
1.10 |
1.06 |
3.6% |
| 6 |
710 |
1.23 |
1.19 |
3.3% |
Table 5.
Simulation results of depth of concrete penetration.
Table 5.
Simulation results of depth of concrete penetration.
| No. |
mp (kg) |
Vs (m/s) |
hc (cm) |
DOP (m) |
No. |
mp (kg) |
Vs (m/s) |
hc (cm) |
DOP (m) |
| 1 |
13 |
200 |
15 |
4.612 |
27 |
9 |
195 |
40 |
0.26 |
| 2 |
13 |
200 |
20 |
3.486 |
28 |
9 |
205 |
35 |
0.28 |
| 3 |
13 |
200 |
30 |
0.622 |
29 |
9 |
215 |
40 |
0.302 |
| 4 |
13 |
200 |
40 |
0.365 |
30 |
9 |
225 |
35 |
0.325 |
| 5 |
8 |
200 |
30 |
0.246 |
31 |
9 |
235 |
40 |
0.348 |
| 6 |
9 |
200 |
30 |
0.27 |
32 |
9 |
245 |
35 |
0.373 |
| 7 |
10 |
200 |
30 |
0.294 |
33 |
9 |
255 |
40 |
0.397 |
| 8 |
11 |
200 |
30 |
0.318 |
34 |
9 |
265 |
35 |
0.961 |
| 9 |
12 |
200 |
30 |
0.348 |
35 |
9 |
275 |
40 |
0.467 |
| 10 |
13 |
220 |
30 |
2.595 |
36 |
9 |
285 |
40 |
1.156 |
| 11 |
13 |
240 |
30 |
4.355 |
37 |
10 |
250 |
35 |
0.891 |
| 12 |
13 |
250 |
30 |
5.17 |
38 |
10 |
230 |
35 |
0.367 |
| 13 |
13 |
260 |
30 |
5.947 |
39 |
10 |
210 |
35 |
0.317 |
| 14 |
13 |
220 |
40 |
0.429 |
40 |
11 |
240 |
35 |
1.103 |
| 15 |
13 |
240 |
40 |
1.728 |
41 |
11 |
215 |
35 |
0.356 |
| 16 |
13 |
250 |
40 |
2.794 |
42 |
11 |
195 |
35 |
0.305 |
| 17 |
13 |
190 |
40 |
0.336 |
43 |
12 |
234 |
40 |
0.450 |
| 18 |
13 |
180 |
40 |
0.307 |
44 |
12 |
241 |
40 |
0.713 |
| 19 |
13 |
170 |
40 |
0.281 |
45 |
12 |
207 |
35 |
0.361 |
| 20 |
9 |
210 |
30 |
0.291 |
46 |
12 |
193 |
35 |
0.322 |
| 21 |
9 |
230 |
30 |
0.341 |
47 |
10 |
198 |
40 |
0.289 |
| 22 |
9 |
250 |
30 |
1.276 |
48 |
10 |
209 |
40 |
0.315 |
| 23 |
9 |
190 |
30 |
0.25 |
49 |
10 |
246 |
40 |
0.410 |
| 24 |
9 |
170 |
30 |
0.212 |
50 |
11 |
237 |
40 |
0.419 |
| 25 |
9 |
175 |
40 |
0.221 |
51 |
11 |
205 |
40 |
0.330 |
| 26 |
9 |
185 |
35 |
0.24 |
52 |
11 |
244 |
40 |
0.446 |
Table 6.
Parameters of the GABP proxy model.
Table 6.
Parameters of the GABP proxy model.
| Parameters |
Value |
| Neurons at the input layer |
3 |
| Neurons at the hidden layer |
5 |
| Neurons at the hidden layer |
1 |
| Learning rate |
0.01 |
| Total epochs |
1000 |
| Training function |
Levenberg-Marquardt backpropagation(TRAINLM) |
| Population size |
100 |
| Number of evolutions |
500 |
| Selection factor |
0.09 |
| Crossover factor |
Random number within [0,1] |
| Mutation factor |
Non-uniform mutation |
Table 7.
Precision parameter of the GABP proxy model.
Table 7.
Precision parameter of the GABP proxy model.
| Stage |
Training |
Testing |
| RMSE |
0.1131 |
0.1124 |
|
0.9934 |
0.9916 |
| Average error (m) |
0.0886 |
0.0971 |
Table 8.
Critical velocity of diffenert thickness of concrete (unit: cm).
Table 8.
Critical velocity of diffenert thickness of concrete (unit: cm).
| Thickness (cm) |
Velocity (m/s) |
Fitness |
| 20 |
282.19 |
0.0025 |
| 25 |
308.79 |
0.0004 |
| 30 |
328.68 |
0.0001 |
| 35 |
345.34 |
0.0017 |
| 40 |
378.39 |
0.0063 |
