1. Introduction
The increasing global energy demand and dwindling fossil fuel reserves have heightened concerns about global warming, environmental degradation, and energy shortages, making this a prominent research area in recent years. The overuse of fossil fuels not only exacerbates environmental pollution but also contributes directly to the ongoing energy crisis [
1,
2]. In response to the urgent need to decrease carbon emissions, China has committed to implementing carbon reduction initiatives by 2030 and achieving carbon neutrality by 2060 [
3]. Biomass, recognized as a clean and renewable energy source, offers substantial energy potential, and its development is associated with a carbon-neutral process that supports sustainable environmental practices [
4,
5]. Consequently, there is a growing interest in advancing technologies to convert various types of biomass, such as agricultural residues, forest by-products, energy crops, food processing waste, and municipal refuse, into alternative fuels or energy sources [
6,
7].
In recent years, the convergence of three critical global issues (energy, the environment, and materials) has propelled research into biomass energy and biomass-derived materials to the forefront. Bamboo, a crucial component of global plant and forest resources, encompasses over 70 genera and 1,200 species [
8]. With its rapid growth cycle, high economic value, and suitability for sustainable management, bamboo has become one of China’s most significant non-timber forest resources, with an annual output of approximately 20 million tons [
9]. The energy applications of bamboo include power generation, its use as industrial boiler fuel, the production of bamboo charcoal, and the development of biofuel technologies [
10]. However, the actual utilization rate of bamboo is relatively low, with lower than 50% of the harvested volume being used [
11]. Each year, millions of tons of bamboo waste, including bamboo joints, bark, and sawdust, are generated during bamboo processing. These by-products are often burned for cooking and heating in rural households or disposed of in landfills. Therefore, it is crucial to develop and utilize bamboo resources more effectively.
Pyrolysis and combustion represent the two primary pathways for converting biomass into energy [
12,
13,
14]. Pyrolysis, often considered the initial phase of combustion, involves a high-temperature process under inert conditions, transforming biomass into three distinct products: bio-liquid, biochar, and biogas. In contrast, combustion, the most commonly utilized thermochemical process in industry, generates heat and electricity from biomass. Understanding the pyrolysis and combustion behaviors of biomass is essential for advancing storage technologies and enhancing bioenergy valorization. These processes’ characteristics and kinetic parameters are fundamental to the design of efficient biomass conversion systems and appropriate equipment. Thermogravimetric analysis (TGA) is a valuable technique for examining the thermochemical conversion and reaction kinetics of various biomass types [
15,
16,
17,
18,
19]. By tracking the relationship between mass and temperature or time under controlled heating conditions, TGA can determine the onset and conclusion temperatures of pyrolysis or combustion, while kinetic parameters can be extracted from the TG-DTG profiles.
However, there is a notable lack of comprehensive data on the pyrolysis and combustion behaviors of bamboo. To unlock bamboo’s potential as a bioenergy feedstock, it is crucial to conduct a detailed analysis of its thermochemical conversion properties. This article explores the pyrolysis and combustion characteristics of bamboo using TGA, with activation energy calculations for both processes performed using three model-free methods: Flynn–Wall–Ozawa (FWO), Kissinger–Akahira–Sunose (KAS), and Starink (STR). This research aims to provide valuable insights for researchers and engineers focused on pyrolysis and combustion, offering guidance for the efficient design and scaling of thermochemical conversion processes for bamboo.
2. Materials and Methods
2.1. Materials
The bamboo used in this study was sourced from Huangshi city, Hubei province, China. The samples were ground using a 150-mesh sieve to obtain particles ranging from 74 to 106 μm in size. This particle size range was selected based on the recommendations of Van de Velden [
20] and Brems [
21] to minimize temperature and heat transfer gradients within the sample. After grinding, the samples were dried at 373 K for 12 hours to remove moisture.
2.1.1. Proximate and Ultimate Analysis
The proximate analysis of the bamboo was performed according to the GB/T212–2008 standard [
22]. The procedure involved drying the bamboo at 378 K for 24 hours to measure the moisture content. The dry bamboo was then heated to 1173±10 K for 7 minutes to obtain the volatile matter. Ash content was assessed by heating the dry biomass at 1123±10 K until a constant mass was achieved, andthe fixed carbon content was obtainedby difference. Meanwhile, a CHNS/O analyzer was employed to concurrently measure the weight percentages of C, H, N, and S in the bamboo, while the O content was obtained by difference. Each test was conducted in duplicate, and the average values were calculated.
The outcomes of the analyses are presented in
Table 1. The high levels of volatile matter and fixed carbon suggest that bamboo has strong potential as a renewable fuel for thermochemical processes [
23]. Additionally, the low concentrations of N and S indicate that the release of pollutant compounds such as SOx and NOx would be minimal, making bamboo a promising candidate for bioenergy production [
24].
2.1.2. FTIR Analysis
To analyze the functional groups present in bamboo, FTIR spectroscopy was conducted. Approximately 0.01 g of the bamboo sample was finely mixed with 1 g of potassium bromide (KBr), and then compressed into thin sheets using a press. The samples were scanned across the 500–4000 cm
–1 range at a typical resolution of 4.0 cm
–1.
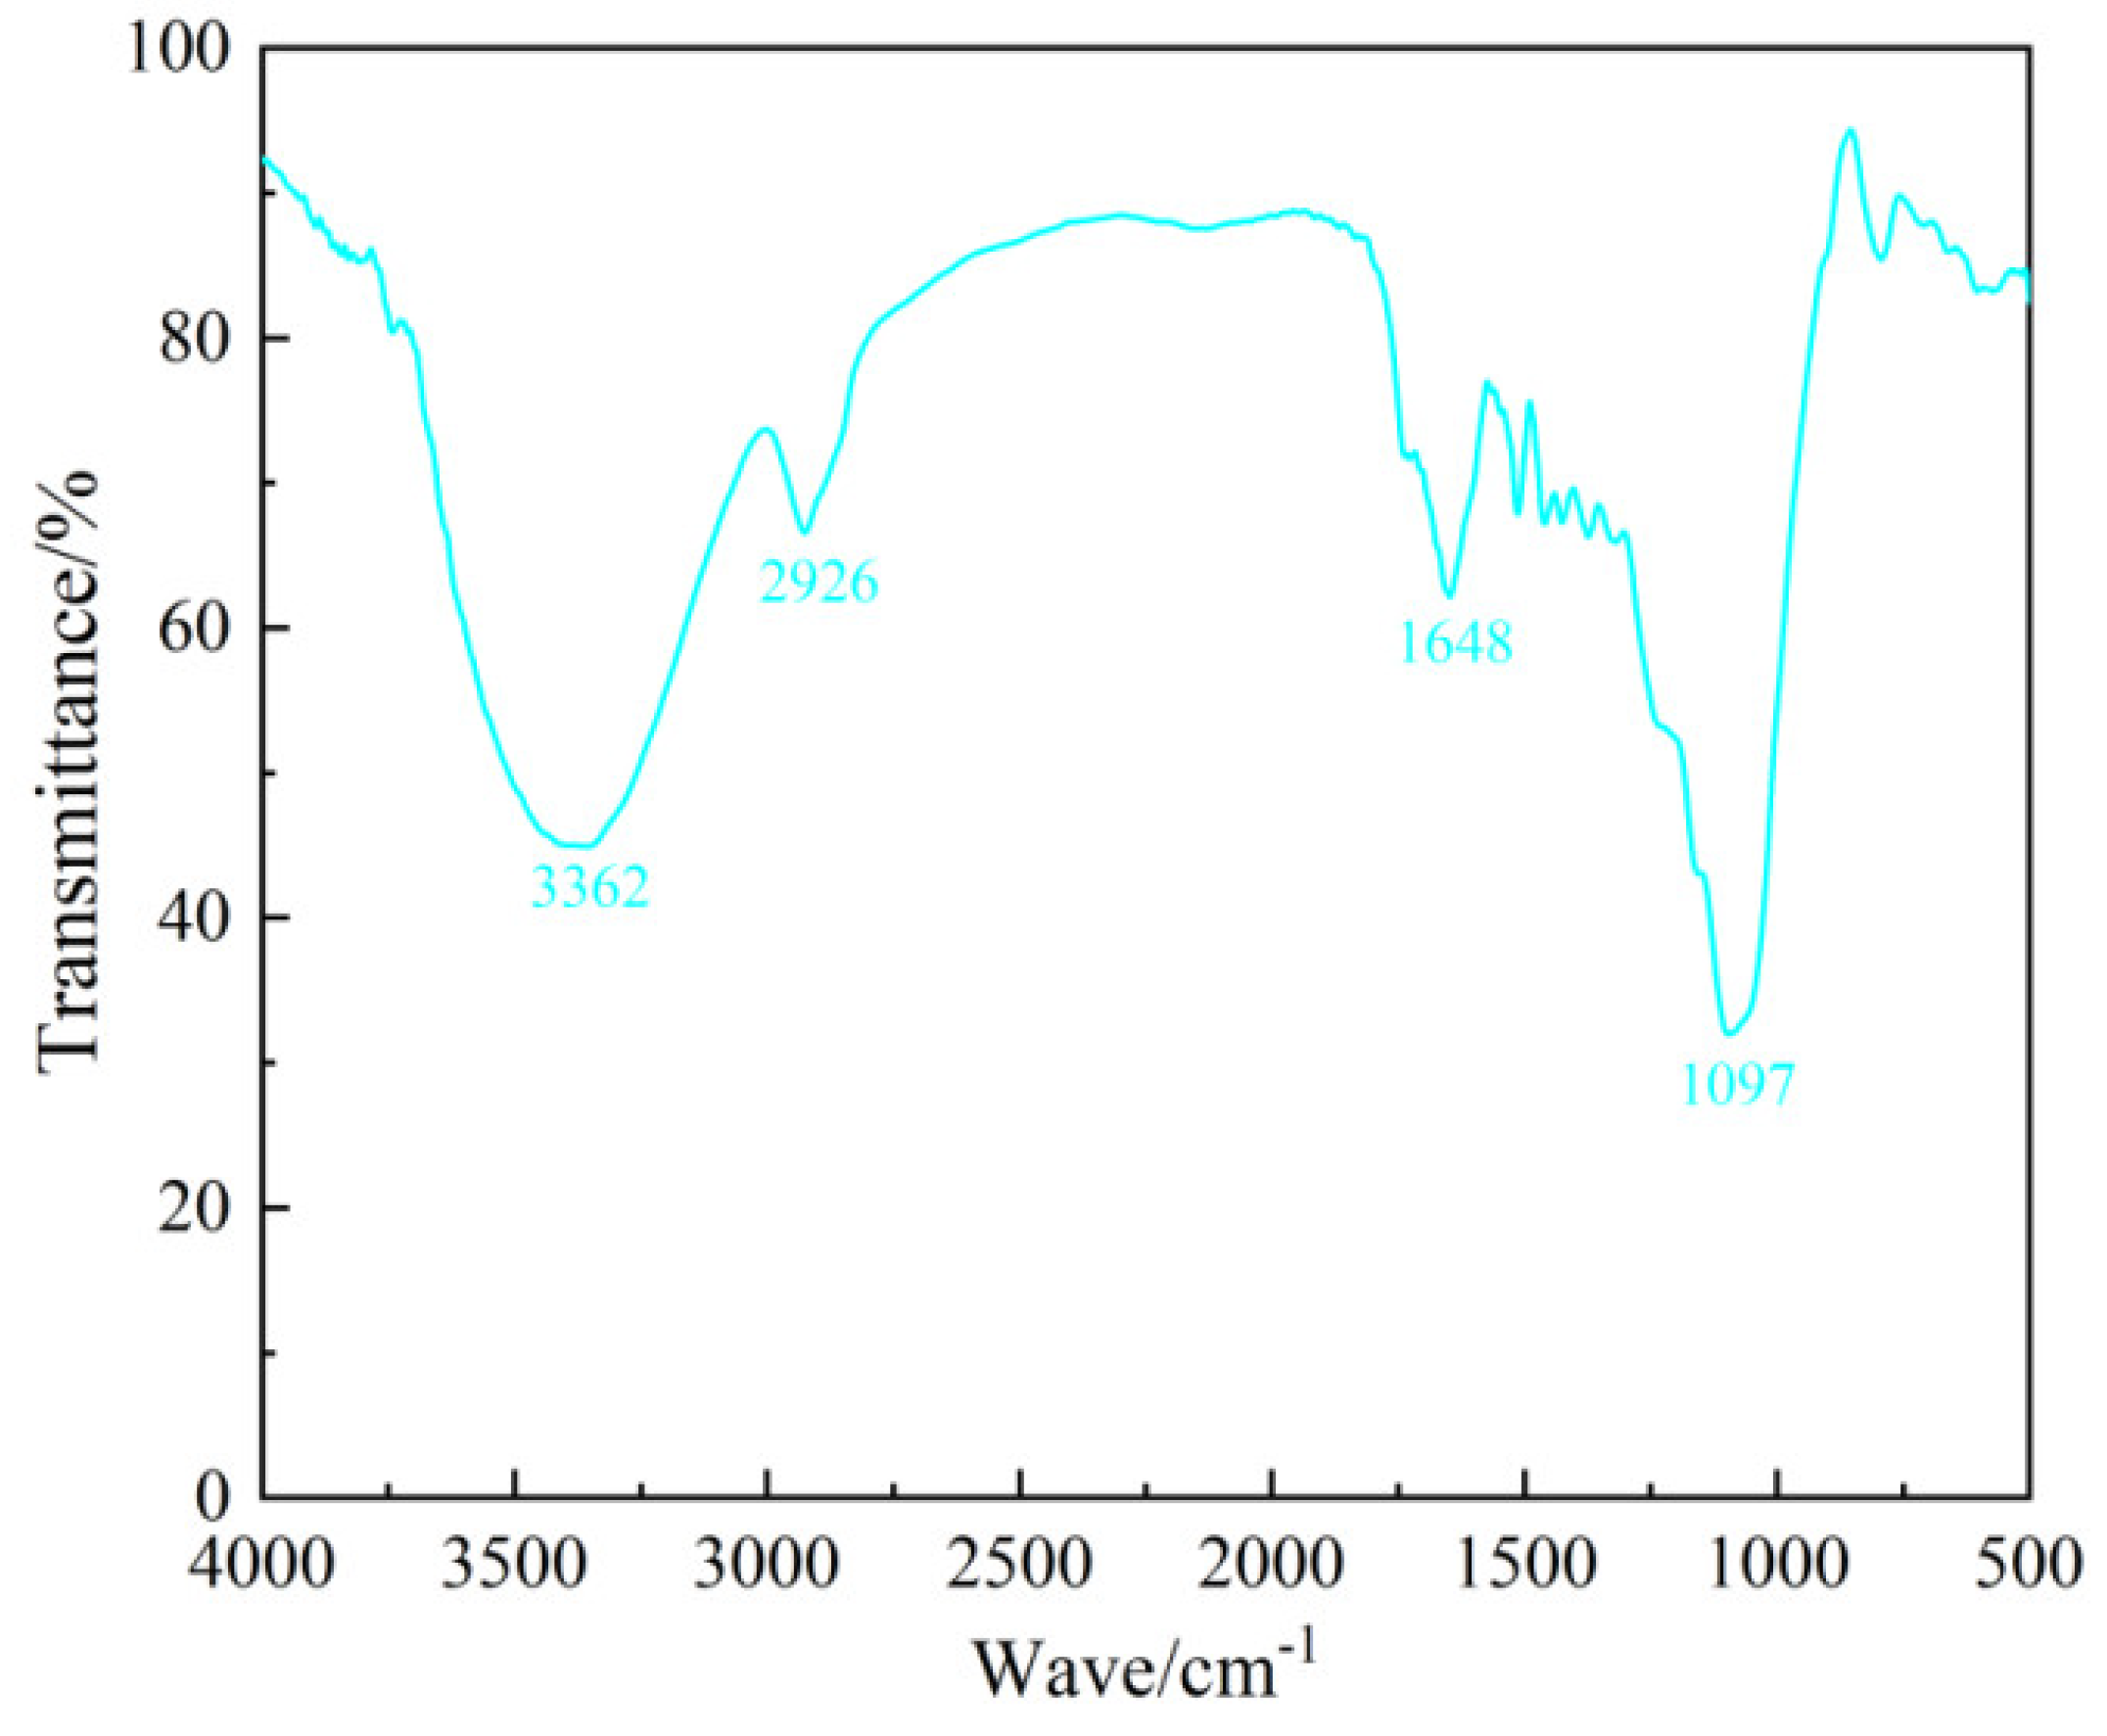
Figure 1 shows that the absorption peak at 3362 cm
–1 corresponds to the –OH stretching, linked to cellulose and lignin. The distinct peak at 2926 cm
–1mainly originates from the asymmetric and symmetric stretching vibrations of –CH
2 groups [
25,
26]. The peak at 1648 cm
–1 signifies the stretching vibration of conjugated carbonyl groups (C=O), while the peak at 1097 cm
–1 is associated with the stretching vibration of primary alcohols (C–O) [
27].
2.1.3. FESEM Analysis
FESEM was employed to examine the microstructural characteristics of the bamboo sample.
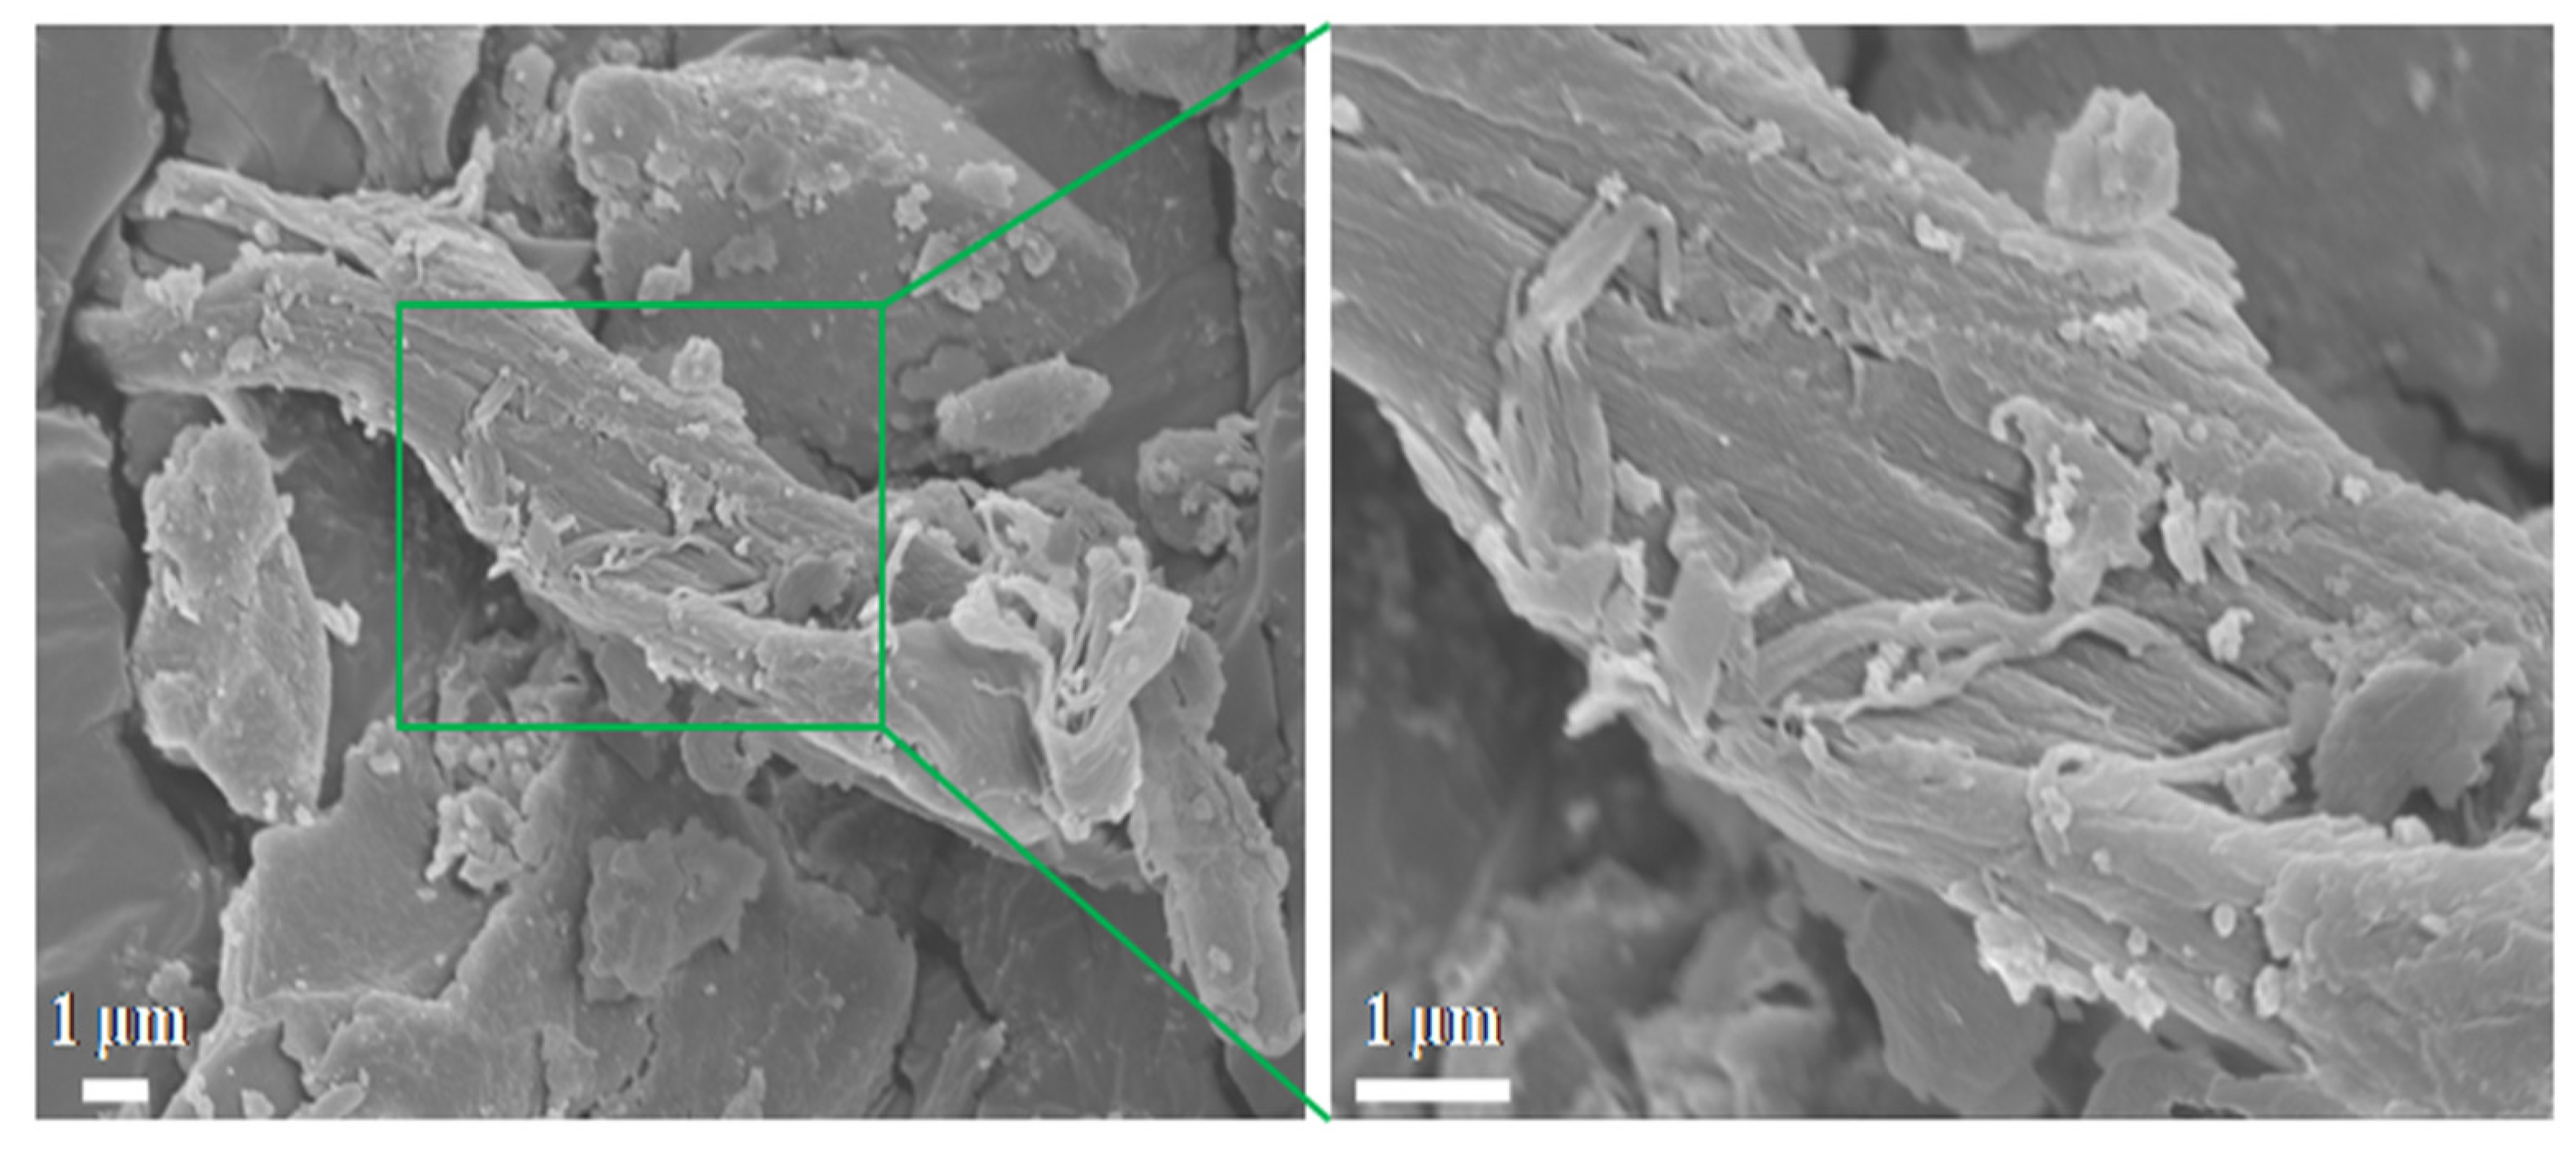
Figure 2 indicates that the bamboo exhibits an irregular, rod-like morphology with fibrous flakes on its surface. Additionally, the presence of nano-sized adsorption particles is visible on the surface.
2.1.4. XRD Analysis
To investigate the crystallinity of bamboo, XRD analysis was performed. The measurement was conducted within the 2θ angle range of 10° to 80° at a scanning rate of 2° per minute, utilizing CuKα radiation.
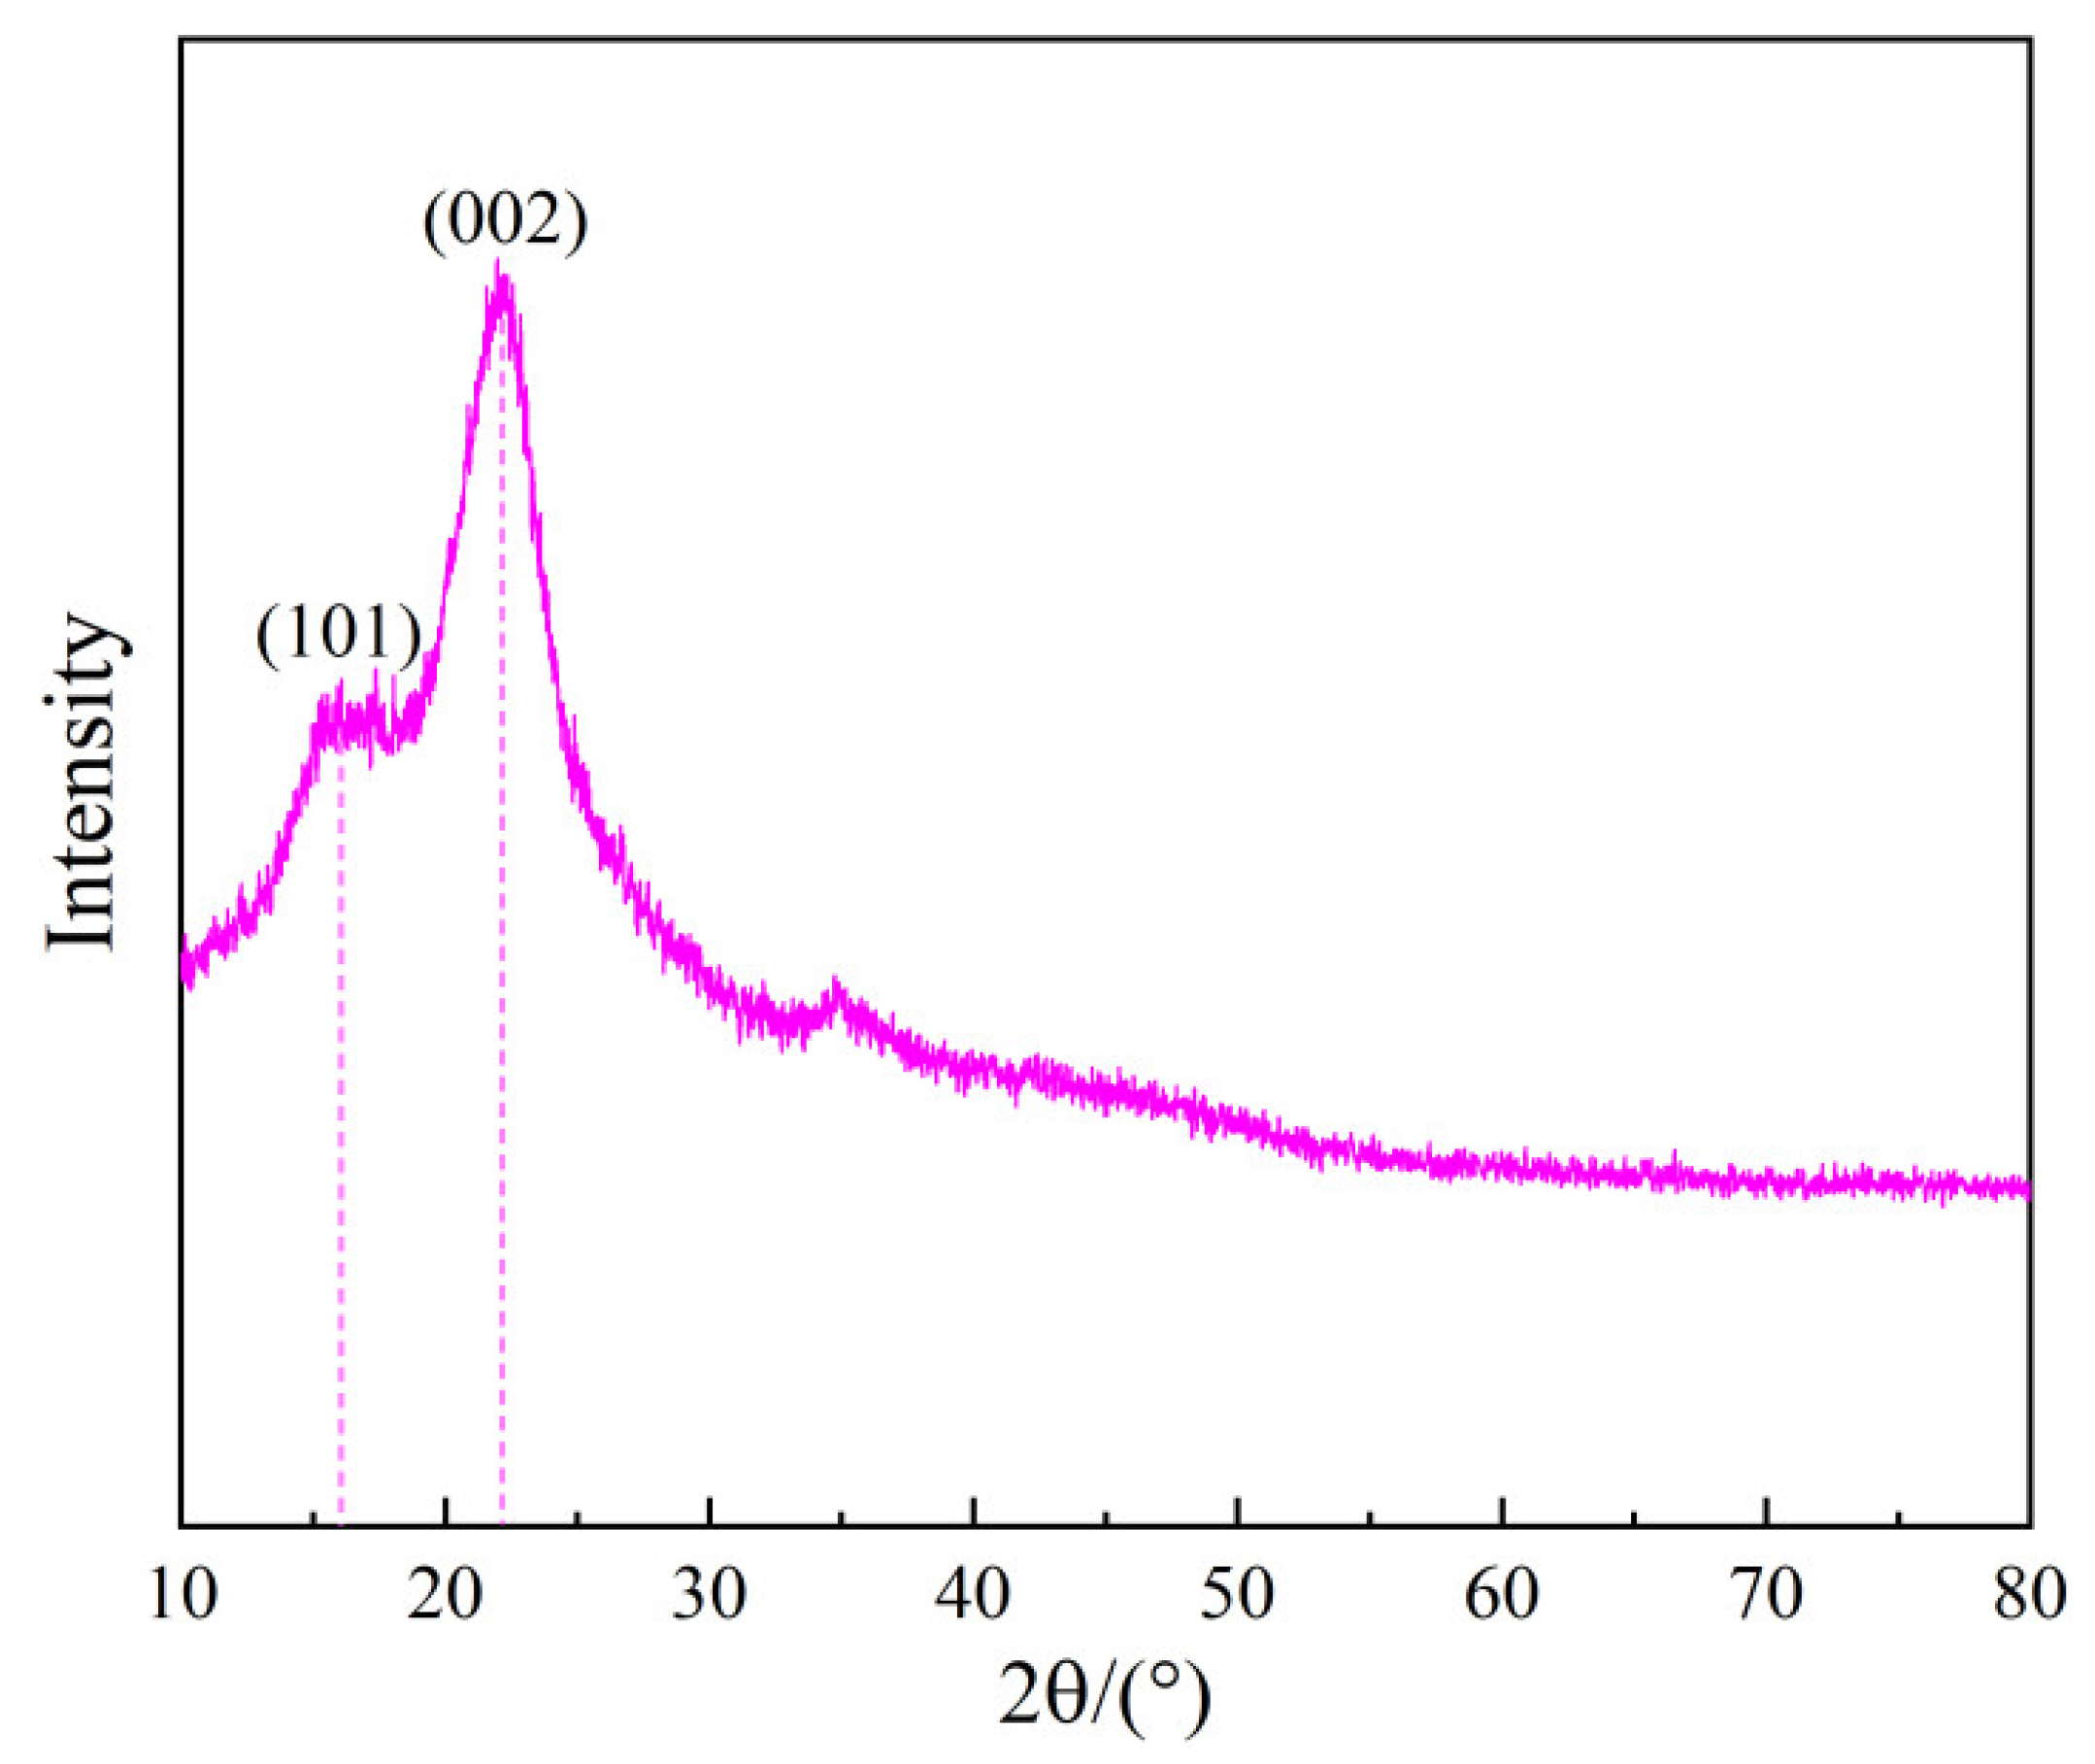
Figure 3 reveals that bamboo possesses both crystalline and amorphous structures. The diffraction peaks observed at 15.8° and 21.9° correspond to the (101) and (002) planes in cellulose, respectively [
28].
2.2. Experimental Procedures
TGA was carried out using ananalyzer (TGA5500, Milford, USA). To reduce the impact of thermal conduction within the sample, approximately 8±0.5 mg of the prepared material was kept in an alumina crucible. The temperature was then increased from 303 K to 1073 K at heating rates of 10, 20, and 30 K/min, conducted in a nitrogen environment for pyrolysis and an air atmosphere for combustion, with a constant gas flow rate of 100 mL/min. The chosen heating rates were sufficiently low to ensure efficient homogeneous decomposition while minimizing mass and heat transfer effects [
29]. The real-time mass loss of the sample was continuously explored throughout the tests. To improve accuracy and reproducibility, each experiment was conducted three times to reduce the potential for errors due to vibrations.
2.3. Kinetic Method
Kinetic analysis is essential for gaining insights into the reaction processes of biomass. Following the guidelines [
30,
31], this study utilized model-free methods such as FWO, KAS, and STR to calculate the kinetic parameters. The reaction rate for the solid–gas interaction can be mathematically expressed in the form below [
32]:
where
α stands for the conversion degree,
k(
T) represents the reaction rate constant,
t denotes the pyrolysis or combustion time, and
f(
α) is defined as the differential expression of the reaction model. The conversion degree during the pyrolysis or combustion process can be obtained from TGA data.
where
m0,
mt, and
mr stand for the initial, instant, and residual mass of bamboo during the pyrolysis or combustion process, respectively. The expression of
k(
T) can be acquired based on the Arrhenius law:
where
T denotes the pyrolysis or combustion temperature,
A stands for the pre-exponential factor,
R is the universal gas constant, and
Eαis defined as the activation energy. Combining Equations (1) and (3) at a constant heating rate (
β=d
T/d
t) and rearranging, Equation (4) yields:
The integral form of f(α) is:
2.3.1. FWO Method
In this approach, the Doyle’s approximation for temperature integration is employed [
33,
34]. Then,
Eα can be derived from the gradientof the regression lines, specifically using the formula −1.052
Eα/
R.
2.3.2. KAS Method
In this approach,
Eais obtainedfrom the slope of the straight line fitted to the plot ofln(
β/
T2 ) versus 1/
T [
35], specifically using the formula −
Eα/
R.
2.3.3. STR Method
For the STR method,
Ea is determined from the slope of the straight line fitted to the plot of ln(
β/
T1.92) versus 1/
T [
36], specifically using the formula −1.0008
Eα/
R.
2.6. Thermodynamic Method
Based on the activation energy, the pre-exponential factor
A and thermodynamic parameters, like enthalpy (Δ
H), Gibbs free energy (Δ
G), and entropy (Δ
S), can be evaluated as follows [
37]:
where
kB=1.381 ×10
−23 J/K represents the Boltzmann constant and
h=6.626 × 10
−34 J/s is Planck’s constant. The pre-exponential factor can be evaluated from Kissinger’s method [
38].
3. Results and Discussion
3.1. Pyrolysis and Combustion Properties
3.1.1. Pyrolysis Characteristics
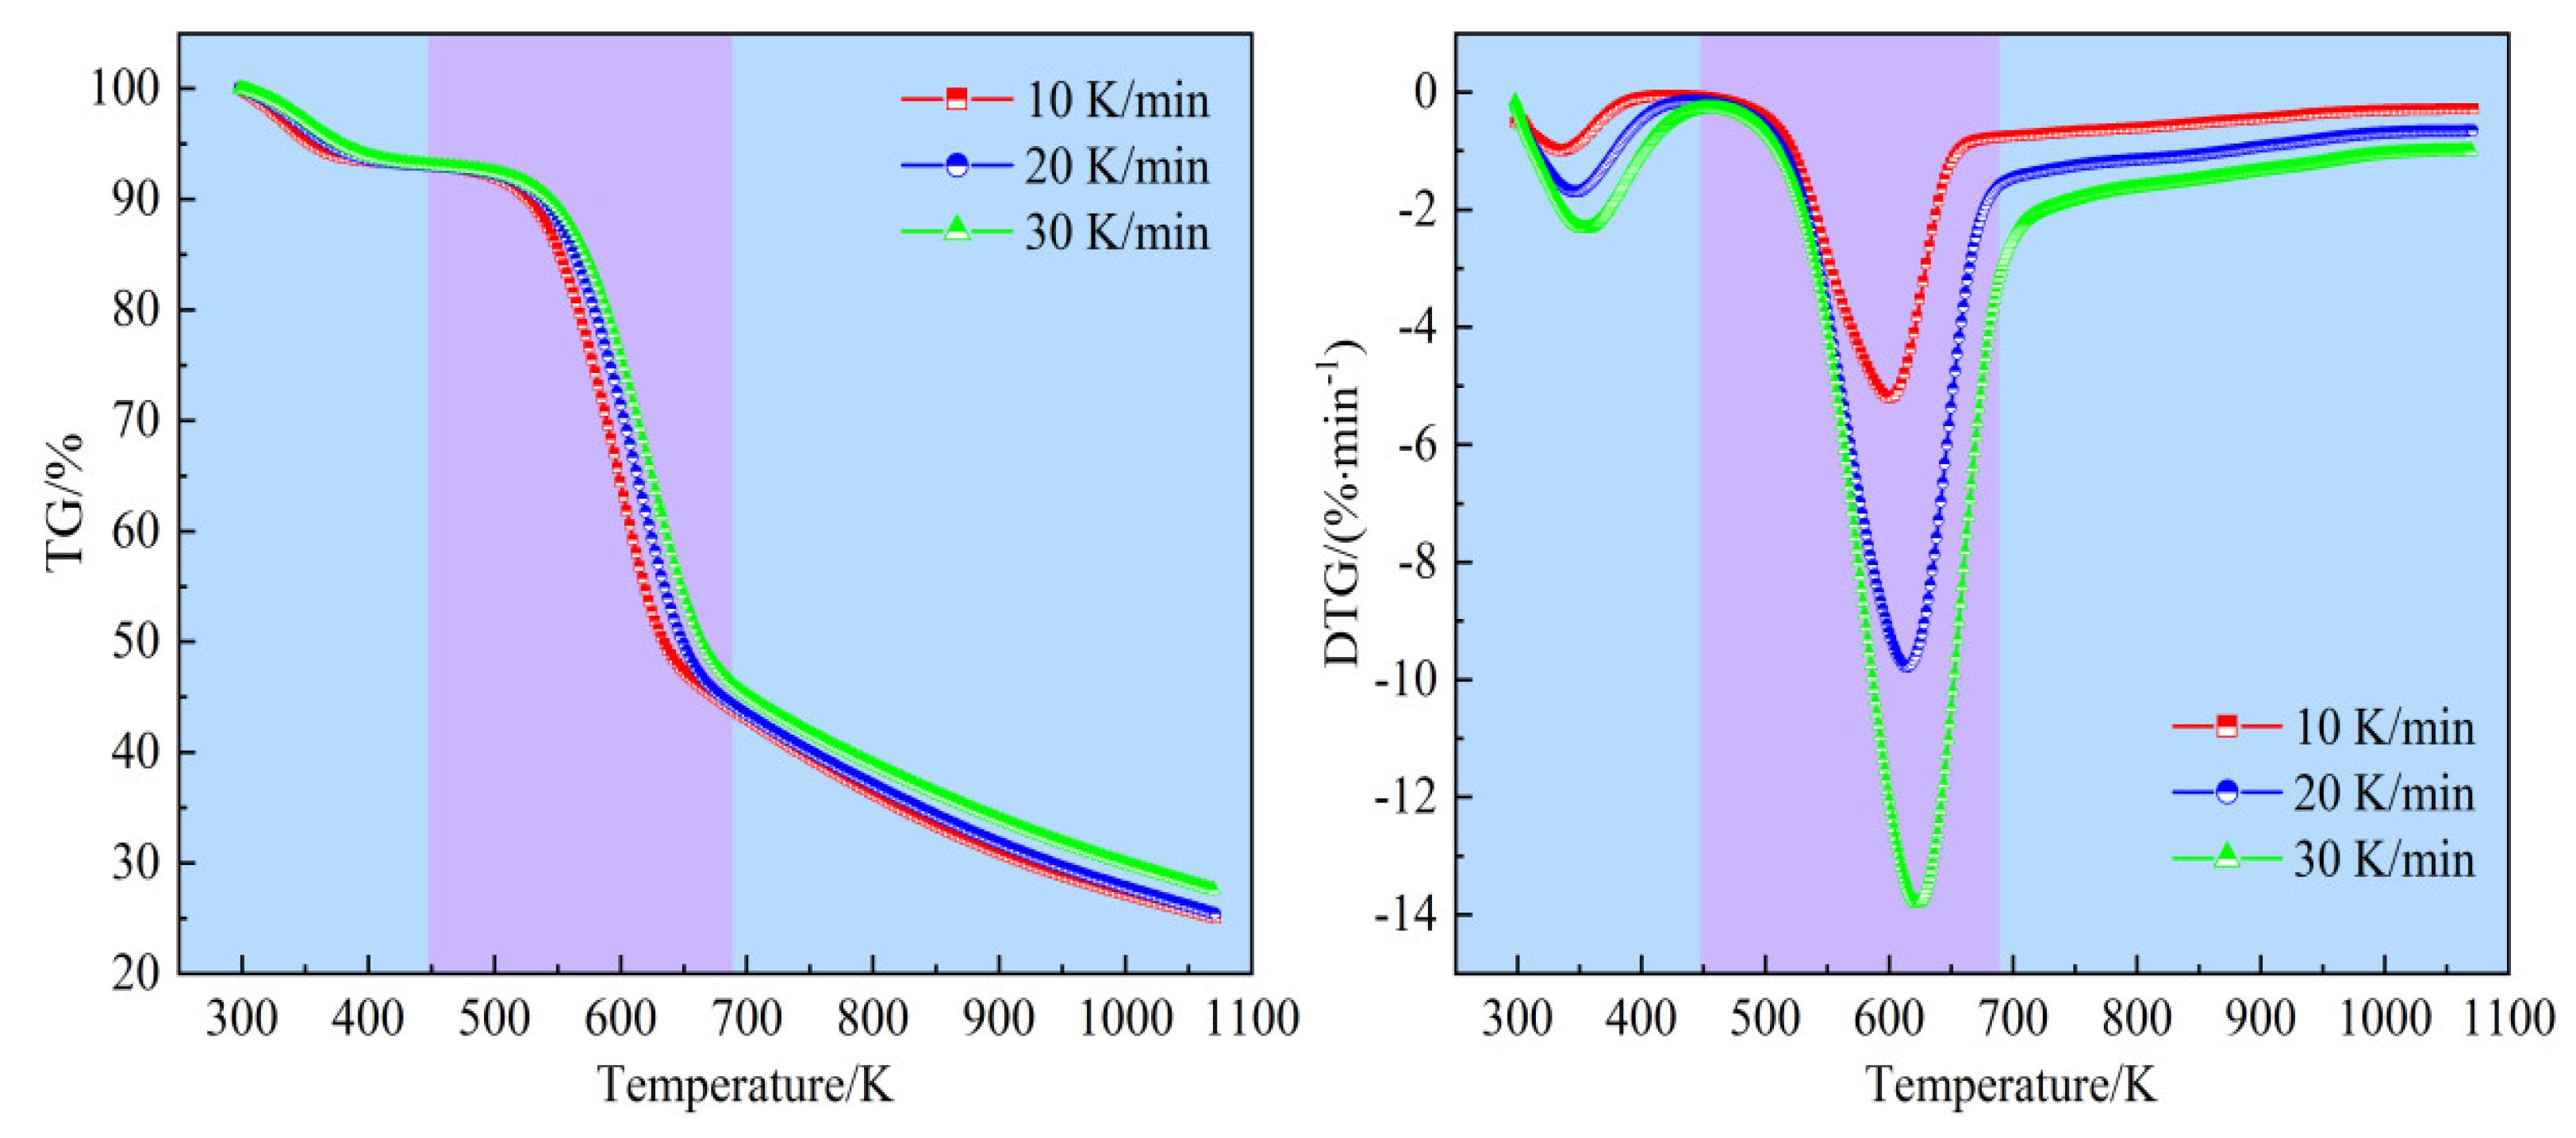
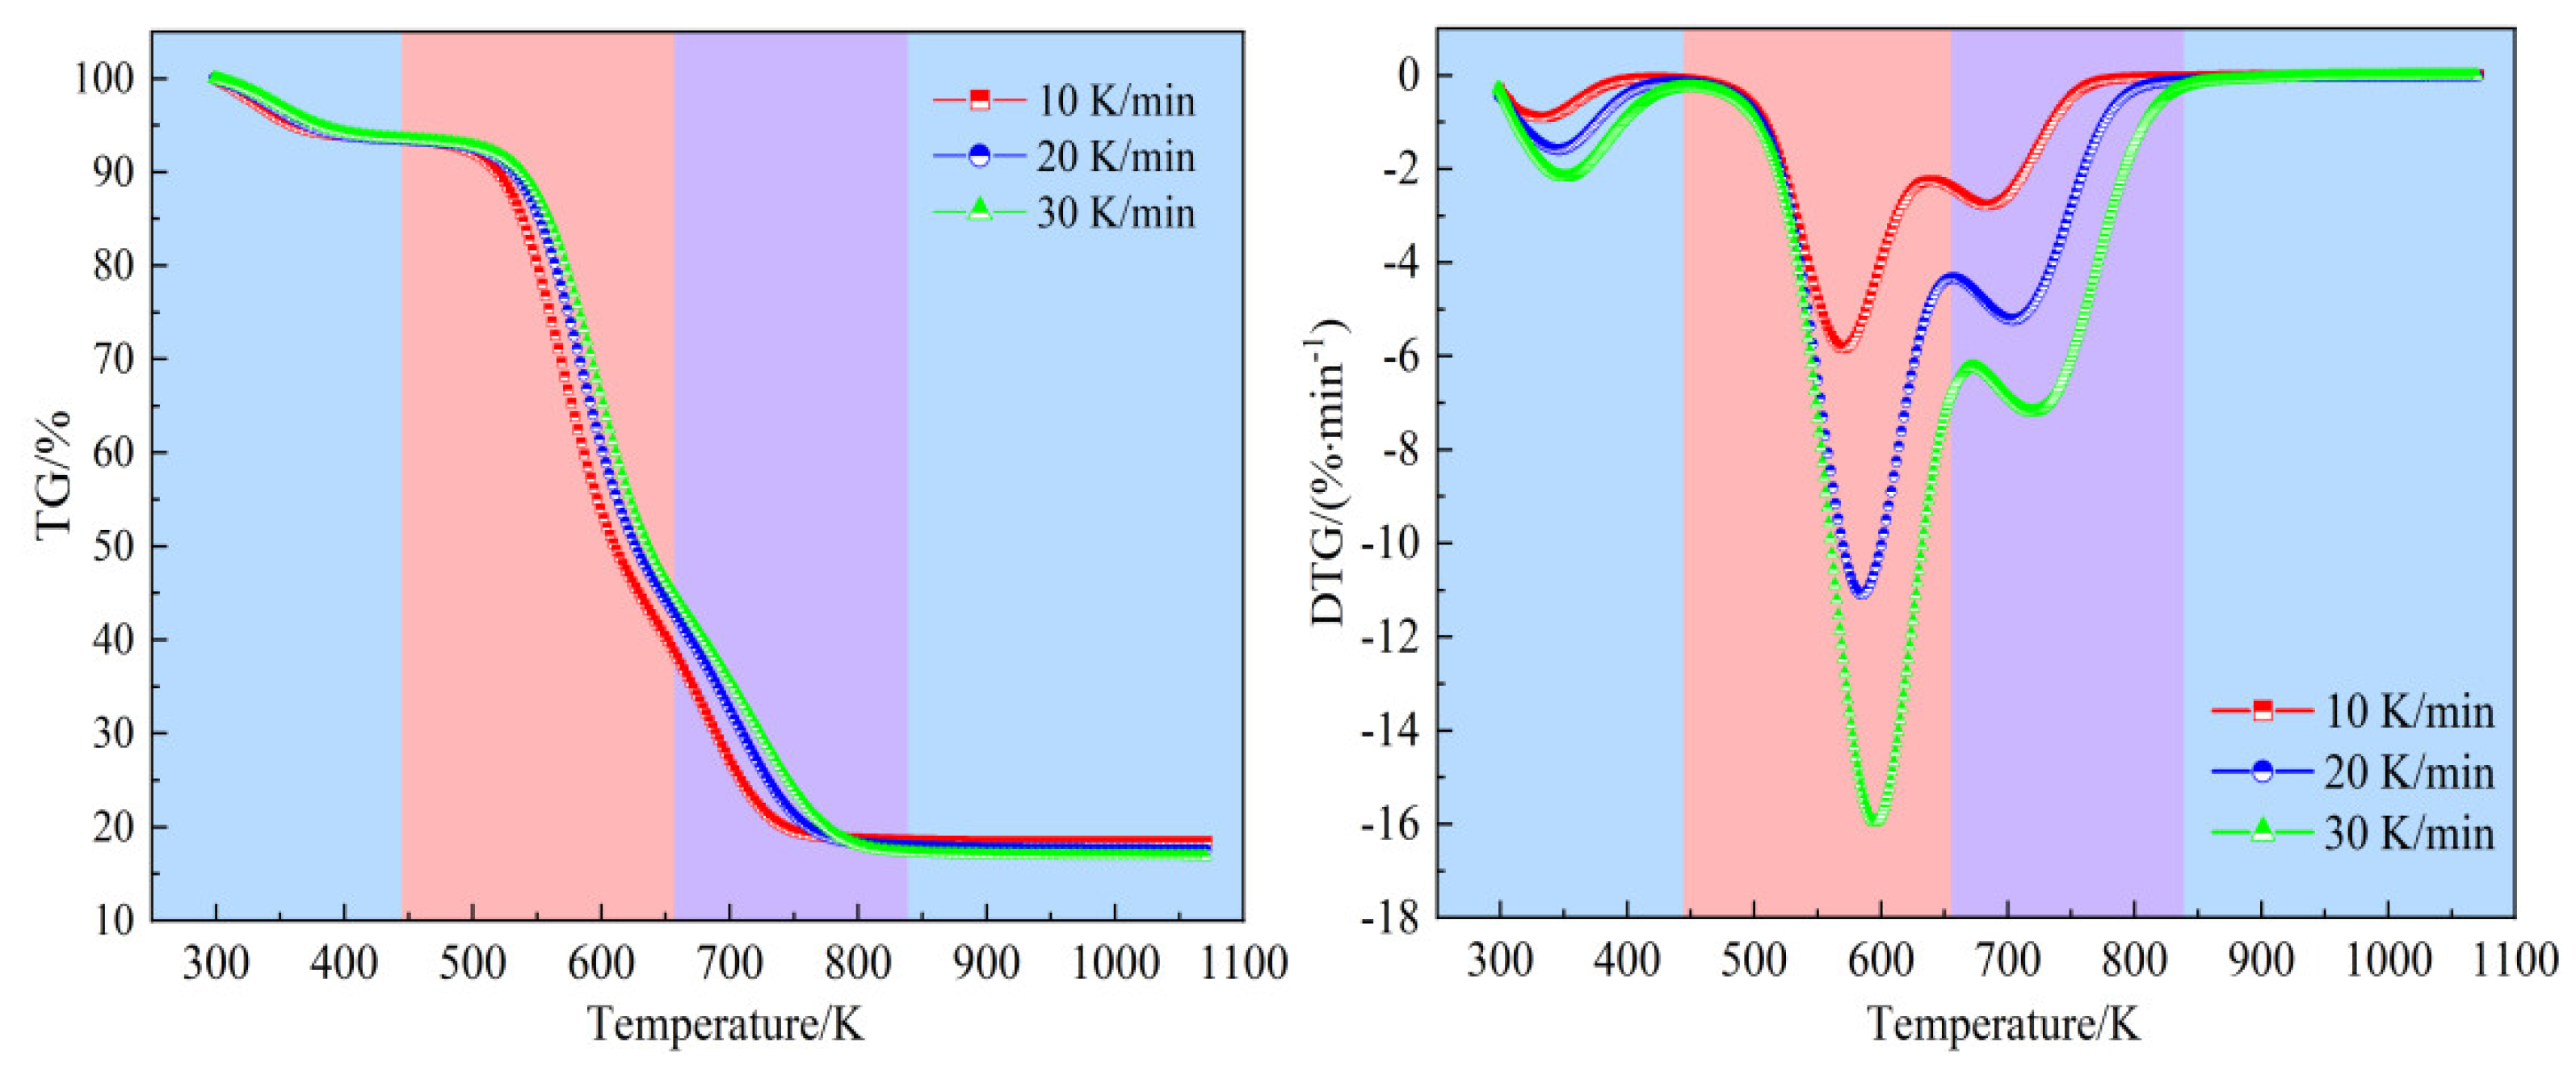
Figure 4 illustrates the pyrolysis of bamboo samples at various heating rates. It is observed that this process can be segmented into three distinct stages. Take the curves at a heating rate of 20 K/min as an example, stage I spans from ambient temperature to 448.12 K and is primarily associated with the evaporation of moisture. During this stage, the weight loss is minimal, constituting about 6.95% of the total weight loss, which highly aligns with the moisture content listed in
Table 1. Stage II, known as the devolatilization stage, occurs between 448.12 K and 690.29 K. In this stage, hemicellulose, cellulose, and most of the lignin undergo pyrolysis, releasing a significant amount of volatiles. This stage accounts for the major weight loss, with approximately 48.89% of the bambo
o’s mass being lost, and the maximum weight loss rate reaching 9.78% per minute. Stage III, the carbonization stage, spans from 690.29 K to the end of the process. The TG curve in this stage shows a gradual decline, attributed to the ongoing decomposition of the remaining lignin, carbon precipitation, and ash formation. The weight loss during this stage is about 18.74%, leaving a residual mass of 25.42%.
Table 2 summarizes the affecting parameters of the main pyrolysis stages (Stage II and Stage III) at various heating rates.
Ta signifies the initial pyrolysis temperature, established through the intersection method [
39], while
Tb refers to the final pyrolysis temperature, where the conversion rate reaches 98% [
40].
Tmax is the temperature corresponding to the maximum weight loss rate during pyrolysis, and
Vmax is the peak weight loss rate. The data indicate that the heating rate has a negligible effect on weight loss during each stage and on the final residual mass. It is observed that
Ta,
Tb, and
Tmax increase progressively with rising heating rates. This increase may originate from the need for higher pyrolysis temperatures to achieve similar pyrolysis outcomes at elevated heating rates, due to thermal lag. Additionally, the temperature difference between the surface and interior of bamboo particles becomes more pronounced with increasing heating rate, shifting the overall TG and DTG curves to higher temperatures.
3.1.2. Combustion Characteristics
Figure 5 displays the TG and DTG profiles of the bamboo combustion, covering the temperature range from 300 K to 1073 K at various heating rates. It can be clearly seen that the combustion process consists of three stages: drying, devolatilization, and char combustion. The curves at a temperature ramp of 20 K/min demonstrate that the drying stage occurs between room temperature and 447.18 K, during which water evaporation causes a slight decrease in biomass weight. The weight loss in this stage, observed to be 6.97%, aligns closely with the moisture content indicated in the proximate analysis in
Table 1, mirroring the weight loss observed in the first stage of pyrolysis. The temperature range from 447.18 K to 658.11 K marks the devolatilization stage. During this stage, hemicellulose and cellulose undergo pyrolysis, producing volatiles that subsequently combust. This leads to a significant reduction in biomass weight, with the TG curve steepening. The bamboo powder experiences a weight loss of approximately 50.97%, with the maximum weight loss rate reaching 11.09% per minute. The final stage, from 658.11 K to 839.17 K, is the char combustion stage. Here, lignin is pyrolyzed into char and then combusted. As the temperature increases, the lignin decomposes, and the char combusts, further reducing the biomass weight. The weight loss in this stage is about 24.51%. The weight loss rate accelerates once again, peaking at a certain temperature before decreasing, leading to a second peak in the DTG curve. After complete combustion, the biomass weight stabilizes with a residual mass of 17.55%, which closely corresponds to the ash content listed in
Table 1, and the curves flatten out.
Table 3 presents the characteristic parameters of the main combustion stages (Stage II and Stage III) for bamboo at various heating rates. The ignition temperature
Ti and burnout temperature
Tf are defined in the same way as pyrolysis. Similar to pyrolysis, the heating rate exhibits a negligible impact on weight loss during each stage and on the final residual mass. However, the characteristic combustion temperatures
Ti,
Tmax, and
Tf tend to increase with higher heating rates due to thermal lag [
41].
3.1.3. Comparison of Pyrolysis and Combustion Characteristics
Under nitrogen and air atmospheres, the TG/DTG curves demonstrate distinct behaviors, particularly regarding the temperature ranges at the same heating rate. The temperature intervals for the primary pyrolysis and combustion stages differ depending on the atmosphere, as detailed in
Table 2 and
Table 3. The oxidative devolatilization process is more pronounced and occurs within a narrower temperature range compared to the devolatilization during pyrolysis. When decomposition occurs in an air atmosphere, the maximum weight loss takes place in two phases: devolatilization (Stage II) and char combustion (Stage III). The rate of weight loss is faster in an air atmosphere compared to a nitrogen atmosphere. However, the weight loss in each stage remains unaffected by variations in the heating rate during either pyrolysis or combustion.
The peak temperatures during the oxidative devolatilization stage, observed at 569.71 K, 584.79 K, and 595.23 K for combustion, are lower than those for pyrolysis, which occur at 599.47 K, 614.93 K, and 621.97 K at different heating rates. This suggests that the presence of oxygen in the air accelerates the reaction, causing volatile substances to be released earlier within the temperature range. During stage III of combustion, the reaction rate increases, leading to a vigorous reaction between the bamboo char and oxygen, resulting in the production of a significant amount of CO2 and H2O, and consequently, greater weight loss compared to stage III of pyrolysis. Additionally, the combustion of bamboo in an air atmosphere yields fewer residues due to char combustion, whereas more residues remain when heating occurs in a nitrogen environment.
The dominant stages exhibit differences in the extent of conversion for pyrolysis and combustion. For instance, at a heating rate of 20 K/min, the devolatilization stage for pyrolysis covers a conversion range of α = 0.124–0.749, while for combustion, it spans α = 0.099–0.698. The final stage for pyrolysis (carbonization) covers α = 0.749–0.980, whereas the combustion stage (char combustion) spans α = 0.698–0.980. These variations in the degree of fractional conversion highlight the significant influence of the surrounding atmosphere on the thermochemical process.
3.2. Pyrolysis and Combustion Kinetics
3.2.1. Pyrolysis Kinetics
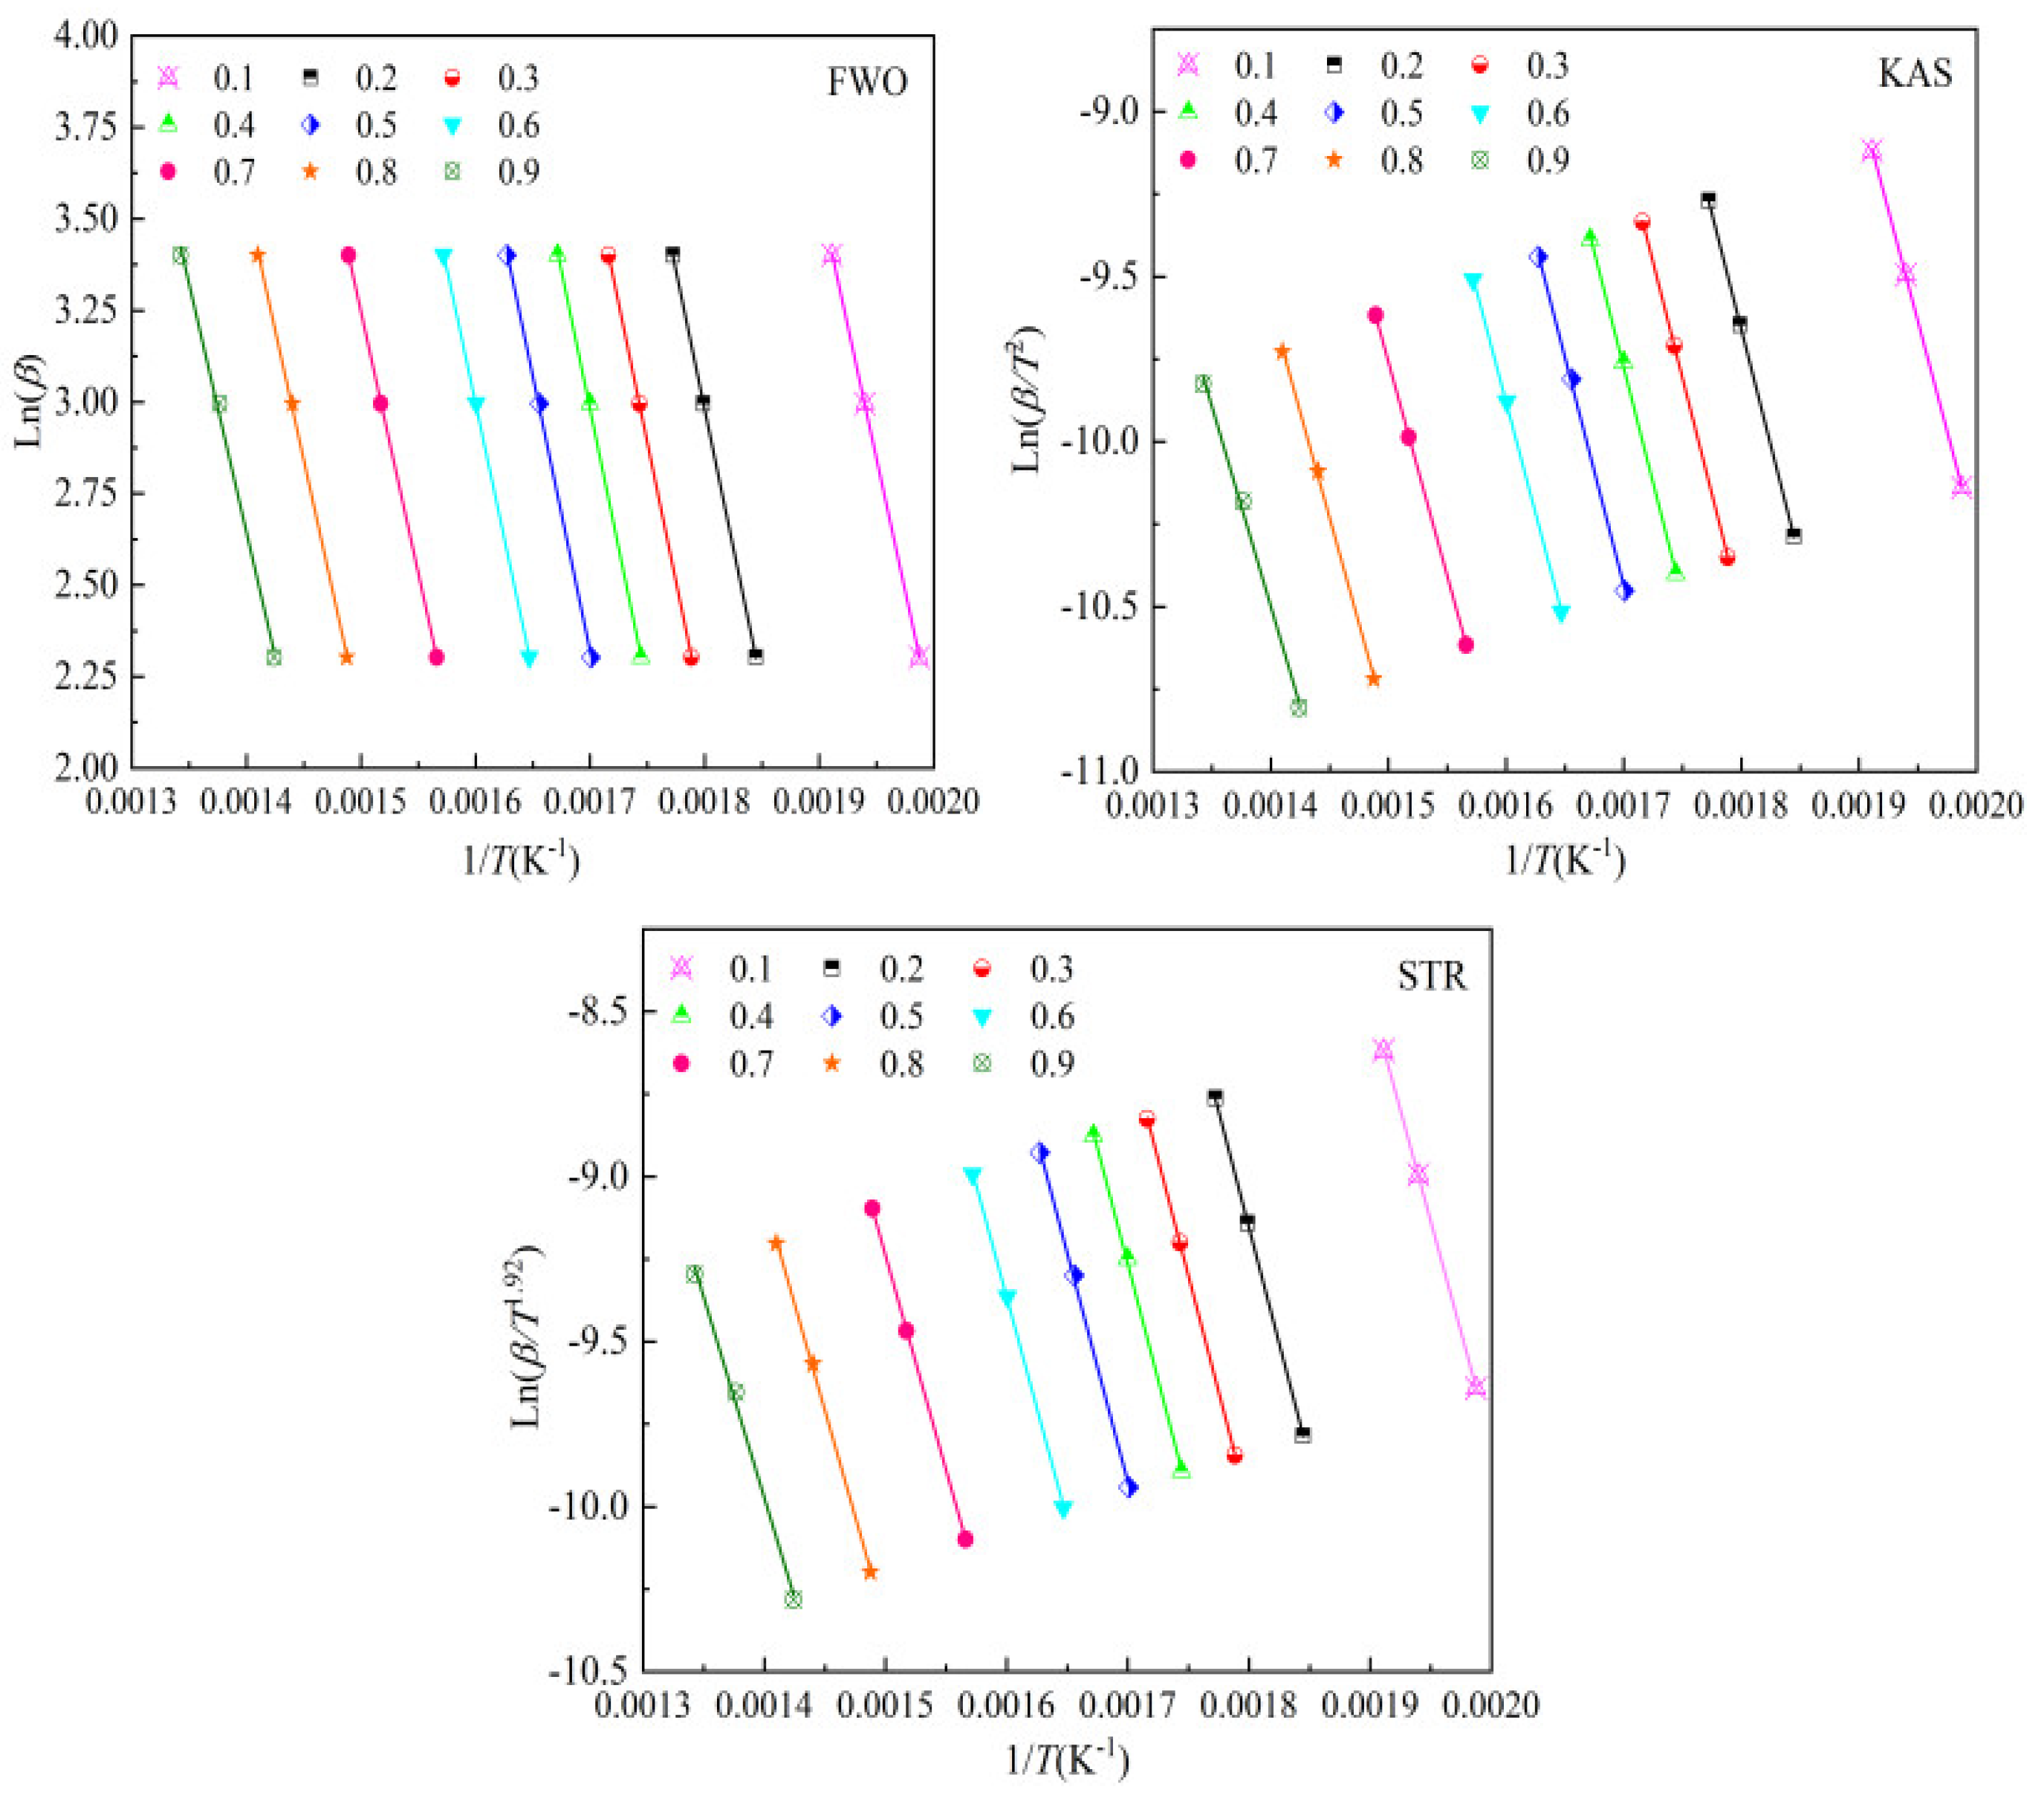
The activation energy was determined using isoconversional methods (KAS, FWO, and STR) across conversion ranges from 0.10 to 0.90, with intervals of 0.10. The plots were generated based on Equations (6)–(8), as illustrated in
Figure 6.
Table 2 reveals that the conversion range from 0.20 to 0.90 falls within the dominant pyrolysis stage.
Table 4 presents the activation energy values for bamboo pyrolysis within this conversion range. All correlations are statistically robust, with the coefficient of determination values (
R2) between 0.9962 and 0.9999 and mean squared error values (MSE) values below 0.0021, confirming the reliability of the results.
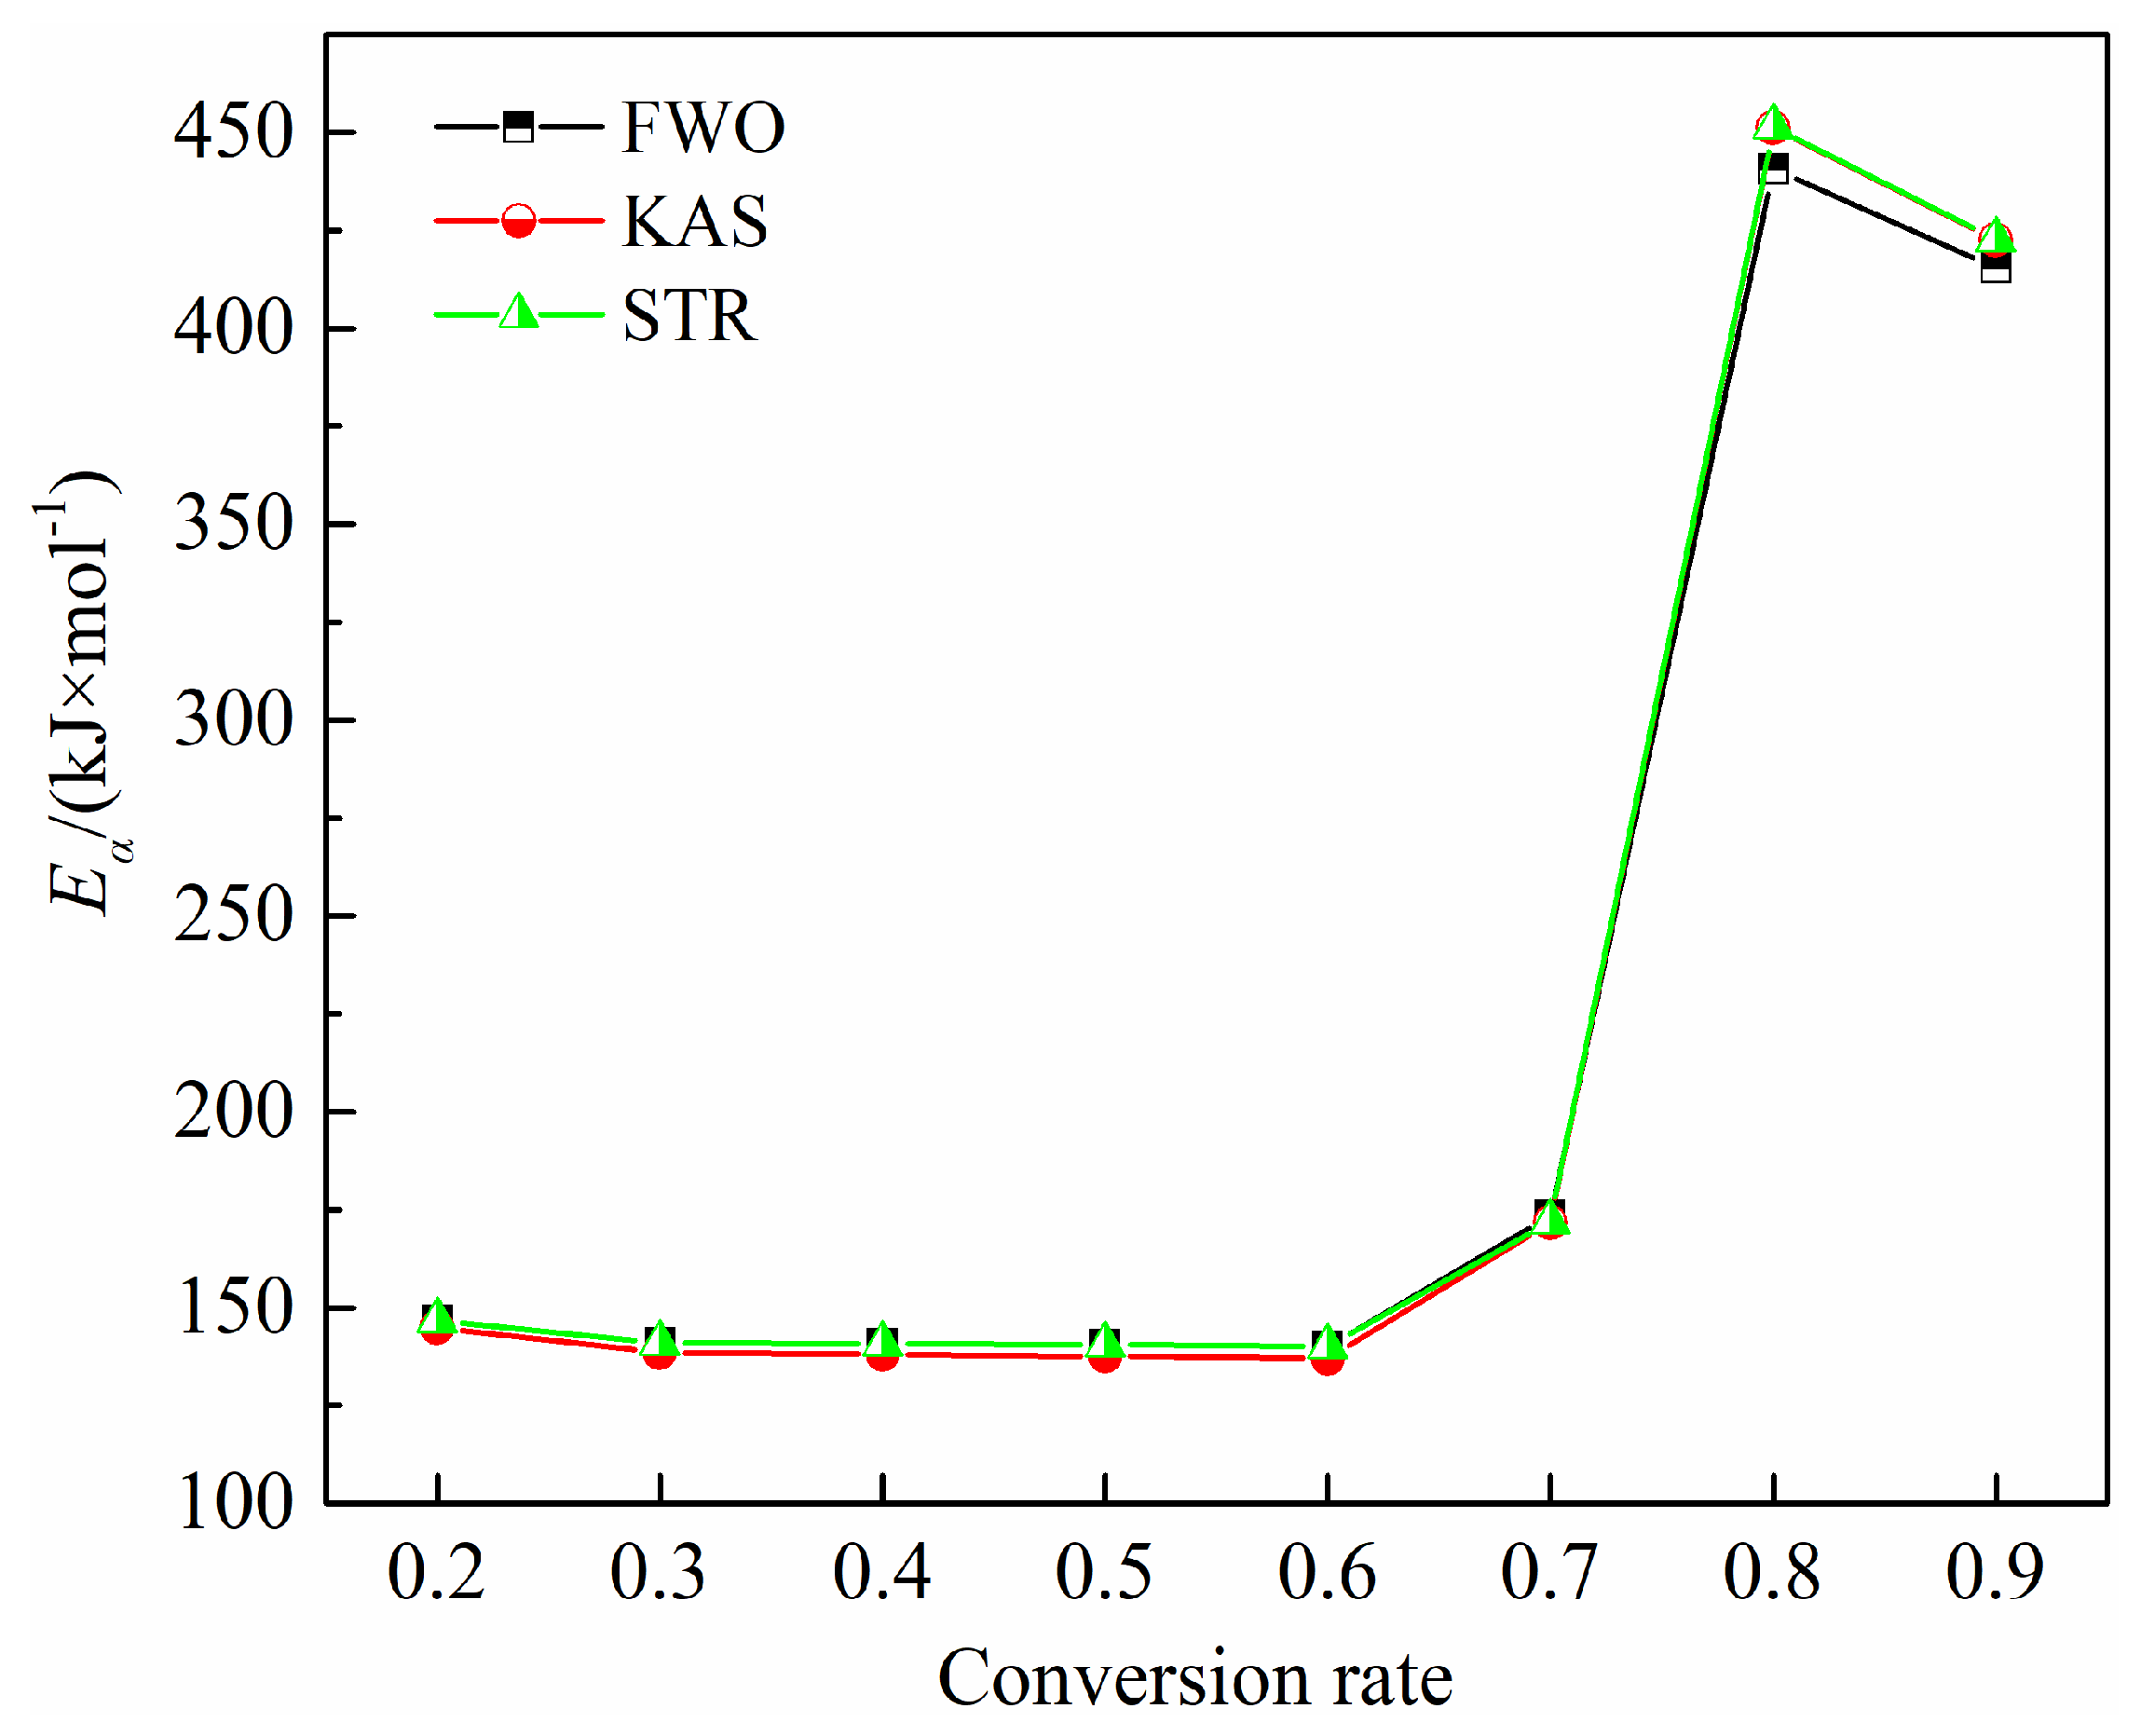
Figure 7 depicts the variations of
Eα across
α values ranging from 0.20 to 0.90 for all methods. It is observed that
Eα values and trends calculated by the three model-free methods are closely aligned. However, activation energy values fluctuate due to the multiple reactions occurring throughout the pyrolysis process. As noted in the previous analysis, the activation energy for bamboo powder pyrolysis at a conversion rate of 0.20–0.70 corresponds to stage II, while values of 0.80–0.90 relate to stage III. For conversion values between 0.20 and 0.60,
Eα decreases from 146.71 kJ/mol to 140.24 kJ/mol, as shown by the FWO method, with similar trends observed for other methods. This decrease in activation energy originates from the concurrent degradation of hemicellulose and cellulose in bamboo. The average activation energy for the devolatilization stage of bamboo pyrolysis is 147.15 kJ/mol, 144.69 kJ/mol, and 145.87 kJ/mol, based on FWO, KAS, and STR models. As the conversion value exceeds 0.70, the activation energy increases significantly due to the more difficult decomposition of lignin [
42], peaking at 440.73 kJ/mol, 451.28 kJ/mol, and 451.42 kJ/mol, according to the FWO, KAS, and STR methods, respectively. In the carbonization stage (Stage III), the activation energy shows a slight decrease within the conversion range of 0.80–0.90, with average values of approximately 428.07 kJ/mol, 436.88 kJ/mol, and 437.07 kJ/mol for FWO, KAS, and STR methods, respectively.
3.2.2. Combustion Kinetics
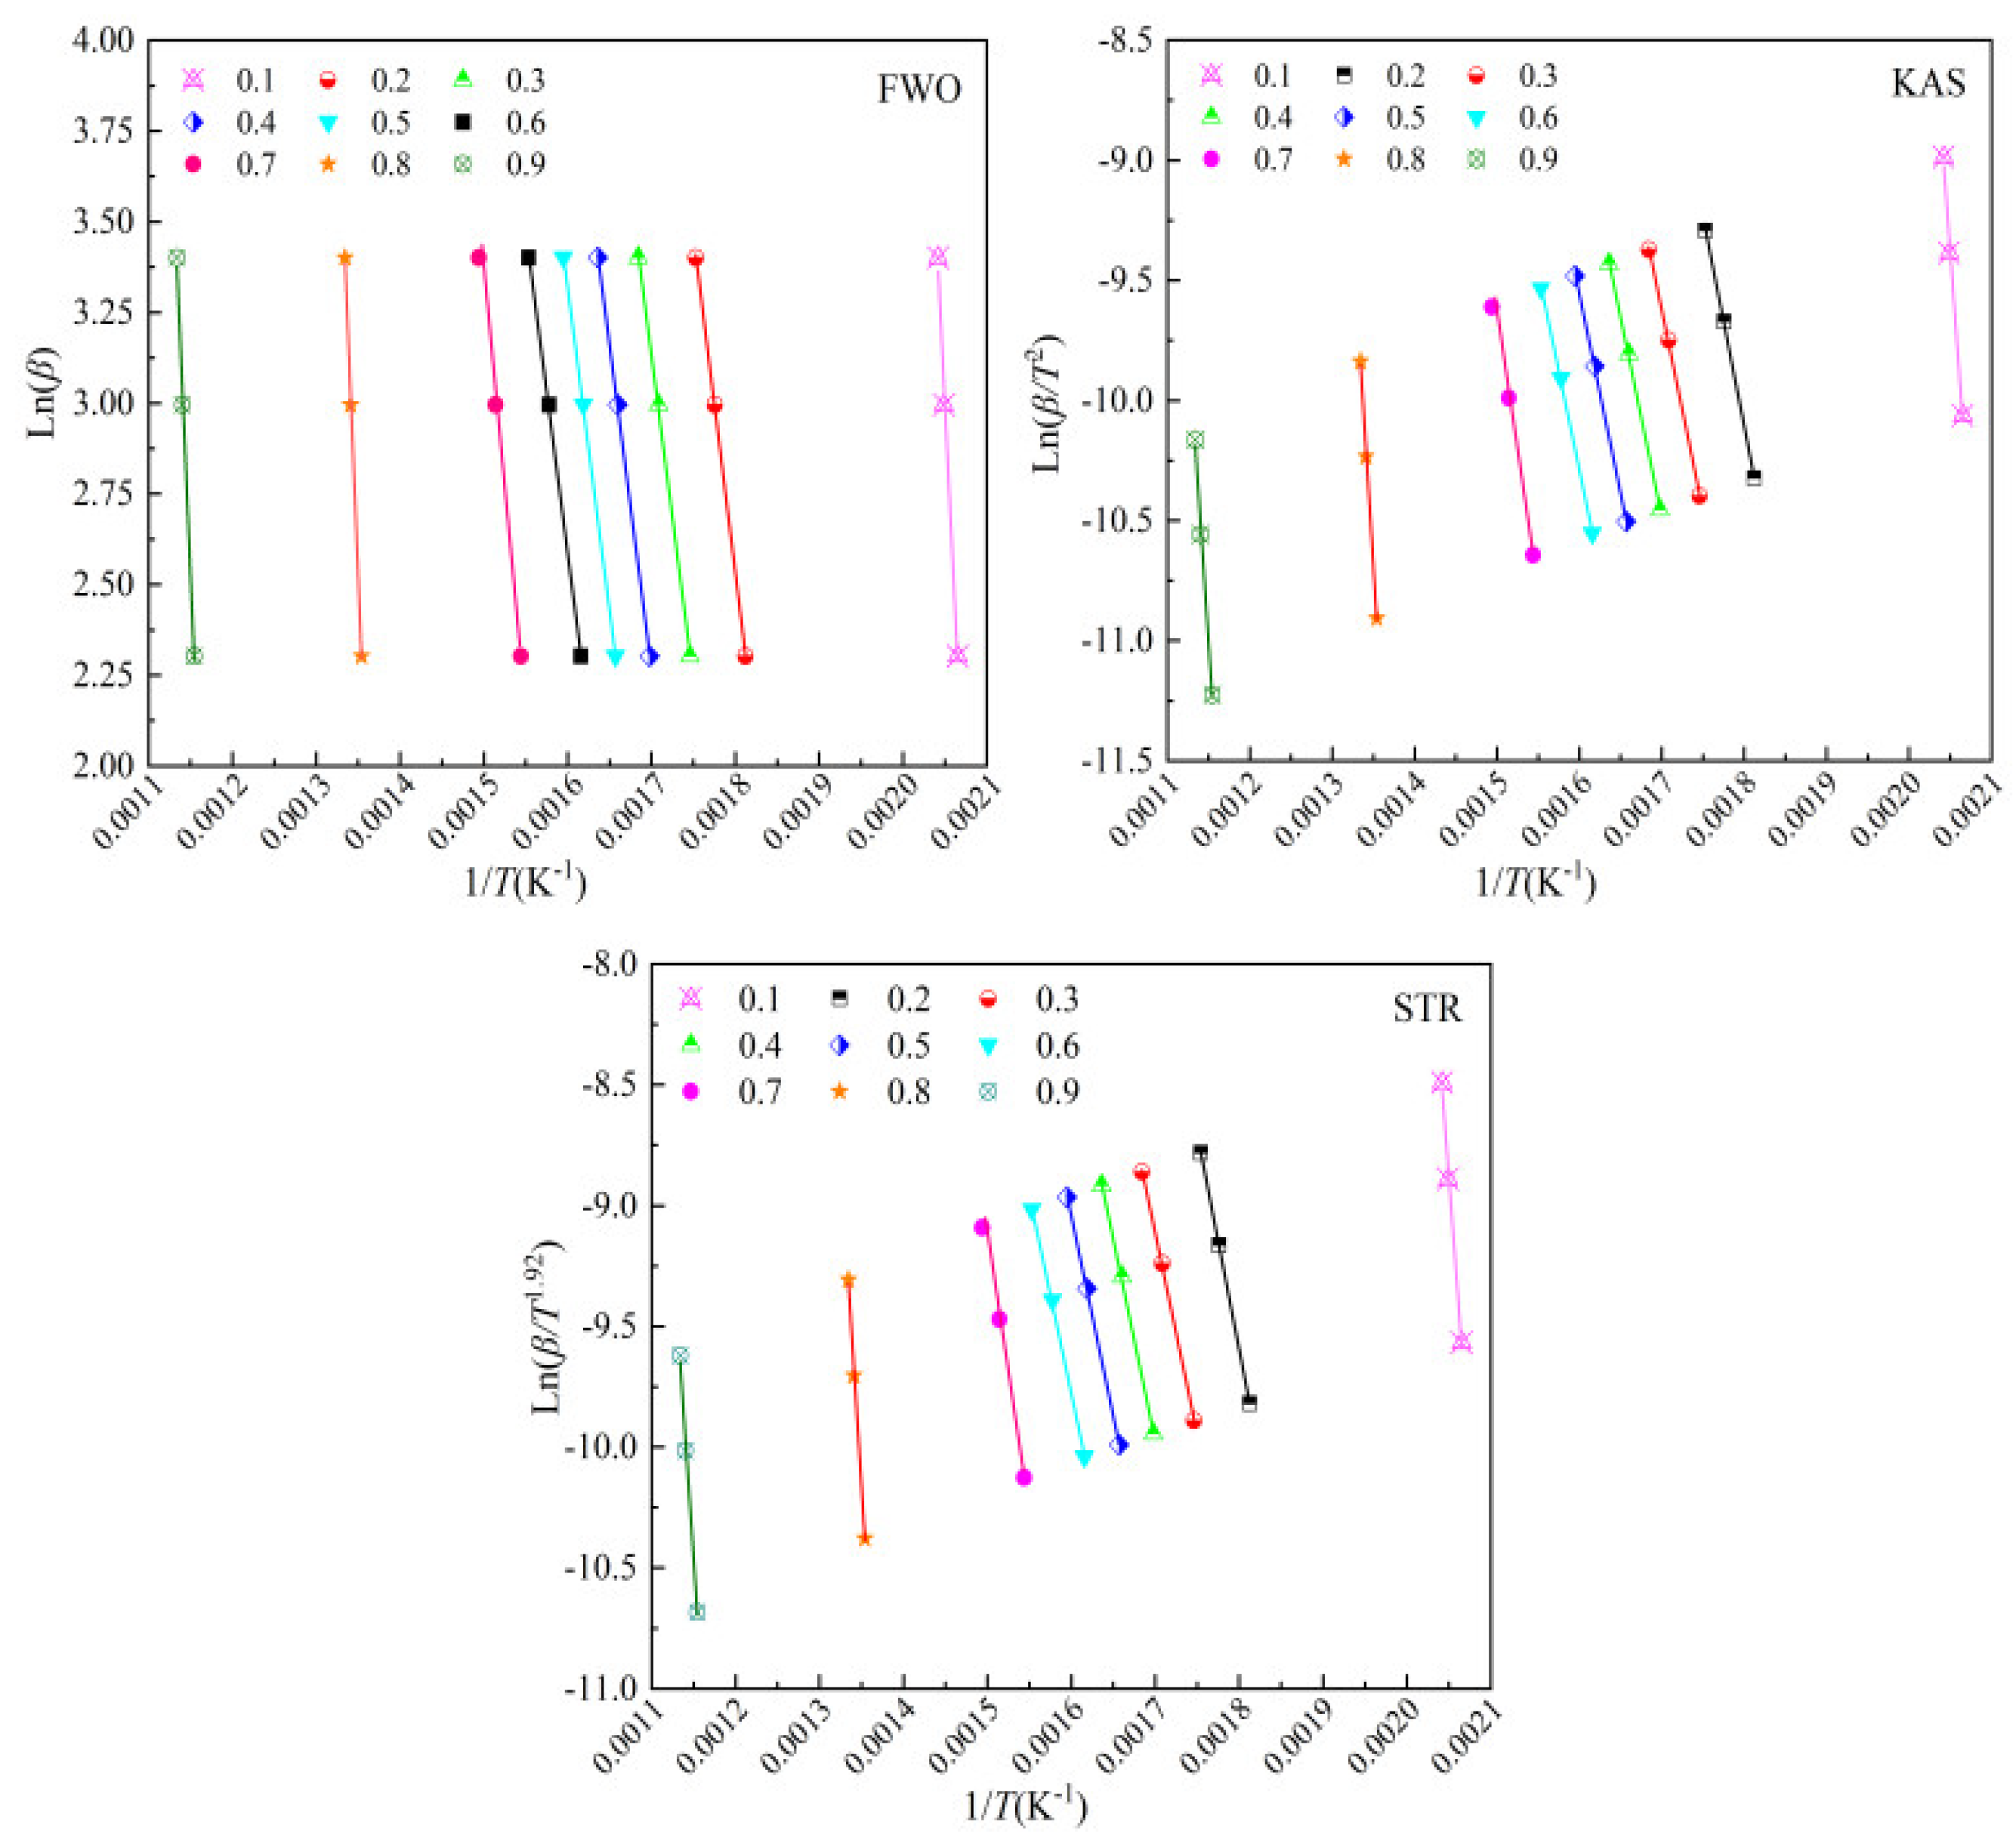
Using Equations (6)–(8), the activation energies for the combustion of bamboo at conversion levels from 0.10 to 0.90, with intervals of 0.10, were obtained using the KAS, FWO, and STR methods. The results are illustrated in
Figure 8.
Table 3 demonstrates that the conversion range from 0.10 to 0.90 is relevant for the dominant combustion stages.
Table 5 provides the activation energy values for bamboo combustion across this conversion range.
R2 values are close to 1, and the MSE values are below 0.0019, confirming the accuracy of the results.
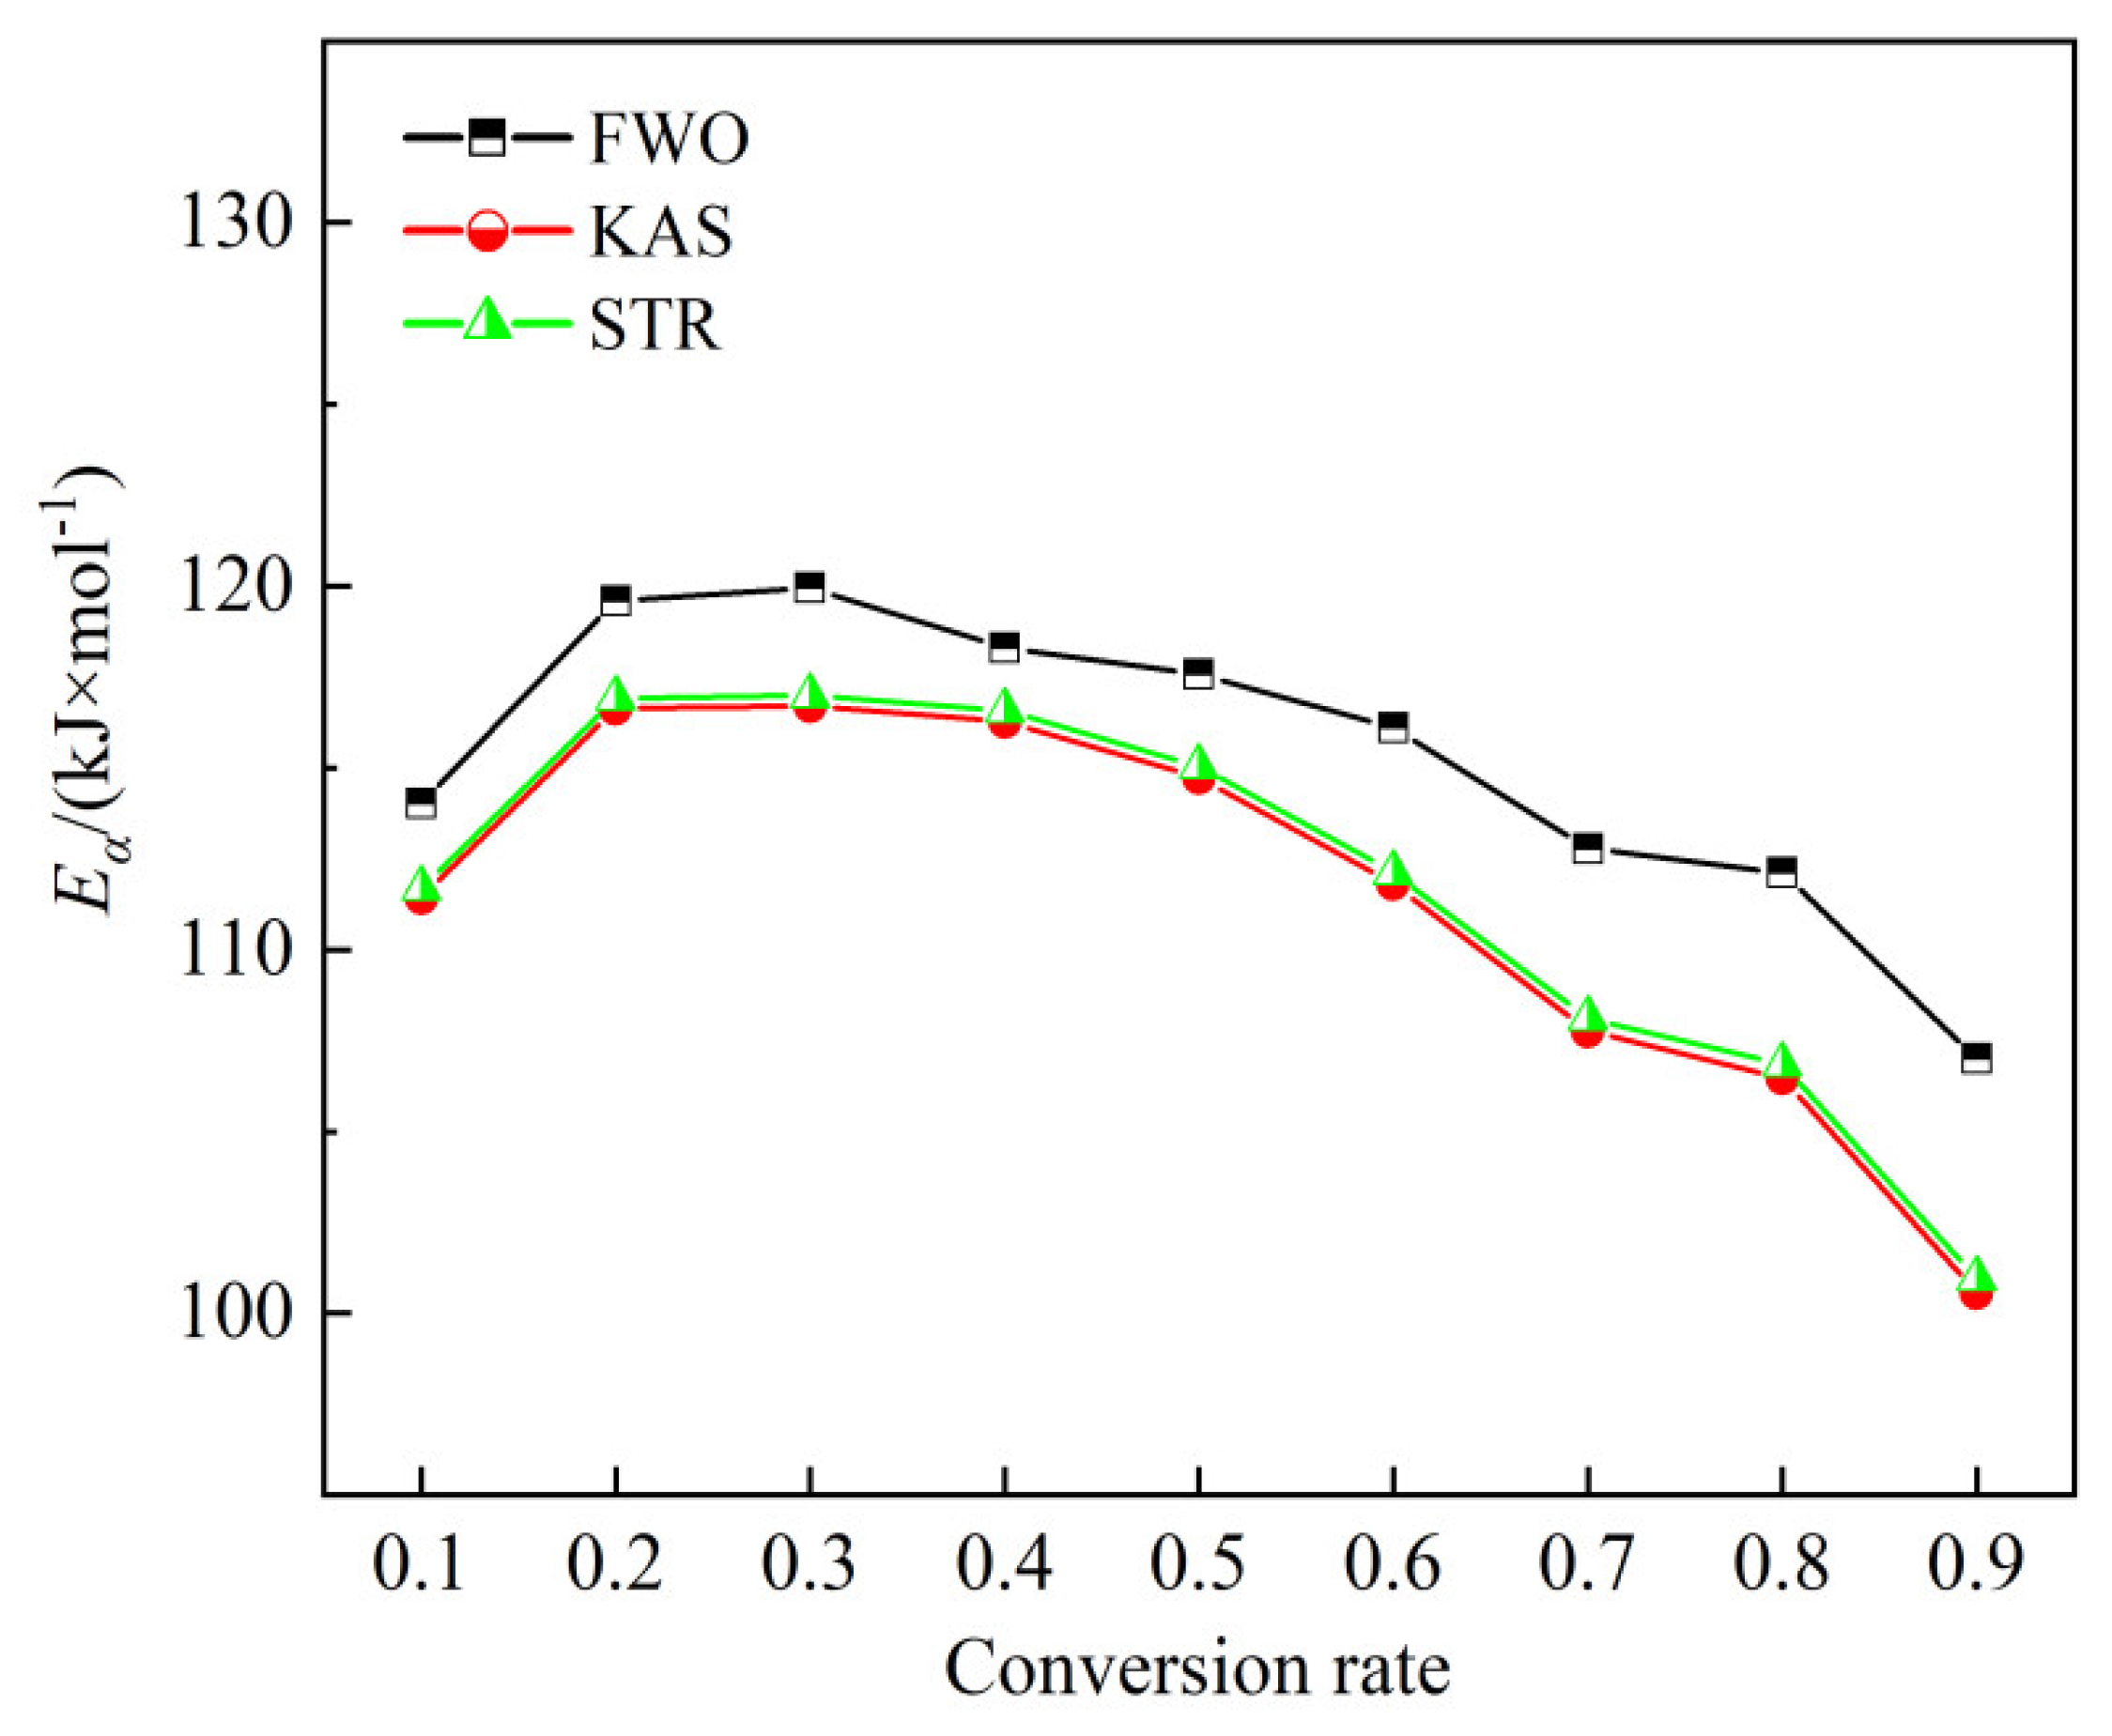
Figure 9 displays the variations in activation energy with conversion degrees from 0.10 to 0.90 for all methods. The activation energies obtained from FWO, KAS, and STR methods follow similar trends with conversion degrees.
Eα values obtained by the STR and FWO methods are generally consistent, while those calculated by KAS are slightly higher. As detailed in the previous section, conversion ranges of 0.10–0.60 and 0.70–0.90 correspond to the second and third stages of bamboo combustion, respectively.
The data indicates that activation energy is significantly influenced by the conversion degree, reflecting the complex simultaneous reactions occurring during both oxidative devolatilization and char combustion stages. During the oxidative devolatilization stage, conversions from 0.10 to 0.20 and 0.30 to 0.60 are associated with the combustion of volatiles released from the breakdown of hemicelluloses, cellulose, and partial lignin. Conversions from 0.70 to 0.90 correspond to the combustion of residual lignin and fixed carbon. Each isoconversional model shows an increase in
Eα value from 0.10 to 0.20 due to the release and combustion of lighter volatile compounds, followed by a decrease between 0.30 and 0.60 as active char reacts with oxygen in the air and undergoes thermal cracking to generate lower compounds [
43].
Eα then decreases further from 0.70 to 0.90, indicating that the biochar has a porous structure with a higher surface area, enhancing surface combustion reactions [
44]. The average
Eα in the second stage, as calculated by FWO, KAS, and STR methods, is 117.59 kJ/mol, 114.60 kJ/mol, and 114.89 kJ/mol, respectively. In the third stage, the average values are around 110.63 kJ/mol, 104.93 kJ/mol, and 105.31 kJ/mol, respectively.
3.2.3. Comparison of Activation Energy
Overall, Eα values for the two thermal treatment processes show a significant difference. Specifically, the Eα values during the oxidative devolatilization stage of combustion are notably lower compared to those during pyrolysis devolatilization. The disparity in activation energy is even more pronounced in the third stage. This variation can be attributed to the reactive nature of oxygen in the air during combustion, as opposed to the inert nitrogen atmosphere used in pyrolysis. In essence, the vigorous combustion of volatile substances and fixed carbon lowers the Eα values for the thermal treatment, thus enhancing the activation of bamboo powder.
3.2.4. Pre-exponential Factor Analysis
The pre-exponential factor A elucidates the collision intensity between reactants. The variations of the pre-exponential factors in the main pyrolysis and combustion stages at different heating rates are presented in
Table 6 and
Table 7. It can be seen that the values in the second and third stages of pyrolysis change within the ranges of 6.50×10
9 to 1.26×10
13 and 4.23×10
33 to 5.18×10
37 respectively. All the values of pre-exponential factor are greater than 10
9, and there is a distinct mutation in the third stage. This alteration reflects the complex reaction mechanism occurring in the thermal degradation of bamboo powder. For combustion, in the second and third stages, the values of pre-exponential factor do not fluctuate significantly, and all values are less than 10
9, indicating surface reactions or the formation of closed activated complexes in the combustion process [
45].
Considering that the degree of conversion is a factor leading to the change of Arrhenius parameters, the equation ln
A =
aEα +
b can be employed to predict the kinetic compensation effect (KCE) [
38], where
a and
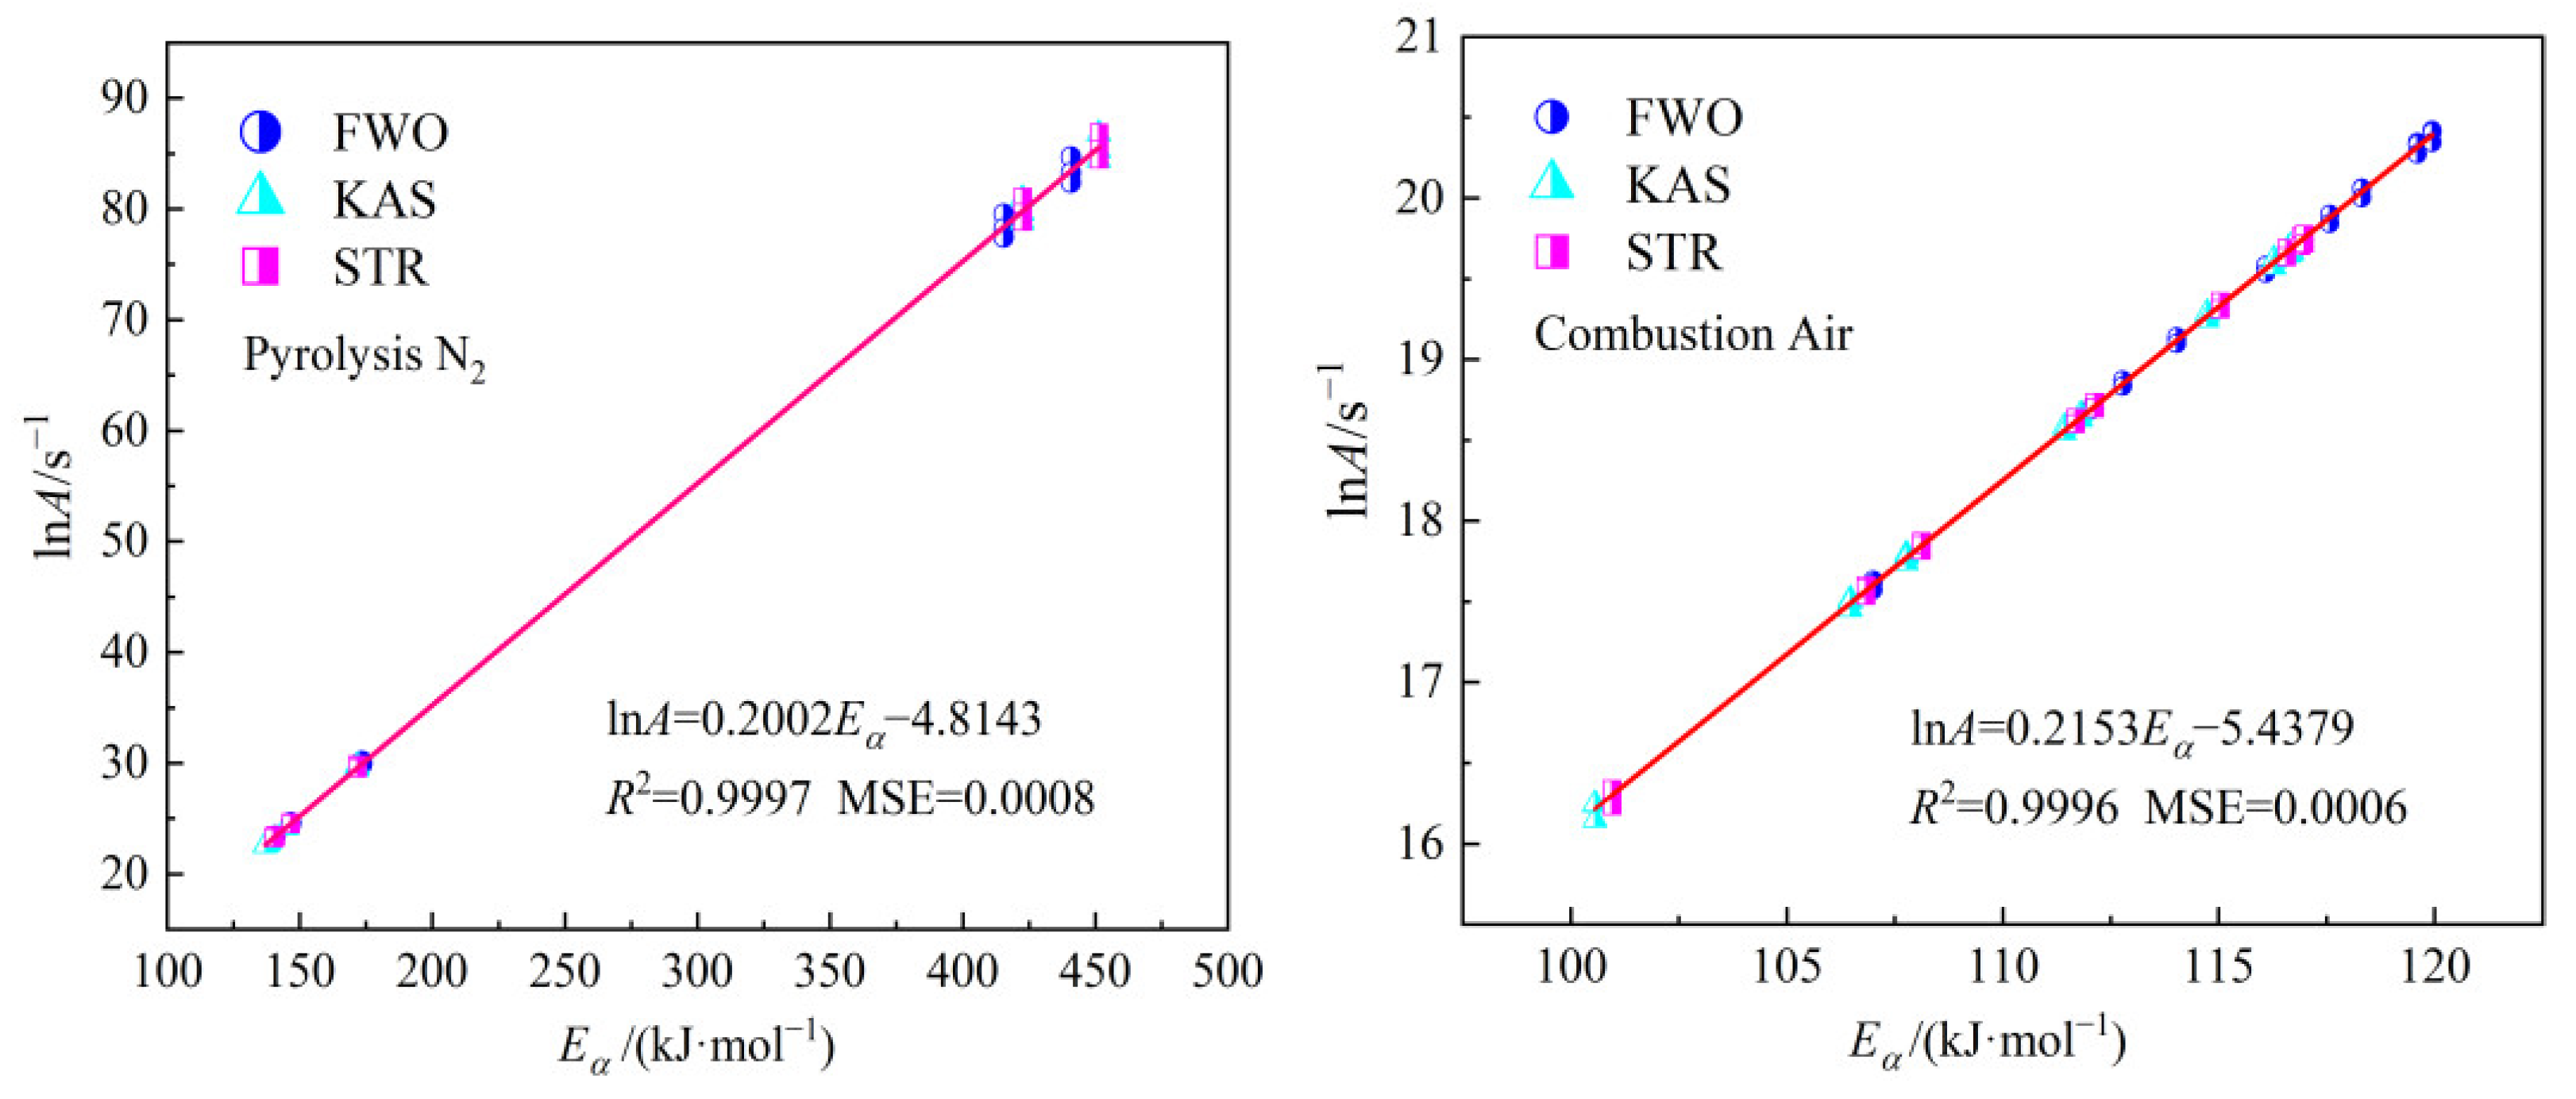
b are the kinetic compensation parameters. To observe the kinetic compensation effect in the pyrolysis and combustion processes of bamboo powder, the relationship between the activation energy
Eα and the pre-exponential factor ln
A calculated by the three model-free models at different heating rates is depicted in the
Figure 10. The strong linear relationship between
Eα and ln
A confirms the kinetic compensation effect. The linear relationship between
Eα and ln
A in the main pyrolysis stage is ln
A=0.2002
Eα−4.8143, with the
R² value of 0.9997 and MSE value of 0.0008. For the main combustion stage, the linear relationship between
Eα and ln
A is ln
A=0.2153
Eα−5.4379, with the
R² value of 0.9996 and MSE value of 0.0006.
3.3. Thermodynamic Analysis
The evaluation of the thermodynamic parameters of the pyrolysis or combustion processes help to provide critical information about its energy requirements and determine appropriate operating conditions. Since the influence of heating rates on thermodynamic parameters can be ignored within the discussed heating rates range. The thermodynamic parameters, such as enthalpy (Δ
H), Gibbs free energy (Δ
G), and entropy (Δ
S) are calculated using thermogravimetric analysis data at the heating rate of 10 K/min according to the Equations (10)−(12), including the KCE. The results are shown in
Table 8 and
Table 9.
The energy difference between solid reactants and activated complexes can be described by enthalpy change (Δ
H) [
46]. As shown in
Table 8 and
Table 9., the change trends of Δ
H with conversion rate for pyrolysis and combustion are the same as that of activation energy in the previous part. All positive values indicate that both pyrolysis and combustion are endothermic processes. For pyrolysis, the average Δ
H values for the devolatilization and carbonization stages are 142.18 kJ/mol and 421.38 kJ/mol (For FWO method), 139.72 kJ/mol and 430.19 kJ/mol (For KAS method), and 141.90 kJ/mol and 430.38 kJ/mol (For STR method), respectively. For combustion, the average Δ
H values for devolatilization and char combustion are 112.92 kJ/mol and 105.06 kJ/mol (For FWO method), 109.93 kJ/mol and 99.36 kJ/mol (For KAS method), and 110.21 kJ/mol and 99.73 kJ/mol (For STR method), respectively. The Δ
H values in the main pyrolysis stage are significantly higher than those in the main combustion stage, indicating that more energy is required for the dissociation of chemical bonds in the pyrolysis process [
47], especially in the third stage. It is worth noting that the difference between
Eα and Δ
H for pyrolysis is less than 7.5 kJ/mol at each conversion rate, and the difference between
Eα and Δ
H for combustion is less than 6.0 kJ/mol, which indicates the ease of formation of activated complexes when reactants are converted to products under specific conditions.
Gibbs free energy (Δ
G) indicates the increase in total energy of the reaction system and the formation of activated complexes [
48]. For the calculation results of all models, the Δ
G values for the devolatilization and carbonization stages of pyrolysis fluctuate around 174 kJ/mol and 169 kJ/mol. While the Δ
G values for the entire main combustion stage fluctuate around 166 kJ/mol. The change in Gibbs energy during the main pyrolysis and combustion stages are very small, indicating that bamboo powder maintains a stable energy output throughout the pyrolysis or combustion process.
The change in entropy (Δ
S) reflects the degree of disorder of the system [
49]. For the second stage of pyrolysis, the average entropy values are −53.64 J/(mol×K) (For FWO method), −57.88 J/(mol×K) (For KAS method), and −54.12 J/(mol×K) (For STR method), respectively. The lower Δ
S indicates that the chemical and physical changes experienced by pyrolyzed biomass are smaller, thus being closer to thermodynamic equilibrium. In the third stage of pyrolysis, Δ
S increases significantly, and the average entropy values are 420.74 J/(mol×K) (For FWO method), 435.60 J/(mol×K) (For KAS method), and 435.93 J/(mol×K) (For STR method), respectively. This indicates that during the carbonization reaction process, the system undergoes a transformation, leading to an increase in disorder, which means being farther away from its own thermodynamic equilibrium and showing higher reactivity to form activated complexes. For combustion, the average Δ
S values for devolatilization and char combustion are −93.04 J/(mol×K) and −107.35 J/(mol×K) (For FWO method), −98.51 J/(mol×K) and −117.79 J/(mol×K) (For KAS method), and −97.98 J/(mol×K)and −117.11 J/(mol×K) (For STR method), respectively. All entropy values in the main combustion stage are negative, indicating that the combustion of volatile and char produce thermally stable products, and the degree of disorder of the products is lower than that of the reactants.
4. Conclusions
In this study, TGA was conducted on bamboo powder under nitrogen and air atmospheres to investigate its pyrolysis and combustion behaviors. The kinetic and thermodynamics parameters for both processes were evaluated using FWO, KAS, and STR. These insights are crucial for a comprehensive understanding of the thermal conversion process and the effective utilization of bamboo waste resources. The key findings from this research are:
(1) The pyrolysis of bamboo is characterized by three distinct stages: drying, devolatilization, and carbonization. In contrast, combustion involves drying, devolatilization, and char combustion. Increasing the heating rate causes the TG and DTG profiles to shift to higher temperatures due to thermal hysteresis.
(2) The temperature ranges and conversion degrees for the main stages of pyrolysis and combustion vary depending on the atmosphere. Under air, the decomposition occurs in two steps—devolatilization and char combustion—with a faster weight loss rate compared to nitrogen. However, the heating rate does not affect the weight loss in each stage or the final residue for either process.
(3) Eα values calculated using FWO, KAS, and STR methods showed similar trends, with high coefficients of determination and low mean squared error values, indicating reliable results. For pyrolysis, Eα in the second stage ranged from 137.04 to 173.54 kJ/mol, and in the third stage from 415.40 to 451.42 kJ/mol. For combustion, Eα values ranged from 111.44 to 119.95 kJ/mol in the second stage and from 100.56 to 112.78 kJ/mol in the third stage. The overall Eα values for pyrolysis is higher than for combustion, reflecting the more reactive nature of oxygen during combustion.
(4) A strong linear relationship between Eα and lnA is observed. The linear relationship between Eα and lnA in the main pyrolysis stage is lnA=0.2002Eα−4.814, and that is lnA=0.2153Eα−5.4379 for the main combustion stage. Thermodynamic parameters indicated that the pyrolysis or combustion of bamboo is endothermic and non-spontaneous. It can be steadily converted into value-added energy to be considered as a feedstock for green energy production.
Author Contributions
Conceptualization, J.L.; methodology, J.L. and Y.W.; formal analysis, J.L. and Q.W.; investigation, S.D.; data curation, Y.F.; writing—original draft preparation, J.L.; writing—review and editing, J.L. and Y.W. All authors have read and agreed to the published version of the manuscript.
Funding
This research was funded by the Opening Foundation of The State Key Laboratory of Refractories and Metallurgy (Wuhan University of Science and Technology), grant number G202208, and the Joint Supported by Hubei Provincial Natural Science Foundation and Huangshi of China, grant number 2023AFD010.
Data Availability Statement
The data presented in this study are available on request from the corresponding author.
Acknowledgments
The authors gratefully acknowledge the resources partially provided by the State Key Laboratory of Refractories & Metallurgy, Wuhan University of Science and Technology.
Conflicts of Interest
The authors declare no conflicts of interest.
References
- Teixeira, B.M.M.; Oliveira, M.; da Silva Borges, A.D. Coniferous Biomass for Energy Valorization: A Thermo-chemical Properties Analysis. Sustainability 2024, 16, 7622. [Google Scholar] [CrossRef]
- McCollum, D.; Bauer, N.; Calvin, K.; Kitous, A. , Riahi, K. Fossil Resource and Energy Security Dynamics in Conventional and Carbon-constrained Worlds. Climatic Change 2014, 123, 413–426. [Google Scholar] [CrossRef]
- Li, W.; Zhang, S.; Lu, C. Exploration of China’s Net CO2 Emissions Evolutionary Pathways by 2060 in the Context of Carbon Neutrality. Sci. Total Environ. 2022, 831, 154909. [Google Scholar] [CrossRef]
- Srirangan, K.; Akawi, L.; Moo-Young, M.; Chou, C. P. Towards Sustainable Production of Clean Energy Carriers from Biomass Resources. Appl. Energy 2012, 100, 172–186. [Google Scholar] [CrossRef]
- Amjith, L.R; Bavanish, B. A Review on Biomass and Wind as Renewable Energy for Sustainable Environment. Chemosphere 2022, 293, 133579. [Google Scholar] [CrossRef]
- Demirbas, A. Biomass Resource Facilities and Biomass Conversion Processing for Fuels and Chemicals. Energy Convers. Manage. 2001, 42, 1357–1378. [Google Scholar] [CrossRef]
- Hu, P.; Hou, C.; Lan, X.; Sheng, H. Pyrolysis Behavior and Kinetics of Typical Crop Straw in Henan Province at Different Heating Rates. Processes 2023, 11, 2761. [Google Scholar] [CrossRef]
- Fei, B; Gao, Z; Wang, J; Liu, Z. Biological, Anatomical, and Chemical Characteristics of Bamboo. In Secondary Xylem Biology, 1st ed.;Kim, Y.S.,Funada, R., Singh, A.P.,Eds.; Cambridge: MA, USA, 2016; pp. 283–306.
- Chen, D.; Liu, D.; Zhang, H.; Chen, Y.; Li, Q. Bamboo Pyrolysis Using TG–FTIR and a Lab-Scale Reactor: Analysis of Pyrolysis Behavior, Product Properties, and Carbon and Energy Yields. Fuel 2015, 148, 79–86. [Google Scholar] [CrossRef]
- Phuangchik, T.; Shanmugam, P.; Kandasamy, S.; Bunnag, S.; Boonyuen, S. Investigating Six Types of Bamboo Charcoal for Eco-friendly Renewable Energy Generation. Biomass Conv. Bioref. 2023, 1–11. [Google Scholar] [CrossRef]
- Yu, D; Tan, H; Ruan, Y. A Future Bamboo-structure Residential Building Prototype in China: Life Cycle Assessment of Energy Use and Carbon Emission. Energy Buildings 2011, 43, 2638–2646. [Google Scholar] [CrossRef]
- Akhtar, A.; Krepl, V.; Ivanova, T. A Combined Overview of Combustion, Pyrolysis, and Gasification of Biomass. Energy Fuels 2018, 32, 7294–7318. [Google Scholar] [CrossRef]
- Parascanu, M.M.; Sandoval-Salasb, F.; Soreanuc, G. Valverdea, J.L.; Sanchez-Silvaa, L. Valorization of Mexican Biomasses Through Pyrolysis, Combustion and Gasification Processes. Renew. Sust. Energy Rev. 2017, 71, 509–522. [Google Scholar] [CrossRef]
- Skodras, G.; Grammelis, P.; Basinas, P.; Kakaras, E.; Sakellaropoulos, G. Pyrolysis and Combustion Characteristics of Biomass and Waste-Derived Feedstock. Ind. Eng. Chem. Res. 2006, 45, 3791–3799. [Google Scholar] [CrossRef]
- Liang, Y.; Cheng, B.; Si, Y.; Cao, D.; Jiang, H.; Han, G.; Liu, H. Thermal Decomposition Kinetics and Characteristics of Spartina Alterniflora via Thermogravimetric Analysis. Renew. Energy 2014, 68, 111–117. [Google Scholar] [CrossRef]
- Dong, L.; Huang, X.; Ren, J.; Deng, L.; Da, Y. Thermogravimetric Assessment and Differential Thermal Analysis of Blended Fuels of Coal, Biomass and Oil Sludge. Appl. Sci. 2023, 13, 11058. [Google Scholar] [CrossRef]
- Xiao, R.; Yang, W.; Cong, X.; Dong, K.; Xu, J.; Wang, D.; Yang, X. Thermogravimetric Analysis and Reaction Kinetics of Lignocellulosic Biomass Pyrolysis. Energy 2020, 201, 117537. [Google Scholar] [CrossRef]
- Thangarasu, V.; de Oliveira, M.R.; Oliveira, L.A.A.; Aladawi, S.; Avila, I. Combustion Characteristics and Gasification Kinetics of Brazilian Municipal Solid Waste Subjected to Different Atmospheres by Thermogravimetric Analysis. Bioresource Technol. 2024, 403, 130906. [Google Scholar] [CrossRef]
- Li, K.; Zhang, W.; Fu, M.; Li, C.; Xue, Z. Discussion on Criterion of Determination of the Kinetic Parameters of the Linear Heating Reactions. Minerals 2022, 12, 81. [Google Scholar] [CrossRef]
- Van de Velden, M.; Baeyens, J.; Brems, A.; Janssens, B.; Dewil, R. Fundamentals, Kinetics and Endothermicity of the Biomass Pyrolysis Reaction. Renew. Energy 2010, 35, 232–242. [Google Scholar] [CrossRef]
- Brems, A.; Baeyens, J.; Beerlandt, J.; Dewil, R. Thermogravimetric Pyrolysis of Waste Polyethylene-terephthalate and Polystyrene: A Critical Assessment of Kinetics Modelling. Resour. Conserv. Recycl. 2011, 55, 772–781. [Google Scholar] [CrossRef]
-
GBT 212–2008; Proximate Analysis of Coal. Standardization Administration of China: China, 2008.
- Pattanayak, S.; Hauchhum., L.; Loha, C.; Sailo, L. Selection Criteria of Appropriate Bamboo Based Biomass for Thermochemical Conversion Process. Biomass Convers. Bior. 2020, 10, 401–407. [Google Scholar] [CrossRef]
- Rusch, F.; de Abreu Neto, R.; de Moraes Lúcio, D.; Hillig, É. Energy Properties of Bamboo Biomass and Mate Co-products. SN Appl. Sci. 2021, 3, 602. [Google Scholar] [CrossRef]
- Chen, Y.; Liu, B.; Yang, H.; Yang, Q; Chen, H. Evolution of Functional Groups and Pore Structure During Cotton and Corn Stalks Torrefaction and Its Correlation with Hydrophobicity. Fuel 2014, 137, 41–49. [Google Scholar] [CrossRef]
- Rasam, S.; Haghighi, A.M.; Azizi, K.; Soria-Verdugo, A.; Moraveji, M.K. Thermal Behavior, Thermodynamics and Kinetics of Co-pyrolysis of Binary and Ternary Mixtures of Biomass Through Thermogravimetric Analysis. Fuel 2020, 280, 118665. [Google Scholar] [CrossRef]
- Nawaz, A.; Kumar, P. Elucidating the Bioenergy Potential of Raw, Hydrothermally Carbonized and Torrefied Waste Arundo Donax Biomass in Terms of Physicochemical Characterization, Kinetic and Thermodynamic Parameters. Renew. Energy 2022, 187, 844–856. [Google Scholar] [CrossRef]
- Sun, E.; Sun, F.; Zhang, Z.; Dong, Y. Interface Morphology and Thermoplasticization Behavior of Bamboo Fibers Benzylated with Benzyl Chloride. Surf. Interface Anal. 2016, 48, 64–72. [Google Scholar] [CrossRef]
- Bai, F.; Sun, Y.; Liu, Y.; Li, Q.; Guo, M. Thermal and Kinetic Characteristics of Pyrolysis and Combustion of Three Oil Shales. Energy convers. Manage. 2015, 97, 374–381. [Google Scholar] [CrossRef]
- Özsin, G.; Alpaslan Takan, M.; Takan, A.; Pütün, A.E. A Combined Phenomenological Artificial Neural Network Approach for Determination of Pyrolysis and Combustion Kinetics of Polyvinyl Chloride. Int. J. Energy Res. 2022, 46, 16959–16978. [Google Scholar] [CrossRef]
- Lédé, J.; Authier, O. Temperature and Heating Rate of Solid Particles Undergoing a Thermal Decomposition. Which Criteria for Characterizing Fast Pyrolysis? J. Anal. Appl. Pyrol. 2015, 113, 1–14. [Google Scholar] [CrossRef]
- Bai, F.; Sun, Y.; Liu, Y.; Liu, B.; Guo., M.; Lü., X.; Guo, W.; Li, Q.; Hou, C.; Wang, Q. Kinetic Investigation Onpartially Oxidized Huadian Oil Shale by Thermogravimetric Analysis. Oil Shale 2014, 31, 337–93. [Google Scholar] [CrossRef]
- Flynn, J.H. The “Temperature Integral”–Its Use and Abuse. Thermochim. Acta 1997, 300, 83–92. [Google Scholar] [CrossRef]
- Ozawa, T.A. A New Method of Analyzing Thermogravimetric Data. Bull. Chem. Soc. Jpn. 1965, 38, 1881–1886. [Google Scholar] [CrossRef]
- Akahira, T.; Sunose, T. Method of Determining Activation Deterioration Constant of Electrical Insulating Materials. Res. Rep. Chiba Inst. Technol. 1971, 16, 22–31. [Google Scholar]
- Starink, M.J. The Determination of Activation Energy from Linear Heating Rate Experiments: A Comparison of the Accuracy of Isoconversion Methods. Thermochim. Acta 2003, 404, 163–76. [Google Scholar] [CrossRef]
- Alves, J.L.F.; Da Silva, J.C.G.; Da Silva Filho, V.F.; Alves, R.F.; Ahmad, M.S.; Galdino, W.V.A.; De Sena, R.F. Bioenergy Potential of Red Macroalgae Gelidium Floridanum by Pyrolysis: Evaluation of Kinetic Triplet and Thermodynamics Parameters. Bioresour. Technol. 2019, 291, 121892. [Google Scholar] [CrossRef]
- Vyazovkin, S.; Burnham, A.K.; Criado, J.M.; Pérez-Maqueda, L.A.; Popescu, C.; Sbirrazzuoli, N. ICTAC Kinetics Committee Recommendations for Performing Kinetic Computations on Thermal Analysis Data. Thermochim. Acta 2011, 520, 1–19. [Google Scholar] [CrossRef]
- Zhang, Y.; Cuo, Y.; Cheng, F.; Yan, K.; Cao, Y. Investigation of Combustion Characteristics and Kinetics of Coal Gangue with Different Feedstock Properties by Thermogravimetric Analysis. Thermochim. Acta 2015, 614, 137–148. [Google Scholar] [CrossRef]
- Deng, S.; Wang, X.; Tan, H.; Mikulčić, H.; Yang, F.; Li, Z.; Duić, N. Thermogravimetric Study on the Co-combustion Characteristics of Oily Sludge with Plant Biomass. Thermochim. Acta 2016, 633, 69–76. [Google Scholar] [CrossRef]
- Ma, J.; Luo, H.; Li, Y.; Liu, Z.; Li, D.; Gai, C.; Jiao, W. Pyrolysis Kinetics and Thermodynamic Parameters of the Hydrochars Derived from Co-hydrothermal Carbonization of Sawdust and Sewage Sludge Using Thermogravimetric Analysis. Bioresour Technol. 2019, 282, 133–141. [Google Scholar] [CrossRef]
- Yu, J.; Wang, D.; Sun, L. The Pyrolysis of Lignin: Pathway and Interaction Studies. Fuel 2021, 290, 120078. [Google Scholar] [CrossRef]
- Ravenni, G.; Sárossy, Z.; Ahrenfeldt, J.; Henriksen, U.B. Activity of Chars and Activated Carbons for Removal and Decomposition of Tar Model Compounds–A Review. Renew. Sust. Energy Rev. 2018, 94, 1044–1056. [Google Scholar] [CrossRef]
- Tong, W.; Cai, Z.; Liu, Q.; Ren, S.; Kong, M. Effect of Pyrolysis Temperature on Bamboo Char Combustion: Reactivity, Kinetics and Thermodynamics. Energy 2020, 211, 118736. [Google Scholar] [CrossRef]
- Ahmad, M.S.; Mehmood, M.A.; Taqvi, S.T.H.; Elkamel, A.; Liu, C.G.; Xu, J.; Rahimuddin, S.A.; Gull, M. Pyrolysis, Kinetics Analysis, Thermodynamics Parameters and Reaction Mechanism of Typha Latifolia to Evaluate Its Bioenergy Potential. Bioresour. Technol. 2017, 245, 491–501. [Google Scholar] [CrossRef] [PubMed]
- Laougé, Z.B.; Merdun, H. Kinetic Analysis of Pearl Millet (Penissetum Glaucum (L.) R. Br.) Under Pyrolysis and Combustion to Investigate Its Bioenergy Potential. Fuel 2020, 267, 117172. [Google Scholar] [CrossRef]
- Lei, J.; Liu, X.; Xu, B.; Liu, Z.; Fu, Y. Combustion Characteristics, Kinetics and Thermodynamics of Peanut Shell for Its Bioenergy Valorization. Processes 2024, 12, 1022. [Google Scholar] [CrossRef]
- Rasam, S.; Moshfegh Haghighi, A.; Azizi, K.; Soria-Verdugo, A.; Keshavarz Moraveji, M. Thermal Behavior, Thermodynamics and Kinetics of Co-pyrolysis of Binary and Ternary Mixtures of Biomass Through Thermogravimetric Analysis. Fuel 2020, 280, 118665. [Google Scholar] [CrossRef]
- Ashraf, M.; Ramzan, N.; Khan, R.U.; Durrani, A.K. Analysis of Mixed Cattle Manure: Kinetics and Thermodynamic Comparison of Pyrolysis and Combustion processes. Case Stud. Therm. Eng. 2021, 26, 101078. [Google Scholar] [CrossRef]
Figure 1.
FTIR spectrum of bamboo.
Figure 1.
FTIR spectrum of bamboo.
Figure 2.
Micromorphology of bamboo.
Figure 2.
Micromorphology of bamboo.
Figure 3.
XRD pattern analysis of bamboo.
Figure 3.
XRD pattern analysis of bamboo.
Figure 4.
TG and DTG curves for bamboo pyrolysis.
Figure 4.
TG and DTG curves for bamboo pyrolysis.
Figure 5.
TG and DTG curves for bamboo combustion.
Figure 5.
TG and DTG curves for bamboo combustion.
Figure 6.
The fitted results by FWO, KAS, and STR methods for bamboo pyrolysis.
Figure 6.
The fitted results by FWO, KAS, and STR methods for bamboo pyrolysis.
Figure 7.
Trend of activation energy for bamboo pyrolysis.
Figure 7.
Trend of activation energy for bamboo pyrolysis.
Figure 8.
The fitted results by FWO, KAS, and STR methods for bamboo combustion.
Figure 8.
The fitted results by FWO, KAS, and STR methods for bamboo combustion.
Figure 9.
Trend of activation energy for bamboo combustion.
Figure 9.
Trend of activation energy for bamboo combustion.
Figure 10.
The kinetic compensation effect for the main pyrolysis and combustion processes.
Figure 10.
The kinetic compensation effect for the main pyrolysis and combustion processes.
Table 1.
Proximate and ultimate analyses of bamboo.
Table 1.
Proximate and ultimate analyses of bamboo.
| Proximate analysis/% |
Ultimate analysis/% |
| Moisture |
Volatiles |
Fixed Carbon |
Ash |
C |
H |
S |
N |
O |
| 7.26 |
59.98 |
14.92 |
17.84 |
36.55 |
4.91 |
0.03 |
0.40 |
58.11 |
Table 2.
Pyrolysis parameters of bamboo at various heating rates.
Table 2.
Pyrolysis parameters of bamboo at various heating rates.
| Heating rate (K/min) |
Prolysis stage |
Temperature
interval (K) |
Ta (K) |
Tmax (K) |
Vmax (%/min) |
Tb (K) |
Weight loss (%) |
Residual
(%) |
Conversion degree |
| 10 |
Stage II |
435.53–664.81 |
519.18 |
599.47 |
5.21 |
1021.65 |
47.35 |
25.01 |
0.123–0.722 |
| Stage III |
664.81–1073.15 |
20.82 |
0.722–0.980 |
| 20 |
Stage II |
448.12–690.29 |
528.01 |
614.93 |
9.78 |
1026.17 |
48.89 |
25.42 |
0.124–0.749 |
| Stage III |
690.29–1073.15 |
18.74 |
0.749–0.980 |
| 30 |
Stage II |
459.02–715.76 |
533.31 |
621.97 |
13.79 |
1027.12 |
49.01 |
27.54 |
0.125–0.773 |
| Stage III |
715.76–1073.15 |
16.42 |
0.773–0.980 |
Table 3.
Combustion parameters of bamboo at various heating rates.
Table 3.
Combustion parameters of bamboo at various heating rates.
| Heating rate (K/min) |
Combustion stage |
Temperature interval (K) |
Ti (K) |
Tmax (K) |
Vmax (%/min) |
Tf (K) |
Weight loss (%) |
Residual
(%) |
Conversion degree |
| 10 |
Stage II |
435.44–634.71 |
503.06 |
569.71 |
5.83 |
741.74 |
49.88 |
18.41 |
0.098–0.690 |
| Stage III |
634.71–786.28 |
686.07 |
2.78 |
24.91 |
0.690–0.980 |
| 20 |
Stage II |
447.18–658.11 |
515.47 |
584.79 |
11.09 |
771.33 |
50.97 |
17.55 |
0.099–0.698 |
| Stage III |
658.11–839.17 |
703.82 |
5.23 |
24.51 |
0.698–0.980 |
| 30 |
Stage II |
458.82–672.69 |
522.72 |
595.23 |
15.94 |
791.32 |
51.86 |
16.89 |
0.099–0.703 |
| Stage III |
670.69–853.30 |
718.28 |
7.19 |
24.26 |
0.703–0.980 |
Table 4.
Activation energy acquired from the three model-free methods.
Table 4.
Activation energy acquired from the three model-free methods.
| α |
FWO |
KAS |
STR |
|
Eα/(kJ/mol) |
R2
|
MSE |
Eα/(kJ/mol) |
R2
|
MSE |
Eα/(kJ/mol) |
R2
|
MSE |
| 0.2 |
146.71 |
0.9996 |
0.0002 |
145.01 |
0.9995 |
0.0003 |
146.70 |
0.9999 |
0.0001 |
| 0.3 |
141.02 |
0.9992 |
0.0005 |
138.66 |
0.9991 |
0.0005 |
141.01 |
0.9992 |
0.0004 |
| 0.4 |
140.77 |
0.9996 |
0.0002 |
138.12 |
0.9996 |
0.0002 |
140.77 |
0.9991 |
0.0005 |
| 0.5 |
140.60 |
0.9997 |
0.0002 |
137.69 |
0.9997 |
0.0002 |
140.60 |
0.9997 |
0.0002 |
| 0.6 |
140.24 |
0.9993 |
0.0004 |
137.04 |
0.9992 |
0.0005 |
140.23 |
0.9992 |
0.0005 |
| 0.7 |
173.54 |
0.9982 |
0.0012 |
171.62 |
0.9980 |
0.0014 |
171.91 |
0.9980 |
0.0014 |
| Average |
147.15 |
|
|
144.69 |
|
|
145.87 |
|
|
| 0.8 |
440.73 |
0.9985 |
0.0010 |
451.28 |
0.9984 |
0.0010 |
451.42 |
0.9994 |
0.0010 |
| 0.9 |
415.40 |
0.9965 |
0.0021 |
422.47 |
0.9963 |
0.0021 |
422.72 |
0.9963 |
0.0021 |
| Average |
428.07 |
|
|
436.88 |
|
|
437.07 |
|
|
Table 5.
Activation energy acquired from the three model-free methods.
Table 5.
Activation energy acquired from the three model-free methods.
| α |
FWO |
KAS |
STR |
|
Eα/(kJ/mol) |
R2
|
MSE |
Eα/(kJ/mol) |
R2
|
MSE |
Eα/(kJ/mol) |
R2
|
MSE |
| 0.1 |
114.03 |
0.9999 |
0.0001 |
111.44 |
0.9999 |
0.0001 |
111.69 |
0.9999 |
0.0001 |
| 0.2 |
119.60 |
0.9999 |
0.0001 |
116.64 |
0.9999 |
0.0001 |
116.91 |
0.9999 |
0.0001 |
| 0.3 |
119.95 |
0.9999 |
0.0001 |
116.70 |
0.9999 |
0.0001 |
116.99 |
0.9999 |
0.0001 |
| 0.4 |
118.31 |
0.9995 |
0.0003 |
116.28 |
0.9994 |
0.0003 |
116.58 |
0.9994 |
0.0003 |
| 0.5 |
117.57 |
0.9996 |
0.0001 |
114.73 |
0.9995 |
0.0003 |
115.04 |
0.9995 |
0.0003 |
| 0.6 |
116.10 |
0.9997 |
0.0002 |
111.81 |
0.9997 |
0.0002 |
112.13 |
0.9997 |
0.0002 |
| Average |
117.59 |
|
|
114.60 |
|
|
114.89 |
|
|
| 0.7 |
112.78 |
0.9999 |
0.0001 |
107.77 |
0.9999 |
0.0001 |
108.12 |
0.9999 |
0.0001 |
| 0.8 |
112.11 |
0.9994 |
0.0004 |
106.47 |
0.9992 |
0.0004 |
106.84 |
0.9992 |
0.0004 |
| 0.9 |
107.01 |
0.9973 |
0.0017 |
100.56 |
0.9965 |
0.0017 |
100.96 |
0.9965 |
0.0019 |
| Average |
110.63 |
|
|
104.93 |
|
|
105.31 |
|
|
Table 6.
Pre-exponential factors for the main pyrolysis process.
Table 6.
Pre-exponential factors for the main pyrolysis process.
| α |
FWO |
KAS |
STR |
| 10 K/min |
20 K/min |
30 K/min |
10 K/min |
20 K/min |
30 K/min |
10 K/min |
20 K/min |
30 K/min |
| 0.20 |
4.89 × 10¹⁰
|
4.63× 10¹⁰
|
4.50× 10¹⁰
|
3.44× 10¹⁰
|
3.28× 10¹⁰
|
3.20× 10¹⁰
|
4.88× 10¹⁰
|
4.62× 10¹⁰
|
4.49× 10¹⁰
|
| 0.30 |
1.50× 10¹⁰
|
1.46× 10¹⁰
|
1.44× 10¹⁰
|
9.20× 10⁹
|
9.05× 10⁹
|
8.99× 10⁹
|
1.50× 10¹⁰
|
1.46× 10¹⁰
|
1.44× 10¹⁰
|
| 0.40 |
1.43× 10¹⁰
|
1.39× 10¹⁰
|
1.37× 10¹⁰
|
8.23× 10⁹
|
8.11× 10⁹
|
8.07× 10⁹
|
1.43× 10¹⁰
|
1.39× 10¹⁰
|
1.37× 10¹⁰
|
| 0.50 |
1.38× 10¹⁰
|
1.34× 10¹⁰
|
1.33× 10¹⁰
|
7.52× 10⁹
|
7.43× 10⁹
|
7.41× 10⁹
|
1.38× 10¹⁰
|
1.34× 10¹⁰
|
1.33× 10¹⁰
|
| 0.60 |
1.28× 10¹⁰
|
1.25× 10¹⁰
|
1.23× 10¹⁰
|
6.57× 10⁹
|
6.51× 10⁹
|
6.50× 10⁹
|
1.27× 10¹⁰
|
1.24× 10¹⁰
|
1.23× 10¹⁰
|
| 0.70 |
1.26× 10¹³
|
1.05× 10¹³
|
9.44× 10¹²
|
8.45× 10¹²
|
7.10× 10¹²
|
6.44×10¹²
|
8.97× 10¹²
|
7.53× 10¹²
|
6.83× 10¹²
|
| 0.80 |
5.93× 1036
|
1.38× 1036
|
5.95× 1035
|
5.04× 1037
|
1.11× 1037
|
4.67× 1036
|
5.18× 1037
|
1.14× 1037
|
4.80× 1036
|
| 0.90 |
3.48× 1034
|
9.13× 1033
|
4.23× 1033
|
1.46× 1035
|
3.70× 1034
|
1.68× 1034
|
1.54× 1035
|
3.89× 1034
|
1.77× 1034
|
Table 7.
Pre-exponential factors for the main combustion process.
Table 7.
Pre-exponential factors for the main combustion process.
| α |
FWO |
KAS |
STR |
| 10 K/min |
20 K/min |
30 K/min |
10 K/min |
20 K/min |
30 K/min |
10 K/min |
20 K/min |
30 K/min |
| 0.10 |
2.01× 10⁸
|
2.05× 10⁸
|
1.97× 10⁸
|
1.14× 10⁸
|
1.18× 10⁸
|
1.14× 10⁸
|
1.20× 10⁸
|
1.24× 10⁸
|
1.20× 10⁸
|
| 0.20 |
6.84× 10⁸
|
6.77× 10⁸
|
6.37× 10⁸
|
3.56× 10⁸
|
3.58× 10⁸
|
3.41× 10⁸
|
3.78× 10⁸
|
3.80× 10⁸
|
3.61× 10⁸
|
| 0.30 |
7.38× 10⁸
|
7.29× 10⁸
|
6.84× 10⁸
|
3.62× 10⁸
|
3.64× 10⁸
|
3.46× 10⁸
|
3.85× 10⁸
|
3.87× 10⁸
|
3.67× 10⁸
|
| 0.40 |
5.15× 10⁸
|
5.14× 10⁸
|
4.85× 10⁸
|
3.30× 10⁸
|
3.32× 10⁸
|
3.16× 10⁸
|
3.52× 10⁸
|
3.54× 10⁸
|
3.37× 10⁸
|
| 0.50 |
4.38× 10⁸
|
4.38× 10⁸
|
4.15× 10⁸
|
2.35× 10⁸
|
2.38× 10⁸
|
2.28× 10⁸
|
2.51× 10⁸
|
2.55× 10⁸
|
2.44× 10⁸
|
| 0.60 |
3.16× 10⁸
|
3.19× 10⁸
|
3.04× 10⁸
|
1.23× 10⁸
|
1.27× 10⁸
|
1.23× 10⁸
|
1.32× 10⁸
|
1.36× 10⁸
|
1.32× 10⁸
|
| 0.70 |
1.53× 10⁸
|
1.57 × 10⁸
|
1.51× 10⁸
|
5.07× 10⁷
|
5.35× 10⁷
|
5.25× 10⁷
|
5.48× 10⁷
|
5.77× 10⁷
|
5.65× 10⁷
|
| 0.80 |
1.32× 10⁸
|
1.36× 10⁸
|
1.31× 10⁸
|
3.80× 10⁷
|
4.04× 10⁷
|
3.99× 10⁷
|
4.13× 10⁷
|
4.38× 10⁷
|
4.32× 10⁷
|
| 0.90 |
4.28× 10⁷
|
4.54× 10⁷
|
4.47× 10⁷
|
1.03× 10⁷
|
1.13× 10⁷
|
1.14× 10⁷
|
1.13× 10⁷
|
1.23× 10⁷
|
1.24× 10⁷
|
Table 8.
Thermodynamic properties for the main pyrolysis process.
Table 8.
Thermodynamic properties for the main pyrolysis process.
| α |
FWO |
KAS |
STR |
| ΔH/(kJ/mol) |
ΔG/(kJ/mol) |
ΔS/(J/(mol×K)) |
ΔH/(kJ/mol) |
ΔG/(kJ/mol) |
ΔS/(J/(mol×K)) |
ΔH/(kJ/mol) |
ΔG/(kJ/mol) |
ΔS/(J/(mol×K)) |
| 0.20 |
142.12 |
174.35 |
−53.74 |
140.42 |
174.41 |
−56.67 |
142.11 |
174.35 |
−53.75 |
| 0.30 |
136.26 |
174.55 |
−63.84 |
133.90 |
174.64 |
−67.92 |
136.25 |
174.55 |
−63.86 |
| 0.40 |
135.87 |
174.56 |
−64.50 |
133.22 |
174.65 |
−69.08 |
135.87 |
174.56 |
−64.50 |
| 0.50 |
135.58 |
174.57 |
−64.99 |
132.67 |
174.67 |
−70.02 |
135.58 |
174.57 |
−64.99 |
| 0.60 |
135.09 |
174.58 |
−65.83 |
131.89 |
174.69 |
−71.36 |
135.08 |
174.58 |
−65.85 |
| 0.70 |
168.15 |
173.52 |
−8.94 |
166.23 |
173.57 |
−12.24 |
166.52 |
173.56 |
−11.74 |
| Average |
142.18 |
174.36 |
−53.64 |
139.72 |
174.44 |
−57.88 |
141.90 |
174.36 |
−54.12 |
| 0.80 |
434.56 |
168.87 |
442.96 |
445.11 |
168.75 |
460.75 |
445.25 |
168.75 |
460.99 |
| 0.90 |
408.19 |
169.16 |
398.51 |
415.26 |
169.08 |
410.44 |
415.51 |
169.08 |
410.86 |
| Average |
421.38 |
169.02 |
420.74 |
430.19 |
168.92 |
435.60 |
430.38 |
168.92 |
435.93 |
Table 9.
Thermodynamic properties for the main combustion process.
Table 9.
Thermodynamic properties for the main combustion process.
| α |
FWO |
KAS |
STR |
| ΔH/(kJ/mol) |
ΔG/(kJ/mol) |
ΔS/(J/(mol×K)) |
ΔH/(kJ/mol) |
ΔG/(kJ/mol) |
ΔS/(J/(mol×K)) |
ΔH/(kJ/mol) |
ΔG/(kJ/mol) |
ΔS/(J/(mol×K)) |
| 0.10 |
109.85 |
166.07 |
−98.69 |
107.25 |
166.18 |
−103.43 |
107.50 |
166.17 |
−102.97 |
| 0.20 |
115.10 |
165.84 |
−89.07 |
112.13 |
165.96 |
−94.49 |
112.40 |
165.95 |
−93.99 |
| 0.30 |
115.30 |
165.83 |
−88.69 |
112.05 |
165.96 |
−94.62 |
112.34 |
165.95 |
−94.10 |
| 0.40 |
113.55 |
165.89 |
−91.88 |
111.52 |
165.98 |
−95.59 |
111.81 |
165.96 |
−95.05 |
| 0.50 |
112.68 |
165.92 |
−93.45 |
109.85 |
166.04 |
−98.64 |
110.15 |
166.03 |
−98.07 |
| 0.60 |
111.05 |
165.98 |
−96.43 |
106.76 |
166.16 |
−104.27 |
107.08 |
166.15 |
−103.68 |
| Average |
112.92 |
165.92 |
−93.04 |
109.93 |
166.05 |
−98.51 |
110.21 |
166.04 |
−97.98 |
| 0.70 |
107.48 |
166.12 |
−102.94 |
102.47 |
166.34 |
−112.11 |
102.81 |
166.32 |
−111.47 |
| 0.80 |
106.52 |
166.15 |
−104.66 |
100.88 |
166.39 |
−114.99 |
101.25 |
166.38 |
−114.31 |
| 0.90 |
101.17 |
166.37 |
−114.45 |
94.72 |
166.66 |
−126.28 |
95.12 |
166.65 |
−125.55 |
| Average |
105.06 |
166.21 |
−107.35 |
99.36 |
166.46 |
−117.79 |
99.73 |
166.45 |
−117.11 |
|
Disclaimer/Publisher’s Note: The statements, opinions and data contained in all publications are solely those of the individual author(s) and contributor(s) and not of MDPI and/or the editor(s). MDPI and/or the editor(s) disclaim responsibility for any injury to people or property resulting from any ideas, methods, instructions or products referred to in the content. |
© 2024 by the authors. Licensee MDPI, Basel, Switzerland. This article is an open access article distributed under the terms and conditions of the Creative Commons Attribution (CC BY) license (http://creativecommons.org/licenses/by/4.0/).
