1. Introduction
Terpenoids represent the most extensive category of natural products produced by land-dwelling plants. While some terpenoid substances, including gibberellins, function as plant hormones and significantly influence growth and development (Zi et al., 2014), the great majority of terpenoids function as specialized or secondary metabolites, playing roles in diverse interactions between plants and their surroundings(Gershenzon & Dudareva, 2007b). As a result, ongoing advancements in the biosynthesis of terpenoids have been crucial in the adaptation processes that occurred during the diversification of land plants, such as mosses.(e.g., hornworts, liverworts, and mosses), clubmosses, ferns, gymnosperms, and angiosperms (Gershenzon & Dudareva, 2007a, 2007b). A crucial area for comprehending the development of terpenoid biosynthesis involves examining the terpene synthases found in land plants, as they play a vital role in the production of terpenes. (Christianson, 2006; Lv et al., 2022).
Terpenes constitute the largest family of secondary metabolites in plants, composed of two isomers of 5 carbons, dimethylallyl diphosphate (DMAPP) and isopentenyl diphosphate (IPP) (Chen et al., 2011). Terpenes found in plants serve essential functions as intermediates in drawing insect pollinators (Byers et al., 2014), facilitating plant defense mechanisms (Chen et al., 2011; Dudareva et al., 2013), influencing plant relationships (Huang et al., 2019), and engaging with diverse ecological environments (Campbell et al., 2019). The biosynthetic pathways of volatile terpenes in plants have been well-characterized (Manyi-Loh et al., 2011). The biosynthetic pathway for terpenes begins with the synthesis of the C5 precursors, dimethylallyl pyrophosphate (DMAPP) and isopentenyl pyrophosphate (IPP). These essential molecules subsequently contribute to the formation of the direct precursors such as farnesyl diphosphate (FPP), geranyl diphosphate (GPP), and geranylgeranyl diphosphate (GGPP). Ultimately, it is the terpene synthases that play a crucial role in the biosynthesis of plant terpenes, catalyzing the conversion of these precursors into a diverse array of terpene compounds that are vital for various physiological processes in plants.(Yu et al., 2020). The mevalonate (MVA) pathway in the cytosol enables the transformation of FPP into sesquiterpenes via TPS, while the methylerythritol phosphate (MEP) pathway in plastids converts GPP and GGPP into monoterpenes and diterpenes, respectively(Chen et al., 2011; Vranova et al., 2013). Situated at the branch point of the isoprenoid pathway, TPS serves as a crucial enzyme in the production of terpenoids(Chen et al., 2023; Lv et al., 2022).
So far, researchers have recognized the TPS gene family across the complete genomes of different plant species, such as Arabidopsis(Vranova et al., 2013), Camellia (Zhou et al., 2020), carrot (Keilwagen et al., 2017), eucalypts (Kuelheim et al., 2015), tomato (Falara et al., 2011), clubmoss (Li et al., 2012), and grape (Chen et al., 2023; Martin et al., 2010). Orchids, one of the largest families of flowering plants, contain a variety of terpenes in their metabolic profiles (Ramya et al., 2020). Currently, the number of TPS genes identified in orchids is quite limited. In Phalaenopsis orchids, PbTPS5 and PbTPS10 may be involved in the biosynthetic pathways of monoterpenes(Chuang et al., 2018). The enzyme FhTPS1 is responsible for the production of linalool, while FhTPS4, FhTPS6, and FhTPS7 serve as bifunctional enzymes capable of utilizing both FPP and GPP as substrates(Gao et al., 2018). Nevertheless, the exploration of TPS genes within P. patens is still insufficient. P. patens, a small moss species that is widely prevalent, has been utilized as a model organism for more than 50 years, thanks to its relatively simple morphology, high frequency of homologous recombination, and robust stress resistance(Callaghan et al., 2020). Additionally, it is a highly promising chassis for synthetic biology, capable of heterologous production of important plant natural products such as taxol(Pierroz, 2023). Furthermore, P. patens belong to the family Funariaceae and the genus Physcomitrium. Its strong regeneration capability, short growth cycle, high gene recombination rate, and ease of cultivation have earned it the nickname “green yeast” (Vranova et al., 2013). The synthesis of terpenoids in P. patens using biotechnology can effectively expand its source of raw materials (Nakajima et al., 2020). Hence, identifying the TPS gene family and exploring the functions of TPS genes in P. patens is essential. Such discoveries will offer significant understanding of the terpenoid biosynthetic pathways in orchids.
2. Materials and Methods
2.1. Identification, Chromosomal Localization, and Physicochemical Analysis of the TPS Family Members in P. patens
The complete genomic data and annotation files for P. patens (SL3.0) were obtained from the NCBI database (
https://www.NCBI.nlm.nih.gov/). To extract coding sequences (CDS) for P. patens, the “Gtf/Gff3 Sequences Extract” feature of the TBtools software (v1.09876) was employed, followed by converting these sequences into protein formats using the “Batch TranSlate CDS to Protein” function(Chen et al., 2020). The TPS gene family members identified in Arabidopsis thaliana served as templates, and their IDs and protein sequences were saved locally. The “Blast Compare Two Seqs” feature within TBtools (with an E-value parameter of 1×10^-5) was used to conduct preliminary sequence alignments to obtain transcriptome IDs of potential TPS gene family members in
P. patens. To explore the domains of the candidate TPS members, protein sequences were retrieved via BLASTP using transcriptome IDs sourced from the NCBI database, specifically selecting the Swiss-Prot/UniProt database, and saved locally. The domains of the TPS candidates were analyzed utilizing the NCBI "Batch Web CD-Search Tool" and the TBtools "Visualize NCBI CDD Domain Pattern" features. Proteins featuring the TPS domain were categorized as members of the P. patens TPS gene family and designated as
PpTPS genes. The chromosomal distribution of the TPS genes in
P. patens was examined through the “Gene Location Visualize from GTF/GFF” function in TBtools and subsequently, the naming of the TPS gene members was updated(Ramya et al., 2020). To evaluate the physicochemical characteristics of P. patens' TPS gene family, various parameters such as amino acid composition, molecular weight, isoelectric point, instability index, hydrophobicity/hydrophilicity, and fat index were assessed using the ExPASy online tool (
https://web.expasy.org/compute_pi/). The subcellular localization of
PpTPS members was determined using the WoLF PSORT online resource (
https://wolfpsort.hgc.jp/), while SignalP was utilized for signal peptide predictions.
2.2. Phylogenetic Tree, Gene Structure, and Selection Pressure Analysis of TPS Proteins in P. patens
The protein sequences of TPS from
Arabidopsis, Dendrobium, and
Phalaenopsis were obtained from their respective databases as well as NCBI. Subsequently, the TPS sequences of
P. patens,
Arabidopsis,
Dendrobium, and
Phalaenopsis were combined into one file. Using the Neighbor-Joining method within MEGA11 software, a phylogenetic tree was generated, with the bootstrap repetitions configured to 1,000 and other options left at their default settings. To enhance the resulting phylogenetic tree, the online tool EvolView (
https://www.evolgenius.info//evolview/#mytrees/clcle/123) was utilized for further refinement. The TBtools software was used to illustrate the gene structures of TPS genes, using the genome annotation file of
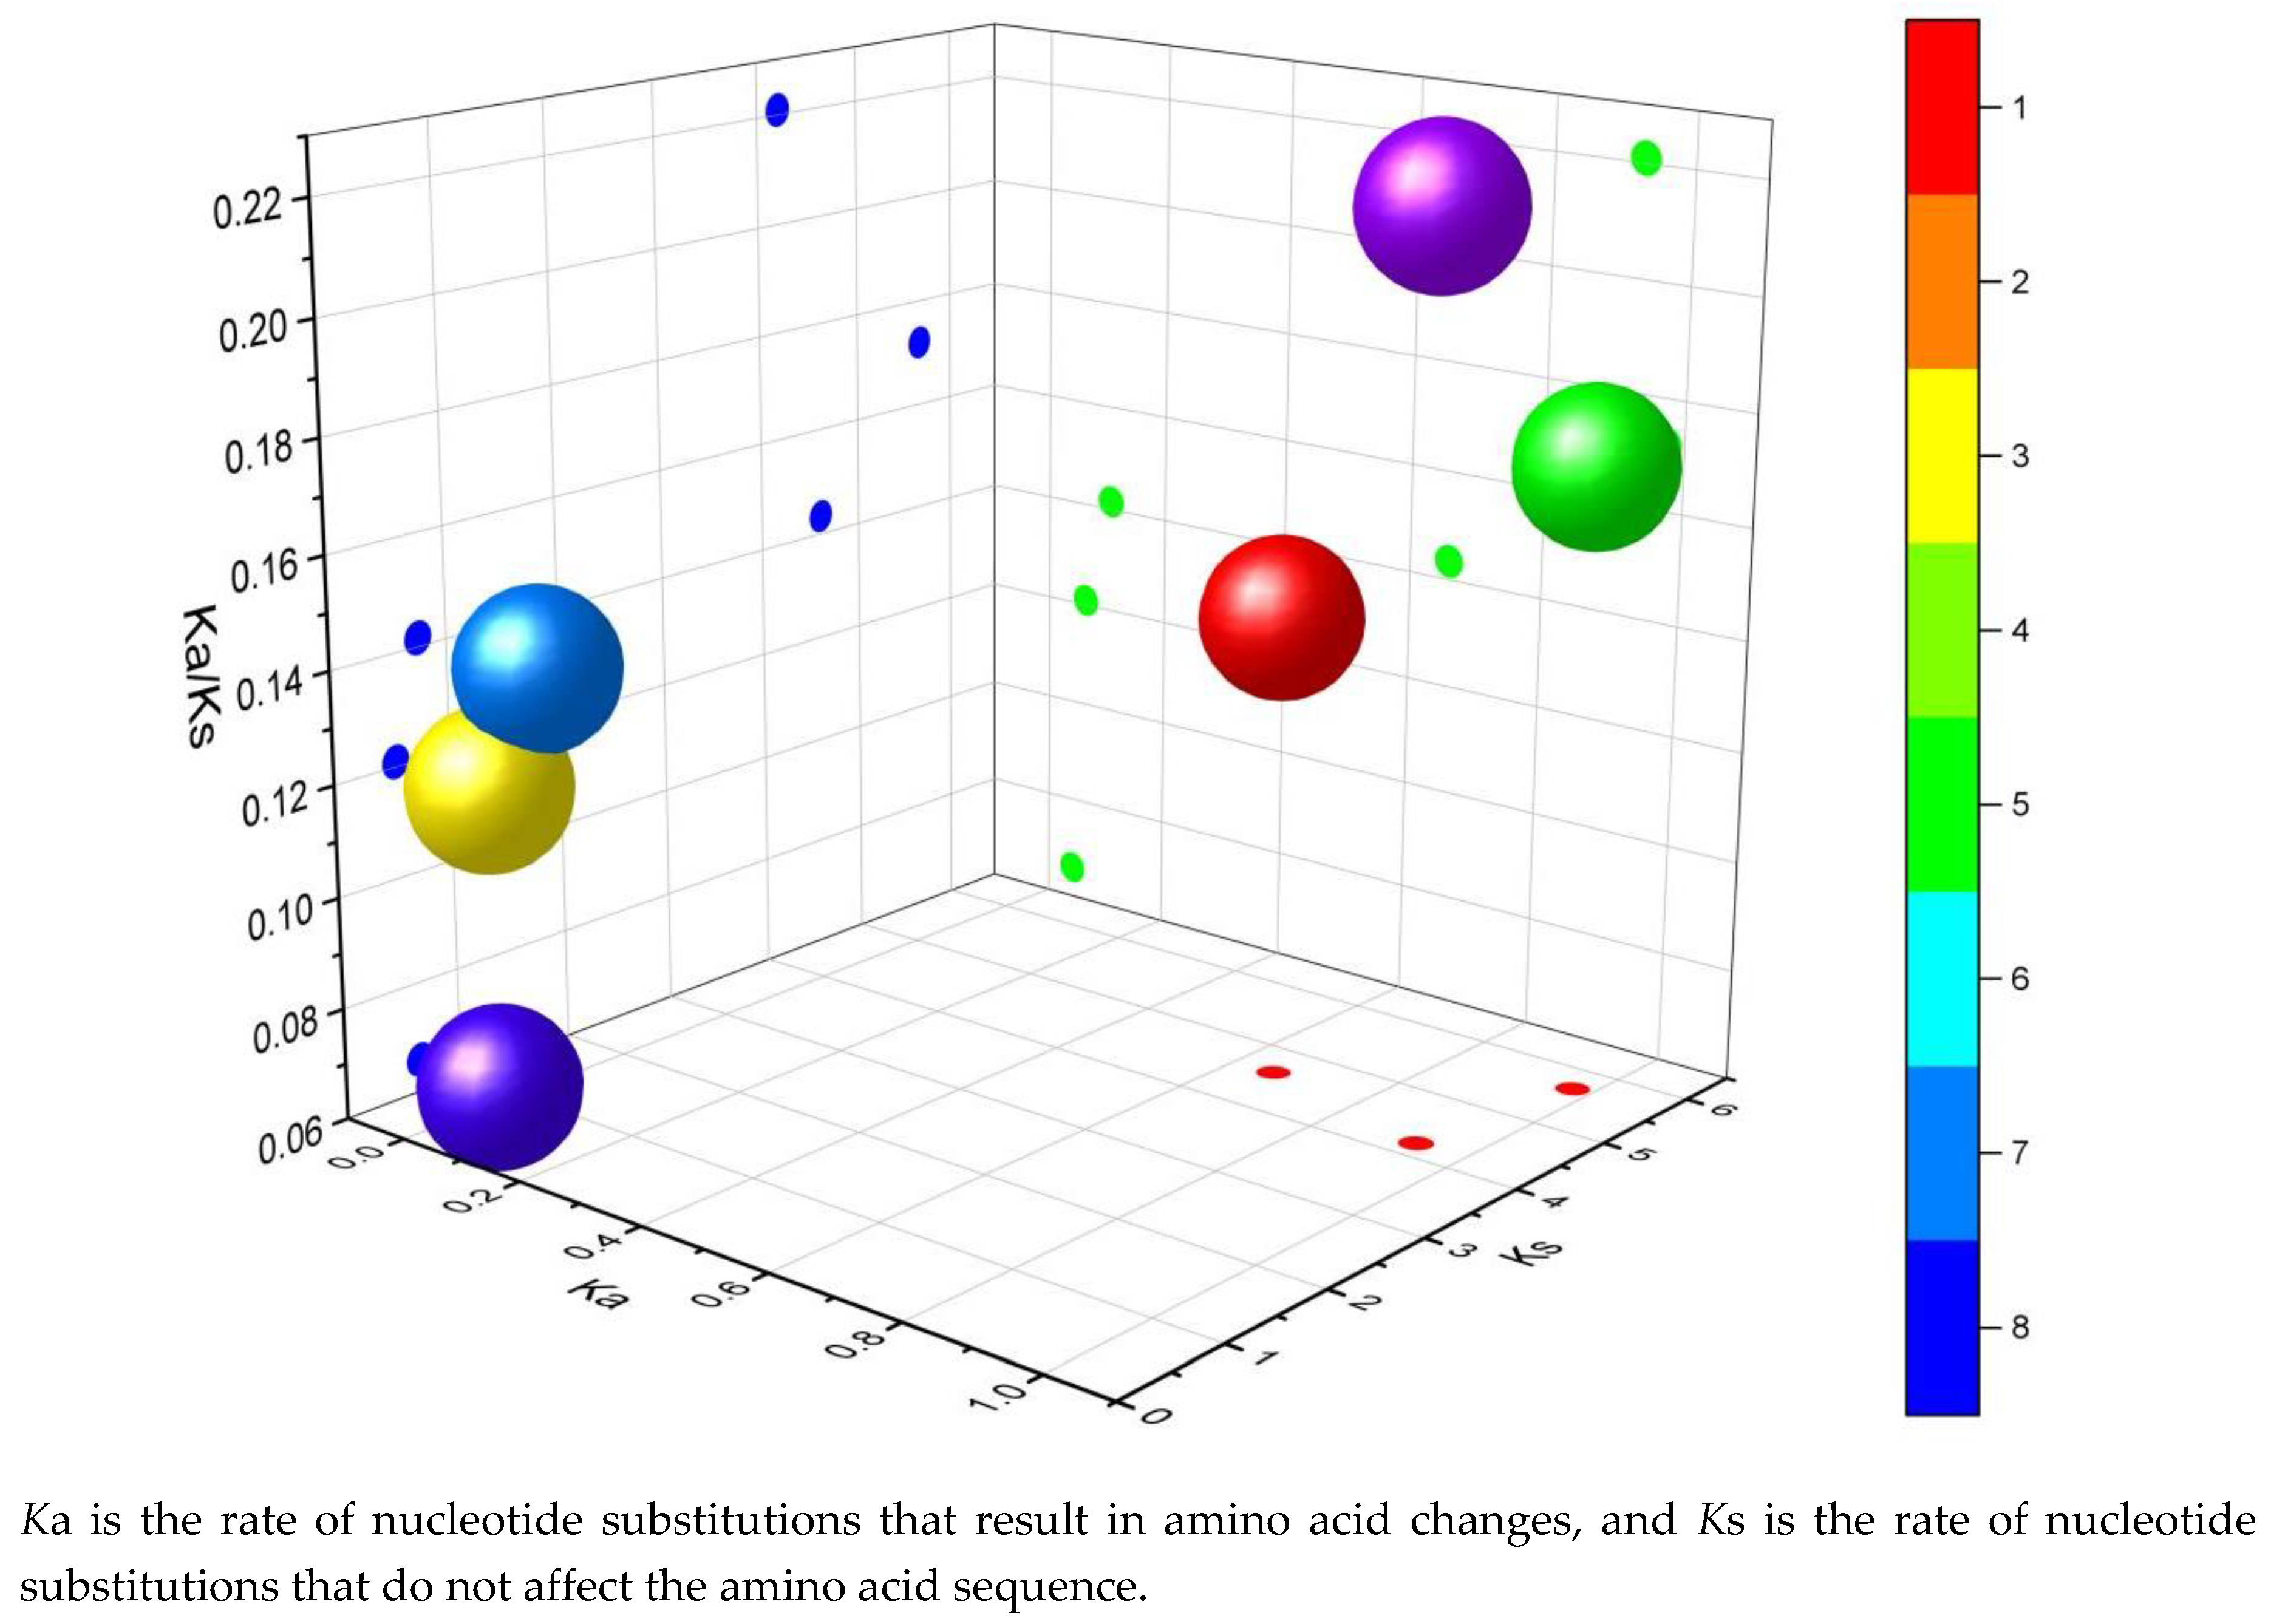
P. patens. The “Simple Ka/Ks Calculator (NG)” feature of TBtools software was applied to compute the selection pressure values for the TPS gene family of
P. patens. These selection pressure values are expressed as the ratio of the non-synonymous substitution rate (Ka) to the synonymous substitution rate (Ks). Ka represents the nucleotide substitution rate that results in amino acid changes, while Ks represents the nucleotide substitution rate that does not affect the amino acid sequence. The calculation formulas are as follows: Ka represents the ratio of single nucleotide polymorphisms (SNPs) leading to non-synonymous substitutions to the total number of non-synonymous substitution sites, while Ks denotes the ratio of SNPs responsible for synonymous substitutions relative to the total number of synonymous substitution sites.
2.3. Analysis of Cis-acting Elements in TPS Genes of P. patens
The cis-acting components (promoters) associated with TPS genes in P. patens were examined by obtaining the 2,000 bp upstream sequences of these genes through the “Gtf/Gff3 Sequences Extract” and “Fasta Extract (Recommended)” features of TBtools. Subsequently, the data was submitted to the PlantCARE database (
http://bioinformatics.psb.ugent.be/webtools/plantcare/) for further analysis. Visual representation of the results was then accomplished utilizing TBtools.
2.4. Analysis of Conserved Motifs in TPS Genes of P. patens
The conserved motifs within the TPS gene family of
P. patens were analyzed using the MEME tool available online (
https://meme-suite.org/meme/tools/meme), and the results were visually presented using TBtools software.
2.5. Tissue Expression Analysis of TPS Genes in P. patens
Tissue expression of TPS genes in P. patens was analyzed by quantifying the expression in four developmental stages of the sporophyte, namely Sporangium, Rhizoid, Stem, and Leaf, based on morphological characteristics such as size, shape, and maturity.
2.6. Patterns of Expression for TPS Genes in P. patens in Response to Different Hormonal and Abiotic Stress Factors.
2.6.1. Plant Materials and Treatments
P. patens was inoculated onto BCDATG medium and cultured at 25°C with a light cycle of 16 hours light/8 hours dark for 28 days. The cultures were then transferred to fresh BCDATG medium and to fresh media containing 50μmol·L-1 abscisic acid, 100 mmol·L-1 mannitol (MAN), and saturated LiCl to subject the plants to hormonal and osmotic stress. Phenotypes were observed after 7 days of treatment(Xiao et al., 2018). Seedlings of P. patens were placed into nutrient solutions that consisted of 100 µmol/L abscisic acid (ABA), 50 µmol/L methyl jasmonate (MeJA), 150 µmol/L NaCl, and 20% polyethyleneglycol 6000 (PEG 6000) for durations of 0, 6, 12, 24, and 48 hours to mimic the effects of hormonal, salt, and drought stress. To induce dark stress, the seedlings were kept in a black, sealed container made of breathable paper for 0, 6, 12, 24, and 48 hours. Each experimental condition was repeated six times, with each sample weighing 0.5 g.Leaf samples from every treatment group at various time points were promptly frozen in liquid nitrogen and then kept in a -80°C upright ultra-low temperature freezer for future qRT-PCR fluorescence quantitative analyses(Chuang et al., 2018).
2.6.2. RNA Extraction and qRT-PCR Quantification
Total RNA extraction from P. patens was performed using TRIzol reagent, sourced from Invitrogen based in Carlsbad, California, USA. Following this extraction, complementary DNA (cDNA) synthesis was conducted utilizing the FastQuant First Strand cDNA Synthesis Kit produced by Tiangen, located in Beijing, China. For the quantitative reverse transcription polymerase chain reaction (qRT-PCR), Real-Time PCR System from Roche, situated in Penzberg, Germany, was employed along with the SYBR Green Premix Pro Taq HS Premix Kit. The design of primers for the qRT-PCR analysis was carried out using the Primer 5.0 software, ensuring that Actin (NC 015447.3) was utilized as the internal control for the experiment. The sequences of the primers and the internal control utilized in this experiment are detailed in
Table 1. The composition of the qRT-PCR reaction mixture included 10 μL of 2×SYBR Green Pro Taq HS Premix, along with 0.4 μL of both the forward and reverse primers. Additionally, 2 μL of complementary DNA (cDNA) was added to the mixture, complemented by 7.2 μL of double-distilled water (ddH2O). The specific conditions for the reaction were carefully set to ensure optimal performance: the temperature was maintained at 37°C for a duration of 15 minutes, followed by a brief heating to 85°C for 5 seconds, after which the mixture was cooled down to 4°C. To assess the levels of relative gene expression, the calculations were performed utilizing the 2−ΔΔCt method, which is a widely accepted approach in quantitative real-time PCR analysis.
(Gao et al., 2018)
2.7. Data Statistics and Analysis
Statistical analysis of the data was carried out utilizing GraphPad Prism 9 software. To evaluate the expression levels of the TPS gene in P. patens seedlings exposed to different hormone treatments and abiotic stresses, an analysis of variance (ANOVA) was performed at various time points. A significance threshold was established at P<0.05, ensuring that the findings would be credible and reliable for interpretation.
3. Results and Analysis
3.1. Identification of TPS Genes in P. patens
Fourteen protein sequences featuring the TPS domain were obtained from the genome database of P. patens (E=1×10
-5). Proteins that were either incomplete (missing start or stop codons) or not classified as having the TPS domain in NCBI BLASTP (using the SWISS-PROT/Uniprot database) were discarded. This process led to the identification of 10 TPS proteins, designated sequentially as
PpTPS1 through
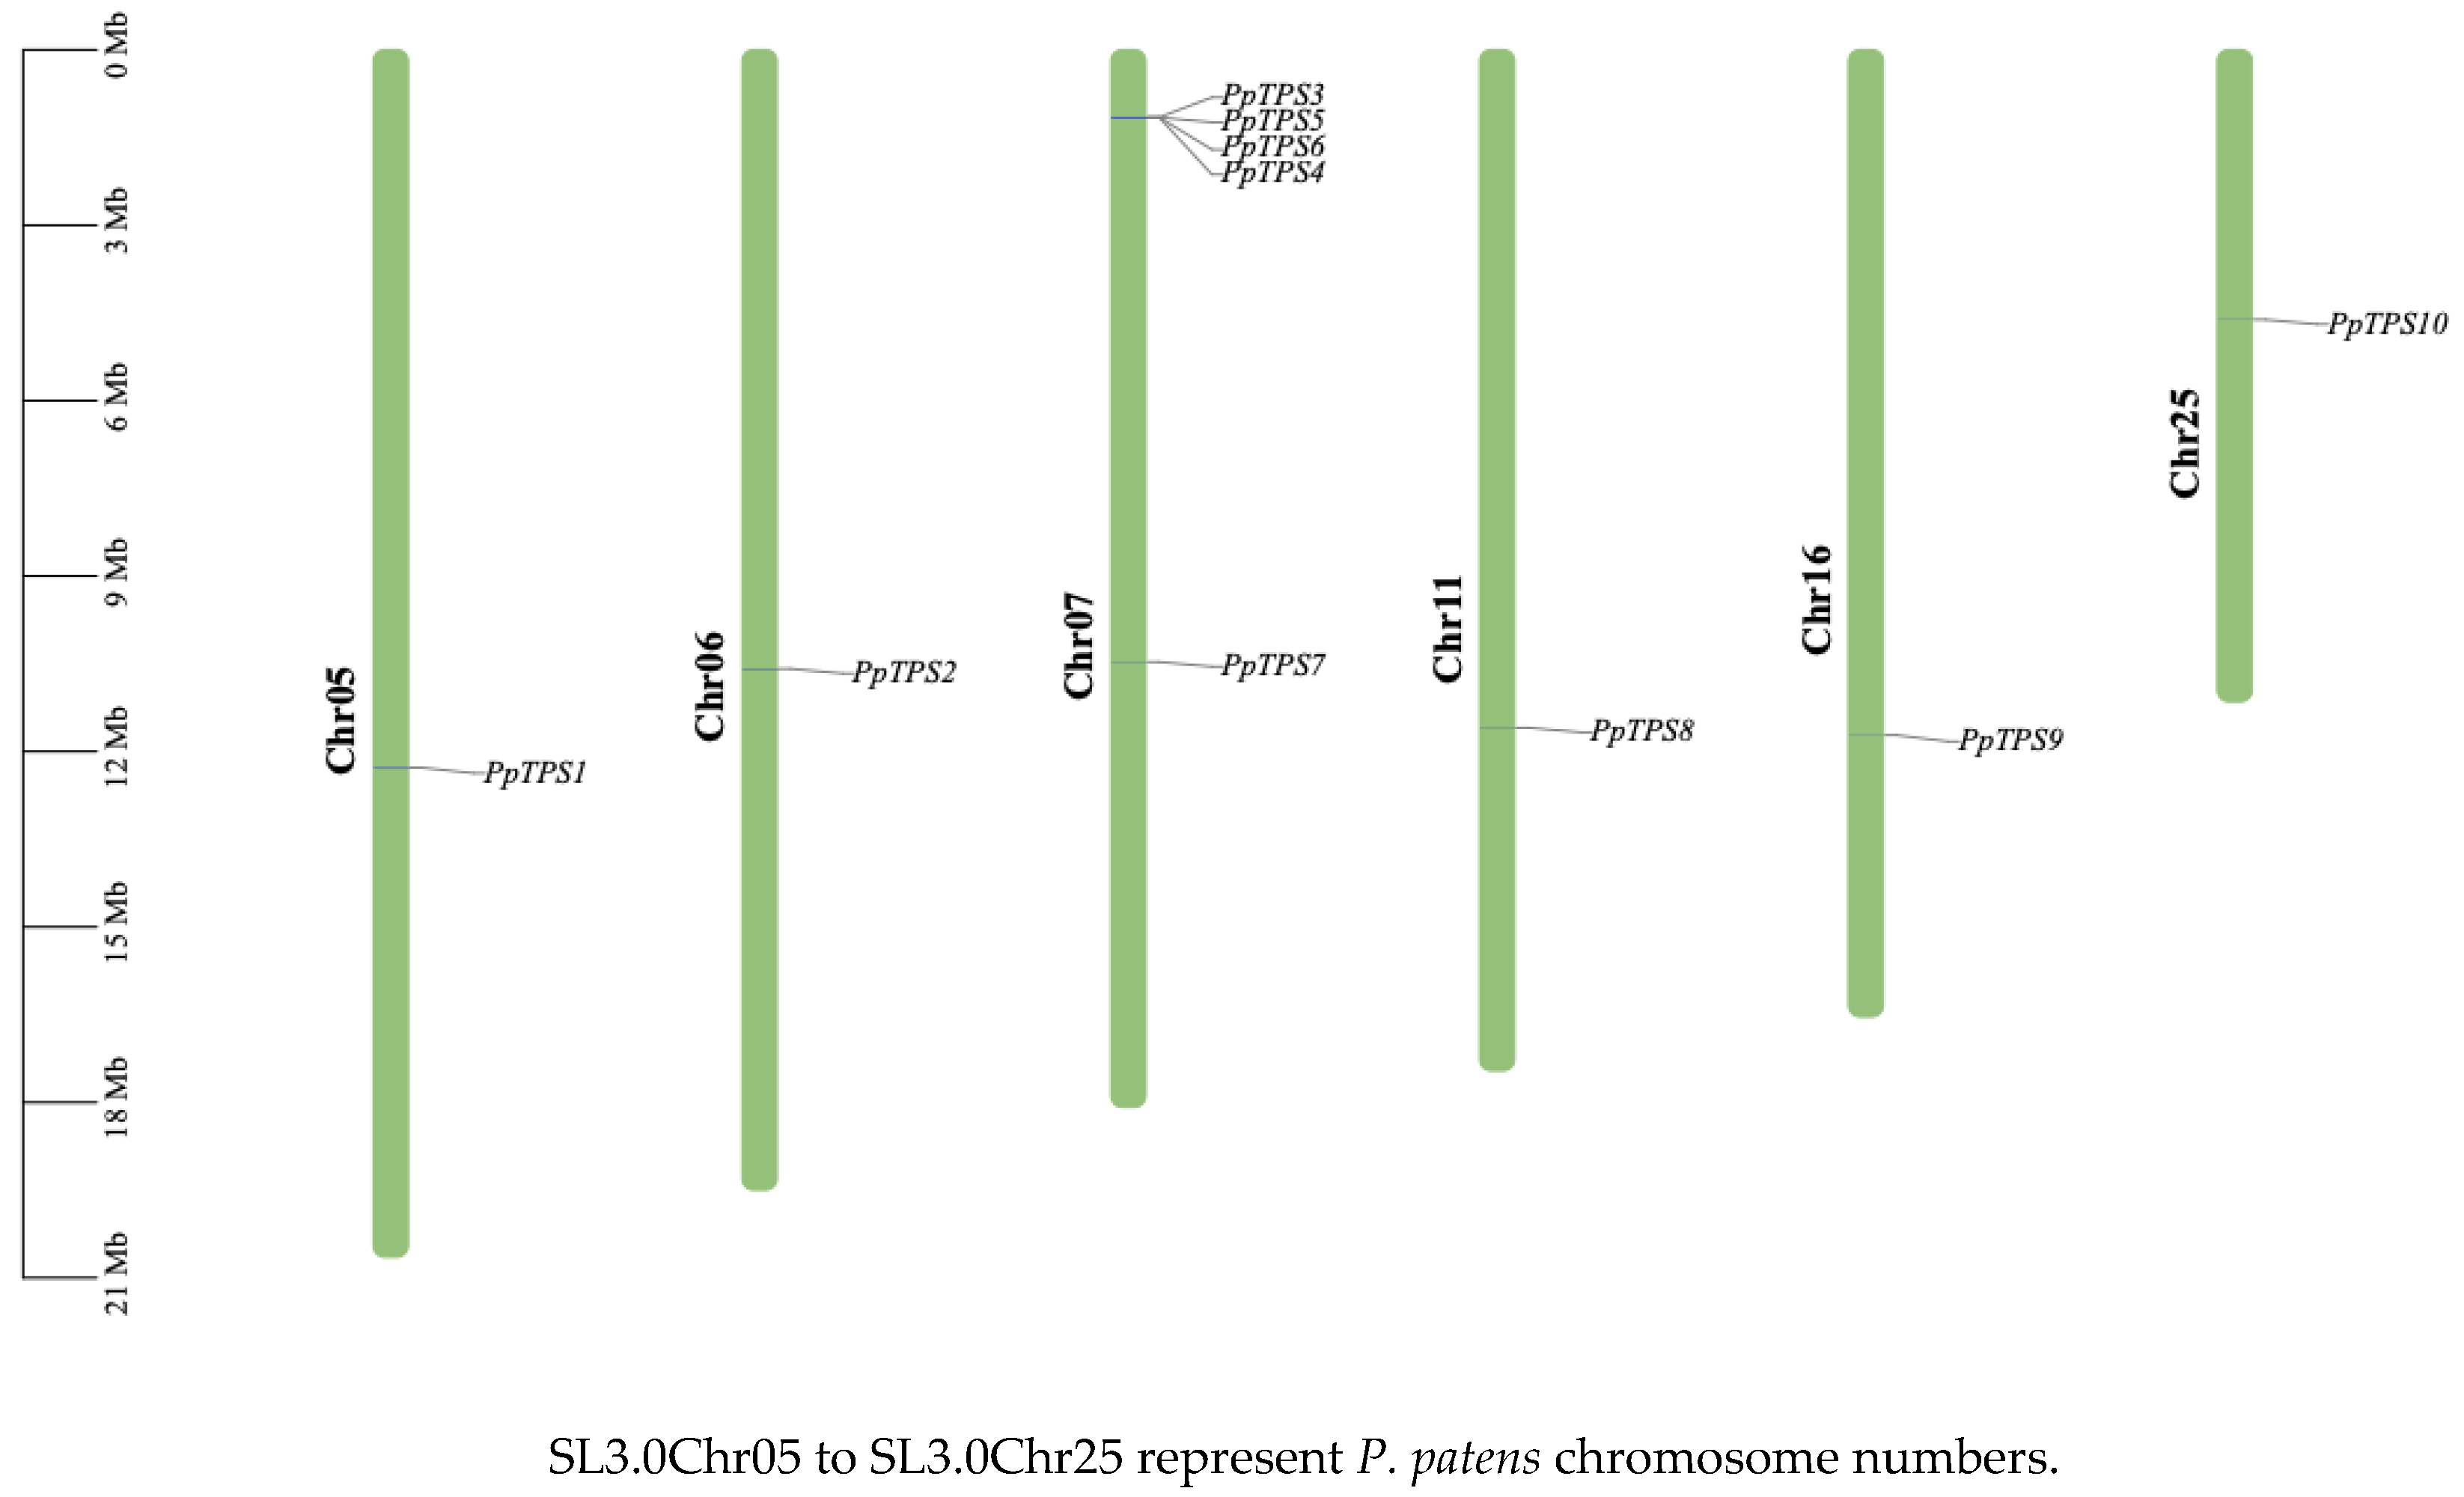
PpTPS10.The distribution of TPS genes across the chromosomes was illustrated by utilizing the genome annotation file of
P. patens along with TBtools software. The findings (
Figure 1) demonstrated an uneven distribution of TPS genes over the 10 chromosomes, where the number of genes present on each chromosome does not correlate with the size of the chromosomes. The average length of amino acids within the TPS family of
P. patens is 885, with molecular weights that vary between 86.952 and 115.257 kDa, and all TPS genes exhibit isoelectric points below 7. The typical instability index measures at 44.62, while the average fat index is recorded at 89.998. The values for hydrophilicity and hydrophobicity range from a maximum of -0.222 to a minimum of -0.362, indicating that all proteins identified are hydrophilic in nature. Subcellular localization predictions showed that the TPS gene family of
P. patens is found in the nucleus, cytoplasm, and chloroplasts. Furthermore, the analysis of signal peptides demonstrated that no members of the TPS family in
P. patens have signal peptides (refer to
Table 2).
3.2. Phylogenetic Tree and Gene Family Structure Analysis of TPS
Phylogenetic trees were created utilizing MEGA11.0 software, drawing upon the TPS protein sequences from
Arabidopsis thaliana (At),
P.patens (Pp),
Dendrobium officinale (Do), and
Phalaenopsis equestris. The findings illustrated in
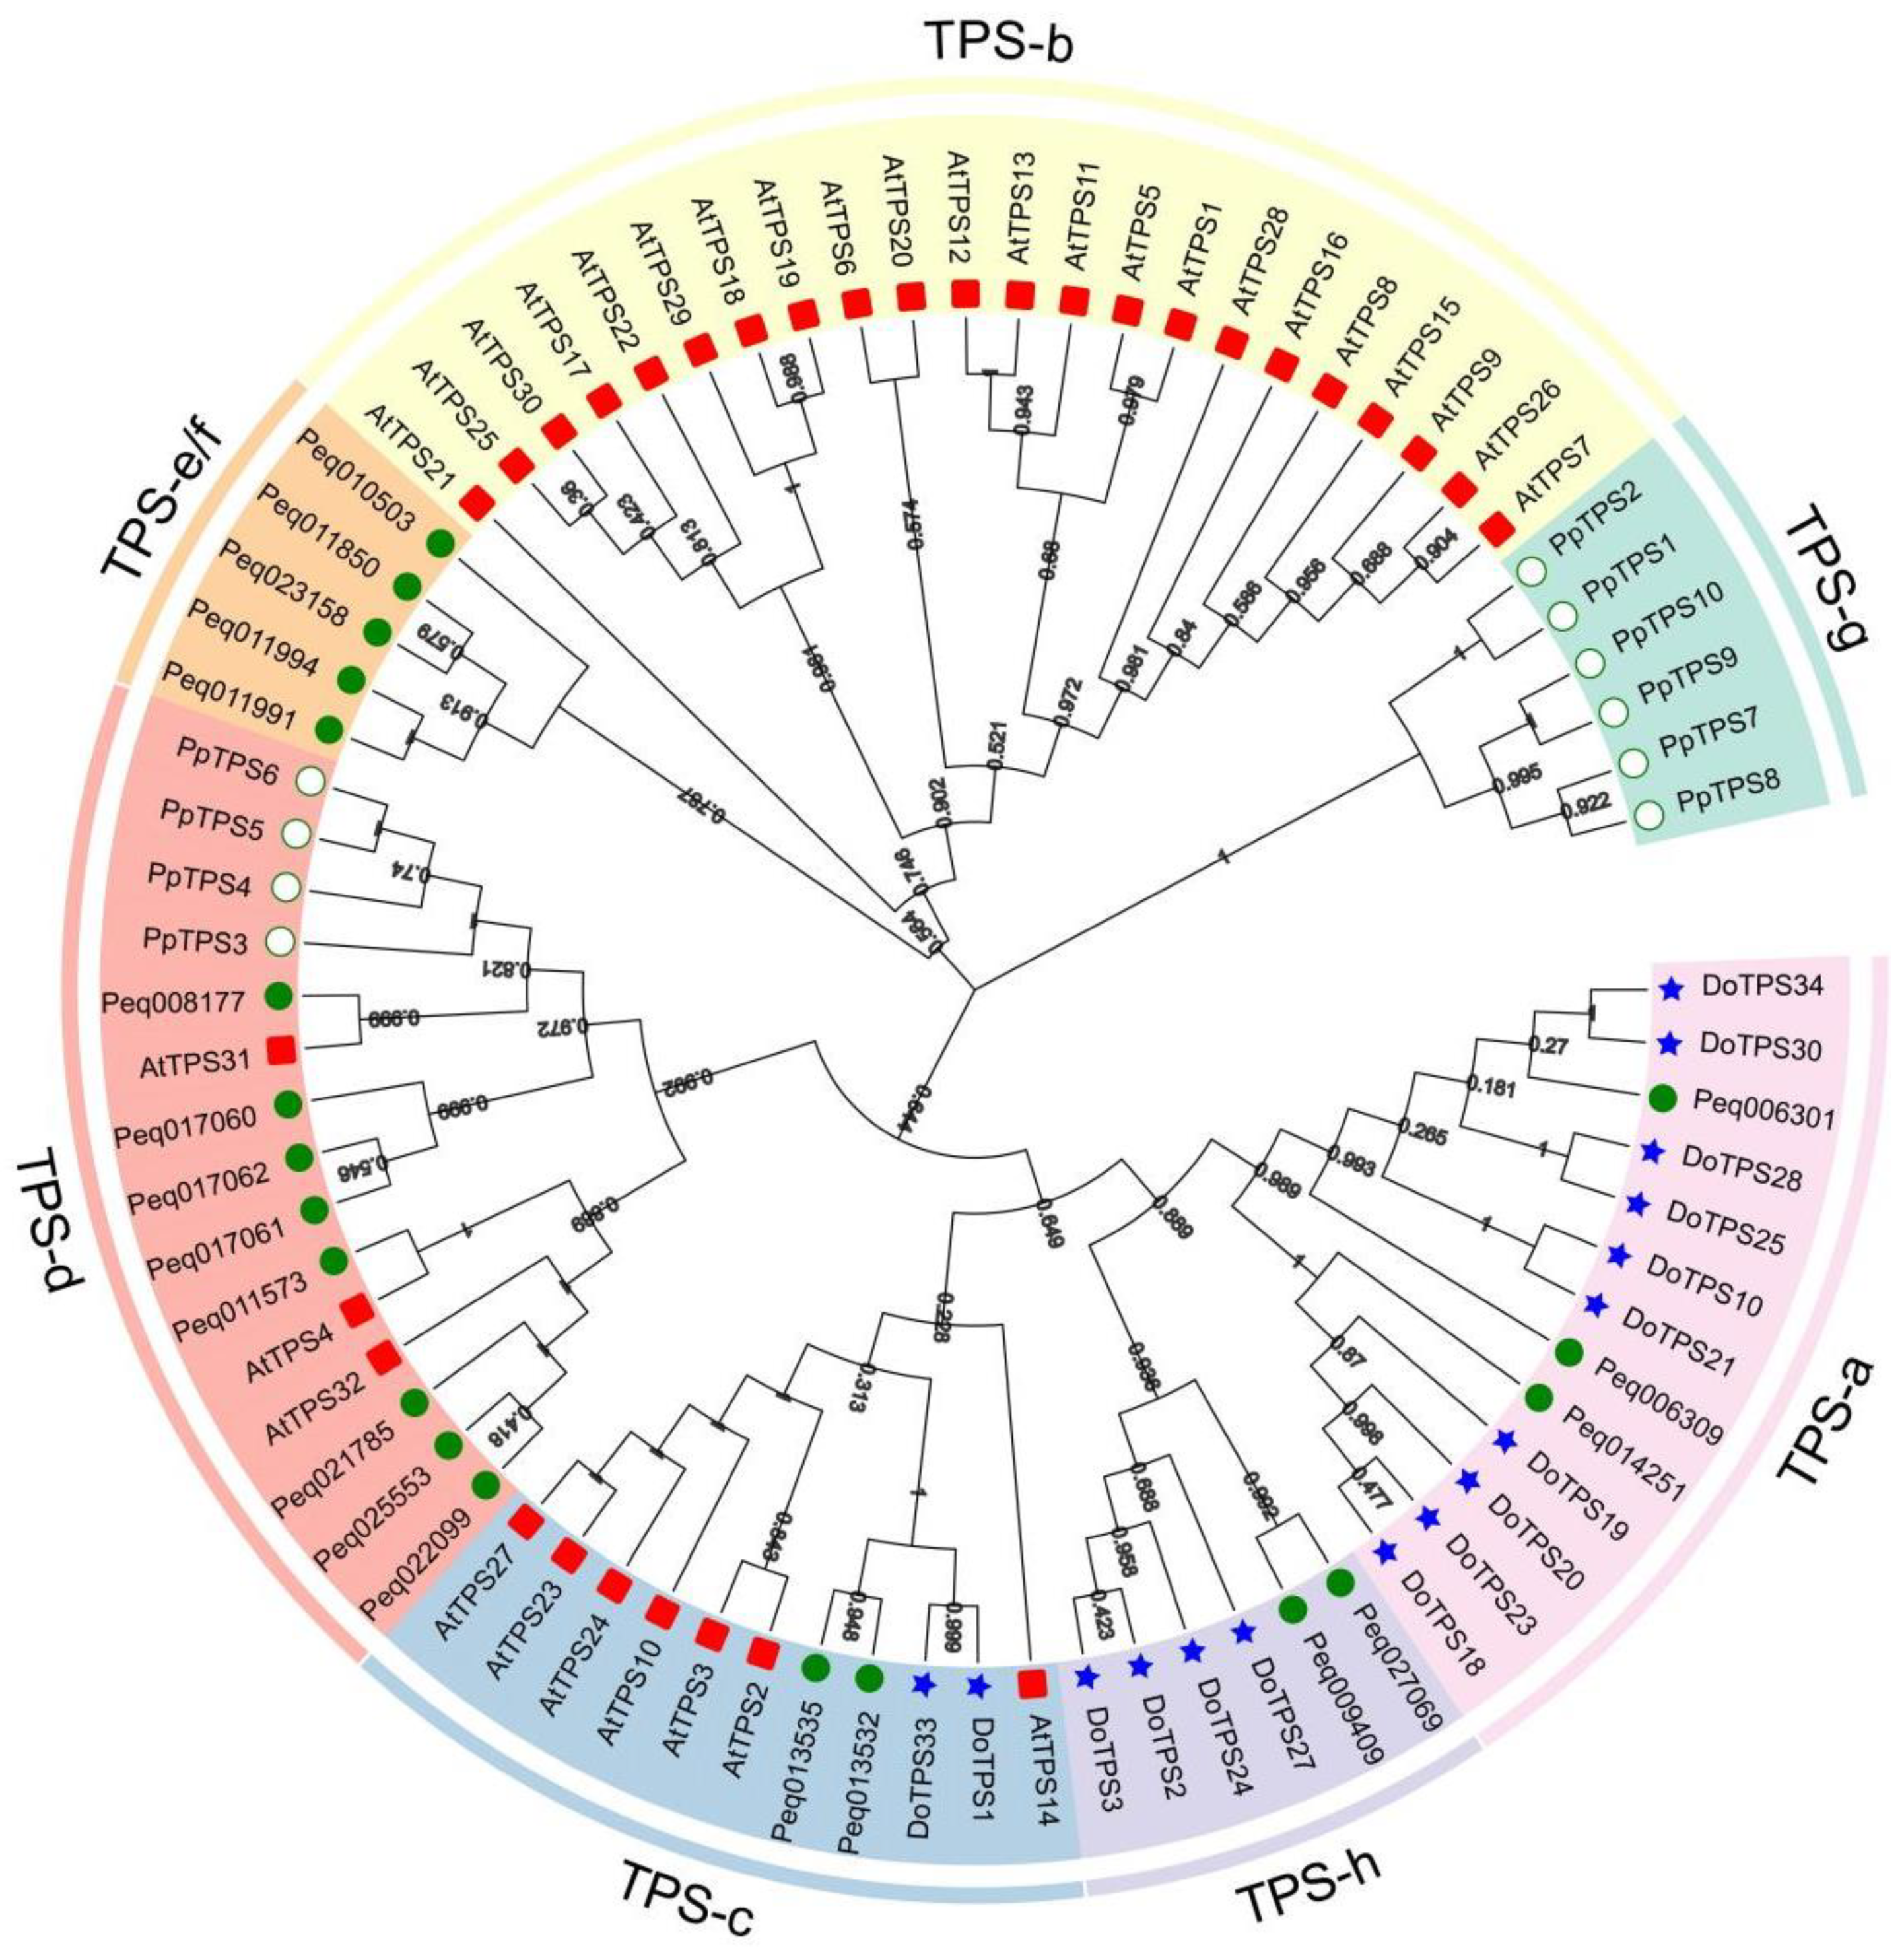
Figure 2 indicate that the 78 TPS proteins identified in these plants can be classified into seven categories: TPS-a, TPS-b, TPS-c, TPS-d, TPS-e/f, TPS-g, and TPS-h. Within these groups, all proteins in the
TPS-b category are derived from Arabidopsis thaliana, whereas six proteins in the TPS-g category originate from
P. patens, and four proteins from the TPS-d group are part of the
P. patens TPS family. The TPS-e/f group comprises 5
Phalaenopsis equestris TPS proteins, with the closest relatives being Peq011991 and Peq011994. Additionally, among the 4 groups,
Oryza sativa is most closely related to
P. patens. Furthermore, the TPS proteins in
P. patens share close evolutionary relationships with those in
Oryza sativa and
Arabidopsis thaliana, suggesting that the TPS gene family members in these 4 species may have retained some common functional characteristics.
Figure 2.
The phylogenetic analysis of
P. patens TPS proteins across ten higher plant species was performed. A phylogenetic tree was constructed using the neighbor-joining method along with the Jones–Taylor–Thornton model, incorporating the pairwise deletion option in MEGA 11.0, which involved 1000 bootstrap replicates. The visualization and annotation of the tree were executed through evolview (
https://www.evolgenius.info//evolview/#mytrees/clcle/123). Previous studies have classified the TPS family into seven unique subfamilies: TPS-a, TPS-b, TPS-c, TPS-d, TPS-e/f, TPS-g, and TPS-h. In the generated visualization, Phalaenopsis TPS proteins are represented by green circles, while TPS proteins from small standing bowl moss are marked with white circles; red rectangles indicate TPS proteins from Arabidopsis, and blue pentagrams are used to denote Dendrobium TPS proteins.
Figure 3.
Analysis of TPS gene structure in P. patens.
Figure 3.
Analysis of TPS gene structure in P. patens.
Figure 4.
Selective evolutionary pressure analysis of P. patens TPS gene family.
Figure 4.
Selective evolutionary pressure analysis of P. patens TPS gene family.
3.3. Cis-Acting Elements Analysis of TPS Family Genes
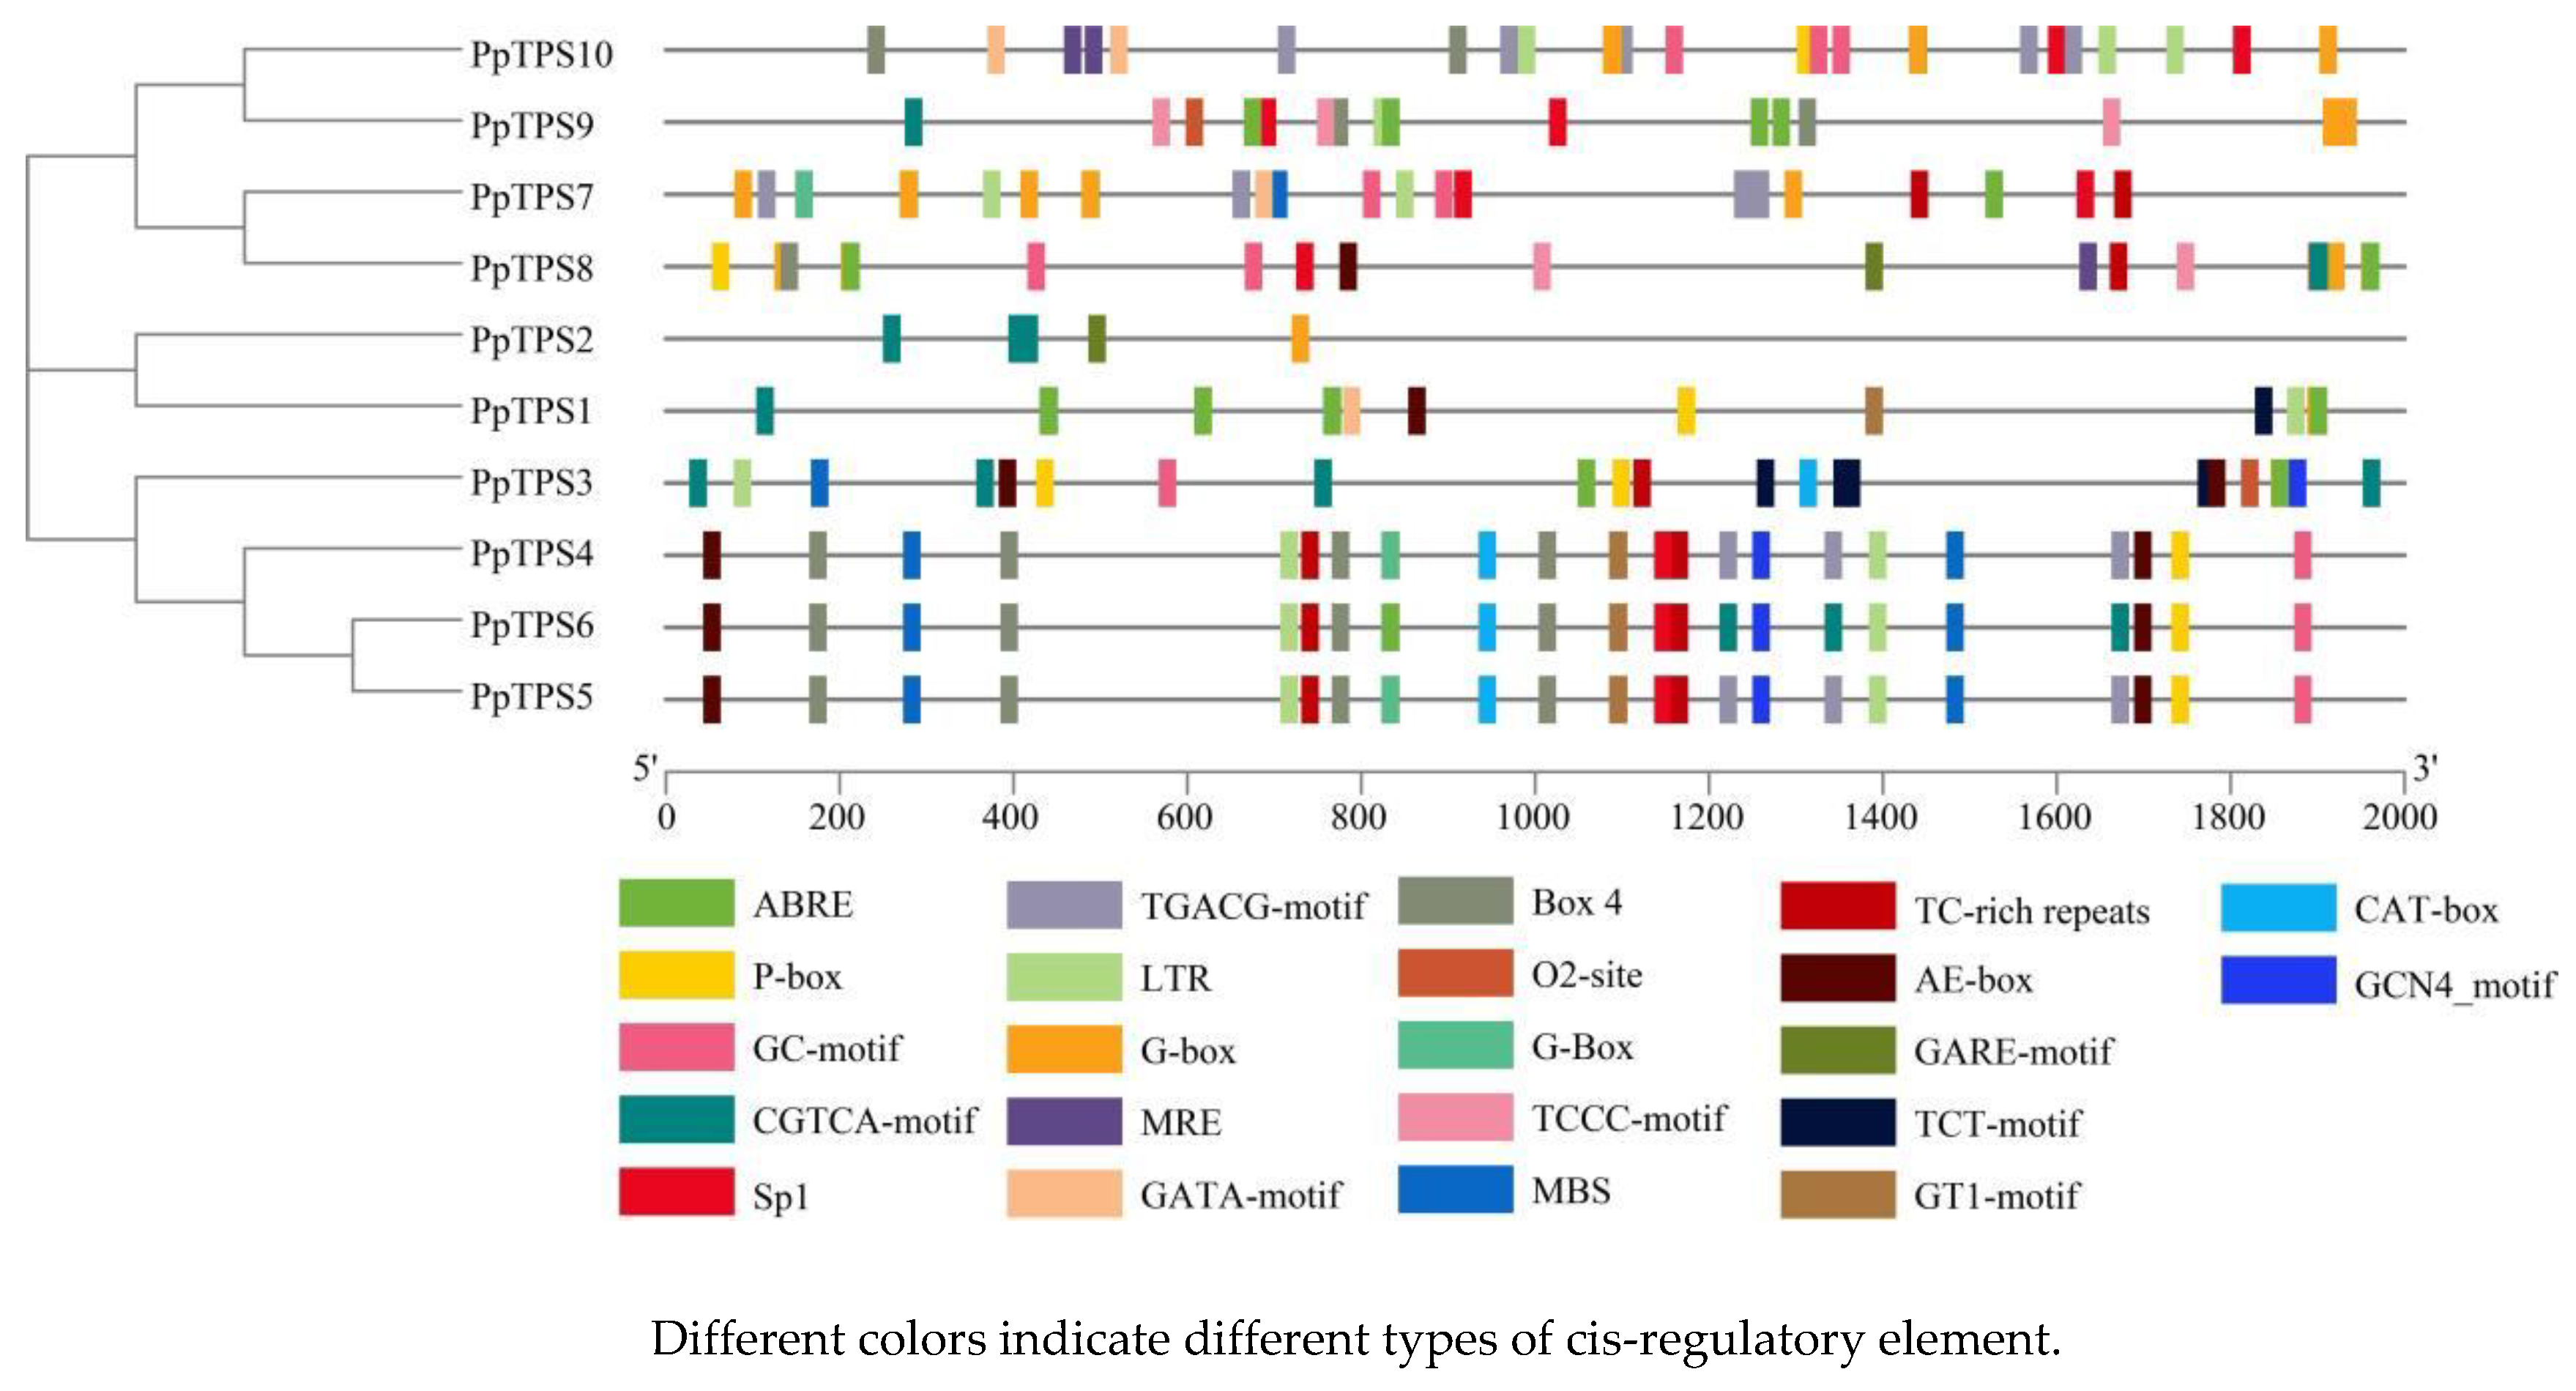
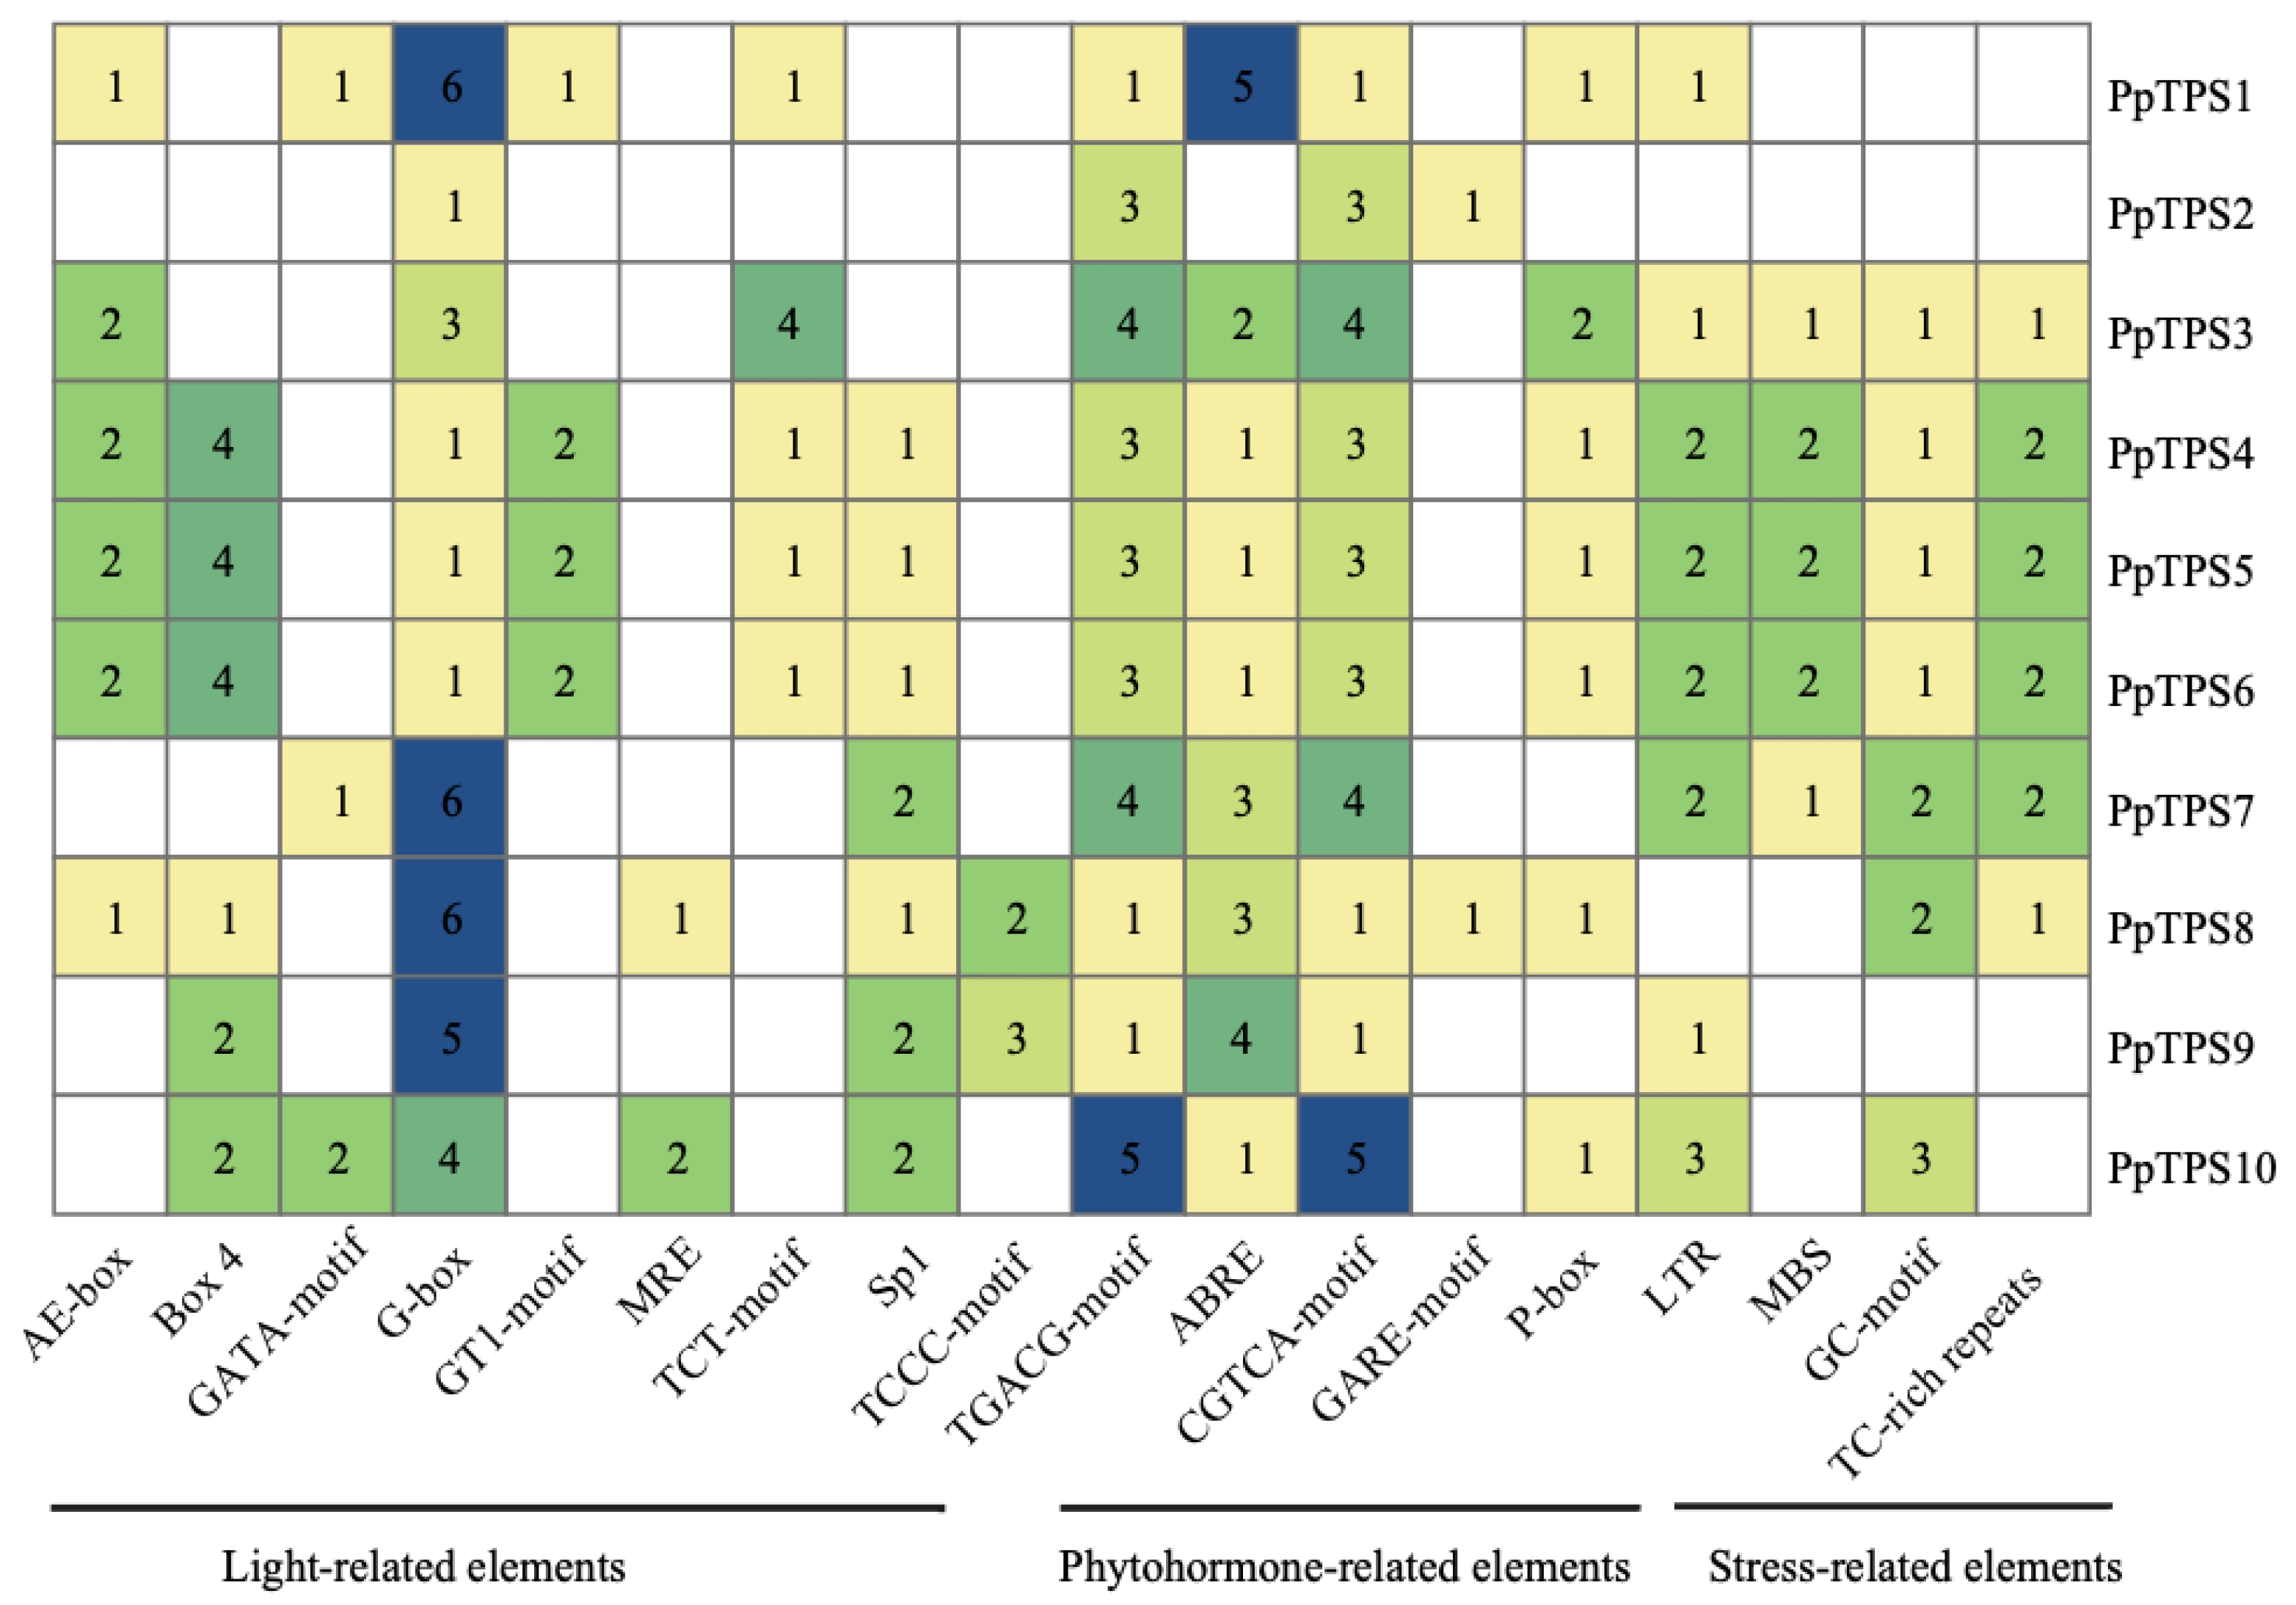
A comprehensive analysis revealed the presence of 21 cis-acting elements within the TPS genes of the moss species P. patens, as illustrated in
Figure 5. Among these identified elements, nine are particularly noteworthy for their connection to light response mechanisms. These include the AE-box, Box 4, GATA-motif, G-box, GT1-motif, MRE, TCT-motif, Sp1, and TCCC-motif, each playing a role in how the organism reacts to light conditions. Additionally, four elements, namely LTR, MBS, GC-motif, and TC-rich repeats, are significant for their involvement in stress responses, indicating the genes' sensitivity to environmental stressors. There is also one element, the CAT-box, which is specifically associated with tissue development processes, highlighting its importance in the growth and differentiation of plant tissues. Furthermore, five elements—ABRE, P-box, TGACG-motif, CGTCA-motif, and GARE-motif—are linked to hormone responses, illustrating the regulatory functions these elements have in hormone signaling pathways. To enhance the understanding of the cis-acting elements within the TPS promoter sequences, three primary categories of these elements were classified, focusing on their relevance to light responses, stress responses, and hormone responses, as depicted in
Figure 6. This classification helps clarify the multifaceted roles that these cis-acting elements play in the regulation of gene expression, demonstrating how they contribute to the plant’s adaptability to various environmental stimuli and developmental cues.
Figure 6 shows that all
P. patens TPS genes contain G-box elements, with
PpTPS1,
PpTPS7, and
PpTPS8 each containing 6 of these elements, which is the highest number. MRE and CAT-box are the least abundant light response elements, with MRE present only in
PpTPS8 and
PpTPS10, and CAT-box present only in
PpTPS7 and
PpTPS10, with
PpTPS10 containing 2 CAT-box elements. With the exception of
PpTPS2 and
PpTPS10, all other members contain LTR elements. All members except
PpTPS2 contain ABRE elements, with
PpTPS1 having the highest number of 5. The elements featuring the CGTCA and TGACG motifs are highly prevalent in
PpTPS10, with five copies of each identified. Overall, a significant presence of cis-acting elements linked to light response, stress response, and hormonal response can be observed, implying that TPS genes in
P. patens play a crucial role in regulating plant growth and hormonal activities.
Table 3.
Functions of the cis-acting elements of each gene in the P. patens TPS gene family.
Table 3.
Functions of the cis-acting elements of each gene in the P. patens TPS gene family.
| Cis-element |
Number of genes |
Sequence of Cis-element |
Functions of Cis-element |
| ABRE |
21 |
ACGTG |
cis-acting element involved in the abscisic acid responsiveness |
| AE-box |
10 |
AGAAACTT |
part of a module for light response |
| Box 4 |
17 |
ATTAAT |
part of a conserved DNA module involved in light responsiveness |
| CAT-box |
4 |
GCCACT |
cis-acting regulatory element related to meristem expression |
| CGTCA-motif |
28 |
CGTCA |
cis-acting regulatory element involved in the MeJA-responsiveness |
| GARE-motif |
2 |
TCTGTTG |
gibberellin-responsive element |
| GATA-motif |
4 |
AAGGATAAGG |
part of a light responsive element |
| G-box |
34 |
CAGACGTGGCA |
cis-acting regulatory element involved in light responsiveness |
| GC-motif |
11 |
CCCCCG |
enhancer-like element involved in anoxic specific inducibility |
| GCN4_motif |
4 |
TGAGTCA |
cis-regulatory element involved in endosperm expression |
| GT1-motif |
7 |
GGTTAA |
light responsive element |
| LTR |
14 |
CCGAAA |
cis-acting element involved in low-temperature responsiveness |
| MBS |
8 |
CAACTG |
MYB binding site involved in drought-inducibility |
| MRE |
3 |
AACCTAA |
MYB binding site involved in light responsiveness |
| O2-site |
3 |
GATGACATGG |
cis-acting regulatory element involved in zein metabolism regulation |
| P-box |
8 |
CCTTTTG |
gibberellin-responsive element |
| Sp1 |
10 |
GGGCGG |
light responsive element |
| TCCC-motif |
5 |
TCTCCCT |
part of a light responsive element |
| TC-rich repeats |
10 |
GTTTTCTTAC |
cis-acting element involved in defense and stress responsiveness |
| TCT-motif |
8 |
TCTTAC |
part of a light responsive element |
| TGACG-motif |
28 |
TGACG |
cis-acting regulatory element involved in the MeJA-responsiveness |
3.4. Conserved Motifs of P. patens TPS Family.
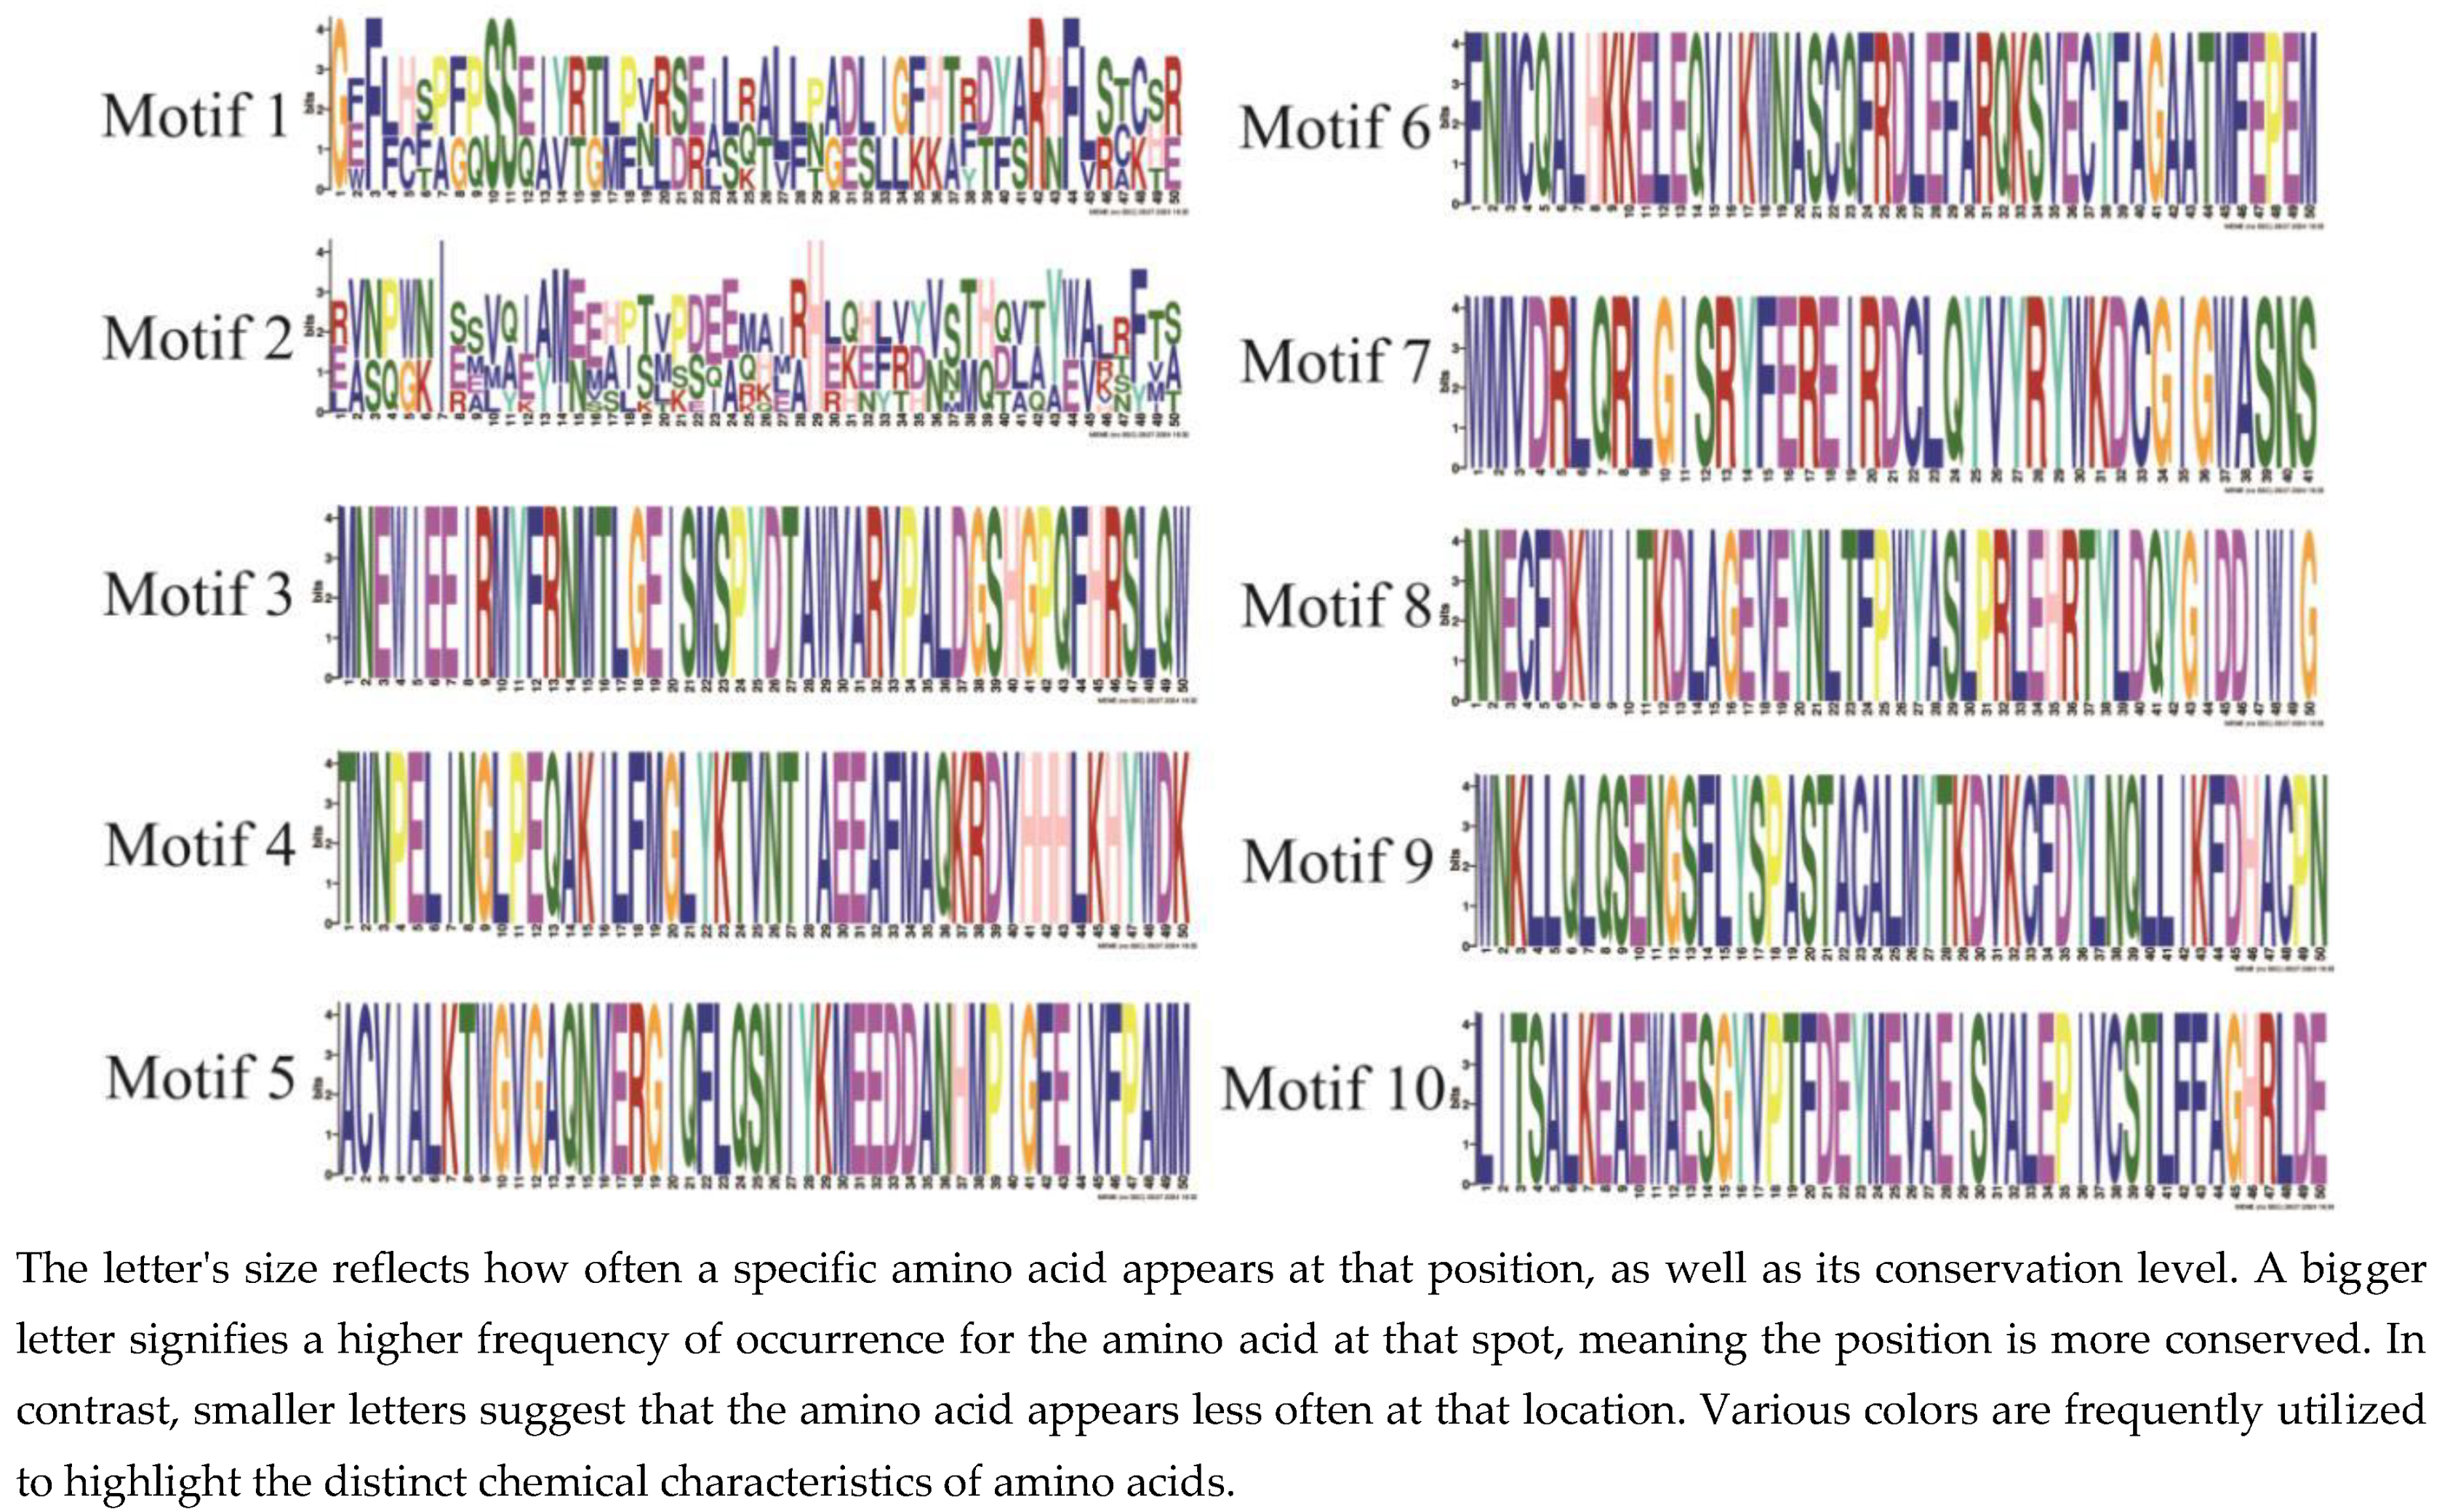
The results of the conserved motif analysis (
Figure 7) indicate that the Schistostega TPS family contains 10 conserved motifs, with each member possessing both motif 1 and motif 2, which constitute the fundamental core of the Schistostega TPS domain; additionally, Class I includes only motif 1 and motif 2.
Table 3 presents the sequence information for the conserved motifs that have been identified, highlighting that the length of each of these motifs varies between 41 to 50 amino acids. This variation in length is significant in understanding the structural and functional characteristics of the motifs. Additionally, the amino acid sequences corresponding to the different conserved motifs are depicted using stacked letters at each respective position, as illustrated in
Figure 8. This representation clearly shows that the ten identified TPS motifs exhibit a high degree of similarity, which may suggest their potential importance in related biological functions or evolutionary conservation.
Table 4.
Conserved sequence information of P. patens TPS gene family.
Table 4.
Conserved sequence information of P. patens TPS gene family.
| Motif |
Motif sequence |
Width |
| Motif1 |
GFFLHSPFPSSZIYRTLPVRSEILRALLPADLJGFHTFDYARHFLSTCSR |
50 |
| Motif2 |
EVNPWNIESVAEAMEEAITVPDEEMAJRHEKEFVYVSTHDVAYWALRFTS |
50 |
| Motif3 |
MNEWIEEIRMYFRNMTLGEISMSPYDTAWVARVPALDGSHGPQFHRSLQW |
50 |
| Motif4 |
TWNPELINGLPEQAKILFMGLYKTVNTIAEEAFMAQKRDVHHHLKHYWDK |
50 |
| Motif5 |
ACVIALKTWGVGAQNVERGIQFLQSNIYKMEEDDANHMPIGFEIVFPAMM |
50 |
| Motif6 |
FNMCQALHKKELEQVIKWNASCQFRDLEFARQKSVECYFAGAATMFEPEM |
50 |
| Motif7 |
WMVDRLQRLGISRYFEREIRDCLQYVYRYWKDCGIGWASNS |
41 |
| Motif8 |
NNECFDKWIITKDLAGEVEYNLTFPWYASLPRLEHRTYLDQYGIDDIWIG |
50 |
| Motif9 |
WNKLLQLQSENGSFLYSPASTACALMYTKDVKCFDYLNQLLIKFDHACPN |
50 |
| Motif10 |
LITSALKEAEWAESGYVPTFDEYMEVAEISVALEPIVCSTLFFAGHRLDE |
50 |
3.5. Tissue-Specific Expression Analysis of the PpTPS Gene
In order to assess the specificity of expression for the PpTPS gene in
P. patens across different growth stages and various tissues, we employed quantitative reverse transcription polymerase chain reaction (qRT-PCR) technology. This method allowed us to accurately measure the expression levels of the
PpTPS gene during the vegetative growth phase, as well as in different tissues that are present during the reproductive growth stage. By conducting these analyses, we aimed to gain a deeper understanding of how the expression of the
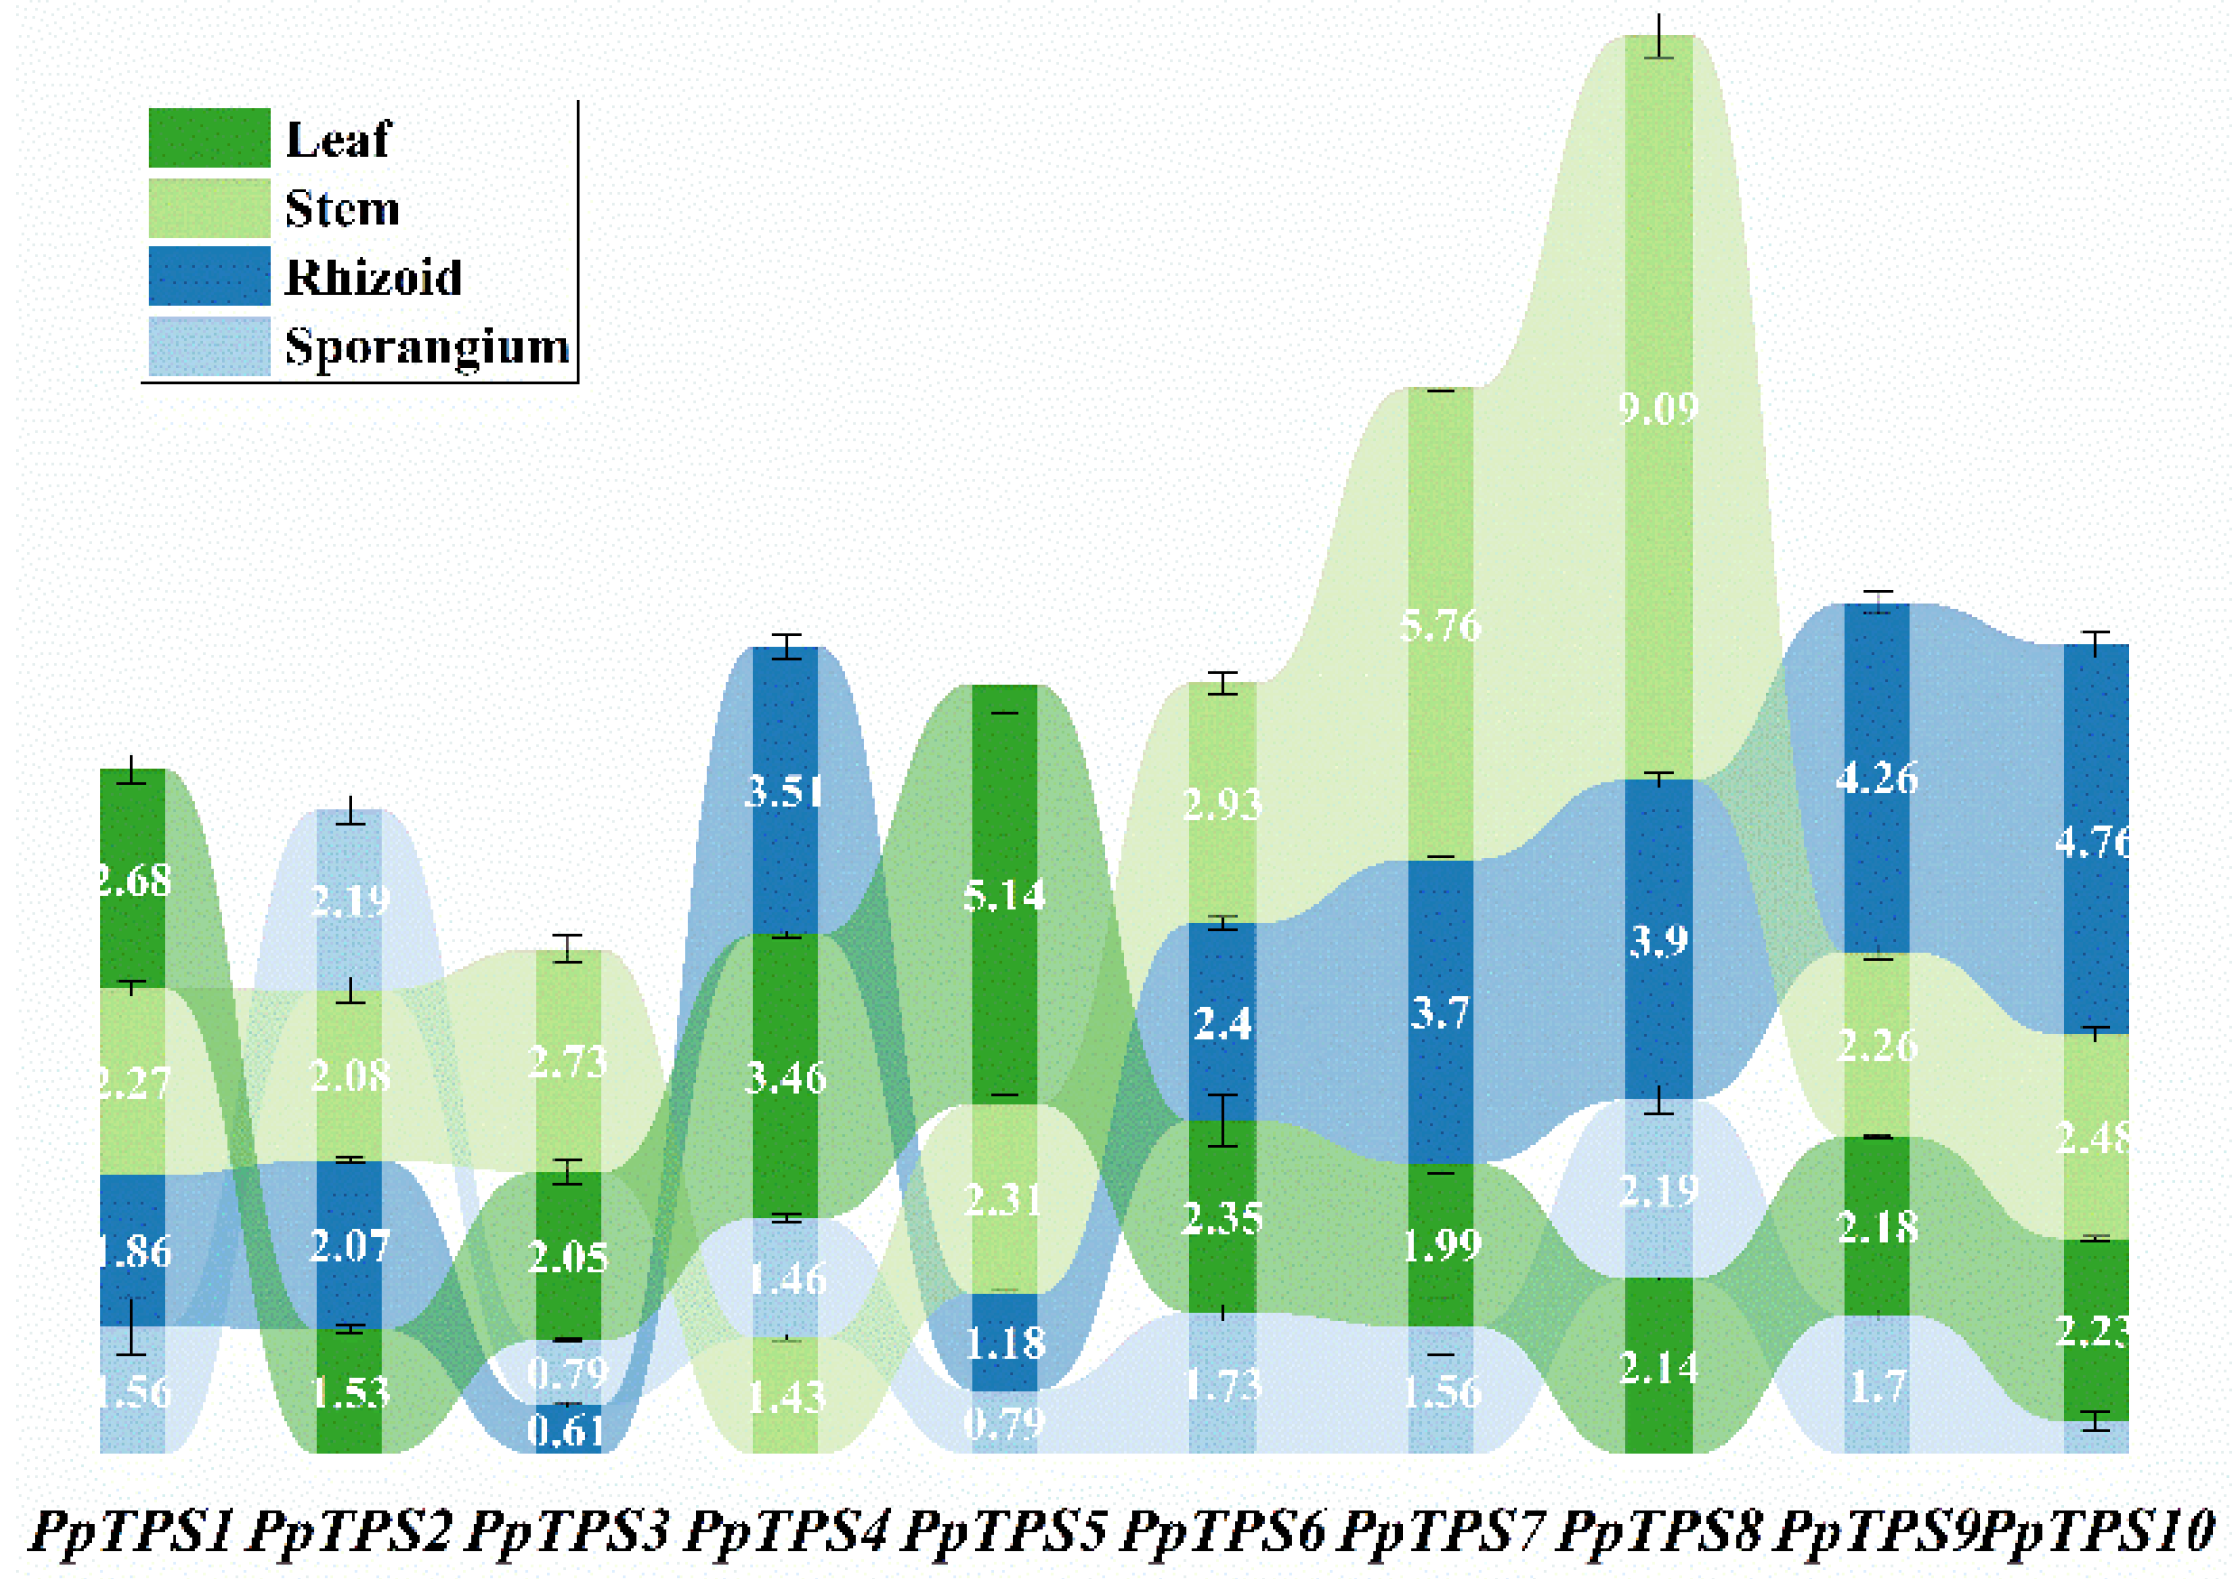
PpTPS gene varies under distinct biological conditions.At various growth stages, all
PpTPS genes exhibited high expression levels in sporangia, rhizoids, stems, and leaves (
Figure 9). Notably, PpTPS2 showed particularly high expression in sporangia, while
PpTPS4, PpTPS6, PpTPS7, PpTPS8, PpTPS9, and
PpTPS10 were predominantly expressed in rhizoids. In stems,
PpTPS1, PpTPS2, PpTPS3, PpTPS5, PpTPS6, PpTPS7, PpTPS8, PpTPS9, and
PpTPS10 were all highly expressed. Additionally,
PpTPS4, PpTPS5, and
PpTPS6 demonstrated high expression levels in leaves. The findings suggest that the
PpTPS genes may play distinct roles throughout various growth stages and upon examination of diverse plant tissues. This implies that the functions of these genes are not uniform but rather specialized, potentially contributing to the overall developmental processes of the plant. As such, understanding the specific roles of
PpTPS genes in different contexts could enhance our knowledge of plant biology and inform agricultural practices.
3.6. Expression Analysis of PpTPS Gene under Hormonal and Abiotic Stress
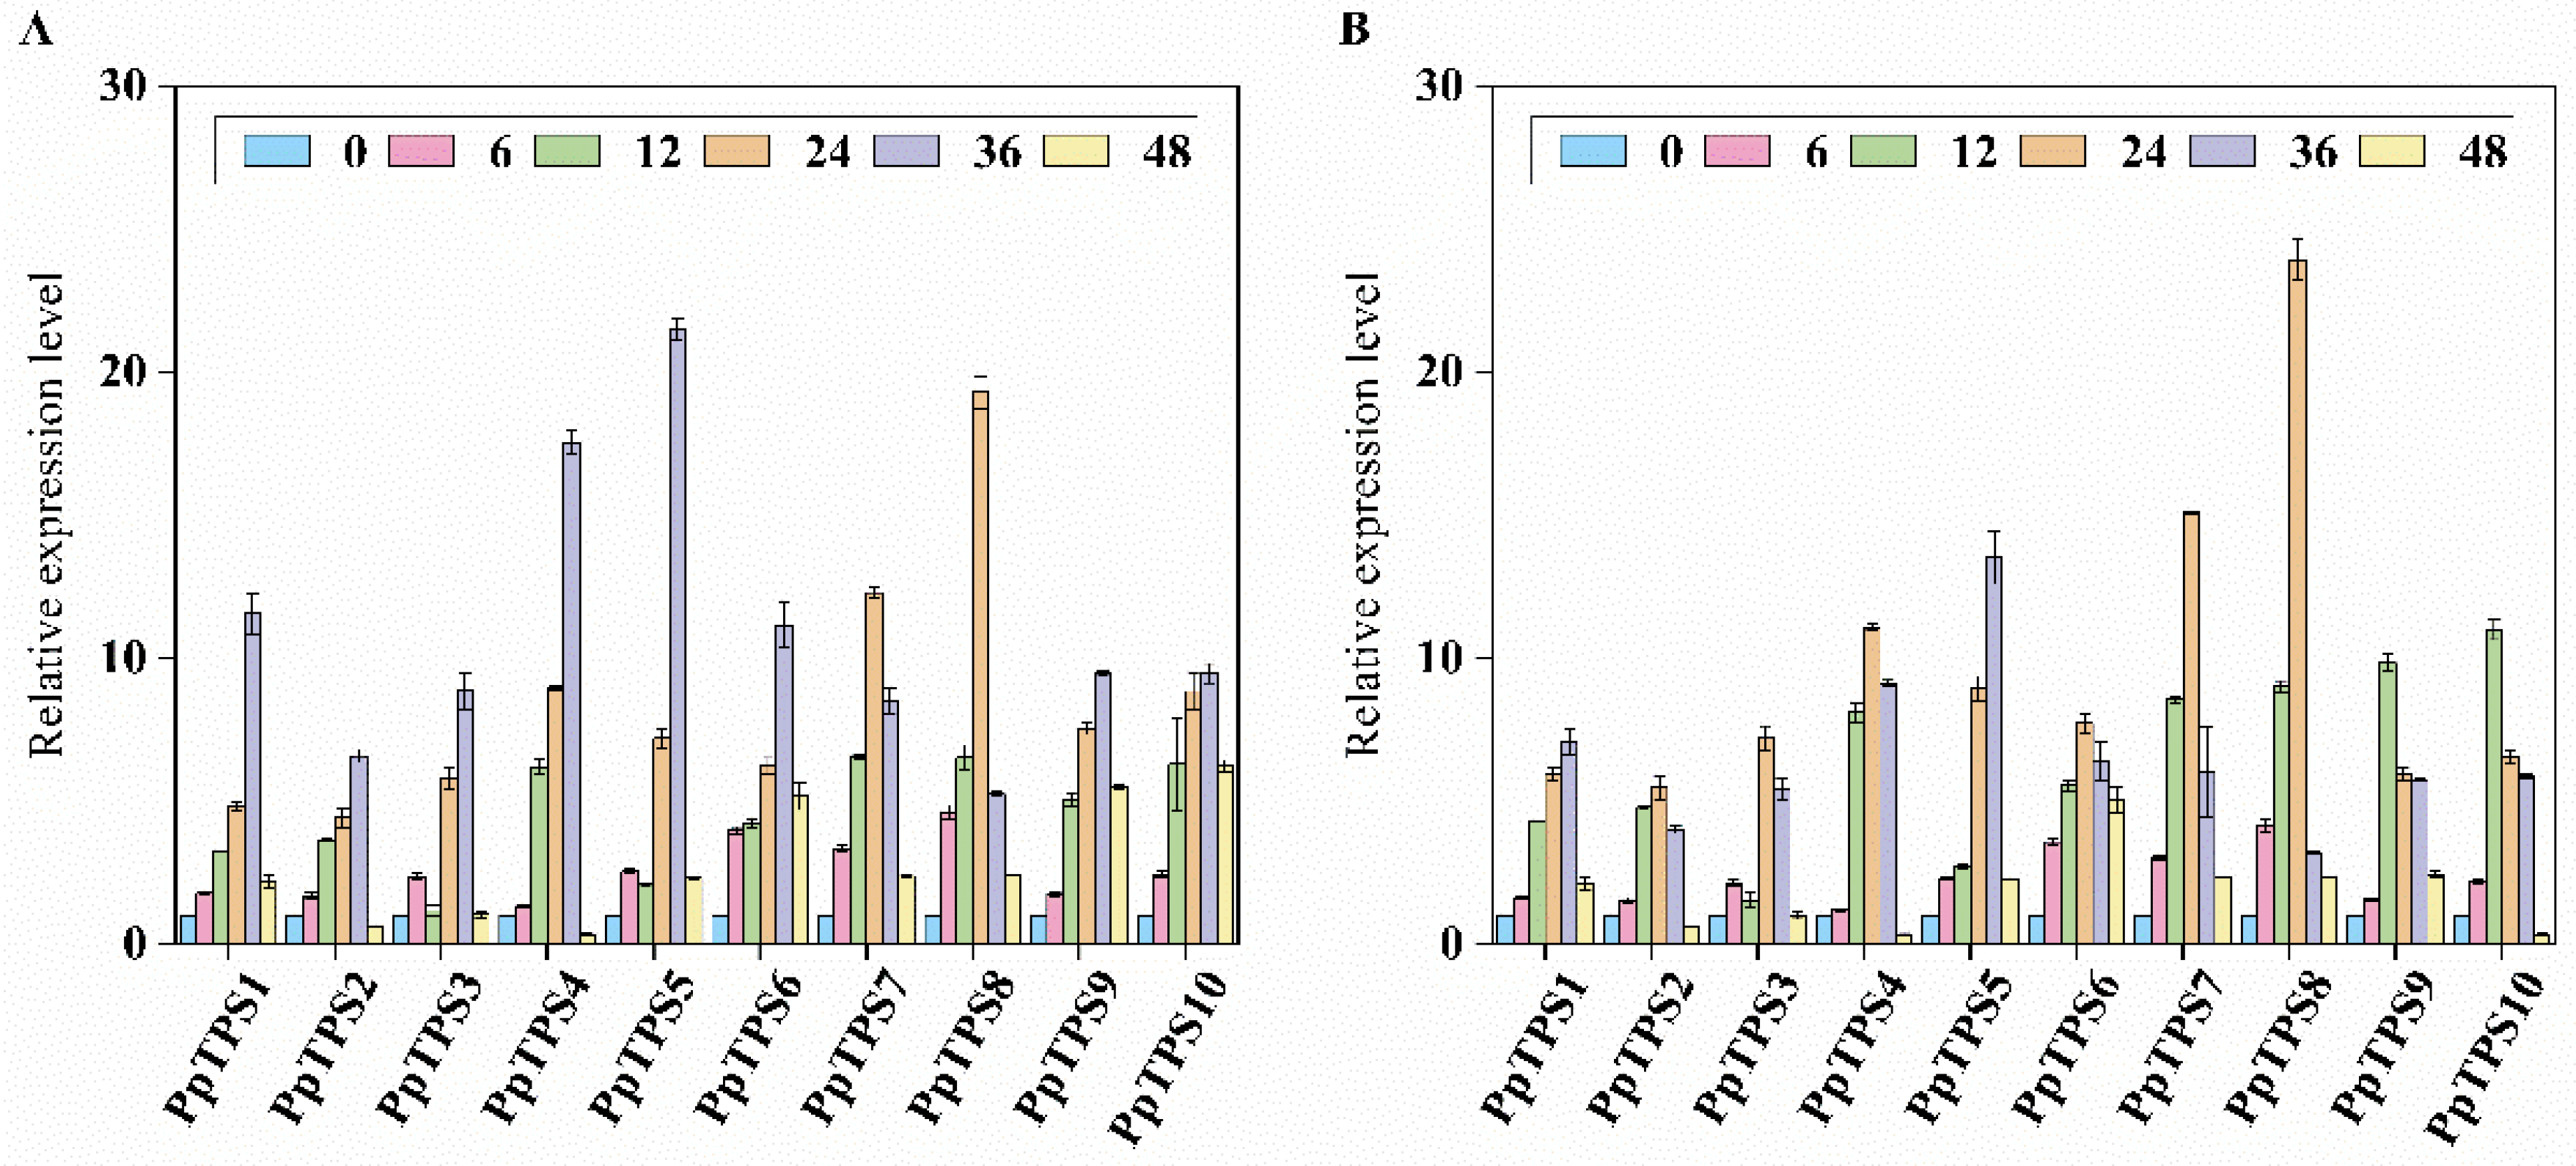
In order to explore the expression levels of
PpTPS genes in response to various hormone treatments, we conducted an analysis of ten
PpTPS genes. These genes were specifically exposed to a concentration of 100 µmol/L of abscisic acid (ABA) and 50 µmol/L of methyl jasmonate (MeJA). This investigation aimed to understand how these hormones influence the expression patterns of the
PpTPS genes, thereby shedding light on their potential roles in hormonal signaling pathways. (refer to
Figure 10B). Among the
PpTPS gene family, after 6 hours of treatment with ABA, all genes, aside from
PpTPS4, demonstrated a significant increase in expression, with
PpTPS5 showing the highest expression level. After 12 hours of ABA treatment,
PpTPS7 attained its maximum expression level. Following 24 hours of ABA exposure, we noted a remarkable increase in the expression levels of
PpTPS4,
PpTPS5,
PpTPS7, and
PpTPS8, Despite
PpTPS2 exhibiting the lowest expression levels, a significant increase in the expression of all members was observed after 6 hours of MeJA treatment, particularly in
PpTPS4,
PpTPS7, and
PpTPS8. However, after 24 hours, there was a marked decline in expression levels.
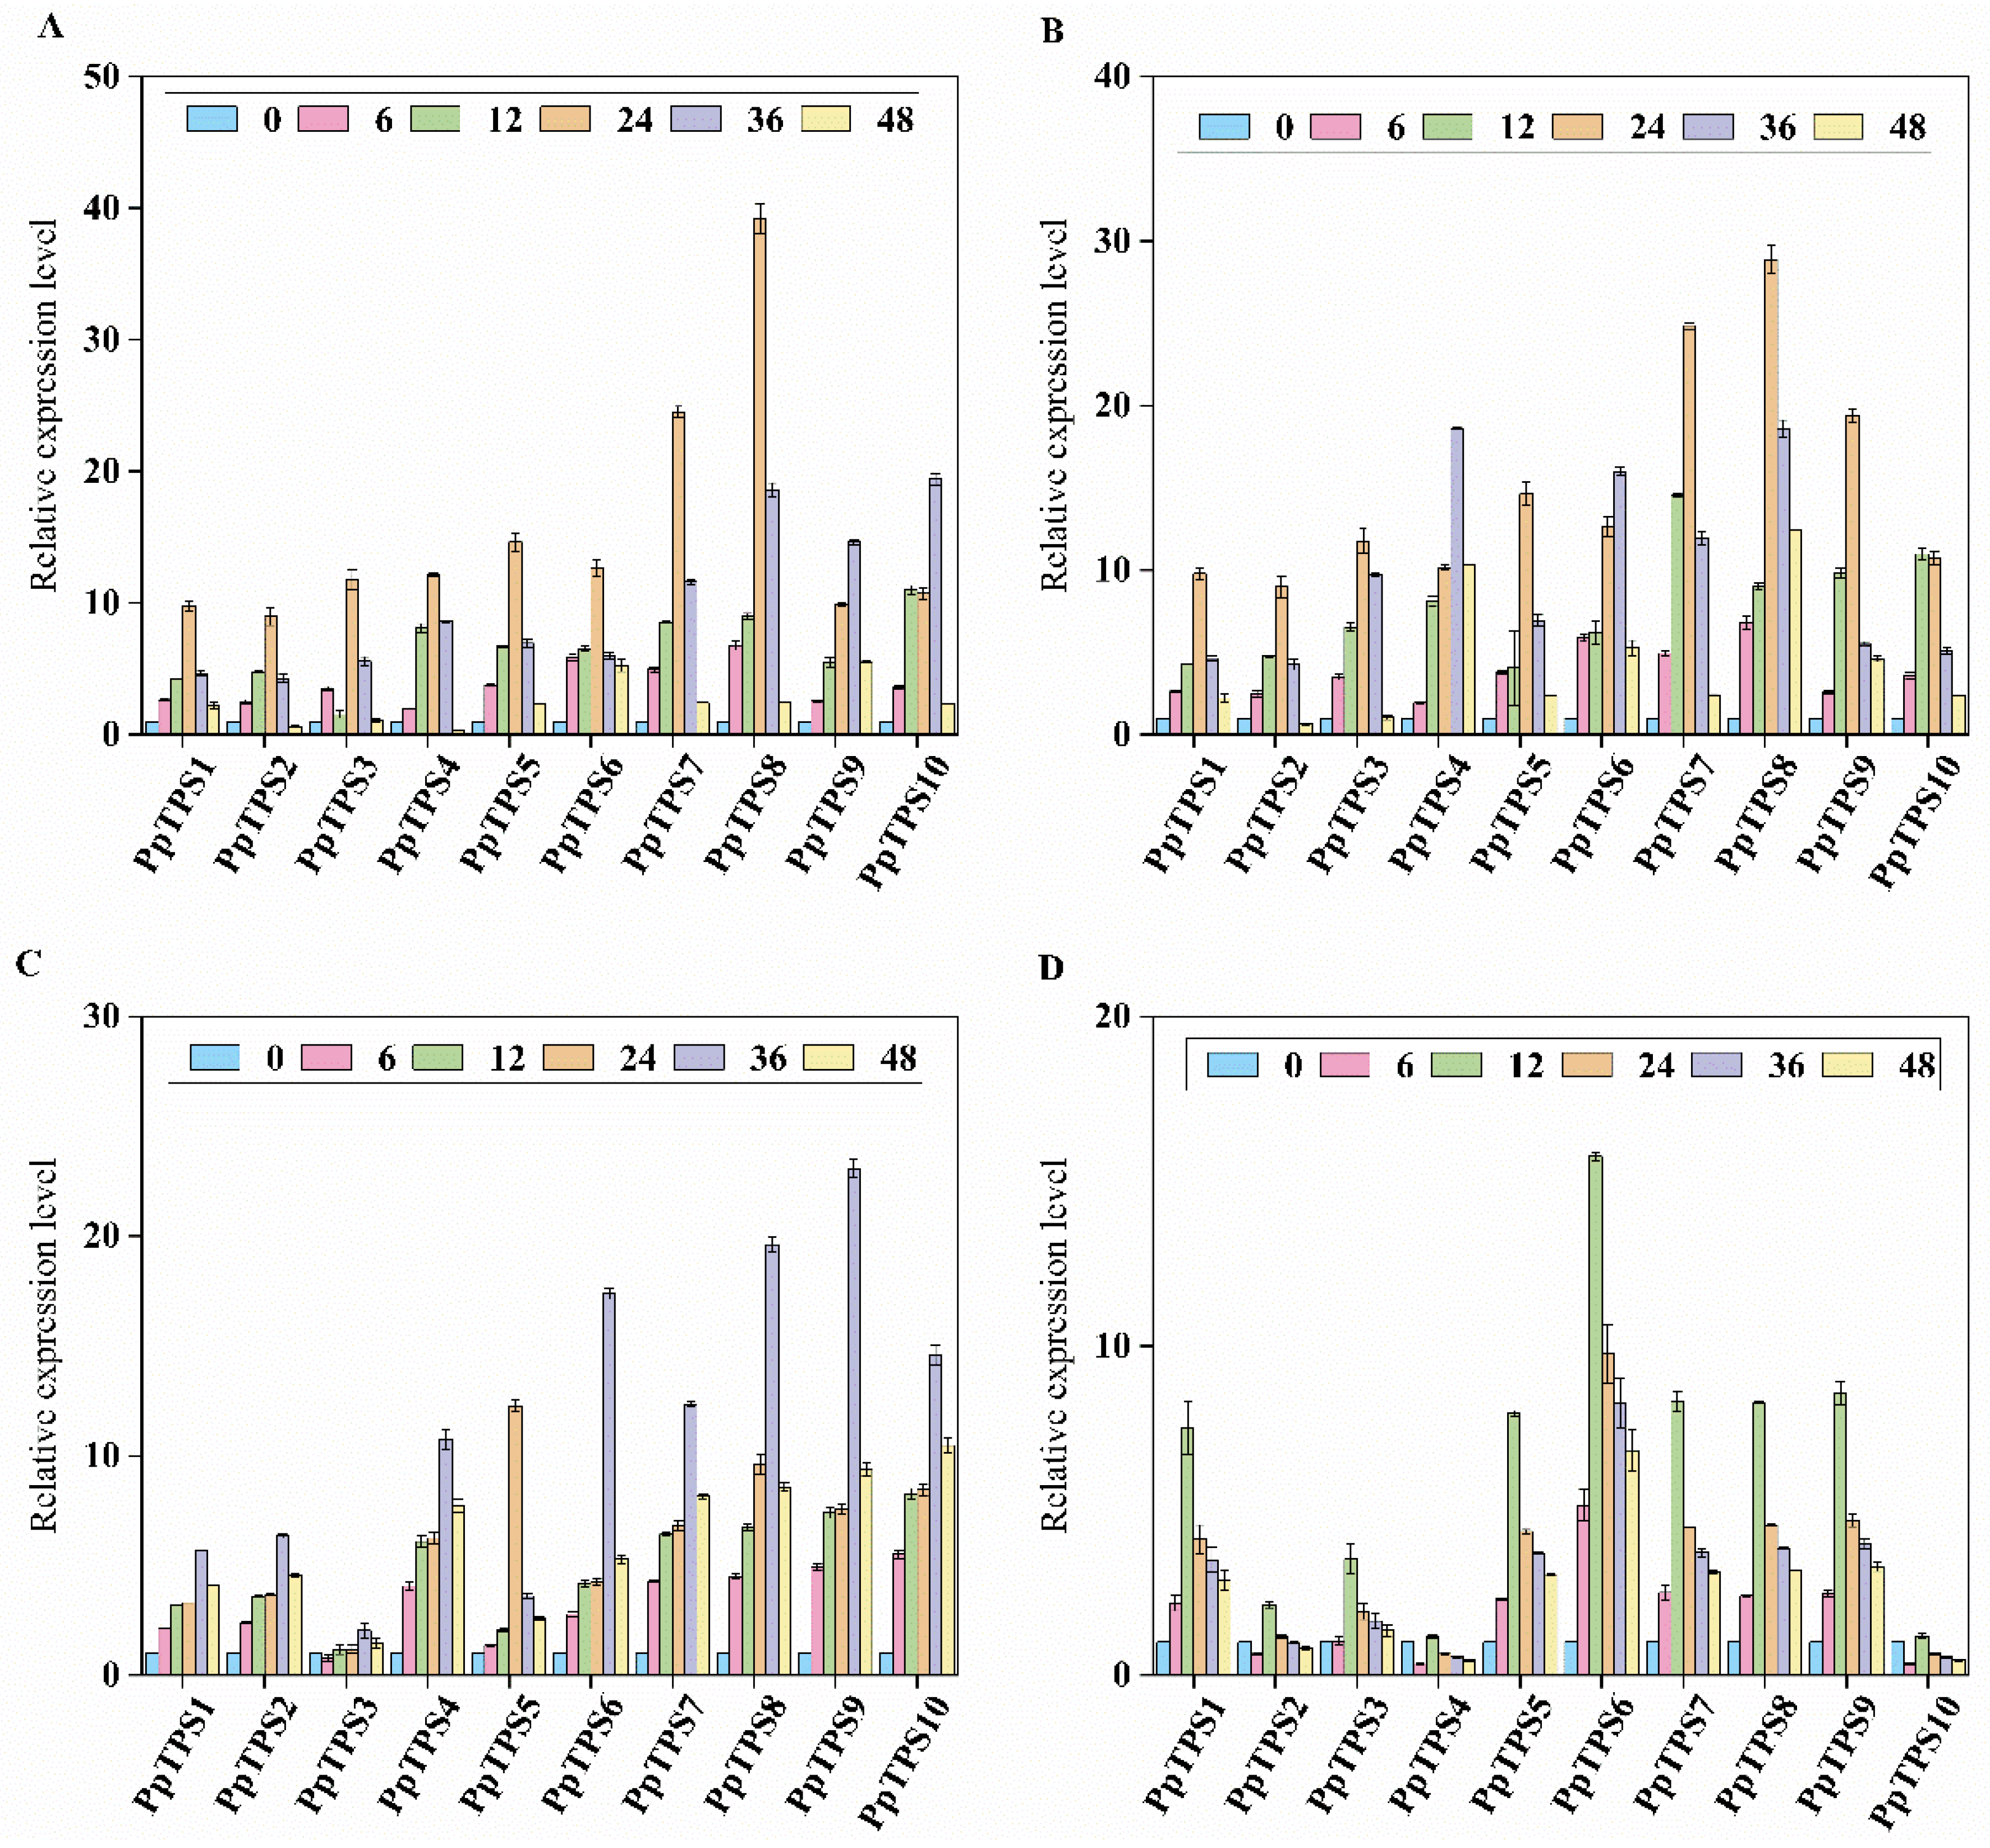
The expression levels of PpTPS genes were assessed to determine their response to a range of abiotic stresses. In particular, a total of ten PpTPS genes were analyzed under several experimental conditions. These included exposure to 150 µmol/L sodium chloride (NaCl), treatment with 20% polyethylene glycol (PEG) 6000, illumination with 253.7 nm ultraviolet (UV) light, and prolonged durations of darkness. The results of this evaluation are illustrated in
Figure 11A-D, which showcases the changes in expression levels associated with each stressor. Among the various members of the
PpTPS family,
PpTPS6 and
PpTPS8 exhibited a marked increase in expression after 6 hours of PEG treatment. After 12 hours of exposure to PEG, the expression levels of all genes examined showed a significant rise, with
PpTPS10 displaying the peak level of expression. After 24 hours of PEG treatment, all gene expression levels continued to be elevated, and
PpTPS8 registered the highest expression among them. Following this, a decrease in the expression levels of all members was observed between 24 and 48 hours. When treated with NaCl, the expression levels of
PpTPS1,
PpTPS2,
PpTPS3,
PpTPS4,
PpTPS5,
PpTPS7,
PpTPS8, and
PpTPS10 showed a significant rise within the 6 to 24-hour period, whereas the expression levels of most members were notably reduced after the 24-hour mark.
Following 6 hours of UV exposure, there was a notable increase in the expression levels of PpTPS1, PpTPS2, PpTPS4, PpTPS6, PpTPS7, PpTPS8, PpTPS9, and PpTPS10, while the expression of other members was considerably reduced. After 12 hours of UV exposure, all members except for PpTPS3 showed a significant rise in expression, with PpTPS9 reaching the highest level. By the 36-hour mark, expression levels for all members had significantly risen, though a decline was observed subsequently. When extending the dark period treatment from 6 to 24 hours, a general increase in the expression levels of all members was noted. However, following the 24-hour extension of the dark treatment, significant suppression of expression levels across all members was recorded.
4. Discuss
P. patens is identified as an important model organism, possessing a terpene synthase (TPS) gene family that plays an essential role in the biosynthesis of terpenoid compounds, which are important for plant growth, development, and reactions to abiotic stress. Research has demonstrated that TPS genes are significant in regulating terpenoid biosynthesis across various plant species, including Arabidopsis thaliana., Dendrobium officinale, Phalaenopsis amabilis, Solanum lycopersicum, and Oryza sativa. These genes are notably significant in mediating plant responses to abiotic stress(Dudareva et al., 2013; Gershenzon & Dudareva, 2007b). This study undertook an extensive bioinformatics analysis of the TPS gene family in P. patens. The investigation identified ten TPS genes distributed across six chromosomes. Domain analysis confirmed the presence of conserved motifs 1 and 2 in all these genes. However, signal peptide predictions indicated the absence of signal peptides in the TPS family of P. patens. These findings align with similar studies on Dendrobium officinale, where TPS gene localization was observed in chloroplasts, cytoplasm, and the nucleus, contributing to terpenoid biosynthesis(Gershenzon & Dudareva, 2007b). The conservation of gene structures observed may highlight significant evolutionary events. To assess the structural diversity of TPS genes in P. patens, the study compared their exon-intron arrangements. Two main types of TPS genes were identified: one with shorter intron regions and another with longer intron sequences. This classification parallels observations in tomato and Phalaenopsis, suggesting that TPS genes within the same subfamily generally possess analogous gene structures, differing mainly in exon and intron lengths. In the phylogenetic analysis, a tree comprising TPS genes from P. patens, Arabidopsis, Dendrobium officinale, and Phalaenopsis was constructed, categorizing 78 TPS members into seven groups. The analysis indicated that the ten PpTPS genes are distributed across two groups, reflecting a high level of structural and functional conservation among PpTPS genes during plant evolution (Ramya et al., 2020). Notably, the TPS-g group contained a significantly higher number of TPS members in P. patens compared to other groups, suggesting a rapid adaptive evolution of these genes. Additionally, genes within the same group generally exhibit similar gene structures and potential functions. For instance, Arabidopsis TPS genes AtTPS31 and AtTPS32 have been linked to the synthesis of sesquiterpenes (such as nerolidol) and various monoterpenes (such as peach aroma and limonene) (Ramya et al., 2020), implying that PpTPS3/4/5/6 (homologous to AtTPS31) may perform analogous functions. Furthermore, many TPS genes in Dendrobium officinale are induced by methyl jasmonate (MeJA) treatment, which enhances the volatilization of monoterpenes like camphor and linalool (Chen et al., 2023). This study found that all PpTPS genes contain MeJA-responsive elements, suggesting that their expression is upregulated under hormonal stress.
In recent years, there have been remarkable progress in synthetic genomics, particularly in the artificial design and synthesis of genomes for simpler organisms. However, applying these techniques to multicellular organisms remains a challenge due to our limited biological knowledge and technological constraints. A collaborative effort between several research teams in China has achieved a notable milestone in this field. They successfully designed and synthesized a portion of the chromosome 18 sequence of Marchantia polymorpha, a plant that marks a transition from aquatic to terrestrial life. This achievement signifies an important step forward in synthetic genomics for multicellular organisms. Marchantia polymorpha, with its simple structure, short life cycle, and strong homologous recombination capability, serves as an ideal model organism for genetic studies. Its genome, around 480 Mb in size, contains a significant amount of transposon-related elements, although their specific functions are yet to be fully understood.
The research teams, led by Dai have proposed the Marchantia polymorpha genome synthesis project (SynMoss). This project aims to redesign and synthesize the plant genome, providing novel opportunities to explore plant genome evolution and potentially paving the way for the synthesis of other plant genomes.To facilitate this ambitious project, the team developed an online genomic editing tool called “GenoDesigner”.This tool enables extensive sequence editing and redesign at the genome level. In fact, the first version of the SynMoss genome was designed using GenoDesigner, highlighting its utility and effectiveness in complex genetic engineering tasks (Kuelheim et al., 2015).
P. patens is a model moss known for its high tolerance to environmental stresses like salt and drought, making it a valuable tool for studying plant stress resistance mechanisms. It flourishes in constant light, since its growth and advancement are affected by the light cycle. This moss is extensively utilized in plant molecular biology due to its mutant library and transgenic technology, which offer significant resources for exploring plant gene functions. P. patens protoplasts are also employed in protein production and drug screening research. P. patens exhibits strong physiological adaptations, such as effective water retention and stomatal regulation, which help it cope with drought. These adaptations are closely related to its ability to regulate endogenous levels of abscisic acid (ABA) and associated signaling pathways. ABA is a key hormone involved in stress responses, including promoting stomatal closure to minimize water loss, managing salt stress, and controlling seed germination. Research on P. patens often involves investigating the effects of various ABA concentrations on its growth and stress tolerance, offering insights into how mosses manage environmental challenges(Falara et al., 2011). This study not only deepens our comprehension of how mosses adapt but also offers possible approaches to enhance stress resilience in various other plant species. (Li et al., 2012). Methyljasmonate (MeJA) plays a crucial role in stimulating the defense mechanisms of plants and modulating numerous physiological processes.It induces the production of pathogen- and insect-resistant compounds, such as secondary metabolites, and affects growth, flowering, and fruit ripening.In Marchantia polymorpha, MeJA treatment can lead to slowed growth and morphological changes, including leaf deformities and apical inhibition. It may also influence developmental stages, potentially reducing sporophyte production and altering reproductive structure development. MeJA promotes the production of secondary metabolites, including terpenoids and alkaloids, which assist the liverwort in defending against pathogens and insects. Research indicates that it enhances resilience to environmental challenges like drought and salinity, potentially influencing the activities of antioxidant enzymes, such as peroxidase (POD) and superoxide dismutase (SOD), thereby contributing to stress resistance. Additionally, treatment with MeJA may alter the concentrations of various plant hormones, including abscisic acid (ABA), auxin (IAA), and cytokinins (CKs), influencing the adaptability of Marchantia polymorpha to environmental pressures(Chuang et al., 2018; Gao et al., 2018; Li et al., 2012).
P. patens has a simplified plant structure, usually composed of a single layer of cells, making it an ideal model for studying cellular responses(Rensing et al., 2020). Its short stems and ovate or lanceolate leaves simplify the study of its physiological and metabolic processes. Due to its high frequency of homologous recombination in the nuclear genome, precise gene disruption and knockout are feasible, facilitating in-depth studies of gene functions. P. patens is the first moss to have its entire genome sequenced, a milestone that provides new perspectives on plant evolution, development, and physiological processes(Charlot et al., 2022; Reski et al., 2018). The plant has simple nutritional requirements and can be cultured in agar media, water, or even in fermentation tanks. Its robust regenerative capability allows any tissue removed from the gametophyte to continue growing, rapidly producing new primordial tissues, which simplifies experimental procedures and shortens research timelines. As a green plant, P. patens offers advantages in environmentally friendly production over chemical synthesis or microbial methods, reducing negative environmental impacts (Guyon-Debast, 2021).
Terpenoids possess antibacterial, antifungal, and insecticidal properties, aiding plants in resisting pathogens and herbivorous insects(Yang et al., 2020). Additionally, certain terpenoids (such as monoterpenes) attract pollinators, thereby promoting plant reproduction. Terpenoids are also involved in information transfer between plants and their environment, regulating plant growth and development. Terpene synthases catalyze a sequence of reactions that utilize terpene precursors, leading to the production of various types of terpenoids. They are essential in the pathways of biosynthesis and have a direct impact on terpenoid accumulation(Feng et al., 2023; Jiarui et al., 2024). Although mosses generally have lower terpenoid production capabilities compared to some higher plants, P. patens may still synthesize specific terpenoids. Transgenic technology can be employed to introduce genes associated with terpenoid synthesis into P. patens, enabling high-yield production of terpenoids. For instance, production efficiency can be improved by introducing and optimizing terpenoid synthesis genes from other plants in P. patens.
Under controlled laboratory conditions, the optimization of the growth environment of P. patens including light, temperature, and nutritional conditions, has been shown to enhance its terpenoid production capacity. The use of specific culture media and additives can further augment the yield of terpenoids. In natural settings, P. patens may produce limited amounts of terpenoids as a defensive mechanism against pests or to regulate its growth. Investigating its natural yield and functions provides critical insights into modifying and enhancing production capabilities. The application of P. patens for terpenoid production holds significant potential, particularly in green chemistry and biosynthesis, due to its simple morphology and ease of cultivation, which facilitates large-scale production.
Under drought conditions, an increase in terpenoid synthase activity can enhance the accumulation of terpenoids, thereby improving drought resistance in P. patens. For instance, drought stress may activate drought-related terpenoid synthases, promoting the synthesis of terpenoids that confer drought resistance(Agarwal et al., 2016). In a similar manner, the expression of terpenoid synthases is influenced by salt stress, resulting in the production of particular terpenoids that assist P. patens in adapting to environments with high salinity. Typically, pathogen infection induces an enhancement in terpenoid synthase activity, leading to the production of pathogen-resistant terpenoids (Ortiz-Ramírez et al., 2016). Furthermore, insect feeding can trigger the expression of terpenoid synthases, thereby increasing the production of insect-repelling terpenoids and mitigating insect damage(Xiao et al., 2018).
Under stress conditions, specific transcription factors, such as MYC2 regulate the expression of terpenoid synthase genes, thereby modulating terpenoid synthesis(Hong et al., 2012). Furthermore, plant hormones like jasmonic acid, ethylene, and abscisic acid are essential in managing stress responses by modulating the expression and function of terpenoid synthases. Moreover, terpenoid synthases can adjust their activity via post-translational modifications, including phosphorylation and acetylation, which can impact terpenoid production by altering substrate availability or interacting with other metabolic pathways (Stevenson et al., 2016). Despite the genome of P. patens containing only ten terpenoid synthase genes, the terpenoid biosynthetic pathways remain functional. Future research could explore leveraging P. patens as an efficient platform for terpenoid biosynthesis and optimizing its potential as a production chassis through genetic engineering (Guyon-Debast, 2021).
References
- Agarwal, T., Upadhyaya, G., Halder, T., Mukherjee, A., Majumder, A. L., & Ray, S. (2016). Different dehydrins perform separate functions in Physcomitrella patens. Planta.
- Byers, K. J. R. P., Bradshaw, H. D., Jr., & Riffell, J. A. (2014). Three floral volatiles contribute to differential pollinator attraction in monkeyflowers (Mimulus) [Article]. Journal of Experimental Biology, 217(4), 614-623. [CrossRef]
- Callaghan, D. A., Masson, J., & During, H. (2020). Physcomitrium x stevensoni DACallaghan (Physcomitrium patens x P. eurystomum) (Funariaceae, Bryophyta), a new name for a rarely recorded hybrid moss [Article]. Journal of Bryology, 42(2), 192-194. [CrossRef]
- Campbell, D. R., Sosenski, P., & Raguso, R. A. (2019). Phenotypic plasticity of floral volatiles in response to increasing drought stress [Article]. Annals of Botany, 123(4), 601-610. [CrossRef]
- Charlot, F., Goudounet, G., Fabien.Nogué, & Perroud, P. F. (2022). Physcomitrium patens Protoplasting and Protoplast Transfection. Methods in molecular biology (Clifton, N.J.), 2464, 3-19.
- Chen, C., Chen, H., Zhang, Y., Thomas, H. R., Frank, M. H., He, Y., & Xia, R. (2020). TBtools: An Integrative Toolkit Developed for Interactive Analyses of Big Biological Data [Article]. Molecular Plant, 13(8), 1194-1202. [CrossRef]
- Chen, F., Tholl, D., Bohlmann, J., & Pichersky, E. (2011). The family of terpene synthases in plants: a mid-size family of genes for specialized metabolism that is highly diversified throughout the kingdom [Review]. Plant Journal, 66(1), 212-229. [CrossRef]
- Chen, H.-Y., Lei, J.-Y., Li, S.-L., Guo, L.-Q., Lin, J.-F., Wu, G.-H., Lu, J., & Ye, Z.-W. (2023). Progress in biological activities and biosynthesis of edible fungi terpenoids [Review]. Critical Reviews in Food Science and Nutrition, 63(25), 7288-7310. [CrossRef]
- Christianson, D. W. (2006). Structural biology and chemistry of the terpenoid cyclases [; Research Support, N.I.H., Extramural; Review]. Chemical Reviews, 106(8), 3412-3442. [CrossRef]
- Chuang, Y.-C., Hung, Y.-C., Tsai, W.-C., Chen, W.-H., & Chen, H.-H. (2018). PbbHLH4 regulates floral monoterpene biosynthesis in Phalaenopsis orchids [Article]. Journal of Experimental Botany, 69(18), 4363-4377. [CrossRef]
- Dudareva, N., Klempien, A., Muhlemann, J. K., & Kaplan, I. (2013). Biosynthesis, function and metabolic engineering of plant volatile organic compounds [Review]. New Phytologist, 198(1), 16-32. [CrossRef]
- Falara, V., Akhtar, T. A., Nguyen, T. T. H., Spyropoulou, E. A., Bleeker, P. M., Schauvinhold, I., Matsuba, Y., Bonini, M. E., Schilmiller, A. L., Last, R. L., Schuurink, R. C., & Pichersky, E. (2011). The Tomato Terpene Synthase Gene Family [Article]. Plant Physiology, 157(2), 770-789. [CrossRef]
- Feng, K., X.-Y., K., Y.-J., Y., Wang, Y., Sun, N., Z.-Y., Y., S.-P., Z., Wu, P., & L.-J., L. (2023). Identification and characterization of terpene synthase OjTPS1 involved in β-caryophyllene biosynthesis in Oenanthe javanica (Blume) DC. Industrial Crops and Products.
- Gao, F., Liu, B., Li, M., Gao, X., Fang, Q., Liu, C., Ding, H., Wang, L., & Gao, X. (2018). Identification and characterization of terpene synthase genes accounting for volatile terpene emissions in flowers of Freesia x hybrida [Article]. Journal of Experimental Botany, 69(18), 4249-4265. [CrossRef]
- Gershenzon, J., & Dudareva, N. (2007a). The function of terpene natural products in the natural world. Nature Chemical Biology, 3(7), 408-414.
- Gershenzon, J., & Dudareva, N. (2007b). The function of terpene natural products in the natural world [; Research Support, Non-U.S. Gov't; Research Support, U.S. Gov't, Non-P.H.S.; Review]. Nature Chemical Biology, 3(7), 408-414. [CrossRef]
- Guyon-Debast, A., AlessandroTerret, ZoeCharlot, FlorenceBerthier, FlorianeVendrell-Mir, PolCasacuberta, Josep M.Veillet, FlorianMorosinotto, TomasGallois, Jean-LucNogue, Fabien. (2021). A blueprint for gene function analysis through Base Editing in the model plant Physcomitrium (Physcomitrella) patens. The New Phytologist, 230(3).
- Hong, G. J., Xue, X. Y., Mao, Y. B., Wang, L. J., & Chen, X. Y. (2012). Arabidopsis MYC2 Interacts with DELLA Proteins in Regulating Sesquiterpene Synthase Gene Expression. The Plant Cell, 24(6), 2635-2648.
- Huang, W., Gfeller, V., & Erb, M. (2019). Root volatiles in plant-plant interactions II: Root volatiles alter root chemistry and plant-herbivore interactions of neighbouring plants [Article]. Plant Cell and Environment, 42(6), 1964-1973. [CrossRef]
- Jiarui, Z., Xiao, H., Xian, Z., Xiaomeng, L., Yuwei, Y., Dongxue, S., Weiwei, Z., Yongling, L., Jiabao, Y., & Feng, X. (2024). The Ginkgo biloba microRNA160–ERF4 module participates in terpene trilactone biosynthesis. Plant Physiology(2), 2.
- Keilwagen, J., Lehnert, H., Berner, T., Budahn, H., Nothnagel, T., Ulrich, D., & Dunemann, F. (2017). The Terpene Synthase Gene Family of Carrot (Daucus carota L.): Identification of QTLs and Candidate Genes Associated with Terpenoid Volatile Compounds [Article]. Frontiers in Plant Science, 8, Article 1930. [CrossRef]
- Kuelheim, C., Padovan, A., Hefer, C., Krause, S. T., Koellner, T. G., Myburg, A. A., Degenhardt, J., & Foley, W. J. (2015). The Eucalyptus terpene synthase gene family [Article]. BMC Genomics, 16, Article 450. [CrossRef]
- Li, G., Koellner, T. G., Yin, Y., Jiang, Y., Chen, H., Xu, Y., Gershenzon, J., Pichersky, E., & Chen, F. (2012). Nonseed plant Selaginella moellendorfii has both seed plant and microbial types of terpene synthases (vol 109, pg 14711, 2012) [Correction]. Proceedings of the National Academy of Sciences of the United States of America, 109(50), 20774-20774. [CrossRef]
- Lv, M., Sun, X., Li, D., Wei, G., Liu, L., Chen, F., Cai, Y., & Fan, H. (2022). Terpenoid biosynthesis in Dendrobium officinale: Identification of (E)-β-caryophyllene synthase and the regulatory MYB genes. Industrial Crops and Products, 182, 114875-.
- Manyi-Loh, C. E., Clarke, A. M., & Ndip, R. N. (2011). Identification of volatile compounds in solvent extracts of honeys produced in South Africa [Article]. African Journal of Agricultural Research, 6(18), 4327-4334. ://WOS:000298502900017. ://WOS.
- Martin, D. M., Aubourg, S., Schouwey, M. B., Daviet, L., Schalk, M., Toub, O., Lund, S. T., & Bohlmann, J. (2010). Functional Annotation, Genome Organization and Phylogeny of the Grapevine (Vitis vinifera) Terpene Synthase Gene Family Based on Genome Assembly, FLcDNA Cloning, and Enzyme Assays [Article]. BMC plant biology, 10, Article 226. [CrossRef]
- Nakajima, M., Miyazaki, S., & Kawaide, H. (2020). Hormonal Diterpenoids Distinct to Gibberellins Regulate Protonema Differentiation in the Moss Physcomitrium patens [Review]. Plant and Cell Physiology, 61(11), 1861-1868. [CrossRef]
- Ortiz-Ramírez, C., Hernandez-Coronado, M., Thamm, A., Catarino, B., Wang, M., Dolan, L., & A.Feijó, J. (2016). A Transcriptome Atlas of Physcomitrella patens Provides Insights into the Evolution and Development of Land Plants. 分子植物:英文版(2), 16.
- Pierroz, G. (2023). 2D or not 2D: how mRNA methylation regulates the transition to 3-dimensional growth in Physcomitrium patens [Editorial Material]. Plant Journal, 114(1), 5-6. [CrossRef]
- Ramya, M., Jang, S., An, H.-R., Lee, S.-Y., Park, P.-M., & Park, P. H. (2020). Volatile Organic Compounds from Orchids: From Synthesis and Function to Gene Regulation [Review]. International Journal of Molecular Sciences, 21(3), Article 1160. [CrossRef]
- Rensing, S. A., Goffinet, B., Meyberg, R., Wu, S. Z., & Bezanilla, M. (2020). The Moss Physcomitrium (Physcomitrella) patens: A Model Organism for Non-Seed Plants. The Plant Cell, 32(5), tpc.00828.02019.
- Reski, Ralf, Bae, Hansol, Simonsen, Henrik, & Toft. (2018). Physcomitrella patens, a versatile synthetic biology chassis. Plant Cell Reports.
- Stevenson, S. R., Kamisugi, Y., Trinh, C. H., Schmutz, J., Jenkins, J. W., Grimwood, J., Muchero, W., Tuskan, G. A., Rensing, S. A., & Lang, D. (2016). Genetic analysis of Physcomitrella patens identifies ABSCISIC ACID NON-RESPONSIVE, a regulator of ABA responses unique to basal land plants and required for desiccation tolerance. American Society of Plant Biologists(6).
- Vranova, E., Coman, D., & Gruissem, W. (2013). Network Analysis of the MVA and MEP Pathways for Isoprenoid Synthesis. In S. S. Merchant (Ed.), Annual Review of Plant Biology, Vol 64 (Vol. 64, pp. 665-700). [CrossRef]
- Xiao, L., Yobi, A., Koster, K. L., He, Y., & Oliver, M. J. (2018). Desiccation tolerance in Physcomitrella patens: Rate of dehydration and the involvement of endogenous abscisic acid (ABA). Plant, Cell & Environment, 41(1).
- Yang, W., Chen, X., Li, Y., Guo, S., & Yu, X. (2020). Advances in Pharmacological Activities of Terpenoids. Natural product communications, 15(3), 1934578X2090355.
- Yu, Z., Zhao, C., Zhang, G., Silva, J. A. T. D., & Duan, J. (2020). Genome-Wide Identification and Expression Profile of TPS Gene Family in Dendrobium officinale and the Role of DoTPS10 in Linalool Biosynthesis. International Journal of Molecular Sciences, 21(15), 5419.
- Zhou, H.-C., Shamala, L. F., Yi, X.-K., Yan, Z., & Wei, S. (2020). Analysis of Terpene Synthase Family Genes in Camellia sinensis with an Emphasis on Abiotic Stress Conditions [Article]. Scientific Reports, 10(1), Article 933. [CrossRef]
- Zi, J., Mafu, S., & Peters, R. J. (2014). To Gibberellins and Beyond! Surveying the Evolution of (Di)Terpenoid Metabolism. In S. S. Merchant (Ed.), Annual Review of Plant Biology, Vol 65 (Vol. 65, pp. 259-286). [CrossRef]
|
Disclaimer/Publisher’s Note: The statements, opinions and data contained in all publications are solely those of the individual author(s) and contributor(s) and not of MDPI and/or the editor(s). MDPI and/or the editor(s) disclaim responsibility for any injury to people or property resulting from any ideas, methods, instructions or products referred to in the content. |
© 2024 by the authors. Licensee MDPI, Basel, Switzerland. This article is an open access article distributed under the terms and conditions of the Creative Commons Attribution (CC BY) license (http://creativecommons.org/licenses/by/4.0/).
