
Submitted:
26 September 2024
Posted:
26 September 2024
You are already at the latest version
Abstract
Background/Objectives: Thyroid cancer, particularly well-differentiated thyroid cancer, is one of the most prevalent endocrine malignancies, with a rising incidence. Although it generally has a favorable prognosis, recurrence is common. Accurate prediction of recurrence is crucial for optimizing treatment plans and improving patient outcomes. This study aimed to advance the state-of-the-art in thyroid cancer recurrence prediction by refining feature engineering techniques and exploring a diverse ensemble of machine learning algorithms and an artificial neural network, using the differentiated thyroid cancer dataset from the UCI Machine Learning Repository; Methods: Various unsupervised data engineering methods, such as dimensionality reduction and clustering, were employed to enhance feature quality and mitigate noise, using stratified 10-fold cross-validation. The best-performing dimensionality reduction techniques were used to build classification model pipelines employing each of several machine learning models and an artificial neural network. The performance of these classification pipelines were assessed using metrics sensitive to class imbalance; Results: Principal Component Analysis and Truncated Singular Value Decomposition achieved superior clustering performance and moderate variances in their first principal components. Logistic Regression, Random Forest, Support Vector Machine, K-Nearest Neighbors, and Feedforward Neural Network models all achieved high performance, with Logistic Regression pipelines demonstrating balanced accuracy, F1 score, AUC, sensitivity, specificity, and precision—all greater than 0.93 on the test set and slightly lower in 10-fold cross-validation. Gradient Boosting classification pipelines performed the lowest, though still with respectable metrics; Conclusions: This study shows that employing feature engineering techniques like Principal Component Analysis or Truncated Singular Value Decomposition in Logistic Regression, Random Forest, Feedforward Neural Networks, Support Vector Machine, and K-Nearest Neighbors classification pipelines can improve thyroid cancer recurrence prediction accuracy and reliability, supporting more personalized treatment strategies in post-treatment patients.
Keywords:
Well-differentiated thyroid cancer
; Recurrence prediction
; Unsupervised Data Engineering Methods
; Dimensionality Reduction Techniques
; Machine learning
; Clustering
; Principal Component Analysis
; Truncated Singular Value Decomposition
; Logistic Regression
1. Introduction
Thyroid cancer, particularly well-differentiated thyroid cancer (WDTC), is one of the most common endocrine malignancies, with an increasing incidence over recent decades [1,2]. Although WDTC generally has a favorable prognosis with appropriate treatment, a subset of patients’ experience recurrence, which complicates management and adversely affects long-term outcomes [3]. Current estimates suggest that 5-30% of WDTC patients may face recurrence, which can significantly impact quality of life and survival rates [4,5]. Accurate prediction of recurrence is therefore essential to optimize treatment plans and improve patient outcomes. Historically, prognosis in thyroid cancer has been guided by conventional clinicopathologic factors, including tumor size, extrathyroidal extension, lymph node involvement, and distant metastasis (T/N/M stages) [6,7,8]. While these factors are useful, they often fail to capture the complexity of individual patient risk profiles, leading to less personalized and sometimes suboptimal management strategies [9]. Recent advancements in machine learning (ML) and data science offer promising avenues to enhance prediction models by incorporating a broader range of features and leveraging sophisticated analytical techniques [10].
In their landmark study, Borzooei et al. (2024) [11] conducted an in-depth exploration of the potential of various machine learning (ML) algorithms for predicting cancer recurrence using the Differentiated Thyroid Cancer Recurrence Dataset. Their research primarily focused on assessing the predictive performance of a suite of traditional ML models, including Support Vector Machine, k-Nearest Neighbors, Decision Tree, and Random Forest, in addition to an Artificial Neural Network. The study provided valuable insights into the strengths and limitations of these algorithms in the context of thyroid cancer recurrence prediction.
However, while Borzooei et al.'s work made significant contributions to the field, it was constrained by the use of only 13 clinicopathologic features available in the dataset. These features, while relevant, may not fully encapsulate the complex and multifactorial nature of differentiated thyroid cancer recurrence. Important sociodemographic variables, as well as other clinical nuances, were not included in their analysis, potentially limiting the models' ability to capture subtle patterns that could influence patient outcomes. Moreover, their study did not fully address the challenges posed by imbalanced data—a common issue in medical datasets where the number of recurrence cases is often much smaller than non-recurrence cases. This imbalance can lead to biased models that favor the majority class, thus reducing the reliability of predictions for the minority class [12], which in this case is the recurrence of thyroid cancer. Without appropriate techniques to handle such imbalances, the performance metrics reported by Borzooei et al. may overestimate the models' effectiveness in real-world applications.
This study seeks to advance the state-of-the-art in predicting differentiated thyroid cancer recurrence by refining feature engineering techniques and exploring a diverse ensemble of machine learning algorithms. We will leverage all 16 sociodemographic and clinicopathologic variables, employing unsupervised data engineering methods, including dimensionality reduction techniques (Principal Component Analysis, Truncated Singular Value Decomposition, Uniform Manifold Approximation and Projection, etc.) and clustering, to enhance feature quality and mitigate noise. Model performance will be evaluated using a comprehensive set of metrics sensitive to imbalanced datasets, with stratified 10-fold cross-validation employed to ensure robust generalization [13]. By systematically comparing these methods, we aim to identify the optimal combinations of feature engineering and predictive modeling techniques, ultimately improving predictive accuracy and contributing to more personalized and effective treatment strategies for thyroid cancer patients.
2. Materials and Methods
2.1. Dataset
The differentiated thyroid cancer dataset was obtained from the UCI Machine Learning Repository [14]. It comprises 383 instances, each characterized by 16 sociodemographic and clinicopathologic features, including Age, Gender, Smoking Status, History of Smoking, History of Radiotherapy, Thyroid Function, Physical Examination, Adenopathy, Pathology, Focality, Risk, Tumor Stage (T), Node Stage (N), Metastasis Stage (M), Overall Stage, and Treatment Response. The target variable (Recurred) indicates whether or not the cancer has recurred post-treatment. The dataset contains no missing values across any features. However, there is a class imbalance in the target variable, with 108 instances of recurrence and 275 instances of non-recurrence. Table 1 provides a detailed description of each feature in the dataset.
2.2. Feature Engineering
Dimensionality reduction is a well-established technique for mitigating the curse of dimensionality by projecting high-dimensional data onto a lower-dimensional space, thus simplifies models, making them easier to interpret and understand. Therefore, prior to predictive model building, we applied various dimensionality reduction techniques, both linear methods—such as Principal Component Analysis (PCA), Truncated Singular Value Decomposition (tSVD), Fast Independent Component Analysis (f-ICA), and Non-Negative Matrix Factorization (NMF)—as well as manifold learning techniques—such as T-distributed Stochastic Neighbor Embedding (t-SNE), Isometric Mapping (Isomap), Uniform Manifold Approximation and Projection (UMAP), and Locally Linear Embedding (LLE). PCA linearly projects data onto axes capturing maximum variance [15,16], while tSVD, similar but often for sparse data, factorizes the data matrix. ICA extracts independent components from multivariate signals [17], with f-ICA accelerating computations. NMF seeks non-negative factors, aiding interpretable feature extraction [18]. t-SNE non-linearly maps data preserving similarities [19], while Isomap focuses on global geometric structure through geodesic distances [20]. UMAP preserves both local and global structure by optimizing a low-dimensional graph representation [21]. LLE maintains local linear relationships by constructing a weighted graph and embedding data accordingly [22]. Initially, the dataset was partitioned into a training set (75%) for hyperparameter tuning and model development, and a holdout test set (25%) for unbiased evaluation. Categorical features were one-hot encoded, while numerical features were scaled using Min-Max normalization, resulting in a preprocessed dataset referred to as “BaseData.” This BaseData served as the starting point of the various dimensionality reduction techniques. All data engineering steps were applied independently to the training and test sets, ensuring consistency in preprocessing parameters. This rigorous approach ensures that model evaluation on the holdout test set is unbiased and reflective of real-world performance.
2.3. Dimensionality Reduction Technique Evaluation and Selection for Classification Models Building.
To select the optimal dimensionality reduction technique for predictive model building, we evaluated the quality of clusters in the engineered datasets using three clustering metrics: adjusted Rand Index (ARI), V-Measure, and Silhouette Coefficient using 10-fold CV. ARI assesses the agreement between the clustering results and ground truth labels (U), adjusted for chance, with scores ranging from -1 (complete disagreement) to 1 (perfect agreement) [23,24]. V-Measure balances homogeneity (where each cluster contains only members of a single class) and completeness (where all members of a class are assigned to the same cluster), with scores ranging from 0 to 1 (perfect homogeneity and completeness) [25]. Unlike the other two metrics, the Silhouette coefficient evaluates intrinsic cluster quality without relying on ground truth, measuring how similar data points are to their own cluster compared to others, with scores ranging from -1 to 1 (higher values indicate better-defined clusters) [26]. K-means clustering was applied to each dataset to generate predicted clusters (V), enabling the calculation of ARI and V-Measure. Cluster centroids and the variance in the first principal components (PC1) of each engineered features were also analyzed to aid in selecting the optimal dimensionality reduction technique to use in the classification models. The engineered features with the best performance across these metrics were chosen for predictive modeling. The mathematical formulations of these metrics are provided below.
where is the Rand Index, calculated as the proportion of pairs of points that are either in the same cluster in both the ground truth (U) and the predicted clustering (V), or in different clusters in both and is the expected value of the Rand Index for random clustering.
where:
with being the conditional entropy of the classes given the clusters, and being the entropy of the classes, and
with being the conditional entropy of the clusters given the classes, and being the entropy of the clusters.
where is the average distance between and all other points in the same cluster and is the average distance between and all points in the nearest neighboring cluster. The overall Silhouette Score is the mean of for all data points
2.4. Classification Models, Hyperparameter Tuning and Evaluation
We employed six classification models, namely Logistic Regression (LR), Gradient Boosting (GB), Support Vector Machine (SVM), Random Forest (RF), K-Nearest Neighbors (KNN), and a Feedforward Neural Network (FNN) using a pipeline with each of the best performing dimensionality reduction techniques explored. These models were chosen for their diverse approaches to classification, which range from linear methods to ensemble learning and neural networks, providing a comprehensive comparison of different algorithms for the task at hand. LR, valued for its interpretability by linking model coefficients to log-odds [27], struggles with non-linear data. GB, an ensemble method that builds models sequentially to correct errors, excels in handling complex patterns, particularly in imbalanced datasets [28,29]. SVM constructs hyperplanes in high-dimensional spaces, offering robustness against overfitting and adaptability through kernel functions [30]. RF, another ensemble technique, creates multiple decision trees to reduce overfitting while effectively managing high-dimensional data [31]. KNN, though straightforward in classifying samples based on the majority class of nearest neighbors, can be computationally intensive and sensitive to the choice of k [32]. Lastly, FNN, capable of modeling complex non-linear relationships through layered neurons, are well-suited for diverse tasks but demand careful hyperparameter tuning and significant computational resources [33].
To optimize the performance of each model, we conducted an exhaustive search over the hyperparameters. Initially, a wide range of hyperparameters was explored to identify the best combination that maximizes model performance. Subsequently, fine-tuning was performed by narrowing the search to specific intervals around the initially identified best parameters. Grid search was implemented with 10-fold cross-validation (CV) to ensure that the results were robust and generalizable [34]. Cross-validation is a critical step to avoid overfitting and to ensure that the model performs well on unseen data [35].
Model performance was first evaluated on a holdout test set, reserved from the original dataset, ensuring that the models were tested on data they had not seen during training. Given the imbalanced nature of the dataset, where certain classes were underrepresented, we utilized a comprehensive set of evaluation metrics sensitive to class imbalance. These included balanced accuracy, area under the receiver operating characteristic curve (AUC), sensitivity, specificity, precision, and F1 score Balanced accuracy was particularly emphasized as it accounts for imbalances by averaging the recall obtained on each class [36,37]. Additionally, AUC was used to assess the trade-off between true positive and false positive rates across different threshold settings [38,39]. Sensitivity (recall) and specificity provided insights into the model's ability to correctly identify positive and negative cases, respectively [40,41,42], while precision and F1-score were used to evaluate the relevance of the positive predictions [41]. Additionally, the Detection Error Tradeoff (DET) curve, which is a plot that shows the trade-off between false positive rate (FPR) and false negative rate (FNR) for a binary classifier was employed to further evaluate the models’ performance.
These metrics are defined by the following formulas, where the symbols and notations have their usual meaning.
To further ensure the robustness and generalizability of our models, stratified 10-fold cross-validation was employed on the entire dataset. Stratification was particularly important in this context to maintain the distribution of classes across all folds, ensuring that each fold was representative of the overall class distribution. This method provided a more reliable estimate of model performance, especially in scenarios with imbalanced data, and helped identify models that generalize well beyond the specific dataset used [36,37]. Figure 1 illustrates the workflow of the feature engineering techniques and classification modeling methodologies employed in the study.
2.5. Software and Computational Tools
The codebase was implemented entirely in Python 3.8.10 [43]. The dimensionality reduction technique, clustering, modeling, and evaluation were implemented using scikit-learn version 1.2.2 [44], SciPy version 1.7.3 [45], NumPy version 1.21.2 [46], and UMAP version 0.5.1 [21]. Data manipulations and visualization were performed with Pandas version 1.3.3 [47], Matplotlib version 3.4.3 [48], and Seaborn version 0.11.2 [49].
3. Results and Discussion
In this study, we employed a variety of unsupervised machine learning techniques, including dimensionality reduction methods such as PCA, tICA, tSVD, NMF, UMAP, t-SNE, Isomap, LLE, and K-means clustering, to engineer features for classification models designed to predict thyroid cancer recurrence in patients’ post-treatment. The dataset used was the differentiated thyroid cancer dataset from the UCI Machine Learning Repository [14]. We selected a diverse set of models including LR, GB, SVM, RF, KNN, and FNN due to their different learning paradigms. We have emphasized that stratification was employed to ensure that the distribution of recurrence and non-recurrence examples remains uniform across all 10 folds during the 10-fold cross-validation (CV) trials. The performance metrics we reported are the mean values calculated across the folds in the loop, which, while computationally demanding, minimizes data wastage [50]. Additionally, evaluating multiple cross-validated performance metrics is recognized as a best practice, as it offers a more comprehensive and unbiased assessment of model performance, mitigating the risk of relying on a single metric that may be skewed by a particular subset of the data. This method reduces the likelihood of overfitting [42]. To further ensure the robustness of our findings, the model's performance was also assessed on an independent test set that had not been previously exposed to the models, providing a more accurate measure of predictive strength.
3.1. Feature Engineering Using Dimensionality Reduction
To identify the optimal dimensionality reduction technique for building the classification models, we established a selection criterion based on the Adjusted Rand Index (ARI) and V-measure scores, with an arbitrary cut-off of both metrics above 0.4. This threshold ensured that the clusters observed after applying each dimensionality reduction technique were reflective of actual patterns in the dataset rather than artifacts introduced by the techniques themselves. K-means clustering, set to two clusters, was employed to identify cluster centroids and label data points accordingly.
Table 2 provides the scores for each method across the clustering metrics utilized. Among the methods evaluated, PCA and tSVD exhibited the highest performance across all clustering metrics, both achieving ARI scores of 0.557 and 0.558, respectively, and V-measure scores of 0.451 and 0.459. Notably, tSVD's silhouette coefficient of 0.537 was slightly higher than PCA's 0.489, underscoring its potential for capturing meaningful clusters. Techniques such as t-SNE and Isomap followed, with ARI, V-measure, and silhouette coefficients ranging between 0.258 – 0.292, 0.277 – 0.292, and 0.334 – 0.362, respectively. These methods demonstrated moderate clustering performance, albeit with higher variance in the first principal component (PC1) (see Table 2). The poor performance of tICA and NMF, with ARI and V-measure scores below 0.2 and silhouette coefficients below 0.36, indicated that these techniques were less effective at capturing the intrinsic structure of the dataset.
Interestingly, UMAP and LLE, despite their negative ARI scores and low V-measure values, achieved the highest silhouette scores, exceeding 0.6. This suggests that embedding methods such as UMAP and LLE may better preserve the intrinsic properties of the data when compared to linear techniques like PCA and tSVD. However, their negative ARI scores indicate that the clusters identified by these methods diverged significantly from the ground truth labels.
Furthermore, the variance of PC1 across the various methods (Table 2) revealed that PCA and tSVD, which clustered data points most closely with respect to the ground truth, exhibited low to moderate variance. In contrast, methods like t-SNE and Isomap showed significantly higher variance, which could reflect their ability to capture more complex, non-linear patterns in the data. As depicted in Figure 2 and Figure 3, the clustering distinctiveness and the spread of PC1 across these methods provide further insight into their respective capabilities. Based on these findings, PCA and tSVD were selected as the optimal dimensionality reduction techniques for the classification pipelines. The superior clustering performance of these methods, combined with their moderate PC1 variance, suggests they strike a balance between capturing meaningful data patterns and maintaining the interpretability of the resulting features.
The methods marked with asterisks (*) are the one adopted in the predictive model development pipeline. The choice is based on the performance of the clustering metrics, PC1 variance and how distinct the clusters are (see Figure 2). PCA=Principal Component Analysis, tSVD=Truncated Singular Value Decomposition, fICA=Fast Independent Component Analysis, NNM=Non-Negative Matrix Factorization, t-SNE=T-distributed Stochastic Neighbor Embedding, Isomap=Isometric Mapping, UMAP=Uniform Manifold Approximation and Projection, LLE=Locally Linear Embedding (LLE), PC1=first principal components.
3.2. Distributions of the Engineered Features
The distribution of the first principal component (PC1) derived from various dimensionality reduction techniques, as illustrated in Figure 3, Panel A, exhibits a distinct bimodal pattern. This bimodality is significant as it suggests the presence of two latent subpopulations within the dataset. The characteristics of these distributions—such as their height, sharpness (kurtosis), and width—provide insights into the underlying data structure and the effectiveness of each dimensionality reduction method.
Techniques like PCA (curve ‘a’) and tSVD (curve ‘c’), which clustered data points most closely with respect to the ground truth, display moderate to sharp peaks in their bimodal distributions, indicating that the variance captured by these methods is concentrated around two distinct clusters with minimal overlap. The sharpness of these peaks suggests that these methods decompose features that are highly informative, leading to a clear separation between the two underlying groups. This clear separation is crucial in a binary classification context, as it enhances the discriminative power of the classifier by providing a strong signal corresponding to each class. The concentrated variance around the two modes reinforces the idea that PCA and tSVD effectively capture the intrinsic structure of the data, making them suitable for feature engineering in this context.
In contrast, techniques like t-SNE (curve ‘f’) and Isomap (curve ‘g’) produce broader, lower peaks. This broader distribution implies a more gradual separation between the two clusters, with a higher degree of overlap. The lower height of the peaks suggests that these methods capture a more diffuse variance, possibly reflecting non-linear relationships in the data that are less sharply defined. While capturing these complex patterns can be valuable, it may also indicate that these methods are less effective in creating a clear-cut separation between the classes. This could introduce ambiguity in the classification task, potentially leading to reduced model performance.
The heatmap in Figure 3, Panel B complements this distribution analysis by visually representing how the standardized PC1 values vary across the dataset. Techniques like PCA, tSVD, and NMF exhibit abrupt transitions between high and low PC1 values, consistent with the sharp peaks observed in the density plots. This abruptness reflects the strong underlying structure captured by these techniques, clearly distinguishing the two subpopulations. On the other hand, methods such as Isomap and LLE show more gradual transitions in the heatmap, with a smoother gradient of PC1 values. This corresponds to the broader peaks in the density plots and suggests a more nuanced capture of the data's structure, potentially blending the two subpopulations together more than the other techniques.
These varying characteristics of the PC1 distributions and heatmap patterns across different dimensionality reduction techniques underscore the importance of technique selection in the feature engineering process. Techniques that produce sharp, well-separated bimodal distributions, such as PCA and tSVD, are likely to yield features that are more effective for binary classification tasks due to their ability to create a clearer distinction between classes. Conversely, methods that produce broader distributions, like Isomap and LLE, may capture more complex, non-linear relationships but could introduce more ambiguity in class separation, potentially impacting model performance.
While the observed bimodality in the distributions is encouraging, it is essential to recognize potential limitations. The robustness of these findings requires further investigation, particularly in elucidating the underlying biological mechanisms driving the observed heterogeneity. Future research should explore additional clustering algorithms and incorporate external data sources to validate and refine the identified subgroups. A deeper understanding of these subpopulations could lead to the development of more precise predictive models, ultimately improving patient outcomes.
3.3. Hyperparameter Optimization for Classification Model Pipelines
Following the identification of PCA and tSVD as the optimal dimensionality reduction techniques, classification pipelines were constructed using each technique for data preprocessing. For both PCA and tSVD, only the first three principal components were selected as input features for the classification models. Before model development, an exhaustive grid search with 10-fold cross-validation (CV) was performed to optimize the hyperparameters of each classification model. Initially, broader ranges for each hyperparameter were explored to ensure comprehensive coverage. Subsequently, fine-tuning was carried out with more granular adjustments around the most promising hyperparameter values. Table 3 presents the optimal hyperparameters that resulted in the best performance on both the test set and during 10-fold CV.
3.4. Classification Model Pipeline Evaluation
The evaluation of classification models using PCA and tSVD dimensionality reduction techniques provides nuanced insights into their performance in predicting thyroid cancer recurrence. The findings suggest that both approaches enhance model performance, though with distinct implications for clinical applications. We observed notable variations across different models and metrics, offering insights into the effectiveness of each model and dimensionality reduction approach. Table 4 presents the performance of the classification model pipelines across six metrics employed in the study, highlighting results from both the test set and 10-fold cross-validation (CV), while Figure 4 displays the ROC and DET curves for each classification model pipeline on the test set.
3.4.1. Performance of PCA-Model Pipelines
The PCA-based model pipelines demonstrated strong performance across several metrics. Logistic Regression (LR) achieved the highest balanced accuracy of 0.952 on the test set and maintained robust performance in 10-fold CV with a balanced accuracy of 0.850. Its impressive F1 score of 0.935 on the test set and 0.849 in 10-fold CV, combined with an AUC of 0.992 and 0.967 on the test set and 10-fold CV, respectively, underscores LR's consistent ability to correctly classify true positives while minimizing false positives. As shown in Figure 4A, the LR model's ROC curve on the test set closely follows the top left corner, highlighting its strong predictive capability in distinguishing between recurrence and non-recurrence of thyroid cancer, a crucial characteristic for clinical settings. The sensitivity of LR was also high at 0.935 on the test set and 0.859 in 10-fold CV, further supporting its efficacy in identifying true positive cases of thyroid cancer recurrence.
SVM, RF, and KNN models also performed admirably. SVM achieved a balanced accuracy and AUC of 0.929 and 0.992 on the test set and 0.873 and 0.960 in 10-fold CV, respectively, demonstrating its effectiveness in distinguishing between positive and negative cases. RF achieved a balanced accuracy of 0.906 on the test set and 0.882 in 10-fold CV, with a high AUC of 0.977 and 0.966, indicating its strong ability to distinguish between positive and negative outcomes. KNN, while showing slightly higher precision at 0.900 on the test set and 0.881 in 10-fold CV, exhibited lower sensitivity (0.871 on the test set and 0.788 in 10-fold CV) compared to LR and RF, suggesting it may miss some positive cases, which could impact its overall classification performance. Their ROC curves (see Figure 4A) suggest strong predictive capability, particularly RF's consistent ability to maintain high sensitivity across the specificity range. However, KNN’s slightly lower sensitivity aligns with the earlier observation of potentially missing some positive cases, thereby affecting its overall classification performance.
Among the models, FNN demonstrated robust performance with a balanced accuracy of 0.938 on the test set and 0.903 in 10-fold CV. The F1 score of 0.896 on the test set and 0.897 in 10-fold CV reflects its balanced ability to classify both positive and negative cases effectively. Its AUC of 0.971 on the test set and 0.961 in 10-fold CV further confirms its strong discriminatory power, though there is a slight drop in sensitivity from 0.968 on the test set to 0.862 in 10-fold CV, suggesting its performance may vary when exposed to different data subsets.
Figure 4C complements the ROC analysis with DET (Detection Error Tradeoff) curves, offering additional insights into model performance, particularly regarding the trade-off between false positive rates (FPR) and false negative rates (FNR). In general, all models demonstrate similar error trade-offs, as evidenced by the proximity of their curves to one another. However, a closer inspection shows that the DET curve for LR, which remains closest to the origin, consistently achieves a lower FNR at comparable FPR levels, particularly in the low FPR region (<10%). This further confirms its robustness, making it a reliable choice for binary classification tasks in clinical applications where minimizing false negatives is critical. SVM, RF, and KNN also display strong performance, though RF's slightly higher FNR highlights the need for potential adjustments to improve sensitivity.
GB, however, showed the lowest performance among the models in the PCA pipeline, with a balanced accuracy of 0.849 on the test set. Despite this, it tends to perform better when tested on various subsets of the dataset, as evidenced by its 10-fold CV results. The GB model’s ROC curve indicates a more gradual increase in sensitivity relative to specificity, reflecting its challenges in fully capturing the complex relationships within the data. The DET curve further reveals that GB has a higher false negative rate compared to the other models, which is a critical consideration in clinical settings where missing positive cases can lead to suboptimal outcomes. Despite these limitations, GB still provides valuable insights, especially in cases where more interpretability or the combination of weak learners might be necessary.
3.4.2. Performance of tSVD-Model Pipelines
The tSVD-based pipelines provided comparable performance, often outperforming their PCA counterparts. LR again demonstrated superior performance with a balanced accuracy of 0.944 on the test set and 0.854 in cross-validation. Its F1 score of 0.933 on the test set and 0.859 in cross-validation, along with a high AUC of 0.994 on the test set and 0.965 in 10-fold CV, underscores LR's effectiveness in accurately predicting thyroid cancer recurrence while maintaining a high level of robustness. As shown in Figure 4B, the LR model's ROC curve on the test set closely follows the top left corner, highlighting its exceptional ability to distinguish between recurrence and non-recurrence—an essential feature for clinical applications. The sensitivity of LR, at 0.903 on the test set and 0.874 in cross-validation, indicates its high efficacy in identifying true positive cases, reinforcing its suitability for clinical use.
RF, using tSVD-engineered features, achieved the second-best performance with a balanced accuracy of 0.937 on the test set and 0.889 in 10-fold CV, along with an impressive AUC of 0.986 and 0.965, respectively. These results suggest that RF is highly effective at classifying cases and distinguishing between positive and negative outcomes. SVM also performed impressively, with balanced accuracies of 0.928 and 0.846 on the test set and 10-fold CV, respectively. However, with the specificity (0.853) slightly less than the sensitivity (0.963) on the test set, and an even more significant difference between specificity and sensitivity in 10-fold CV, the imbalanced nature of the dataset with positive examples as the minority class may explain these results. KNN also performed well with a balanced accuracy of 0.908 on the test set and 0.872 in 10-fold CV. Its AUC of 0.987 on the test set and 0.960 in 10-fold CV shows strong classification capabilities, though its sensitivity was somewhat lower at 0.853 on the test set and 0.788 in 10-fold CV compared to other models. Figure 4D reveals that both RF and KNN classification pipelines maintain low FNR across a range of FPR values, suggesting that the tSVD-based features enhance these models' ability to handle complex, high-dimensional data effectively.
FNN’s performance with tSVD was particularly noteworthy, achieving a balanced accuracy of 0.912 on the test set and 0.859 in 10-fold CV. The F1 score of 0.903 on the test set and 0.870 in 10-fold CV, along with the remarkable AUC of 0.989 and 0.963, highlights its strong classification accuracy, particularly in predicting positive cases accurately. However, the lower sensitivity of 0.824 on the test set and 0.872 in 10-fold CV indicates a potential area for improvement, especially in capturing all true positive cases. Another impressive aspect of FNN’s performance using the tSVD pipeline is its perfect precision score (1.00) and specificity (1.00) on the training set, with just a slight decline in 10-fold CV. The ROC and DET curves suggest that FNN is highly capable of distinguishing between classes, with performance nearly equivalent to that of LR.
GB again displayed the lowest performance among the models in the tSVD pipeline, with a balanced accuracy of 0.896 on the test set and 0.884 in 10-fold CV. While this is an improvement over its PCA counterpart, the GB model's ROC curve remains less steep (0.978), indicating that it continues to struggle with sensitivity and specificity compared to the other models. The DET curve similarly highlights the model's higher false negative rate, suggesting that GB might be less suited for tasks where minimizing false negatives is crucial. Nonetheless, the GB model’s performance, while lower, might still be valuable in scenarios where its strengths, such as handling complex interactions in the data, could be leveraged with additional tuning.
This comparative analysis of PCA and tSVD-based pipelines shows that while both dimensionality reduction techniques enhance model performance, tSVD often provides a slight edge in classification accuracy, particularly for models like RF, SVM, and FNN. The DET curves further support these findings, showing that tSVD-based pipelines generally result in lower false negative rates and, consequently, fewer missed cases of thyroid cancer recurrence. This highlights the importance of selecting the appropriate dimensionality reduction technique based on the specific clinical context and the desired trade-offs between sensitivity, specificity, and overall classification accuracy. In both PCA and tSVD classification pipelines, we observe strong performance from LR, RF, SVM, and FNN models, with GB being the least effective but still providing valuable insights in certain contexts. These results suggest that both dimensionality reduction techniques can enhance the prediction of thyroid cancer recurrence, with the choice between PCA and tSVD depending on the specific clinical context and desired trade-offs between sensitivity, specificity, and overall classification accuracy.
3.5. Comparison with Other Methods
Compared with existing studies on predicting the likelihood of differentiated thyroid cancer (DTC) recurrence or metastasis in post-treatment patients, including those by Borzooei et al. (2024) [11], Qiao et al. (2024) [51], and Wang et al. (2024) [52], our study demonstrates several notable strengths and innovations that enhance the accuracy and robustness of predictions.
3.5.1. Advanced Dimensionality Reduction Techniques
Our study employs a comprehensive range of dimensionality reduction techniques to address the curse of dimensionality. We utilized both linear methods such as PCA and tSVD, as well as manifold learning techniques like t-SNE and UMAP. This approach allowed us to reduce the dataset to a manageable number of features—three in this case—that retained the highest variance. The application of these methods aligns with recent advancements in data preprocessing for high-dimensional datasets [21].
3.5.2. Rigorous Feature Engineering and Clustering Validation
To refine our feature engineering techniques, we implemented k-means clustering on the generated feature sets. We evaluated the clustering results using ARI and V-measure, and assessed the intrinsic properties of each cluster using the silhouette coefficient score. Stratified 10-fold CV was used to ensure the robustness and reliability of these metrics. This meticulous approach to feature selection and clustering validation reflects best practices in ensuring high-quality feature sets and aligns with methodologies reported by Ester et al. (1996) [53] on clustering evaluation and Hennig (2007) [54] on cluster validation techniques.
3.5.3. Diverse Machine Learning Models and Comprehensive Evaluation Metrics
Our study leverages a wide array of machine learning (ML) and neural network models, each with distinct learning behaviors, to capture various aspects of the data. We applied diverse classification metrics, including AUC, Balanced Accuracy, Sensitivity, Specificity, Precision, and DET curves. These metrics are particularly valuable for addressing class imbalance and assessing model performance comprehensively. The use of stratified 10-fold CV and testing with an external dataset further ensures that our metrics are generalizable and reflect the true performance of the models on unseen data. This approach is in line with the evaluation practices emphasized by He and Garcia (2009) [37] for dealing with imbalanced datasets and by Sokolova and Lapalme (2009) [55] for evaluating classifier performance.
3.5.4. Comparative Performance Analysis
Table 5 presents a comparison of our approach with previous studies in terms of selected performance metrics. While studies like Borzooei et al. (2024) [11] demonstrated high sensitivity and specificity using traditional feature sets and models, our study's application of advanced dimensionality reduction and comprehensive feature engineering techniques resulted in comparable performance metrics. For example, our SVM model achieved an AUC of 99.2% and sensitivity of 96.1%, which is consistent with the high performance reported by Borzooei et al [11]. for SVM but with enhanced feature engineering. Similarly, our RF model's AUC and sensitivity align with the results from Qiao et al. (2024) [51], demonstrating the robustness of Random Forest across various datasets and feature sets.
3.6. Implications and Future Directions
The results of this study highlight several important implications for the application of dimensionality reduction and classification techniques in predicting thyroid cancer recurrence. Both PCA and tSVD proved to be effective dimensionality reduction techniques, facilitating the development of robust classification models. The superior performance of PCA and tSVD in terms of clustering metrics and PC1 variance suggests their capability to retain significant data structures, which is crucial for accurate classification.
Among the models evaluated, LR consistently delivered the best performance across both PCA and tSVD pipelines, indicating its robustness and reliability in binary classification tasks related to cancer recurrence prediction. The high precision and balanced accuracy achieved by LR suggest that it is well-suited for clinical applications where accurate prediction and differentiation between recurrence and non-recurrence are critical. RF and KNN also demonstrated strong performance, particularly with tSVD-engineered features, which could be attributed to their ability to handle complex, high-dimensional data effectively. However, the lower sensitivity in KNN compared to other models suggests that while it excels in precision, it may require further optimization to enhance its ability to identify all positive cases. FNN’s performance, particularly with tSVD, shows promise in terms of AUC and precision, though there is room for improvement in sensitivity. The ability of FNN to achieve high precision and AUC indicates its potential utility in scenarios where distinguishing between classes is critical, but adjustments may be needed to improve its sensitivity.
These findings underscore the importance of selecting appropriate dimensionality reduction and classification techniques to optimize predictive performance. The choice of dimensionality reduction method and model can significantly impact the accuracy and reliability of predictions, with practical implications for improving patient management and treatment strategies in differentiated thyroid cancer. Future work should continue to refine these models and explore additional techniques to further enhance predictive accuracy and clinical applicability. Selecting the appropriate dimensionality reduction method and model based on the trade-offs between accuracy, sensitivity, and generalizability is crucial.
4. Conclusions
This study demonstrates that feature engineering techniques, such as PCA and tSVD, can significantly enhance the performance of classification models in predicting differentiated thyroid cancer recurrence in post-treatment patients. Classification pipelines incorporating PCA or tSVD, particularly when paired with models like LR, RF, FNN, SVM, and KNN, showed highly promising results. Among these, LR-based pipelines exhibited the best performance in predicting cancer recurrence. This approach has the potential to support more effective and personalized treatment strategies, improving patient outcomes by accurately predicting the likelihood of recurrence and enabling timely interventions. The source codes are freely available for download from the GitHub link provided here (https://github.com/OnahPmi/Thyroid-Cancer-Recurrence-Prediction-Project).
Supplementary Materials
The following supporting information can be downloaded at the website of this paper posted on Preprints.org, Dataset S1: PCA generated data; Dataset S2: t-SVD generated data; Dataset S3: f-ICA generated data; Dataset S4: NMF generated data; Dataset S5: t-SNE generated data; Dataset S6: Isomap generated data; Dataset S7: UMAP generated data; Dataset S8: LLE generated data.
Author Contributions
Conceptualization, E.O. and U.J.E.; methodology, E.O., A.S.A. and U.J.E.; validation, E.O, and U.J.E.; formal analysis, E.O. and U.J.E.; investigation, E.O..; resources E.O.; data curation, E.O., U.J.E. and U.G.E.; writing—original draft preparation, E.O. A.S.A. and K.C.A.; writing—review and editing, K.C.A..; visualization, E.O., U.J.E. and U.G.E.; supervision, E.O; project administration, E.O. All authors have read and agreed to the published version of the manuscript.
Funding
This research received no external funding.
Institutional Review Board Statement
Not applicable.
Informed Consent Statement
Not applicable.
Data Availability Statement
Publicly available dataset was analyzed in this study. This data can be found here: https://archive.ics.uci.edu/dataset/915/differentiated+thyroid+cancer+recurrence. All other data generated during this investigation are included in the supplementary information of this article.
Acknowledgments
The authors would like to express their gratitude to Shiva Borzooei and Aidin Tarokhian from Hamadan University of Medical Sciences, Iran, for making the differentiated thyroid cancer dataset publicly available.
Conflicts of Interest
The authors declare no conflicts of interest.
References
- Miranda-Filho, A.; Lortet-Tieulent, J.; Bray, F.; Cao, B.; Franceschi, S.; Vaccarella, S.; Dal Maso, L. Thyroid cancer incidence trends by histology in 25 countries: a population-based study. Lancet Diabetes Endocrinol. 2021, 9, 225–234. [CrossRef] [PubMed]
- Xi, N.; M., Wang, L.; Yang, C. Author Correction: Improving the diagnosis of thyroid cancer by machine learning and clinical data. Sci Rep. 2022, 12, 13252. [CrossRef] [PubMed]
- Jayarangaiah, A.; Sidhu, G.; Brown, J.; Campbell, O. B.; McFarlane, S. I. Therapeutic options for advanced thyroid cancer, IJCEM 2019, 5, 26–34. [CrossRef]
- Medas, F.; Canu, G. L.; Boi, F.; Lai, M. L.; Erdas, E.; Calò, P. G. Predictive Factors of Recurrence in Patients with Differentiated Thyroid Carcinoma: A Retrospective Analysis on 579 Patients. Cancers 2019, 11, 1230. [CrossRef] [PubMed]
- Guo, K.; Wang, Z. Risk factors influencing the recurrence of papillary thyroid carcinoma: a systematic review and meta-analysis. Int J Clin Exp Pathol. 2014, 7, 5393–5403. [PubMed]
- Hakim Tawil, J. A.; Rojas, M. F.; Santivañez, J. J.; León, L.; González Devia, D. Prognostic factors for recurrence in patients with papillary thyroid carcinoma. Ear Nose Throat J. 2023, 1455613231158792. [CrossRef]
- Alkilany, S.; Mahfouz, E.; Mohammed, E.; Ghazawy, E.; Abdelgwad, Y.; Mohamadien, N.; Soliman, M.; Abdelrehim, M. Recurrence Risk in Thyroid Cancer Patients after Thyroidectomy. Minia Journal of Medical Research, 2024, 35, 1–10. [CrossRef]
- Kim, M.; Cho, S. W.; Park, Y. J.; Ahn, H. Y.; Kim, H. S.; Suh, Y. J.; Choi, D.; Kim, B. K.; Yang, G. E.; Park, I. S.; Yi, K. H.; Jung, C. K.; Kim, B. H. Clinicopathological Characteristics and Recurrence-Free Survival of Rare Variants of Papillary Thyroid Carcinomas in Korea: A Retrospective Study. Endocrinology and metabolism 2021, 36, 619–627. [CrossRef]
- Haddad, R. I.; Bischoff, L.; Ball, D.; Bernet, V.; Blomain, E.; Busaidy, N. L.; Campbell, M.; Dickson, P.; Duh, Q. Y., Ehya, H.; Goldner, W. S.; Guo, T.; Haymart, M.; Holt, S.; Hunt, J. P.; Iagaru, A.; Kandeel, F.; Lamonica, D. M.; Mandel, S.; Markovina, S.; … Darlow, S. Thyroid Carcinoma, Version 2.2022, NCCN Clinical Practice Guidelines in Oncology. JNCCN, 2022, 20, 925–951. [CrossRef]
- Sarker, I. H. Machine learning: Algorithms, real-world applications, and research directions. SN Comput Sci, 2021, 2, 1–21. [CrossRef]
- Borzooei, S.; Briganti, G.; Golparian, M.; Lechien, J. R.; Tarokhian, A. Machine learning for risk stratification of thyroid cancer patients: a 15-year cohort study. Eur Arch Otorhinolaryngol. 2024, 281, 2095–2104. [CrossRef]
- Santos, M. S.; Soares, J. P.; Abreu, P. H.; Araújo, H.; Santos, J. Cross-validation for imbalanced datasets: Avoiding overoptimistic and overfitting approaches [Research frontier]. IEEE CIM, 2018, 13, 59–76. [CrossRef]
- Kohavi, R. A Study of Cross-Validation and Bootstrap for Accuracy Estimation and Model Selection. IJCAI 1995, 14, 1137–1145.
- Borzooei, Shiva; Tarokhian, Aidin. Differentiated Thyroid Cancer Recurrence. UCI Machine Learning Repository 2023. [CrossRef]
- Abdi, H.; Williams, L. J. Principal Component Analysis. Wiley Interdisciplinary Reviews: Computational Statistics 2010, 2, 433–459. [CrossRef]
- Jolliffe, I.T. Principal Component Analysis, 2nd ed.; Springer Series in Statistics: New York, 2002; pp. 338–339.
- Hyvärinen, A.; Oja, E. Independent Component Analysis: Algorithms and Applications. Neural Netw. 2000, 13, 411–430. [CrossRef]
- Lee, D. D.; Seung, H. S. Learning the parts of objects by non-negative matrix factorization. Nature 1999, 401, 788–791. [CrossRef]
- van der Maaten, L. J. P.; Hinton, G. E. Visualizing high-dimensional data using t-SNE. Journal of Machine Learning Research 2008, 9, 2579–2605.
- Tenenbaum, J. B.; de Silva, V.; Langford, J. C. A global geometric framework for nonlinear dimensionality reduction. Science 2000, 290, 2319–2323. [CrossRef]
- McInnes, L., Healy, J.; Melville, J. UMAP: Uniform Manifold Approximation and Projection for Dimension Reduction. Journal of Open Source Software 2018, 3, 861. https://arxiv.org/abs/1802.03426. [CrossRef]
- Roweis, S. T.; Saul, L. K. Nonlinear dimensionality reduction by locally linear embedding. Science 2000, 290, 2323–2326. [CrossRef]
- Hubert, L.; Arabie, P. Comparing partitions. Journal of Classification, 1985, 2, 193–218. [CrossRef]
- Rand, W. M. Objective Criteria for the Evaluation of Clustering Methods. JASA 1971, 66, 846–850. [CrossRef]
- Rosenberg, Andrew; Hirschberg, Julia; Eisner, Jason (Bearb.). V-Measure: A Conditional Entropy-Based External Cluster Evaluation Measure. In: EMNLP-CoNLL: ACL, 2007, S. 410–420. https://aclanthology.org/D07-1043.
- Rousseeuw, P. J. Silhouettes: A graphical aid to the interpretation and validation of cluster analysis. Journal of Computational and Applied Mathematics 1987, 20, 53–65. [CrossRef]
- Hosmer Jr., D.W.; Lemeshow, S.; Sturdivant, R.X. Applied Logistic Regression. 3rd ed.; John Wiley & Sons, Hoboken, NJ. 2013.
- Friedman, J. H. Greedy function approximation: A gradient boosting machine. Ann. Statist. 2001, 29, 1189-1232. [CrossRef]
- Chen, T.; Guestrin, C. XGBoost: A scalable tree boosting system. In Proceedings of the 22nd ACM SIGKDD international conference on knowledge discovery and data mining 2016, 785–794.
- Cortes, C.; Vapnik, V. Support-vector networks. Machine Learning 1995, 20, 273-297. [CrossRef]
- Breiman, L. Random forests. Machine Learning, 2001, 45, 5–32. [CrossRef]
- Altman, N. S. An introduction to kernel and nearest-neighbor nonparametric regression. The American Statistician 1992, 46, 175–185. [CrossRef]
- Goodfellow, I.; Bengio, Y.; Courville, A. Deep Learning. MIT Press. 2016.
- Bergstra, J.; Bengio, Y. Random Search for Hyper-Parameter Optimization. JMLR 2012, 13, 281–305.
- Wong, T. T. Performance Evaluation of Classification Algorithms by K-fold and Leave-One-Out Cross Validation. Pattern Recognition 2015, 48, 2839–2846. [CrossRef]
- Brodersen, K. H.; Ong, C. S.; Stephan, K. E.; Buhmann, J. M. The balanced accuracy and its posterior distribution. In 2010 20th International Conference on Pattern Recognition 2010, IEEE. 3121–3124.
- He, H.; Garcia, E. A. Learning from Imbalanced Data. IEEE Transactions on Knowledge and Data Engineering 2009, 21, 1263–1284.
- Fawcett, T. An Introduction to ROC Analysis. Pattern Recognition Letters, 2006, 27, 861–874. [CrossRef]
- Bradley, A. P. The use of the area under the ROC curve in the evaluation of machine learning algorithms. Pattern Recognition 1997, 30, 1145–1159. [CrossRef]
- Forman, G. An Extensive Empirical Study of Feature Selection Metrics for Text Classification. JMLR 2003, 3, 1289–1305.
- Powers, D. M. Evaluation: From Precision, Recall and F-Measure to ROC, Informedness, Markedness and Correlation. J Mach Learn Technol. 2011, 2, 37–63.
- Onah, E.; Uzor, P. F.; Ugwoke, I. C.; Eze, J. U.; Ugwuanyi, S. T.; Chukwudi, I. R.; Ibezim, A. Prediction of HIV-1 protease cleavage site from octapeptide sequence information using selected classifiers and hybrid descriptors. BMC bioinformatics 2022, 23, 466. [CrossRef]
- Python Software Foundation. Python Language Reference (Version 3.8.10). 2023. https://www.python.org/.
- Pedregosa, F.; Varoquaux, G.; Gramfort, A.; Michel, V.; Thirion, B.; Grisel, O.; Blondel, M.; Prettenhofer, P.; Weiss, R.; Dubourg, V.; Vanderplas, J.; Passos, A.; Cournapeau, D.; Brunet, M.; Duchesnay, E.; LeCun, Y.; Buitinck, L. Scikit-learn: Machine learning in Python. JMLR, 2011, 12, 2825–2830. https://scikit-learn.org/stable/about.html.
- Virtanen, P.; Gommers, R.; Oliphant, T. E.; Haberland, M.; Reddy, T.; Cournapeau, D.; Burovski, E.; Peterson, P.; Weckesser, W.; Brionne, J.; van der Walt, S. J.; Brett, M.; Wilson, J.; Jarrod Millman, K.; Mayorov, N.; Raw, A.; van der Meulen, M.; Certík, O.; ... Oliphant, A. SciPy 1.0: Fundamental Algorithms for Scientific Computing in Python. Nature Methods 2020, 17, 261–272. [CrossRef]
- Harris, C. R.; Millman, K. J.; van der Walt, S. J.; Gommers, R.; Virtanen, P.; Cournapeau, D.; Wieser, E.; Johansson, K.; Schulz, A.; Gribski, S.; Oliphant, T. E.; Petersen, W. K. Array programming with NumPy. Nature, 2020585, 357–362. [CrossRef]
- McKinney, W. Data Structures for Statistical Computing in Python. Proceedings of the 9th Python in Science Conference, Austin, 28 June – 3 July 2010, 56–61.
- Hunter, J. D. Matplotlib: A 2D graphics environment. Computing in Science & Engineering 2007, 9, 90–95. [CrossRef]
- Waskom, M. L. Seaborn: Statistical data visualization. JOSS 2021, 6, 3021. [CrossRef]
- Berrar, D. Cross-validation. Encyclopedia of Bioinformatics and Computational Biology, 2019, 1, 542–545.
- Qiao, L.; Li, H.; Wang, Z.; Sun, H.; Feng, G.; Yin, D. Machine learning based on SEER database to predict distant metastasis of thyroid cancer. Endocrine, 2024, 84, 1040–1050. [CrossRef]
- Wang, H.; Zhang, C.; Li, Q.; Tian, T.; Huang, R.; Qiu, J.; Tian, R. Development and validation of prediction models for papillary thyroid cancer structural recurrence using machine learning approaches. BMC cancer 2024, 24, 427. [CrossRef] [PubMed]
- Ester, M.; Kriegel, H.-P.; Sander, J.; Xu, X. A Density-Based Algorithm for Discovering Clusters in Large Spatial Databases with Noise. KDD, 1996, 226–231.
- Hennig, C. Cluster-Wise Assessments of Cluster Stability. CSDA 2007, 52, 258–271. [CrossRef]
- Sokolova, M.; Lapalme, G. A systematic analysis of performance measures for classification tasks. Information Processing & Management 2009, 45, 427–437. [CrossRef]
Figure 1.
Workflow of feature engineering techniques and classification modeling methodologies employed in the study. PCA=Principal Component Analysis, tSVD=Truncated Singular Value Decomposition, fICA=Fast Independent Component Analysis, NNM=Non-Negative Matrix Factorization, t-SNE=T-distributed Stochastic Neighbor Embedding, Isomap=Isometric Mapping, UMAP=Uniform Manifold Approximation and Projection, LLE=Locally Linear Embedding (LLE), ARI=Adjusted Rand Index, LR=Logistic Regression, GB=Gradient Boosting, SVM=Support Vector Machine, RF=Random Forest, KNN=K-Nearest Neighbors, FNN=Feedforward Neural Network, AUC= area under the receiver operating characteristic (ROC) curve.
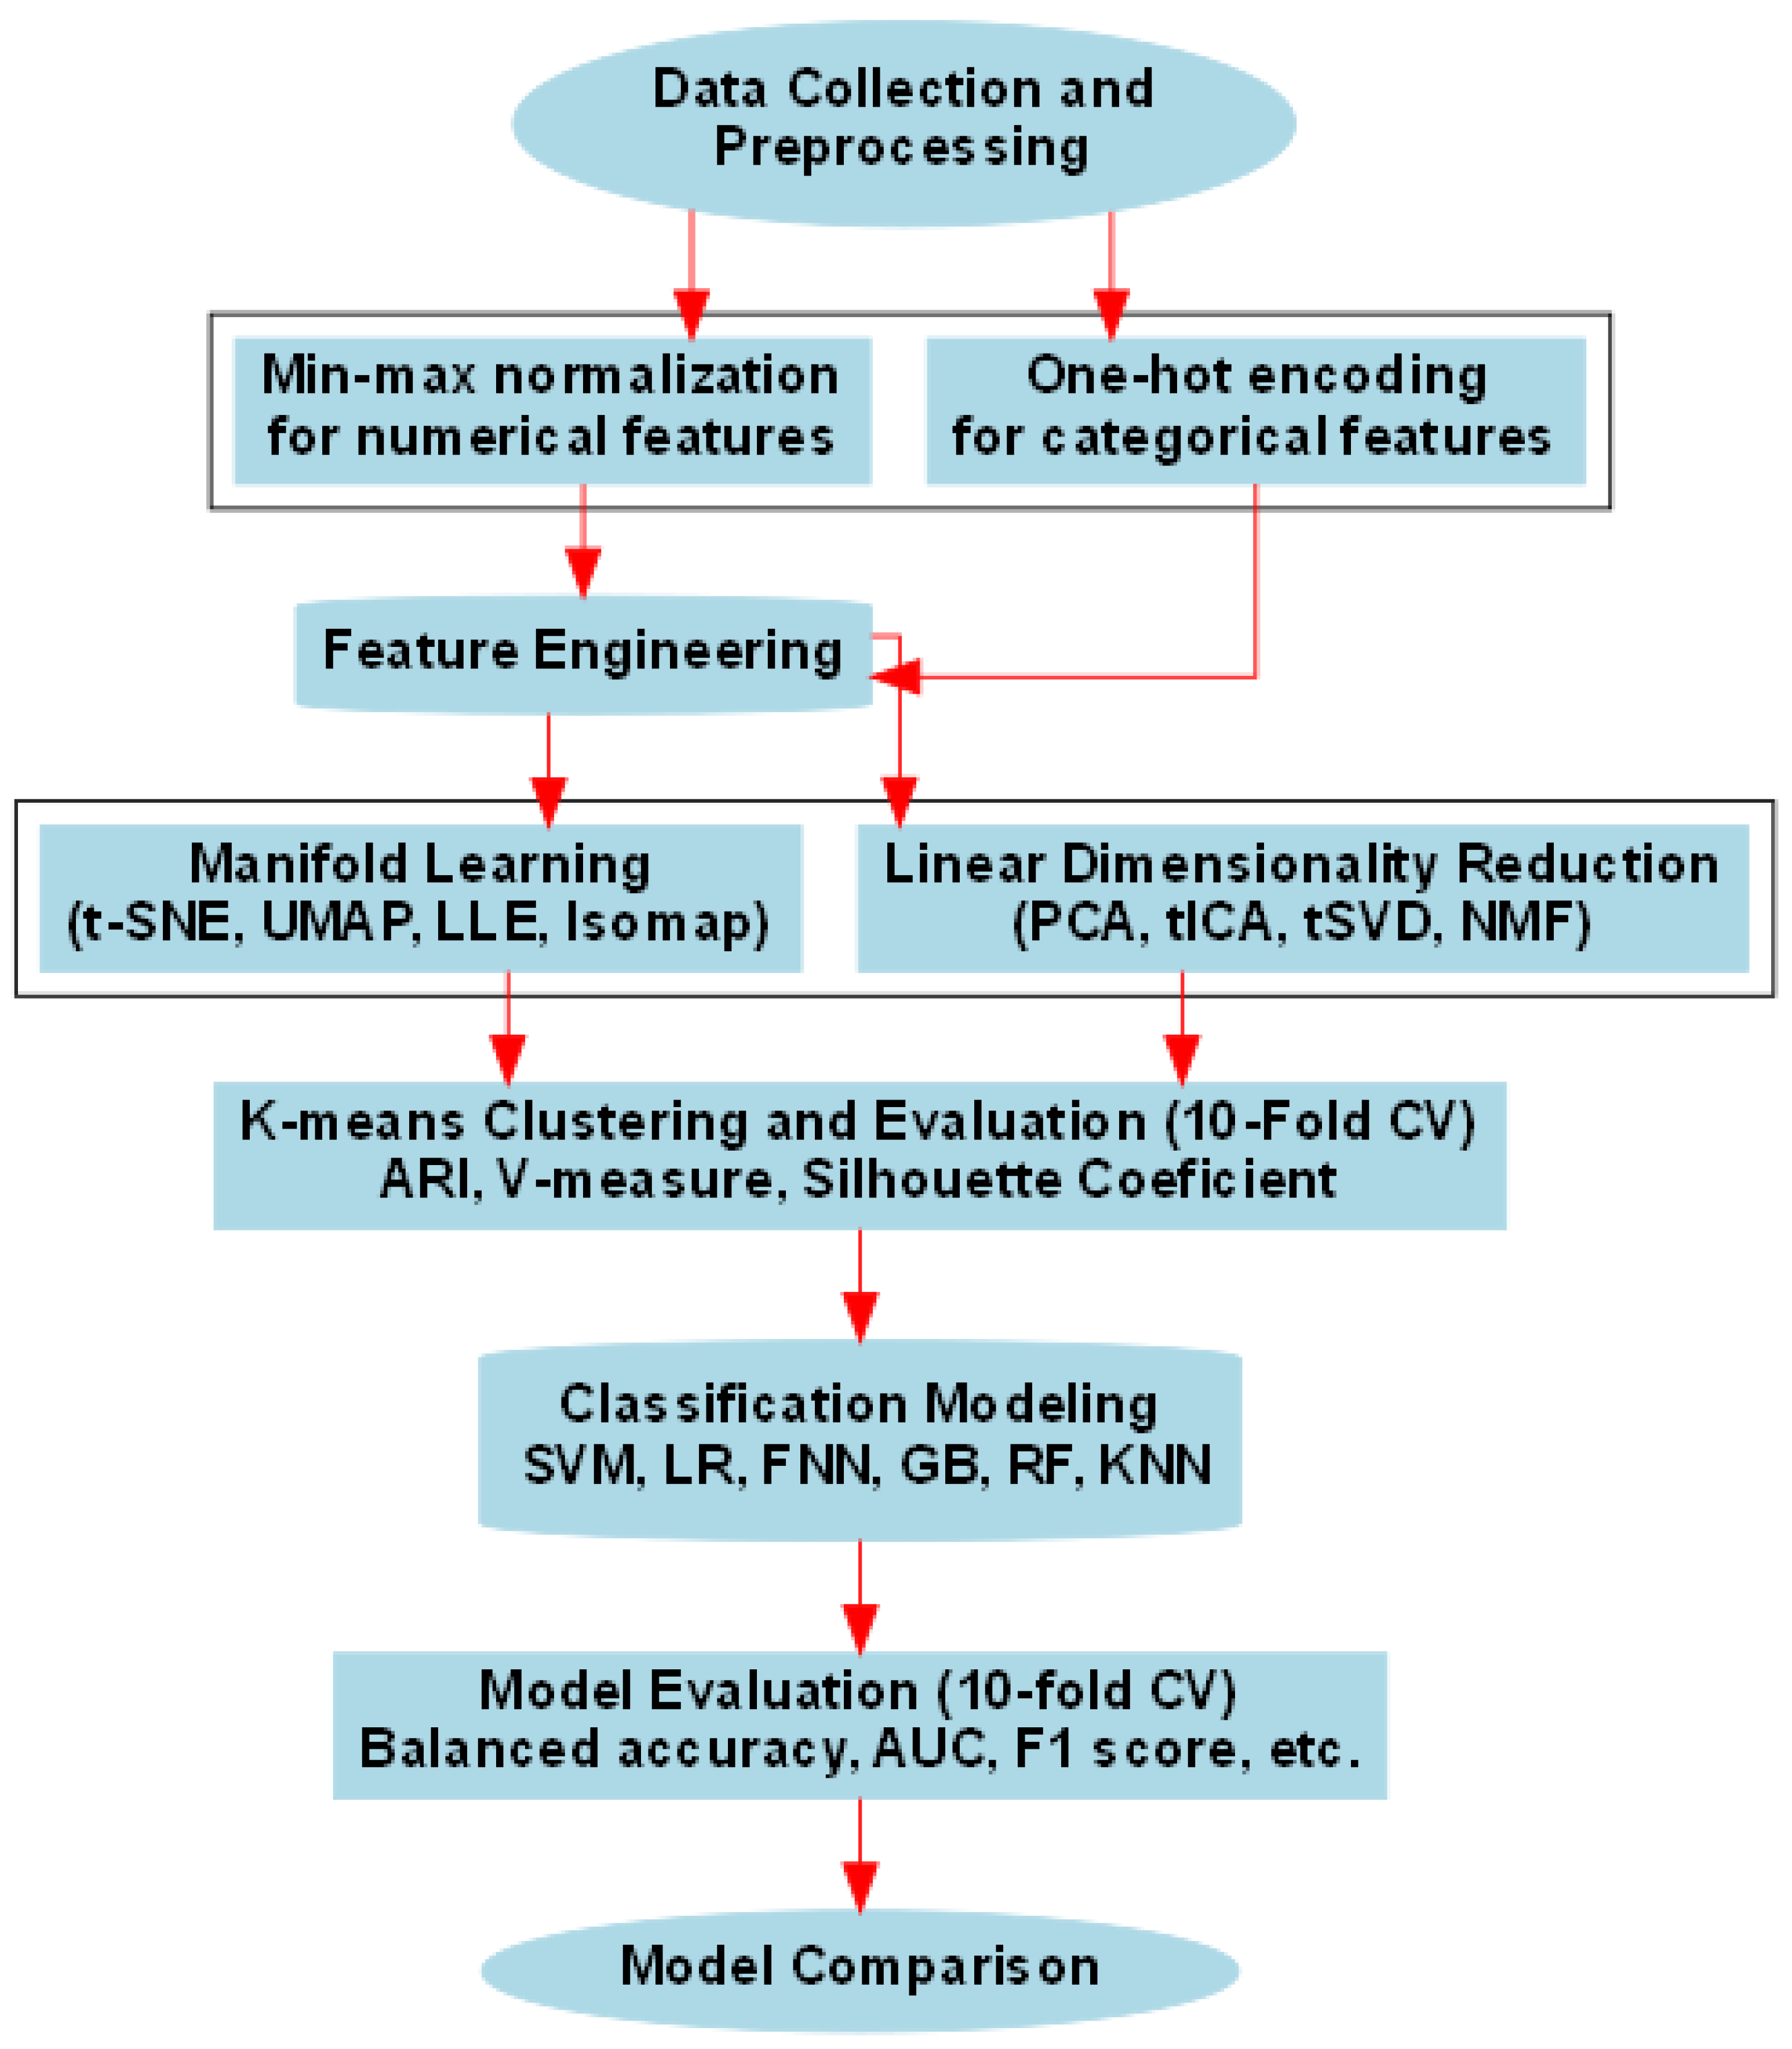
Figure 2.
Scatter plots illustrating the dataset clusters from each dimensionality reduction technique. [a] PCA-Decomposed data, [b] tICA-Decomposed data, [c] tSVD-Decomposed data, [d] NMF-Decomposed data [e] UMAP-Decomposed data [f] t-NSE-Decomposed data [g] Isomap-Decomposed data [h] LLE-Decomposed data. The red “+” indicate K-means predicted cluster centers. The data points coloring is in accordance with the grand truth (class labels in the dataset) not the K-means predicted classes.
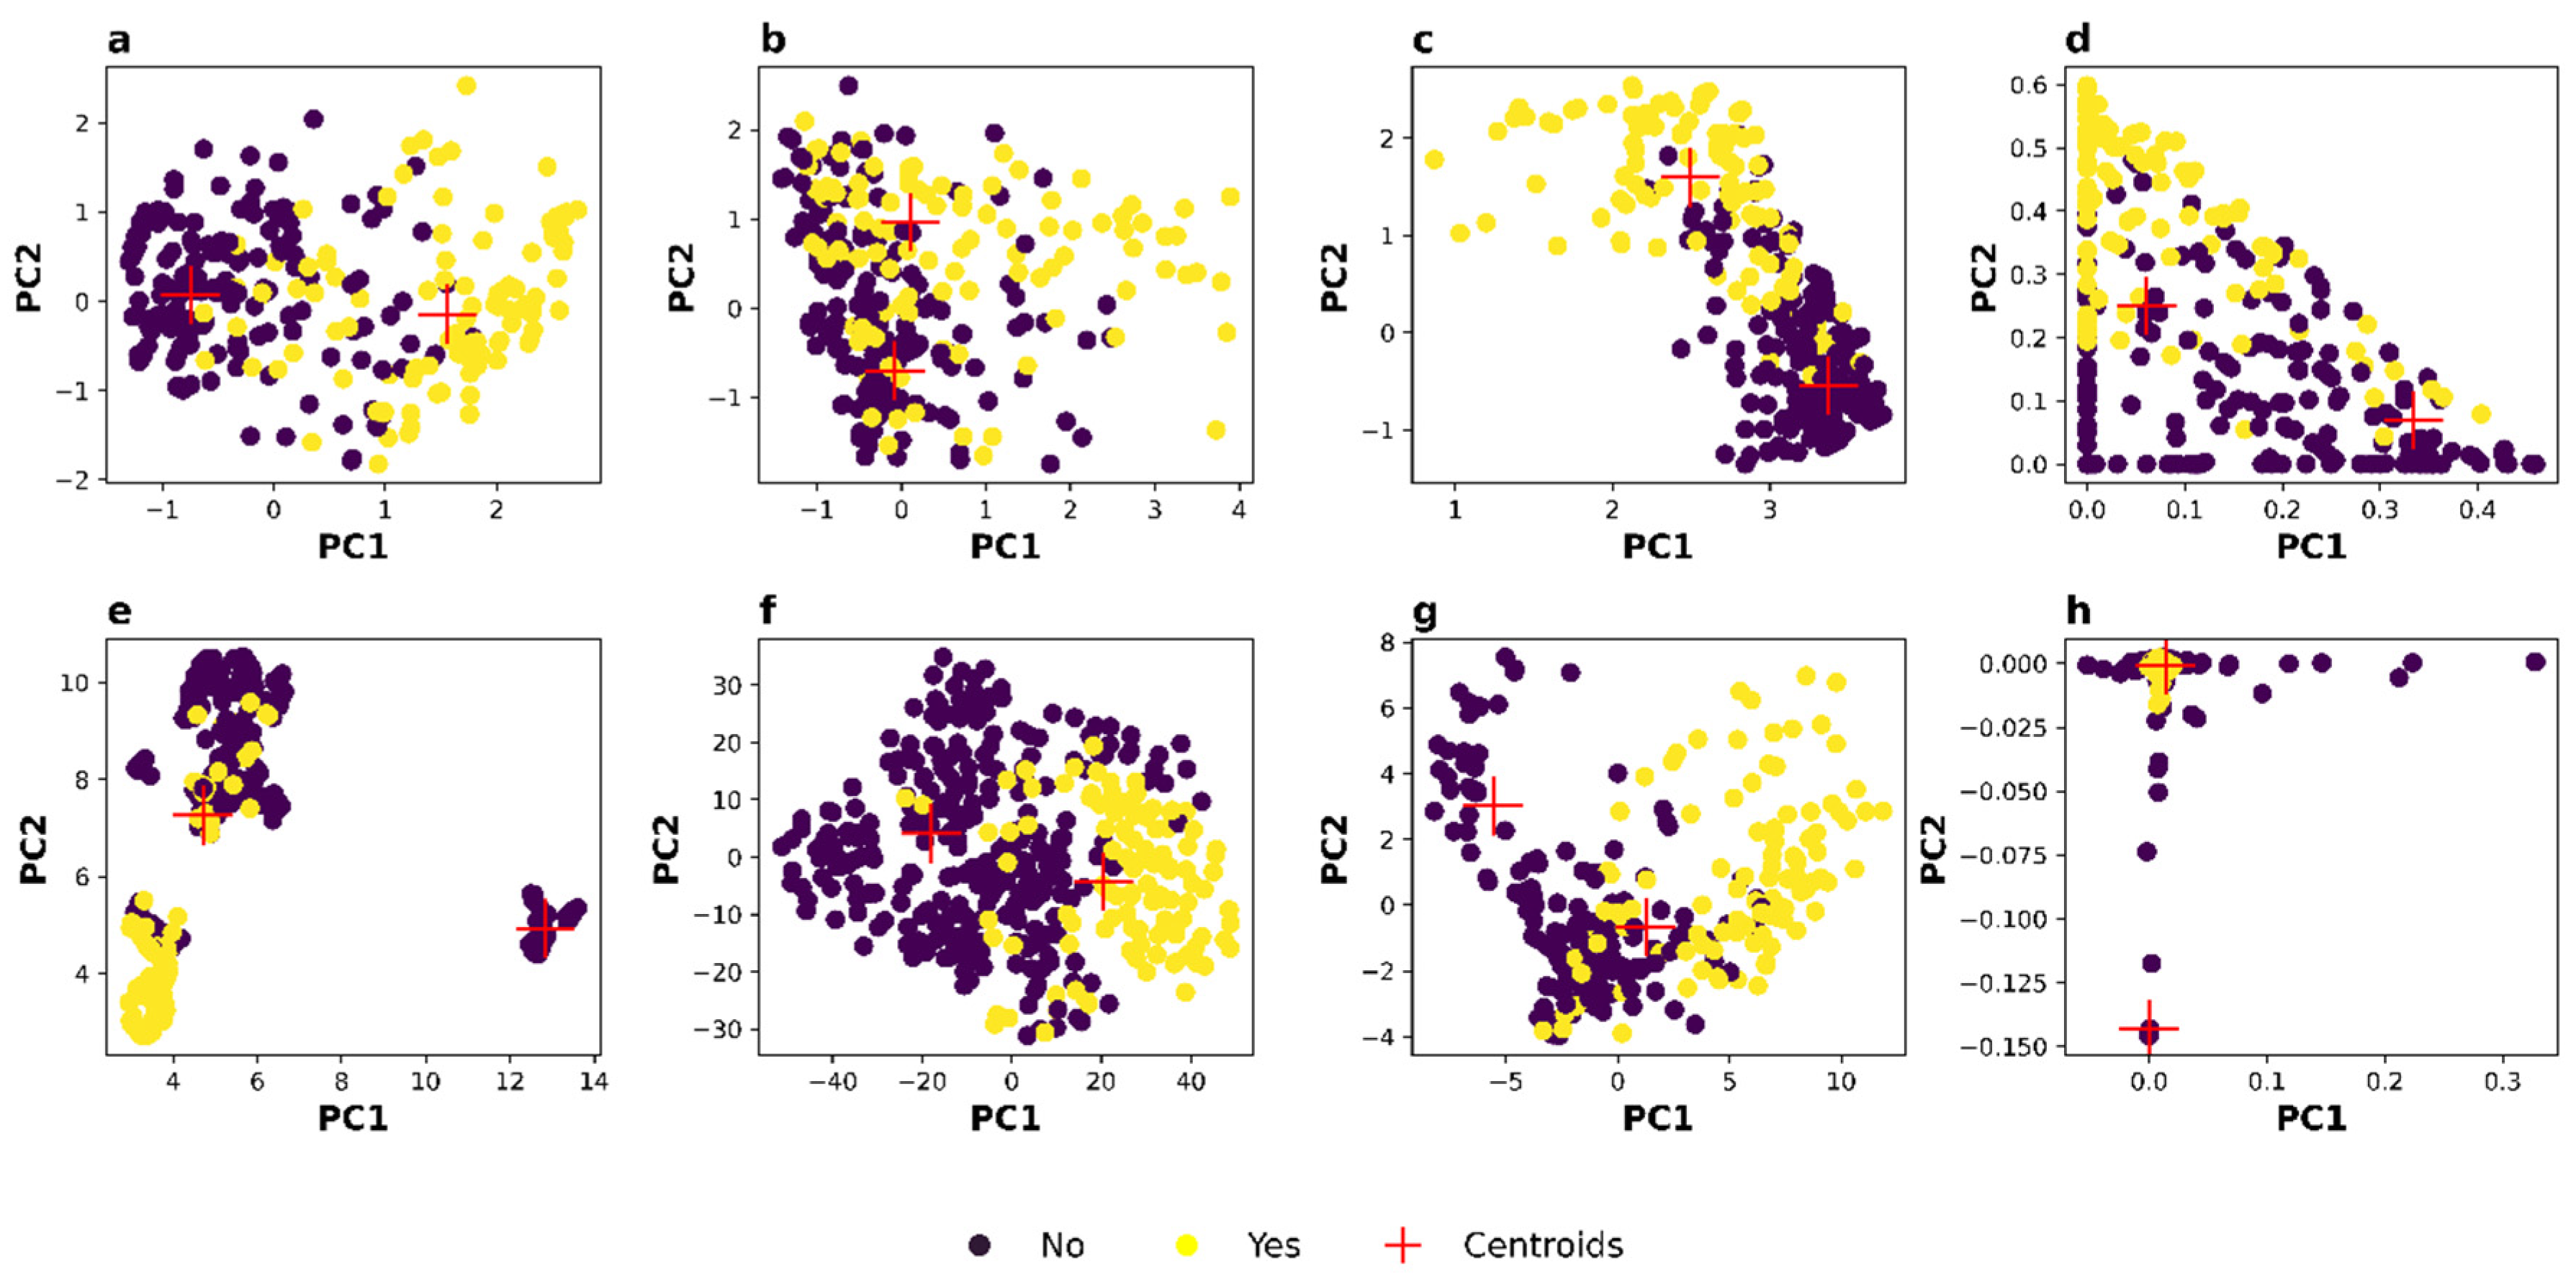
Figure 3.
[A] Density distributions and [B] heatmap of the standardized first principal components (PC1) derived from features obtained through various dimensionality reduction techniques. The subplots correspond to: [a] PC1 from PCA-derived features, [b] PC1 from tICA-derived features, [c] PC1 from tSVD-derived features, [d] PC1 from NMF-derived features, [e] PC1 from UMAP-derived features, [f] PC1 from t-SNE-derived features, [g] PC1 from Isomap-derived features, and [h] PC1 from LLE-derived features.
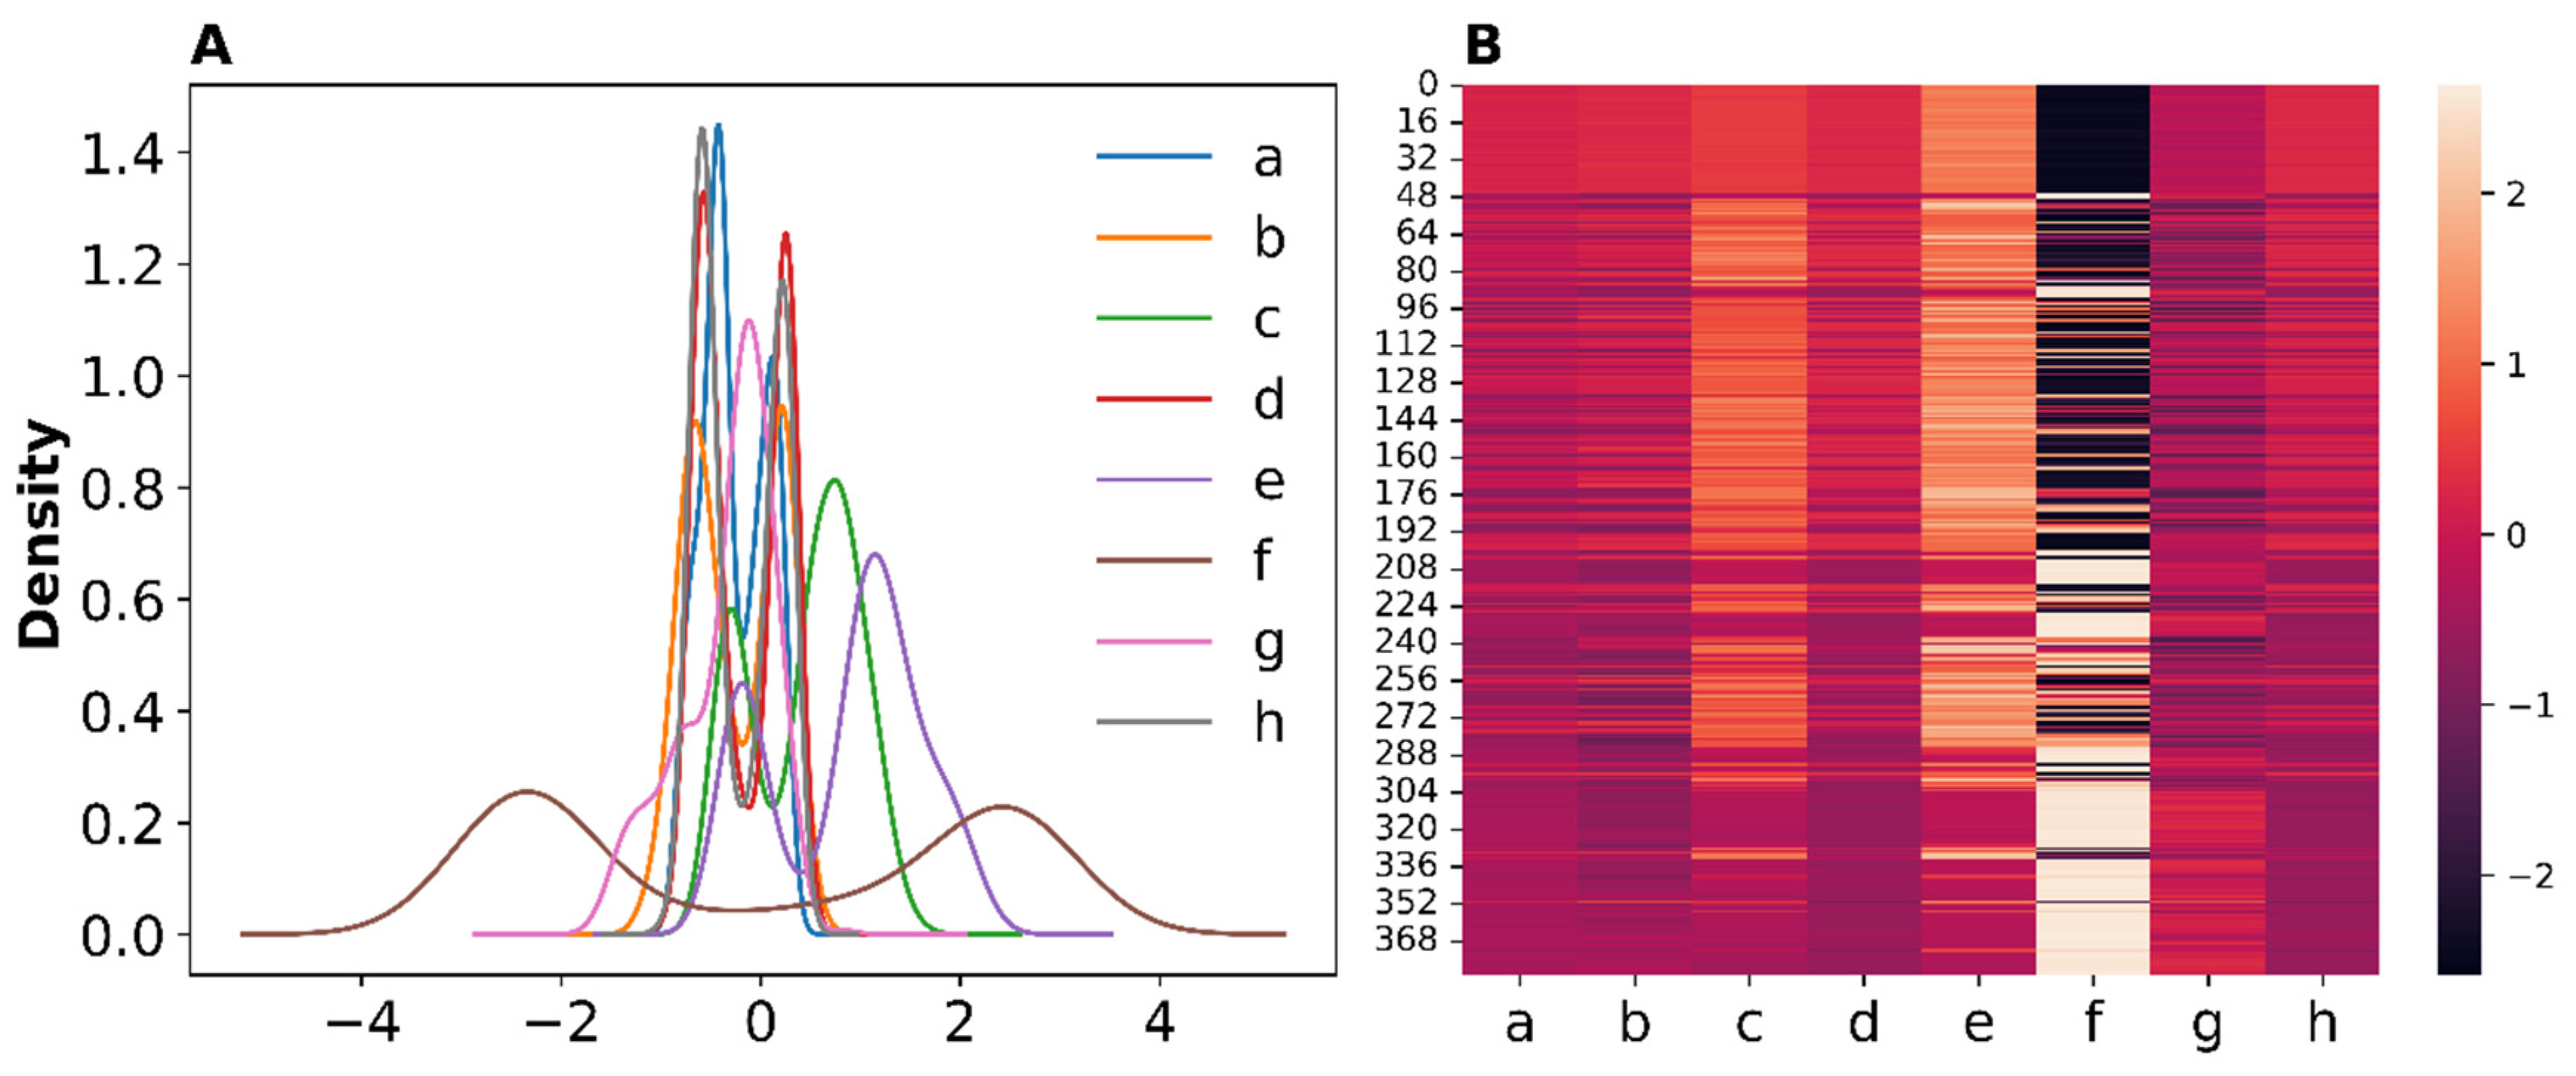
Figure 4.
[A] ROC-Curves of PCA-model pipelines, [B] ROC-Curves of tSVD-model pipelines, [C] DET-Curves of the PCA-model pipelines [D] DET-Curves of the tSVD-model pipelines.
Figure 4.
[A] ROC-Curves of PCA-model pipelines, [B] ROC-Curves of tSVD-model pipelines, [C] DET-Curves of the PCA-model pipelines [D] DET-Curves of the tSVD-model pipelines.
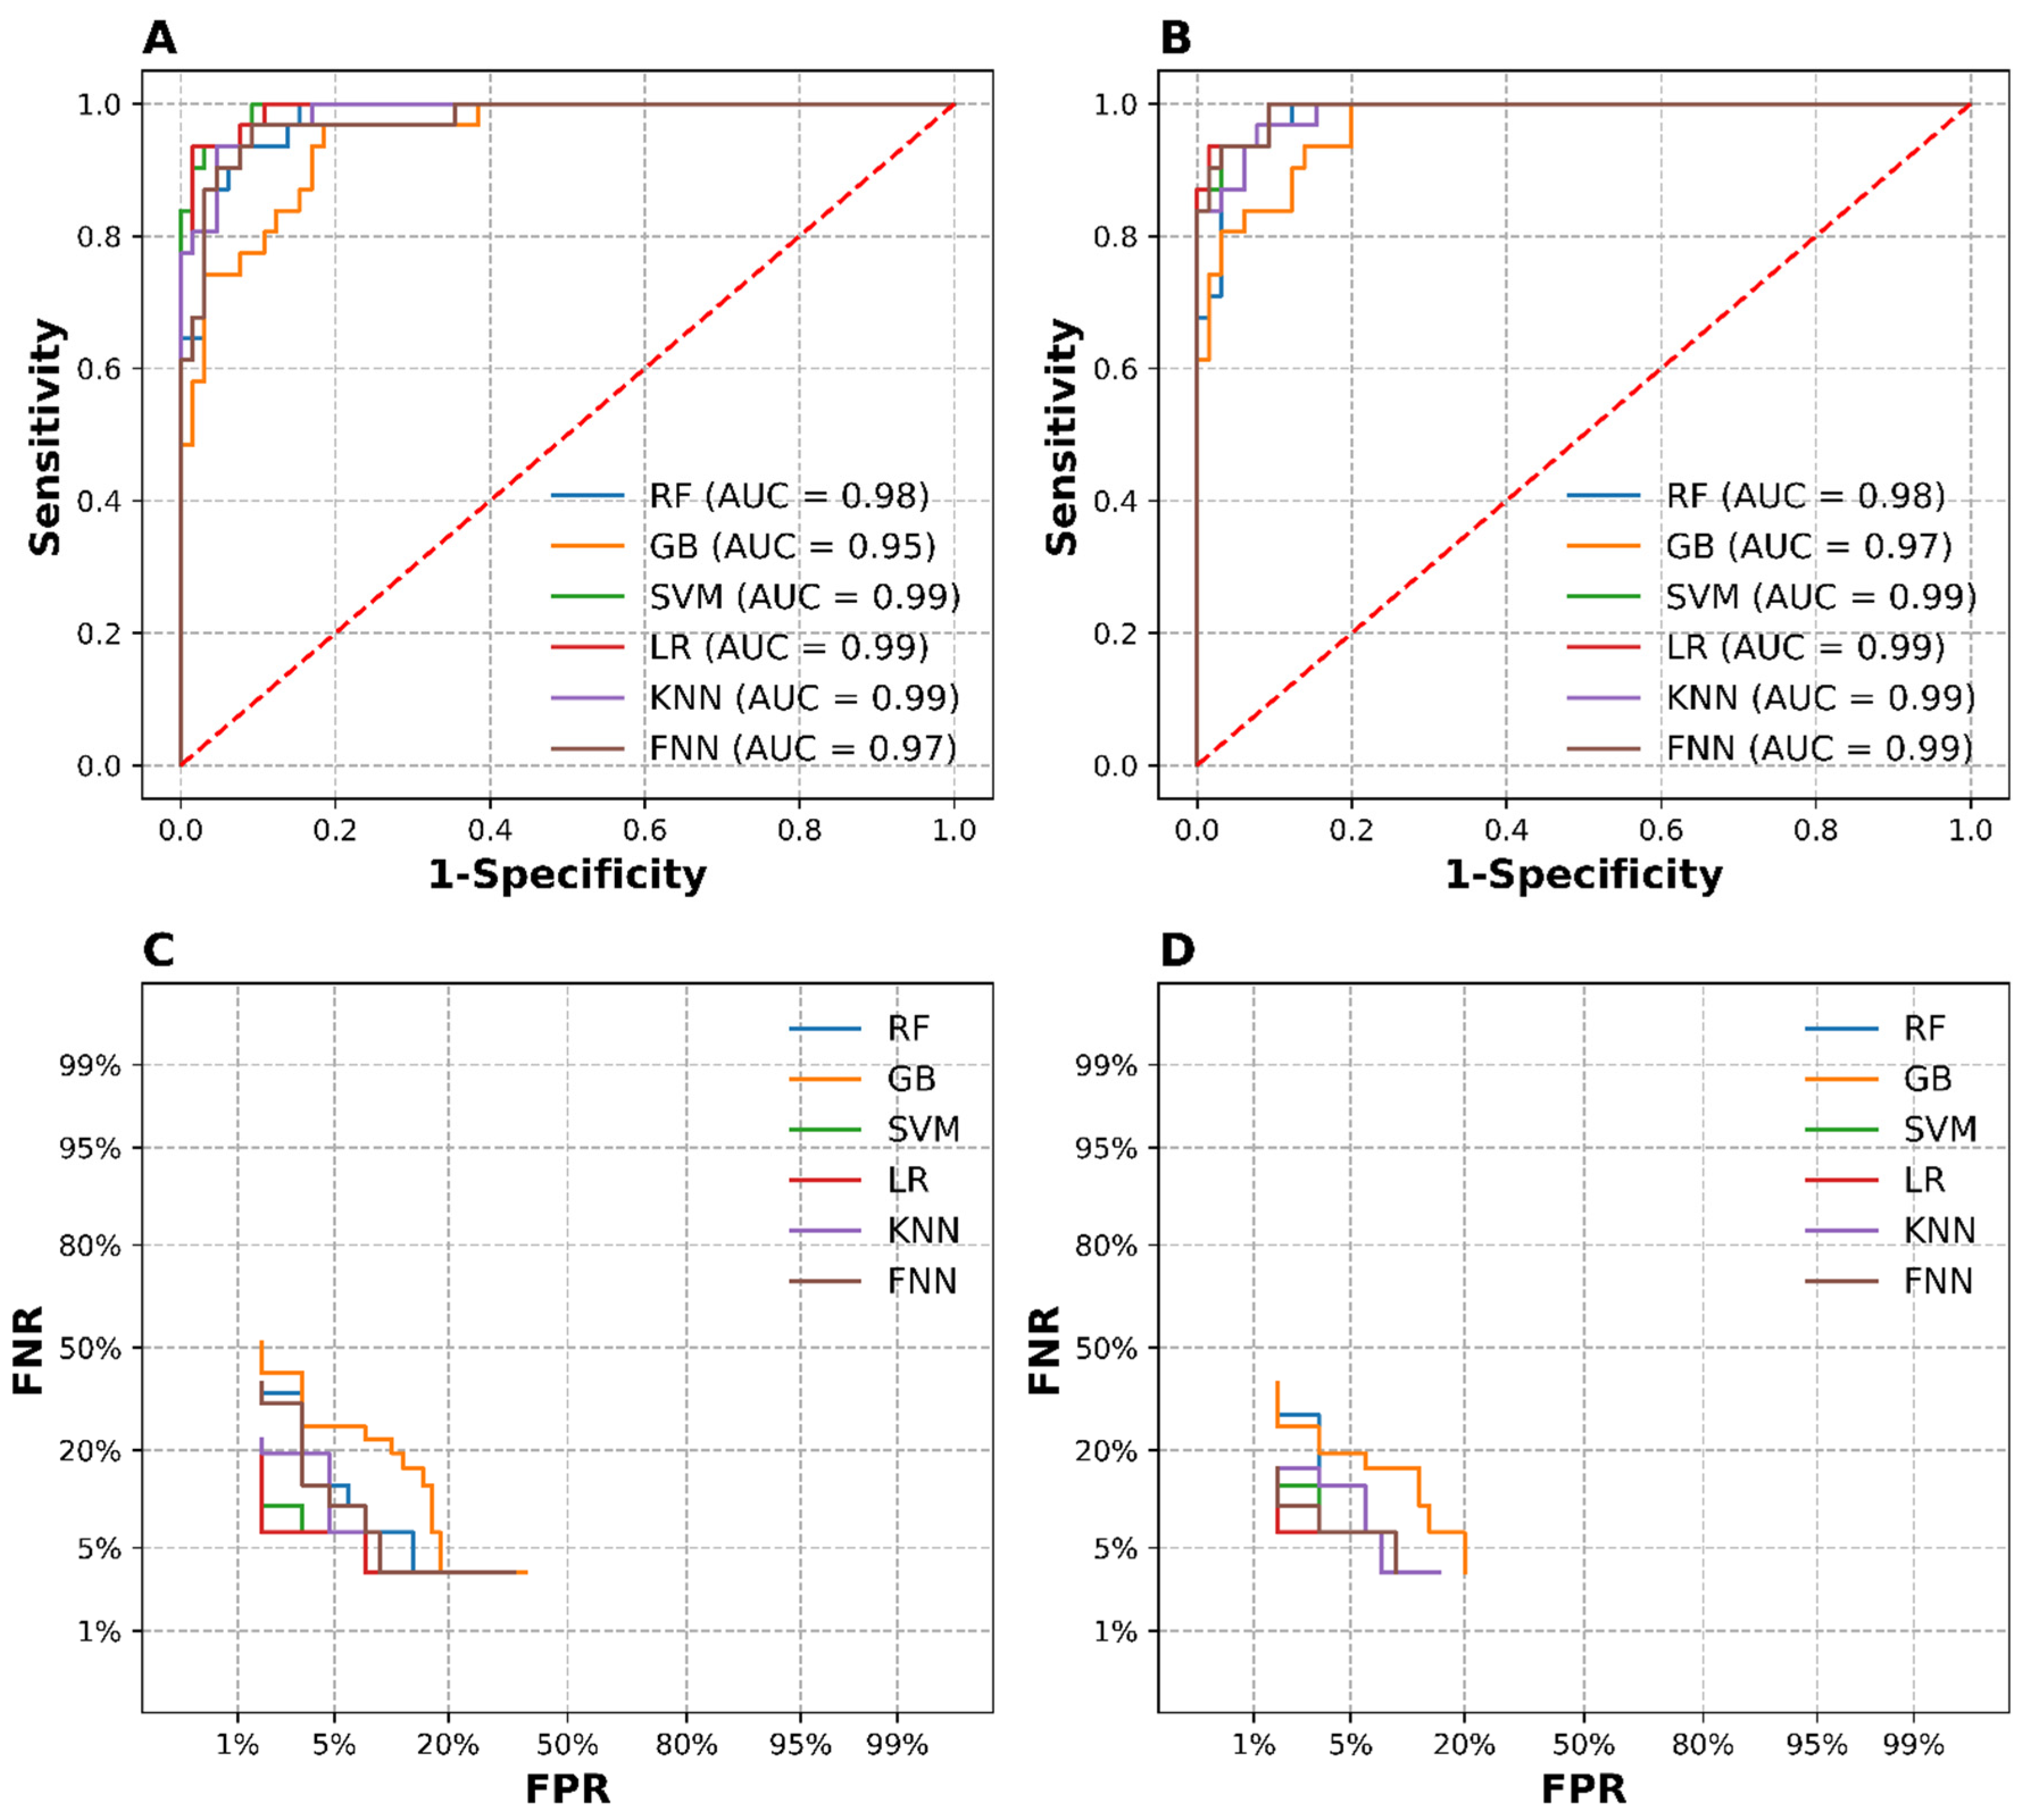

Table 1.
Dataset Description.
| Feature Name | Type | Description | Feature Value |
| Age | Integer | The age of the patient in years. | Any positive integer value (e.g., 20, 45, 60) |
| Gender | Categorical | The gender of the patient. | Male or Female |
| Smoking | Categorical | Indicates whether the patient is a current smoker. | Yes or No |
| Hx Smoking | Categorical | History of smoking. | Yes or No |
| Hx Radiothreapy | Categorical | History of receiving radiotherapy, particularly in the head and neck area. | Yes or No |
| Thyroid Function | Categorical | The functional status of the thyroid gland (e.g., Normal, Hyperthyroidism, Hypothyroidism). | Euthyroid, Clinical Hyperthyroidism, Subclinical Hypothyroidism, Clinical Hypothyroidism, or Subclinical Hyperthyroidism, |
| Physical Examination | Categorical | Findings from a physical examination of the patient. | Multinodular goiter, Single nodular goiter-right, Single nodular goiter-left, Normal or Diffuse goiter |
| Adenopathy | Categorical | Presence of swollen or enlarged lymph nodes, indicating potential spread of cancer. | No, Right, Bilateral, Left, Extensive, or Posterior |
| Pathology | Categorical | Histopathological findings from a biopsy of the thyroid tissue (e.g., Papillary, Follicular). | Papillary, Micropapillary, Follicular, or Hurthel cell |
| Focality | Categorical | Indicates whether the cancer is unifocal (single tumor) or multifocal (multiple tumors). | Uni-Focal or Multi-Focal |
| Risk | Categorical | Overall risk assessment based on various factors like tumor size, lymph node involvement, etc. | Low, Intermediate or High |
| T | Categorical | Tumor (T) stage in the TNM classification system, describing the size and extent of the primary tumor. | T2, T3a, T1a, T1b, T4a, T3b, or T4b |
| N | Categorical | Node (N) stage in the TNM classification system, indicating lymph node involvement. | N0, N1b, or N1a |
| M | Categorical | Metastasis (M) stage in the TNM classification system, indicating whether cancer has spread distantly. | M0 or M1 |
| Stage | Categorical | Overall cancer stage determined by combining T, N, and M stages (I, II, III, IV). | I, II, III, IVA or IVB |
| Response | Categorical | Indicates the patient's response to treatment (e.g., Complete, Partial, Stable, Progressive). | Excellent, Indeterminate, Structural Incomplete, or Biochemical Incomplete |
| Recurred | Categorical | Target variable indicating whether the thyroid cancer has recurred after treatment. | Yes or No |
Table 2.
Performance metrics of the engineered data clustering.
| Dataset | Method | ARI | V-Measure | Silhouette Coefficient | PC1 Variance |
| BaseData | PCA* | 0.557 | 0.451 | 0.489 | 1.200 |
| tICA | 0.179 | 0.165 | 0.318 | 1.001 | |
| tSVD* | 0.558 | 0.459 | 0.537 | 0.537 | |
| NMF | 0.013 | 0.102 | 0.352 | 0.156 | |
| UMAP | -0.076 | 0.093 | 0.604 | 2.565 | |
| t-SNE | 0.258 | 0.277 | 0.362 | 22.727 | |
| Isomap | 0.258 | 0.292 | 0.334 | 4.477 | |
| LLE | -0.081 | 0.083 | 0.633 | 0.049 |
Table 3.
Optimal Hyperparameters Discovered for Each Classification Model Pipeline.
| Model | Hyperparameter | PCA-Model Pipeline | tSVD-Model Pipeline |
| RF | criterion | log_loss | entropy |
| max_depth | None | None | |
| class_weight | {0:1, 1:3} | {0:1, 1:3} | |
| min_sample_leaf | 4 | 2 | |
| sample_split | 4 | 5 | |
| n_estimators | 400 | 400 | |
| max_features | log2 | log2 | |
| GB | criterion | squared_error | friedman_mse |
| learning_rate | 0.36 | 0.35 | |
| loss | Exponential | log_loss | |
| max_depth | 5 | 5 | |
| n_estimators | 152 | 150 | |
| SVM | C | 0.12 | 0.25 |
| kernel | Sigmoid | sigmoid | |
| LR | C | 0.35 | 0.1 |
| solver | Liblinear | Liblinear | |
| max_iter | 5000 | 5000 | |
| penalty | l2 | l2 | |
| KNN | n_neighbors | 17 | 18 |
| weight | distance | Distance | |
| p | 2 | 4 | |
| FNN | alpha | 1.0 | 1.0 |
| activation | relu | Identity | |
| hidden_layer_size | (100, 100) | (125,155) | |
| learning_rate | constant | Adaptive | |
| solver | sgd | Sgd | |
| max_iter | 8000 | 15000 |
LR=Logistic Regression, GB=Gradient Boosting, SVM=Support Vector Machine, RF=Random Forest, KNN=K-Nearest Neighbors, FNN=Feedforward Neural Network.
Table 4.
Performance of the Classification Model pipelines on the Test set and 10-Fold CV.
| Model | PCA-Model Pipeline | |||||||||||
| Test set Performance | 10-fold CV Performance | |||||||||||
| B. Acc. | F1 score | AUC | Sen. | Spec. | Prec. | B. Acc. |
F1 Score |
AUC | Sen. | Spec. | Prec. | |
| RF | 0.906 | 0.853 | 0.977 | 0.935 | 0.877 | 0.784 | 0.882 | 0.867 | 0.966 | 0.862 | 0.902 | 0.779 |
| GB | 0.849 | 0.794 | 0.948 | 0.806 | 0.892 | 0.781 | 0.868 | 0.873 | 0.946 | 0.797 | 0.939 | 0.856 |
| SVM | 0.929 | 0.892 | 0.992 | 0.935 | 0.923 | 0.853 | 0.873 | 0.861 | 0.960 | 0.845 | 0.902 | 0.776 |
| LR | 0.952 | 0.935 | 0.992 | 0.935 | 0.969 | 0.935 | 0.850 | 0.849 | 0.967 | 0.779 | 0.920 | 0.798 |
| KNN | 0.912 | 0.885 | 0.985 | 0.871 | 0.954 | 0.900 | 0.872 | 0.881 | 0.960 | 0.788 | 0.957 | 0.883 |
| FNN | 0.938 | 0.896 | 0.971 | 0.968 | 0.908 | 0.833 | 0.903 | 0.897 | 0.961 | 0.871 | 0.935 | 0.855 |
| tSVD-Model Pipeline | ||||||||||||
| Test set Performance | 10-fold CV Performance | |||||||||||
| B. Acc. | F1 score | AUC | Sen. | Spec. | Prec. | B. Acc. |
F1 Score |
AUC | Sen. | Spec. | Prec. | |
| RF | 0.937 | 0.886 | 0.986 | 0.912 | 0.938 | 0.861 | 0.889 | 0.892 | 0.965 | 0.844 | 0.949 | 0.871 |
| GB | 0.896 | 0.853 | 0.978 | 0.853 | 0.938 | 0.853 | 0.884 | 0.886 | 0.957 | 0.825 | 0.938 | 0.858 |
| SVM | 0.928 | 0.879 | 0.992 | 0.853 | 0.963 | 0.906 | 0.846 | 0.848 | 0.961 | 0.780 | 0.916 | 0.789 |
| LR | 0.944 | 0.933 | 0.994 | 0.903 | 0.985 | 0.966 | 0.854 | 0.859 | 0.965 | 0.770 | 0.931 | 0.832 |
| KNN | 0.908 | 0.885 | 0.987 | 0.853 | 0.963 | 0.906 | 0.860 | 0.868 | 0.952 | 0.770 | 0.949 | 0.862 |
| FNN | 0.912 | 0.903 | 0.989 | 0.824 | 1.000 | 1.000 | 0.859 | 0.870 | 0.963 | 0.762 | 0.967 | 0.906 |
B. Acc.=Balanced Accuracy, AUC= area under the receiver operating characteristic (ROC) curve, Sen. = Sensitivity, Spec. = Specificity, Prec.=Precision, LR=Logistic Regression, GB=Gradient Boosting, SVM=Support Vector Machine, RF=Random Forest, KNN=K-Nearest Neighbors, FNN=Feedforward Neural Network.
Table 5.
Performance Comparison of Our Approach and Previous Studies on Selected Metrics for Predicting DTC Recurrence on the Test Set.
Table 5.
Performance Comparison of Our Approach and Previous Studies on Selected Metrics for Predicting DTC Recurrence on the Test Set.
| Study | Model | Dataset/Features | AUC | Sen. | Spec. | Comment |
| Our Study | SVM | PCA/tSVD pipelines | 99.2% | 93.5% (PCA), 85.3% (tSVD) | >92% | Confirms SVM's effectiveness; aligns with Borzooei et al. |
| KNN | PCA/tSVD pipelines | >98.4% | >85% | >95% | Suggests improved predictive ability with high-variance features. | |
| RF | PCA/tSVD pipelines | >97% | 93.5% (PCA), 91.2% (tSVD) | 87.7% (PCA), 93.8% (tSVD) | Consistent with Borzooei et al.; reliable performance. | |
| FNN | PCA/tSVD pipelines | >97% | 96.8% (PCA), 82.4% (tSVD) | 90.8% (PCA), 100% (tSVD) | Comparable performance with Borzooei et al.’ ANN model; high spec and sen. | |
| LR | PCA/tSVD pipelines | >99% | 93.5% (PCA), 90.6% (tSVD) | >96% | Superior performance to Wang et al. LR | |
| Borzooei et al. (2024) [11] | SVM | 13 clinicopathologic features | 99.71 | 99.33% | 97.14% | High performance; aligns with your tSVD-based SVM (AUC: 99.2%). |
| KNN | 13 clinicopathologic features | 98.44 | 83% | 97.14% | Our KNN models in PCA/tSVD pipelines show slightly higher AUC (>98%) and sensitivity (>85%). | |
| RF | 13 clinicopathologic features | 99.38 | 99.66% | 94.28% | Comparable to our RF models with AUC >97% in both PCA and tSVD pipelines. | |
| ANN | 13 clinicopathologic features | 99.64 | 96.6% | 95.71% | High performance comparable to our FNN model. | |
| Qiao et al. (2024) [51] | RF | Distant metastasis dataset | 0.960 | 92.9% | N/A | High performance similar to our RF model's performance. |
| Wang et al. (2024) [52] | RF | Larger cohort (2244 patients), perioperative variables | 0.766 | 0.757 | 0.682 | Lower performance than our study; variation may be due to different feature sets. |
| LR | Larger cohort (2244 patients), perioperative variables | 0.738 | 0.865 | 0.495 | Lower performance than our LR; variation may be due to different feature sets. | |
| SVM | Larger cohort (2244 patients), perioperative variables | 0.752 | 0.568 | 0.903 | Lower performance than our SVM but with comparable spec. |
Sen. = Sensitivity, Spec. = Specificity, LR=Logistic Regression, GB=Gradient Boosting, SVM=Support Vector Machine, RF=Random Forest, KNN=K-Nearest Neighbors, FNN=Feedforward Neural Network.
Disclaimer/Publisher’s Note: The statements, opinions and data contained in all publications are solely those of the individual author(s) and contributor(s) and not of MDPI and/or the editor(s). MDPI and/or the editor(s) disclaim responsibility for any injury to people or property resulting from any ideas, methods, instructions or products referred to in the content. |
© 2024 by the authors. Licensee MDPI, Basel, Switzerland. This article is an open access article distributed under the terms and conditions of the Creative Commons Attribution (CC BY) license (http://creativecommons.org/licenses/by/4.0/).
Copyright: This open access article is published under a Creative Commons CC BY 4.0 license, which permit the free download, distribution, and reuse, provided that the author and preprint are cited in any reuse.


