Submitted:
14 September 2024
Posted:
27 September 2024
You are already at the latest version
Abstract
Keywords:
1. Introduction
2. Materials and Methods
2.1. Study Area
2.1.1. Demographic Data of the RMSC
2.1.2. Economics of RMSC
2.1.3. Motorization Rate
2.1.4. Links with Cáceres
2.2. Description of Bus Lines
2.3. Data
2.4. Variables Selection
3. Results
3.1. Analysis by Municipality
3.2. Bus Route Analysis
4. Discussion
5. Conclusions
Author Contributions
Funding
Data Availability Statement
Acknowledgments
Conflicts of Interest
Appendix A
- -
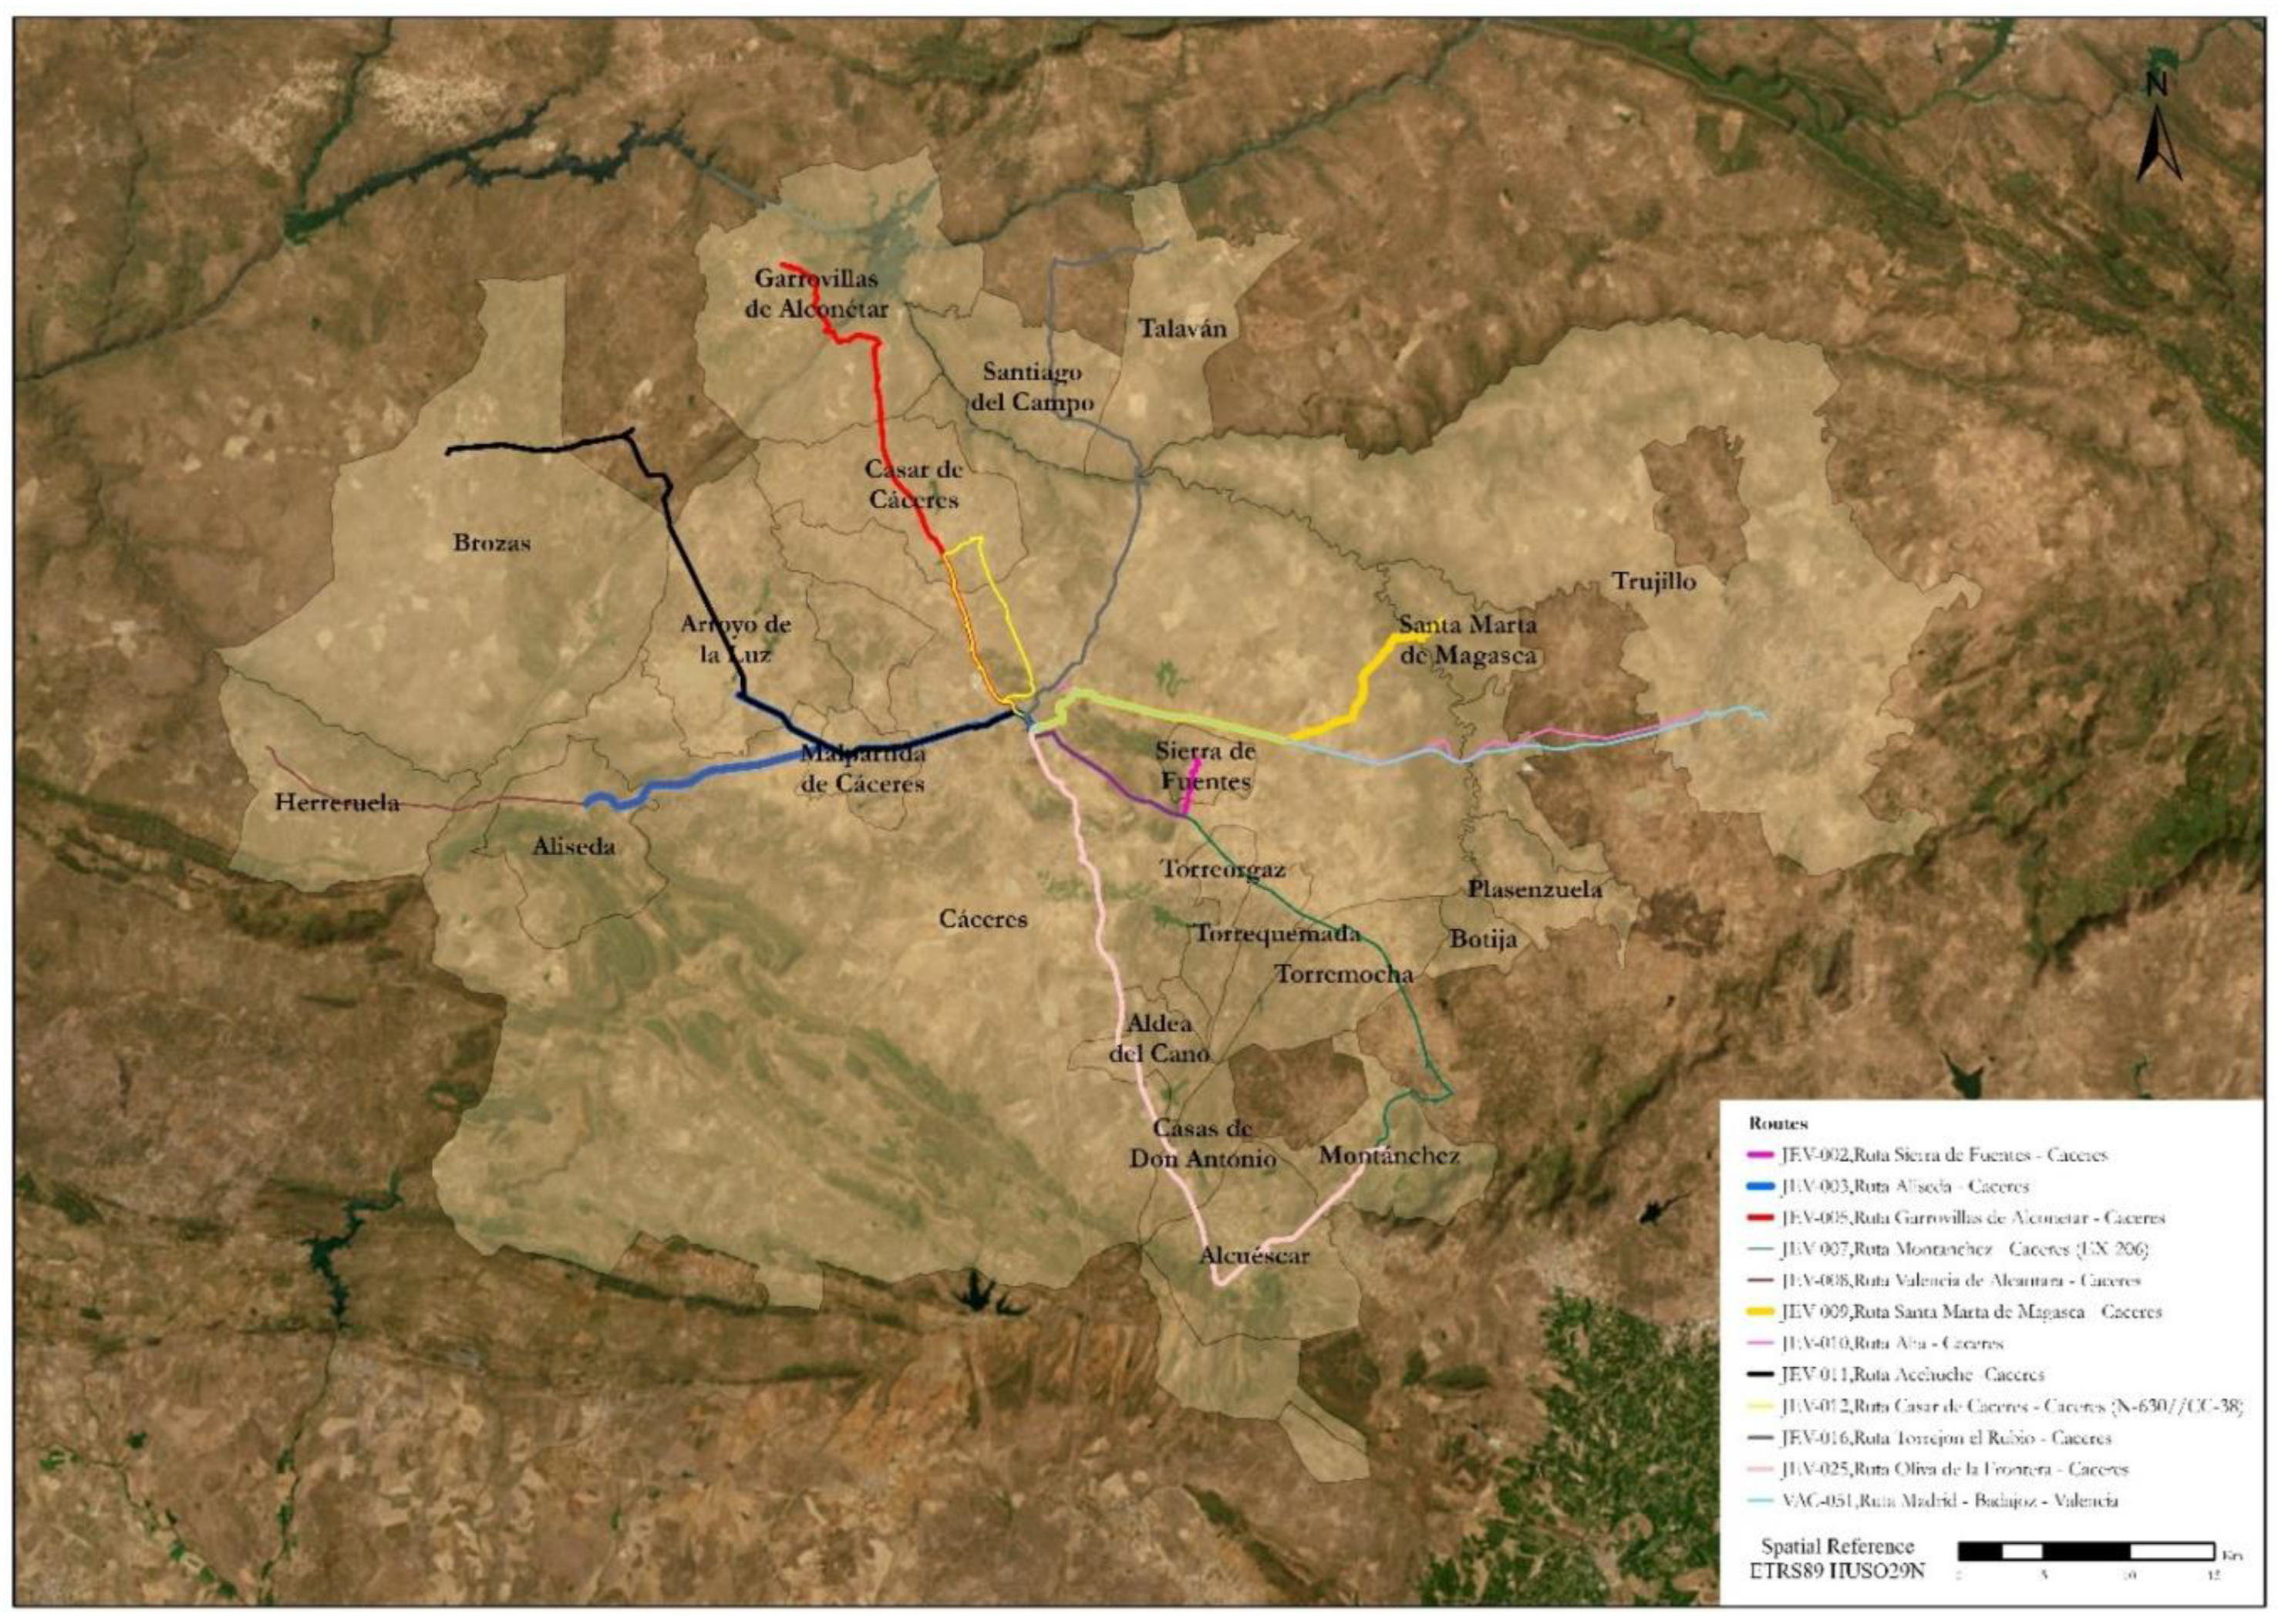
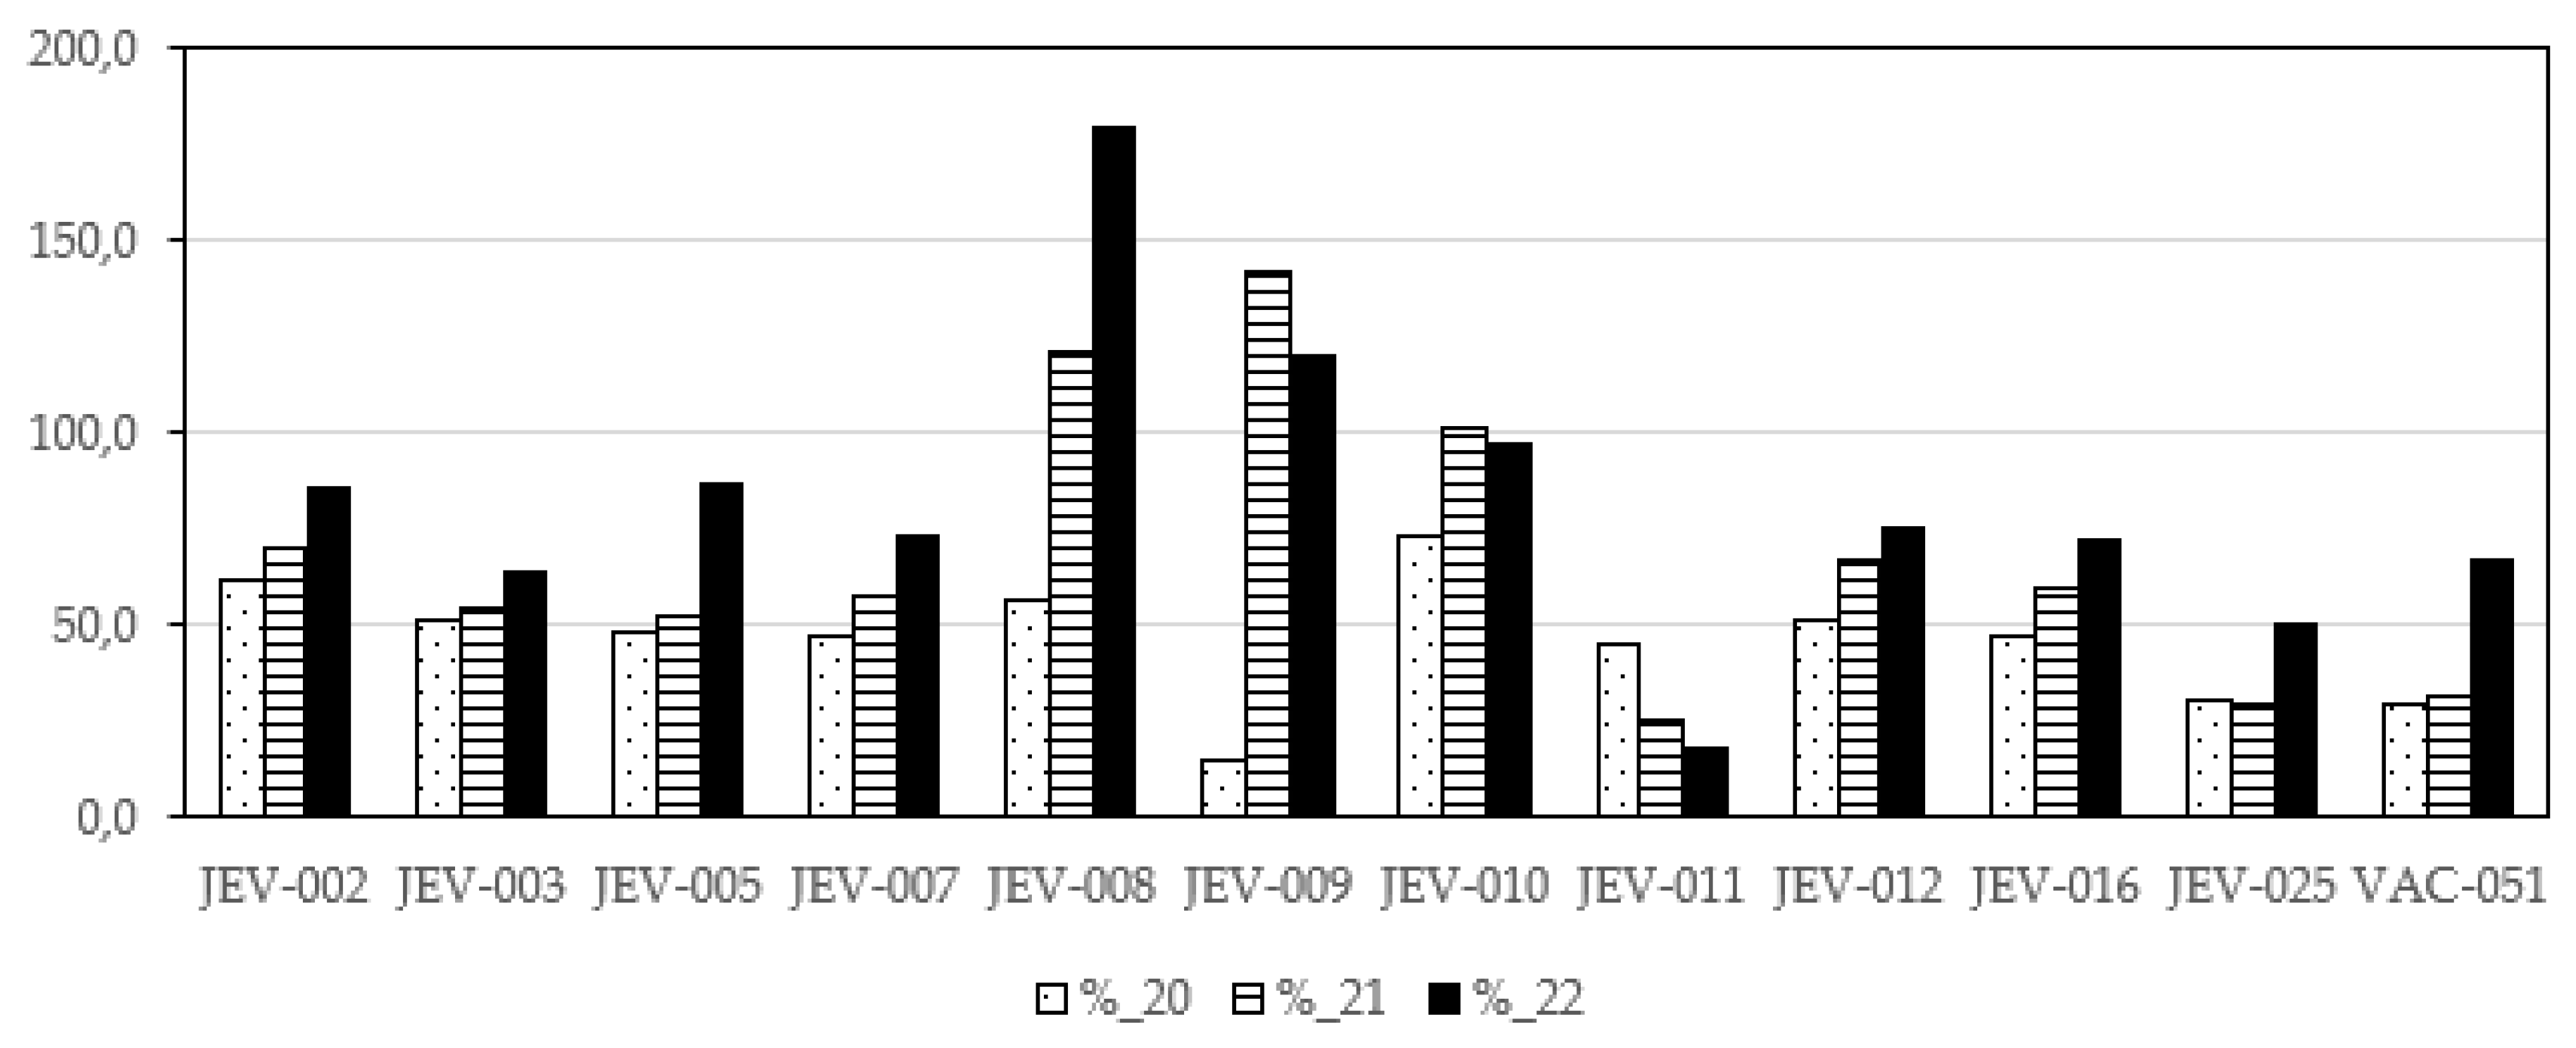
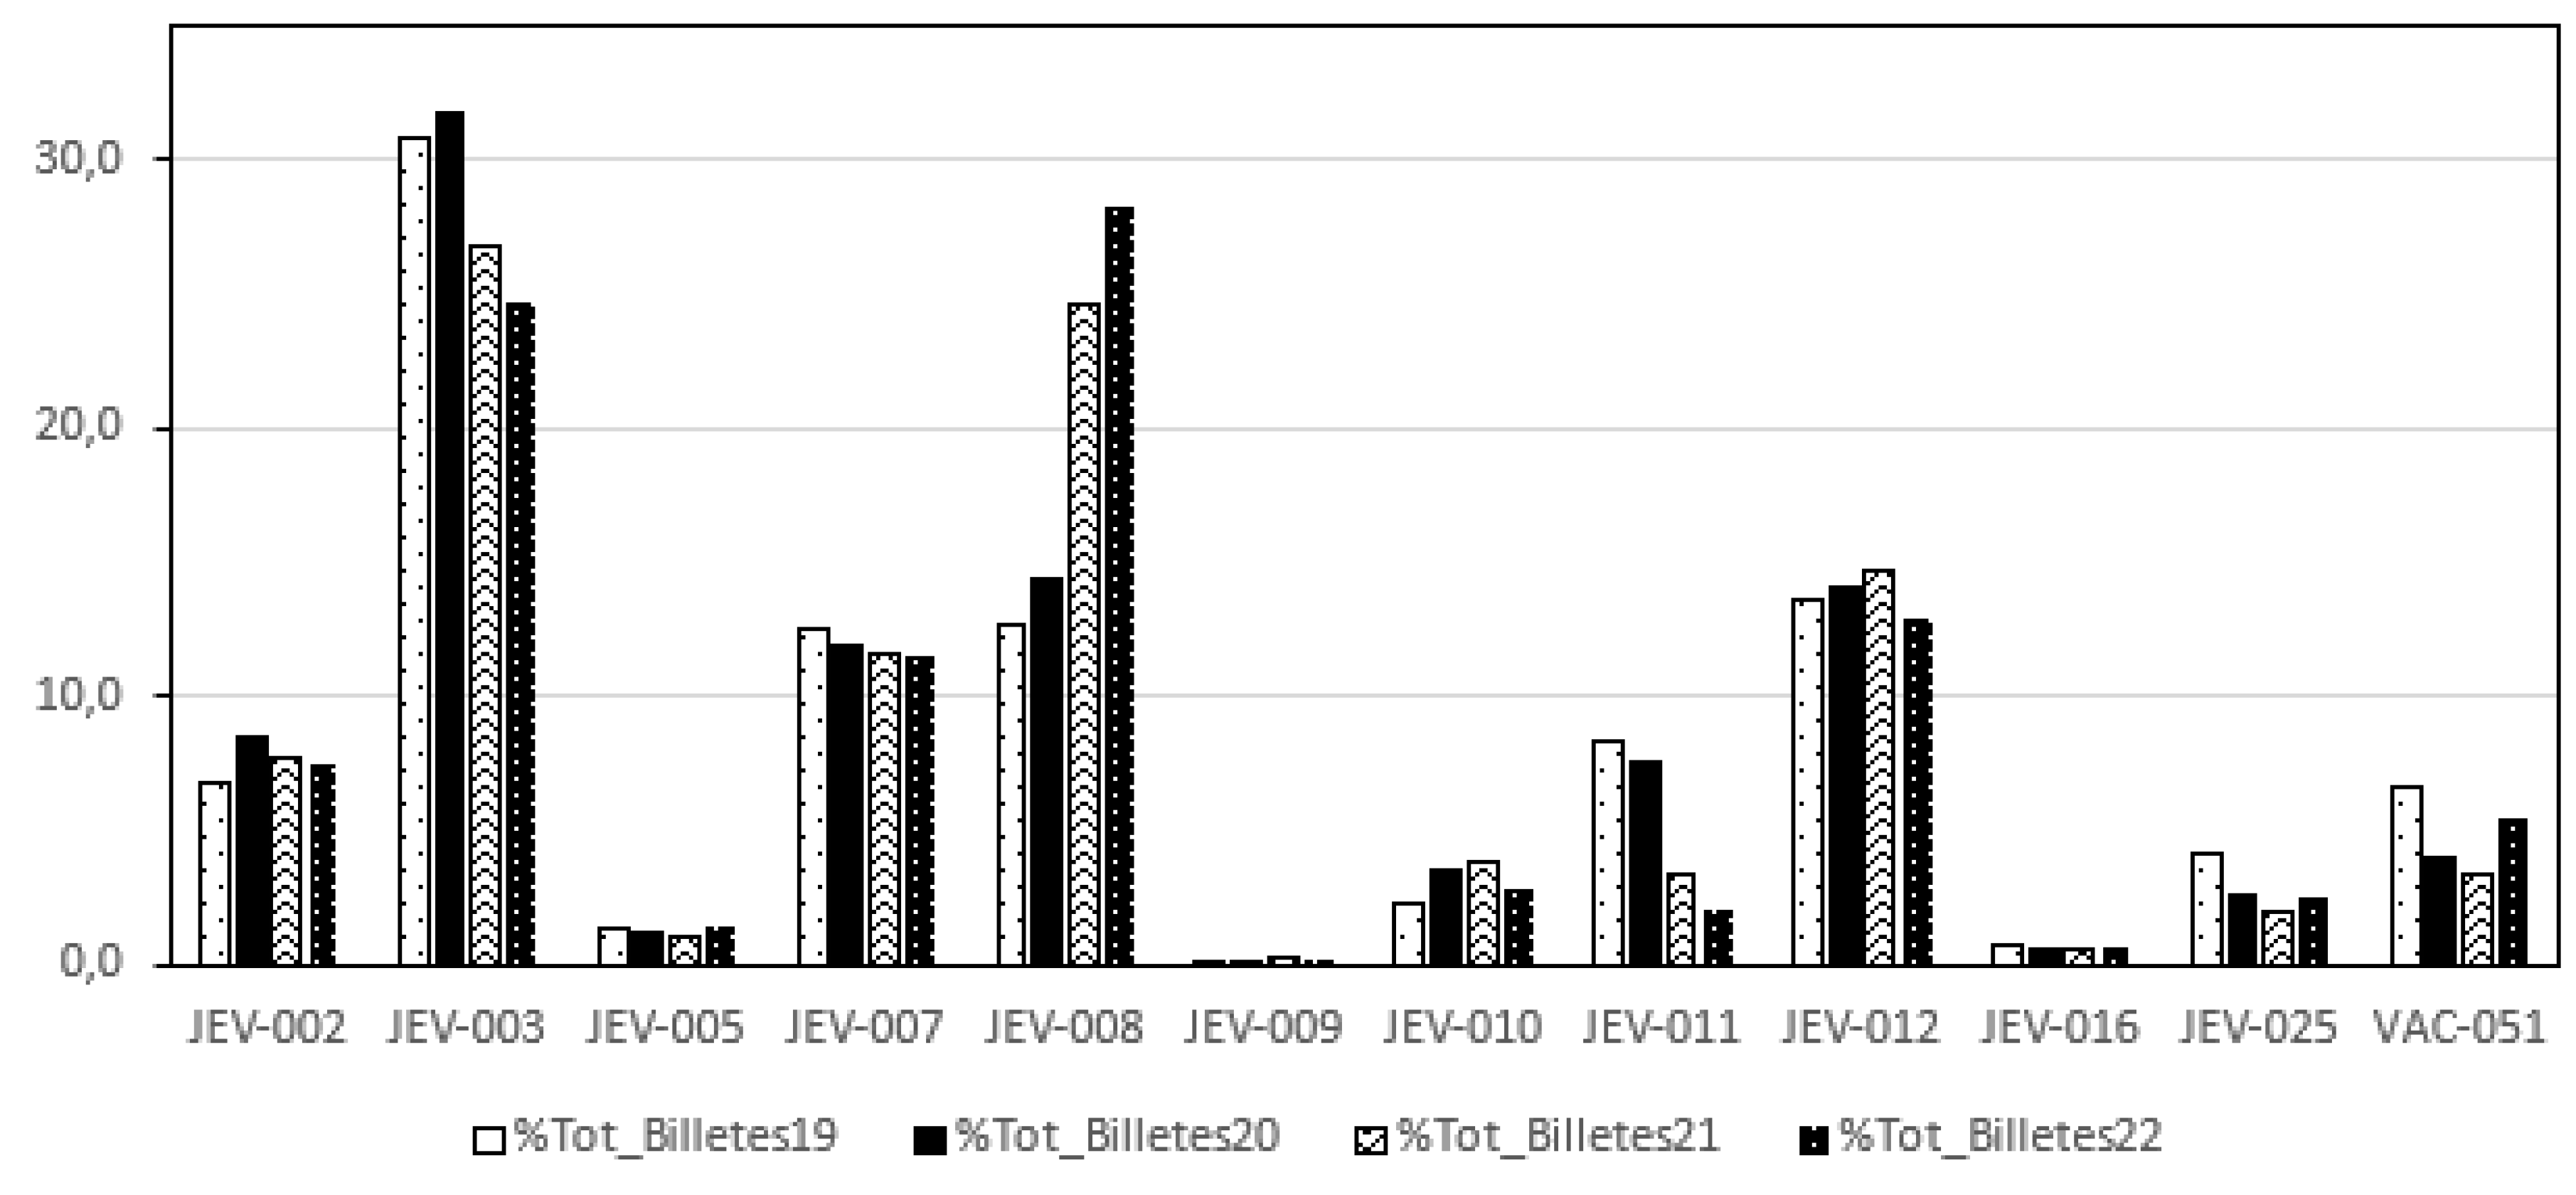
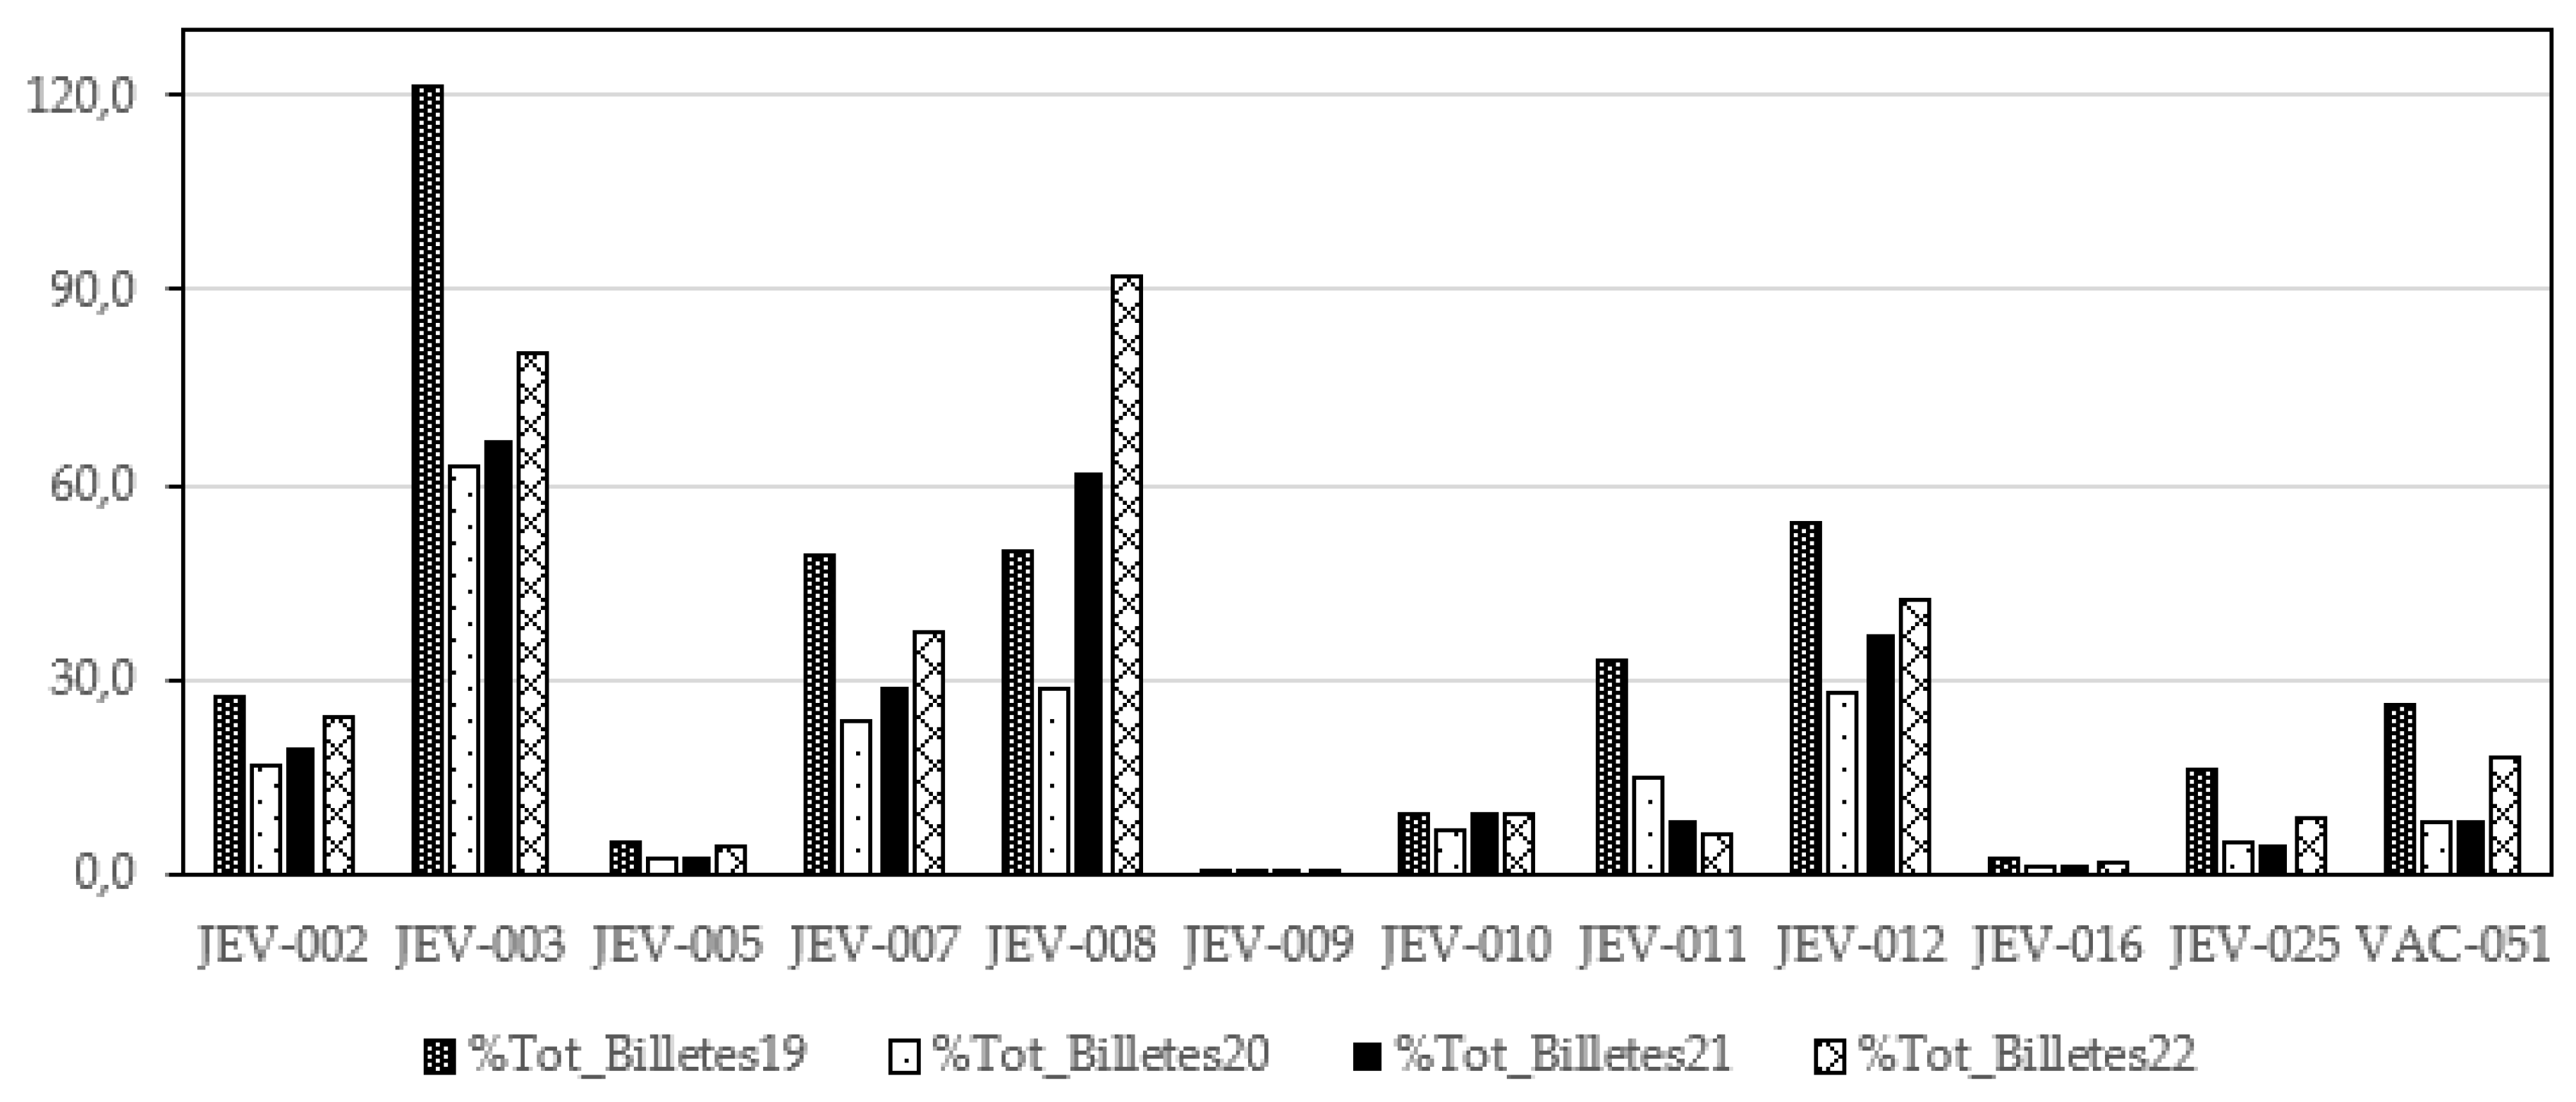
- JEV-002 Route Sierra de Fuentes – Cáceres. It connects the municipalities of Sierra de Fuentes with Cáceres with a length of 15.2 kilometres and it is managed by the company Duran Bus S.L.
- -
- JEV-003 Aliseda – Cáceres. José Ramon Mena Autobuses S.L. known as Mena is the company in charge of co-connecting the municipalities of Aliseda, Arroyo de la Luz, Malpartida de Cáceres and Cáceres in a route of 45.4 km.
- -
- JEV-005 Route Garrovillas de Alconétar – Cáceres. It connects the municipalities of Garrovillas de Alconétar with Cáceres and the company Herederos de Juan Gil Hernández, S.L. is in charge of it. This route has an extension of 36.4 km.
- -
- JEV-007 Route Montánchez – Cáceres (EX206). Managed by the local company of the municipality of Montánchez Solís Autocares, S.L. and connecting the municipalities of Montánchez, Albalá, Torre de Santa María, Valdefuentes, Torremocha, Torrequemada, Torreorgaz and Cáceres in an extension of 46.8 km.
- -
- JEV-008 Route Valencia de Alcántara – Cáceres. Route managed by the company El Gato S.L. and connects the municipalities of Valencia de Alcántara, Membrío, Salorino, Herreruela, Malpartida de Cáceres and Cáceres in service 1 within this line. In the service 2 offered by this line is the one that connects Aliseda with Arroyo de la Luz, Malpartida de Cáceres and Cáceres coinciding with the route JEV-003 so when this fact happened from the regional government it was decided to suppress the route JEV-003 from the year 2021, however, to carry out our study we have chosen to maintain the route JEV-003 active and to suppress the service 2 of the JEV-008 in order to have a single service within this route that would join the towns of Herreruela, Aliseda, Malpartida de Cáceres and Cáceres having this service an extension of 49.5 km.
- -
- JEV-009 Route Santa Marta de Magasca – Cáceres. Line managed by the company Alsa - Mirat that connects the municipalities of Santa Marta de Magasca with Trujillo and Cáceres, being this line the 36th service within this concession. This line covers a total of 31.9 km.
- -
- JEV-010 Route Alía – Cáceres. It has the concession of the bus company Alsa - Mirat and runs through 14 towns starting from Alía and going through Guadalupe, Cañamero, Logrosán, Zorita, Conquista de la Sierra, Herguijuela, Pago de San Clemente, Madroñera, Trujillo until arriving in Cáceres. This line covers a total of 50 kilometres.
- -
- JEV-011 Route Acehúche – Cáceres. It is managed by the company Autocares Noreste S.L. and departs from Acehúche passing through Ceclavín, Zarza la Mayor, Piedras Albas, Alcántara, Mata de Alcántara, Villa del Rey, Brozas, Navas del Madroño, Arroyo de la Luz, Malpartida de Cáceres until arriving at Cáceres. This line runs through a total of 12 municipalities with an extension of 49.9 kilometres.
- -
- JEV-012 Route Casar de Cáceres – Cáceres. This route is managed by Autocares Hnos. Fdez. Palomino, S.L. and has two types of services, although both connect in the same way Casar de Cáceres - Cáceres and vice versa, these combinations are broken down by where they circulate differentiating the ser-vice 1, it does it by the national road N-630 and service 2 by the conventional road CC-324. All in a route of 31.9 km in total.
- -
- JEV-016 Ruta Torrejón el Rubio – Cáceres. This line runs along the EX-390 regional road connecting the municipalities of Torrejón el Rubio, Monroy, Talaván, Hinojal, Santiago del Campo and Cáceres and is managed by the company Emiz, S.L. This route has an extension of 44.1 km
- -
- JEV-025 Route Oliva de la Frontera – Cáceres. The concession is held by the bus company Autocares de Badajoz S.L., and it connects the towns of Oliva de la Frontera, Jerez de los Caballeros, Brovales, Burguillos del Cerro, Zafra, Los Santos de Maimona, Villafranca de los Barros, Almendralejo, Torremejía, Mérida, Carrascalejo, Aljucén, Casas de Don Antonio, Aldea del Cano, Valdesalor and Cáceres. It has a length of 52.4 km, taking into account only the municipalities of the Network through which the old route JE-018-C used to run (Montánchez, Alcuéscar, Casas de Don Antonio, Aldea del Cano), although by a different route, so the regional government decided to join both lines and leave a single active service in order to link several municipalities both inside and outside the Network.
- -
- VAC-051 Route Madrid – Badajoz – Valencia. This route is the only one that connects two municipalities within the Sustainable Network of Municipalities of Cáceres, which are Trujillo and Cáceres, but the line originates in a town outside the autonomous community of Extremadura.
References
- Organización de las Naciones Unidas. Declaración Universal de Derechos Humanos.
- Organización de las Naciones Unidas. Pacto Internacional de Derechos Civiles y Políticos; 1966. [Google Scholar]
- Martín, M.M. Restrictions on the Free Movement of Persons in the EU during the COVID-19 Era: Towards an Uncertain Future. Araucaria 2020, 311–335. [Google Scholar] [CrossRef]
- Chinazzi, M.; Davis, J.T.; Ajelli, M.; Gioannini, C.; Litvinova, M.; Merler, S.; Pastore Y Piontti, A.; Mu, K.; Rossi, L.; Sun, K.; et al. The Effect of Travel Restrictions on the Spread of the 2019 Novel Coronavirus (COVID-19) Outbreak; 2020. [Google Scholar]
- Rasca, S.; Markvica, K.; Ivanschitz, B.P. Impacts of COVID-19 and Pandemic Control Measures on Public Transport Ridership in European Urban Areas – The Cases of Vienna, Innsbruck, Oslo, and Agder. Transp Res Interdiscip Perspect 2021, 10. [Google Scholar] [CrossRef]
- Martin, S.; Bergmann, J. (Im)Mobility in the Age of COVID-19. International Migration Review 2021, 55, 660–687. [Google Scholar] [CrossRef]
- Governo Italiano Registrato Alla Corte Dei Conti Il 9 de Marzo de 2020 Ufficio Controllo Atti PCM Ministeri Della Giustizia e Degli Affari Esteri e Della Cooperazione Internazionale.
- République Française Décret 2020-293du 23 Mars 2020 Prescrivant Les Mesures Générales Nécessaires Pour Faire Face à L’épidémie de Covid-19 Dans Le Cadre de L’état D’urgence Sanitaire. 2020.
- Laverty, A.A.; Millett, C.; Majeed, A.; Vamos, E.P. COVID-19 Presents Opportunities and Threats to Transport and Health. J R Soc Med 2020, 113, 251–254. [Google Scholar] [CrossRef]
- Poder Judicial España Real Decreto 463/2020, de 14 de Marzo, Por El Que Se Declara El Estado de Alarma Para La Gestión de La Situación de Crisis Sanitaria Ocasionada Por El COVID-19; 2020.
- Linka, K.; Peirlinck, M.; Sahli Costabal, F.; Kuhl, E. RAPID INNOVATIVE COMMUNICATION Outbreak Dynamics of COVID-19 in Europe and the Effect of Travel Restrictions. 2020. [CrossRef]
- Comisión Europea Viajes Durante La Pandemia de Coronavirus.
- Mogaji, E. Impact of COVID-19 on Transportation in Lagos, Nigeria. Transp Res Interdiscip Perspect 2020, 6. [Google Scholar] [CrossRef]
- Badr, H.S.; Du, H.; Marshall, M.; Dong, E.; Squire, M.M.; Gardner, L.M. Association between Mobility Patterns and COVID-19 Transmission in the USA: A Mathematical Modelling Study. Lancet Infect Dis 2020, 20, 1247–1254. [Google Scholar] [CrossRef]
- Abu-Rayash, A.; Dincer, I. Analysis of Mobility Trends during the COVID-19 Coronavirus Pandemic: Exploring the Impacts on Global Aviation and Travel in Selected Cities. Energy Res Soc Sci 2020, 68. [Google Scholar] [CrossRef]
- Rankavat, S.; Gurram, A.R.; Pawar, D.S.; Kushwaha, V. Study of COVID-19 Impact on Users’ Perception for Transport Modes Choice in India. IATSS Research 2023, 47, 73–83. [Google Scholar] [CrossRef]
- Wang, K.-Y. How Change of Public Transportation Usage Reveals of the SARS Virus in a City. PLoS One 2014, 11. [Google Scholar] [CrossRef]
- Ferguson, N.M.; Cummings, D.A.T.; Cauchemez, S.; Fraser, C.; Riley, S.; Meeyai, A.; Iamsirithaworn, S.; Burke, D.S. Strategies for Containing an Emerging Influenza Pandemic in Southeast Asia. Nature 2005, 437, 209–214. [Google Scholar] [CrossRef]
- Troko, J.; Myles, P.; Gibson, J.; Hashim, A.; Enstone, J.; Kingdon, S.; Packham, C.; Amin, S.; Hayward, A.; Van-Tam, J.N. Is Public Transport a Risk Factor for Acute Respiratory Infection? BMC Infect Dis 2011, 11. [Google Scholar] [CrossRef]
- Cartenì, A.; Di Francesco, L.; Henke, I.; Marino, T.V.; Falanga, A. The Role of Public Transport during the Second Covid-19 Wave in Italy. Sustainability 2021, 13, 11905. [Google Scholar] [CrossRef]
- Muley, D.; Shahin, M.; Dias, C.; Abdullah, M. Role of Transport during Outbreak of Infectious Diseases: Evidence from the Past. Sustainability 2020, 12, 7367. [Google Scholar] [CrossRef]
- König, A.; Dreßler, A. A Mixed-Methods Analysis of Mobility Behaviour Changes in the COVID-19 Era in a Rural Case Study. European Transport Research Review 2021, 13. [Google Scholar] [CrossRef]
- Tapiador, L.; Gomez, J.; Vassallo, J.M. Exploring the Relationship between Public Transport Use and COVID-19 Infection: A Survey Data Analysis in Madrid Region. Sustain Cities Soc 2024, 104. [Google Scholar] [CrossRef]
- (I) Ministerio de la Presidencia, R. con las C. y M.D. Real Decreto 463/2020, 14 de Marzo, Por El Que Se Declara El Estado de Alarma Para La Gestión de La Situación de Crisis Sanitaria Ocasionada Por El COVID-19. 2020, núm. 67.
- Seguridad Nacional. Gabinete de la Presidencia del Gobierno El Gobierno Decreta El Estado de Alarma Para Hacer Frente a La Expansión de Coronavirus COVID-19 2020.
- Gutiérrez, A.; Miravet, D.; Domènech, A. COVID-19 and Urban Public Transport Services: Emerging Challenges and Research Agenda. Cities Health 2021, 5, S177–S180. [Google Scholar] [CrossRef]
- De Luca, C.; Tondelli, S.; Elisabeth Aberg, H. The Covid-19 Pandemic Effects in Rural Areas; 2020. [Google Scholar]
- Abellán, J.; González, E.; Rueda, F. Impacto Del COVID-19 En La Movilidad En Transporte Público En España. Revista de Movilidad y Transporte 2021, 12, 45–60. [Google Scholar]
- Sträuli, L.; Tuvikene, T.; Weicker, T.; Kębłowski, W.; Sgibnev, W.; Timko, P.; Finbom, M. Beyond Fear and Abandonment: Public Transport Resilience during the COVID-19 Pandemic. Transp Res Interdiscip Perspect 2022, 16. [Google Scholar] [CrossRef]
- Ortega Prieto; Gómez Lobo Sostenibilidad Del Transporte Interurbano Regiones Rurales de España. 2022.
- Julio Gómez-Pomar El Impacto Del Coronavirus En La Movilidad y En El Sector Del Transporte 2020.
- Ministerio de Transportes, M. y A.U. Observatorio Del Transporte y La Logística En España. Informe Anual 2022. 2023. [Google Scholar]
- Guillén-Pujadas, M.; Gutiérrez-Aragón, Ó.; Fondevila-Gascón, J.-F.; Vilajoana-Alejandre, S. Perfil de Los Usuarios Del Servicio Del Transporte de Pasajeros: Taxis y Vehículos de Transporte Con Conductor (VTC) En España Tras La Pandemia Del COVID-19. INNOVA Research Journal 2023, 8, 67–82. [Google Scholar] [CrossRef]
- Marco Dols, P.; García Crespo, H. Vista de Impacto Del COVID-19 En El Transporte Público Urbano de Las Ciudades Medias Españolas. Available online: https://revistaseug.ugr.es/index.php/cuadgeo/article/view/25345/26958 (accessed on 23 February 2024).
- Aloi, A.; Alonso, B.; Benavente, J.; Cordera, R.; Echániz, E.; González, F.; Ladisa, C.; Lezama-Romanelli, R.; López-Parra, álvaro; Mazzei, V.; et al. Effects of the COVID-19 Lockdown on Urban Mobility: Empirical Evidence from the City of Santander (Spain). Sustainability 2020, 12, 3870. [CrossRef]
- Gorbalenya, A.E.; Baker, S.C.; Baric, R.S.; de Groot, R.J.; Drosten, C.; Gulyaeva, A.A.; Haagmans, B.L.; Lauber, C.; Leontovich, A.M.; Neuman, B.W.; et al. The Species Severe Acute Respiratory Syndrome-Related Coronavirus: Classifying 2019-NCoV and Naming It SARS-CoV-2. Nat Microbiol 2020, 5, 536–544. [Google Scholar]
- Al-Akioui, A.; Monzon, A. Spatial Analysis of COVID-19 Pandemic Impacts on Mobility in Madrid Region. Sustainability 2023, 15, 14259. [Google Scholar] [CrossRef]
- Fernández Pozo, R.; Wilby, M.R.; Vinagre Díaz, J.J.; Rodríguez González, A.B. Data-Driven Analysis of the Impact of COVID-19 on Madrid’s Public Transport during Each Phase of the Pandemic. Cities 2022, 127, 103723. [Google Scholar] [CrossRef]
- González, A.B.R.; Wilby, M.R.; Díaz, J.J.V.; Pozo, R.F. Characterization of COVID-19’s Impact on Mobility and Short-Term Prediction of Public Transport Demand in a Mid-Size City in Spain. Sensors 2021, 21, 6574. [Google Scholar] [CrossRef]
- Díaz de la Rosa, E. El Impacto de La Pandemia Del Covid-19 En El Transporte Público Regular de Pasajeros Por Carretera de Tenerife. 2021.
- Facal, E.P.; Manjon, I.M.; Plasencia-Lozano, P. Impact of COVID-19 on Urban Transportation Habits in the City of Gijón. Transportation Research Procedia 2021, 58, 535–542. [Google Scholar] [CrossRef]
- Orro, A.; Novales, M.; Monteagudo, Á.; Pérez-López, J.B.; Bugarín, M.R. Impact on City Bus Transit Services of the COVID-19 Lockdown and Return to the New Normal: The Case of A Coruña (Spain). Sustainability 2020, 12, 7206. [Google Scholar] [CrossRef]
- Linares-Unamunzaga, A.; Serrano-López, R.; Rojo-Arce, M. IMPACT ON URBAN MOBILITY OF PREVENTIVE MEASURES AGAINST COVID-19 DURING THE STATE OF ALARM. THE PARTICULAR CASE OF A MEDIUM-SIZED CITY. 2021. [Google Scholar]
- Osorio Arjona, J. Analyzing Post-COVID-19 Demographic and Mobility Changes in Andalusia Using Mobile Phone Data. Sci Rep 2024, 14. [Google Scholar] [CrossRef]
- Ministerio de Transportes, M. y A.U. Análisis de La Movilidad En España Con Tecnología Big Data Durante El Estado de Alarma Para La Gestión de La Crisis Del COVID-19. 2021.
- Schiller L, P.; Kenworthy, J. An Introduction to Sustainable Transportation Policy, Planning and Implementation, 2nd ed.; Routledge, 2017. [Google Scholar]
- Barbieri, D.M.; Lou, B.; Passavanti, M.; Hui, C.; Hoff, I.; Lessa, D.A.; Sikka, G.; Chang, K.; Gupta, A.; Fang, K.; et al. Impact of COVID-19 Pandemic on Mobility in Ten Countries and Associated Perceived Risk for All Transport Modes. PLoS One 2021, 16. [Google Scholar] [CrossRef]
- Creutzig, F. How Fuel Prices Determine Public Transport Infrastructure, Modal Shares and Urban Form. Urban Clim 2014, 10, 63–76. [Google Scholar] [CrossRef]
- Organización de las Naciones Unidas Objetivos de Desarrollo Sostenible.
- Instituto Nacional de Estadística Demografía y Población. Cifras INE. 2022.
- Instituto de Estadística de Extremadura Censo 2021.
- Gutiérrez Puebla, J. Indicadores de Accesibilidad En Transporte Publico En El Medio Rural: Una Propuesta Metodológica. Estud Geogr 1991, 52, 205–221. [Google Scholar] [CrossRef]
- Camarero, L.; Oliva, J. Mobility and Territorial Cohesion. The Shaping of the Rural-Urban Mobility System. In Proceedings of the Revista Española de Investigaciones Sociológicas; Centro de Investigaciones Sociológicas, January 1 2024; pp. 23–42. [Google Scholar]
- Alloza, M.; González-Díez, V.; Moral-Benito, E.; Tello-Casas, P. Access to Services in Rural Spain. Documentos Ocasionales N.o 2122.
- Marco Dols, P.; Soriano Martí, J. Transporte Público y Despoblación En El Medio Rural: El Caso Del Interior Castellonense. Cuadernos de Geografía de la Universitat de València 2020, 29. [Google Scholar] [CrossRef]
- Porru, S.; Misso, F.E.; Pani, F.E.; Repetto, C. Smart Mobility and Public Transport: Opportunities and Challenges in Rural and Urban Areas. Journal of Traffic and Transportation Engineering (English Edition) 2020, 7, 88–97. [Google Scholar] [CrossRef]
- Frank, L.; Dirks, N.; Walther, G. Improving Rural Accessibility by Locating Multimodal Mobility Hubs. J Transp Geogr 2021, 94, 103111. [Google Scholar] [CrossRef]
- Yildirim, M.; Geçer, E.; Akgül, Ö. The Impacts of Vulnerability, Perceived Risk, and Fear on Preventive Behaviours against COVID-19; Taylor&Francias Online, 2020; pp. 35–43. [Google Scholar]
- Sträuli, L.; Tuvikene, T.; Weicker, T.; Kębłowski, W.; Sgibnev, W.; Timko, P.; Finbom, M. Beyond Fear and Abandonment: Public Transport Resilience during the COVID-19 Pandemic. Transp Res Interdiscip Perspect 2022, 16. [Google Scholar] [CrossRef]
- Dirks, N.; Frank, L.; Baumgärtner, F.; Letmathe, P.; Walther, G. Identification of Critical Public Transport Connections in Rural Areas | Identifikation Kritischer Verbindungen Des Öffentlichen Personennahverkehrs Im Ländlichen Raum. gis.Science - Die Zeitschrift fur Geoinformatik 2020, 2020, 72–80. [Google Scholar]
- Camarero, L.; Oliva Serrano, J. Exploring the Social Face of Urban Mobility Daily Mobility as Part of the Social Structure in Spain. Int J Urban Reg Res 2008, 32, 344–362. [Google Scholar] [CrossRef]
- López González, A. La-Jerarqua-de-Asentamientos-En-Castilla-y-Len-Una-Aproximacin-Desde-El-Punto-de-Vista-de-La-Dimensin-Demogrfica-Municipal-y-de-Los-Ejes-Viarios-0.
- Campisi, T.; Basbas, S.; Skoufas, A.; Akgün, N.; Ticali, D.; Tesoriere, G. The Impact of Covid-19 Pandemic on the Resilience of Sustainable Mobility in Sicily. Sustainability 2020, 12, 8829. [Google Scholar] [CrossRef]
- Mateu, G.; Sanz, A. Public Policies to Promote Sustainable Transports: Lessons from Valencia. Sustainability 2021, 13, 1141. [Google Scholar] [CrossRef]
- Cloke, P. Rural Britain: A Social Geography. Phillips, D. and Williams, A. Oxford: Blackwell, 1984. 274 Pp.£7.50 Paperback. Applied Geography 1985, 5, 259–263. [Google Scholar] [CrossRef]
- Jiménez-Espada, M.; Naranjo, J.M.V.; García, F.M.M. Identification of Mobility Patterns in Rural Areas of Low Demographic Density through Stated Preference Surveys. Applied Sciences 2022, 12, 10034. [Google Scholar] [CrossRef]
- Arranz-López, A.; Elizondo Candanedo, R.F.; Soria-Lara, J.A. An Exploratory Data Analysis Based on Open Sources Impact of the COVID-19 Pandemic on Mobility in Spain; 22 May 2024; pp. 259–279. [Google Scholar]
- Henke, I.; Pagliara, F.; Cartenì, A.; Coppola, P. The Impact of COVID-19 Pandemic on Public Transport: A Mobility Survey in Naples (South of Italy). The Open Transportation Journal 2023, 17. [Google Scholar] [CrossRef]
- Vega Naranjo, J.M.; Jiménez-Espada, M.; Martínez García, F.M.; González-Escobar, R.; Cortés-Pérez, J.P. Intercity Mobility Assessment Facing the Demographic Challenge: A Survey-Based Research. Int J Environ Res Public Health 2023, 20, 1163. [Google Scholar] [CrossRef]
- Carrel, A.L.; Li, M. Survey-Based Measurement of Transit Customer Loyalty: Evaluation of Measures and Systematic Biases. Travel Behav Soc 2019, 15, 102–112. [Google Scholar] [CrossRef]
Disclaimer/Publisher’s Note: The statements, opinions and data contained in all publications are solely those of the individual author(s) and contributor(s) and not of MDPI and/or the editor(s). MDPI and/or the editor(s) disclaim responsibility for any injury to people or property resulting from any ideas, methods, instructions or products referred to in the content. |
© 2024 by the authors. Licensee MDPI, Basel, Switzerland. This article is an open access article distributed under the terms and conditions of the Creative Commons Attribution (CC BY) license (http://creativecommons.org/licenses/by/4.0/).


