
Submitted:
26 September 2024
Posted:
27 September 2024
You are already at the latest version
Abstract
Light pollution of the night sky is a phenomenon increasingly observed around the world and reported in the form of thematic maps. The major contributor to light pollution is ill-adjusted or inappropriately designed artificial lighting by outdoor light sources. The phenomenon occurs mainly over urban areas, but affects both the urban environment and the areas adjacent to it. The problem of excessive artificial light emission at night and the negative effects it causes has already become so serious and global in its impact that effective and comprehensible methods of cartographic presentation of this phenomenon have been explored. The literature on the subject provides examples of how to present the results of measurements of light pollution of the night sky, but these have been developed using different colour scales, often in discretionary ranges and units of measurement. This paper presents an overview of the measurement scales and units found in the literature to describe the phenomenon of light pollution that obscures the night sky. A proposal of the author’s color scale for the presentation of the phenomenon was proposed and shown by example. The differences between measurement scales and how they affect interpretation of results are discussed. Furthermore, a recommendation is made for a standardised method of cartographic visualisation of the spatial distribution and presentation of light smog measurement results.
Keywords:
light pollution
; light smog
; colour scale
; cartographic visualisation
; symbolisation
1. Introduction
The natural environment in which we live is systematically exposed to degradation by various types of pollutants, mainly of anthropogenic origin, which is primarily due to civilisation and increasing globalisation. Human activity over the last few decades has contributed to significant changes in the environment, which are now being monitored and analysed. Most of these interacting factors show an increasing negative impact on the condition and quality of the functioning of living organisms. One form of progressive environmental degradation is light pollution, which affects the night sky and is an increasingly common phenomenon. The main causes of light pollution are poorly designed or implemented light sources for outdoor lighting, excessive emission of artificial light into the lower atmosphere, as well as scattering and reflection of light by clouds and particulates of anthropogenic origin [1,2,3]. This negative process can be observed over urban areas (Figure 1), but it affects both the urban environment and adjacent areas. It is estimated that about 80% of the world’s population and more than 99% of the inhabitants of the United States and Europe live in areas where the night sky is polluted by artificial light [4]. Research into excessive light emitted into the atmosphere is today an interdisciplinary challenge, requiring targeted analyses by specialists representing various scientific fields such as astronomy, biology, medicine, geography and physics. Observations have shown that the increased amount of light in the night sky entails a number of negative consequences, including the consumption of additional energy, causing unreasonable economic costs and the use of fossil resources. Light smog is also detrimental to the development and life of plants, animals and, above all, the health and well-being of humans [5,6,7,8,9]. Illumination of areas that should remain dark is yet another huge problem [1]. These include, for example, astronomical observatories, which are intended to be away from the reach of urban skyglow [10]. Existing facilities, located on the outskirts of towns and cities, are more and more exposed every year to the spatially expanding range of light islands in every direction. To protect the night sky from this negative phenomenon, so-called night sky reserves and parks are being established in some locations of the world. The International Dark-Sky Association (IDA) has taken steps to preserve and protect the night sky environment and to certify so-called dark sky places (International Dark Sky Places) in areas that meet very stringent conditions in this respect [11,12].
The importance and relevance of the issue described is further evidenced by the fact that in November 2017, UNESCO adapted a resolution to establish 16 May as the International Day of Light, the main purpose of which is to draw attention to the fact that light-based technologies and light derivatives affect the daily lives of all people and play an important role in achieving energy efficiency, mainly by limiting energy losses and reducing light pollution. These actions are crucial for preserving the dark sky serving the fundamental human right to commune with this gift of nature. The observed phenomenon of light pollution of the night sky has become such an important global issue that efforts have been made to find effective and clear methods for cartographic presentation of its intensity and distribution. Despite the growing interest in the subject, however, no formal legal or practical standards, regulations or guidelines have yet been developed to describe the phenomenon in a comprehensive way and to present its prevalence. So far, only a few European countries can boast the first legal provisions describing the magnitude of excessive light emission and recommending the maintenance of optimal night-time lighting conditions in terms of health, mainly for humans [13]. In Poland, in 2022, a group of experts from several research centres drafted a document in the form of a Memorandum intended as the beginning of a focused discussion and a contribution towards the work on the preparation of national legal regulations in this regard [14]. This does not change the fact, however, that no publicly available document has so far defined a limit value for the surface brightness of the sky or for ground illumination to adversely affect humans and other biotic elements of the natural environment. In this respect, there are also no guidelines or technical instructions on how to present the spatial distribution of the phenomenon in a coherent way that is accessible to a mass audience, including convincing and easy-to-understand cartographic visualisation methods.
In the reviewed both specialist and popular scientific literature on the subject, there are examples of satellite imagery or spatial analysis relating to the presentation of the results of measurements of artificial light pollution of the night sky, which were, however, produced using different colour scales, in discretionary ranges and units of measurement [15,16,17,18,19,20]. A consistent and conceptually coherent cartographic presentation of the spatial distribution of the night sky light pollution is an important prerequisite for its correct interpretation and analysis. The presented image should be comprehensible to all audiences, both scientists and non-expert users. It also constitutes an educational and promotional component, e.g. for those interested in the development of astrotourism or in the improvement of local outdoor environmental conditions in their immediate surroundings. The results of research on the quality of the night sky should also be presented together with other factors of environmental degradation that are included in the thematic scope of official sozological maps or other geoenvironmental maps or tourism and landscape maps.
This paper presents an overview of different methods of cartographic presentation found in the literature along with measurement scales and units used to describe the intensity of light pollution of the night sky. The paper describes the differences between the measurement scales used by researchers representing various scientific disciplines and their subsequent influence on the interpretation of results. From a practical point of view, consideration was also given to the importance of presenting the obtained results in a formal and unambiguous graphical form in accordance with the current principles of cartographic visualisation of phenomena relating to the state and quality of the natural environment and enabling the comparison of values from different locations. Finally, guidelines are proposed to standardise the hitherto divergent methods used for cartographic presentation of light smog measurement results.
2. Methods Used to Measure Light Pollution of the Night Sky
Artificial light pollution of the night sky can be measured using several different methods. There are measurement methods available only to professionals, and those that can be used by amateurs who observe the night sky as a hobby [1,16,19,20,21]. The methods used can be divided according to selected criteria. There are instrumental and observational methods. With regard to the direction of the measurements to be made, they can be divided into those where measurements are made from the ground surface upwards, mainly in the zenith direction, and the reverse, i.e. when measurements are made from a specific altitude towards the Earth’s surface. In the latter case – the measurement of the artificial light emission, it is necessary to use instruments that have a spectral sensitivity covering the entire visible light spectrum (400–700 nm). Restricting part of the electromagnetic radiation band in the recording process results in measurement errors and thus severely reduces the possibility of comparing the results.
The most common instrumental method used to measure the surface brightness of the night sky is through SQM (Sky Quality Meters) and TESS (Telescope Encoder and Sky Sensor) photometers [1,2,16,17,18,19,20,21,22,23]. These devices are available on the market in both simple manual versions and more advanced semi-automatic or automatic versions. In the former case, the user activates the measurement button and reads the value shown on the display. In the latter case, measurements are carried out automatically at a predefined, software-determined time and interval (Figure 2). The automatic method allows measurements to be made at any time and place without human presence, regardless of the prevailing weather conditions. It is designed for systematic research and monitoring over longer periods of time and allows determination of, among other things, temporal variability and trends of the analysed phenomenon. It is, however, limited by the spatial range of a single measurement, which for larger areas requires the establishment of a well-thought-out measurement network. Recently, a systematic bias in the zenith photometer data was also detected, which should be taken into account in subsequent measurements [25].
Another frequently used instrumental method is imaging the night sky with digital cameras or camcorders [26,27,28]. In this case, cameras equipped with fisheye (all-sky) lenses are also employed, allowing the entire sky to be recorded simultaneously (Figure 3) [27]. However, irrespective of the type of lens, the images taken are saved in lossless format, e.g., raw, which allows not only their qualitative evaluation, but above all further processing of the acquired material in specialised software to present the recorded data in a metric way (Figure 3) [25].
In the case of reverse registration, i.e. top-down towards the Earth’s surface, measurements of the luminous energy of the radiation emitted from the area covered by the image data acquisition are made. For this purpose, raster images acquired using remote sensing techniques, both satellite and aerial, as well as increasingly popular unmanned aerial vehicles (UAV) are used. The imagery produced in this way is used not only for qualitative analysis, but primarily for quantitative analysis, which is obtained after the process of data processing. Satellite data on the emission of artificial light from the Earth are provided by observation satellites of the DMSP, Suomi-NPP and Luojia 1-01 series [29,30,31]. These images differ in their temporal resolution, i.e. revisit period, and spatial resolution of 3 km, 1 km and 130 m, respectively. Although the first mentioned satellite is characterised by a low spatial resolution, its unquestionable advantage is the large area coverage of recording. An entire city or even a country can be visualised in a single image, and a mosaic of countable images will cover the entire globe, of course with a high generalisation of content. In the case of the Luojia 1-01 satellite, the recorded image allows for detailed analysis of local light sources. An inconvenience in temporal analyses of satellite images is the impossibility of performing registration under partial or total cloud cover. Technical specifications of instruments on board the satellites indicate that registration is performed in the incomplete spectrum of visible light, which consequently causes interpretation errors. In remote sensing of city lights, a set of discrete azimuth angles may also be required. Images taken by astronauts on the International Space Station (ISS) are also interesting (Figure 4). Night-time images of some of the world’s cities can be found in NASA’s public database. It is a good material for analysing the emission of artificial light from a given part of the Earth’s surface. Such images show light sources and their colour, but they are usually taken once and only for large communities, while the temporal variation of the phenomenon cannot be analysed on the basis of single registrations. Satellite recordings are completed by measurements made at the flight ceiling. Aerial photographs have a much higher spatial resolution, but in order to cover a larger area (e.g., a city), it is necessary to perform a surface acquisition consisting of many photographs repeated over time, which involves high costs. A currently developed alternative for very small areas (e.g., streets, housing estates) are measurements made using UAVs. Their unquestionable advantages are low data acquisition costs, high repeatability of registration and very high field resolution, which allows the identification of even a single light source (Figure 4).
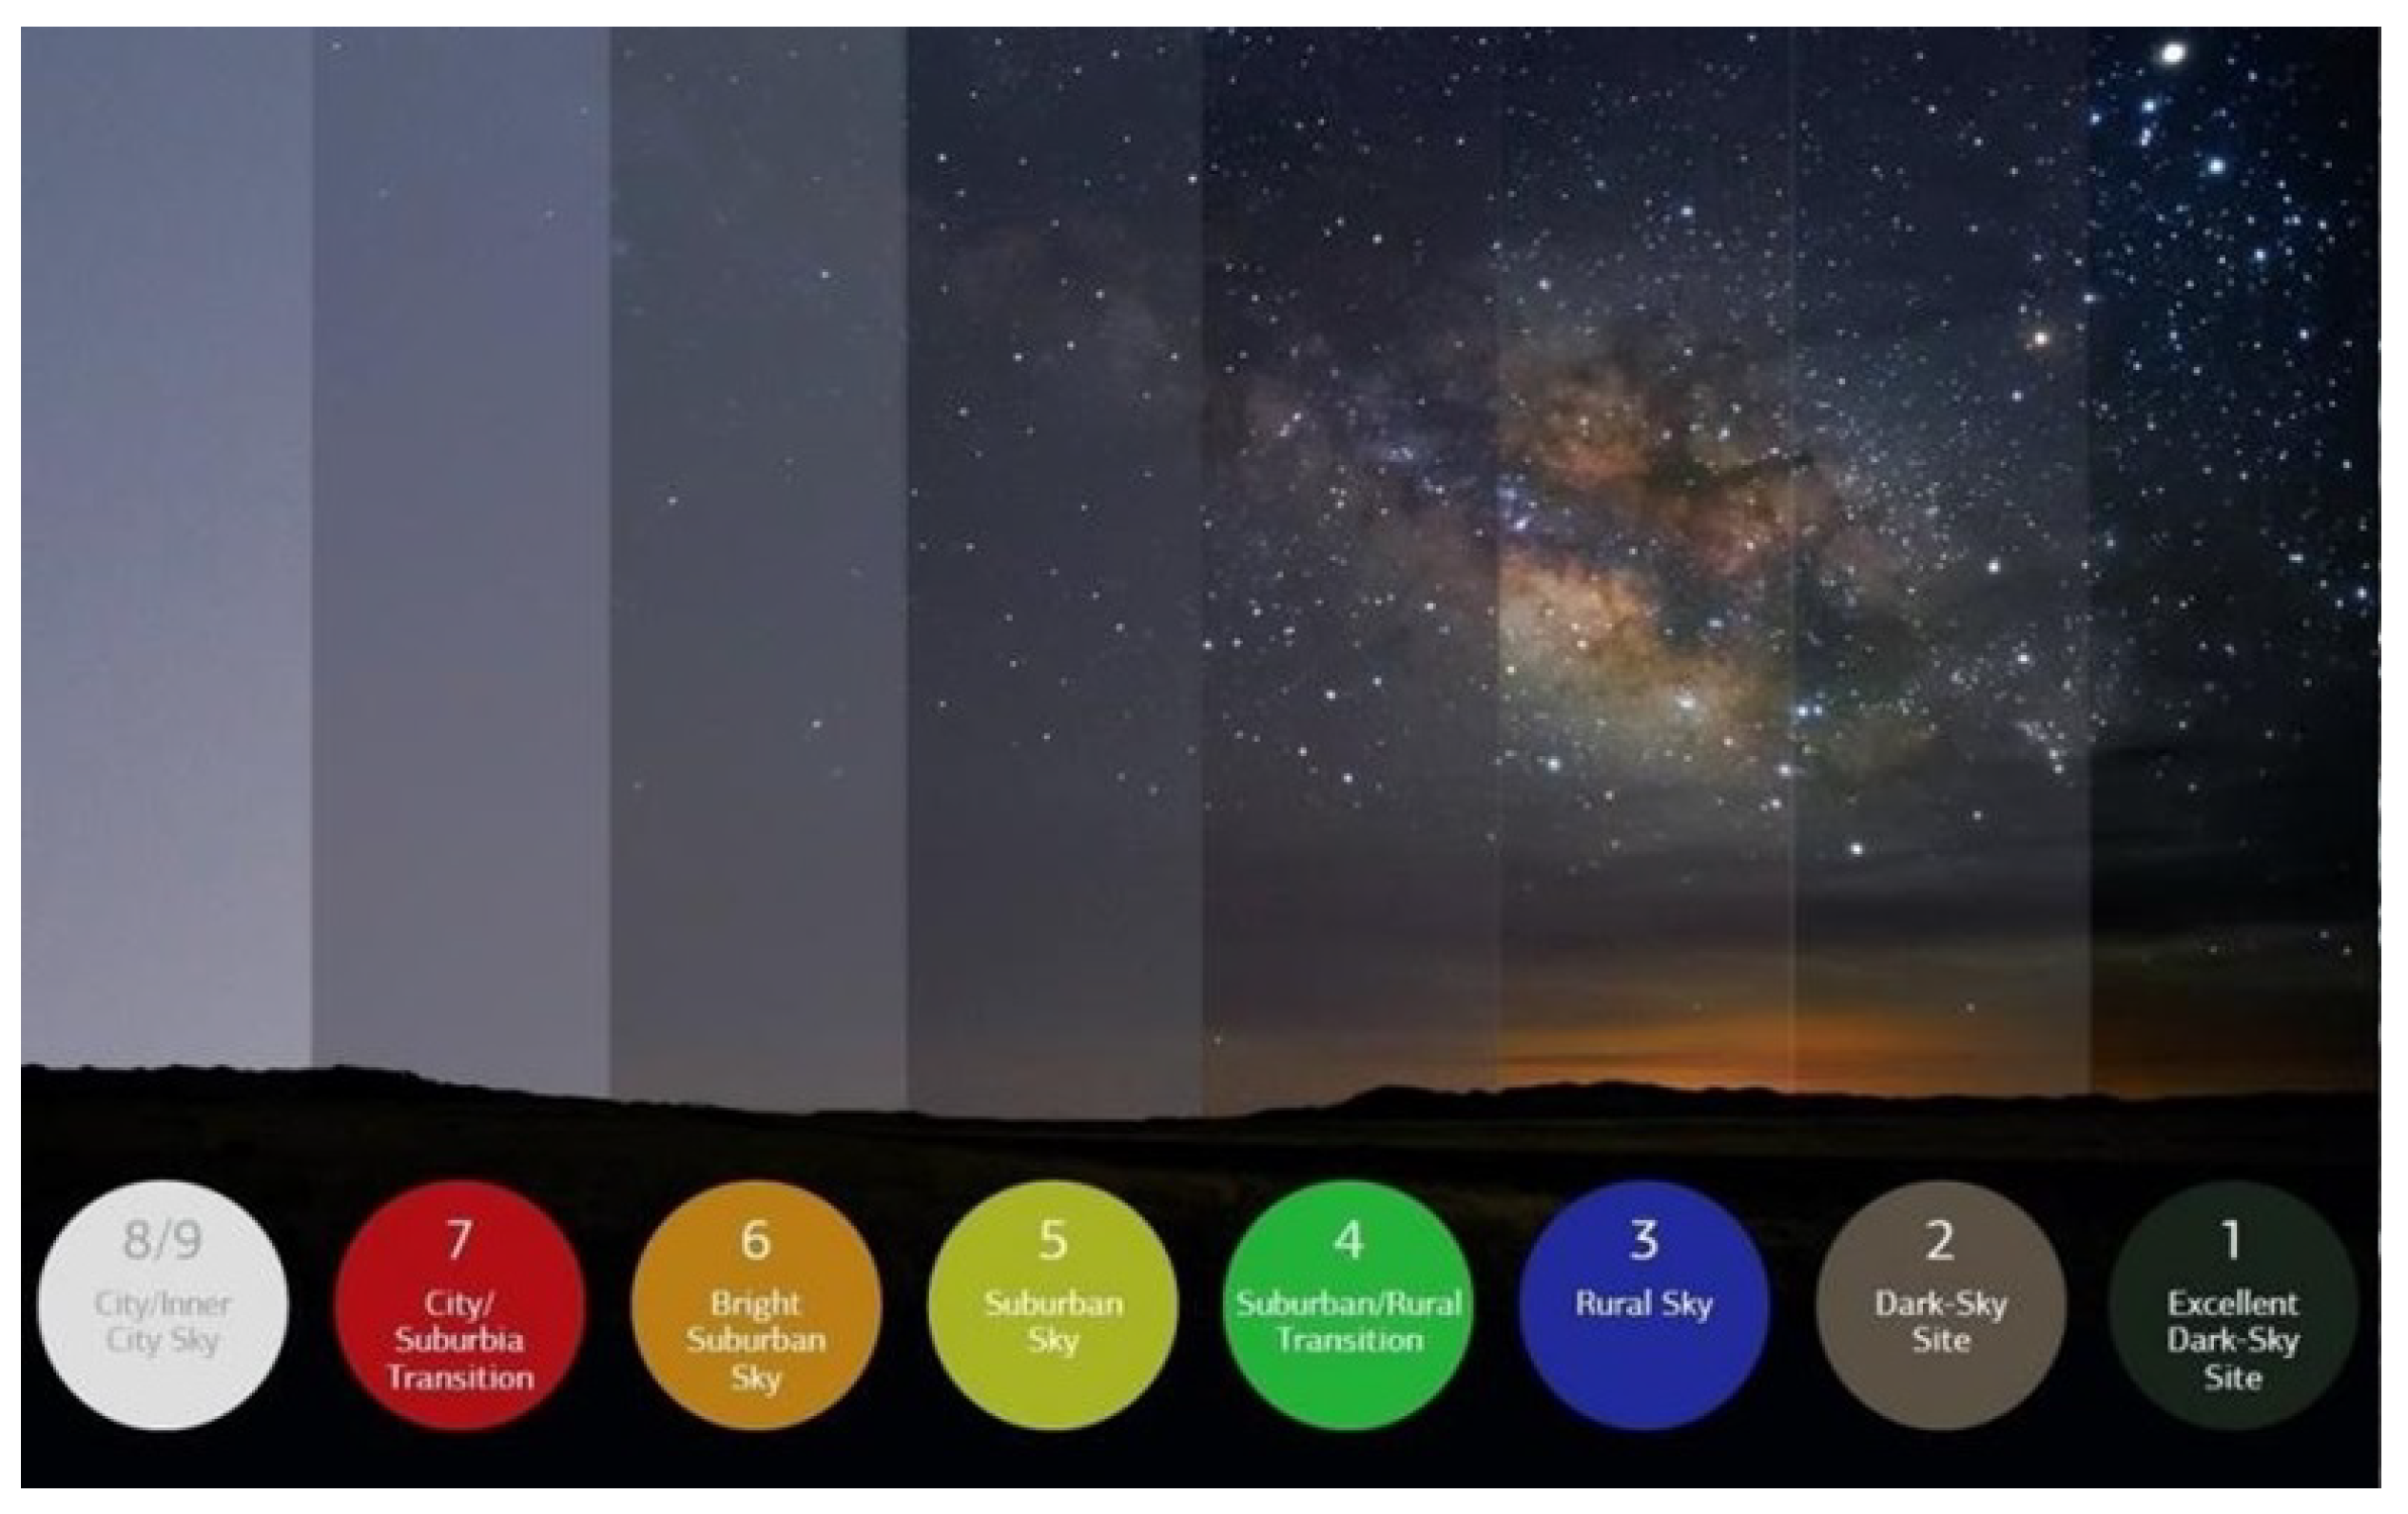
Alternative methods of measuring light pollution in the night sky include the use of available observational methods [21], of which the most commonly used, both by amateurs and professionals, is the assessment of the night sky quality. It consists in determining the degree of sky pollution by assigning the current state of objects visible in the night sky to one of the distinguished classes specified in the interpretive model (see the content of Figure 11).
3. Scales and Units of Measurements Used to Present the Phenomenon of the Night Sky Brightness
Light pollution of the night sky can be measured using the methods and data acquisition techniques described above. Data recorded using different methods for the same phenomenon are, however, presented or visualised using different scales and measurement units. The most common measurement unit describing light pollution is mag/arcse (magnitude per square arcsecond), used to represent data obtained primarily through SQM photometer measurements. This non-SI unit is commonly used in astronomy and expresses a value both on a logarithmic and inverse scale. This means that a value of 22 mag/arcse represents a dark sky with minimal luminance, without negative influence of any ground-based light source. For comparison, the night sky in largely urbanised areas is reported to have values in the range of about 14 to 16 mag/arcse[1,2,16,23]. This scale is commonly used in light pollution atlases [4,15] (Figure 5 and Figure 6). In some cases, it is additionally convertible to an SI unit representing luminance (cd/), which is a measure of intensity of incident illuminance in a given direction.
Figure 5 presents the surface brightness of the night sky in Poland published in the World Atlas of Light Pollution. A spectral scale consisting of 15 colour ranges was used for the cartographic presentation. The scale starts at a value of 22 mag/arcse, which indicates the darkest sky (unpolluted), and the intervals between the ranges correspond to the logarithmic scale. The proposed colours used in this scale start from deep black (RGB=0,0,0) and progress sequentially through blue, green, yellow red, pink, up to white (RGB=255,255,255) denoting represented values below 17.5 mag/arcse. Figure 6, on the other hand, shows an extract of a map from the Light Pollution Atlas [15]. The range breakdown was done with reference to the so-called Natural Sky Brightness (NSB) scale, which determines how many times brighter the night sky is compared to its unpolluted natural counterpart. In the original, the NSB contained half of the currently distinguished ranges with the number 3 as its limit, but it has now been supplemented with intermediate separations [4,15]. Similar to the previous legend, it is a spectral scale with 15 distinguished colour ranges. The difference between these scales is visually apparent. The separations used do not overlap, and different colour schemes were used in both scales. In the latter scale, grey is used instead of pink.
The methodology of visualizing the phenomenon of the night sky pollution used in the Light Pollution Atlas was employed to present the content on the Astrotourism Map of Lower Silesia. Prepared only in the Polish language version, the thematic portal is used to disseminate knowledge about the light smog phenomenon and its spatial extent to a wide group of end users (Figure 7). The legend designed for the portal partly corresponds to the scale shown in Figure 7, but has different ranges of defined values and corresponding colours assigned to them. For some data resources, radiance is used as an information scale representing the level of light pollution in the night sky, which quantitatively shows the viewer how much light is emitted by a given surface per unit projected area per unit solid angle (W/(csr)). An example of the use of such a scale is the map in Figure 8 created from night images recorded by the Suomi NPP satellite [32]. The scale used in the legend of this figure is divided into 14 unequal colour ranges and starts with a value of 0 (black, RGB=0,0,0). The colour scheme used in this case is similar to the first two scales, but ends with the colour red marking areas with a high radiance of more than 150 * W/csr. Another example of presenting the radiance imaged by the same satellite (Suomi NPP) are the data presented on the WorldView thematic portal, which provides daily access to recorded imagery data, including night-time satellite imageries (Figure 9). The scale of units used on this platform comprises values between 0 and 38.2 W/(csr), where 0 is represented by the black colour (RGB=0,0,0) and denotes areas without light emission sources, while values above the upper limit are represented by white (RGB=255,255,255). The intermediate values are represented in continuous grey tones. Compared to the scale discussed previously, which represents sky pollution in the form of radiance, this scale has a smaller range of separations and a different colour scheme for the presented values. In addition, the intervals are not clearly separated by defining their specific boundary values.
Not only radiometric analyses of the recorded imagery, but also individual daily images taken by the Suomi NPP satellite are posted on the Worldview thematic portal. These images are taken in shades of grey, with black indicating areas without external illumination, while white represents illuminated urban areas within their limits (Figure 10).
Another method of assessing the phenomenon used by people dealing with light pollution is the Bortle scale [21], which is used to assess the quality of the night sky during typical astronomical observations. This scale distinguishes nine classes represented by eight colour ranges (class 8 and 9 are jointly characterised by the white colour). Each of the classes denotes the level and range of visibility of astronomical objects specified in the model (Figure 11).
Figure 11.
Photograph of the night sky as seen from locations with different intensities of light pollution in the sky presented using the Bortle scale (source: https://worldview.earthdata.nasa.gov/).
Figure 11.
Photograph of the night sky as seen from locations with different intensities of light pollution in the sky presented using the Bortle scale (source: https://worldview.earthdata.nasa.gov/).
All the methods of cartographic visualisation of night sky pollution by artificial light presented above are employed in available publications and are used to carry out further analyses of both quantitative and qualitative nature [4,16,19,20,24,27,30,31,32]. A cognitive and interpretation problem is the presentation of the same registration results using different metric units, of which often even the nomenclature is not formally standardised. An additional problem is the important issue of developing a suitable algorithm for converting units from one system to another.
Figure 12 presents an approximate comparison of all the scales discussed, which shows both common features and clear differences between the visualisations used. In all cases, the most important similarity is that the colour scale begins with the same colour – black, which corresponds to the unpolluted sky. In most cases, the value on the opposite side of the scale, denoting the most light-polluted area, is also similar. When looking at the details of the presented comparison, one can see a different approach to the issue. Each visualisation has a different number of distinguished ranges or definitions of their boundaries, even when the same measurement unit was used. This consequently affects the colours used to differentiate classes of values and the number of colours used. It is also worth paying attention to the fact that the presented colour scales do not satisfy some criteria which are intended to simplify scientific communication [33,34].
4. Proposal of Cartographic Symbols for Selected Thematic Studies Presenting Information on Night Sky Light Pollution
Based on several years of their own experience and field observations, as well as the literature survey, the authors of this study recommend adopting a standardised methodology for visualising artificial light pollution of the night sky. From a pragmatic point of view in the current research, the most legible measurement scale is the one based on the unit referred to as magnitude per square arcsecond – mag/arcse, which is widely used by various research groups, and has a practical rationale. However, the authors acknowledge that in the future it will also be necessary to take into account another scale, preferably based on SI units. The ranges or boundaries of divisions proposed below could be converted to the selected scale.
The scale adopted should be open on both sides and allow for the possibility of both larger and smaller values. The first value starting the scale should be close to 22 mag/arcse, as shown in the previously mentioned visualisation examples, and the range of separations should be based on pragmatic aspects. The highest value represents a dark night sky free of any external light sources [4,15,16]. Whereas the other end of the scale should have additional separations due to the fact that the sky brightness measured in towns and cities can be as low as 14–15 mag/arcse, which, in the case when the last interval ends at about 17.5 mag/arcse, makes it impossible to present differences in sky brightness between selected urban agglomerations [16,17,23]. Without this additional separation, all major cities around the world are homogeneous and similar in perception in the presented visualisations, which is not congruent with reality. It is also necessary to adopt standardised ranges of values. In the published materials related to the brightness of the night sky, significant measurement values were identified in the course of different activities, which could become limit values and serve to create standardised ranges for all visualisations. These include the following values at the upper end of the scale:
- 21.6 mag/arcse – corresponding to the mean value of sky brightness below the atmosphere [4];
- 21.2 mag/arcse – describing conditions corresponding approximately to the zenith luminosity of the visible spectrum [12];
- 20.21 mag/arcse – defining a sky unpolluted by artificial light, but with the presence of a full moon [4];
- 19.72 mag/arcse – describing a dark sky that occurs at the end of nautical twilight; people living in an area with this level of sky brightness do not experience conditions resembling a real night [4];
- 18.89 mag/arcse – this value is considered the limit for night time adaptation by human eyes [15].
In next stages, further refinement of the visualisation scale below the value of 18 mag/arcse is necessary. It is known that in highly urbanised areas the values recorded are below 17 mag/arcse, but can also assume a registration range as low as 14.5 mag/arsce [16,23,35]. It is therefore necessary to define more ranges covering this lower range of values.
Scientists, especially practitioners involved in studies of public health and the functioning of living organisms in a highly transformed natural environment, are also faced with the challenge of attempting to accurately determine a limit value or range of limit values that define a safe level of light pollution for the health and functioning of man. Such an attempt would help to make everyone on the planet aware of how many of us live in areas characterised by the negative and oppressive impact of artificial night light, and of the effects this has on the coexistence of civilisation-related diseases caused indirectly by this phenomenon. This would also be important for the development of future technical conditions for conducting measurements of the phenomenon, its monitoring over time, and establishing standards related to the number of times when the set limits are exceeded in a given period (e.g., a year or season) resulting in the announcement of a warning condition, an alert, and remedial action. Based on their experience, the authors of this study suggest that, depending on the established ranges, the colour black to blue defines measurement values that reflect conditions conducive to human well-being and well-functioning. Such a distribution of colours corresponds to the range from natural night sky conditions, i.e. those without the presence of external light sources, to the brightness values occurring during a night with a full moon. For the range of values defining the natural nocturnal adaptation capabilities of the human eye, colours describing nature should be used (e.g., green), while measurements showing values below this threshold should, by definition, alert the reader through yellow and red colours that the parameters are exceeded. The use of the author’s colour layout proposal (Figure 13) increases the readability of the cartographic visualization and makes it possible for any user to correctly interpret the results presented on the map. In addition, the proposed range of ranges better corresponds to the variability of the phenomenon, especially for urban areas, and makes it possible to compare different areas. Thus, despite the use of different measurement units, they can be unified and visually presented in this way.
The above proposals relate to the visualisation of the phenomenon of light pollution of the night sky, which, due to the method of measurement and data organisation (raster model in the case of remote sensing data or vector model, or raster model as a result of interpolation of results collected from a distributed ground-based network of sensors) has surface coverage. In many situations, however, measurements are carried out only at single recording sites and the results of such observations need to be clearly presented using point symbols at the location of the phenomenon. In addition, depending on the scale of a thematic map and the adopted generalisation of the content, a communication should comply with the applicable technical guidelines. This is the case with the official Sozological Map of Poland, published at a scale of 1:50,000 and covering the entire territory of the country [36]. This targeted thematic resource presents the state of the natural environment and the causes and effects of transformations taking place therein under the influence of miscellaneous processes, mainly of anthropogenic origin [37]. The thematic content consists of six levels of information, including the most extensive one on the degradation of environmental components. The content of the legend of this section is divided in detail according to the object of analysis into: degradation of the land surface, forests, surface water, groundwater and degradation of atmospheric air. The latter group allows for the inclusion of information on light smog. Therefore, the section “Degradation of atmospheric air” in the legend of the official sozological map should include a symbol of an excessive outdoor lighting emitter (Figure 14). This calls for supplementing the content of the GIS-4 Technical Guidelines in force since 2005 [37], not only in terms of standardised symbolisation contained in the map legend, but also in the descriptive section together with definitions, and introducing this supplement into extensive scientific commentaries on these resources being created at the same time. Consideration should also be given as to whether poorly designed extensive architectural illuminations and other significant light sources whose main direction of emission is upwards or sideways rather than downwards (e.g. large greenhouses) should be added to the list of projects likely to have a significant impact on the environment. When modern lighting solutions are applied by city authorities, e.g. the replacement of sodium street lamps, which are still common today, by LED street lamps, such information should be marked as part of the prevention of environmental degradation.
The processed information on light pollution and referenced locally as point symbols should also be included in the content structure of small-scale maps, especially tourist maps or tourist-landscape maps. This applies in particular to the situation where recipients of such a study are informed of places where it is possible to observe the night sky in conditions of natural darkness, i.e. the sky not polluted by artificial light. Such information should be included not only on tourist maps, but also in tourist and landscape guidebooks or promotional materials prepared for given areas with the objective to promote and develop astrotourism. The recommended location of places with optimal conditions for observing the night sky would be an incentive for the development of this form of activity and a unique distinguishing mark of a given area for those seeking such challenges. The point symbols proposed for this thematic scope are presented in Figure 15. This would also be a contribution to the development of a completely new series of thematic maps on astrotourism with the identification of potential sites for this type of activity, including the location of astronomical observatories or school astrobases, as well as the boundaries of night sky protection areas or those aspiring to this distinction.
The aforementioned maps and portals or prepared thematic guides could also be supplemented with a symbol indicating areas with high pollution of the night sky by artificial light, where observation of constellations or systems of celestial bodies known from descriptions and astronomical guides is not possible (Figure 16). Such measures would primarily have an educational aspect, helping to promote awareness of the phenomenon of light pollution in the night sky, and this in turn should contribute to improving lighting conditions in designated areas. These types of symbols could be used to mark cities or their districts that are unfriendly to astrotourism.
As shown above, colour and brightness from Bertin’s graphic variables [38] are used for surface visualisation of spatial data on artificial light pollution in the night sky, and additionally size and shape for point symbols.
5. Discussion and Conclusions
Such a diverse approach to the visualisation of data related to the level of artificial light pollution in the night sky found in the specialist literature causes great problems in the proper interpretation of data for all those interested in the subject, and in further analysis of the phenomenon results in great difficulties in comparing the data and proper final conclusions. The authors of the study are of the opinion that it is necessary to start thorough methodological work on a standardised description of the issue through discussions involving specialists representing different scientific fields and studying the same phenomenon from different angles and viewpoints applying different approaches and methods. The above measures should serve as a first step to start work on standardising the content of spatial resources concerning the representation of the phenomenon of light pollution in the sky, affecting both directly over urban areas and places distant from population centres. It is suggested that both the measurement system and the single unit used to record light smog levels should be standardised, so that the data submitted for further analysis are comprehensible to all users and clear to the recipients of the resulting cartographic studies. A subsequent step should involve an analysis of technical guidelines for outdoor lighting used and taken into account by various professional sectors, which would ultimately allow coherent and up-to-date legal provisions to be presented with comments and interpretations.
Light pollution of the night sky is an environmental degradation that increasingly affects humans in particular. A growing group of interdisciplinary scientists all over the world carry out numerous measurements and related work on this issue. There is a growing public interest, especially in larger urban areas, in understanding and counteracting the causes and effectively monitoring its intensity and extent. Despite this, many European countries have so far failed to implement legislation on the excessive emission of artificial light at night. There are, however, several different measurement methods that measure the magnitude of this pollution, but none of them is legally recognised as suitable for this type of study. The cartographic visualization of the measurement results is problematic and inconsistent in terms of content. In each group of measurement methods, results are obtained in different measurement units and presented using more or less different scales with non-standardised and sometimes incomprehensible ranges. The availability of various measurement methods is undoubtedly an advantage in gaining a more comprehensive understanding of this phenomenon, but it is incumbent on cartographers to ensure that the information conveyed is clear and that a correct interpretation layer is created. From this perspective, while respecting and preserving the multisource nature of measurement data, it is very important to enable the conversion of a given unit (even in an adopted approximation) into other units or comparing them while leaving their physical characteristics unchanged used in similar measurements, so that ultimately, when analysing the collected material from different studies, there are no doubts regarding their interpretation. The standardisation of the scale of presentation and the boundaries of separations should be flexible enough in its application so that the final colour scheme adopted is uniform for the result obtained in a given area where data acquisition is carried out, regardless of the measurement method used.
Excessive emission of artificial light at night is such a major issue today that it will have to be taken into account in guidelines for new series of environmental maps and thematic studies, as well as geoportal resources providing information on the quality of the natural environment. It is also an element that is increasingly included in guidelines for environmental analyses and planning documents. For this reason, starting a discussion on the development of norms and standards of cartographic presentation for the phenomenon of artificial light pollution of the night sky, measured by different methods, would seem highly justified. In this process, one must not forget about tourists or people with visual impairments. Such measures will not only provide for the marking of night sky observation sites or the improvement and targeting of graphic information for a proper understanding of this negative phenomenon, its magnitude and impact on the health and functioning of all living organisms, but also for the targeted education at all age levels.
Author Contributions
All authors have read and agreed to the published version of the manuscript.
Funding
This research received no external funding
Data Availability Statement
The data that support the findings of this study are public available. These data were derived from the following resources available in the public domain:
Conflicts of Interest
The authors declare no conflicts of interest.
References
- Kołomański, S. Zanieczyszczenie światłem i ciemność [Light pollution and darkness]. In: Wiśniewska M.R., Tomasik K. (ed.), Przejdź na ciemną stronę nocy. Środowiskowe i społeczne skutki zanieczyszczenia światłem [Go to the dark side of the night. Environmental and social effects of light pollution]. Wyd. Uniwersytetu Warszawskiego. Warszawa: 2010, pp. 29–46.
- Ściężor, T. (2020). The impact of clouds on the brightness of the night sky. Journal of Quantum Spectroscopy and Radiative Transfer, 2021, 247. [CrossRef]
- Ściężor, T.; Czaplicka, A. The impact of atmospheric aerosol particles on the brightness of the night sky. Journal of Quantitative Spectroscopy and Radiative Transfer, 2020, 254, 107168. [CrossRef]
- Cinzano, P.; Falchi, P.F.; Elvidge, C.D. The first World Atlas of the artificial night sky brightness, Monthly Notices of the Royal Astronomical Society, 2001, 328, pp. 689–707. [CrossRef]
- Connors, B.M.; McConnell, A.; Routledge, R. (2010). Effect of artificial light on marine invertebrate and fish abundance in an area of salmon farming. Marine Ecology Progress, 2010, 419, pp. 147–156. [CrossRef]
- Falchi, F.; Cinzano, P.; Elvidge, C.; Keith, D.; Haim, A. Limiting the impact of light pollution on human health, environment and stellar visibility. Journal of Environmental Management, 2011, 92, pp. 2714–2722. [CrossRef]
- Garcia-Saenz, A.; Sanchez de Miguel, A.; Espinosa, A.; Crespo, A.; Aragonés, N.; Llorca, J.; Amiano, P.; Martín, V.; Guevara, M.; Capelo, R.; Tardón, A.; Peiró, R.; Jiménez-Moleón, J.; Roca Barcelo, A.; Perez-Gomez, B.; Dierssen-Sotos, T.; Fernández, T.; Moreno-Iribas, C.; Moreno, V.; Kogevinas, M. Evaluating the association between artificial light-at-night exposure and breast and prostate cancer risk in Spain (mcc-spain study). Environmental Health Perspectives, 2018, 126. [CrossRef]
- Jones, J.; Francis, C.M. (2003). The effects of light characteristics on avian mortality at lighthouses. Journal of Avian Biology. 2003, 34, pp. 328–333. [CrossRef]
- Stevens, R.G. Light-at-night, circadian disruption and breast cancer: Assessment of existing evidence. International Journal of Epidemiology,38, 2009, pp.1–8. [CrossRef]
- Falchi, F.; Ramos, F.; Bará, S.; Sanhueza, P.; Arancibia, M.J.; Damke, G.; Cinzano, P. Light pollution indicators for all the major astronomical observatories, Monthly Notices of the Royal Astronomical Society, 2023, 519(1), pp. 26–33. [CrossRef]
- Karpińska, D.; Kunz, M. Ochrona nocnego nieba - wyzwanie dla Rezerwatu Biosfery Bory Tucholskie [Protection of the night sky – a challenge for the Tuchola Forest Biosphere Reserve] In: Rola i funkcjonowanie parków krajobrazowych w rezerwatach biosfery [The role and functioning of landscape parks in biosphere reserves] / Kunz Mieczysław (red.), Toruń, Wyd. Naukowe Uniwersytetu Mikołaja Kopernika w Toruniu, 2020, pp. 329–346, ISBN 978-83-231-4480-9.
- International Dark-Sky Association, 2022. The International Dark Sky Places conservation program recognizes and promotes excellent stewardship of the night sky. Available online: https://www.darksky.org/our-work/conservation/idsp/ (access: 29.12.2022).
- Ministry of the Environment of the Czech Republic. 2022. Light pollution reduction measures in Europe.
- Szlachetko, K. red.Memorandum w sprawie ustanowienia prawnych podstaw zrównoważonej polityki oświetlenia zewnętrznego. [Memorandum on establishing the legal basis for a sustainable outdoor lighting policy] Instytut Metropolitarny, Gdańsk, 2022, 48 p.
- Falchi, F.; Cinzano, P.; Duriscoe, D.; Kyba, C.C.M.; Elvidge, C.D.; Baugh, K.; Portnov, B.A.; Rybnikova, N.A.; Furgoni, R. (2016). The new world atlas of artificial night sky brightness. Science Advances, 2013, 2. [CrossRef]
- Hänel, A., Posch, T., Ribas, S.J., Aubé, M., Duriscoe, D., Jechow, A., Kolláth, Z., Lolkema, D.E., Moore, C., Schmidt, N., Spoelstra, H., Wuchterl, G., & Kyba, C.C.M. Measuring night sky brightness: Methods and challenges. Journal of Quantitative Spectroscopy and Radiative Transfer,2017, 205, 278–290. [CrossRef]
- Karpińska, D.; Kunz, M. Light pollution in the night sky of Toruń in the summer season. Bulletin of Geography. Physical Geography Series, 2019, 17, pp. 91–100. [CrossRef]
- Kolláth Z. Measuring and modelling light pollution at the Zselic Starry Sky Park. Journal of Physics Conference Series, 2010, 218(1), 012001. [CrossRef]
- Levin, N.; Kyba, C.C.M.; Zhang, Q.; Sánchez de Miguel, A.; Román, M.O.; Li X.; Portnov, B.A.; Molthan, A.L.; Jechow, A.; Miller, S.D.; Wang, Z.; Shrestha, R.M.; Elvidge, C.D. Remote sensing of night lights: A review and an outlook for the future, Remote Sensing of Environment, 2020, 237. [CrossRef]
- Mander, S., Alam, F., Lovreglio, R., & Ooi, M. (2023). How to measure light pollution – a systematic review of methods and applications, Sustainable Cities and Society, 2023. [CrossRef]
- Ściężor, T. Metody pomiaru jasności nocnego nieba (Methods of measuring the brightness of the night sky). 2021. Online: http://lightpollution.pk.edu.pl/SOCN/metody.php (accessed 10 December 2021).
- Karpińska, D.; Kunz, M. Device for automatic measurement of light pollution of the night sky, Scientific Reports, 2022, 12, 16476. [CrossRef]
- Karpińska, D.; Kunz, M. Analysis of light pollution of the night sky in Toruń (Poland). Civil and Environmental Engineering Reports, 2020, 30(4), pp. 155–172. [CrossRef]
- Ściężor, T. Effect of Street Lighting on the Urban and Rural Night-Time Radiance and the Brightness of the Night Sky. Remote Sens., 2021, 13, 1654. [CrossRef]
- Kocifaj, M.; Kómar, L.; Lamphar, H; et al. A systematic light pollution modelling bias in present night sky brightness predictions. Nat Astron, 2023, 7, pp. 269–279. [CrossRef]
- Jechow, A.; Hölker, F.; & Kyba, C.C.M. Using all-sky differential photometry to investigate how nocturnal clouds darken the night sky in rural areas. Scientific Reports, 2019, 9, 1391. [CrossRef]
- Jechow, A.; Kolláth, Z.; Ribas, S.J.; et al. Imaging and mapping the impact of clouds on skyglow with all-sky photometry. Scientific Reports, 2017, 7, 6741. [CrossRef]
- Jechow, A.; Kyba, C.C.M.; Kolláth, Z.; Lerner, A.; Hänel, A.; Shashar, N.; Hölker, F. Measuring light pollution with fisheye lens imagery from a moving boat, a proof of concept. International Journal of Sustainable Lighting, 2017, 36(1), 15–255. [CrossRef]
- Cinzano, P.; Falchi, F.; Elvidge, C.D.; Baugh, K.E.The artificial night sky brightness mapped from DMSP satellite Operational Linescan System measurements. Monthly Notices of the Royal Astronomical Society, 2000, 318, pp. 641–657. [CrossRef]
- Elvidge, C.D.; Baugh, K.E.; Zhizhin, M.; Hsu, F.C. (2013). Why VIIRS data are superior to DMSP for mapping nighttime lights, Proceedings of the Asia-Pacific Advanced Network, 2013, 35, p. 62.
- Zhang C., Pei Y., Li J., Qin Q., & Yue J. Application of Luojia 1-01 Nighttime Images for Detecting the Light Changes for the 2019 Spring Festival in Western Cities, Remote Sensing, 2020, 12, 1416.
- VIIRS-NASA. Light Pollution Map, Available online: https://www.lightpollutionmap.info, (access: 29.12.2022).
- Crameri, F.; Shephard, G.E.; Heron, P.J. The misuse of colour in science communication. Nat Commun, 2020, 11, 5444. [CrossRef]
- Moreland, K. Why We Use Bad Color Maps and What You Can Do About It, in Proc. IS&T Int’l. Symp. on Electronic Imaging: Human Vision and Electronic Imaging, 2016. [CrossRef]
- Ściężor, T.; Kubala, M.; Kaszowski, W.; Dworak, T.Z. Zanieczyszczenie świetlne nocnego nieba w obszarze aglomeracji krakowskiej. Analiza pomiarów sztucznej poświaty niebieskiej. [Light pollution of the night sky in the area of the Kraków agglomeration. Analysis of artificial blueglow measurements]. Wyd. Politechniki Krakowskiej. Kraków. 2010.
- Pasławski, J. O mapach środowiska naturalnego Polski w skali 1:50 000 [Maps on natural environment of Poland 1:50 000] in: Znaczenie badań krajobrazowych dla zrównoważonego rozwoju [The role of landscape studies for sustainable development] UW, Warszawa.2016, pp.283–299.
- GIS-4. Mapa sozologiczna Polski w skali 1:50 000. Wytyczne Technicze [Sozological map of Poland in the scale of 1:50,000. Technical Guidelines] 2005, GUGiK, Warszawa, 58 p.
- Bertin, J. Semiologie graphique. Les diagrammes, les reseaux, les cartes, Mouton et Gouthier-Villars, La Haye–Paris, 1967.
Figure 1.
Night panorama of Toruń taken from the UAV board showing the described phenomenon of light smog in urban areas (photo by Mieczysław Kunz).
Figure 1.
Night panorama of Toruń taken from the UAV board showing the described phenomenon of light smog in urban areas (photo by Mieczysław Kunz).
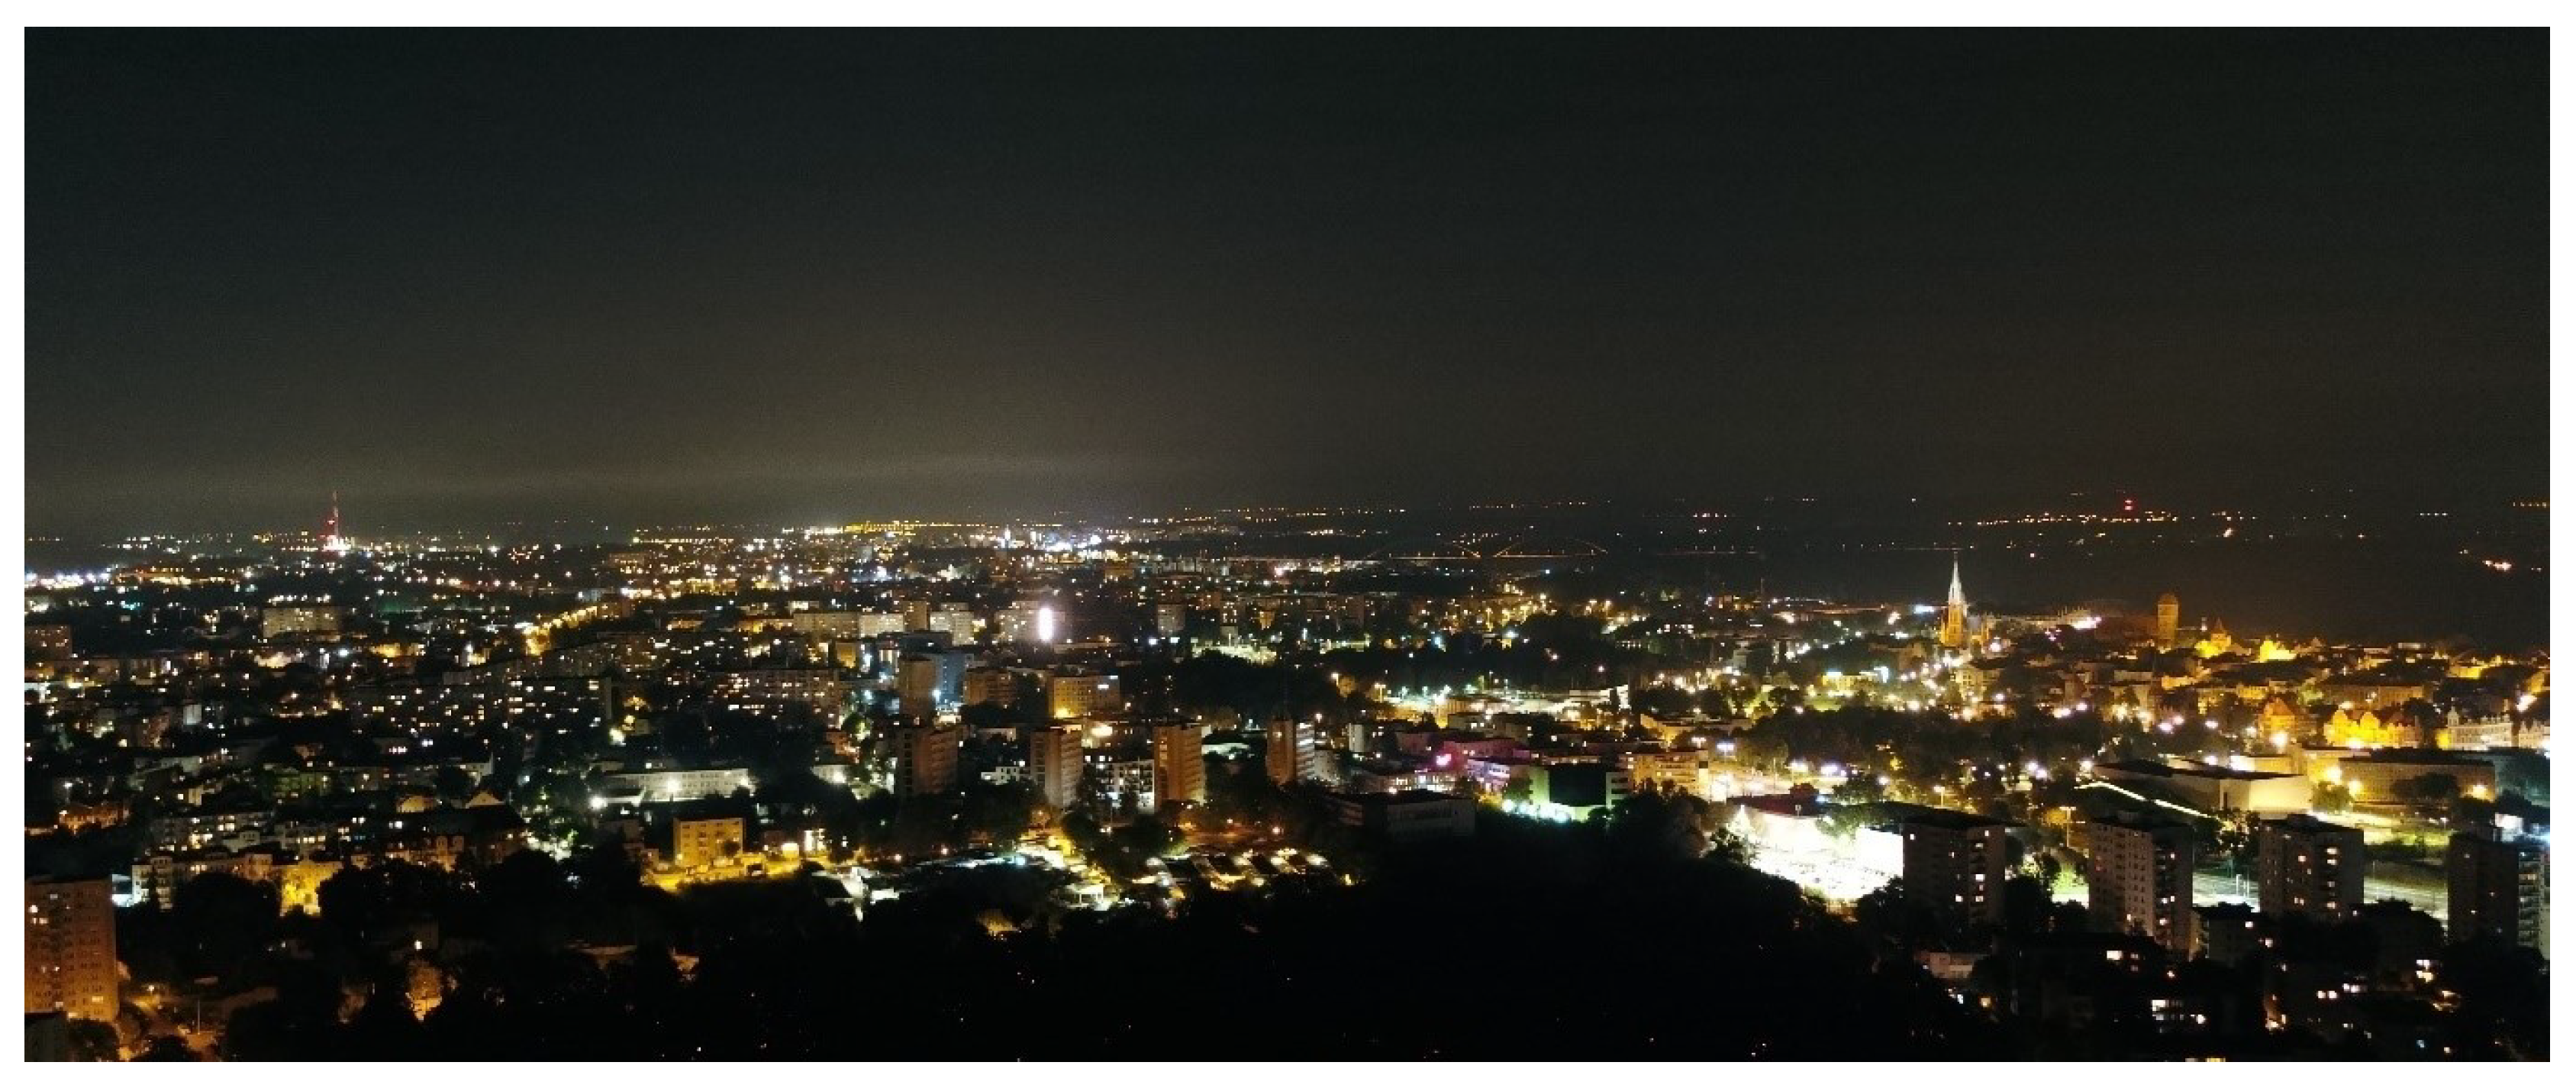
Figure 2.
View of the hand-held SQM photometer (left, photo by Dominika Daab) and the automatic SQM photometer in the L version mounted on the observation deck of the Faculty of Earth Sciences and Spatial Management, Nicolaus Copernicus University in Toruń (right, photo by Mieczysław Kunz).
Figure 2.
View of the hand-held SQM photometer (left, photo by Dominika Daab) and the automatic SQM photometer in the L version mounted on the observation deck of the Faculty of Earth Sciences and Spatial Management, Nicolaus Copernicus University in Toruń (right, photo by Mieczysław Kunz).
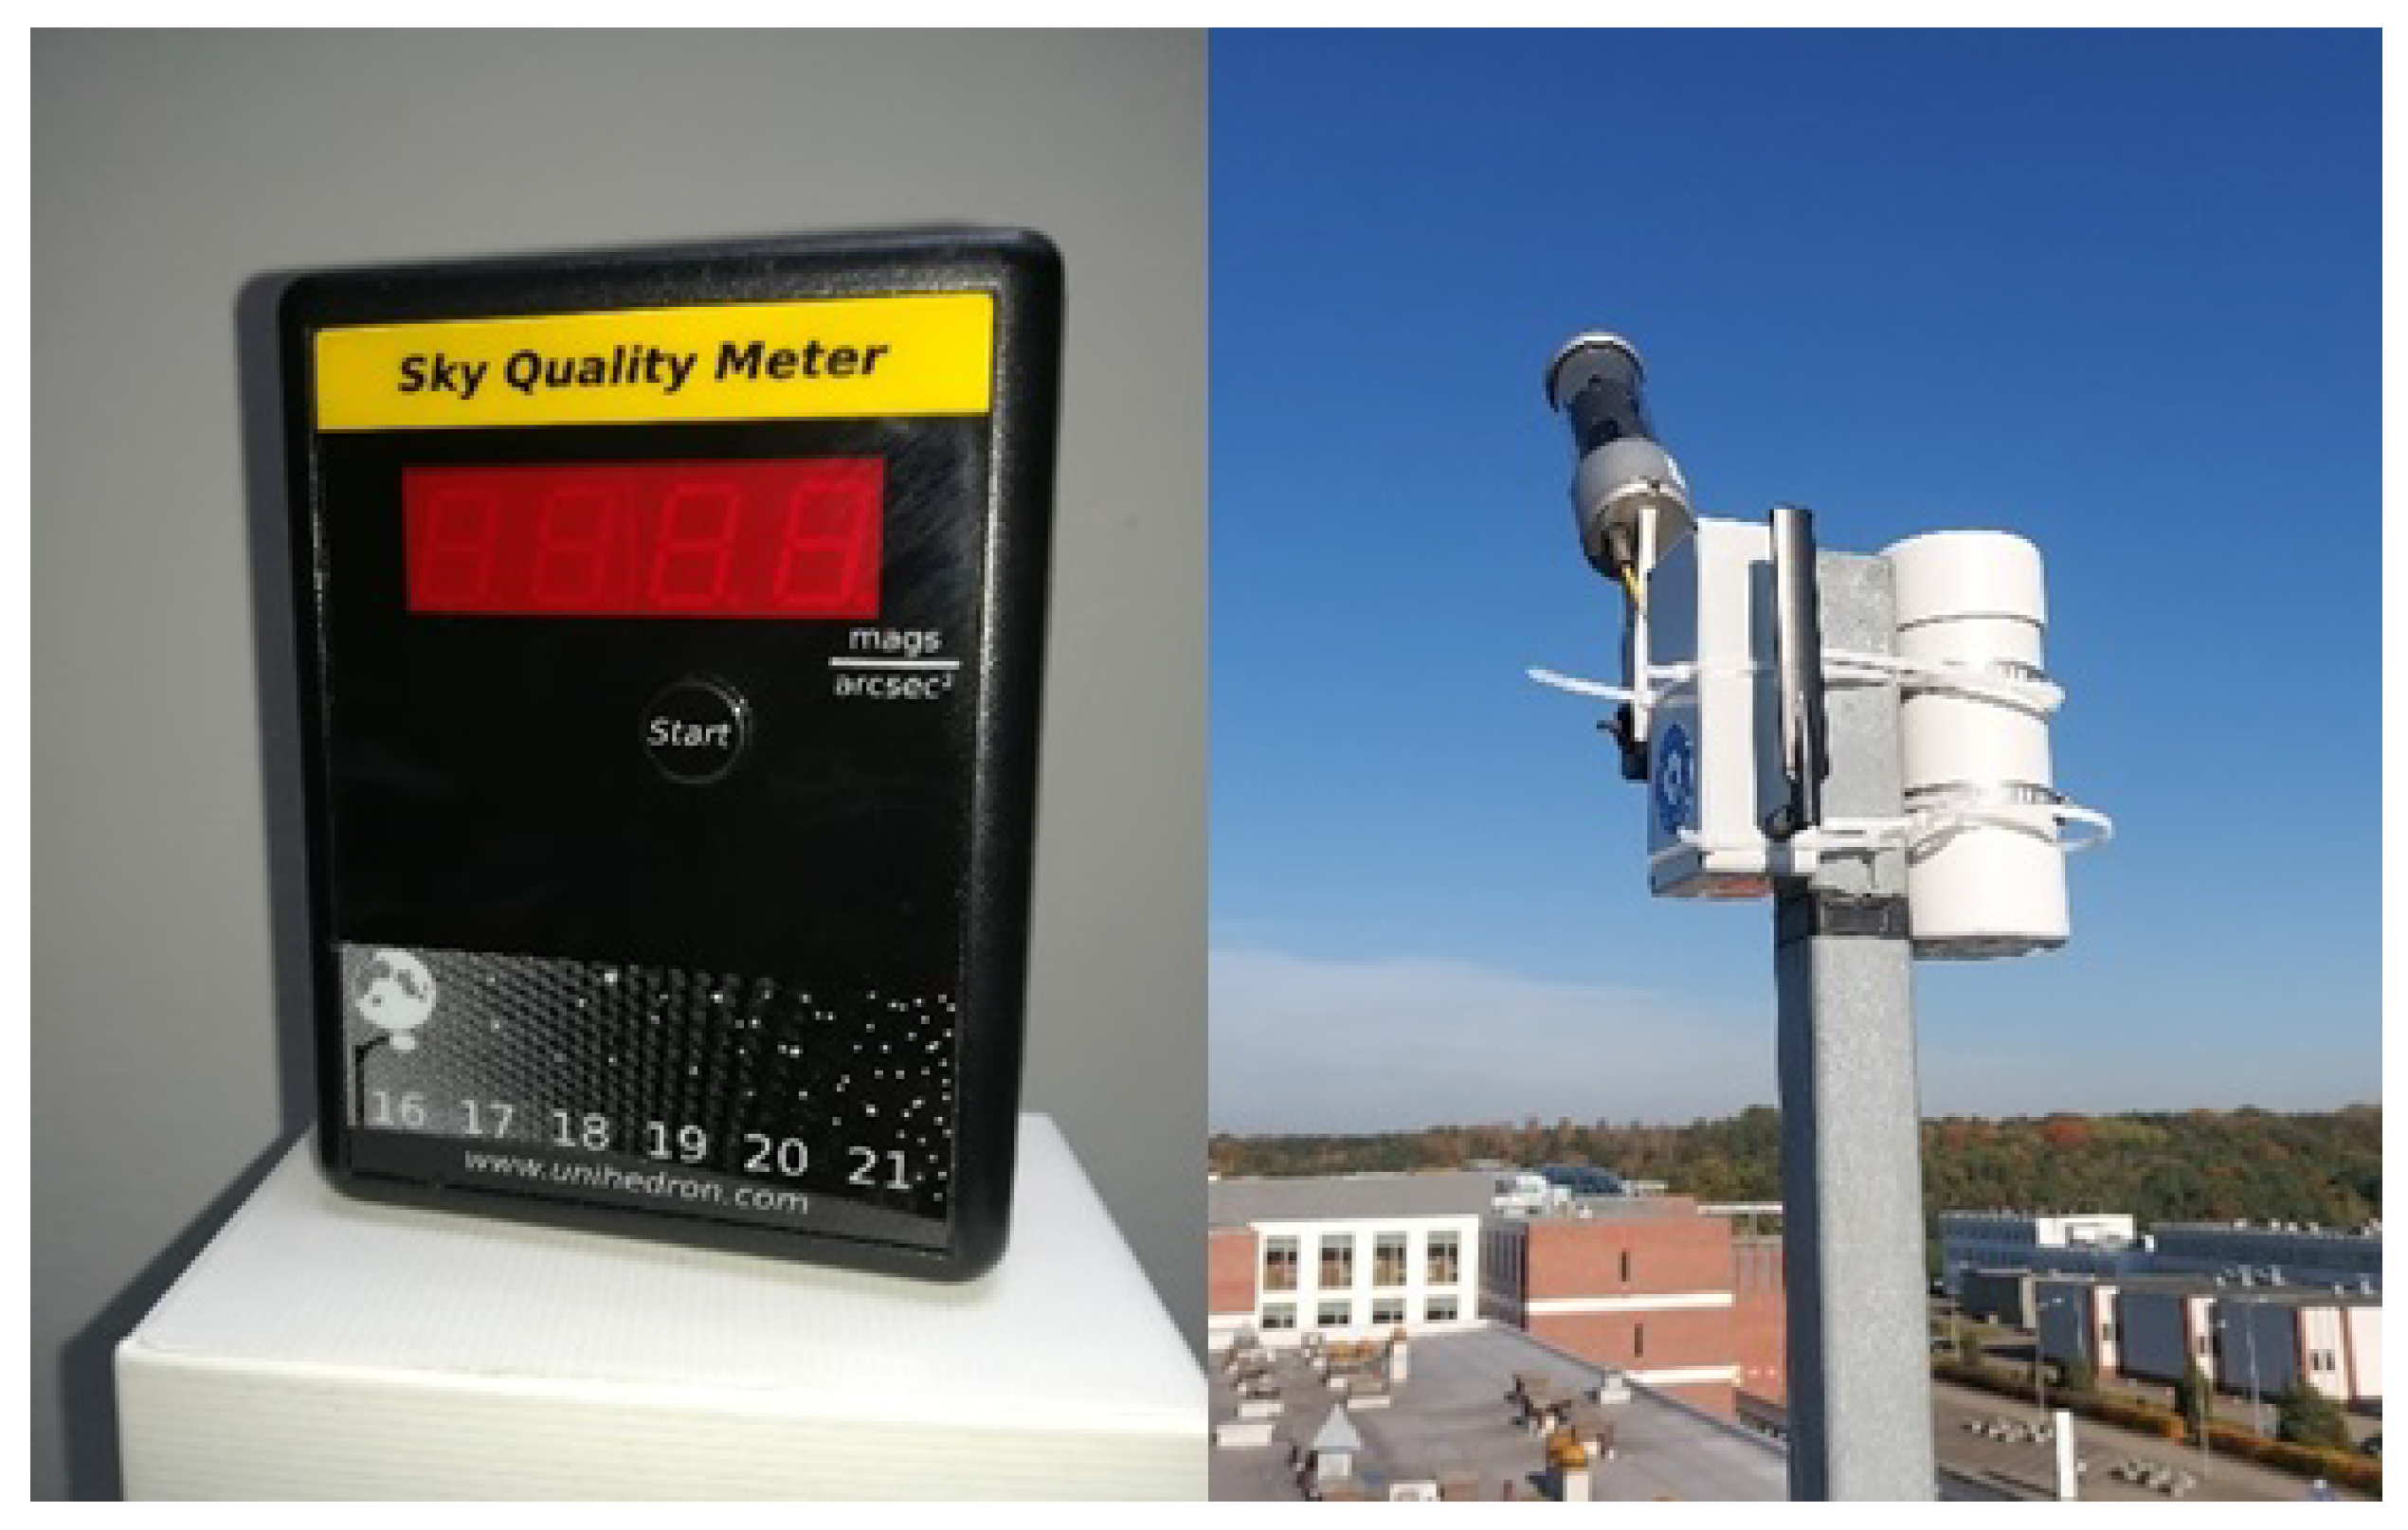
Figure 3.
Photograph of the night sky taken with a fisheye lens (left); photograph processed to a metric form using the spectral colour scale (right). Scale in the figure in mcd/.
Figure 3.
Photograph of the night sky taken with a fisheye lens (left); photograph processed to a metric form using the spectral colour scale (right). Scale in the figure in mcd/.
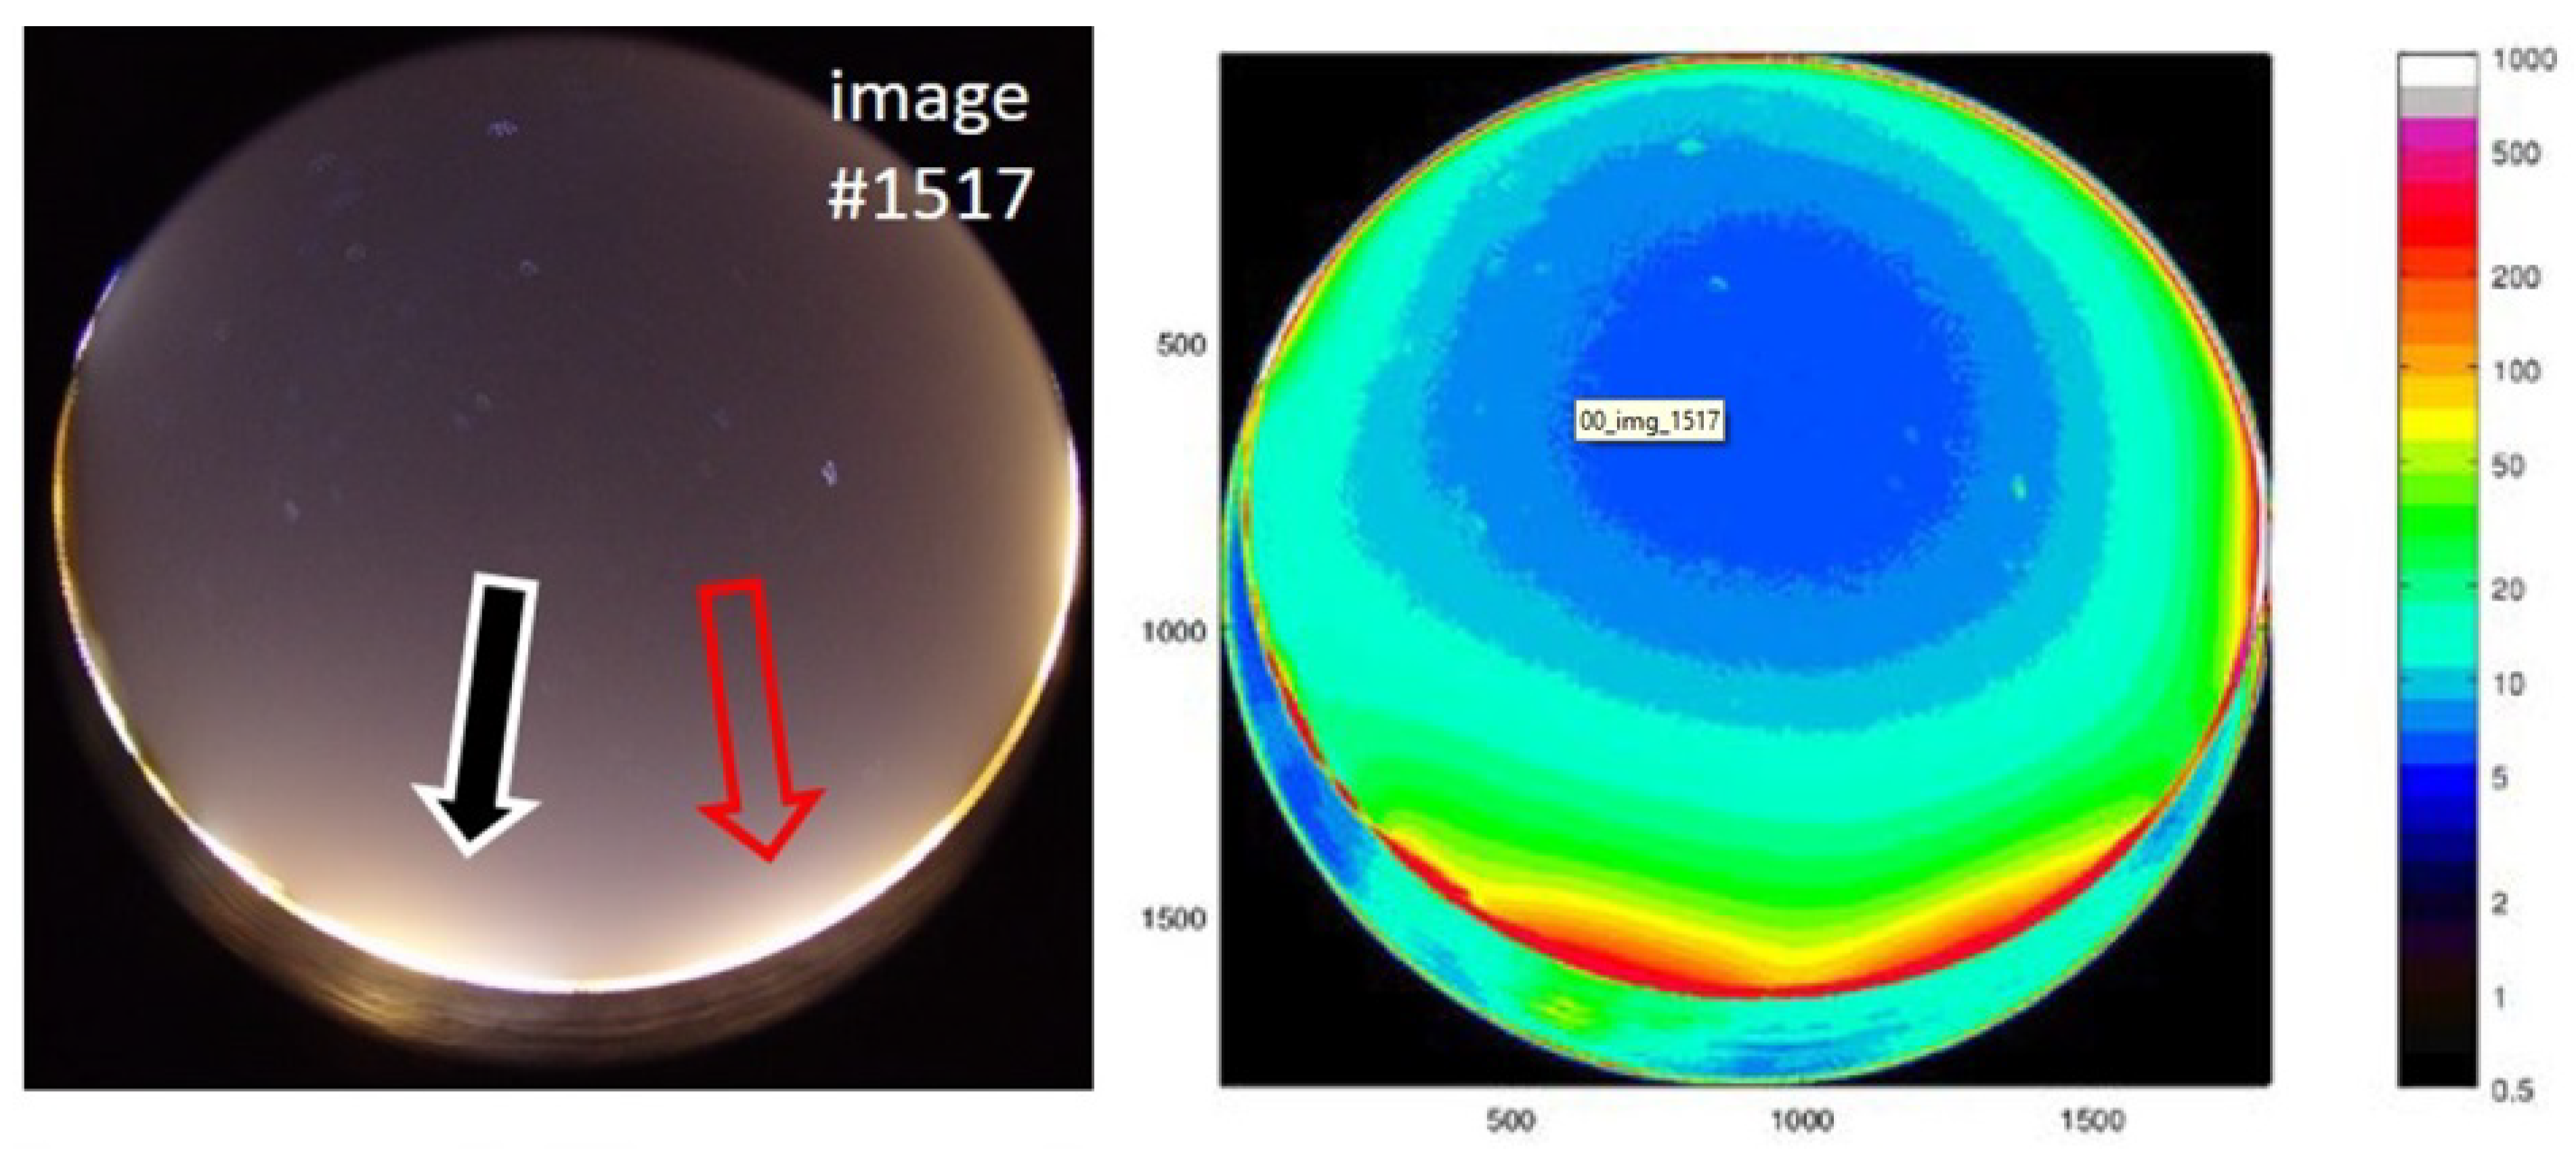
Figure 4.
Vertical satellite image of the city of Cracow taken aboard the ISS (left) and the vertical image of a fragment of the city of Toruń taken by UAV (right).
Figure 4.
Vertical satellite image of the city of Cracow taken aboard the ISS (left) and the vertical image of a fragment of the city of Toruń taken by UAV (right).
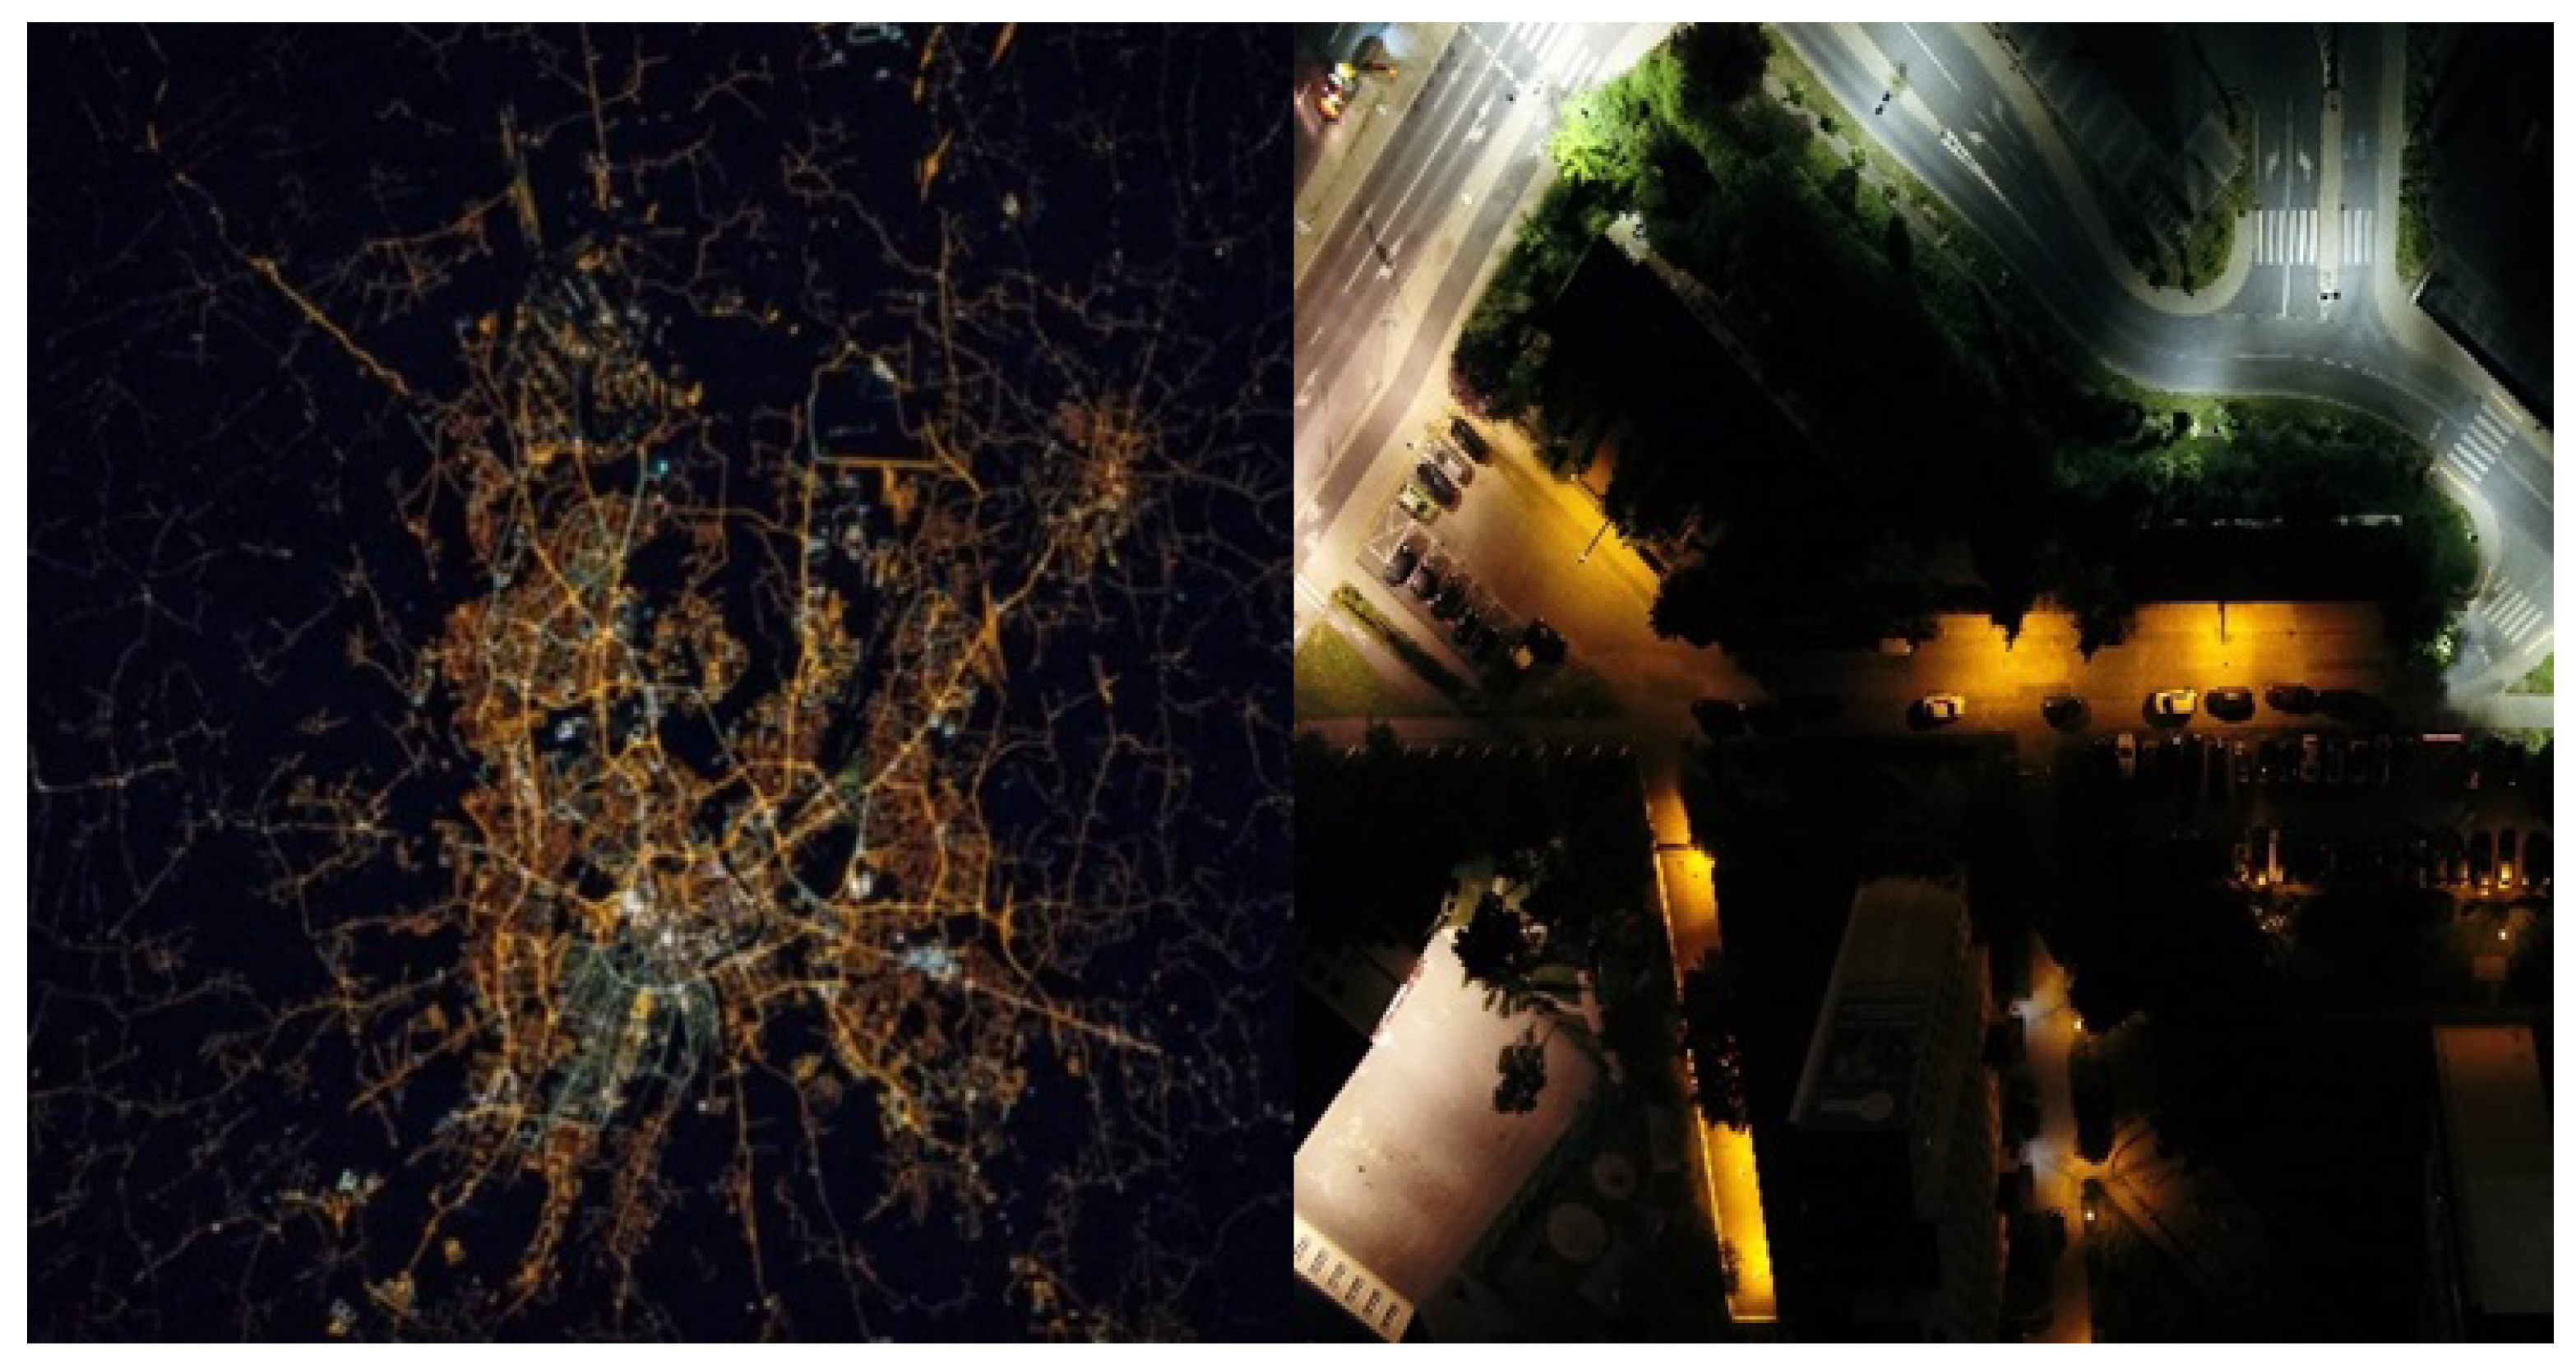
Figure 5.
Surface brightness of the night sky expressed in mag/arcse, presented in the World Atlas of Light Pollution for Poland (source: https://lightpollutionmap.info).
Figure 5.
Surface brightness of the night sky expressed in mag/arcse, presented in the World Atlas of Light Pollution for Poland (source: https://lightpollutionmap.info).
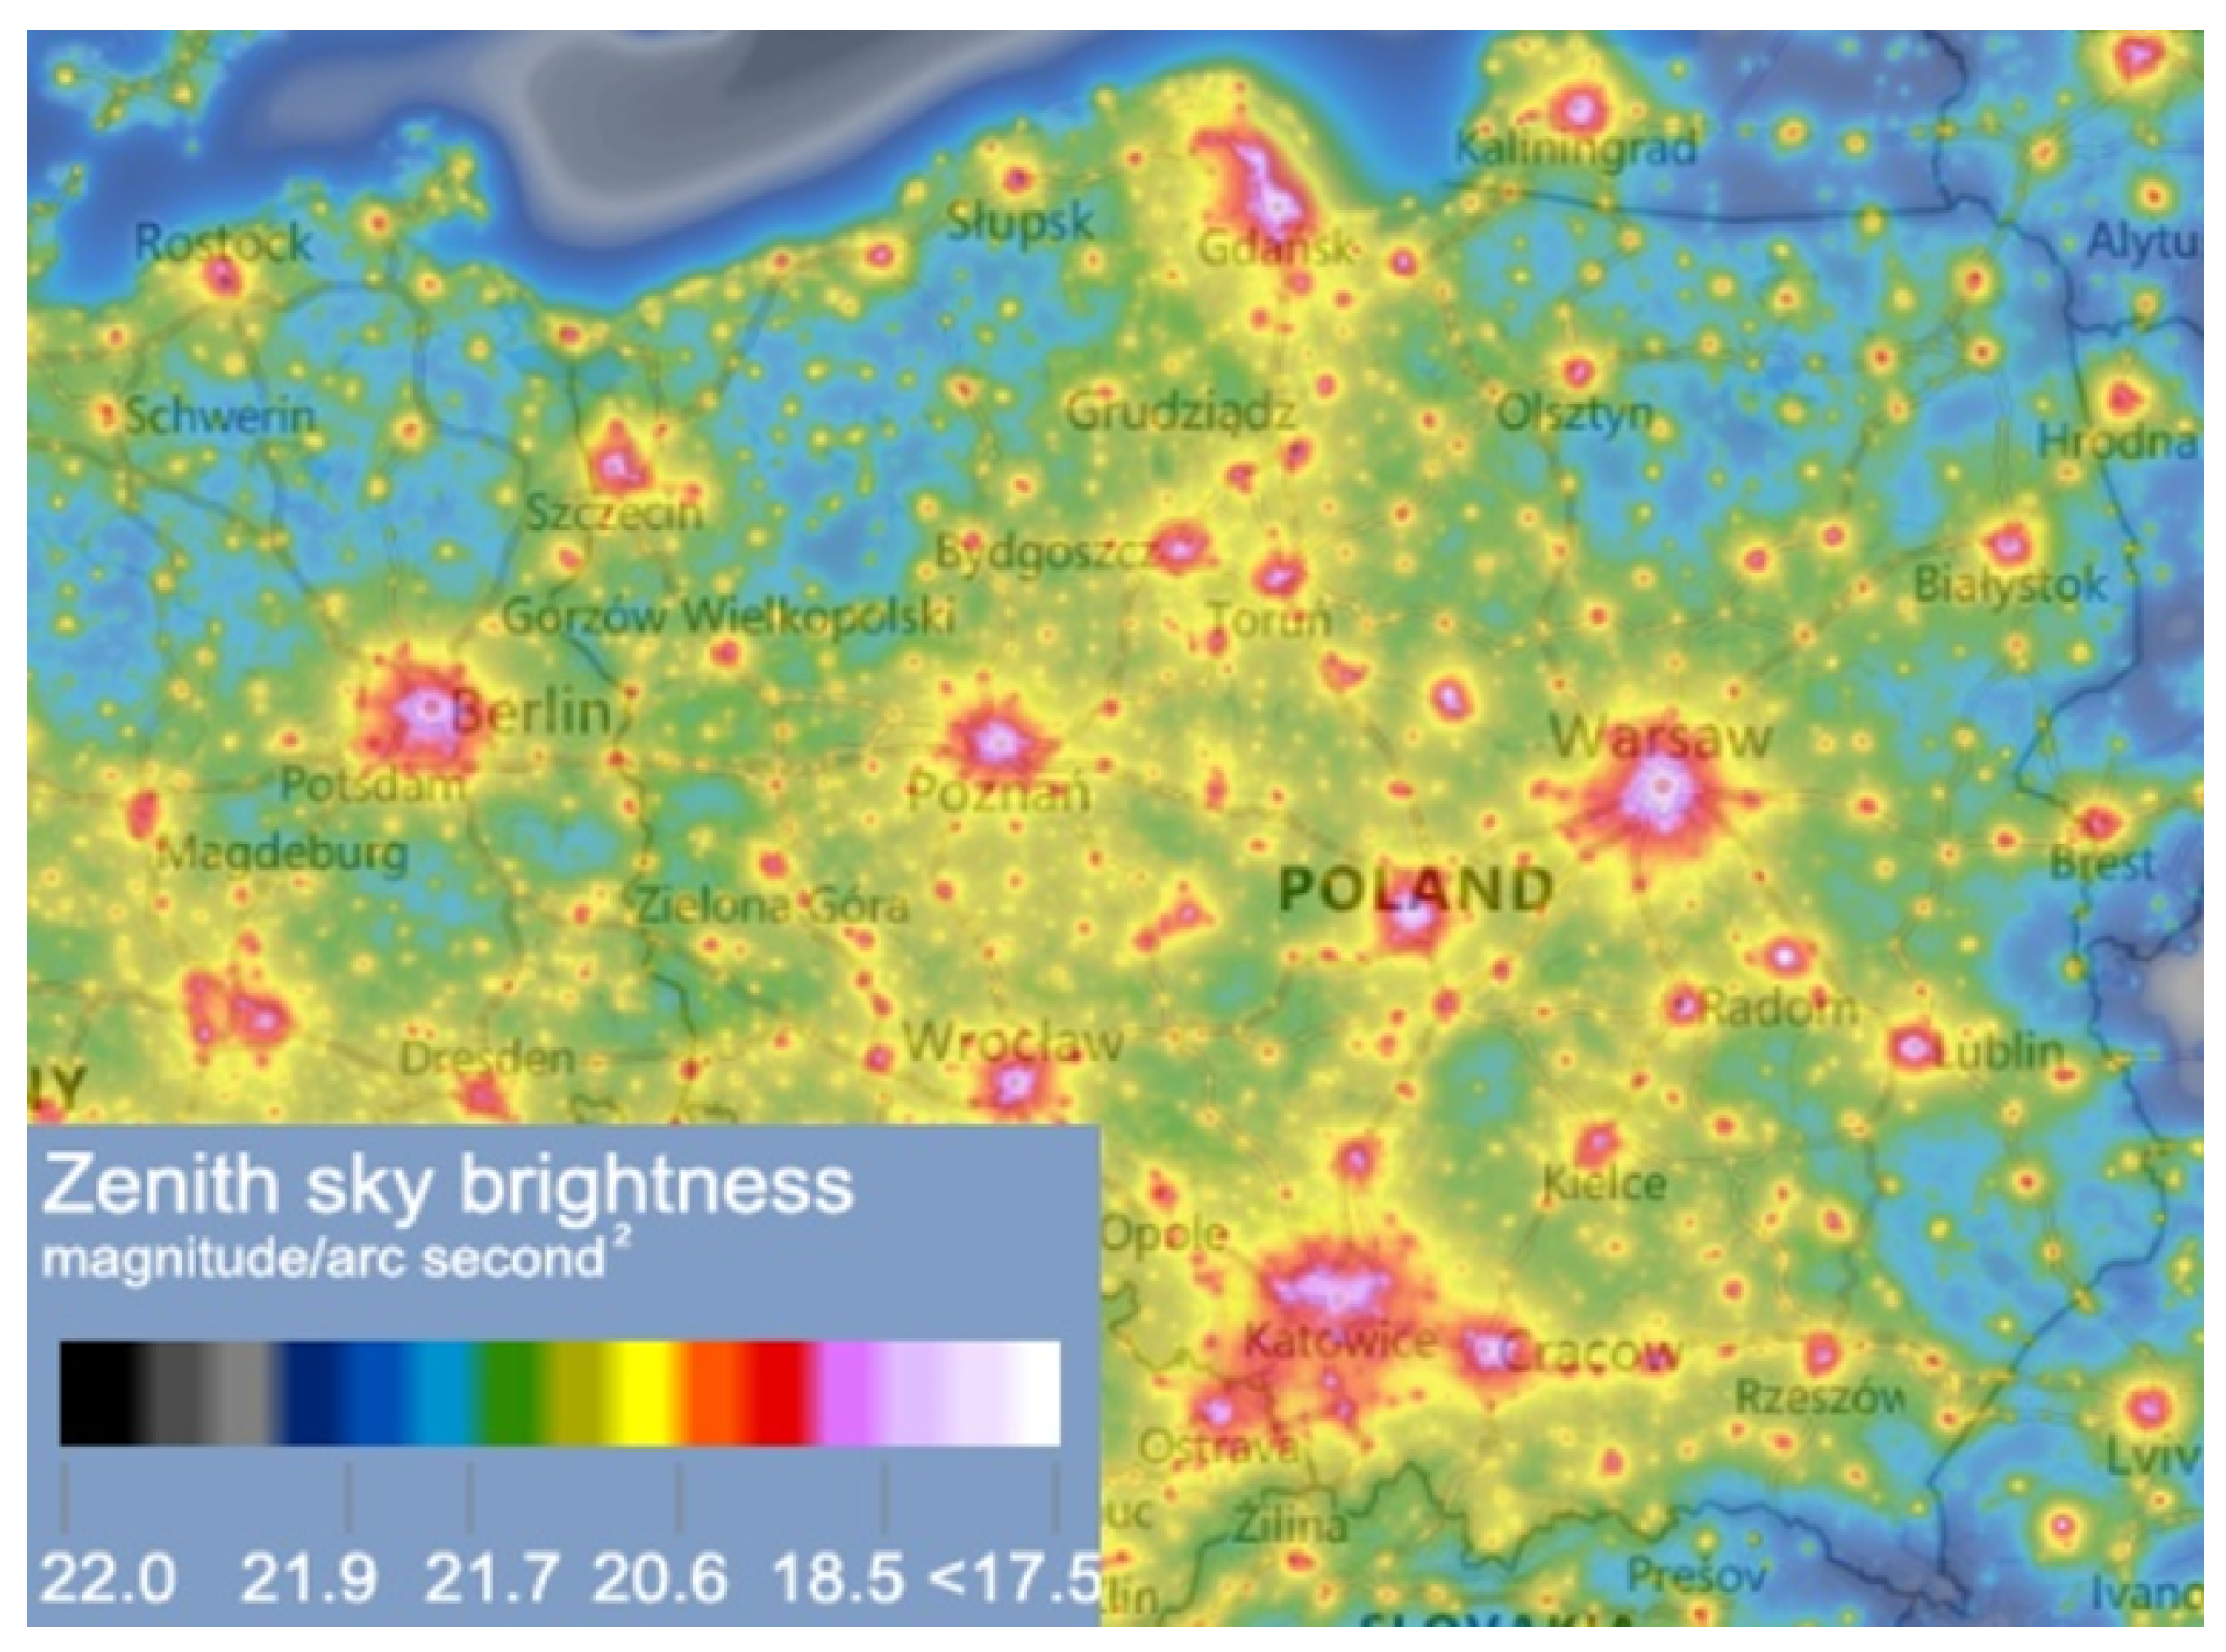
Figure 6.
Surface brightness of the night sky expressed in mag/arcse and NSB, presented in the Light Pollution Atlas for Poland (source: https://darksitefinder.com/maps/world.html#7/52.177/18.160).
Figure 6.
Surface brightness of the night sky expressed in mag/arcse and NSB, presented in the Light Pollution Atlas for Poland (source: https://darksitefinder.com/maps/world.html#7/52.177/18.160).
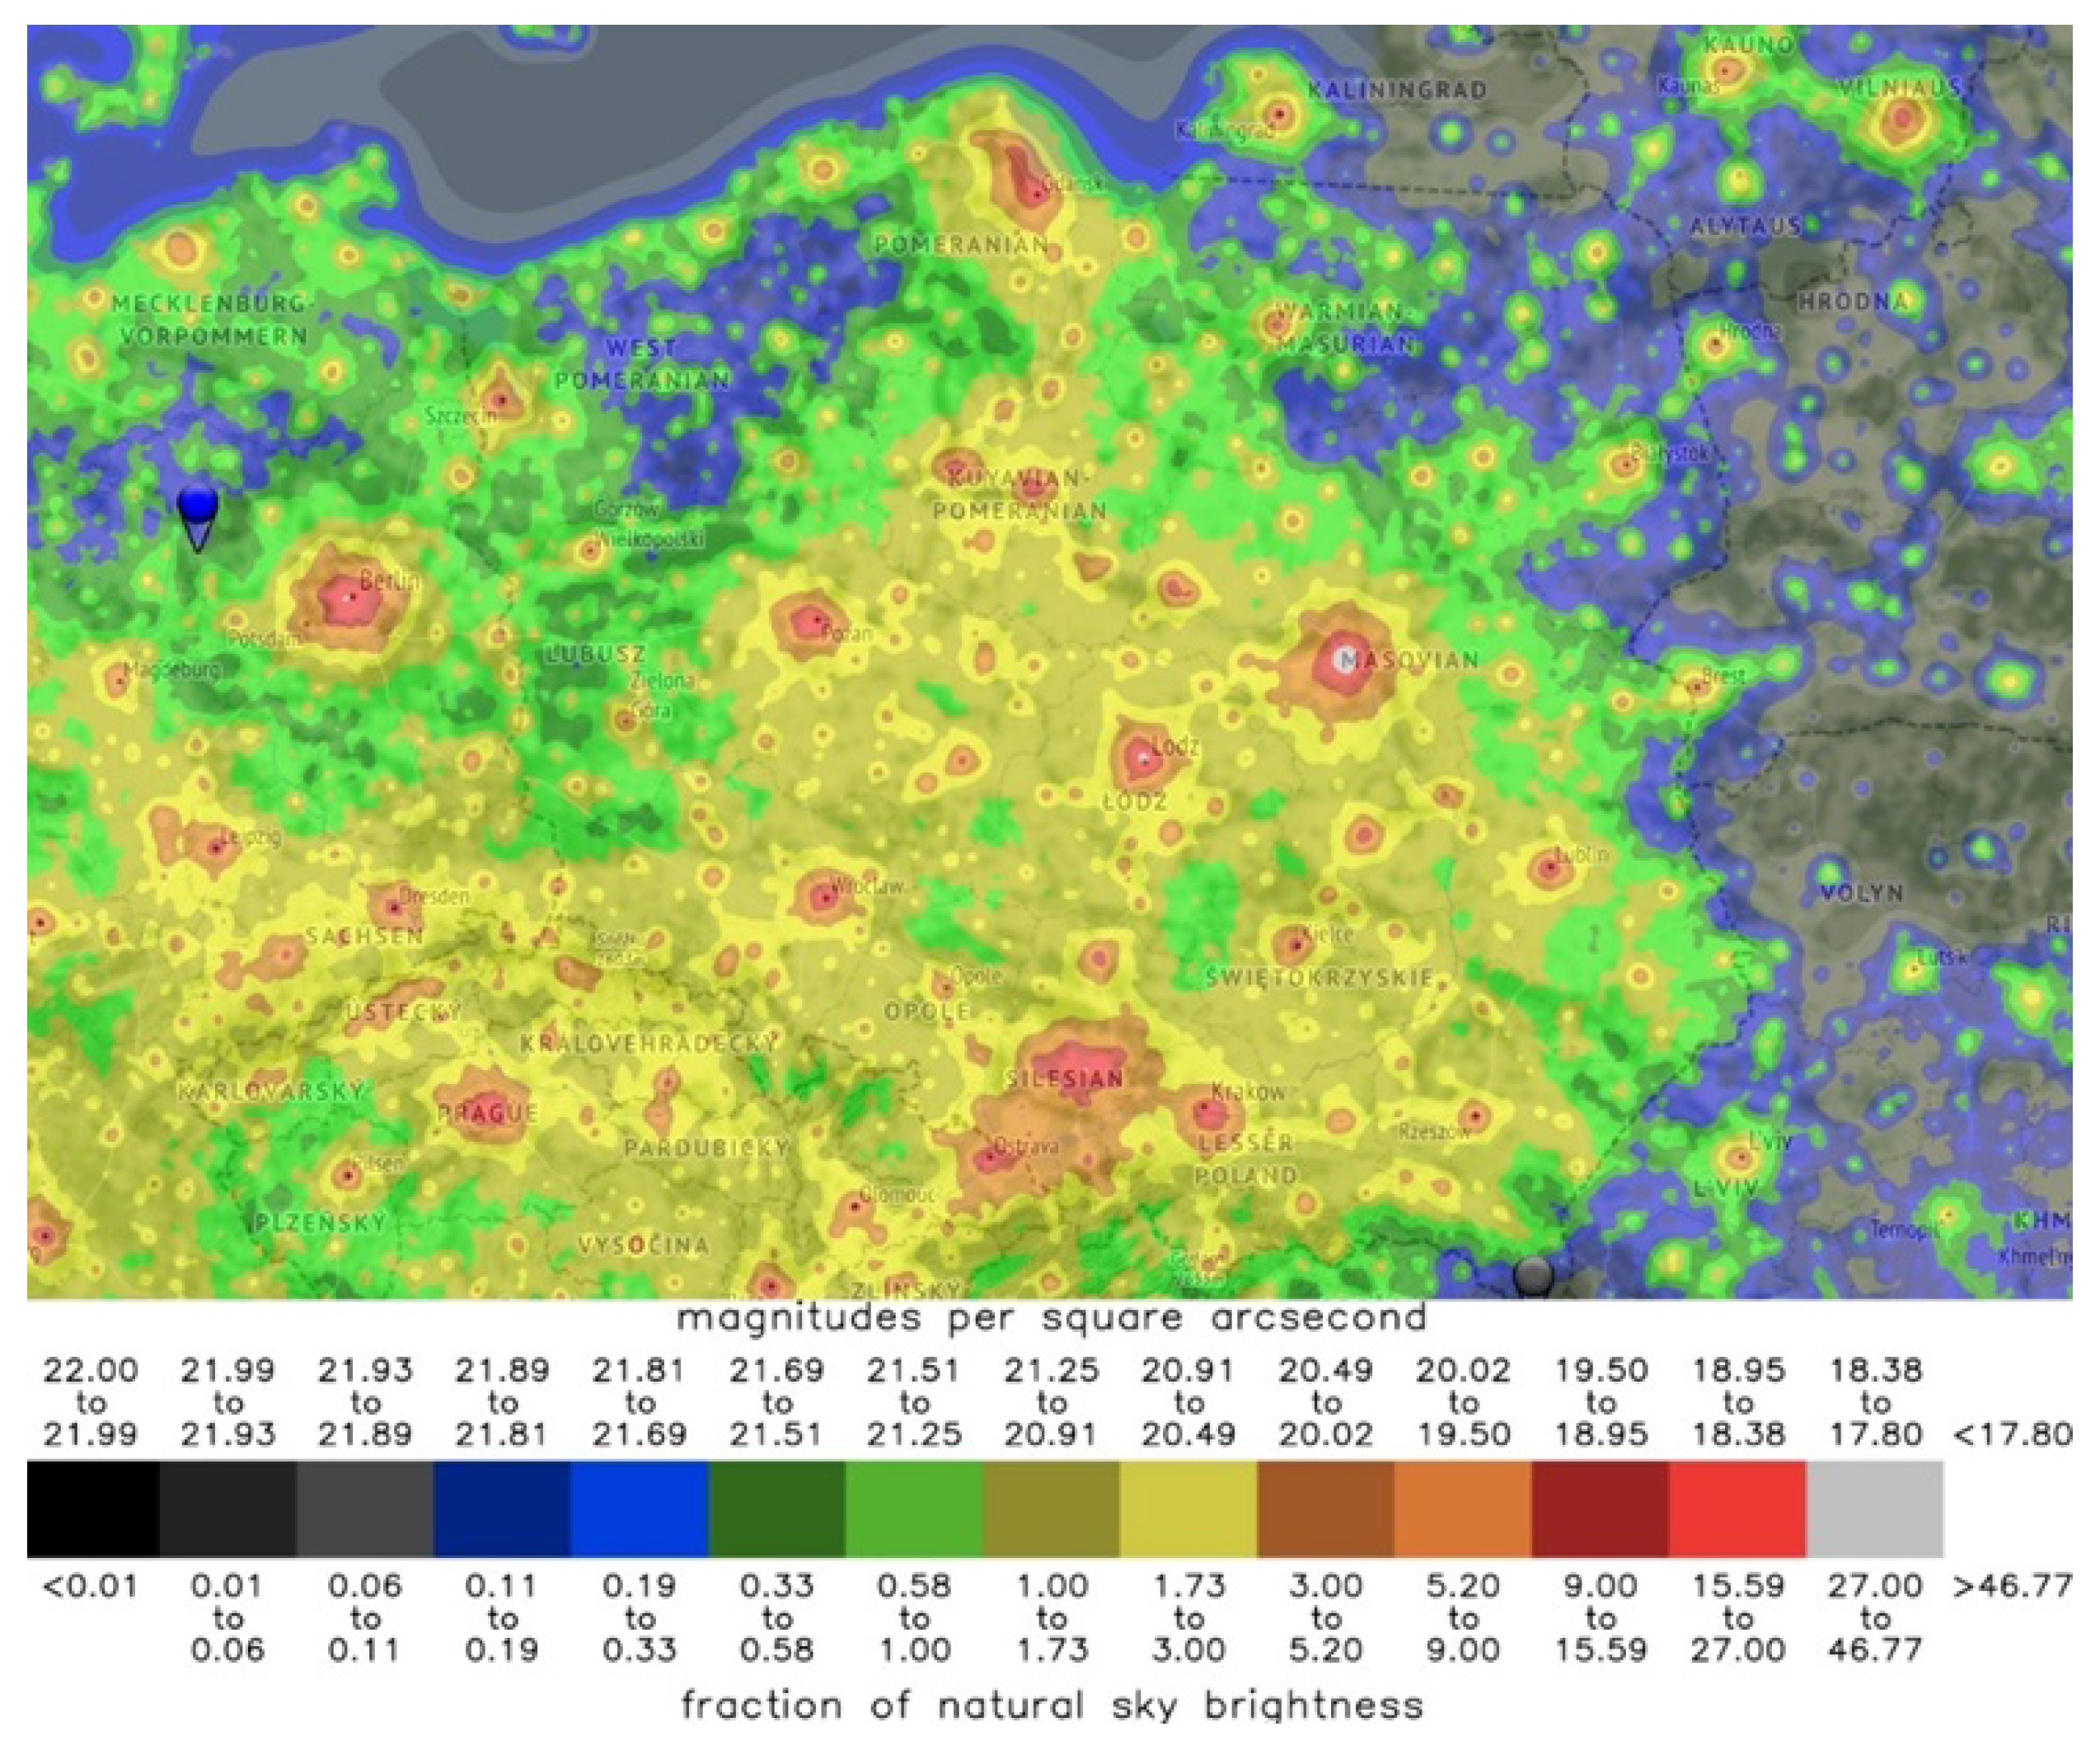
Figure 7.
Fragment of the environs of the Wrocław city included on the Lower Silesia Astrotourism Map (source: https://geoportal.dolnyslask.pl).
Figure 7.
Fragment of the environs of the Wrocław city included on the Lower Silesia Astrotourism Map (source: https://geoportal.dolnyslask.pl).
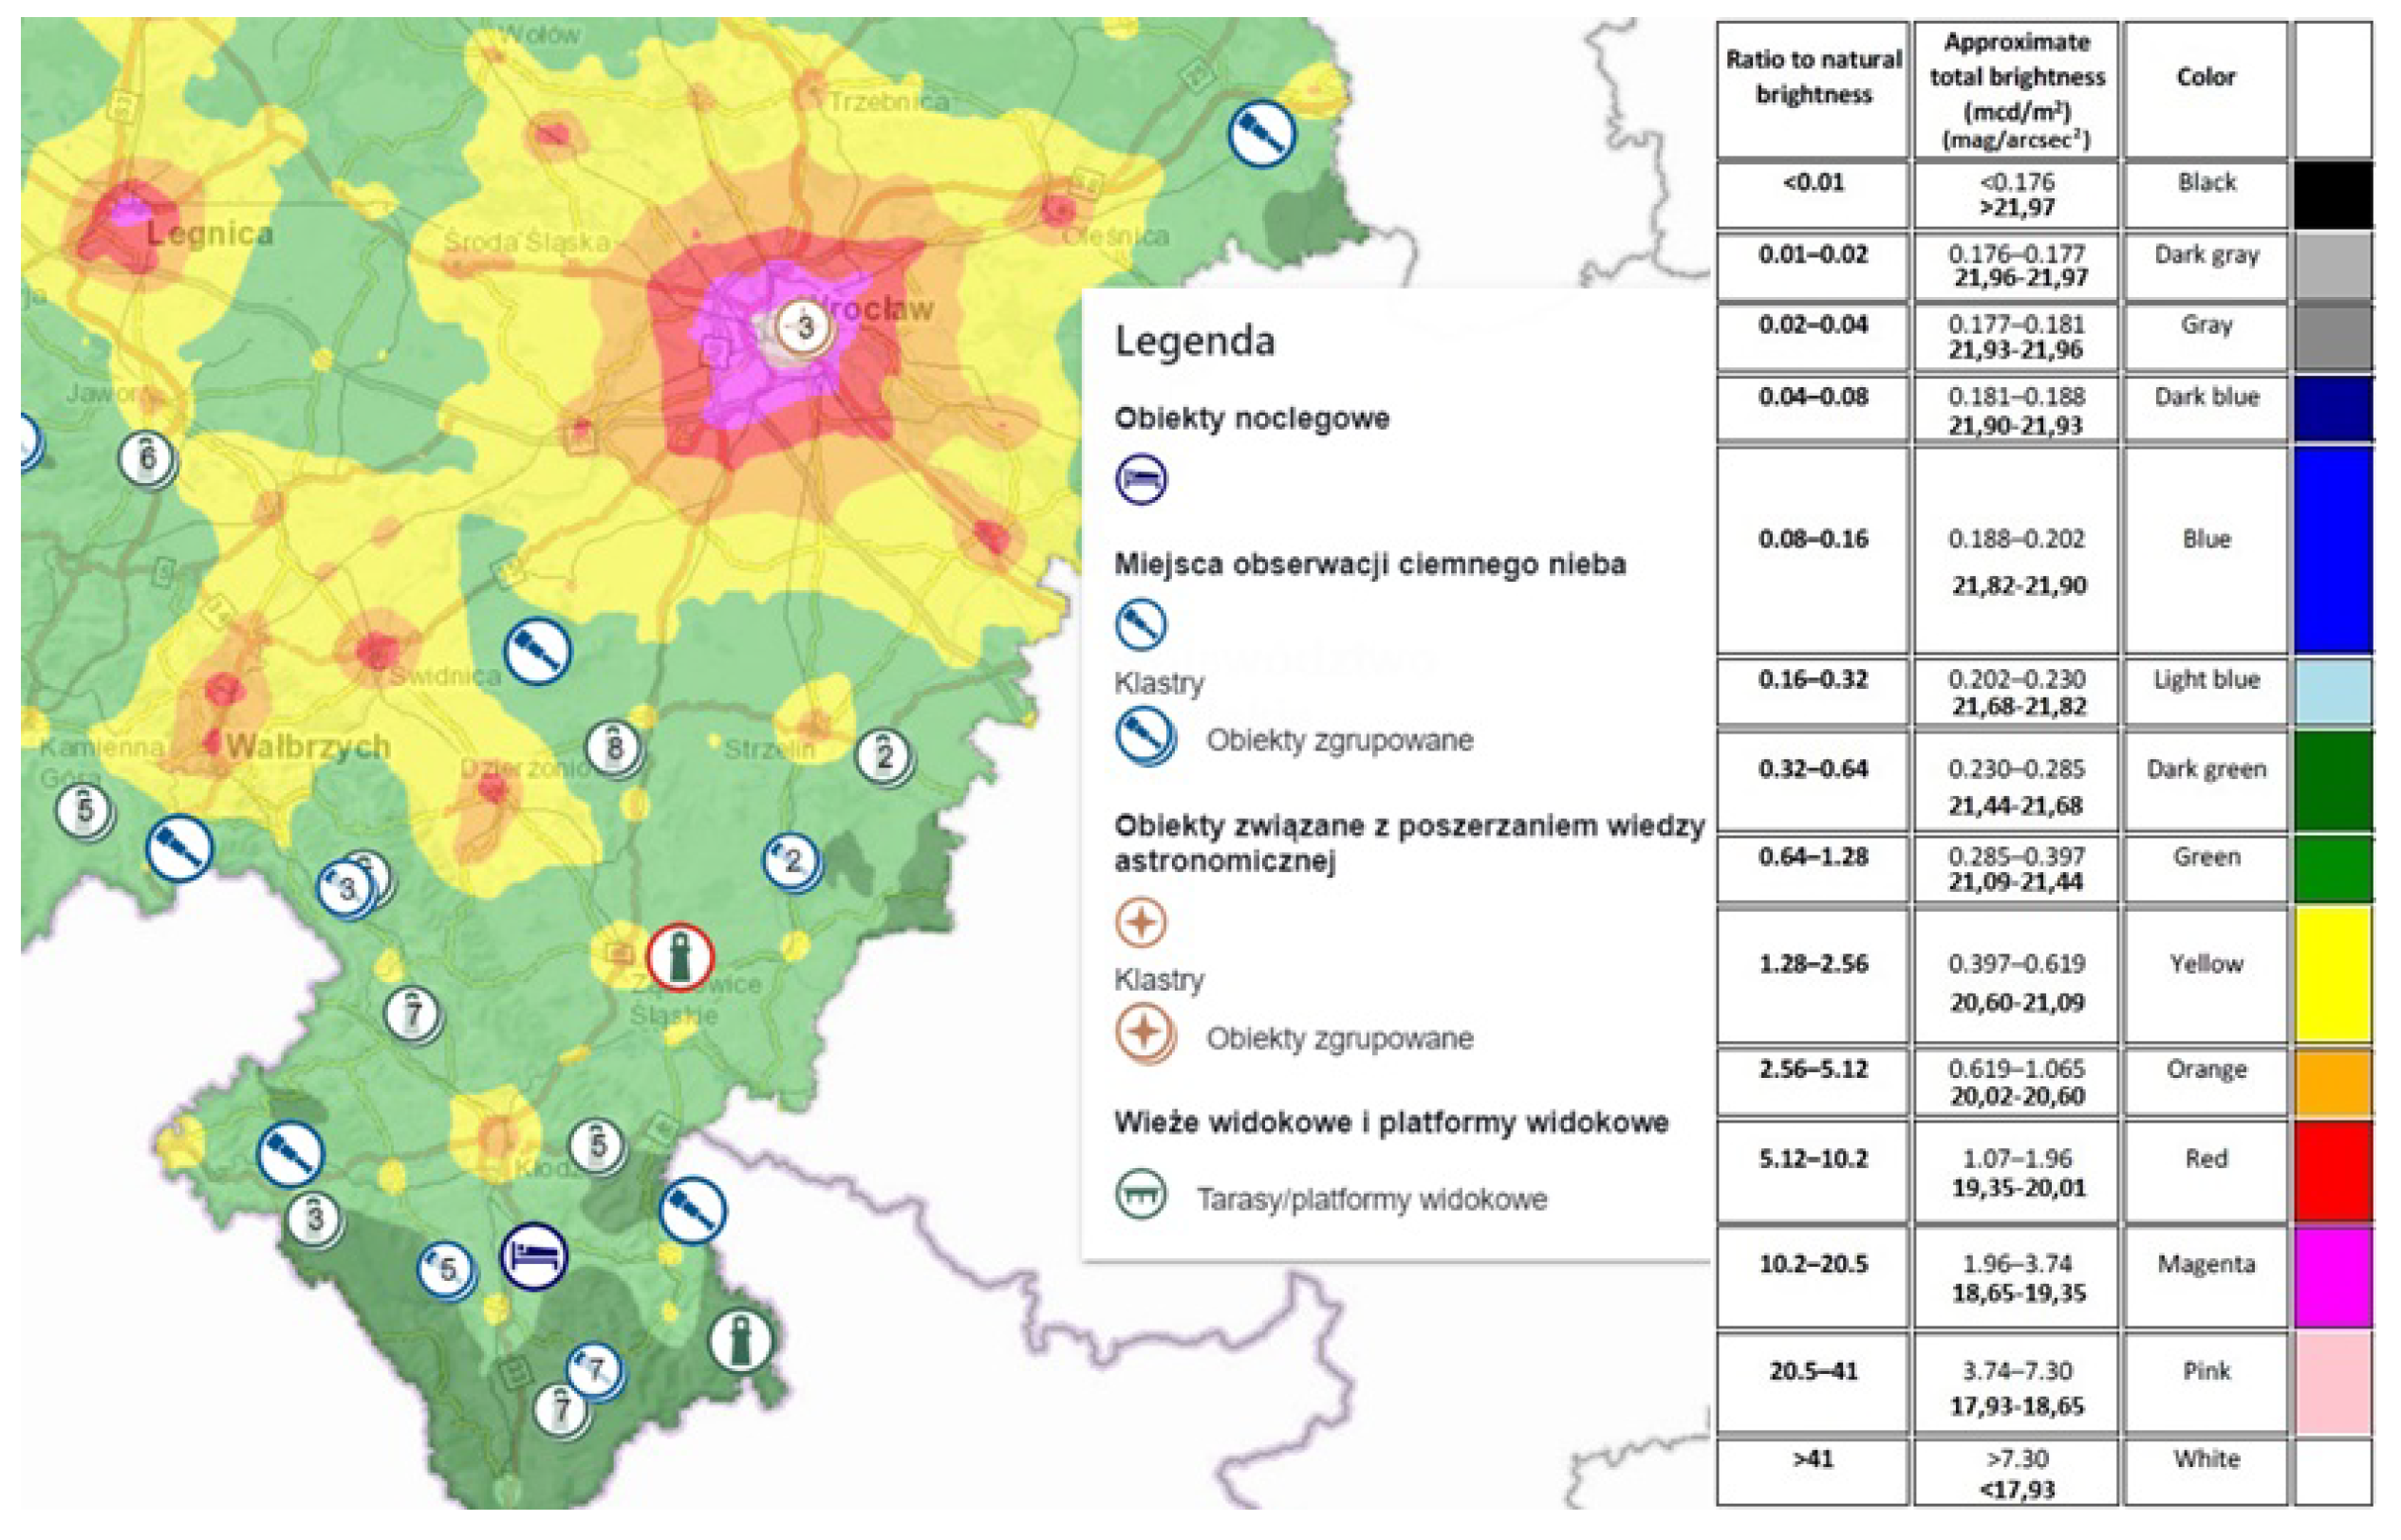
Figure 8.
Light pollution in Poland in 2021 presented as radiance (source: https://www.lightpollutionmap.info).
Figure 8.
Light pollution in Poland in 2021 presented as radiance (source: https://www.lightpollutionmap.info).
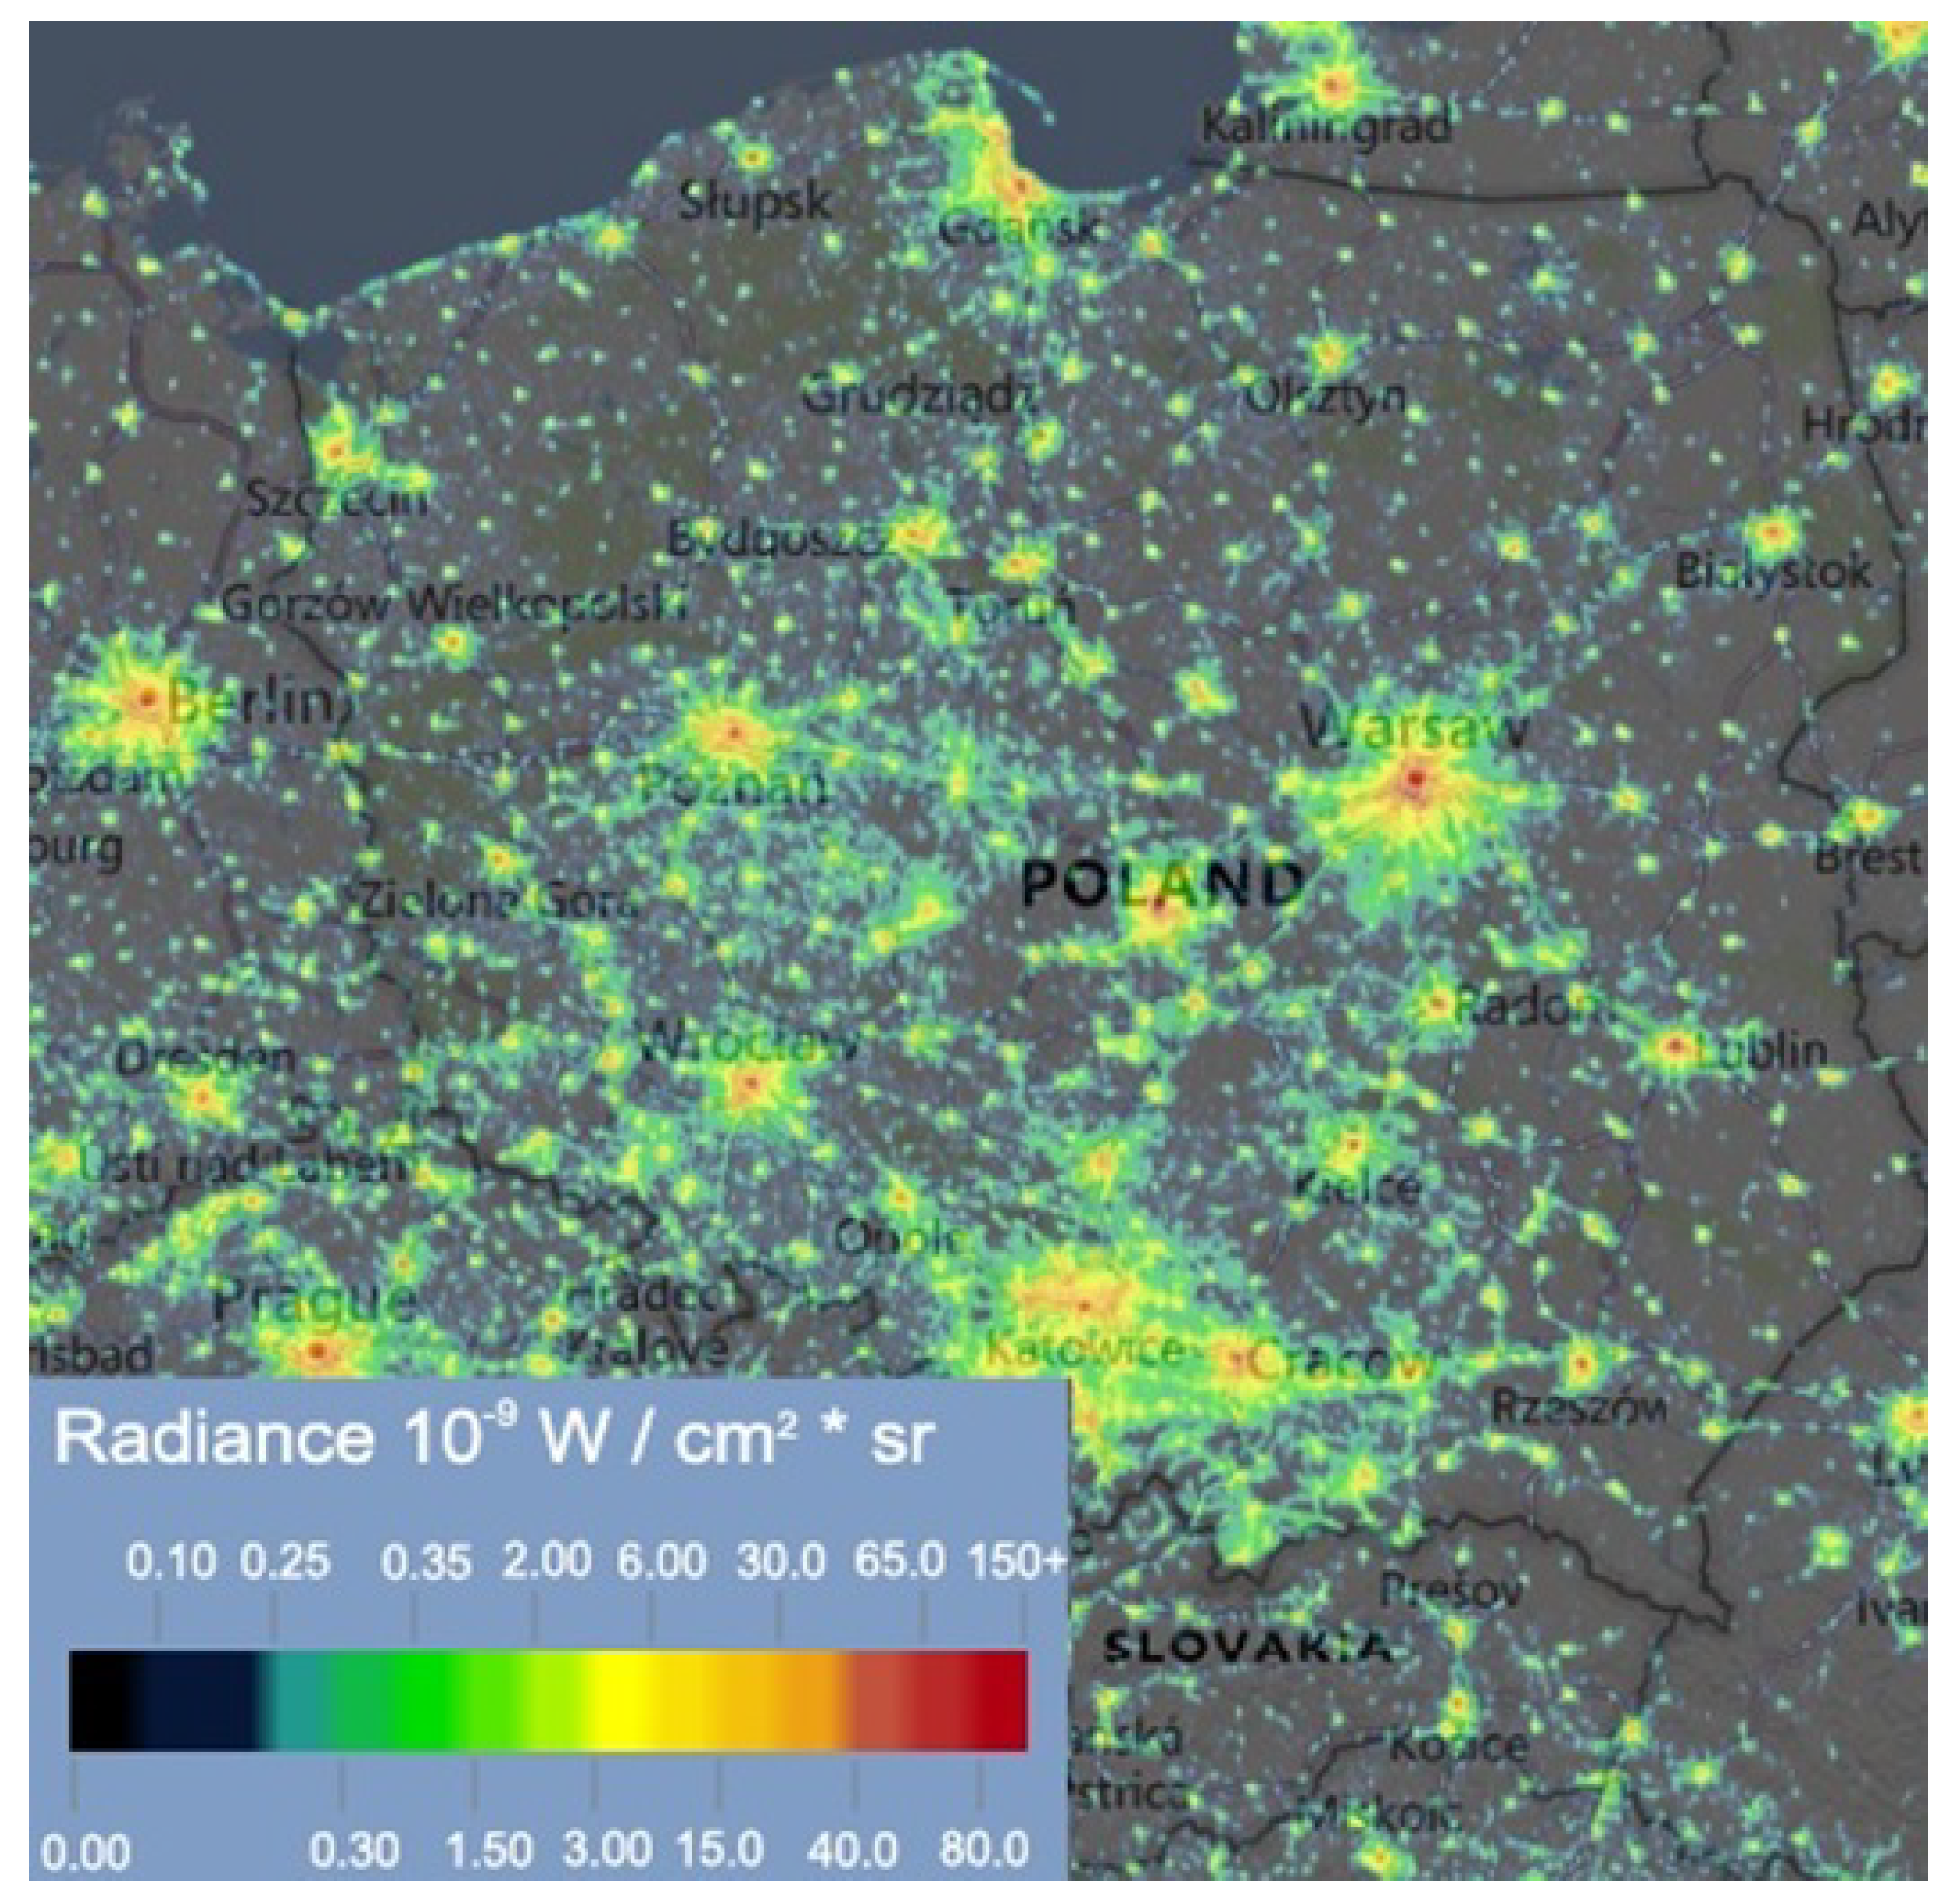
Figure 9.
Radiance representing light pollution in Poland at night on 26 August 2022 (source: https://worldview.earthdata.nasa.gov/).
Figure 9.
Radiance representing light pollution in Poland at night on 26 August 2022 (source: https://worldview.earthdata.nasa.gov/).
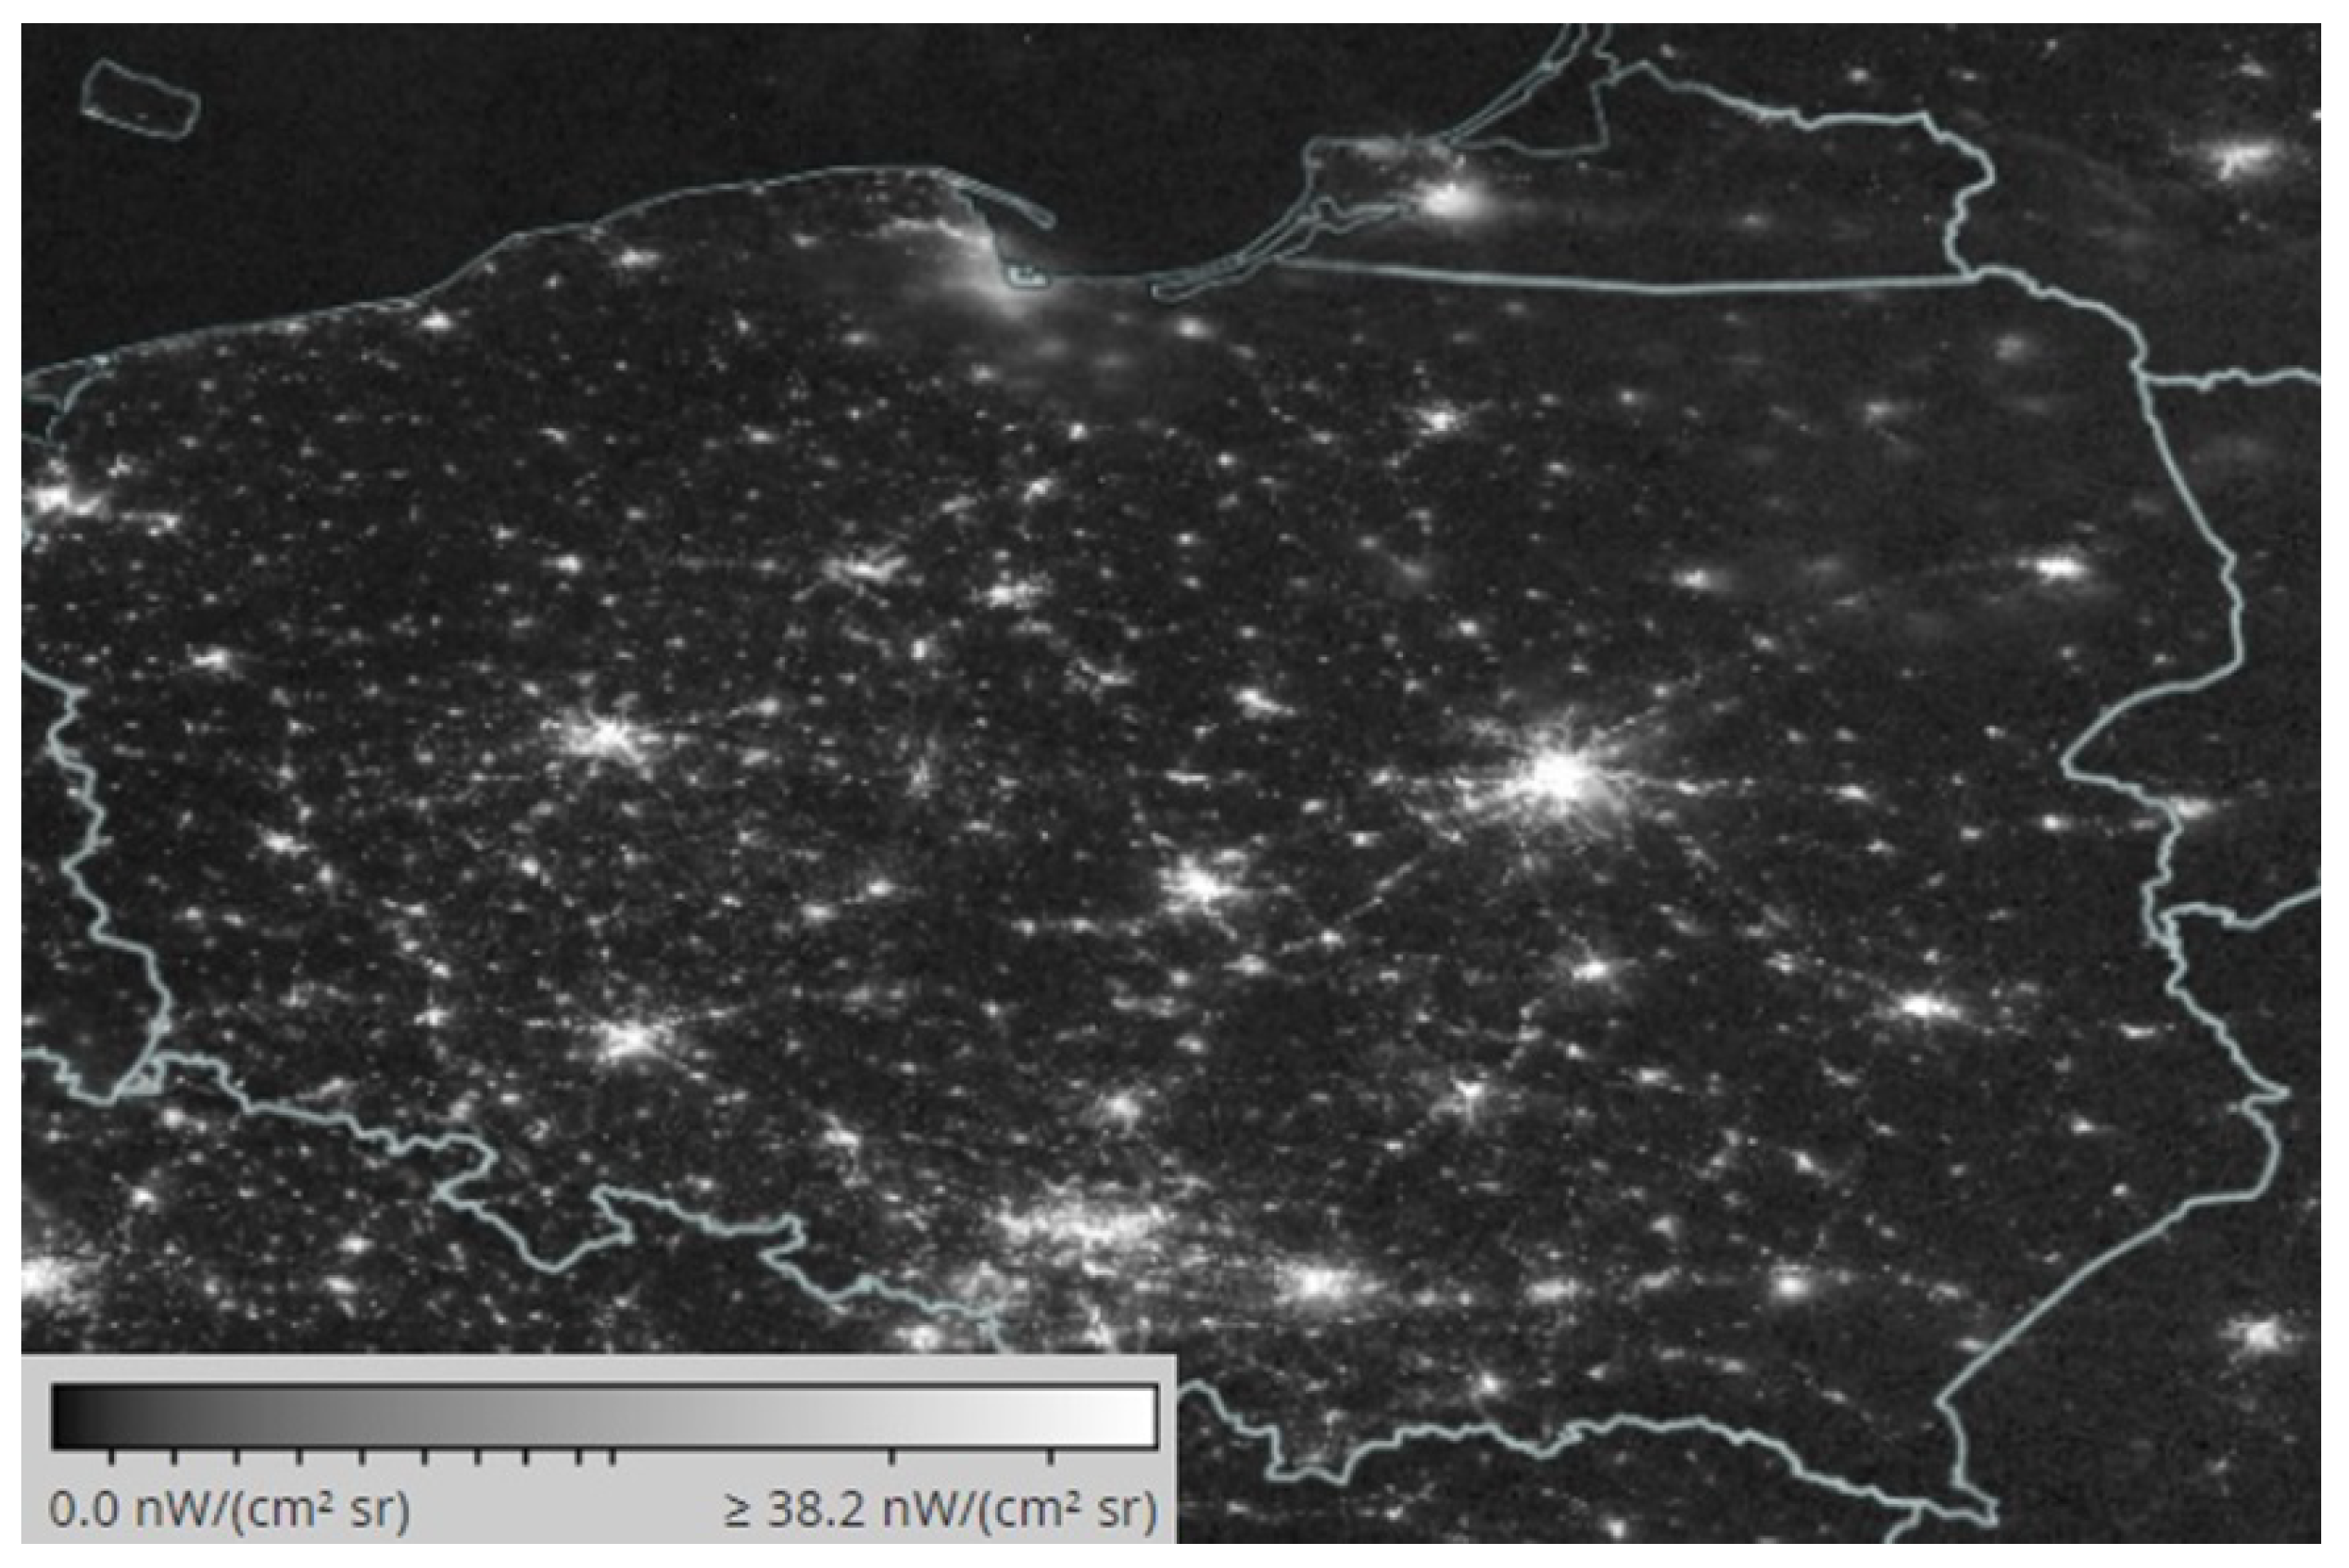
Figure 10.
Night-time photograph of Poland taken on 26 August 2022 (source: https://worldview.earthdata.nasa.gov/).
Figure 10.
Night-time photograph of Poland taken on 26 August 2022 (source: https://worldview.earthdata.nasa.gov/).
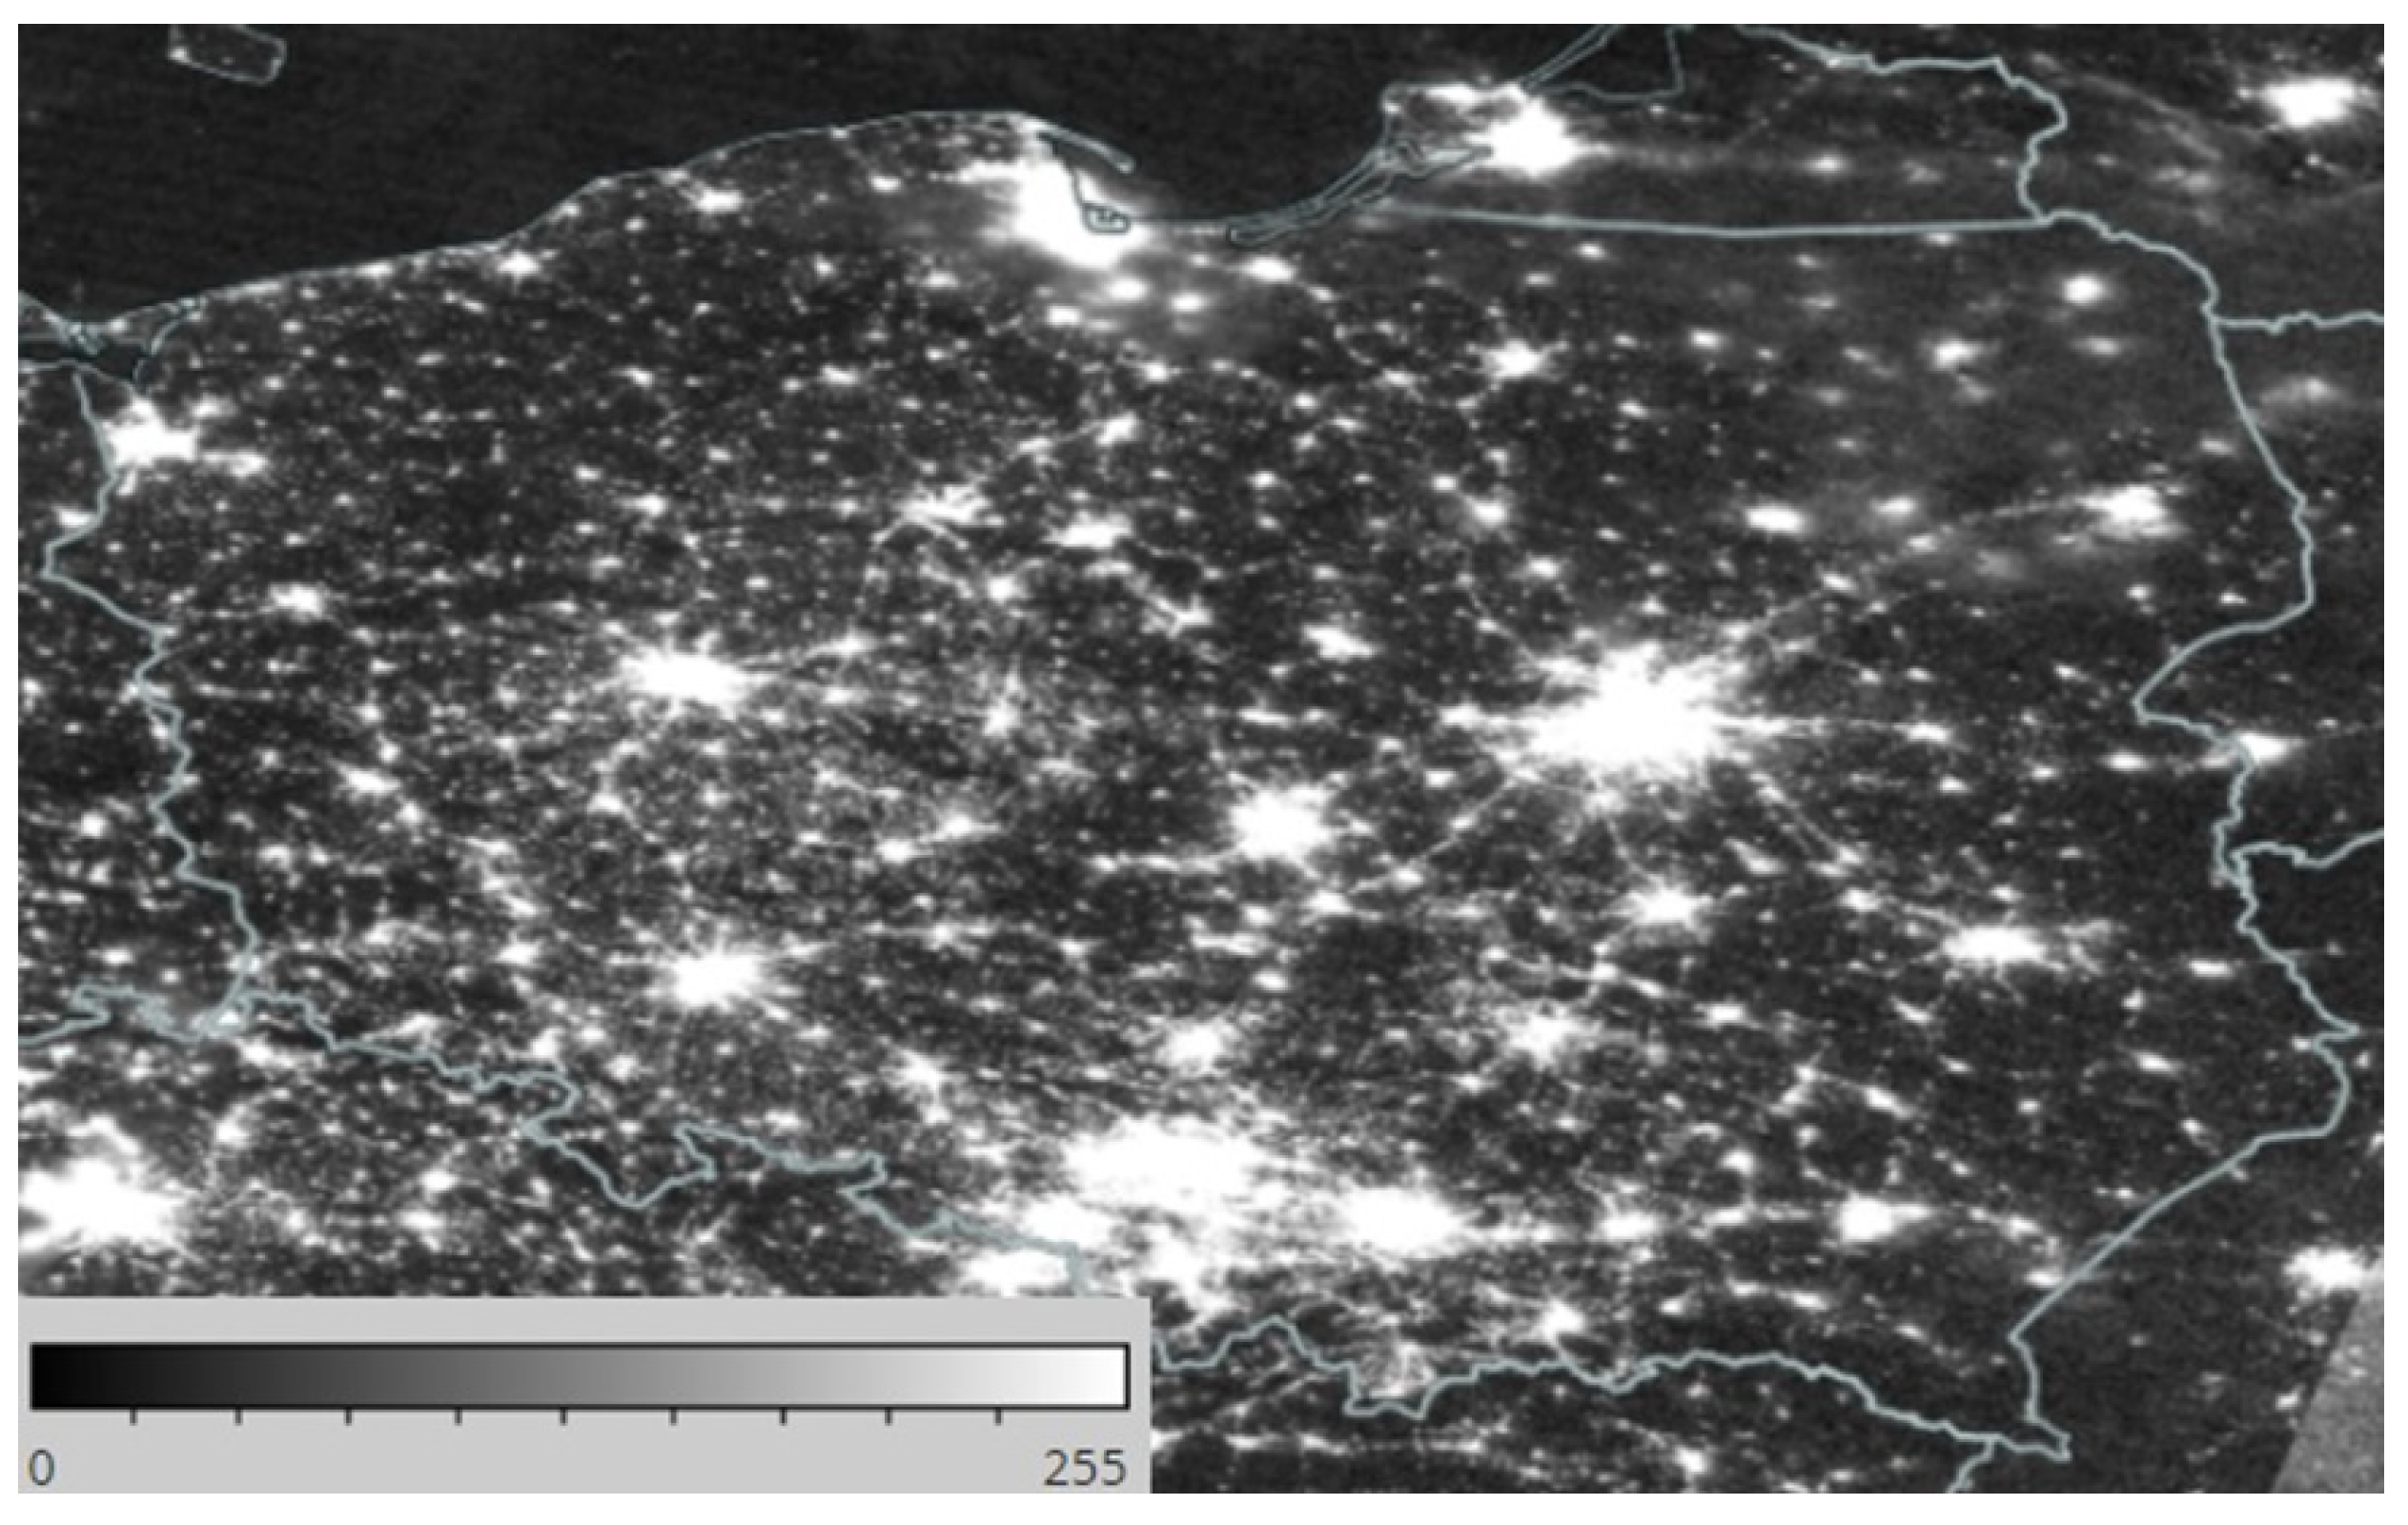
Figure 12.
Comparison of the scales of brightness and pollution of the night sky by artificial light found in cartographic and documentary materials and described in this paper.
Figure 12.
Comparison of the scales of brightness and pollution of the night sky by artificial light found in cartographic and documentary materials and described in this paper.
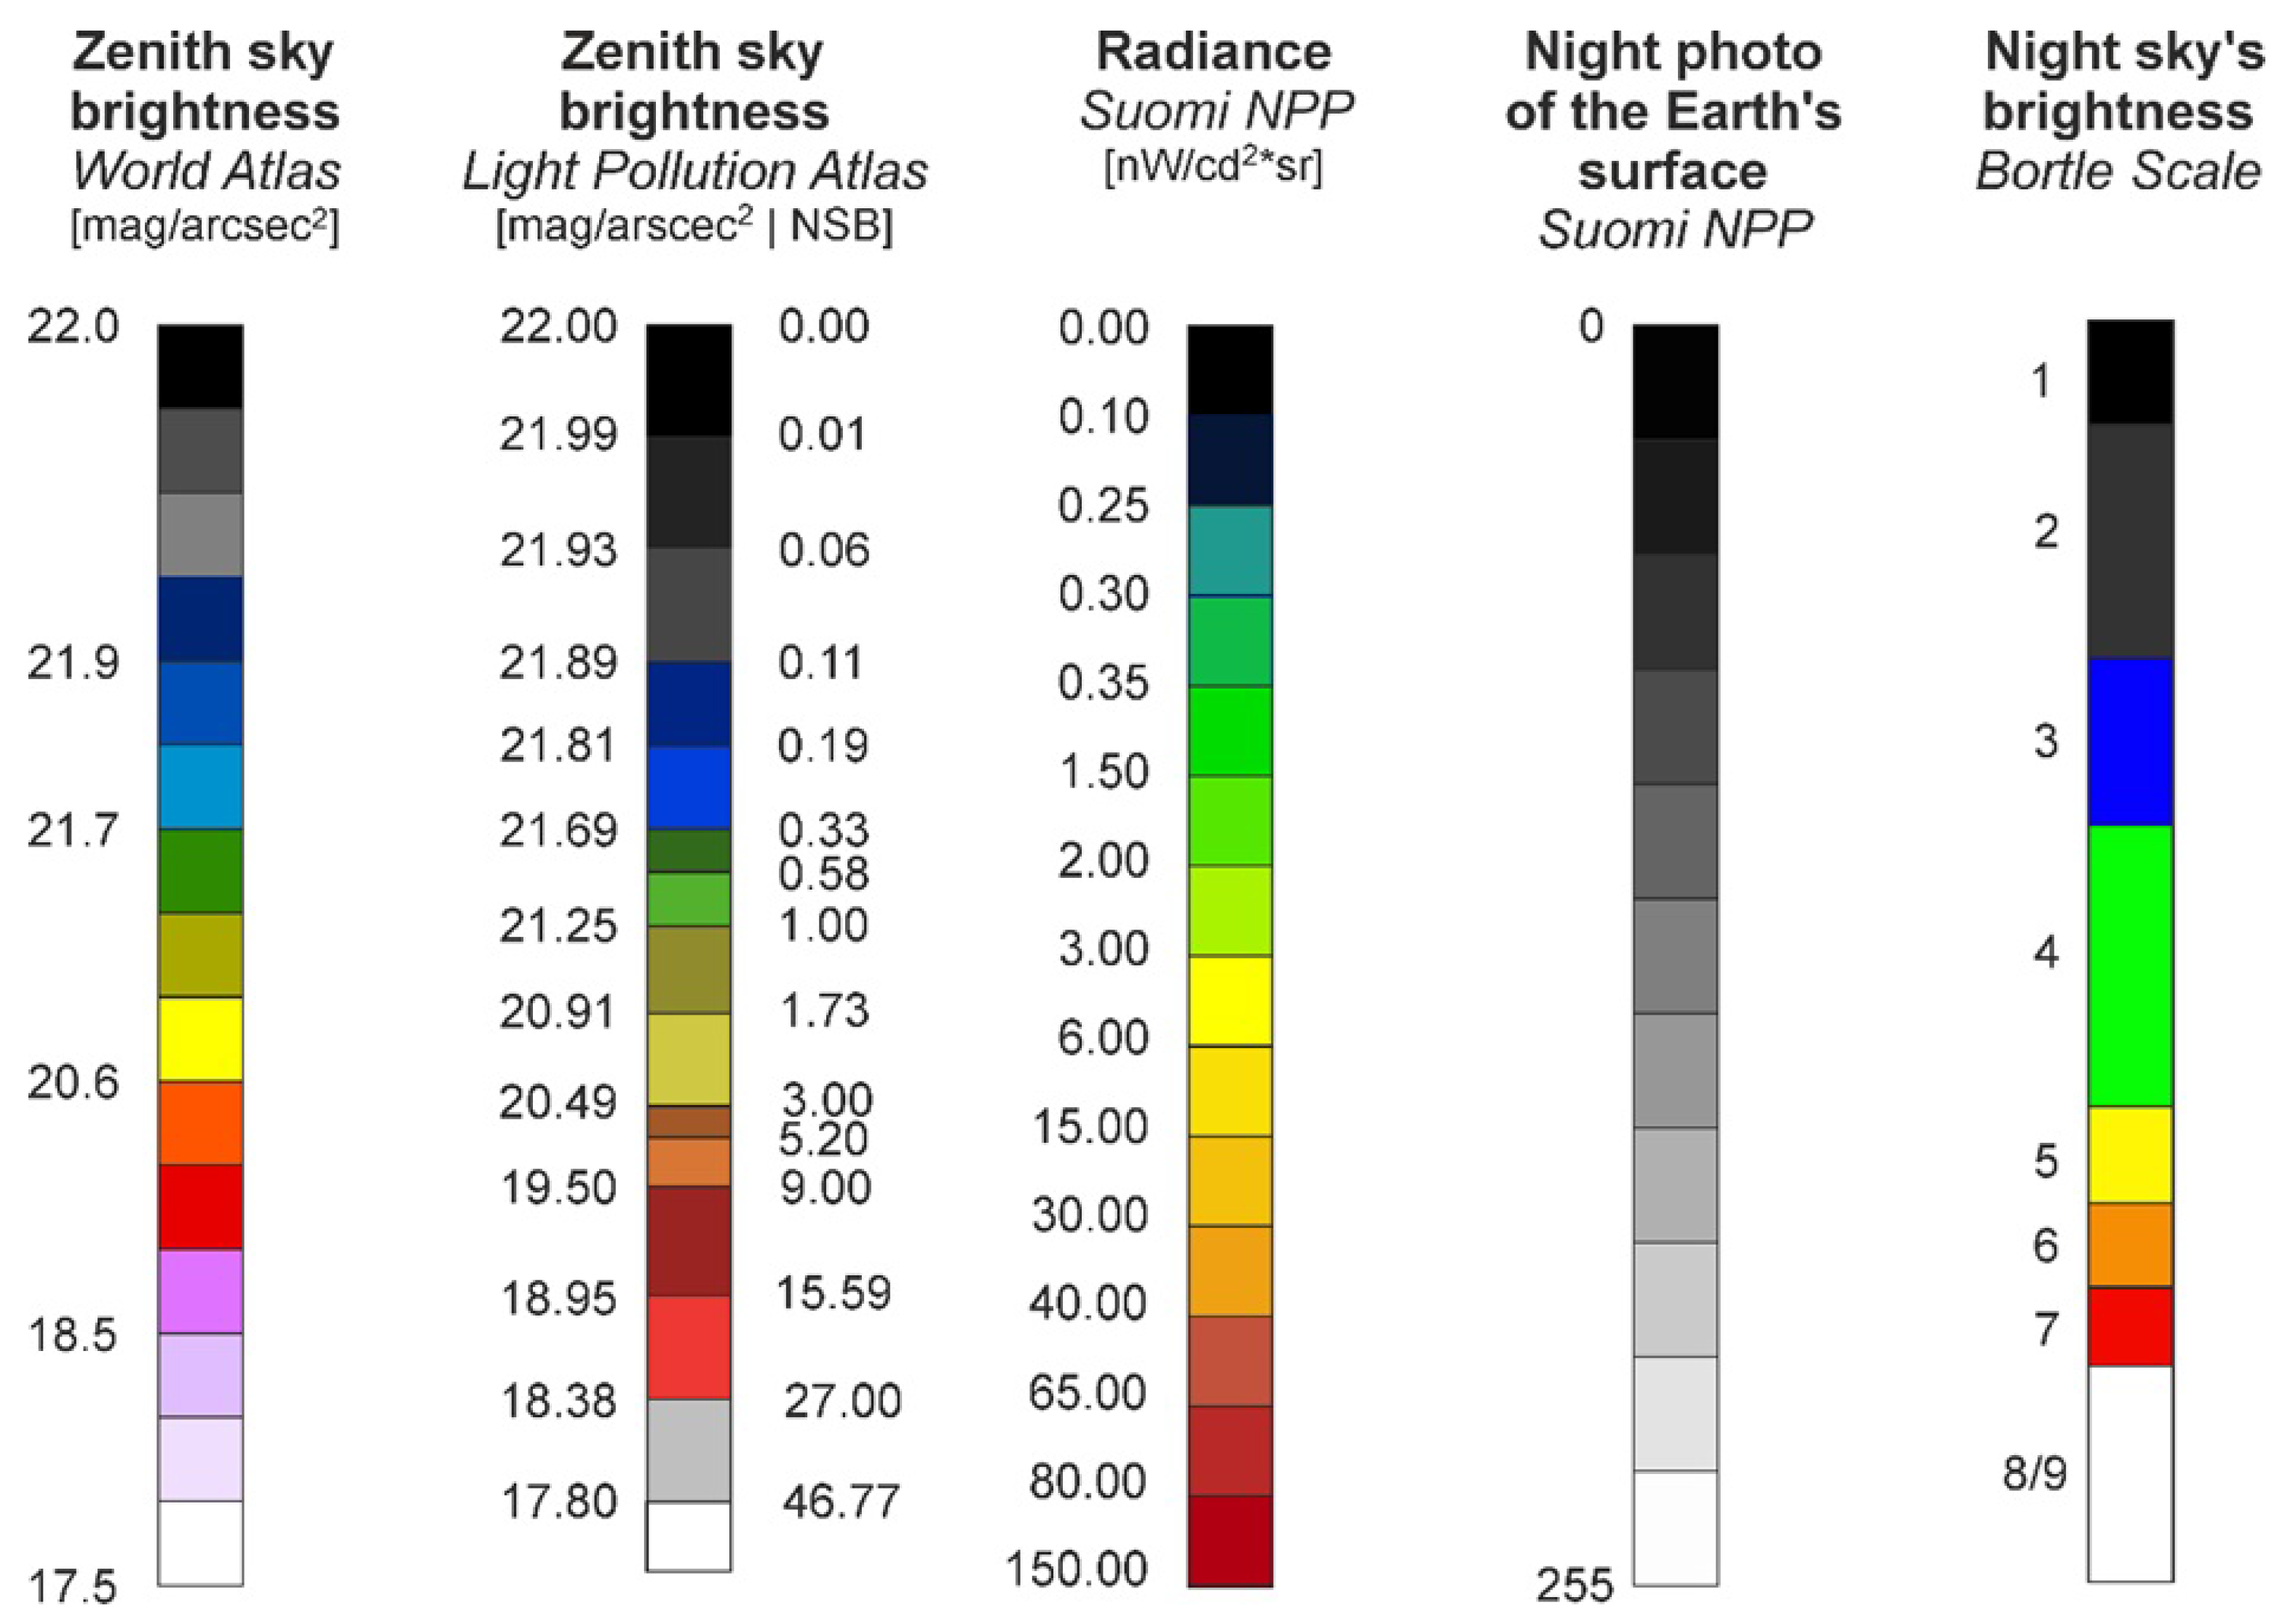
Figure 13.
Visualization of light pollution in the night sky in Toruń using a color scale: Light Pollution Atlas (left), World Atlas (middle) and author’s proposal (right).
Figure 13.
Visualization of light pollution in the night sky in Toruń using a color scale: Light Pollution Atlas (left), World Atlas (middle) and author’s proposal (right).
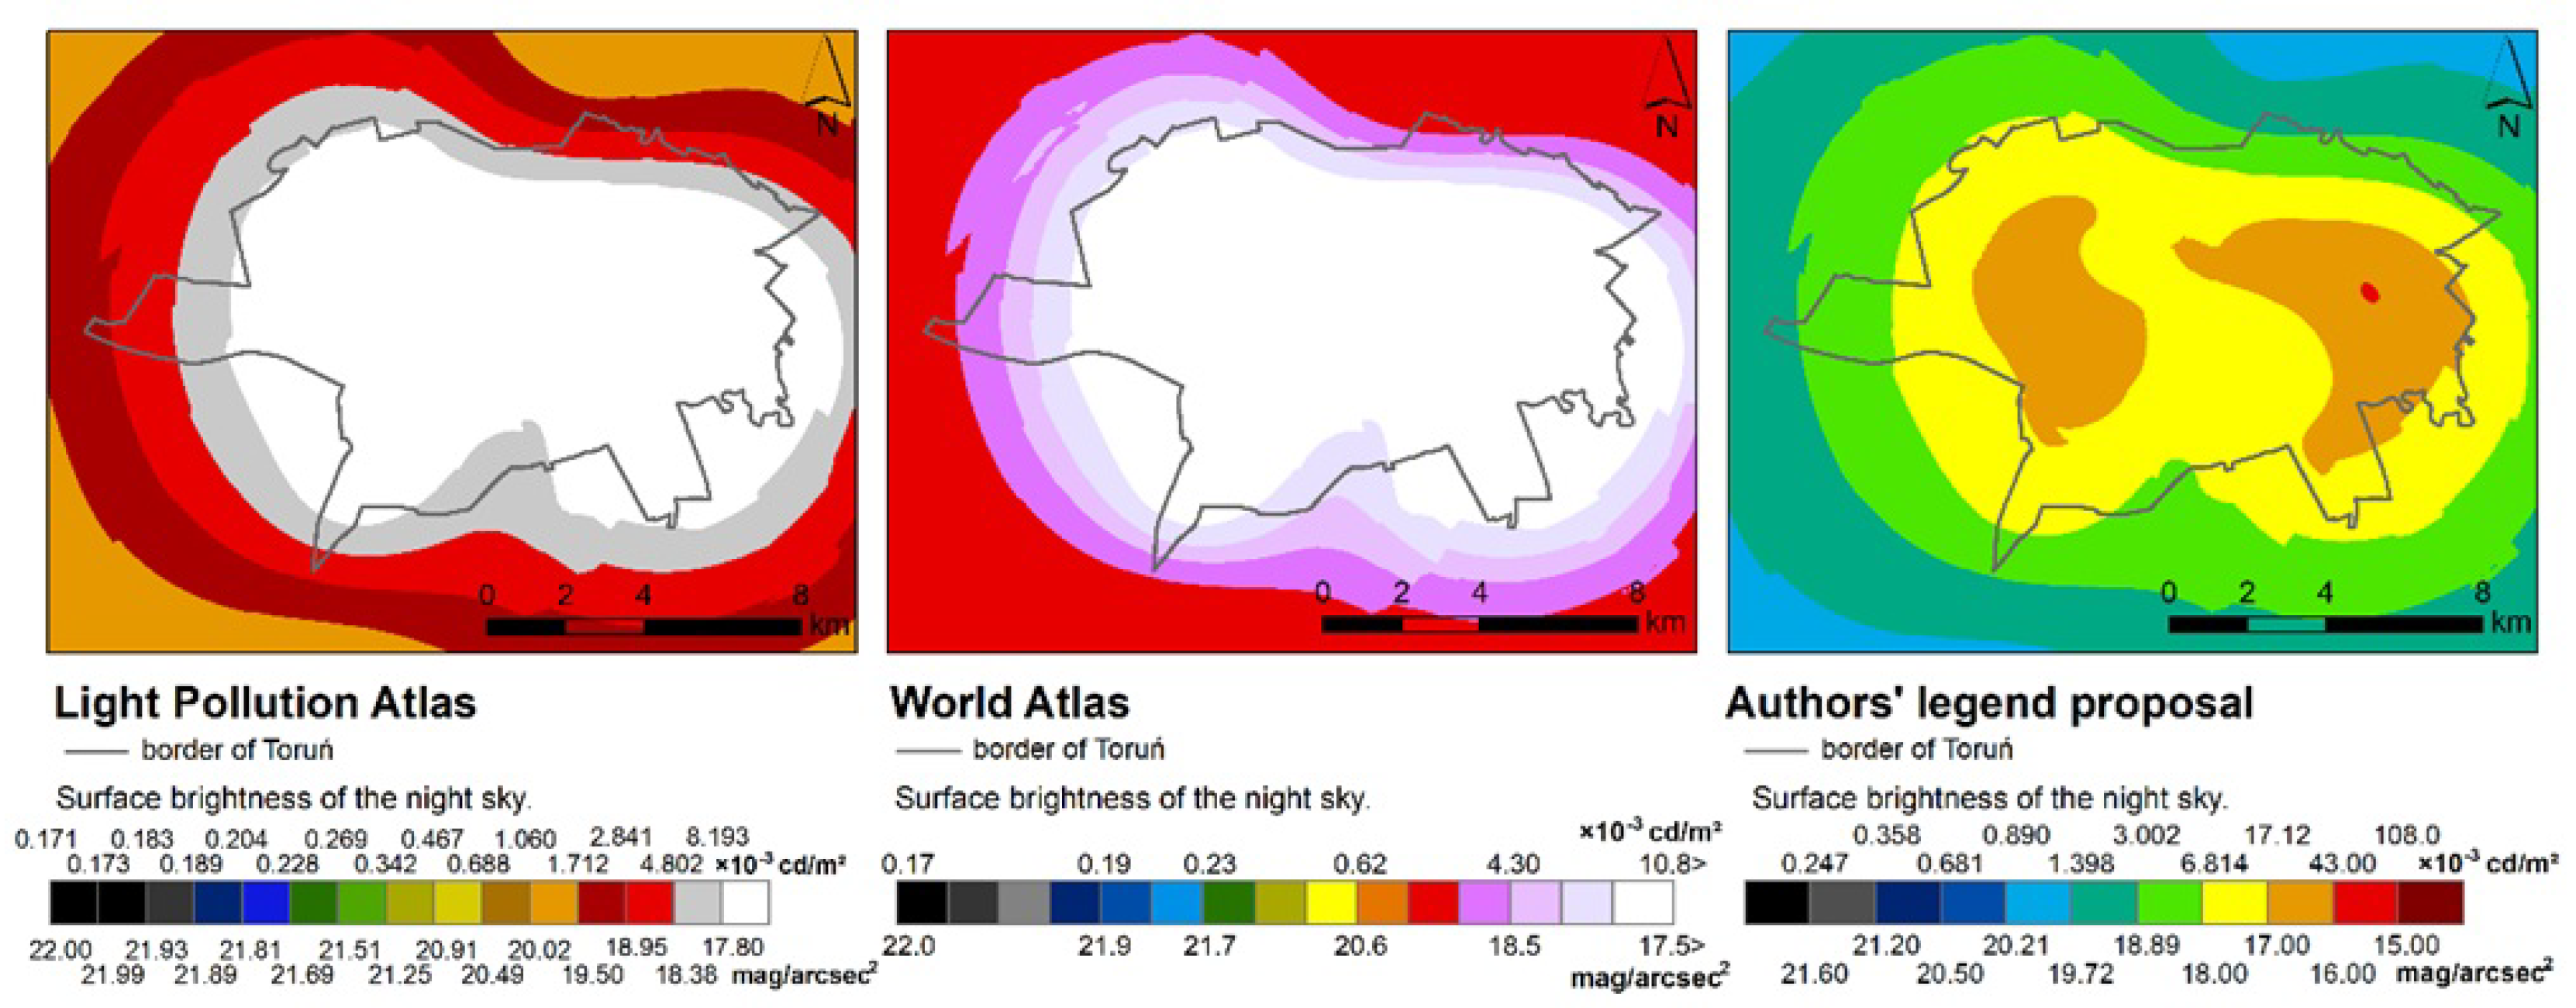
Figure 14.
Point symbols proposed for an emitter of excessive outdoor lighting as a supplement to the content of the official sozological map on a scale of 1:50,000 in the section on degradation of atmospheric air (symbols were enlarged four times, in the original its height is 0.3 cm).
Figure 14.
Point symbols proposed for an emitter of excessive outdoor lighting as a supplement to the content of the official sozological map on a scale of 1:50,000 in the section on degradation of atmospheric air (symbols were enlarged four times, in the original its height is 0.3 cm).
Figure 15.
Suggested point symbols in achromatic and monochromatic versions indicating the location of astrotourism sites.
Figure 15.
Suggested point symbols in achromatic and monochromatic versions indicating the location of astrotourism sites.
Figure 16.
Suggested point symbols in achromatic and monochromatic versions denoting areas with high pollution of the night sky by artificial light.
Figure 16.
Suggested point symbols in achromatic and monochromatic versions denoting areas with high pollution of the night sky by artificial light.
Disclaimer/Publisher’s Note: The statements, opinions and data contained in all publications are solely those of the individual author(s) and contributor(s) and not of MDPI and/or the editor(s). MDPI and/or the editor(s) disclaim responsibility for any injury to people or property resulting from any ideas, methods, instructions or products referred to in the content. |
© 2024 by the authors. Licensee MDPI, Basel, Switzerland. This article is an open access article distributed under the terms and conditions of the Creative Commons Attribution (CC BY) license (http://creativecommons.org/licenses/by/4.0/).
Copyright: This open access article is published under a Creative Commons CC BY 4.0 license, which permit the free download, distribution, and reuse, provided that the author and preprint are cited in any reuse.


