Preprint
Article

A Cox Proportional Hazards Model with Latent Covariates Reflecting Student’s Preparation, Motives, and Expectations for the Analysis of Time to Degree

Altmetrics

Downloads

34

Views

18

Comments

0

This version is not peer-reviewed

Submitted:

27 September 2024

Posted:

30 September 2024

You are already at the latest version

Alerts
Abstract
Issues related to the duration of university studies, have attracted the interest of many researchers from different scientific fields, as far back as the middle of the 20th century. In this study, a Survival Analysis methodology, and more specifically a Cox Proportional hazards model, has been pro-posed to evaluate a theoretical framework/model that relates the risk a student either graduating on time or having a late graduation, with a number of observed and latent factors that have been proposed in the literature as the main determinants of degree completion. The major findings of the analysis suggest that the factors contributing to the shortening of the duration of studies in-clude high academic achievements at early stages, positive motivation, expectations, attitudes, and beliefs about studies. On the contrary, external situations, negative academic experiences and some individual characteristics of the students contribute to an extended duration of studies.
Keywords: 
Subject: Social Sciences  -   Education

1. Introduction

Phenomena regarding quitting studies and late graduation were made noticeable at the early decades of the 20th century mainly in the U.S.A. [1]. Essentially such phenomena reflect the outcome of the studies when it is not identical to “on time graduation”, that is graduation as provided by the rules of an educational system or institution. Over time, and as education becomes most massive, similar phenomena occur in many countries or levels of education, while various terms have been used to describe them; these terms often reflect a local character of the phenomenon. Student mortality, attrition, late graduation, dropout, voluntary withdrawal, delayed college progress are some of those terms (see among others [1,2,3,4]). The systematic study of these phenomena and, in particular, of the risk for any of the above events as well as of the length of time until their occurrence and of the factors associated with them, caused, with an increasing mode, the interest of the researchers, given also that the volume of the students with such features became considerable [5,6,7]. This interest has to do with manpower planning for higher education graduates at nationwide or regional level. In addition, the corresponding research results are useful for planning and for educational policy decisions, at an institutional level, given that, lately, such issues are used as performance indicators while they should also be of interest to potential graduates. During the years, several theories or approaches have been proposed for understanding and explaining the above-mentioned phenomena. These approaches can be roughly categorized as psychological, sociological, organizational, and integrated [6].

1.1. Psychological Perspective—“Students’ Involvement Theory”

Regarding the psychological perspective, the main approach is based on what is known as student's involvement theory, proposed by Astin [8]. The idea is that student persistence is conditional to the amount of physical and psychological energy that the student devotes to the academic experience. Astin focuses on the effects of student characteristics (e.g., gender, age, and place of residence) as well as on the institutional characteristics (e.g., type, location and selectivity) on student retention.

1.2. Sociological Perspective—“Integration Model”

In the sociological perspective, Tinto’s [2] student integration model is the most cited. The model explores the joint interactions of academic and social systems that determine whether the student persists within an academic institution. Tinto's view is that student retention is positively related to student’s academic and social commitment to graduation. This commitment is directly conditional to student’s pre-college attributes and predispositions, e.g., socioeconomic status, academic ability, race and gender.

1.3. Organizational/Economic Perspectives—“Attrition Model”

In the organizational approach, concepts that are usually met in human research management are used to handle students' withdrawal from the universities. Thus, Bean's study on employee turnover and job satisfaction has been extended to study student attrition. The subsequent student attrition model explores the relationship between the organizational structures of the university institutions and student retention taking into account students’ perceived satisfaction from their studies [9].

1.4. Integrated Perspective—“Combination of Theories”

Finally, the integrated approaches combine elements of the above-mentioned theories towards a better explanation and understanding of the problem. By comparing both Tinto’s (1975) student integration model and Bean’s (1980) student attrition model, Cabrera, Nora and Castaneda (1993) found that they are not mutually exclusive but rather complementary.
Within this context, several statistical methodologies have been proposed towards the application of the above-mentioned theories to real cases. These methodologies vary from simple descriptive methods to multidimensional methods, for example ordinary and logistic regression [10] as well as structural equation models [11] and survival analysis methods (see among others, [5,7,12,13,14,15,16,17,18].
In the framework of the Greek higher education, there are results concerning the distribution of the duration of studies in a university oriented to social and political sciences given the condition that there is a lower time limit for graduation but there is no upper limit (this is a rule that covers university studies in Greece). This distribution is studied by means of survival analysis methods [13]. In particular, the distribution of the duration of studies has been studied by means of survival function (see Section 3), reflecting the probability an individual student will “survive at the university” or, speaking by means of graduation, will not graduate up to a given point of time t. The results show that there are three clear categories of students: those who graduate just after the threshold, those who graduate in a later time and those that may have a very late graduation or will not graduate at all.
In this paper, an analysis of such determinants is performed by means of a Cox Proportional Hazard Model (see Section 3) in order to investigate factors associated with or which caused the above-mentioned distribution of duration of studies. More specifically, building on Kalamatianou and McClean’s (2003) study, the objective of this paper is to evaluate a conceptual model (see Section 2), which draws on the model of Tinto (1975) and Bean (1980), that associates time to degree (or the previously mentioned distribution of the duration of studies) with a number of observed and latent variables, related to students’ prior academic achievement, motives, expectation and preparedness. These variables or factors have been proposed in the literature as the main determinants of students’ academic success and degree completion.
The results, reported in Section 4, demonstrate the value of the conceptual model and the suitability of its statistical counterpart while also they provide useful information regarding the factors associated with the duration of studies for the university from which the data is derived.

2. Materials and Methods

2.1. The Conceptual Model, the Variables and the Data

This paper supposes that the duration of studies, considered as the dependent variable, is related to four categories of variables, as it is briefly shown in Figure 1. For the sake of brevity, the variables included in each category, along with the coding of their values, are described below.
Dependent variable: Duration of studies, measured (in months) as the time between the first enrolment in the university and a) the graduation date for the students that have obtained their degrees -complete observations b) the end date of the follow up period, which lasted until the end of June 2012, for non- graduate’s student -right censored observations (for details see [14]).
Explanatory variables/ Covariates: Here we considered four categories of observed and latent covariates, assumed to be time independent. In order to compose latent variables, we used the Gutman’s Accumulative Scale of methodology of latent summation score [23].
The first category represents Students’ Personal Characteristics as well as Prior Academic Achievements corresponding to six observed variables:
X1. Gender:(1, male; 0, female),
X2. Place of Origin: (1, Athens; 0, other),
X3. Students’ Age at the time of university enrolment: (Age of each individual at the time of enrolment at the university)
X4. Secondary school grades: (the score ranges from 10-minimum grade required for admission to university-to 20),
X5. University access score:(is the mean mark in the university entrance examination score),
X6. Way of admission to the university: (1, General examination; 0, other)
The second category represents Time Commitment, interests, and participation and includes 10 observed and one latent covariate:
X7. Study habits:(1, Studying throughout the semester; 0, not at all or during examination period),
X8. Attendance:(1, continuously; 0, sometimes or less),
X9. Class participation:(1, Yes; 0, No).
X10. Prior interest in field of studies(1, Yes; 0, No),
X11. Satisfaction derived from the curriculum:(1, Yes; 0, No),
X12. Satisfaction derived from the course(1, Yes; 0, No),
X13. Order of preference of the Department of Studies,
X14. Work during studies(1, Had a job during studies; 0, otherwise),
X15. Unforeseen factors during studies(1, Yes; 0, No),
X16. Academic performance: Average score of the first two semesters of studies(the score ranges from 0 to 10).
In addition to this second category of variables one more latent covariate is included:
X17. Academic adjustment.To capture academic adjustment, five observed variables were scored. These correspond to: Participation to the university events, Participation to students’ parties and other political events, Participation in students’ election activities, “Hanging outwith classmates, and Living in University Campus.
The third category represents students’ Motives for choosing the particular university department and expectations from it and includes four observed and one latent covariate as bellow:
X18. Vocational rehabilitation(1, Yes; 0, No),
X19. Skills and qualifications required by the labor market(1, Yes; 0, No),
X20. Prestige that is expected to be gained from the specific curriculum(1, Yes; 0, No
X21. Knowledge acquisition on the specific science)
X22. Parental socioeconomic status (SES) which is a latent variable measured on the base of parental educational, occupational, and income level (1, High SES; 0, Low SES)
The fourth category corresponds to students’ preparedness for entering the university and includes two latent covariates:
X23. The influence on the decision of the student to be admitted to university measured on the base of the following variables/questions: The selection of the particular field of studies was based on students' desire for education, Τhe selection of the particular field of studies was based on students' personal choices, The parental interest in the progress of students throughout the duration of studies.
X24. The reasons which led the students to pursue university studies measured by the following reasons/variables: Social advancement, Social recognition, Personal improvement, Social mobility, Greek society considers self-evident that someone has to attend university, The independence from the family environment, Obtaining general knowledge, Obtaining prestige as university graduates, Parental expectations, The experience of "student life".
In order to test the applicability of the above model to the Greek reality, data was collected in a period of 18 months (from September 2012 until February 2014) by using a questionnaire on a sample of 1,236 cases. The sample derives from a population which amounts to 20,892 observations which represent study times (in months) of students who entered different departments of a certain Greek University, from the academic year 1983-84 to 2005-2006 (i.e., 23 consecutive cohorts). The sample was collected using finite populations sample techniques for censored data [19] and it was a proportionally stratified sample for gender and academic department [20]. Subsequently, data was analyzed by means of a Cox proportional hazards model as described in next Section.

2.2. The Statistical Model

Survival analysis is an often-used method for observing duration between events. The basic concepts and terminology of the survival analysis are as follows: T is considered as a random variable that represents survival time, in our case duration of studies. Then, the survival distributions of T can be described by four functions, which for the purposes of this study express graduation probabilities, as follows: f(t) is defined as the graduation probability density function and F(t) as the cumulative graduation density function. The survivor function is S(t) = 1-F(t), defined in this context as the probability that a student has not graduated, immediately past time t. Then, the hazard function H(t) = f(t)/ S(t) is defined as the instantaneous graduation rate or, in other words, as a measure of the likelihood of a student to graduate at time t, given that the specific student has stayed in university until time t [21]. In the context of survival analysis, various methods have been proposed to examine the relationship of survival distributions with a number of independent variables (commonly known as covariates). Cox Proportional Hazard Model or Cox Model is such a method proposed by [22] and may be briefly described as follows:
At time t for an individual with a vector of explanatory variables x= (x1,…,xg), the Cox model defines the hazard function by the following equation:
H ( t ; x ) = h 0 ( t ) exp ( x β )
where β = (β1,…,βg) is a vector of regression coefficients, reflecting the effects of the vector x of explanatory variables on survival time, and h0(t) is an arbitrary unspecified baseline hazard function for an individual with x= 0 [23]. The model described in equation (1) is semi-parametric because, while the baseline hazard function h0(t) can take any form (follow any distribution), at the same time the quantity exp (xβ) must follow the exponential distribution with parameter λ=1 [24]. In addition, the effects of the explanatory variables/covariates over h0(t) are assumed constant over time. Recalling equation (1), it must be noted that in this particular analysis each regression coefficient βi has the interpretation that a unit increase in the ith covariate, Xi, increases the hazard of graduation by the multiplicative factor exp(βi).

2.3. The Empirical Model

It is considered that the random variable Yt represents the duration of studies for each one of the 1,236 students, members of the sample, as described in Section 2. It is also considered that the dependent variable Yt is associated with 24 covariates/independent variables, four latent and 20 observed (as it is shown in brevity in Figure 1 and described in Section 2), on the basis of the Cox proportional hazards model described by the following equation:
H ( Y t i ) = h 0 ( Y t ) e β 1 Χ 1 + β 2 Χ 2 + . . . + β 24 Χ 24
where, I denotes each one of the i=1, 2, …, n students (members of the sample); in this case, n=1.236. H (Yti) is the hazard function, Yti represents duration of studies for each one of the above students, Xg denotes each one of the of covariates and βg symbolizes each one of the coefficients; where g=1, 2, …, 24. Finally, xig is the value of the g covariate, on ith student. It is considered that the above model (see Figure 1 and Equation 2) can adequately describe the factors affecting time until graduating in the case of Greek higher education. Subsequently, the above model was applied in real cases using the SPSSv23 statistical package and the results are described in Section 3.

3. Results

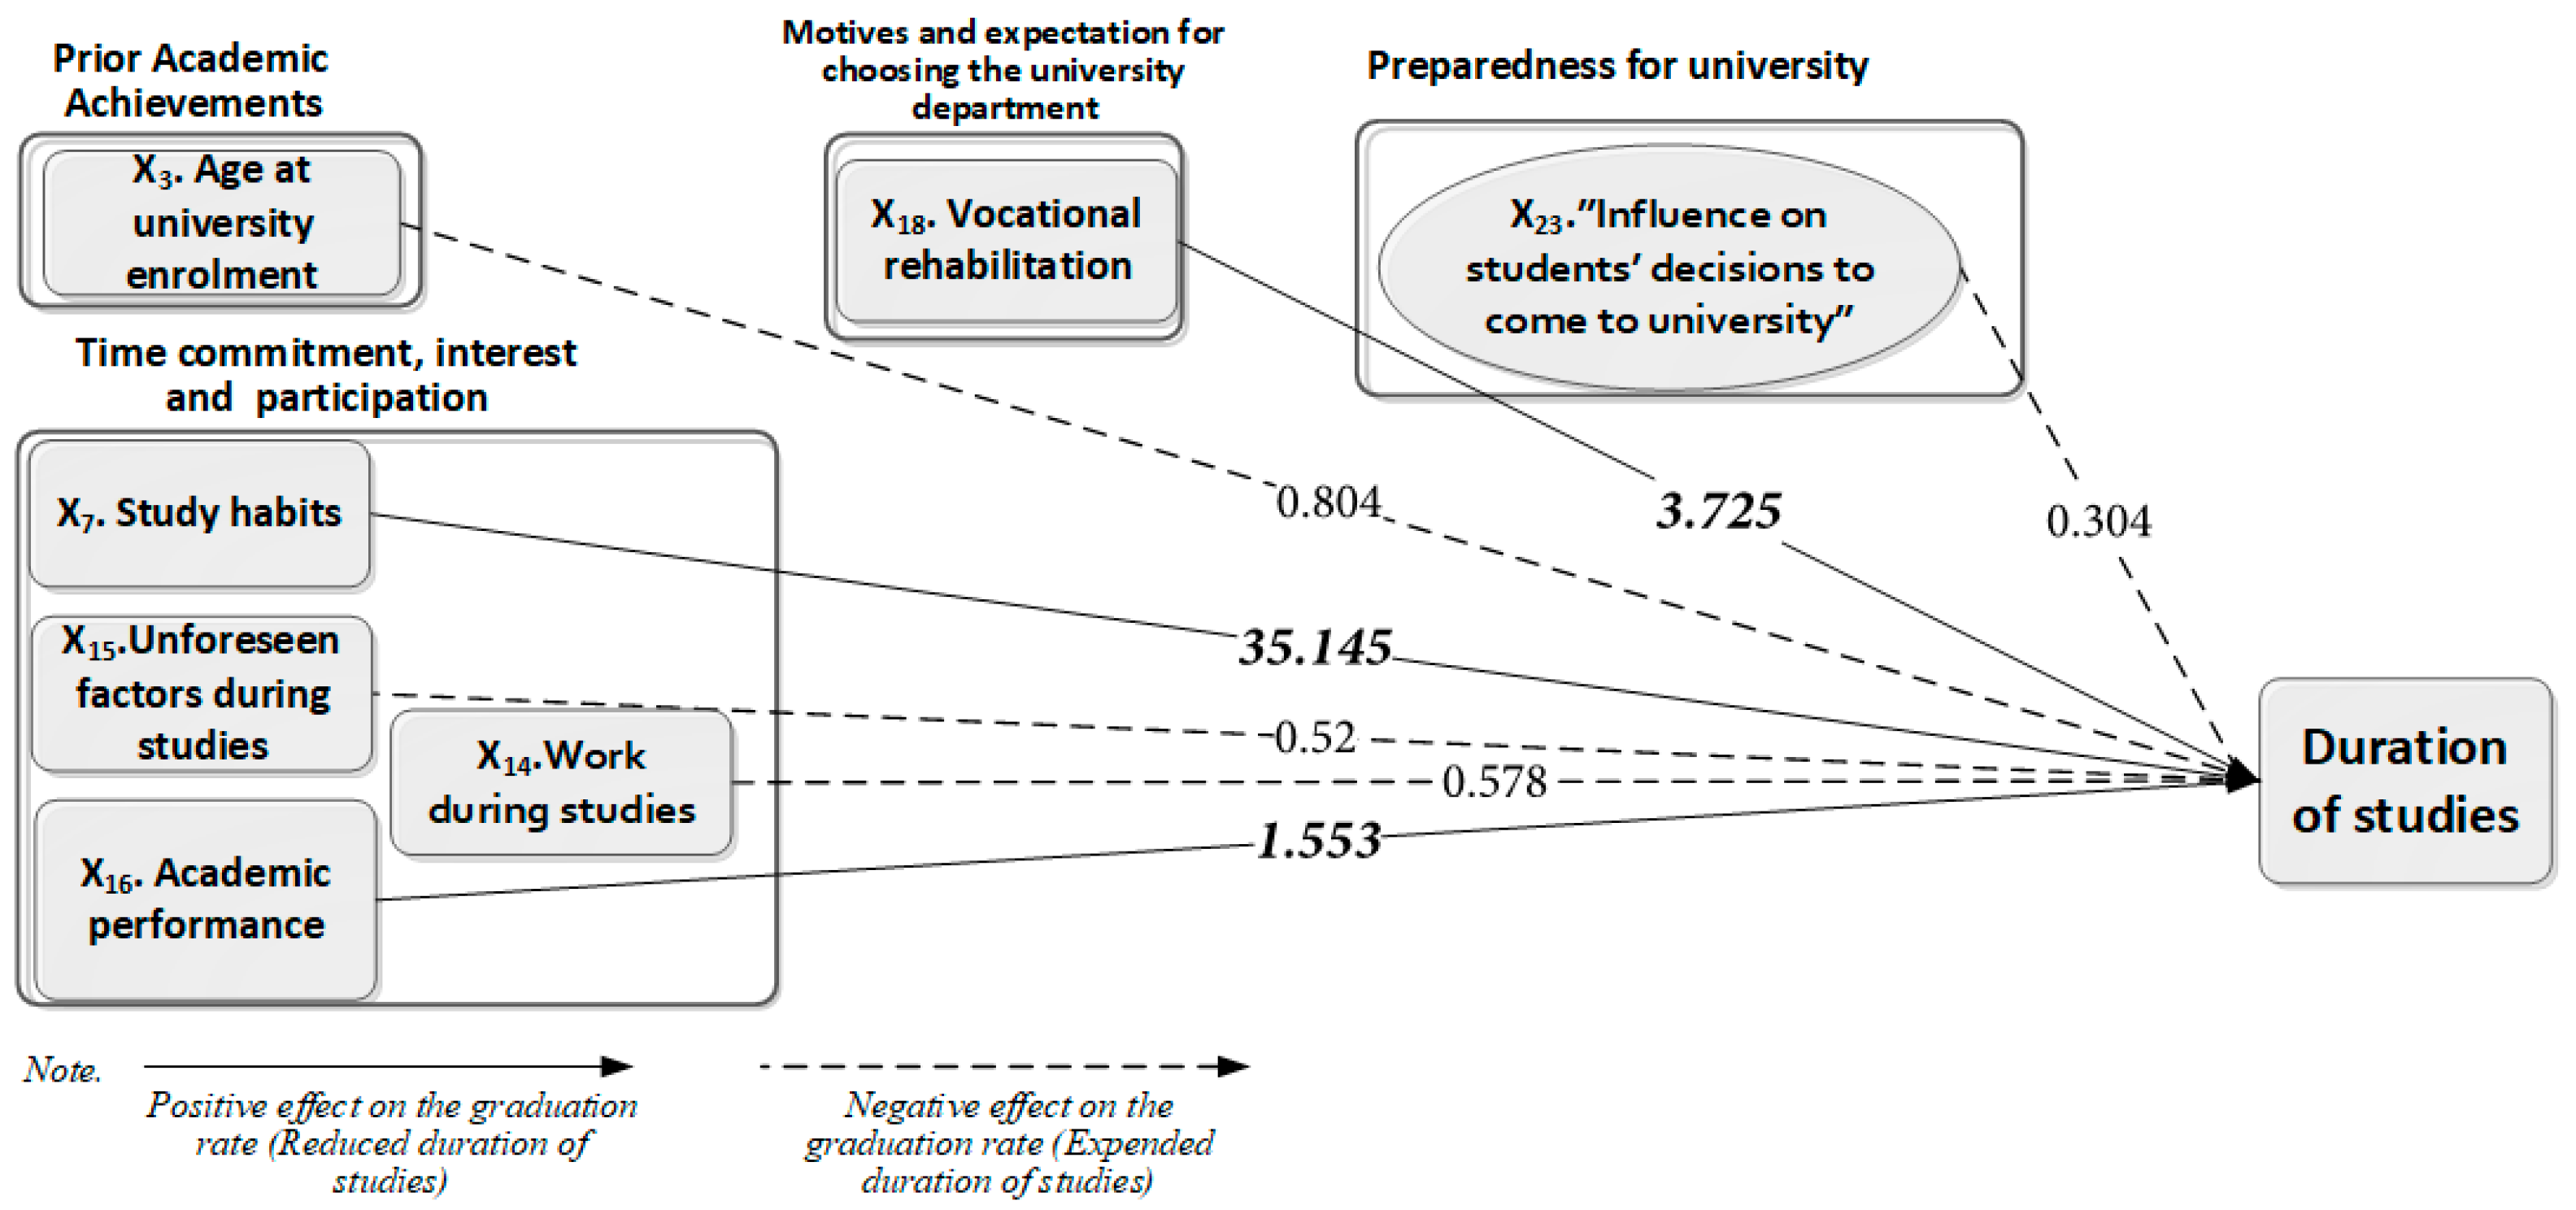
Figure 2 represents the estimates of the significant regression coefficients eβi of the model described in Equation (2). Based on these results, one could argue the following: Study habits, vocational rehabilitation, academic performance, unforeseen factors, and work during studies, as well as gender, age at admission in the university, and finally the reasons which led the students to pursue university education, appear to have a significant impact on the duration of studies.
The first four of the above covariates have a positive effect on the graduation rate in the sense that they reduce the duration of studies. In particular, students studying throughout the semester (i.e., variable Study Habits) tend to graduate faster than those who study during the examination period or less. Quoting that for these students exp (β) is bigger than one (eβ7=35.145), it follows that the students who study throughout the semester graduate 35 times sooner. Vocational rehabilitation expectations from studies accelerate the graduation time as well. Again, students who have the above expectations tend to graduate almost four times faster (eβ18=3.725) than those who do not. Another factor that contributes to faster graduation is academic performance. In fact, as the average score achieved at the end of the first two semesters is increased by one unit, the graduation rate is increased one and a half time (eβ16=1.553).
The remaining covariates have a negative effect on the graduation rate in the sense that they extend the duration of studies. More specifically, the exp(β) for male students (i.e., value 1 for the gender covariate) is less than one (eβ1=0.757). It follows that men’s graduation time is expected to be 24.3% higher than that of women (100× (1-0.757) = 24.3). Also, it is clear that students’ conjunctures taking place during studies, like illness and work, are key factors that tend to increase the time to graduate. Indeed, students who experience unforeseen factors during their studies have a 48.2% later graduation than those who have not (eβ15=0.52; 100× (1-0.52) = 48.2%); similarly, those who work during their studies tend to graduate 42% later than those who do not (eβ14=0.578; 100× (1-0.578) = 42.2%). Also, it seems that students who have enrolled at the university at an older age than usual, and students whose decision to pursue university studies was influenced by others graduate later. In fact, students that enrol in university at an older age experience almost 22% (eβ3= 0.804; 100× (1-0.804) = 19.6) slower graduation rates than those who enrol in university at the usual age. And finally, students whose decision to be admitted to university was influenced by others have almost 70% slower graduation rate than those who were not (eβ23=0.304; 100× (1-0.304) = 69.6%).

4. Conclusions

In this study, a Cox’s Proportional Hazards Model was used for the evaluation of a theoretical model for the factors affecting time to degree. In the above framework, a conceptual model was developed, through which the duration of studies is associated with specific observed and latent factors/covariates. These factors either pre-exist students’ enrolment in the university or they are formulated later during their studies. Following that, a Cox Proportional Hazards Model was employed for testing the applicability of the above theoretical model on real data. The results indicate that Cox’s Proportional Hazards Model proved suitable in approaching and interpreting factors associated with academic success in higher education, measured in terms of time to graduate. Overall, a first conclusion from the proportional hazards model developed here, is that the students who study throughout the semester, expect vocational rehabilitation, and achieve high average scores by the end of the first two semesters of their studies tend to graduate faster.

References

  1. J. Mcneely Specialist in Higher Education, Division of Higher Education United States Department Of The Interior Office Of Education J. W. Studebaker, Commissioner United States Government Printing OFFICE.
  2. V. Tinto. Dropout from Higher Education: A Theoretical Synthesis of Recent Research. Winter, 1975.
  3. A. F. Schoenfeldt. Personal and Environmental Factors Associated with College Dropouts Among High Aptitude Students. 1966.
  4. W. G. Spady and / Oise. Dropouts from Higher Education: Toward an Empirical Model’.
  5. C. Aina. Parental background and College drop out. Evidence from Italy. 2005.
  6. B. A. Vander Schee. College Student Retention: Formula for Student Success (review). J Coll Stud Dev 2007, 48, 360–362. [Google Scholar] [CrossRef]
  7. R. D. Reason. Student Variables that Predict Retention: Recent Research and New Developments. 2009.
  8. A. W. Abtin. Cone Dropouts: A National Profile This Document Has Been Repro-Duced Exactly As Received From The Person Or Organization Orig-Inating It. Points Of View Or Opin-Ions Stated Do Not Necessarily Represent Official Office Of Edu-Cation Position Or Policy.
  9. J. P. Bean. DROPOUTS AND TURNOVER: The Synthesis and Test of a Causal Model of Student Attrition. 1980.
  10. J. P. Smith and R. A. Naylor. Dropping out of university: a statistical analysis of the probability of withdrawal for UK university students.
  11. M. C. Voelkle and N. Sander. University Dropout: A Structural Equation Approach to Discrete-Time Survival Analysis. J Individ Differ 2008, 29, 134–147. [Google Scholar] [CrossRef]
  12. A. L. Booth, S. E. A. L. Booth, S. E. Satchell, and A. L. Bootht. The Hazards of Doing a PhD: An Analysis of Completion and Withdrawal Rates of British PhD Students in the 1980s. 1995. [Google Scholar]
  13. G. Kalamatianou and S. McClean. The Perpetual Student: Modeling Duration of Undergraduate Studies Based on Lifetime-Type Educational Data.
  14. W. Arulampalam, R. Naylor, and J. Smith. Factors affecting the probability of first year medical student dropout in the UK: A logistic analysis for the intake cohorts of 1980-92. Med Educ 2004, 38, 492–503. [Google Scholar] [CrossRef] [PubMed]
  15. J. P. Smith and R. A. Naylor. Dropping out of university: a statistical analysis of the probability of withdrawal for UK university students.
  16. S. Herzog. Measuring determinants of student return vs. dropout/stopout vs. transfer: A first-to-second year analysis of new freshmen. Res High Educ 2005, 46, 883–928. [Google Scholar] [CrossRef]
  17. M. S. Visser, M. Luwel, and H. F. Moed. The attainment of doctoral degrees at Flemish Universities: A survival analysis. High Educ (Dordr) 2007, 54, 741–757. [Google Scholar] [CrossRef]
  18. A. H. Marshall and M. Zenga. Simulating Coxian phase-type distributions for patient survival. International Transactions in Operational Research 2009, 16, 213–226. [Google Scholar] [CrossRef]
  19. “E. B. Marc, J. S. “E. B. Marc, J. S. Maurice, and J. S. Richard, Cancer Clinical Trials Methods and Practice (New York, Oxford University Press, 1985).”.
  20. “92_Snedecor_ΒOOΚ_Statistical Methods”.
  21. J. R. Chimka, T. Reed-Rhoads, and K. Barker. Proportional hazards models of graduation. J Coll Stud Ret 2007, 9, 221–232. [Google Scholar] [CrossRef]
  22. D. R. Cox. Biometrika Trust Partial likelihood. 1975.
  23. “Cox Proportional-Hazards Regression for Survival Data.
  24. R. N. Fox. Application of a Conceptual Model of College Withdrawal to Disadvantaged Students. 1986.
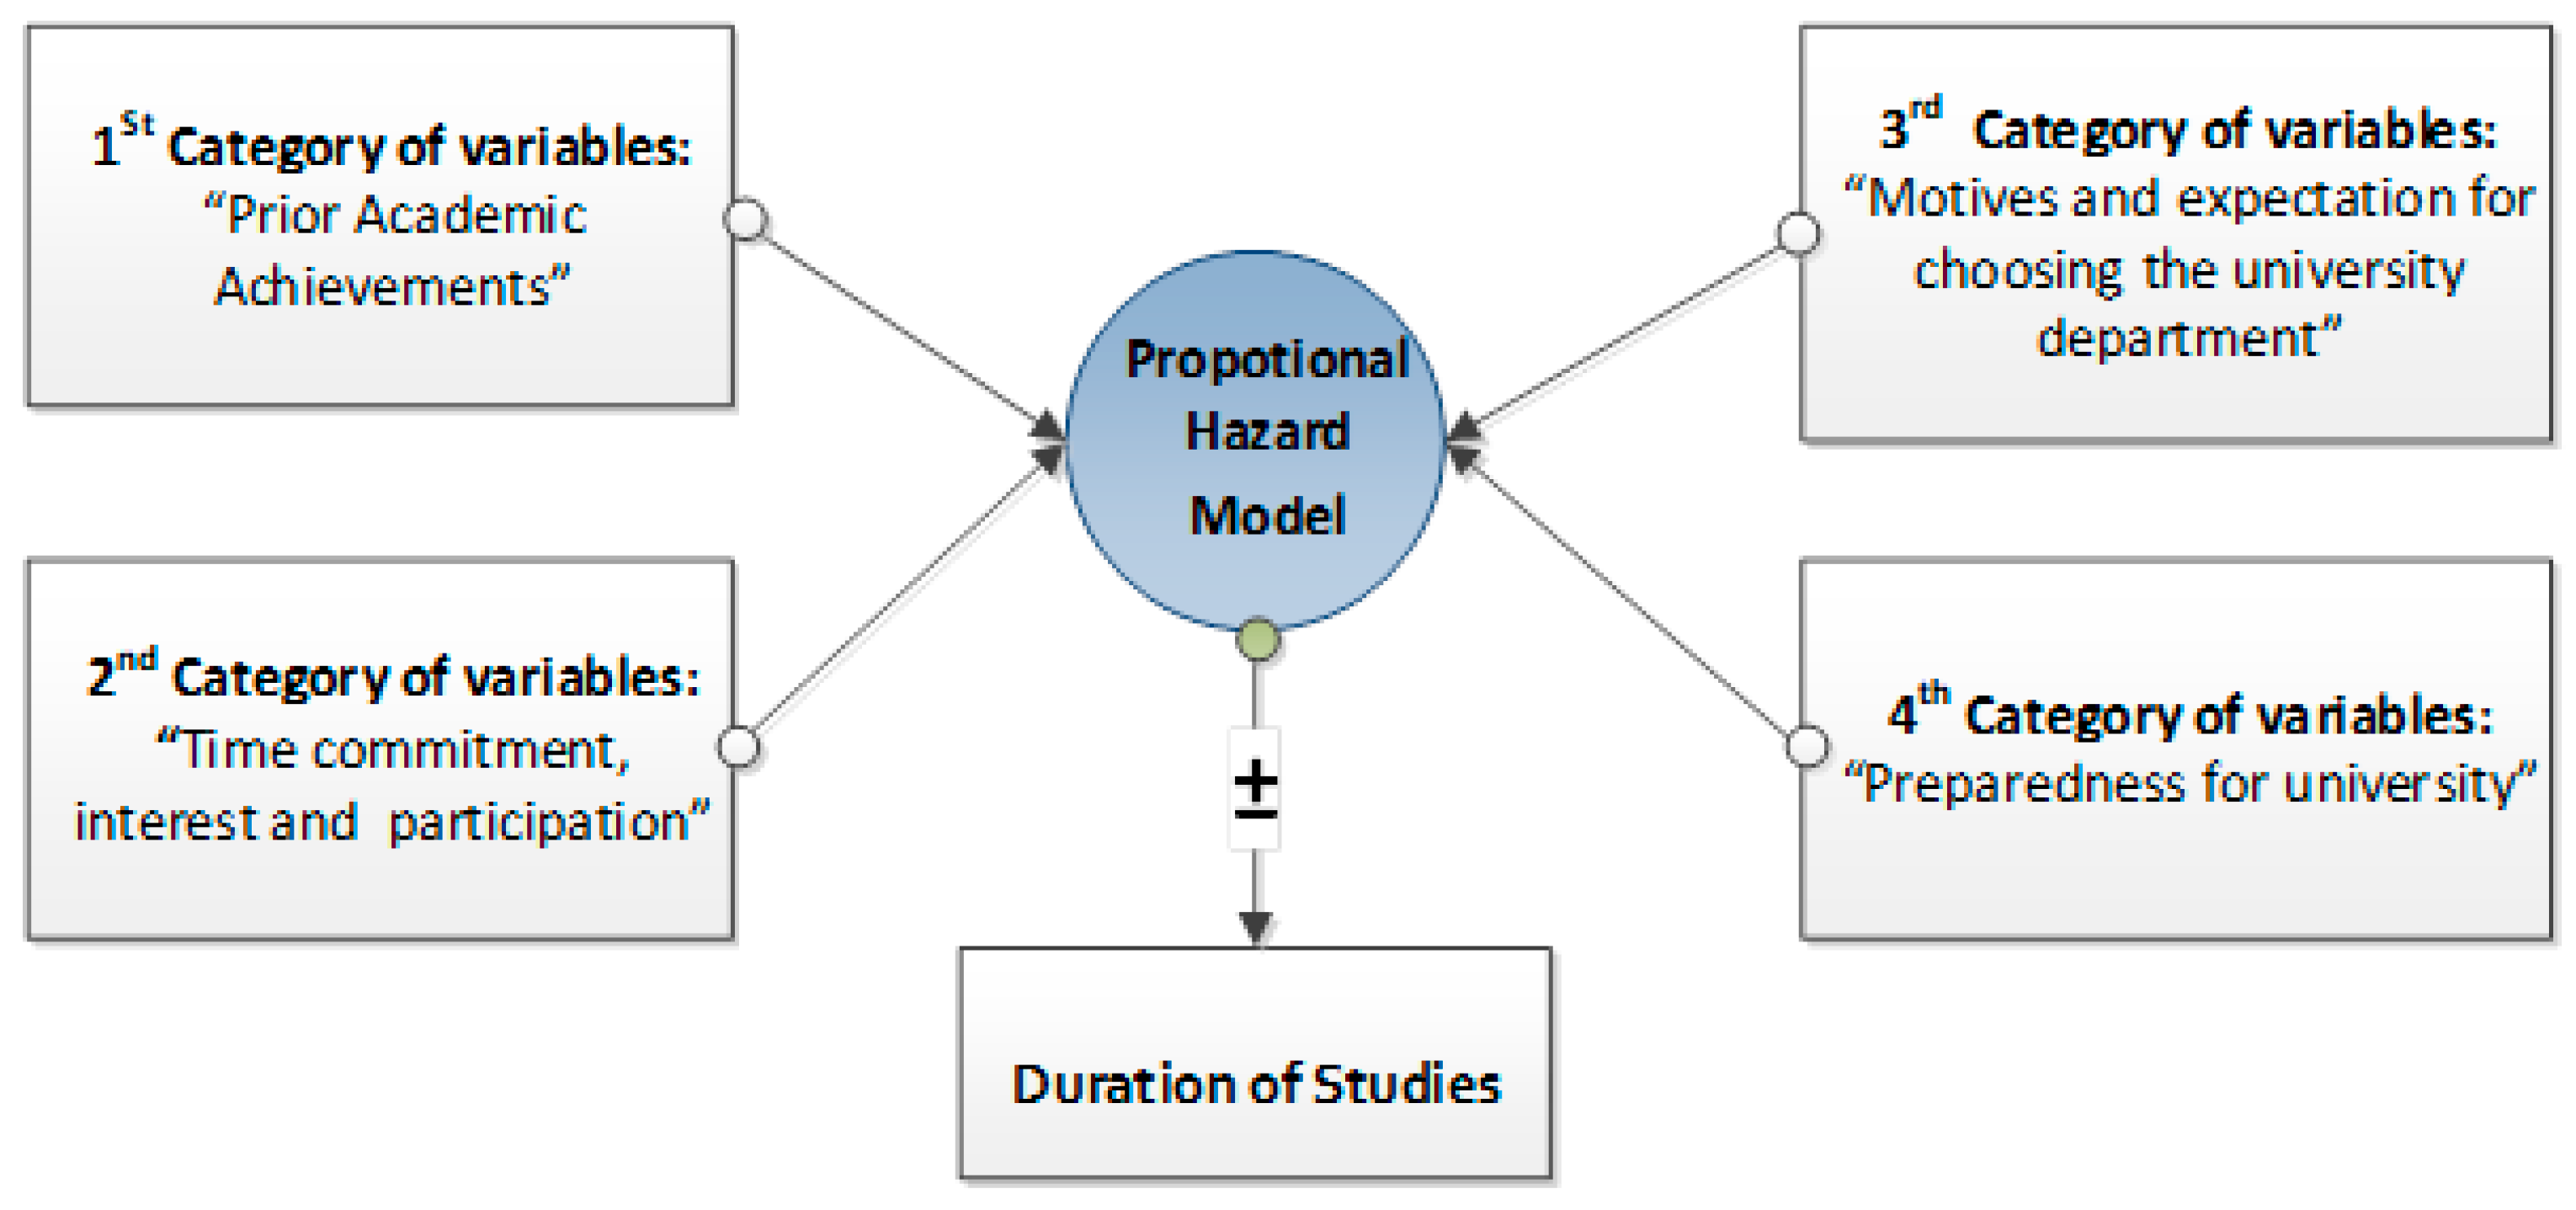
Figure 1. Graphical representation of the conceptual model.
Preprints 119579 g001
Figure 2. Graphical representation of the statistically significant covariates.
Preprints 119579 g002
Disclaimer/Publisher’s Note: The statements, opinions and data contained in all publications are solely those of the individual author(s) and contributor(s) and not of MDPI and/or the editor(s). MDPI and/or the editor(s) disclaim responsibility for any injury to people or property resulting from any ideas, methods, instructions or products referred to in the content.
Copyright: This open access article is published under a Creative Commons CC BY 4.0 license, which permit the free download, distribution, and reuse, provided that the author and preprint are cited in any reuse.
Prerpints.org logo

Preprints.org is a free preprint server supported by MDPI in Basel, Switzerland.

Subscribe

© 2024 MDPI (Basel, Switzerland) unless otherwise stated