1. Introduction
Scientific interest in finding alternatives to the worldwide problems stemming from population growth and limited fossil fuel resources has increased in recent years. The focus has been on producing green energy and using materials to store it. Hydrogen storage is a desirable option for this purpose.
The development of materials for hydrogen storage remains a significant challenge. The US Department of Energy (US-DOE) highlights the importance of finding a material that can store hydrogen with high gravimetric and volumetric density while being environmentally friendly [
1]. To achieve optimal adsorption and desorption, the adsorption energies for storing H2 molecules should fall within the range of 0.1 eV to 0.2 eV [
2,
3]. Various methods exist to generate renewable energy sources for hydrogen production. Electrolytic hydrogen production offers an alternative to hydrogen production for internal combustion engines and fuel cells [
4]. The hydrogen evolution reaction (HER) is a critical electrocatalytic reaction, with hydrogen adsorption on the electrode playing a crucial role. In the past, Pt-based materials were considered the best HER catalysts. However, it is essential to find cheaper and more abundant alternatives to Pt materials [
5]. Molybdenum sulfide was the first reported alternative to Pt-based materials for catalyzing the HER in acidic aqueous solutions [
6]. Since then, research on low-cost HER electro-catalysis materials has gained prominence [
7,
8,
9,
10,
11,
12,
13,
14].
A current field of investigation is searching for adequate materials for molecular hydrogen storage with the necessary gravimetric capacity at ambient temperature and pressure [
15,
16,
17,
18,
19,
20,
21,
22,
23,
24,
25,
26,
27,
28,
29,
30,
31,
32]. The research interest in hydrogen energy is based on its great potential to replace fossil fuels [
33].
On the other hand, currently, the first-principles calculations applied in the exploration of new materials for hydrogen storage are performed solely by simple energy optimization, as seen in [
23,
33,
34]. Our aim in this investigation is to have a way to predict if the molecular physisorption obtained by simple energy optimization exists for a given temperature. This means determining if the kinetic energy given to the system when the effect of temperature is included, destroys the molecular physisorption obtained by simple energy optimization.
We investigated the direct interaction between a MoP2 surface and H2 molecules for hydrogen storage using DFT calculations. Additionally, we explored the influence of Mo vacancies on the gravimetric capacity of hydrogen adsorption on a MoP2 surface. Our study involved FPMD calculations at atmospheric pressure and 300 K, 77 K, 4 K, and 3 K to assess the system's stability under varying conditions.
2. Materials and Methods
We performed ab initio DFT calculations to study hydrogen storage on the 2D material MoP
2. We considered the pristine material and the same material with 12.5% Mo vacancies. We employed the generalized gradient approximation (GGA) with the exchange-correlation energy given by Perdew-Burke-Ernzerhof double-zeta polarized basis sets and norm-conserving pseudopotentials [
35,
36]. Our calculations used the SIESTA code [
37] and the spin-polarized density functional formalism. We followed the Monkhorst–Pack scheme [
38] and considered a Brillouin zone sampling of 24x24x1 k-points. We took an energy cutoff of 180 Ry for numerical integrations. The geometries of the studied systems converged until forces between atoms were smaller than 0.01 eV/Å. To consider dispersion forces, we included the Van der Waals interactions using Grimme's semi-empirical approach [
39].
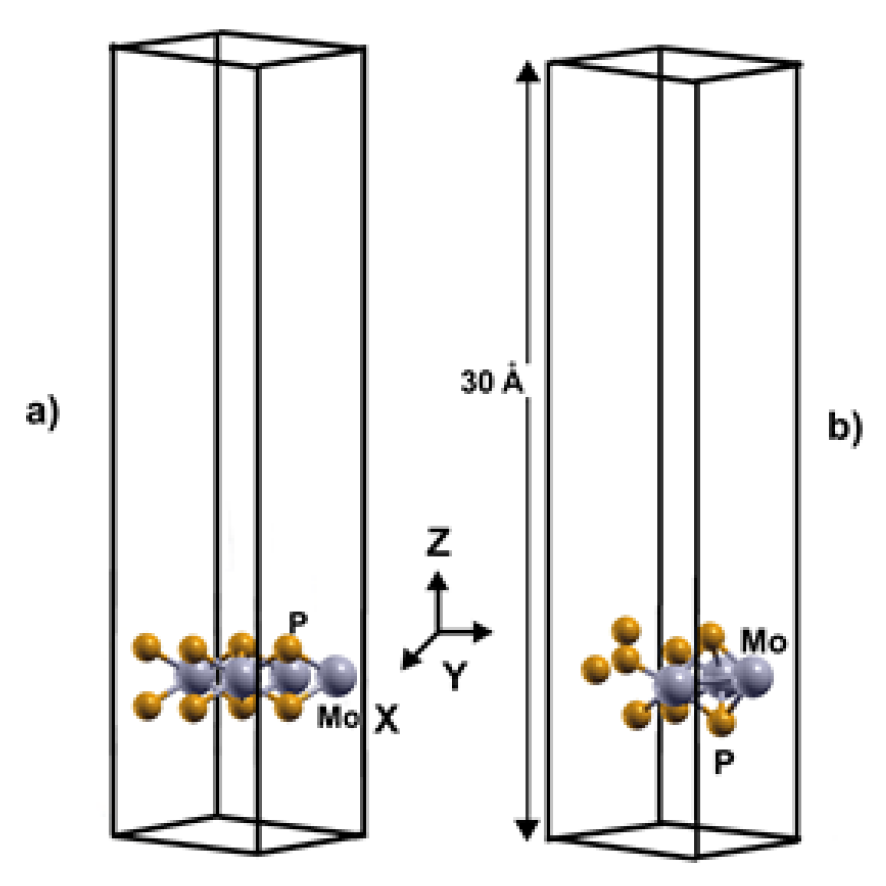
We carried out our simulations of these systems with a supercell 2x2, with a separation between layers of 30 Å. In the case of the pristine 2DMoP
2 system, the supercell consists of four molybdenum (Mo) atoms and eight phosphorus (P) atoms (
Figure 1(a)). In comparison, the 2D MoP
2 with a Mo vacancy has three molybdenum (Mo) particles and eight phosphorus (P) atoms (
Figure 1(b)). In this manner, the Mo vacancy in the cell of twelve atoms corresponds to 12.5% of vacancies. In the system's initial configuration (pristine or with 12.5% of vacancies), we added hydrogen molecules one by one above a Mo or P atom to optimize the system, and the original distance of the hydrogen molecules from the surface was 3 Å.
Every structure was relaxed to determine the most stable configuration before the saturation of H
2 molecules. We calculated the adsorption energy using Equation (1).
here, E
ads is the adsorption energy, n is the number of hydrogen molecules we considered, EH is the total energy of one free H
2 molecule, and E surface is the total energy of the surface unit cell. We obtained by optimization an average adsorption energy of ‒ 0.13 eV per molecule. We calculated the gravimetric capacity Wt% using Equation (2).
where W
H is the molecular hydrogen mass, n is the same as before, and W
surface is the mass in the unit cell surface.
When optimizing the energy of a system, we can make accurate predictions for the adsorption energy when there is a strong attraction, such as in chemisorption. However, for physisorption processes with energies below 0.2 eV, including dispersion forces (Van der Waals interactions), it is necessary to increase the accuracy of the adsorption energy calculation, which must be much more significant. The system's temperature and pressure can significantly increase their relative influence on the adsorption energy. According to US DOE recommendations for storing hydrogen, it is necessary to have adsorption energies between 0.1 eV and 0.2 eV for effective adsorption and desorption processes at room temperature and pressure around some atmospheres [
2,
3]. This range of molecular hydrogen binding energy values is between physisorption and chemisorption phenomena. Thus, as mentioned above, we had to include dispersion forces in calculating the Van der Waals interactions. We used Grimme's semi-empirical approach for this purpose. We used FPMD calculations to include the effect of temperature and pressure on the binding forces on the hydrogen molecules.
Furthermore, following US DOE recommendations, the hydrogen storage capacity should be six weight percent. Finding the right solution is challenging because hydrogen molecules may be too strongly or weakly adsorbed in light materials [
3]. We chose a 2D MoP2 surface that is pristine or with Mo vacancies as a possibility.
We have developed a criterion to test the total attractive forces in hydrogen storage at a specific temperature. With this approach, we predict whether the molecular physisorption obtained by simple energy optimization exists for a given temperature.
In this system, we have physisorption processes dominated by Van Deer Waals' interactions with the molecule and the surface. Furthermore, the Van der Walls forces occur in these systems when we have surface and molecule polarization processes. The molecule polarization will depend on the average distance between its atoms, and this distance will depend on the temperature; additionally, this polarization depends on the distance of the molecule from the surface. The closer the molecule, the more intense the polarization and the force on the molecule. Besides, the distance of the molecule from the surface will depend on its kinetic energy, i.e., on the temperature. Furthermore, when we perform FPMD calculations, the temperature is included, and the kinetic energy of the atoms on the surface and of the molecule's atoms are considered. This kinetic energy consists of each molecule's vibrations, rotations, velocities, and interactions. Of course, this is for every particle of the whole system. The polarization process is more dynamic and temperature-dependent. Thus, the magnitude of the total attraction force on the molecule will depend on the temperature.
We first investigated the pristine surface and optimized the system formed with the surface and hydrogen molecules. This optimization leads to a value for the gravimetric capacity for hydrogen storage and the adsorption energy per molecule. Afterward, we used a first-principles molecular dynamics approach at various temperatures. To perform this calculation, it is necessary to establish a value for the temperature and hydrostatic pressure. We chose ambient temperature and pressure to compare our results with the DOE’s requirements for hydrogen storage. We conducted the following procedure to determine the number of molecules attached to the surface at the temperature T1.
We start performing an FPMD calculation at temperature T
1 using the optimized system configuration as the initial setup for a long enough time (~ 1ps) to obtain a stable system configuration at that temperature T
1. Then, we conducted a second FPMD calculation at a lower temperature, T
2 (where T
2 << T
1), using the final stable configuration from the first FPMD calculation as the initial setup. If total attraction forces were on the molecules at T
1, they would return to the surface when the temperature reduces to T
2 because of kinetic energy reduction. We counted as adsorbed hydrogen molecules at temperature T
1, only those that moved back toward the surface at temperature T
2. In our FPMD calculations, we used the NVE ensemble, and for the temperature control, we used velocity rescaling. We followed the parallelizing workload given in the Quantum Espresso code [
40], and we used 32 processors, and the total employed computer time was around nine weeks. For visualization of the different surfaces and configurations, we used the XCrysen code [
41].
3. Results
3.1. Hydrogen Storage on Pristine 2D MoP2.
3.1.1. Optimization
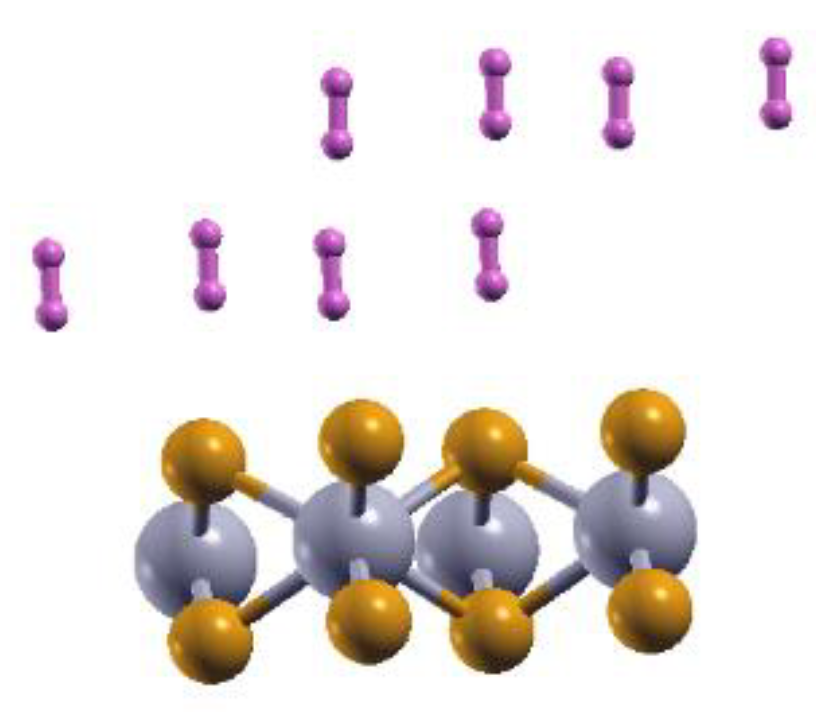
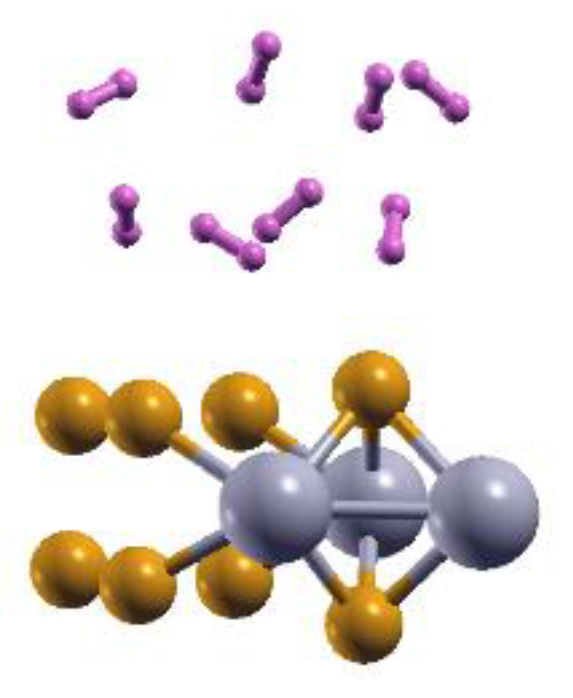
The pristine monolayer can adsorb up to 16 H
2 molecules—eight molecules per side, as shown in
Figure 2, which presents the final configurations for one side.
We obtained a gravimetric capacity for hydrogen storage of 5.72%, and the average adsorption energy is ‒ 0.13 eV/molecule.
3.1.2. First-Principles Molecular Dynamics Calculations
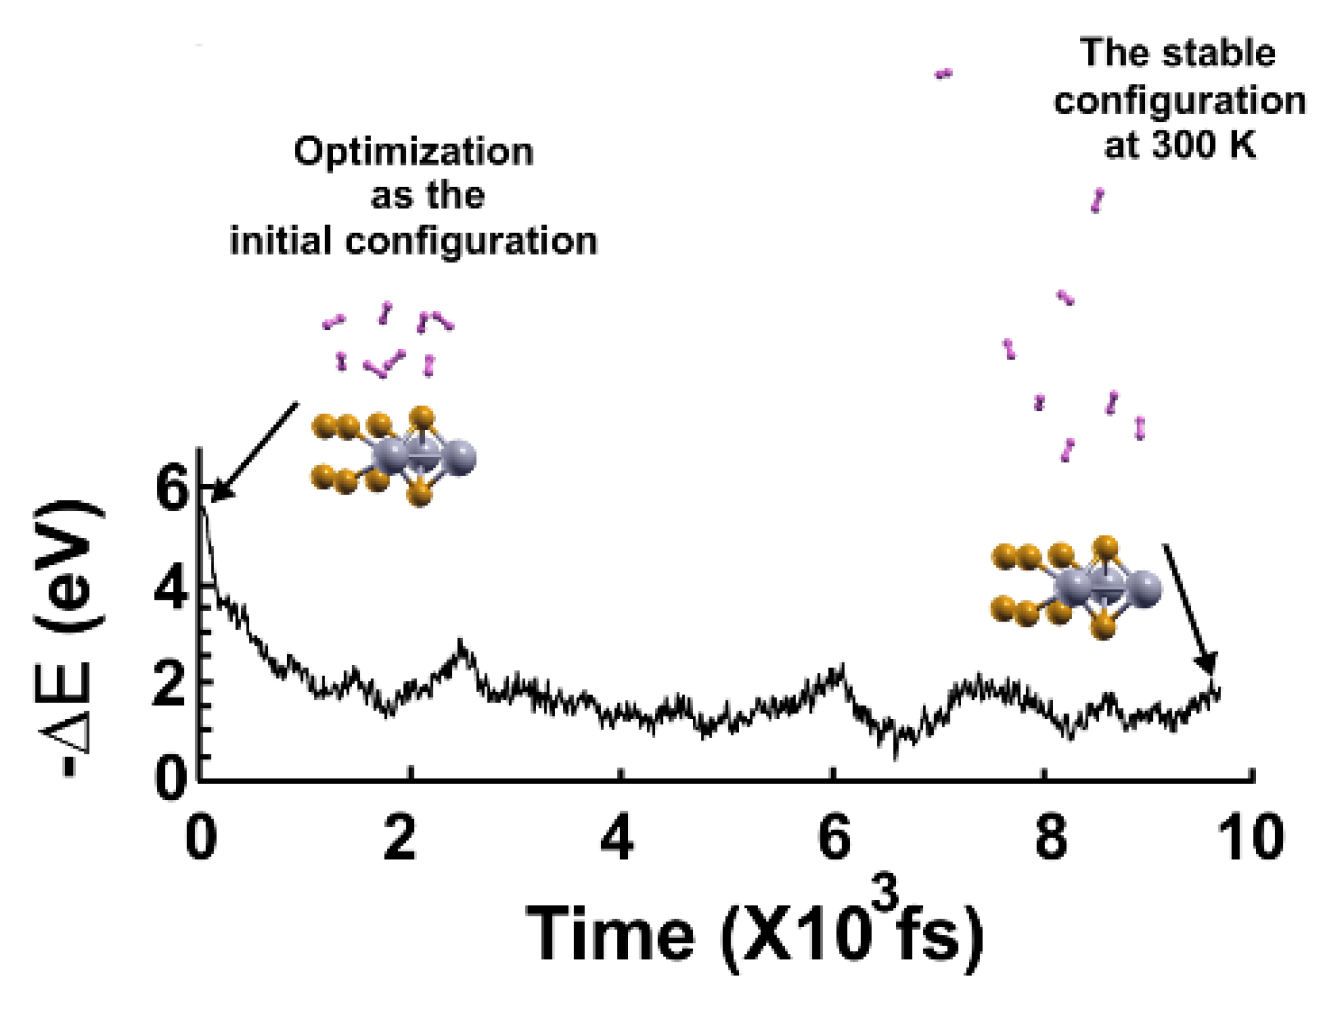
We followed the criterion described in the Materials and Methods section to calculate the gravimetric capacity, determining how many molecules adsorbed the surface at a given temperature. Using the optimization of the system and the adsorbed hydrogen molecules as the starting point, we performed the first-principles molecular dynamics calculations at 300K.
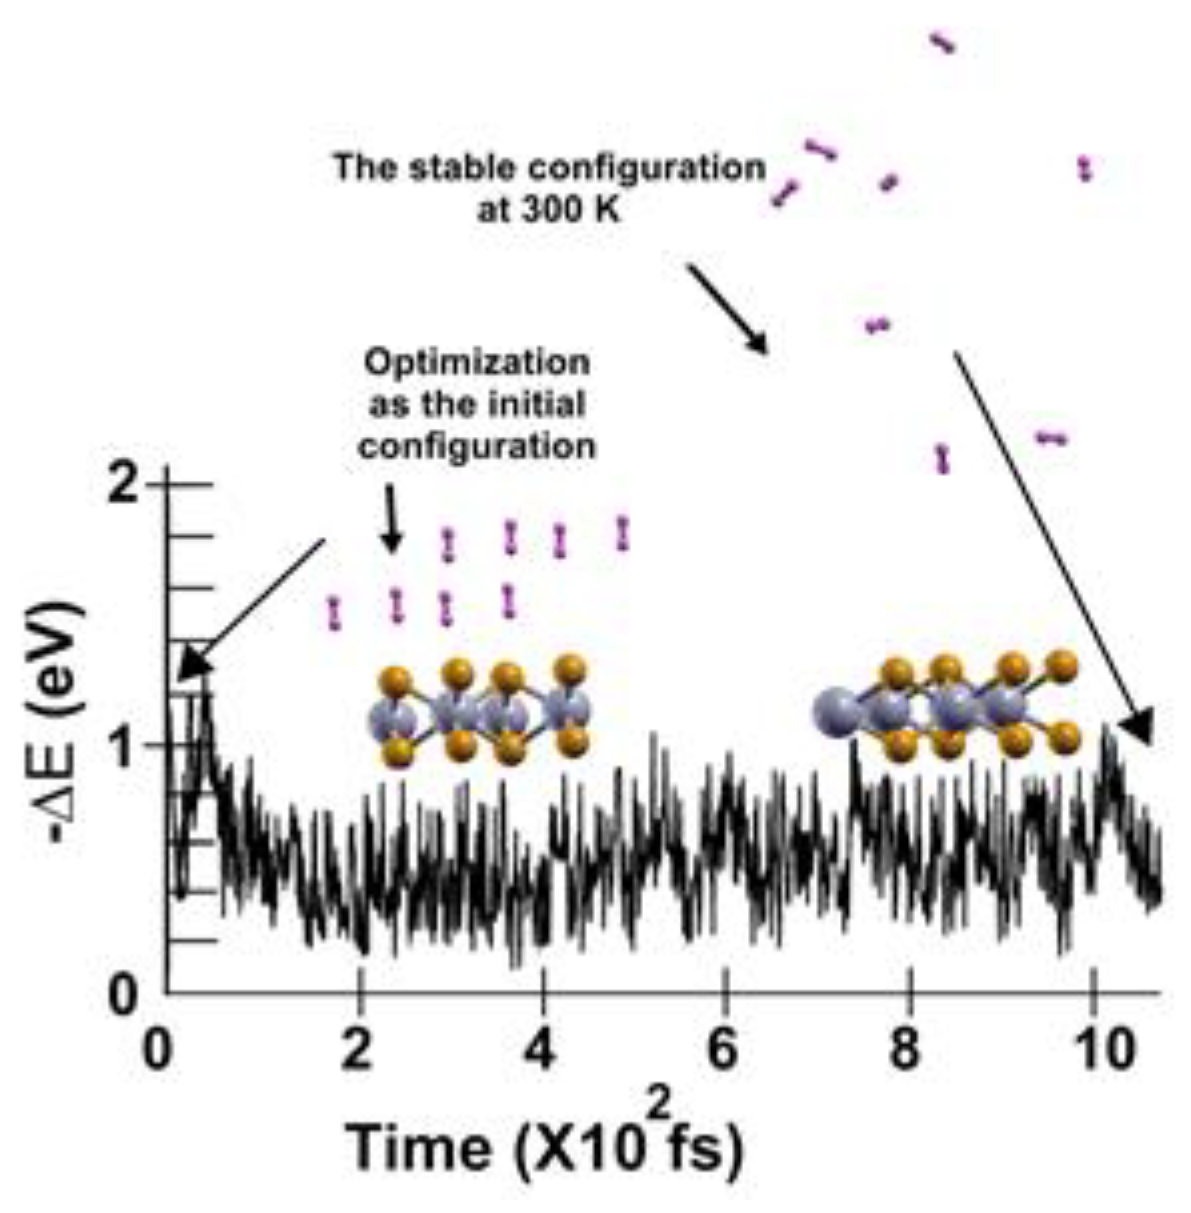
We found that at 300 K, all the adsorbed H
2 molecules in the initial optimization moved away from the surface, as
Figure 3 shows.
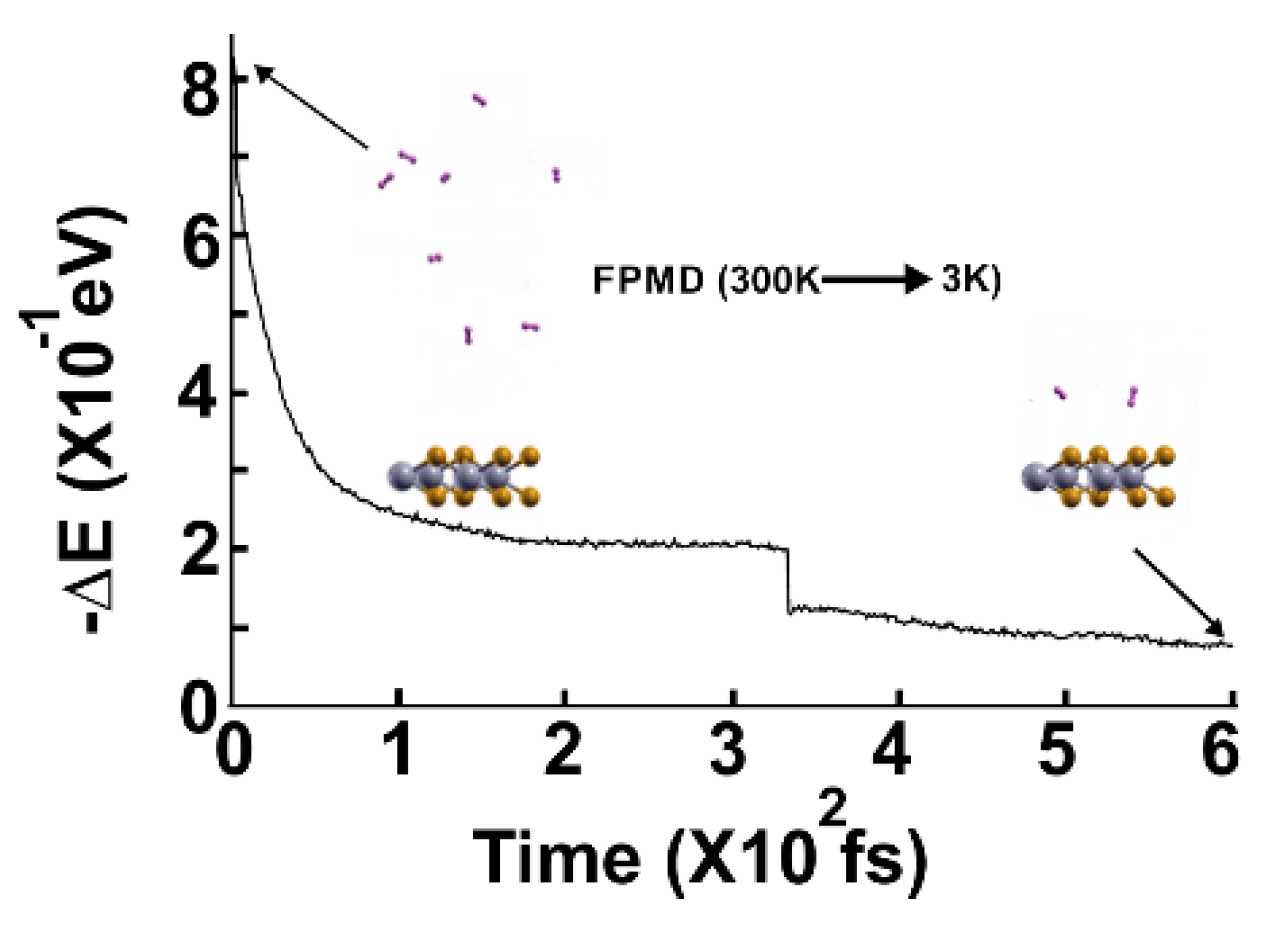
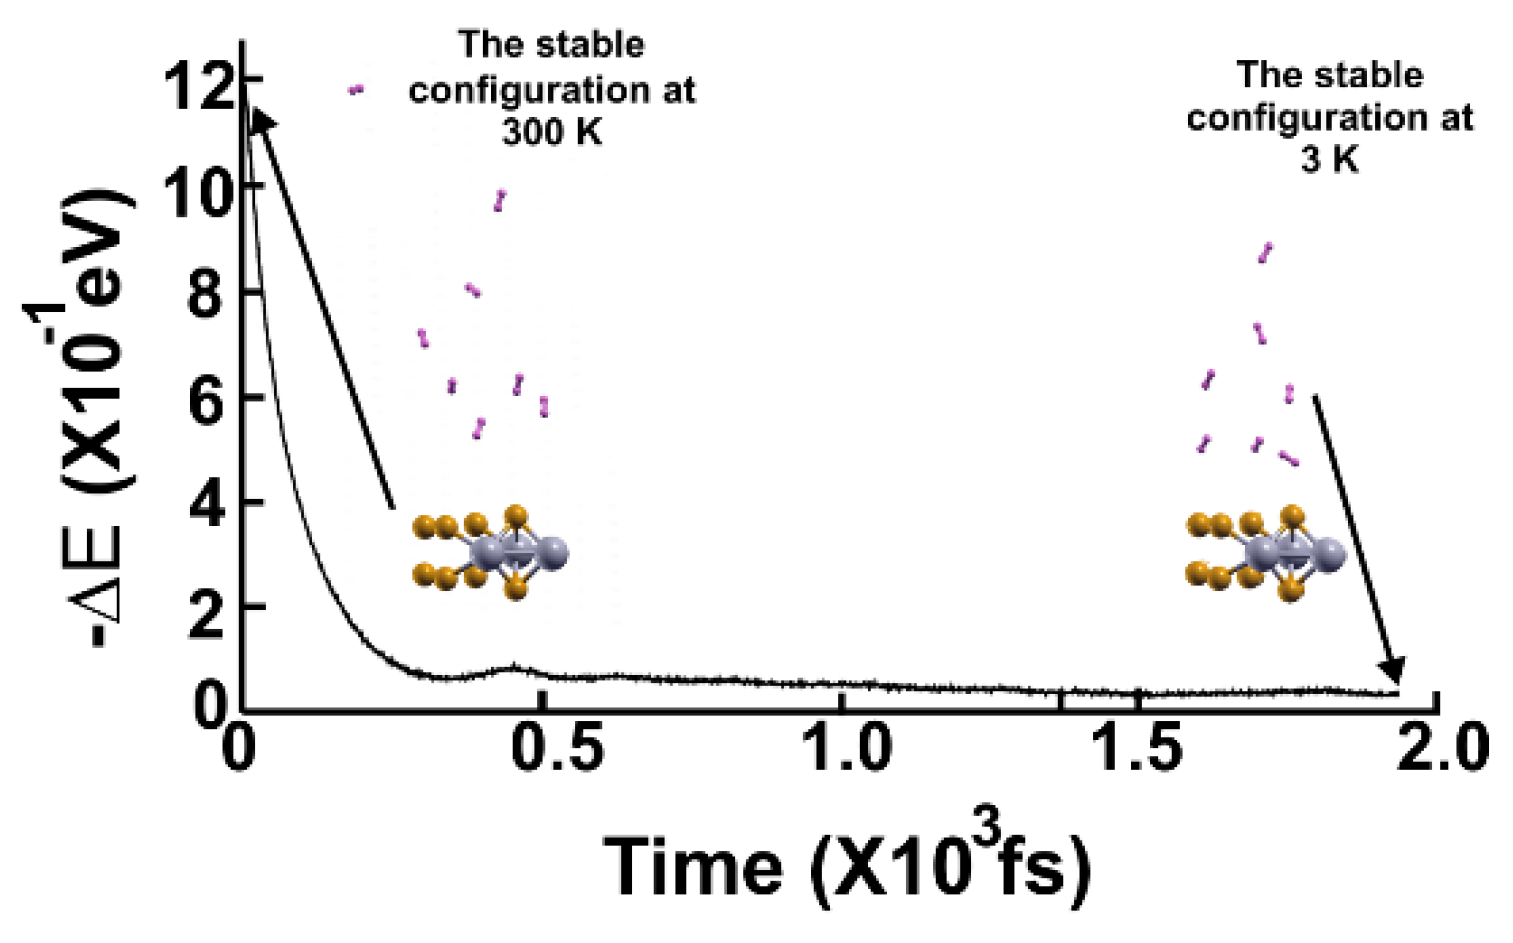
We then reduced the temperature to 3 K and performed a second FPMD calculation to determine how many remained bound to the surface. Thus, we considered the stable configuration obtained at 300 K as the initial state for the second FPMD calculation, as shown in
Figure 4. We identified as adsorbed H
2 molecules only those that moved back to the surface. In this way, we obtained that at 300 K, the pristine surface retained only two H
2 molecules per side, which implies 1.28% of gravimetric storage capacity.
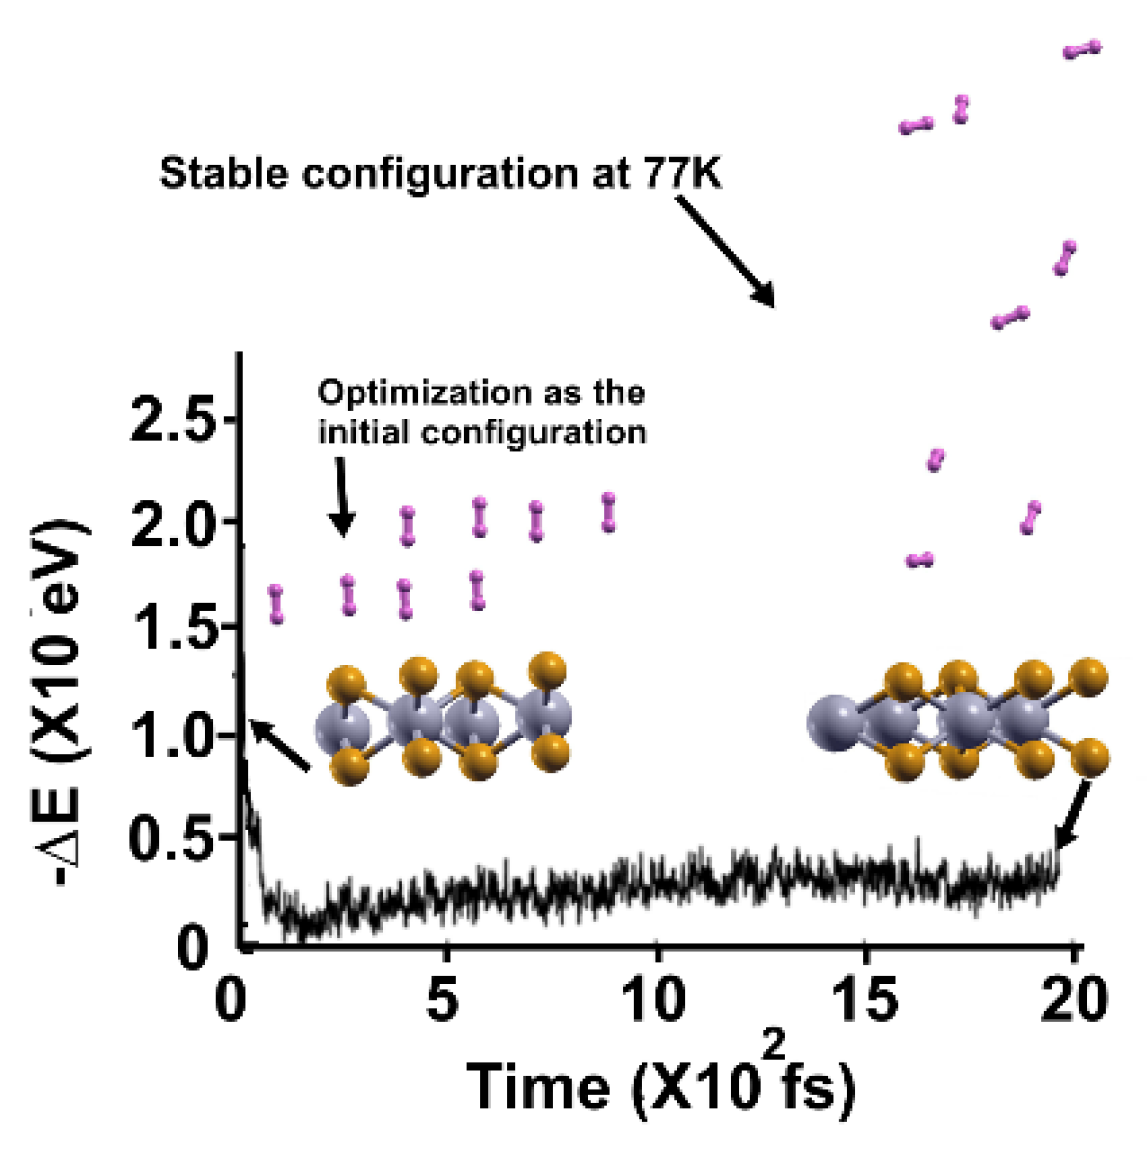
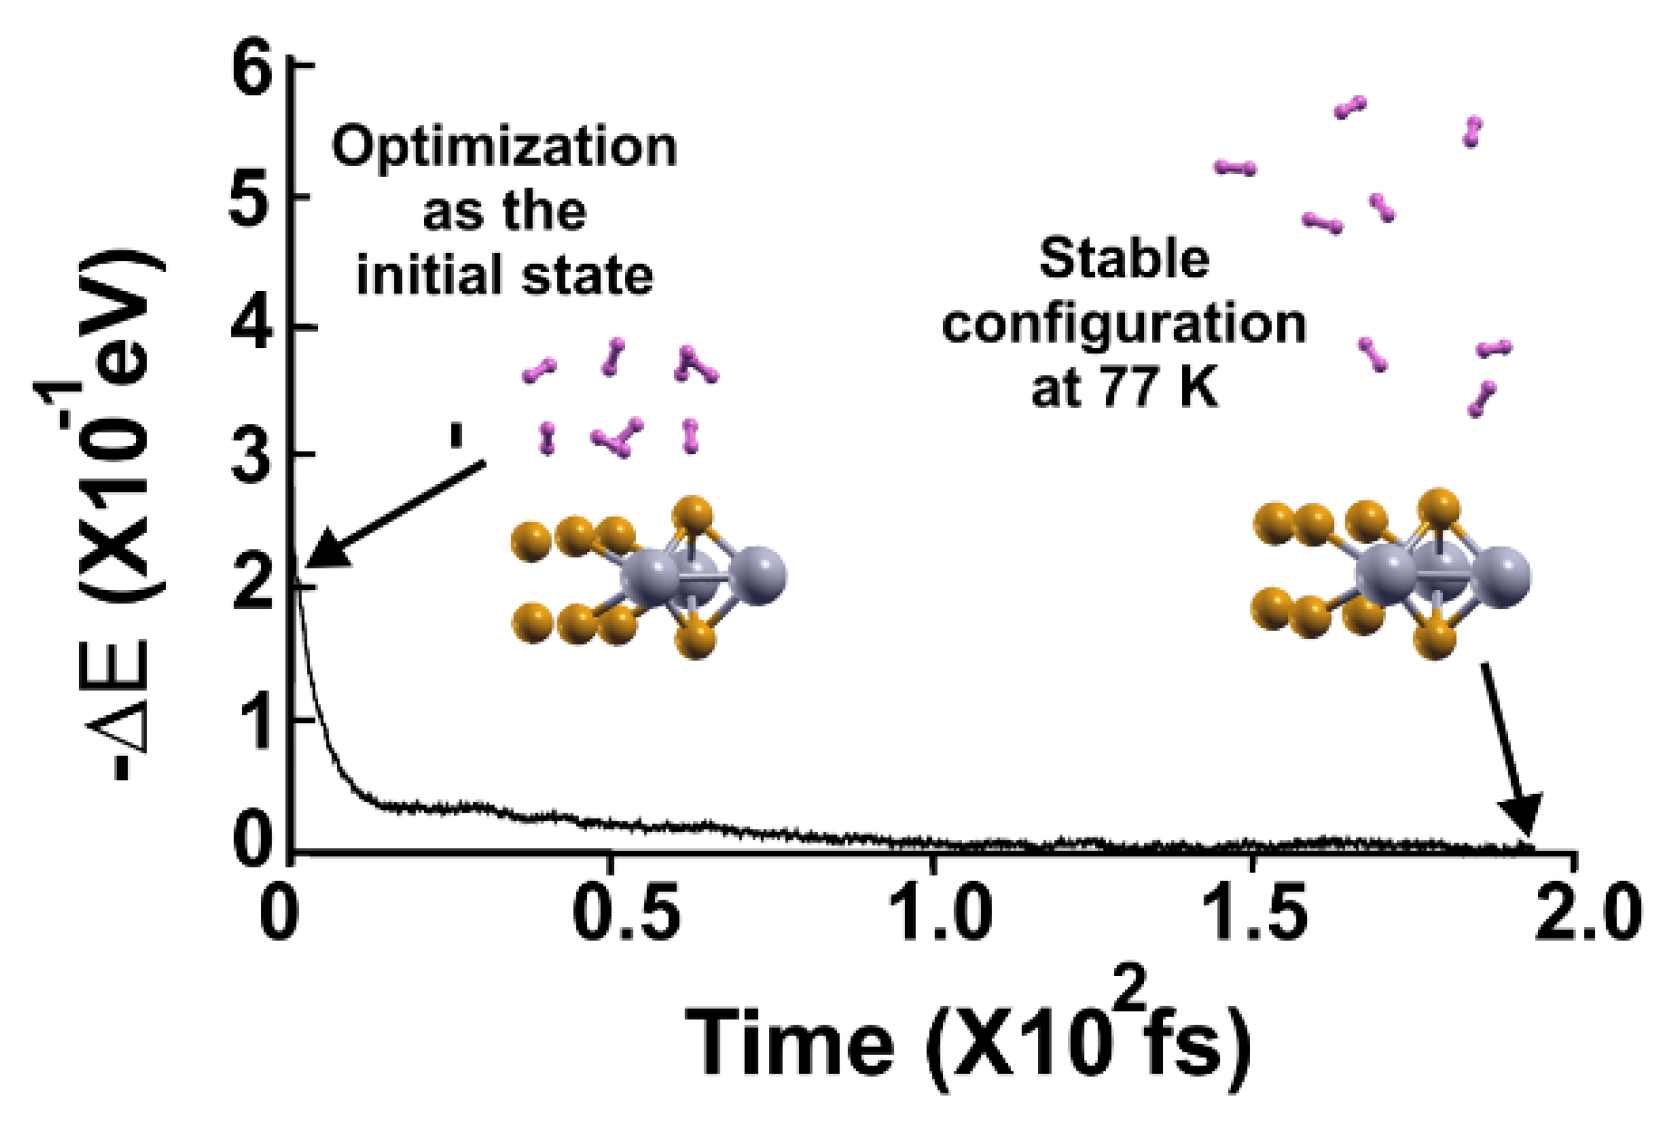
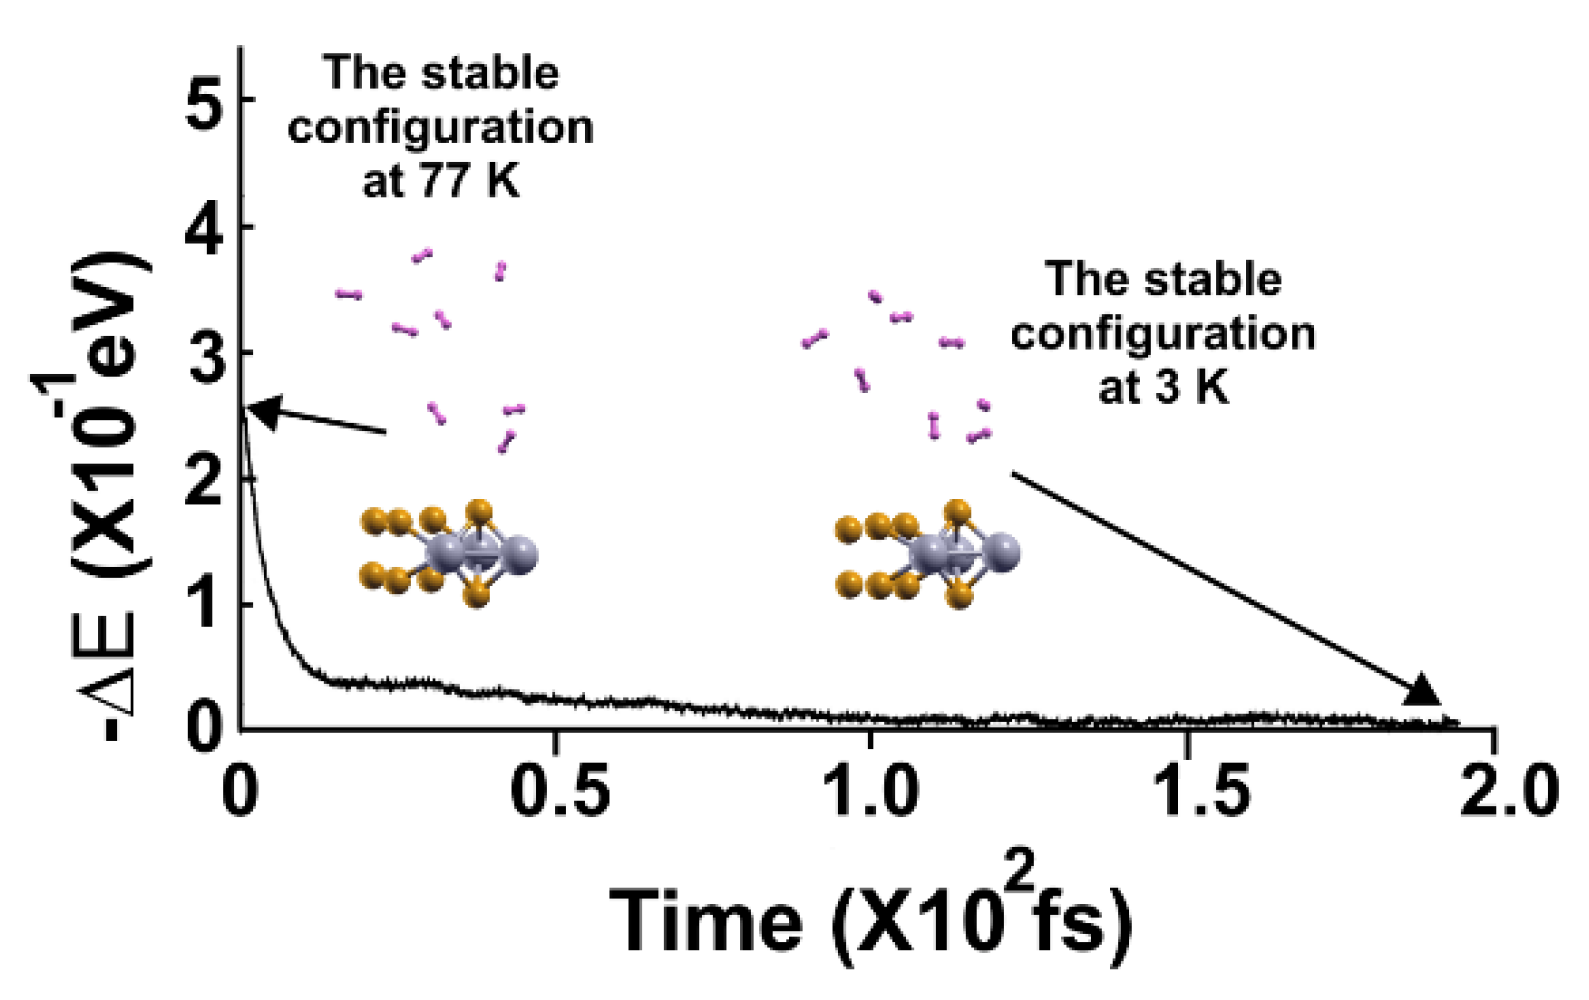
Again, at 77 K, we considered the optimization configuration the initial state and performed an FPMD calculation, as shown in
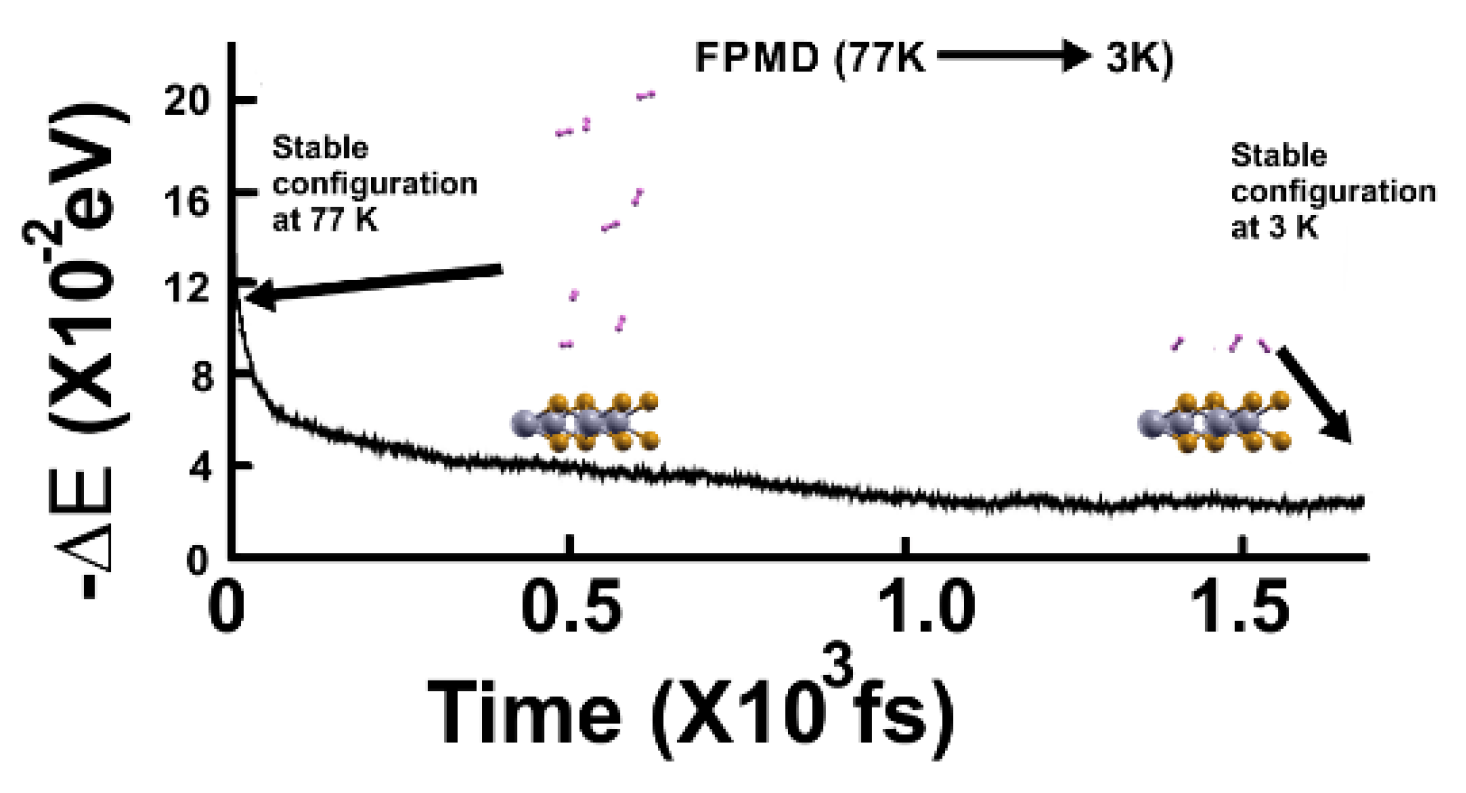
Figure 5, and used the same criterion. Afterward, we reduced the temperature to 3 K and performed another FPMD calculation to determine how many remained bound to the surface (see
Figure 6). Thus, we identified as adsorbed H2 molecules only those that moved back to the surface. There were only three H
2 molecules per side of the surface, with a gravimetric capacity for molecular hydrogen storage of 1.92%.
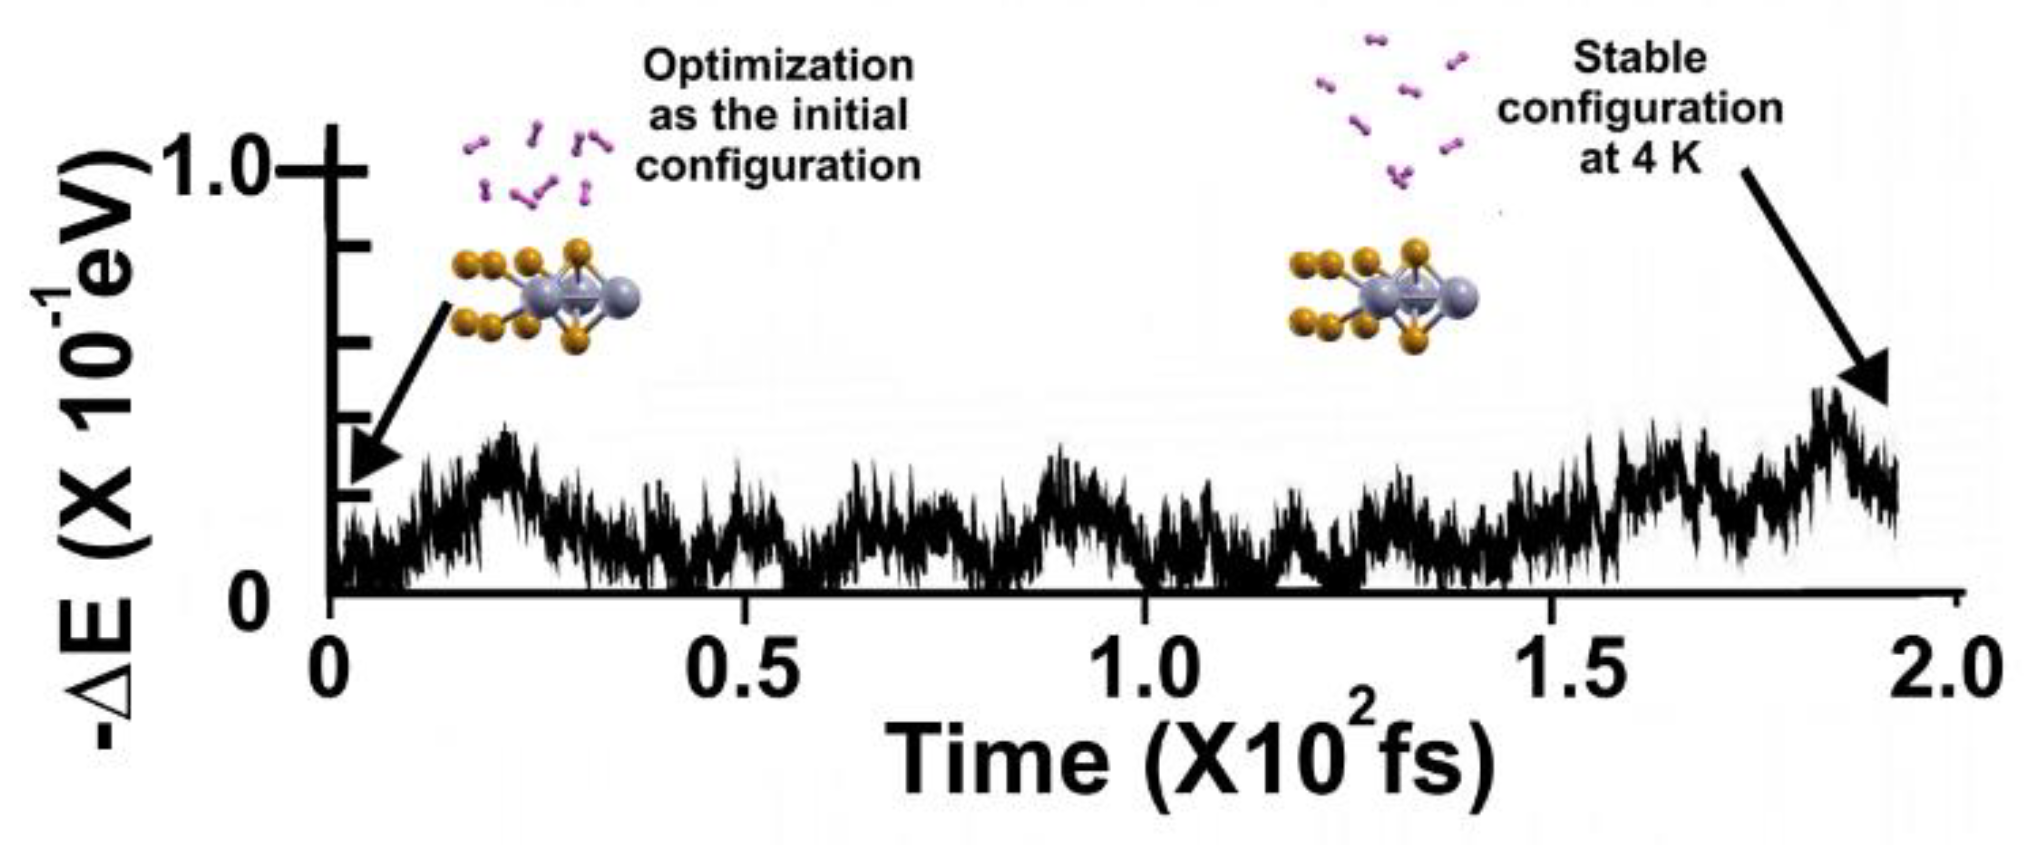
In the case of 4 K,
Figure 7 shows the FPMD calculation where the optimization is the initial configuration. Notice that all the molecules remained close to the surface.
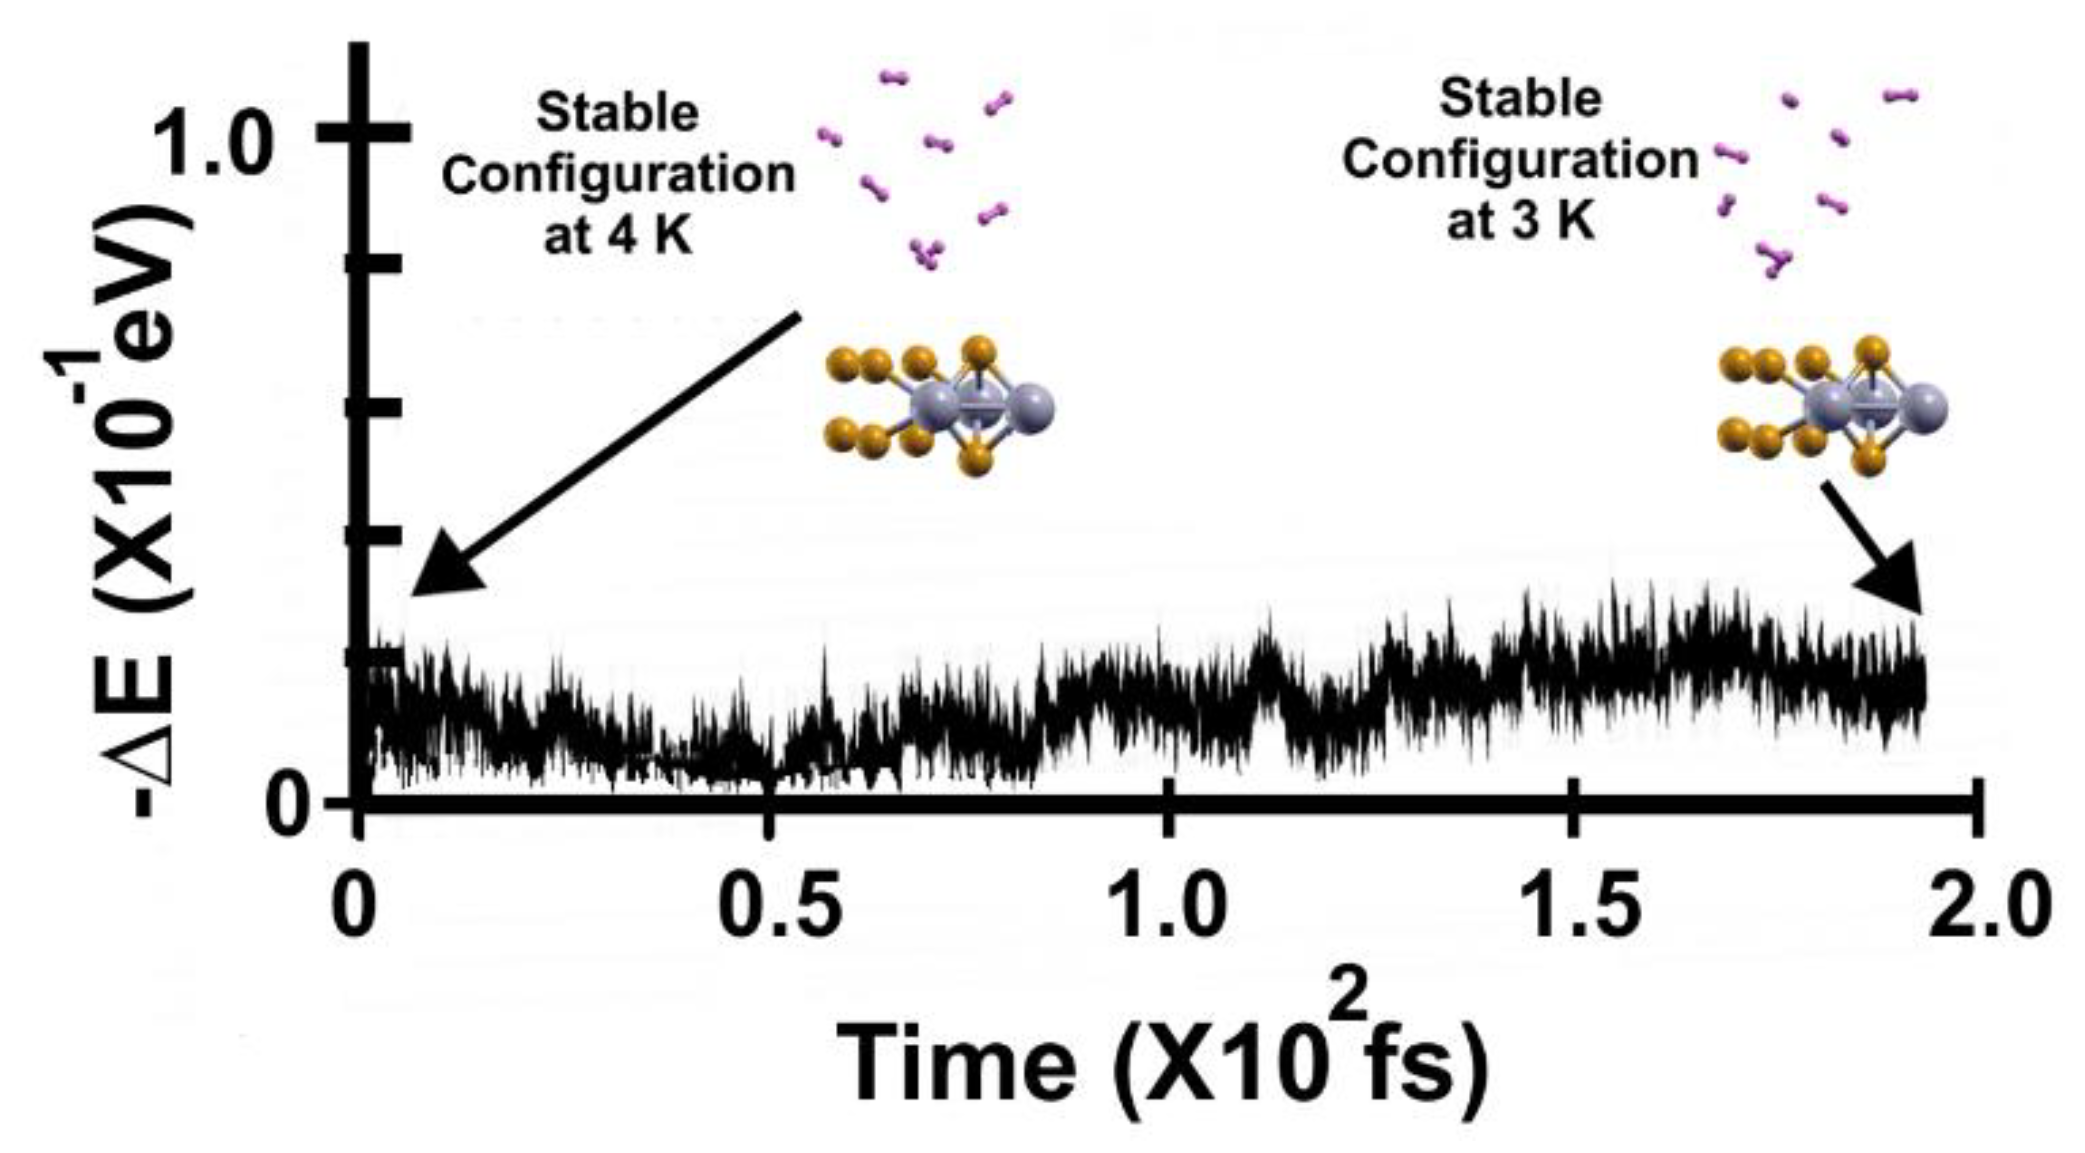
In the following FPMD calculation at 3 K, all the hydrogen molecules moved back to the surface, indicating that they adsorbed on the pristine 2D MoP
2 surface, as
Figure 8 shows. The gravimetric capacity for molecular hydrogen storage is 5.1% for 16 adsorbed hydrogen molecules (eight per side).
In summary, in the optimization, the pristine 2D MoP2 surface adsorbed up to 16 hydrogen molecules (8 per side), with a gravimetric molecular hydrogen storage capacity of 5.1% and an average adsorption energy of ‒ 0.13 eV/molecule. However, we performed an FPMD calculation at 300 K and applied our already mentioned criterion to determine how many molecules adsorbed the surface at a given temperature. At that temperature, we found that only two (per side) hydrogen molecules adsorbed on the pristine 2D MoP2 surface, with a gravimetric capacity of 1.28%. When we considered a temperature of 77 K and applied the same criterion, we found a gravimetric capacity for molecular hydrogen storage of 1.92%. For 4 K, the gravimetric capacity increases to 5.1%.
3.2. Hydrogen Storage on 2DMoP2 with Mo Vacancies.
3.2.1. Optimization
To simulate the adsorption of H
2 molecules on the surface of 2DMoP
2 with vacancies, we considered a supercell 2x2x1, as
Figure 1 (b) shows. In this manner, we made a Mo vacancy in the cell of twelve atoms, corresponding to 12.5% of vacancies. Again, in the system's initial configuration, we added hydrogen molecules one by one above a Mo or P atom to optimize the system, and the original distance of the hydrogen molecules from the surface was 3 Å. We obtained that 2D MoP
2 with Mo vacancies can adsorb up to 16 H2 molecules (eight molecules per side), as
Figure 9 shows, and a gravimetric capacity of 6.0%. We calculated average adsorption energy of around ‒ 0.14 eV/molecule.
3.2.2. First-Principles Molecular Dynamics Calculations
We followed the procedure in section 2.1 to calculate the gravimetric capacity at 300 k.
Figure 10 shows the FPMD calculation at that temperature. As expected, all the molecules displaced away from the surface.
Figure 11 shows the subsequent FPMD calculation at 3 K, starting with the stable configuration at 300 K. Notice that seven hydrogen molecules (per side) moved towards the surface when the temperature decreased. Thus, the gravimetric capacity for hydrogen storage on the surface is 5.27%.
In the case of 77 K, we again considered the optimization configuration as the initial state and performed an FPMD calculation at that temperature, as
Figure 12 shows. Again, all the molecules moved away from the surface.
In
Figure 13, we present the subsequent FPMD calculation at 3 K, starting with the stable configuration at 77 K. Notice that all the eight hydrogen molecules (per side) moved towards the surface when the temperature decreased, showing a gravimetric capacity of 6.02%.
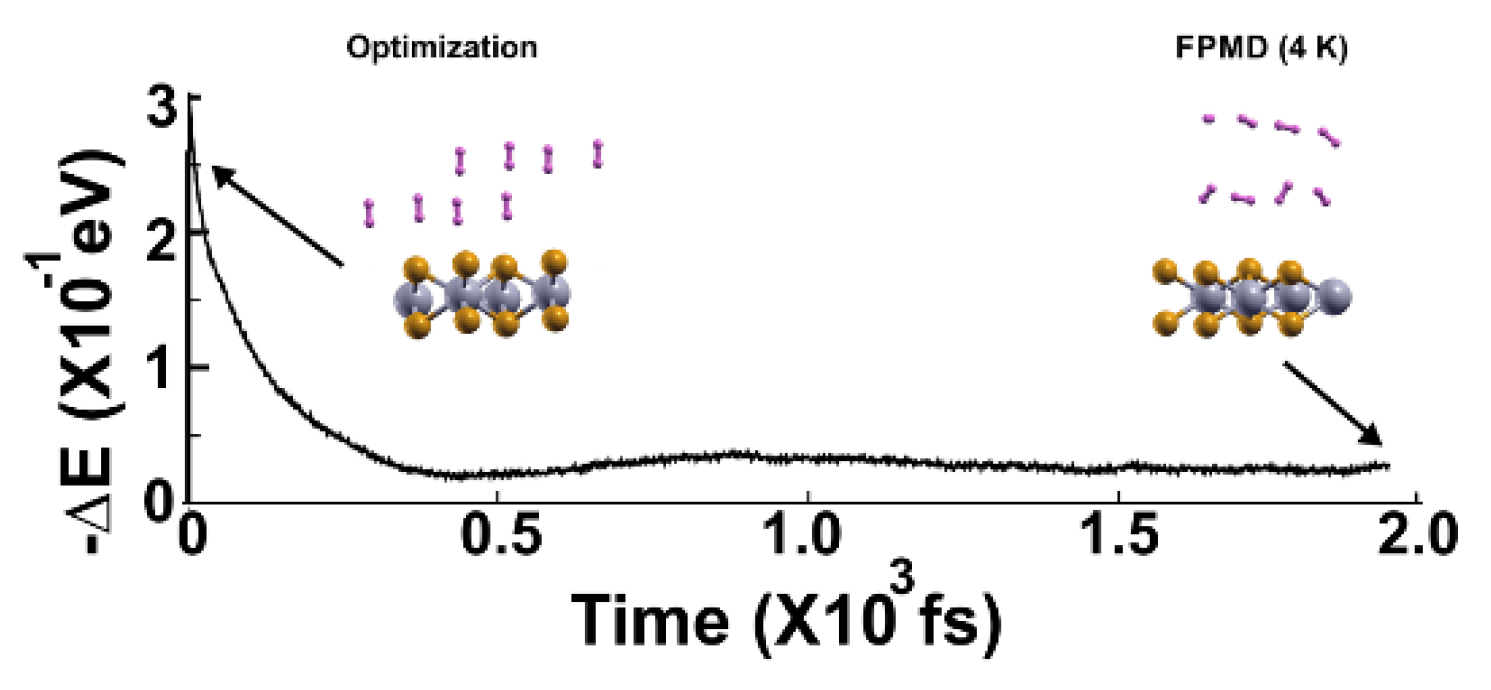
Figure 14 shows the FPMD calculation at 4 K, taking the optimization as the initial configuration. Again, we can notice that all the hydrogen molecules moved away from the surface. The elapsed time was two picoseconds.
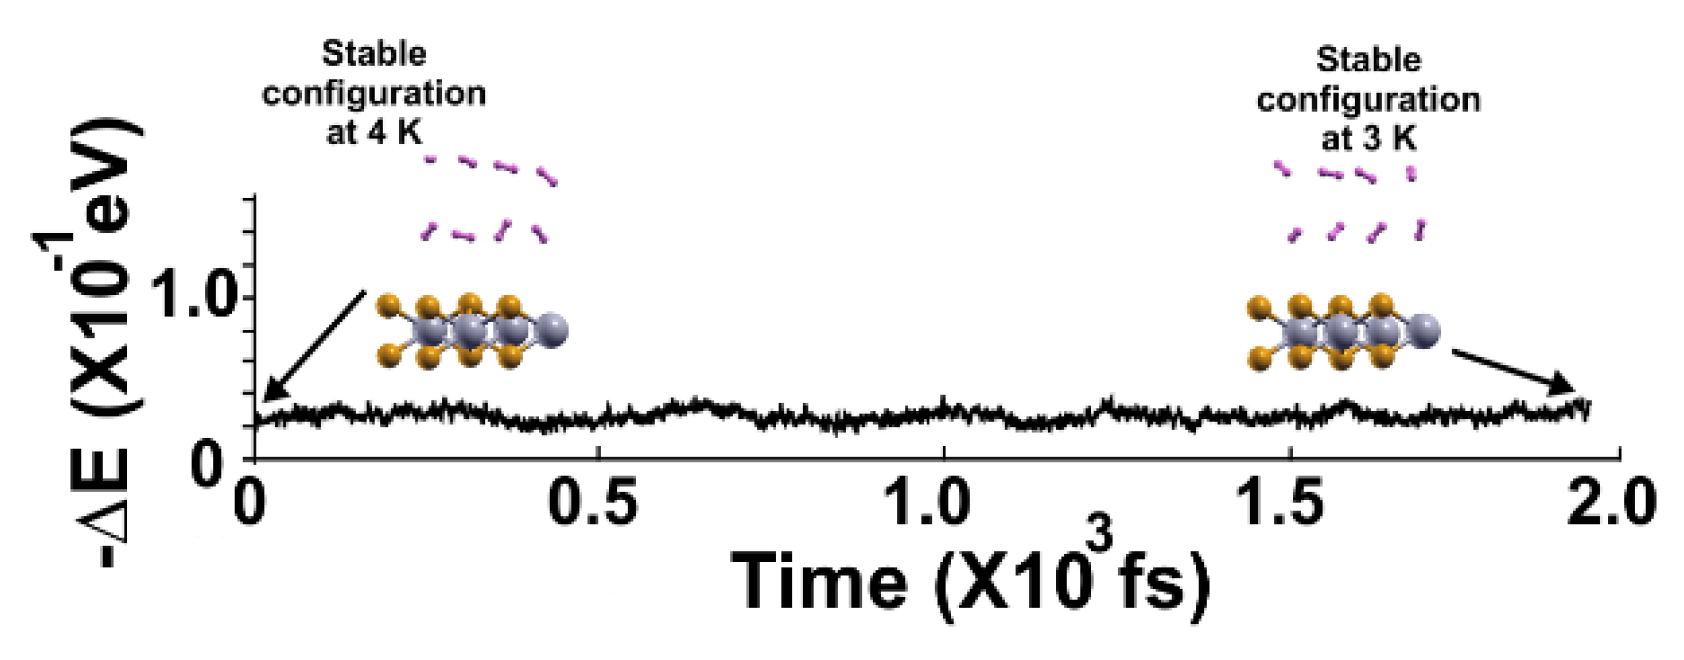
In
Figure 15, we present the subsequent FPMD calculation at 3 K, starting with the stable configuration at 4 K. Notice that all eight hydrogen molecules (per side) moved towards the surface when the temperature decreased, showing a gravimetric capacity of 6.02%.
In summary, when we considered the 2D MoP2 with 12.5% Mo vacancies and optimized the system, the surface adsorbed up to 16 hydrogen molecules (8 per side). This corresponds to a gravimetric molecular hydrogen storage capacity of 6.02%, and the average adsorption energy is ‒ 0.14 eV/molecule. However, when we applied our already described approach to determine how many molecules adsorbed the surface at a given temperature and performed an FPMD calculation at 300 K, we found that only seven (per side) hydrogen molecules adsorbed on the surface. The gravimetric capacity is 5.27%. Using the same methodology at 77 K, we found a gravimetric capacity for molecular hydrogen storage of 6.02%. Finally, and as we expected, for 4 K, the gravimetric capacity is 6.02%, too.
4. Discussion
Given that currently, the first-principles calculations applied in the exploration of new materials for hydrogen storage are performed by solely simple energy optimization (see, for example, [
34]), we propose a criterion using a first-principles molecular dynamics approach to test the total attraction forces on the physisorbed molecule. We performed ab initio DFT calculations. We apply it to investigate the hydrogen storage on the 2D material MoP
2 at different temperatures. However, the method has a general application for the physisorption of molecules on any surface. We considered the 2D material pristine and with 12.5% of Mo vacancies.
Our investigation aims to predict whether the molecular physisorption obtained by simple energy optimization exists for a given temperature. This means determining whether the kinetic energy given to the system destroys the molecular physisorption obtained by simple energy optimization when the effect of temperature is included. For this purpose, we utilized FPMD calculations.
We found by optimization of the system that the pristine 2D MoP
2 surface adsorbed a maximum of 16 hydrogen molecules (8 per side), with an average adsorption energy of
‒ 0.13 eV/molecule. Furthermore, we considered the same surface with 12.5% Mo vacancies and obtained by optimization a gravimetric capacity of 6.02% and an average adsorption energy of ‒ 0.14 eV/molecule. We had to consider dispersion forces. Thus, we included the Van der Waals interactions using Grimme's semiempirical approach [
14].
Next, we apply our approach to know if the molecular hydrogen physisorption obtained by simple energy optimization exists for a given temperature. First, we performed an FPMD calculation at temperature T1 using the optimized system configuration as the initial setup for a long enough time (~ 1ps) to obtain a stable system configuration at that temperature T1. Then, we conducted a second FPMD calculation at a lower temperature, T2 (where T2 << T1), using the final stable configuration from the first FPMD calculation as the initial setup. If total attraction forces were on the molecules at T1, they would return to the surface when the temperature reduces to T2 because of kinetic energy reduction. We counted as adsorbed hydrogen molecules at temperature T1, only those that moved back toward the surface at temperature T2.
We followed the criterion described above to calculate the gravimetric storage capacity for molecular hydrogen storage for 300K, 77 K, and 4 K. Our results suggest that using only optimization may lead to unreliable predictions for hydrogen storage. We conclude that the 2D MoP2 surface with Mo vacancies was more adequate than the pristine surface. At 300 K, the defective 2D MoP2 with 12.5% Mo vacancies had a 5.27% gravimetric capacity (the US-DOE target is 5.5% for automotive-grade molecular hydrogen storage). At 77 K and below this temperature, this system reached a gravimetric capacity of 6.02%, above the US-DOE target. Here, the disadvantage is maintaining the material at that temperature during the automotive-grade application for hydrogen storage.
While maintaining the material at the required temperature is challenging, our results indicate that further investigation of this class of 2D materials could lead to successful molecular hydrogen storage at room temperature and ambient pressure.
Author Contributions
Conceptualization, LFM; Data curation, ALM, OST, and LFM; Formal analysis ALM, and LFM; Funding acquisition, LFM; Investigation, ALM, OST, and LFM; Methodology, ALM, OST, and LFM; Project administration, LFM; Resources, LFM; Validation, ALM, OST, and LFM; Writing—original draft, ALM and LFM; Writing—review & editing LFM All authors have read and agreed to the published version of the manuscript.
Funding
This research was funded by Dirección General de Asuntos del Personal Académico de la Universidad Nacional Autónoma de México, grant number IN102323.
Institutional Review Board Statement
Not applicable.
Informed Consent Statement
Not applicable.
Acknowledgments
We thank Dirección General de Asuntos del Personal Académico de la Universidad Nacional Autónoma de México for its partial financial support through Grant IN102323 and the Postdoctoral Program (POSDOC) postdoc scholarship for ALM. We also thank UNAM-Miztli-Super-Computing Center for its technical assistance through the project LANCAD-UNAM-DGTIC-030.
Conflicts of Interest
The authors declare no conflict of interest.
References
- Office of energy efficiency & renewable energy. DOE Technical Targets for Onboard Hydrogen Storage for Light-Duty Vehicles, https://www.energy.gov/eere/fuelcells/doetechnical-targets-onboard-hydrogen-storage-light-duty vehicles. (accessed on 24 July 2024).
- Jena, P. ; Materials for Hydrogen Storage: Past, Present, and Future J. Phys. Chem. Lett. 2011 2 206.
- Zhou, J.; Wang, Q.; and Sun, Q. ; Electric field enhanced hydrogen storage on polarizable materials substrates Proc. Natl. Acad. Sci. USA. 2010 107 2801.
- Lasia, A. ; Mechanism and kinetics of the hydrogen evolution reaction Int. J. of Hydrogen Energy 2019, 44, 19484. [Google Scholar] [CrossRef]
- Gao, Y.; Zhang, M.; Ding, J.; Hong, S.; Masa, J.; Liu, S.; Sun, Z. ; Simple synthesis of two-dimensional MoP2 nanosheets for efficient electrocatalytic hydrogen evolution Elec. Comm. 2018 97 27.
- Yan, Y.; Xia, B.; Xu, Z.; Wang, X. ; Recent Development of Molybdenum Sulfides as Advanced Electrocatalysts for Hydrogen Evolution Reaction ACS Catal 2014 4 1693−1705.
- Kibsgaard, J.; Tsai, C.; Chan, K.; Benck, J. D.; Nørskov, J. K.; Abild-Pedersen, F.; Jaramillo, T. F. ; Designing an improved transition metal phosphide catalyst for hydrogen evolution using experimental and theoretical trends Energy Environ. Sci 2015 8 3022.
- McEnaney, J. M.; Chance Crompton, J.; Callejas, J. F.; Popczun, E. J.; Biacchi, A. J.; Lewis, N. S.; Schaak, R. E. ; Amorphous molybdenum phosphide nanoparticles for electrocatalytic hydrogen evolution Chem. Mater 2014 26 4826–4831.
- Wei, C.; Qian, L.; Xing, Z.; Asiri, A. M.; Alamri, K. A.; Sun, X.; MoP nanosheets supported on biomass-derived carbon flake: One-step facile preparation and application as a novel high-active electrocatalyst toward hydrogen evolution reaction. Applied Catalysis B: Environmental 2015 164 144–150.
- Karki, S. , et al., Synthesis and Engineering of High-Performance Transition Metal-Based Electrocatalysts for Green Hydrogen Production and Storage, in Transition Metal-Based Electrocatalysts: Applications in Green Hydrogen Production and Storage. ACS Publications 2023 169-203.
- T. He, et al.Integrated interfacial design of covalent organic framework photocatalysts to promote hydrogen evolution from water Nat. Commun. 2023 14 329.
- S. Li, et al. Mechanically induced highly efficient hydrogen evolution from water over piezoelectric SnSe nanosheets Small, 2022 18 2202507.
- Wang, X.; Liu, X.; Wu, S.; Liu, K.; Meng, X.; Li, B.; Lai, J.; Wang, L.; Feng, S. Phosphorus vacancies enriched cobalt phosphide embedded in nitrogen doped carbon matrix enabling seawater splitting at ampere-level current density. Nano Energy 2023, 109. [Google Scholar] [CrossRef]
- Z. Zhou, et al.Rapid synthesis of C60-MoC nanocomposites by molten salt electrochemical reaction for hydrogen evolution J. Electrochem. Soc. 2023 170 026503.
- Tarhan, C.; Mehmet, A.Ç. A study on hydrogen, the clean energy of the future: Hydrogen storage methods. J. of Ener. Stor 2021 40 10 2676. [CrossRef]
- Usman, M.R. Hydrogen storage methods: Review and current status. Renew. Sustain. Energy Rev. 2022, 167. [Google Scholar] [CrossRef]
- Edet, H.O; Louis, H. ; Benjamin, I; Gideon, M.; Unimuke, T.O.; Adalikwu, S. A.; Nwagu, A.D.;. Adeyinka, A.S. Hydrogen storage capacity of C12X12 (X = N, P, and Si). Chem Phys Impact, 2022 5 100107.
- Chen, Z.; Kirlikovali, K.O.; Idrees, K.B.; Wasson, M.C.; Farha, O.K. Porous materials for hydrogen storage. Chem 2022, 8, 693–716. [Google Scholar] [CrossRef]
- Shang, Y.; Pistidda, C.; Gizer, G.; Klassen, T.; Dornheim, M. Mg-based materials for hydrogen storage. J. Magnes. Alloy. 2021, 9, 1837–1860. [Google Scholar] [CrossRef]
- Lin, H.-J.; Lu, Y.-S.; Zhang, L.-T.; Liu, H.-Z.; Edalati, K.; Révész, A. Recent advances in metastable alloys for hydrogen storage: a review. Rare Met. 2022, 41, 1797–1817. [Google Scholar] [CrossRef]
- S. Aydin, M. S. Aydin, M. Şimşek. The enhancement of hydrogen storage capacity in Li, Na, and Mg-decorated BC3 graphene by CLICH and RICH algorithms Int. J. Hydrog. Energy 2019 44 7354-7370.
- K. Suresh et al. Optimizing hydrogen storage in MOFs through engineering of crystal morphology and control of crystal size J. Am. Chem. Soc. 2021 143 1 0727–10734.
- X. Dou, et al. Enhanced reversible hydrogen storage performance of Mg-decorated g-C2N: First-principles calculations Comput. Mater. Sci. 2023 220 112046.
- Chandrika, K.M.; V, P. Is chitin a promising hydrogen storage material? A thorough quantum mechanical study. Int. J. Hydrogen Energy 2023, 48, 16779–16789. [Google Scholar] [CrossRef]
- Zhang, X.; Lin, R.; Wang, J.; Wang, B.; Liang, B.; Yildirim, T.; Zhang, J.; Zhou, W.; Chen, B. Optimization of the Pore Structures of MOFs for Record High Hydrogen Volumetric Working Capacity. Adv. Mater. 2020, 32, e1907995–e1907995. [Google Scholar] [CrossRef] [PubMed]
- Lesmana, L.A.; Aziz, M. Adoption of triply periodic minimal surface structure for effective metal hydride-based hydrogen storage. Energy 2022, 262. [Google Scholar] [CrossRef]
- Labrousse, J.; Belasfar, K.; Aziz, O.; El Kenz, A.; Benyoussef, A. First principles study of BC7 monolayer compared to graphene as an ultra-high-capacity sheet for hydrogen storage applications. Diam. Relat. Mater. 2022, 131. [Google Scholar] [CrossRef]
- Wang, X.; Jia, Y.; Xiao, X.; Zhou, P.; Bi, J.; Qi, J.; Lv, L.; Xu, F.; Sun, L.; Chen, L. Robust architecture of 2D nano Mg-based borohydride on graphene with superior reversible hydrogen storage performance. J. Mater. Sci. Technol. 2022, 146, 121–130. [Google Scholar] [CrossRef]
- H. Luo et al. Highly dispersed nano-TiB2 derived from the two-dimensional Ti3CN MXene for tailoring the kinetics and reversibility of the Li-Mg-BH hydrogen storage material. Appl. Surf. Sci. 2023 610 155581.
- Tian, W.; Ren, G.; Cui, H.; Huan, Y.; Liu, P.; Yang, L.; Jiang, Q.; Bai, X. Analysis of hydrogen storage mechanism in bilayer double-vacancy defective graphene modified using transition metals: Insights from Ti-BDVG(Ti)-Ti. Int. J. Hydrogen Energy 2023, 48, 14322–14336. [Google Scholar] [CrossRef]
- Abifarin, J.K.; Torres, J.F.; Lu, Y. 2D materials for enabling hydrogen as an energy vector. Nano Energy 2024, 129. [Google Scholar] [CrossRef]
- Nagar, R. Srivastava, S.; Hudson, S.L.; Amaya, S.L.; Tanna, A.; Sharma, M.; Achayalingam, R.; Sonkaria, S.; Khare, V.; Sesha S. Srinivasan, S.S. Recent developments in state-of-the-art hydrogen energy technologies – Review of hydrogen storage materials. Solar Compass 2023 5 100033.
- Singh, M.; Shukla, A.; Chakraborty, B. Highly efficient hydrogen storage of a Sc decorated biphenylene monolayer near ambient temperature: ab initio simulations. Sustain. Energy Fuels 2022, 7, 996–1010. [Google Scholar] [CrossRef]
- Marcos-Viquez, A.L.; Miranda, A.; Cruz-Irisson, M.; Pérez, L.A. Tin carbide monolayers decorated with alkali metal atoms for hydrogen storage. Int. J. Hydrogen Energy 2022, 47, 41329–41335. [Google Scholar] [CrossRef]
- Troullier, N.; Martins, J.L. Efficient pseudopotentials for plane-wave calculations. Phys. Rev. B 1991, 43, 1993–2006. [Google Scholar] [CrossRef] [PubMed]
- Perdew, J.P.; Burke, K.; Ernzerhof, M. Generalized gradient approximation made simple. Phys. Rev. Lett. 1996, 77, 3865–3868. [Google Scholar] [CrossRef] [PubMed]
- Soler, J. M.; Artacho, E.; Gale, J. D.; García, A.; Junquera, J.; Ordejón, P.; Sánchez-Portal, D. ; The SIESTA method for ab initio order-N materials simulation Phys. Condens. Matter 2002 14, 2745.
- Monkhorst, H.J.; Pack, J.D. Special points for Brillouin-zone integrations. Phys. Rev. B 1976, 13, 5188–5192. [Google Scholar] [CrossRef]
- Grimme, S. ; Semiempirical GGA-type density functional constructed with a long-range dispersion correction J. Comput. Chem. 2006 27 1787. [CrossRef]
- Giannozzi, P.; Andreussi, O.; Brumme, T.; Bunau, O.; Nardelli, M.B.; Calandra, M.; Car, R.; Cavazzoni, C.; Ceresoli, D.; Cococcioni, M.; et al. Advanced Capabilities for Materials Modelling with Quantum ESPRESSO J. Phys. Condens. Matter 2017 29 46 5901. [CrossRef]
- Kokalj, A. XCrySDen—a new program for displaying crystalline structures and electron densities. J. Mol. Graph. Model. 1999, 17, 176–179. [Google Scholar] [CrossRef]
Figure 1.
The unit cell of the optimized configurations of 2DMoP2 pristine surface (a) and the unit cell with a Mo vacancy (b).
Figure 1.
The unit cell of the optimized configurations of 2DMoP2 pristine surface (a) and the unit cell with a Mo vacancy (b).
Figure 2.
The optimized configuration of the 2DMoP2 pristine surface with eight adsorbed hydrogen molecules. This adsorption occurs on each side of the surface for 16 adsorbed molecules.
Figure 2.
The optimized configuration of the 2DMoP2 pristine surface with eight adsorbed hydrogen molecules. This adsorption occurs on each side of the surface for 16 adsorbed molecules.
Figure 3.
The FPMD calculation is at 300 K. The initial configuration is the optimization of the pristine 2D MoP2. The H2 molecules moved away from the surface, with one picosecond elapsed.
Figure 3.
The FPMD calculation is at 300 K. The initial configuration is the optimization of the pristine 2D MoP2. The H2 molecules moved away from the surface, with one picosecond elapsed.
Figure 4.
We performed the FPMD calculation at 3K, taking the initial configuration of the stable system as obtained at 300 K. Only two hydrogen molecules moved back to the surface, indicating that only those two remained adsorbed on the pristine 2D MoP2 surface at 300 K. The gravimetric capacity is 1.28% in this case.
Figure 5.
The FPMD calculation is at 77K, with the optimization as the initial configuration. All the molecules are displaced away from the surface.
Figure 5.
The FPMD calculation is at 77K, with the optimization as the initial configuration. All the molecules are displaced away from the surface.
Figure 6.
The FPMD calculation is at 3K, taking the initial configuration of the stable system as obtained at 77 K. Only three hydrogen molecules (per side) moved back to the surface, indicating that only those six remained adsorbed on the pristine 2D MoP2 surface at 77 K. The gravimetric capacity is 1.92%.
Figure 7.
The FPMD calculation is at 4K, with the optimization as the initial configuration. All hydrogen molecules remained close to the surface.
Figure 7.
The FPMD calculation is at 4K, with the optimization as the initial configuration. All hydrogen molecules remained close to the surface.
Figure 8.
We performed the FPMD calculation at 3K, taking the initial configuration of the stable system as obtained at 4 K. All the hydrogen molecules moved back to the surface, indicating that they adsorbed on the pristine 2D MoP2 surface. The gravimetric capacity for molecular hydrogen storage is for 16 hydrogen molecules, 5.1%.
Figure 9.
The optimized configuration is 2DMoP2 with 12.5% Mo vacancies and eight adsorbed hydrogen molecules. The adsorption occurs on each side of the surface for 16 adsorbed molecules. The average adsorption energy is ‒ 0.14 eV/molecule.
Figure 9.
The optimized configuration is 2DMoP2 with 12.5% Mo vacancies and eight adsorbed hydrogen molecules. The adsorption occurs on each side of the surface for 16 adsorbed molecules. The average adsorption energy is ‒ 0.14 eV/molecule.
Figure 10.
FPMD calculation at 300 K, where the initial state is the optimization of the 2D MoP2 with 12.5% Mo vacancies. The hydrogen molecules moved away from the surface. The elapsed time was one picosecond.
Figure 10.
FPMD calculation at 300 K, where the initial state is the optimization of the 2D MoP2 with 12.5% Mo vacancies. The hydrogen molecules moved away from the surface. The elapsed time was one picosecond.
Figure 11.
FPMD calculation at 3 K, where the initial state is the stable configuration at 300 K of the 2D MoP2 with 12.5% Mo vacancies. Only seven hydrogen molecules remained attached to the surface; this corresponds to a gravimetric capacity for molecular hydrogen storage of 5.27%. The elapsed time was two picoseconds.
Figure 12.
FPMD calculation at 77 K, where the initial state is the optimization. All the molecules moved away from the surface. The elapsed time was two picoseconds.
Figure 12.
FPMD calculation at 77 K, where the initial state is the optimization. All the molecules moved away from the surface. The elapsed time was two picoseconds.
Figure 13.
FPMD calculation at 3 K, where the initial state is the stable configuration at 77 K of the 2D MoP2 with 12.5% Mo vacancies. All the hydrogen molecules remained attached to the surface; this corresponds to a gravimetric capacity for molecular hydrogen storage of 6.02%. The elapsed time was two picoseconds.
Figure 14.
FPMD calculation at 4 K, where the initial state is the optimization. All the molecules moved away from the surface. The elapsed time was two picoseconds.
Figure 14.
FPMD calculation at 4 K, where the initial state is the optimization. All the molecules moved away from the surface. The elapsed time was two picoseconds.
Figure 15.
FPMD calculation at 3 K, where the initial state is the stable configuration at 4 K of the 2D MoP2 with 12.5% Mo vacancies. As expected, the eight hydrogen molecules (per side) remained attached to the surface; the gravimetric capacity is 6.02%. The elapsed time was around two picoseconds.
|
Disclaimer/Publisher’s Note: The statements, opinions and data contained in all publications are solely those of the individual author(s) and contributor(s) and not of MDPI and/or the editor(s). MDPI and/or the editor(s) disclaim responsibility for any injury to people or property resulting from any ideas, methods, instructions or products referred to in the content. |
© 2024 by the authors. Licensee MDPI, Basel, Switzerland. This article is an open access article distributed under the terms and conditions of the Creative Commons Attribution (CC BY) license (https://creativecommons.org/licenses/by/4.0/).

