Submitted:
27 September 2024
Posted:
29 September 2024
You are already at the latest version
Abstract
Keywords:
1. Introduction
2. Experimental Campaign
2.1. Connection
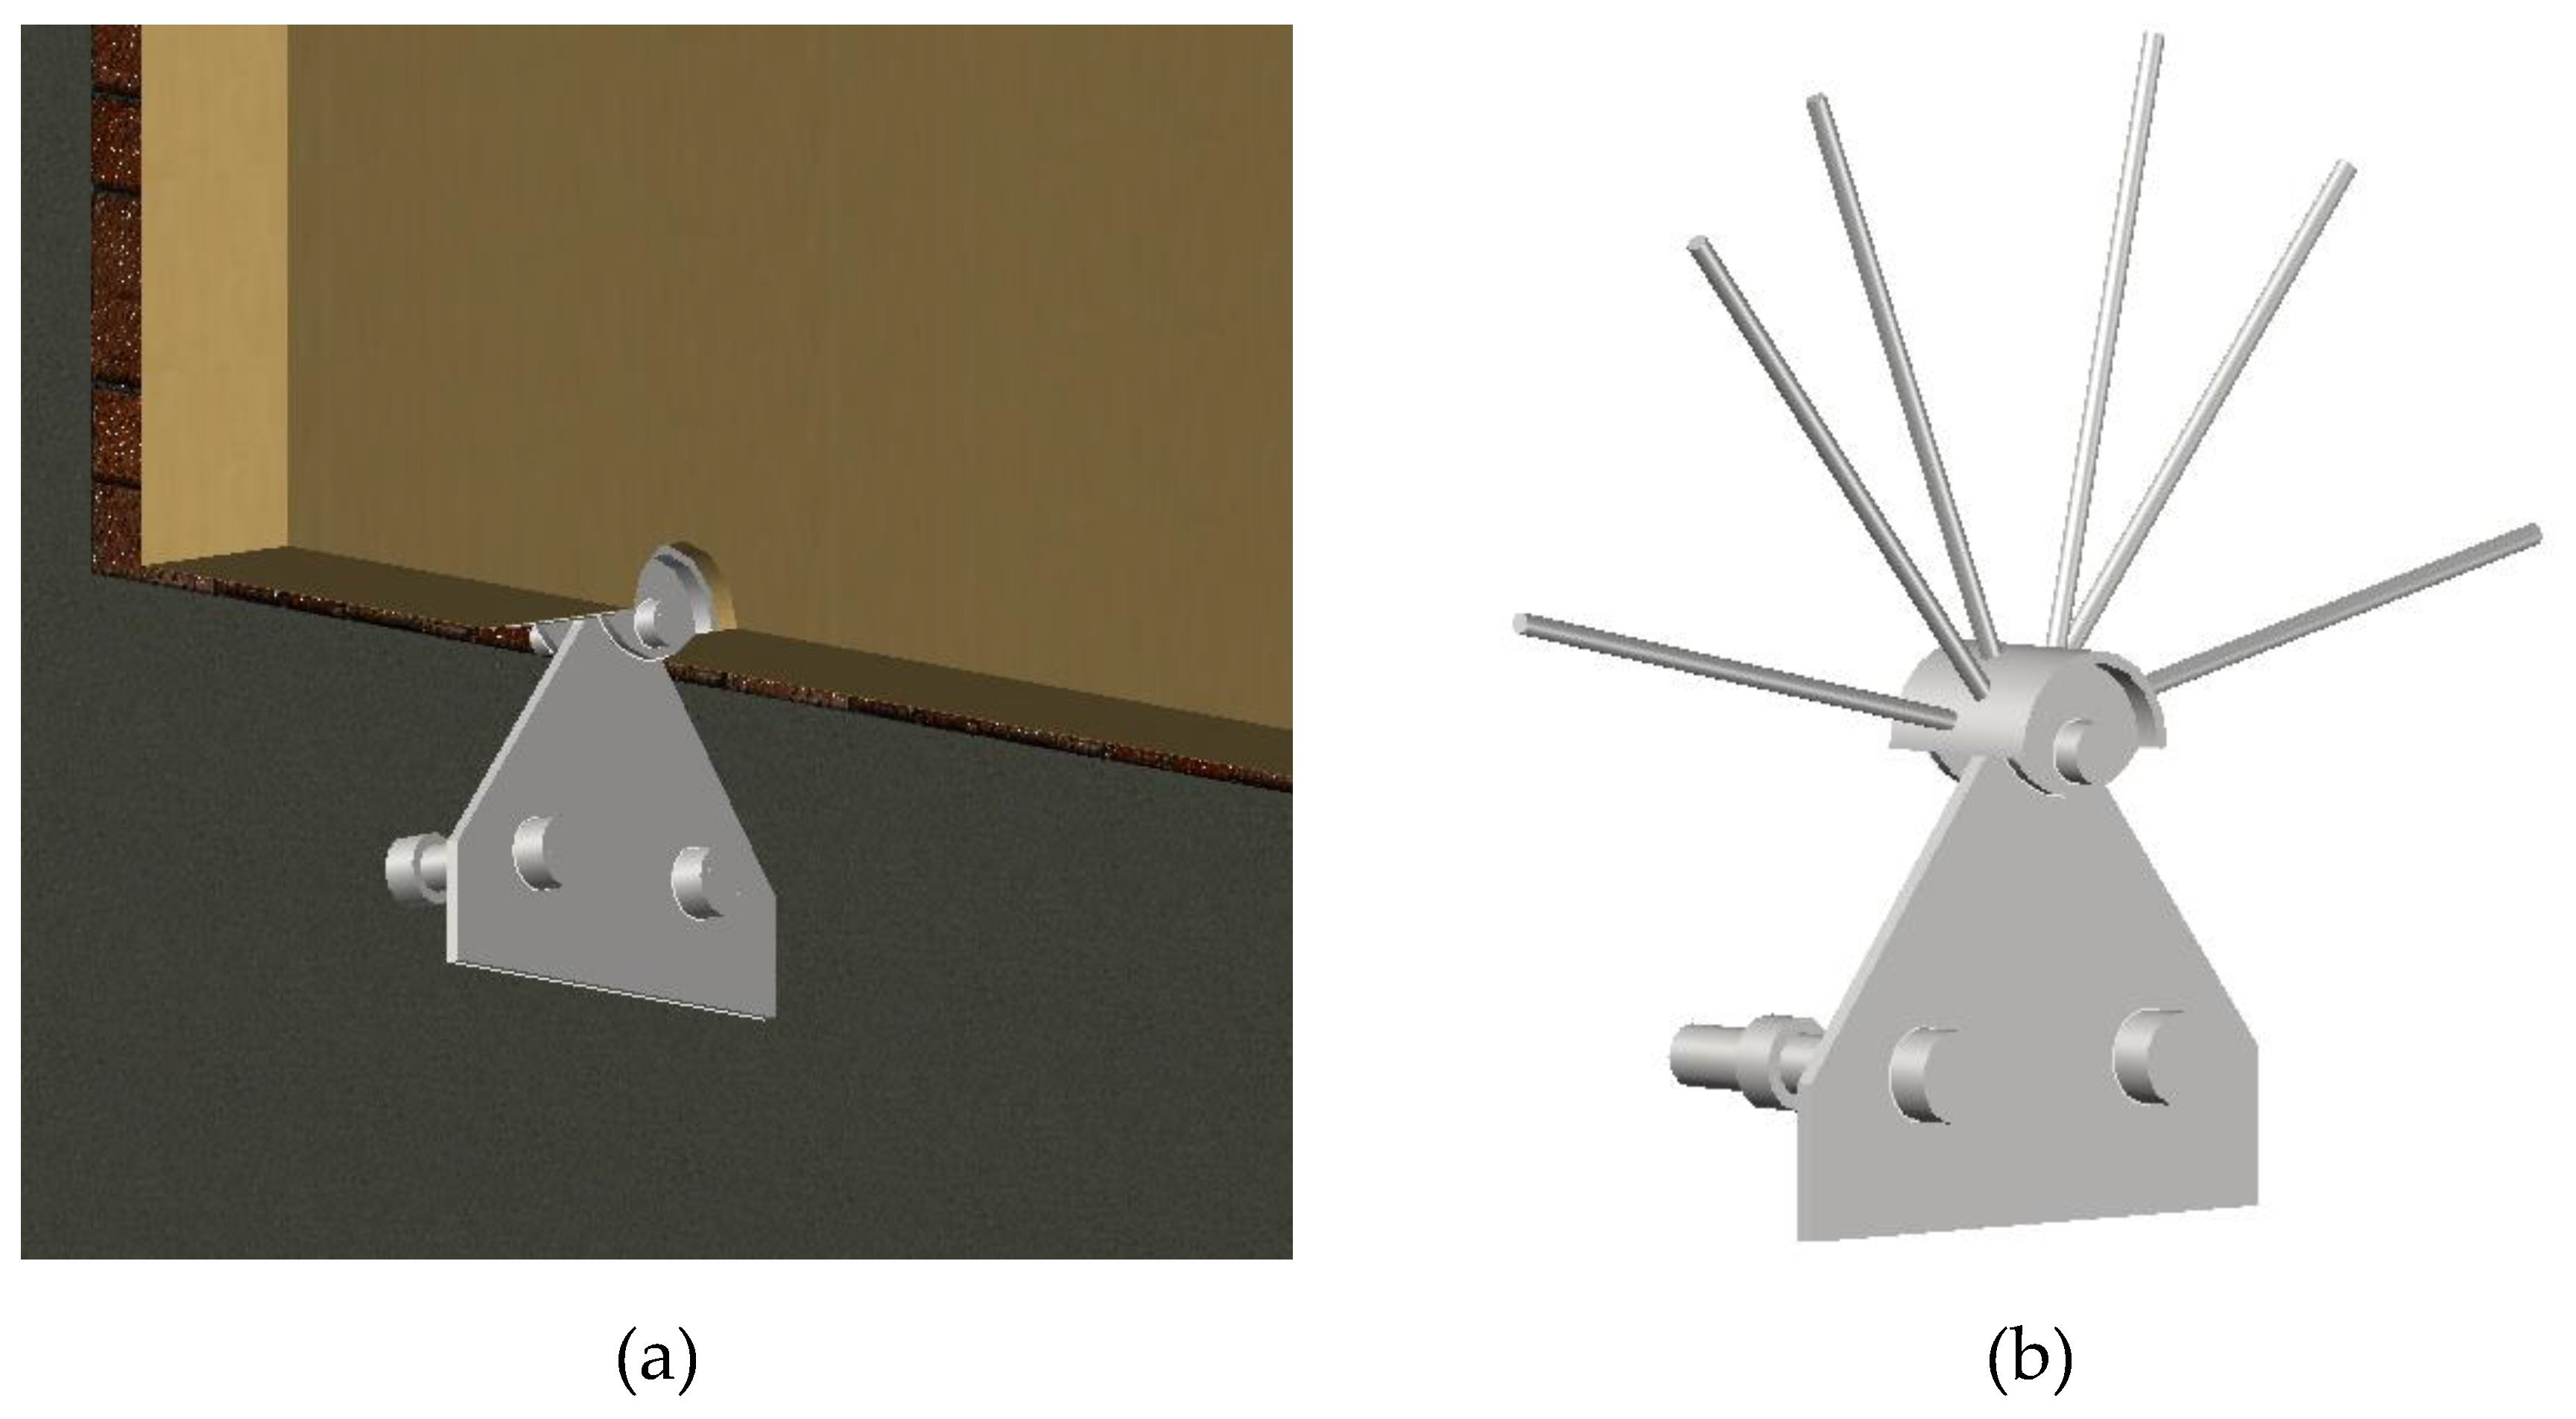
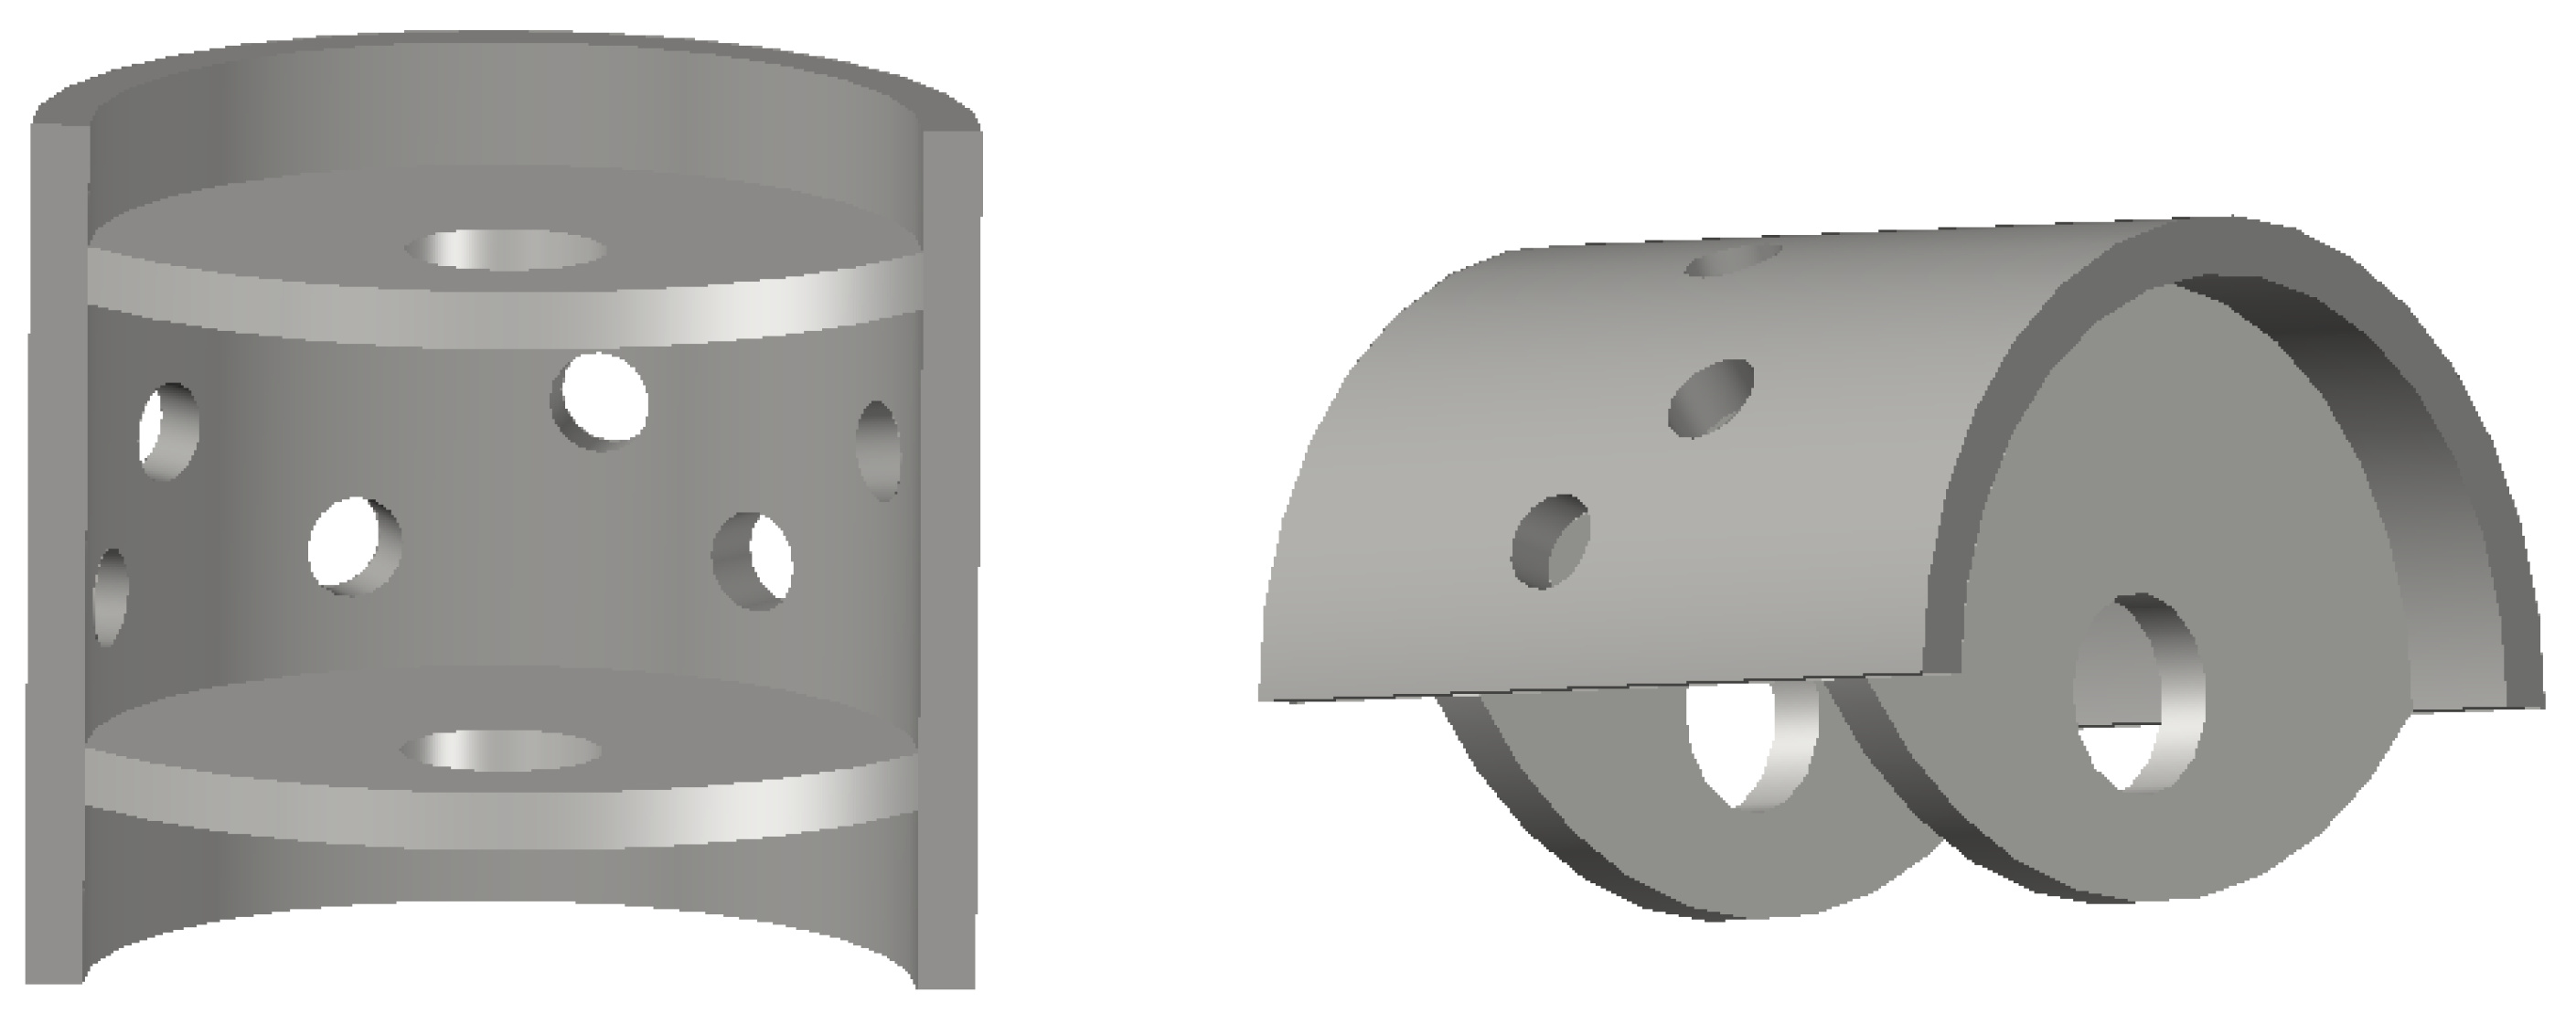
- RADIAL
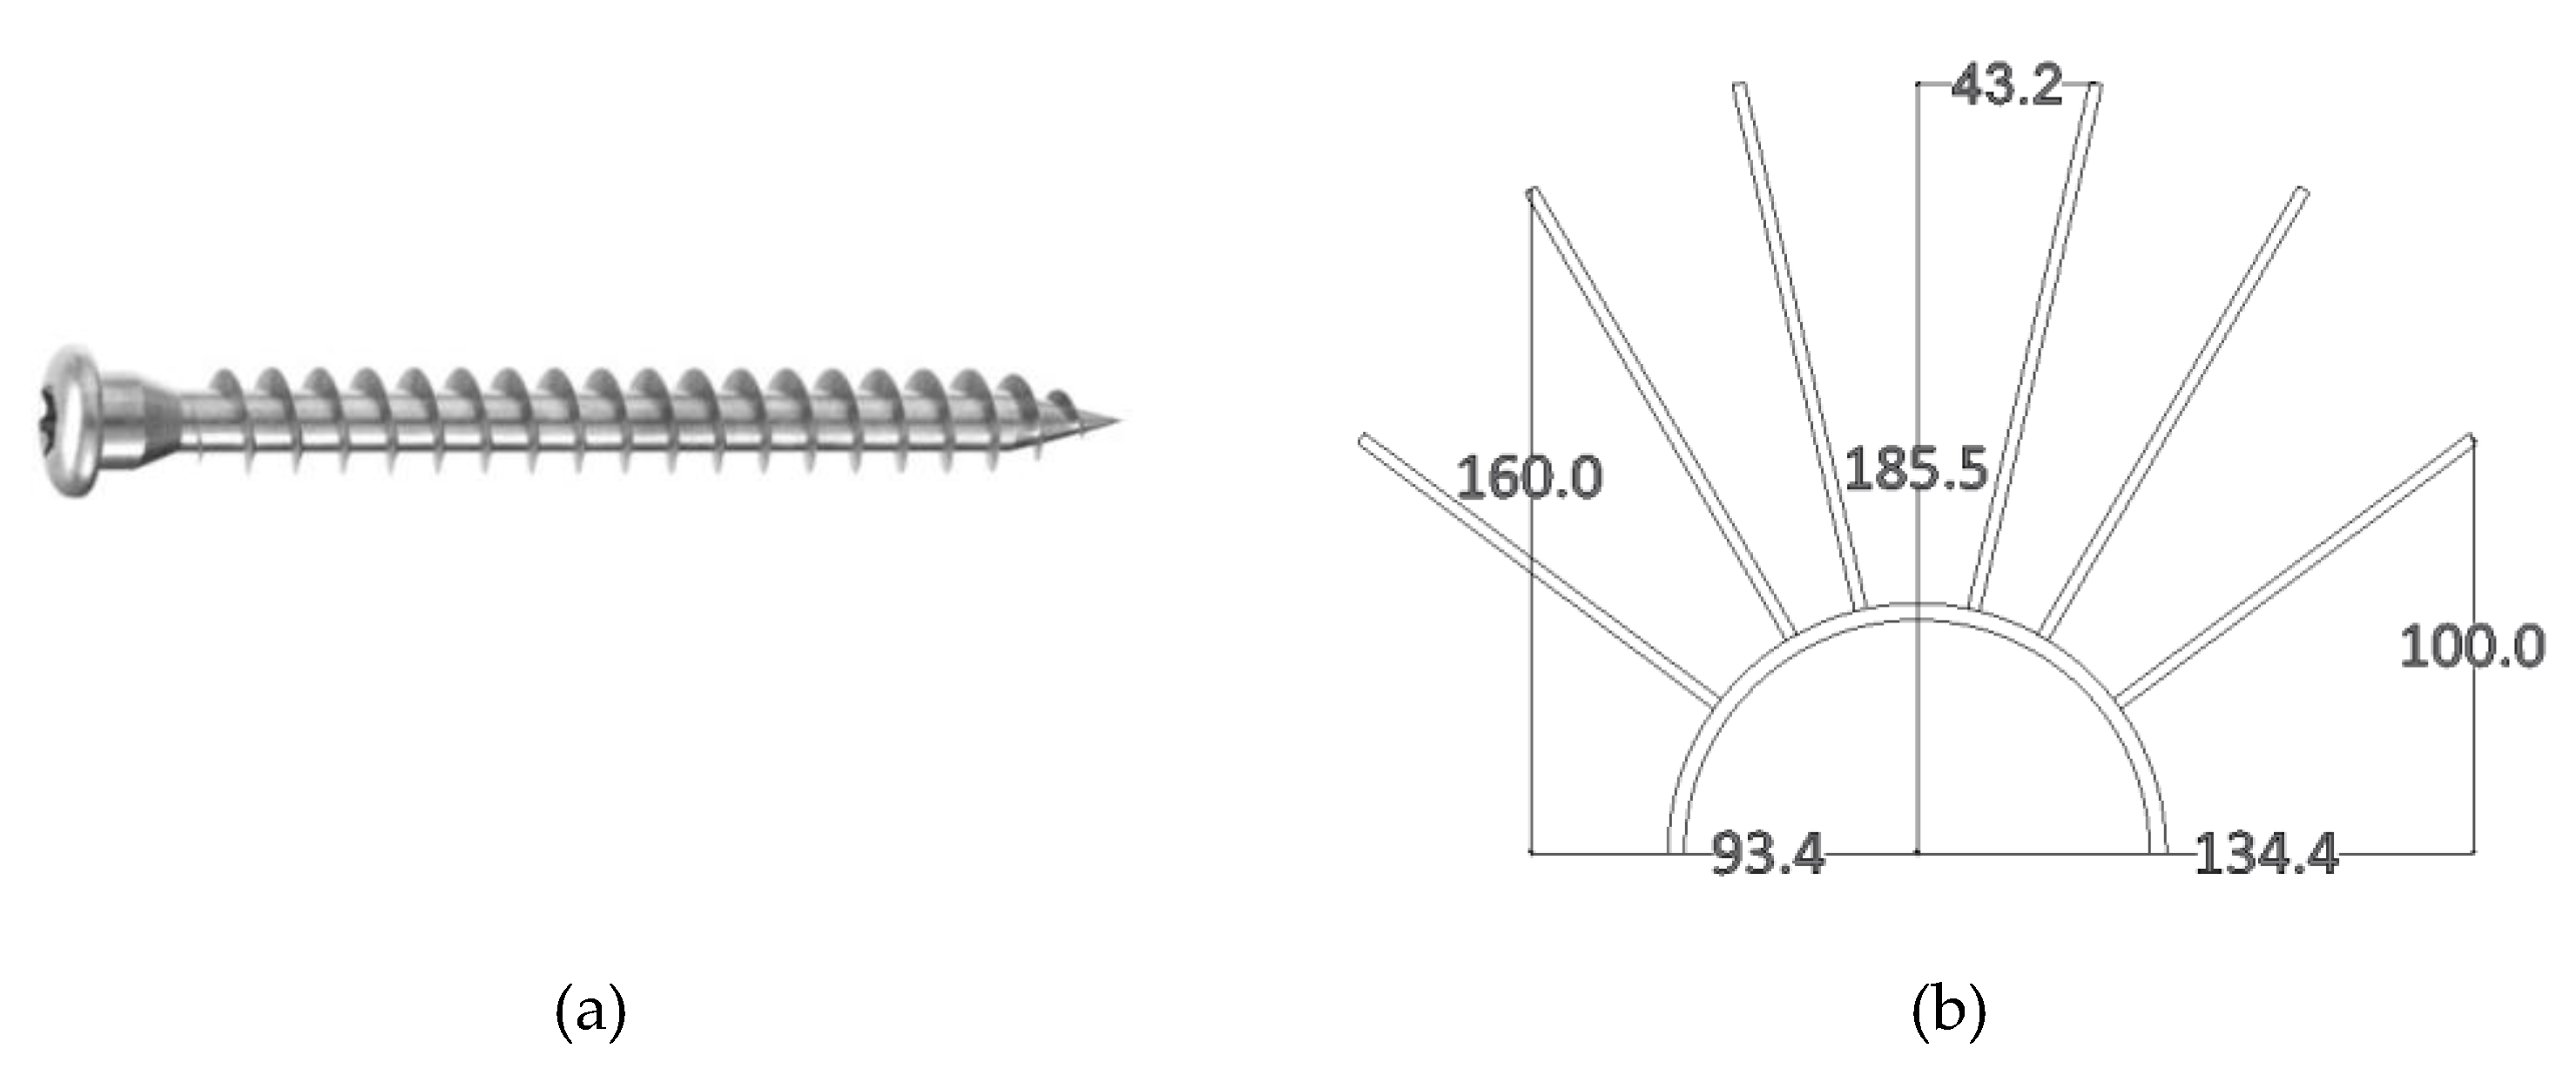
- Screws
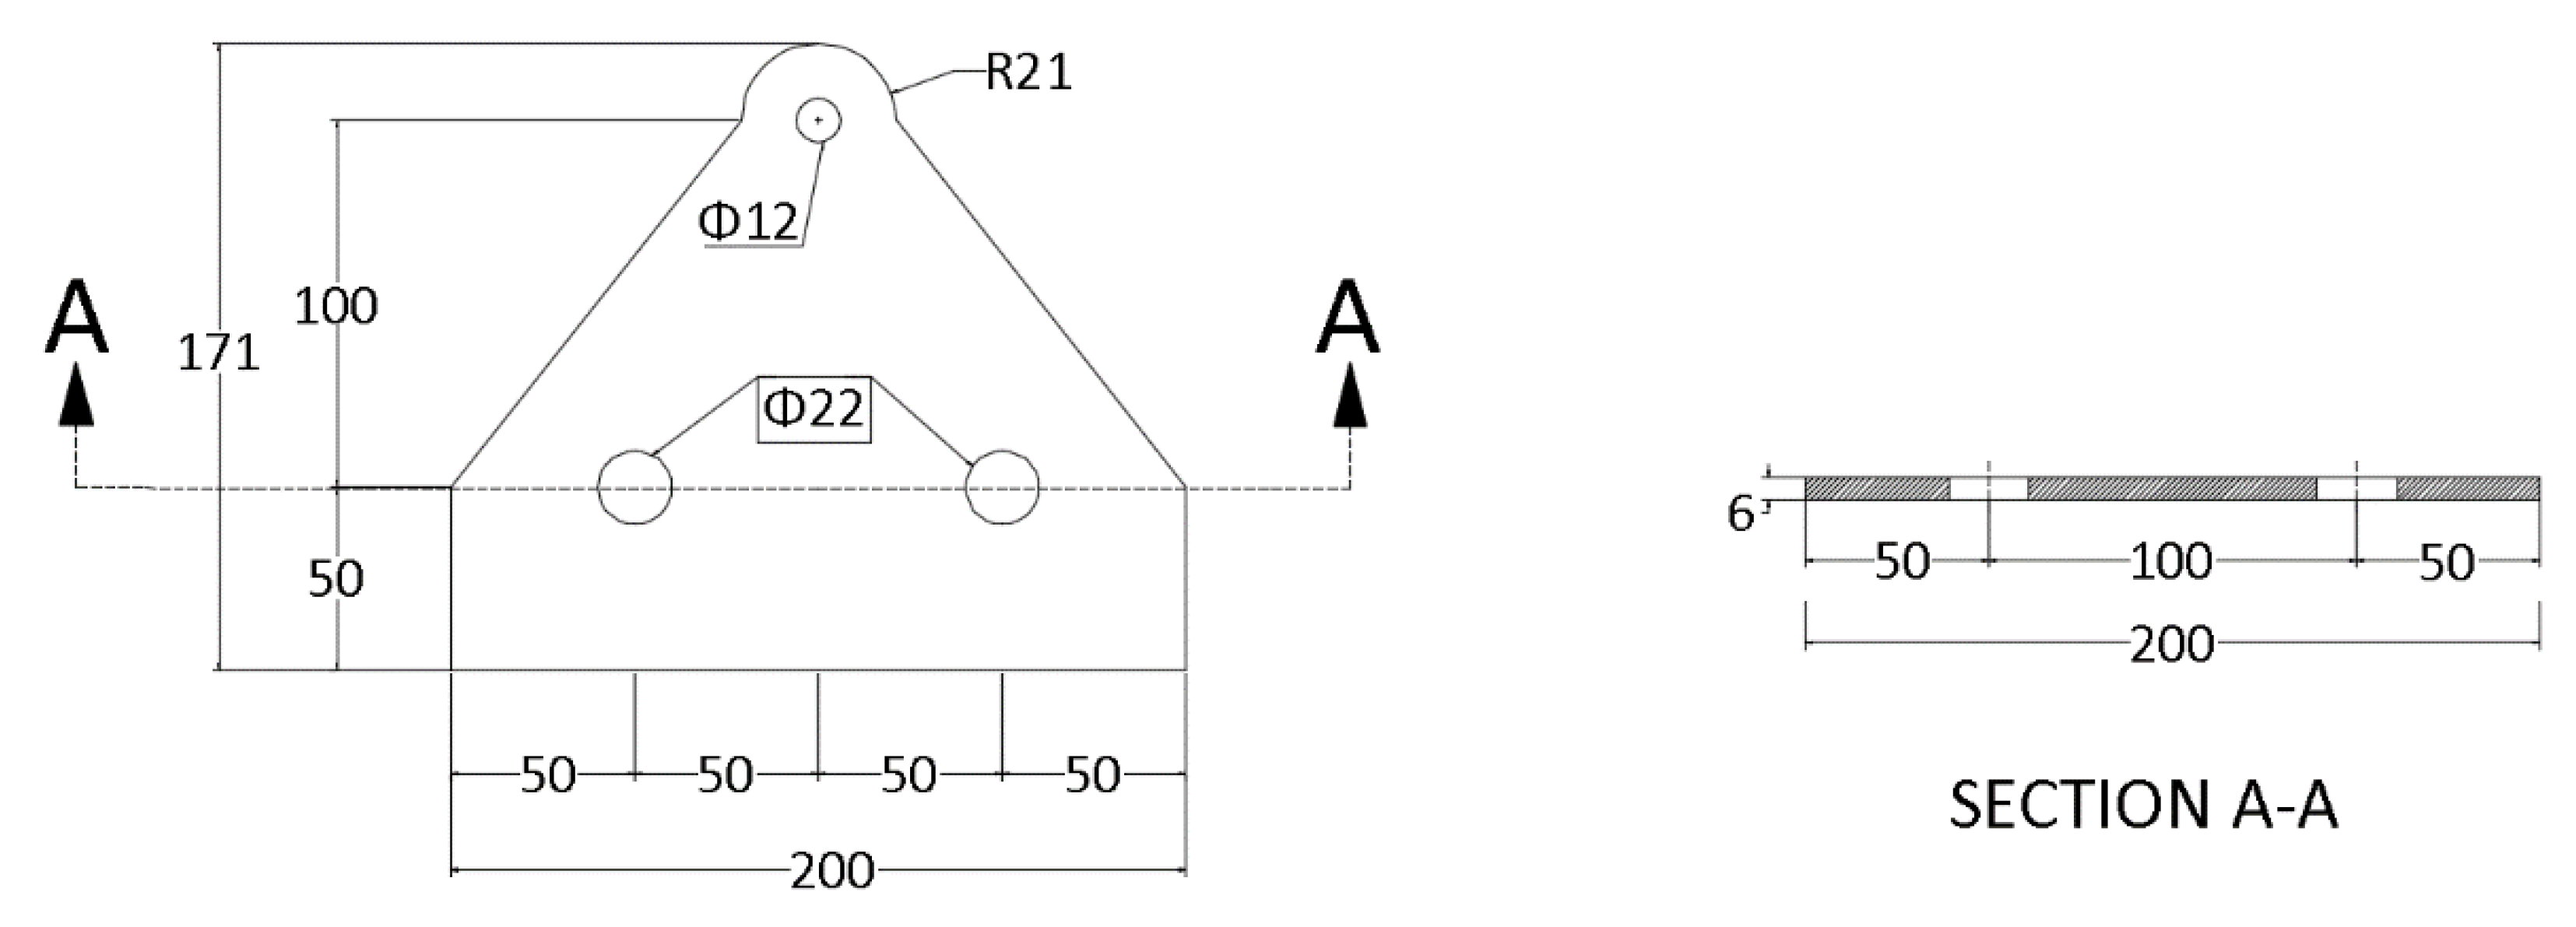
- Triangular plate (TP)
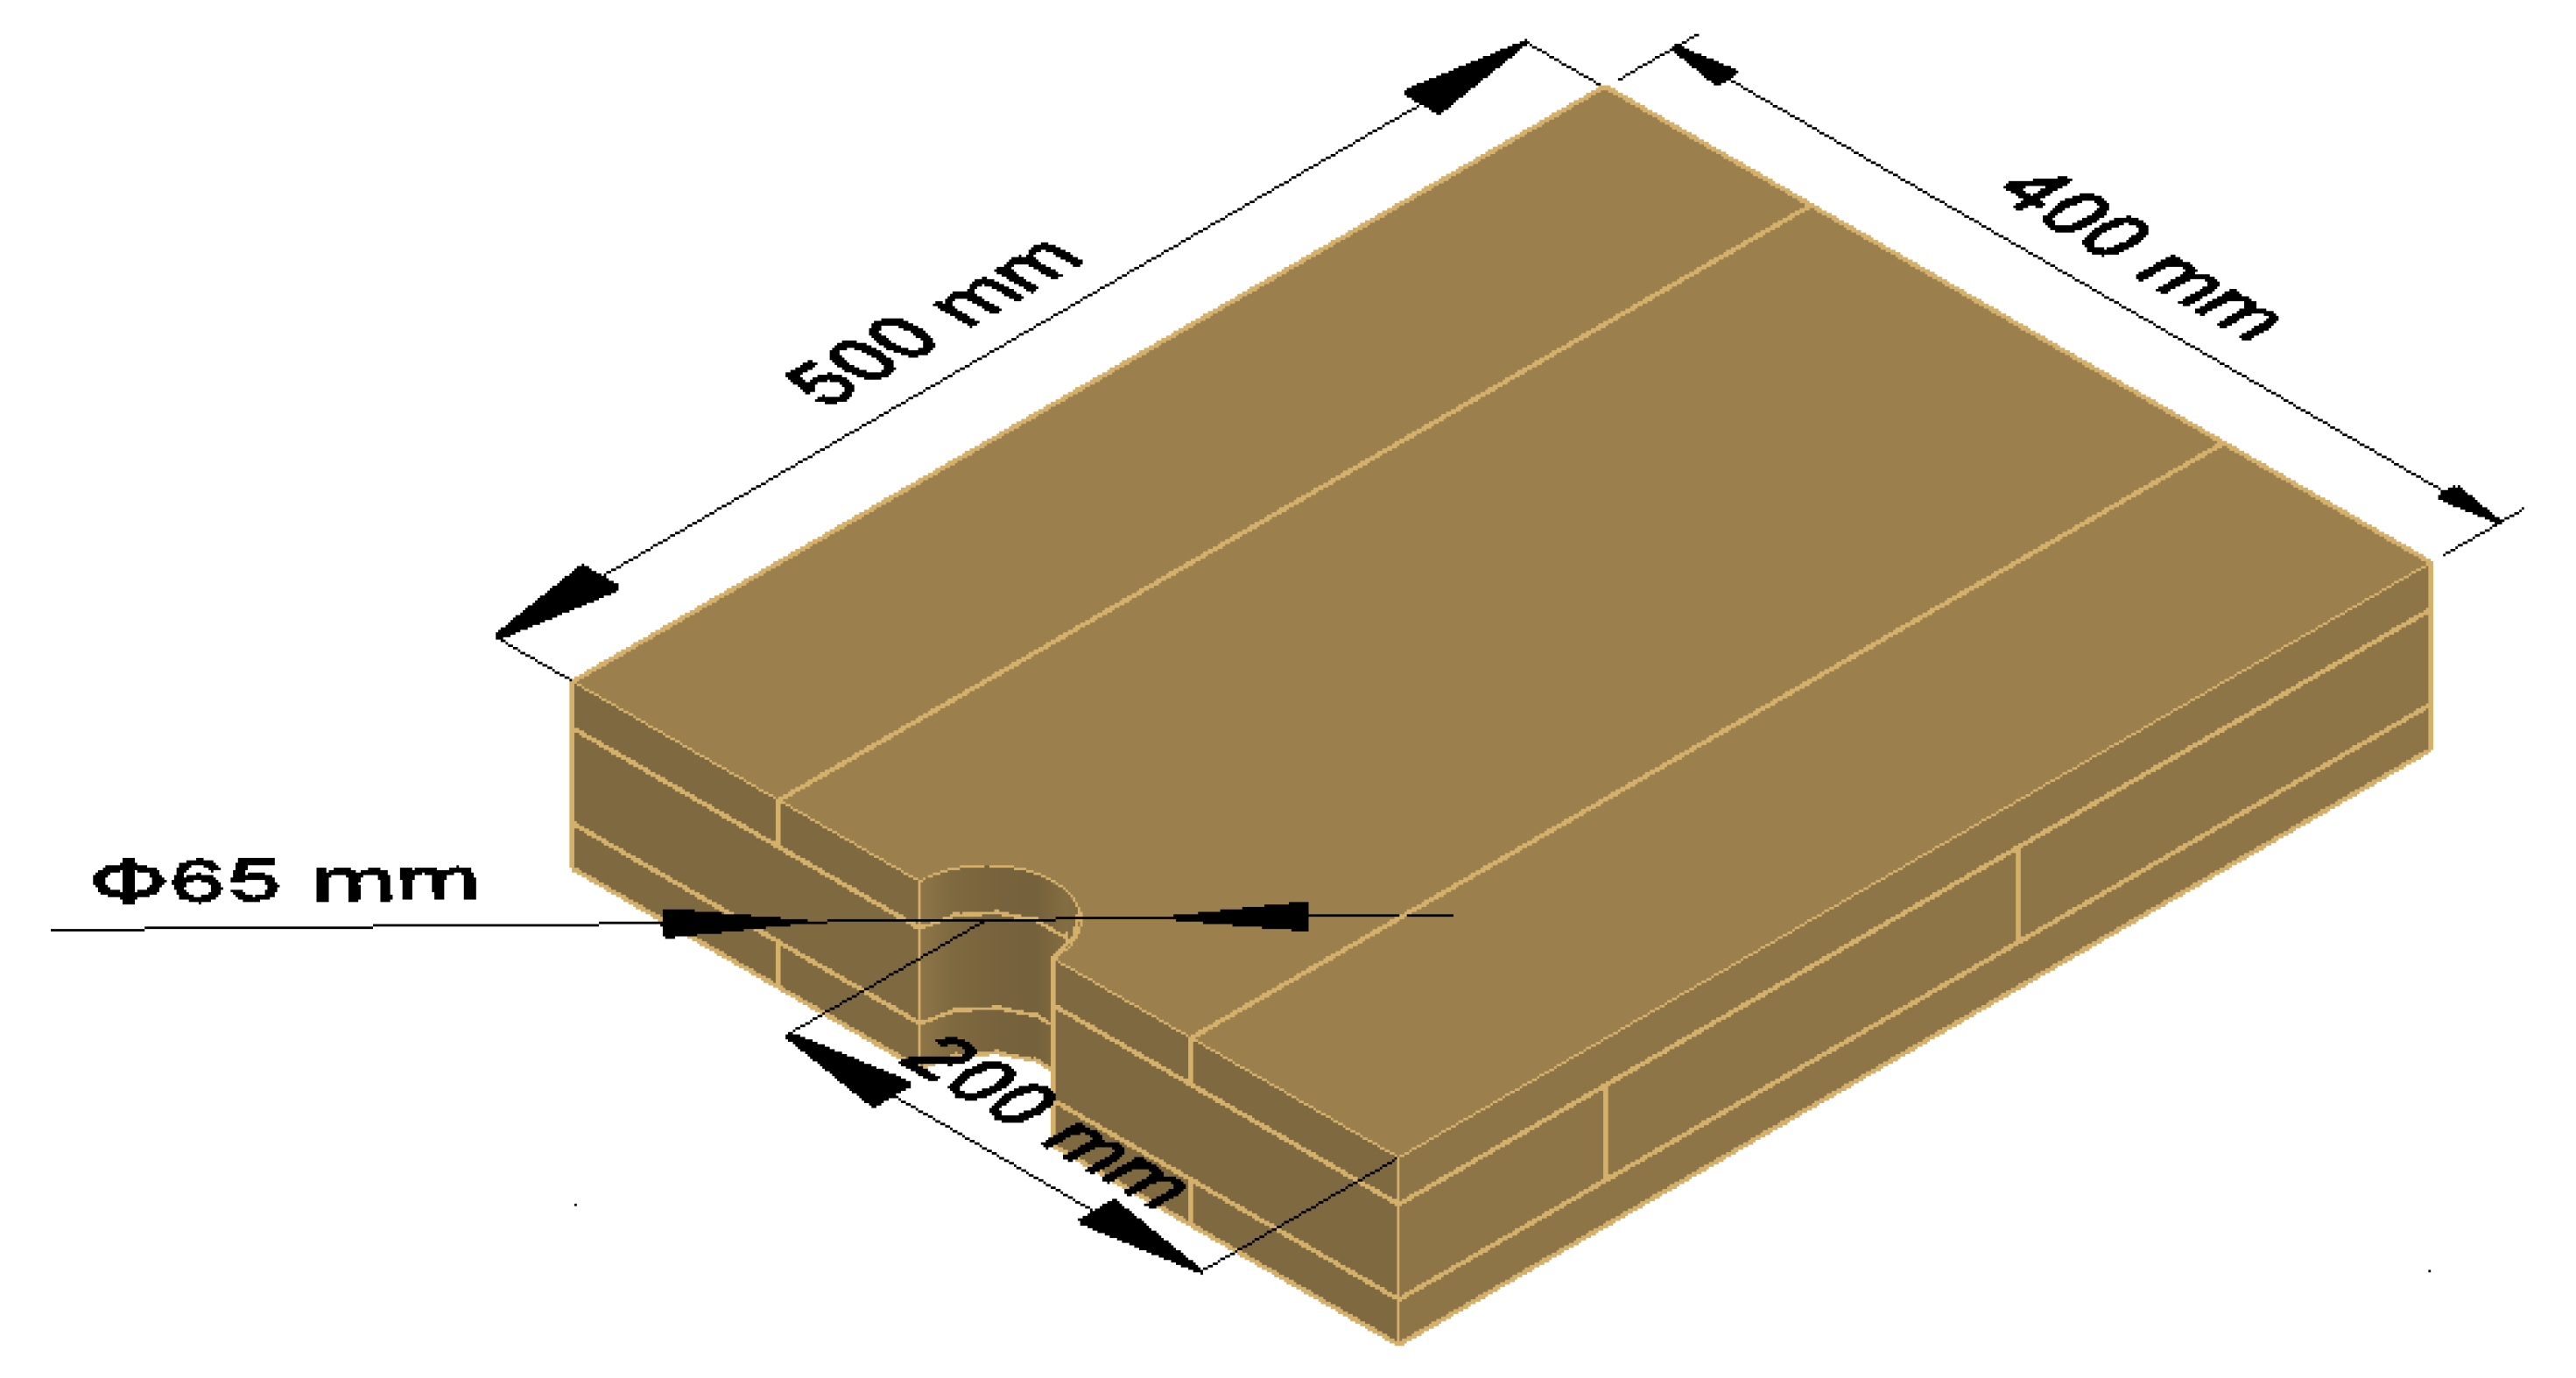
2.2. CLT Panel
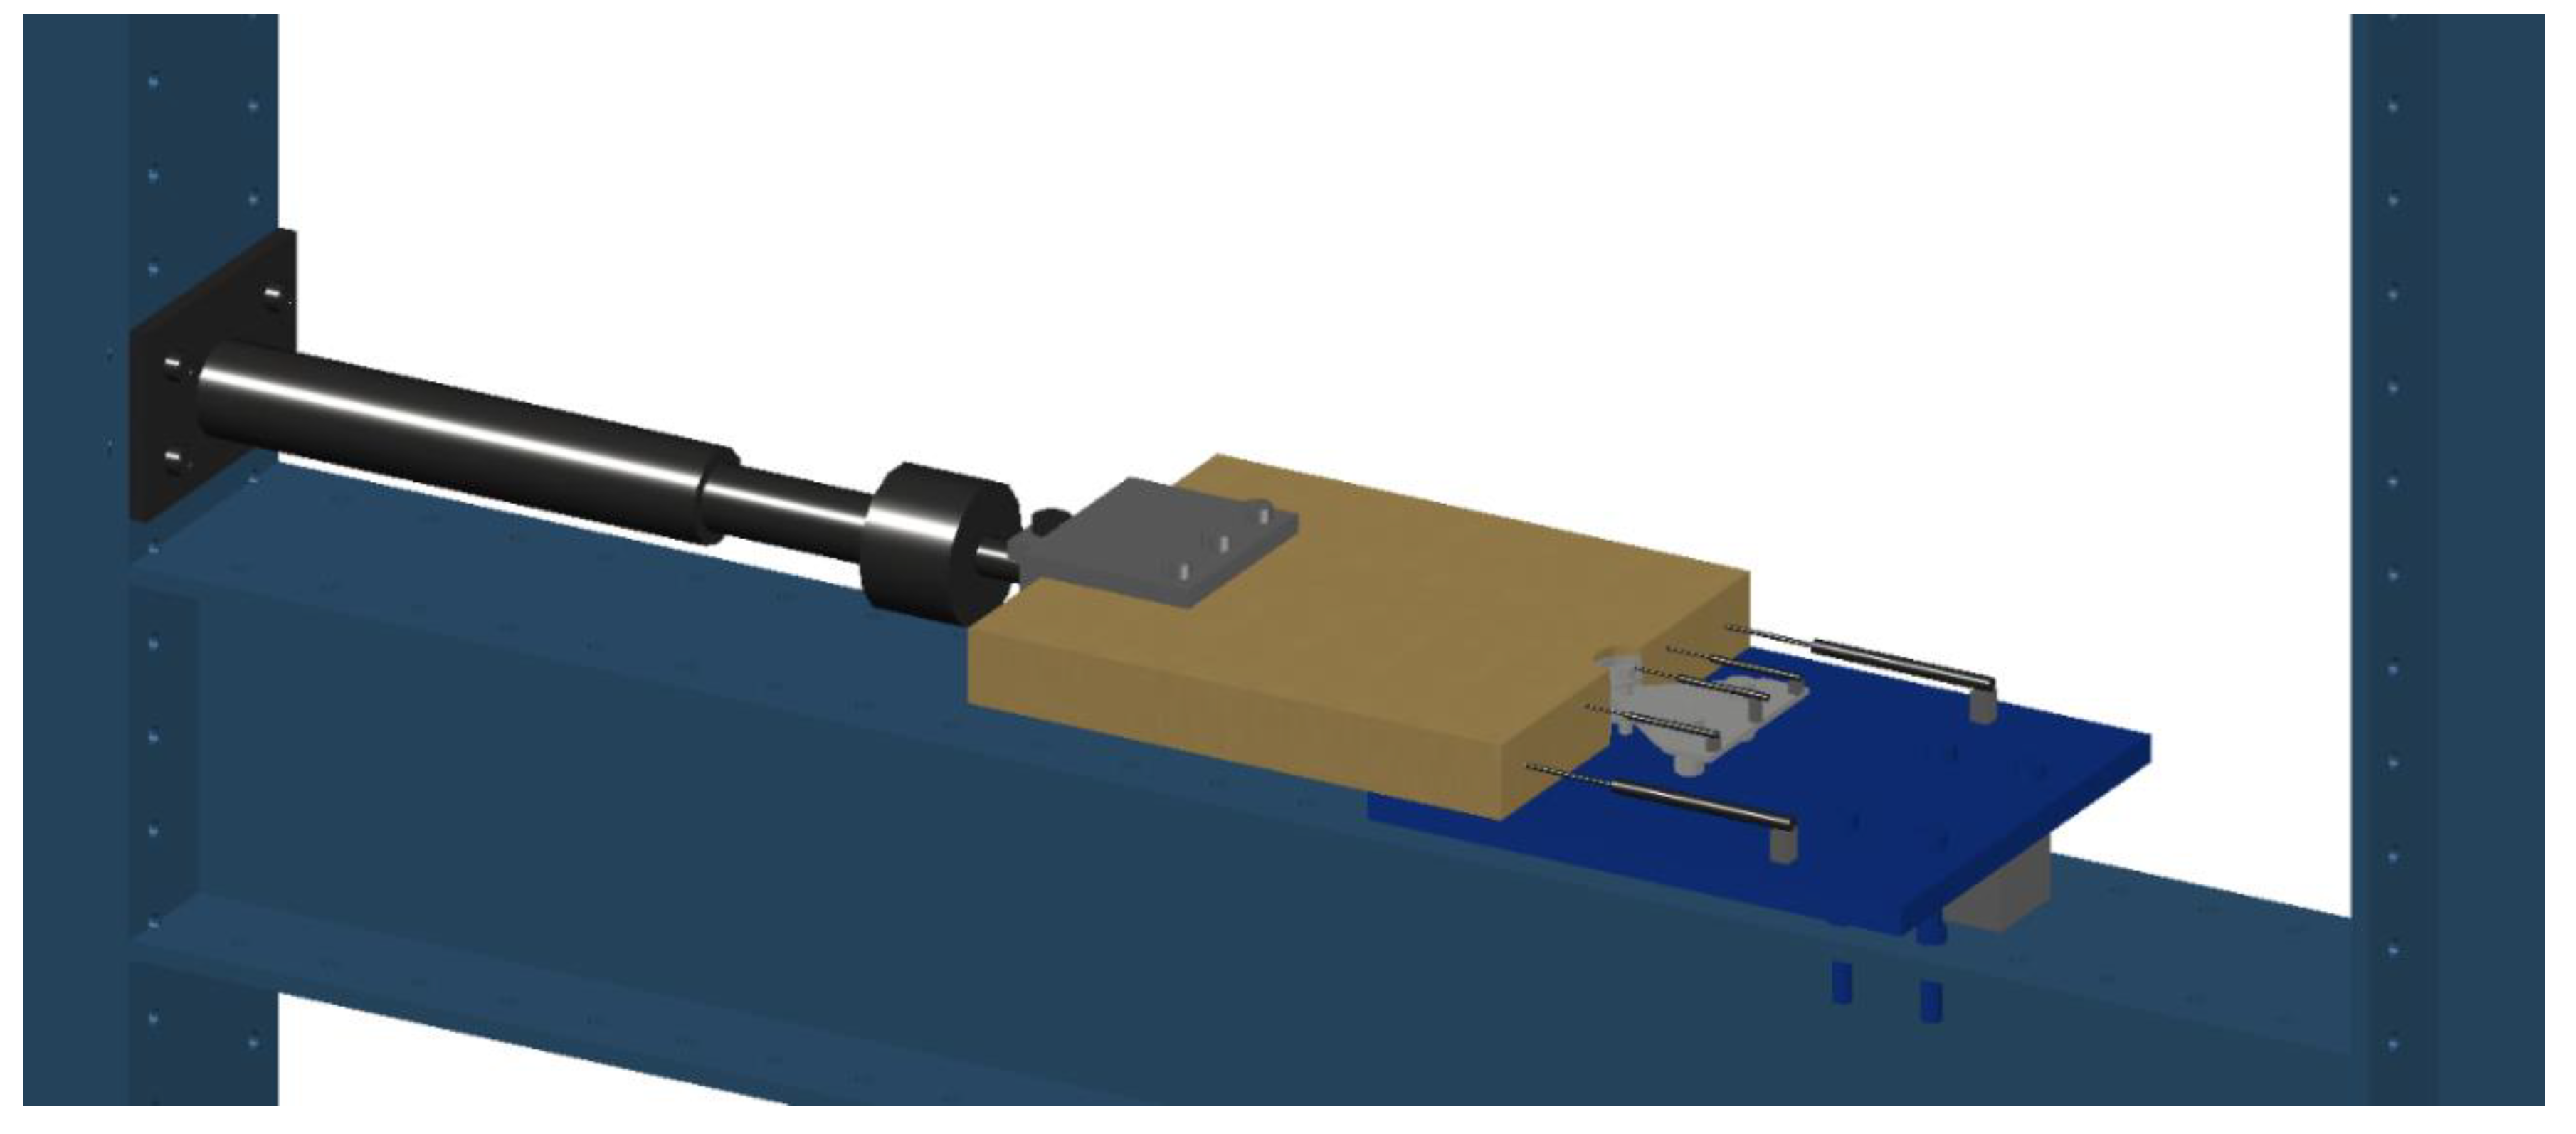
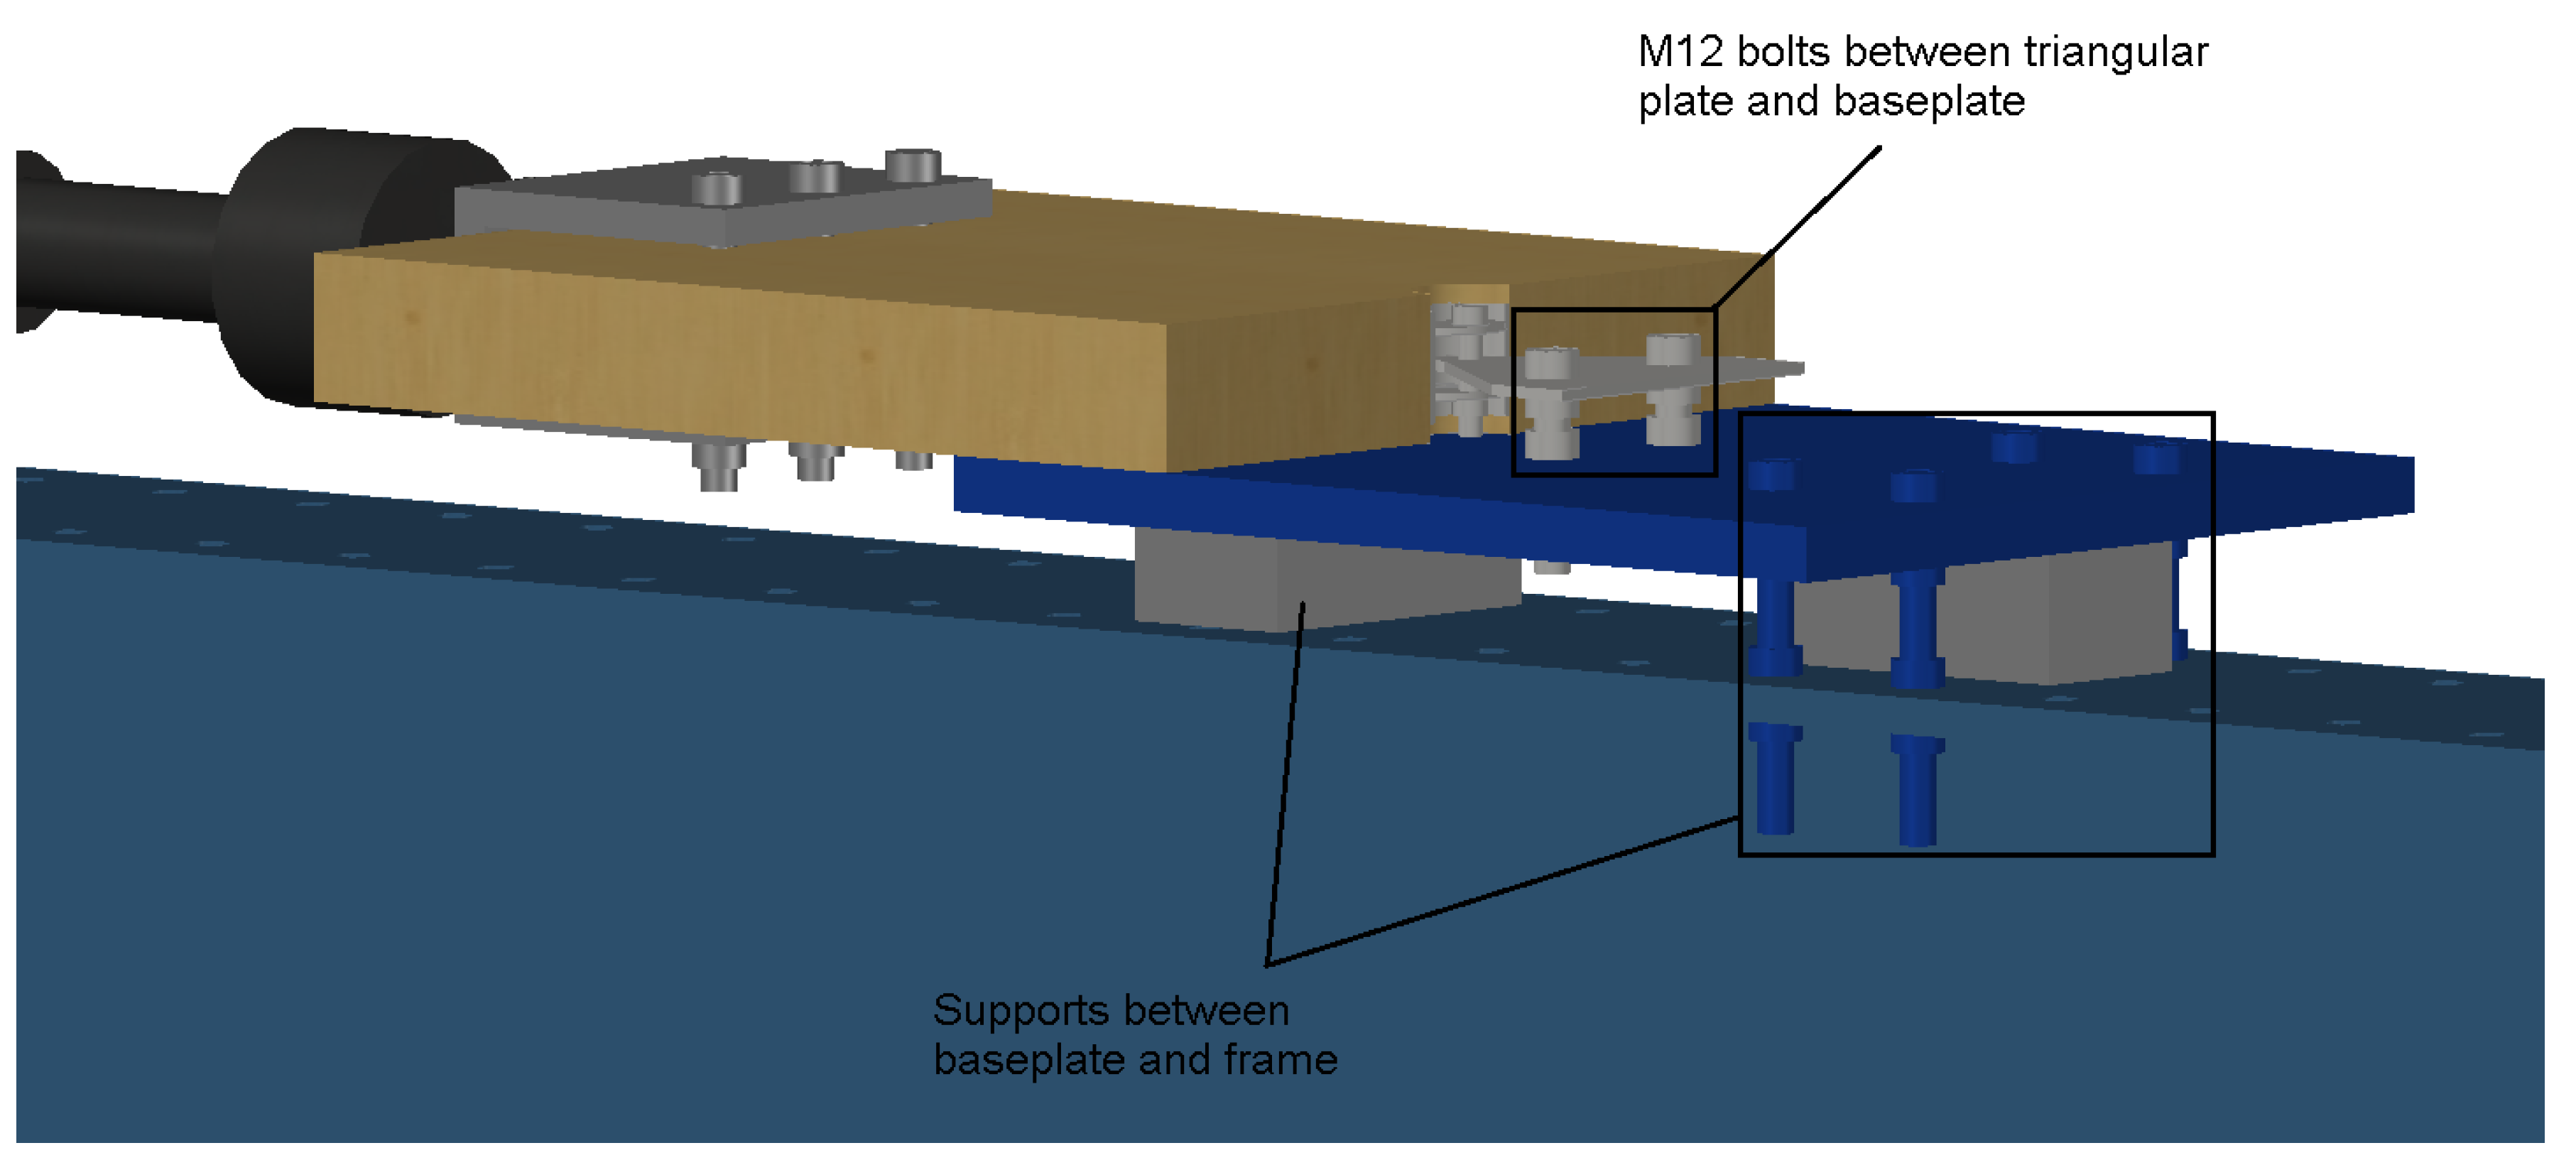
2.3. Test-Setup
2.4. Loading of Specimens
- The loading connection detail
- Loading procedure
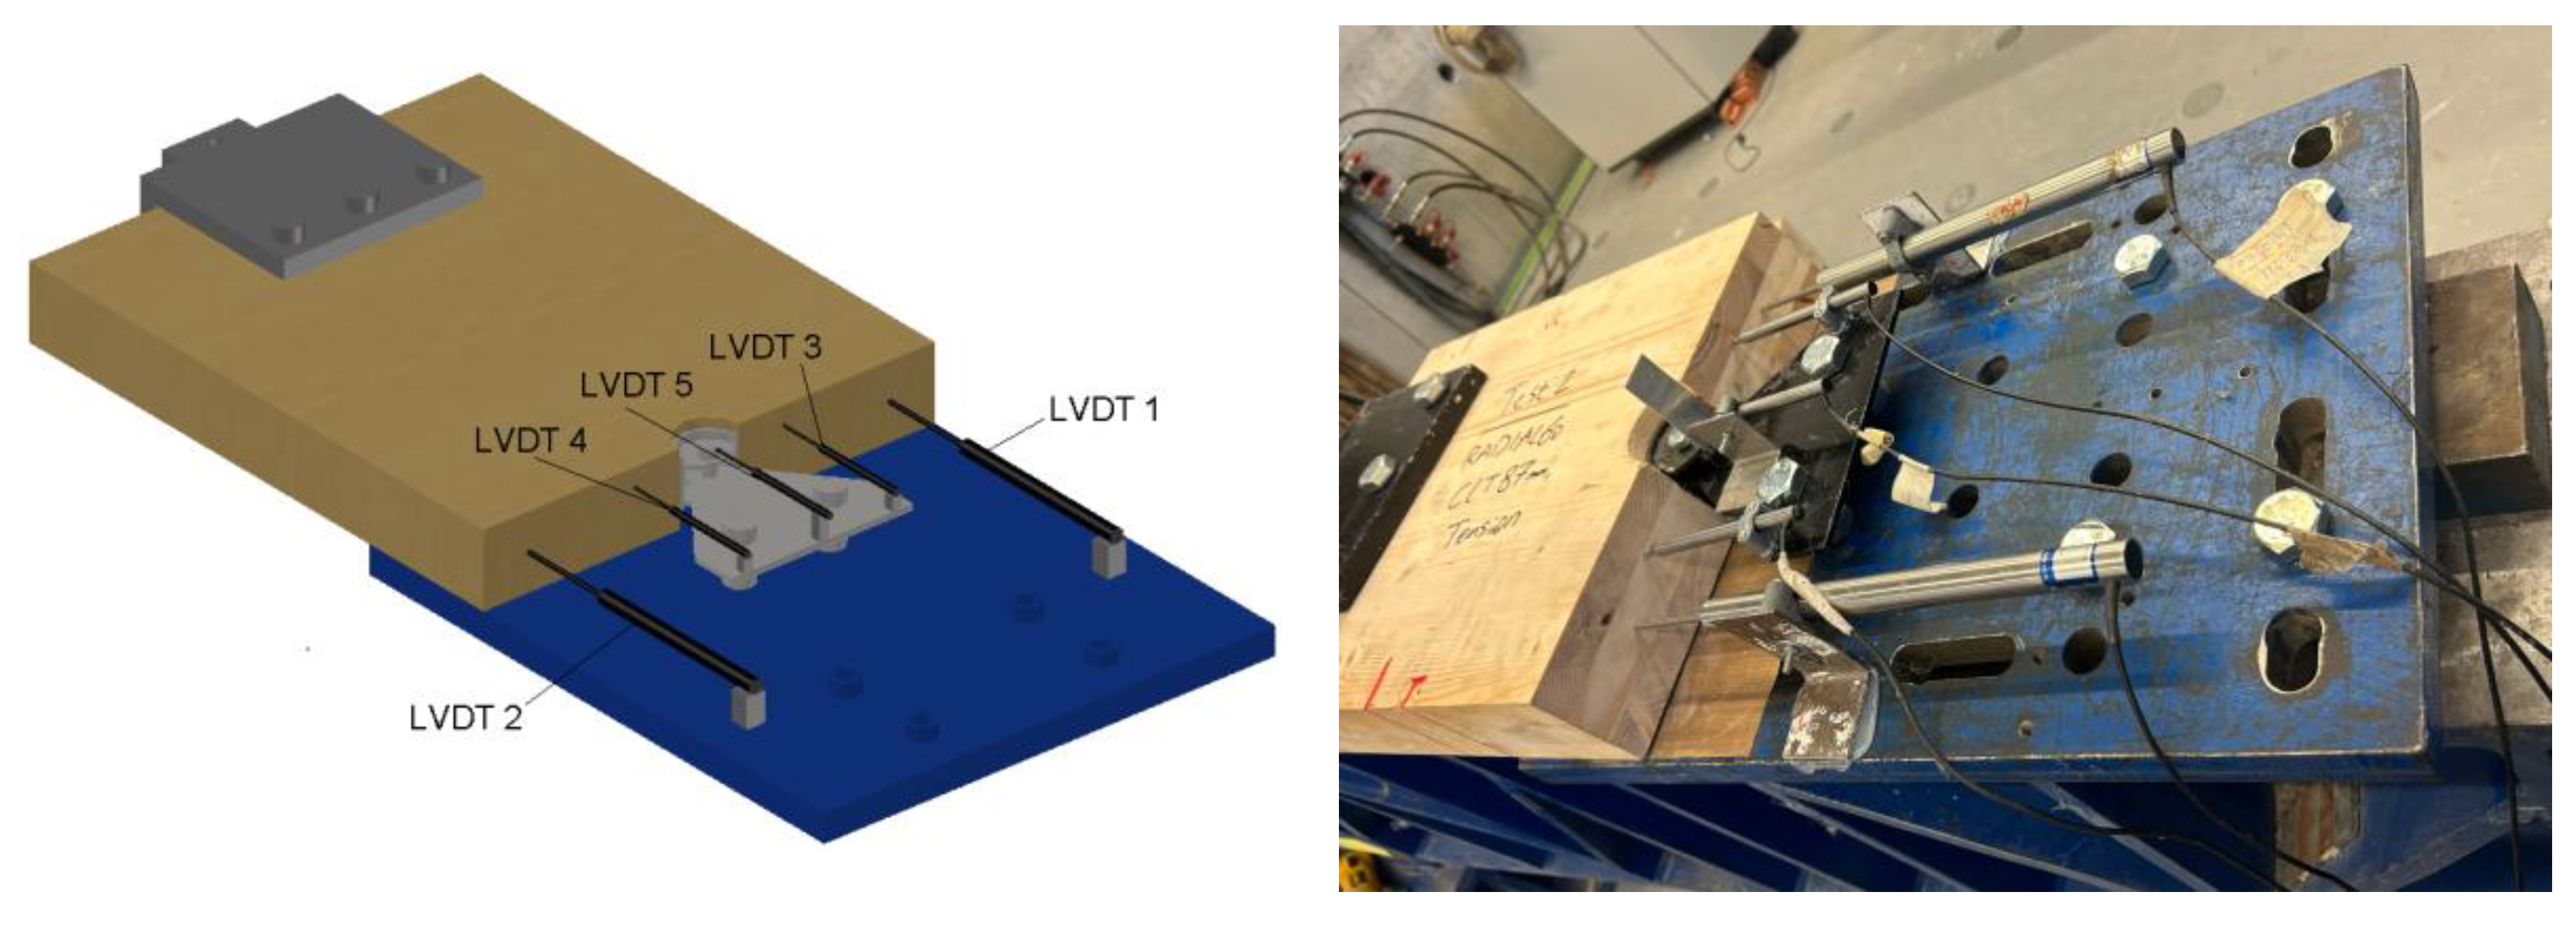
2.5. LVDTs
2.6. Tests Description
3. Results
3.1. Failure Modes
3.2. Structural Capacity of Connection
3.1.1. Monotonic Loading
3.1.1. Cyclic Loading
- Connector ductility-level
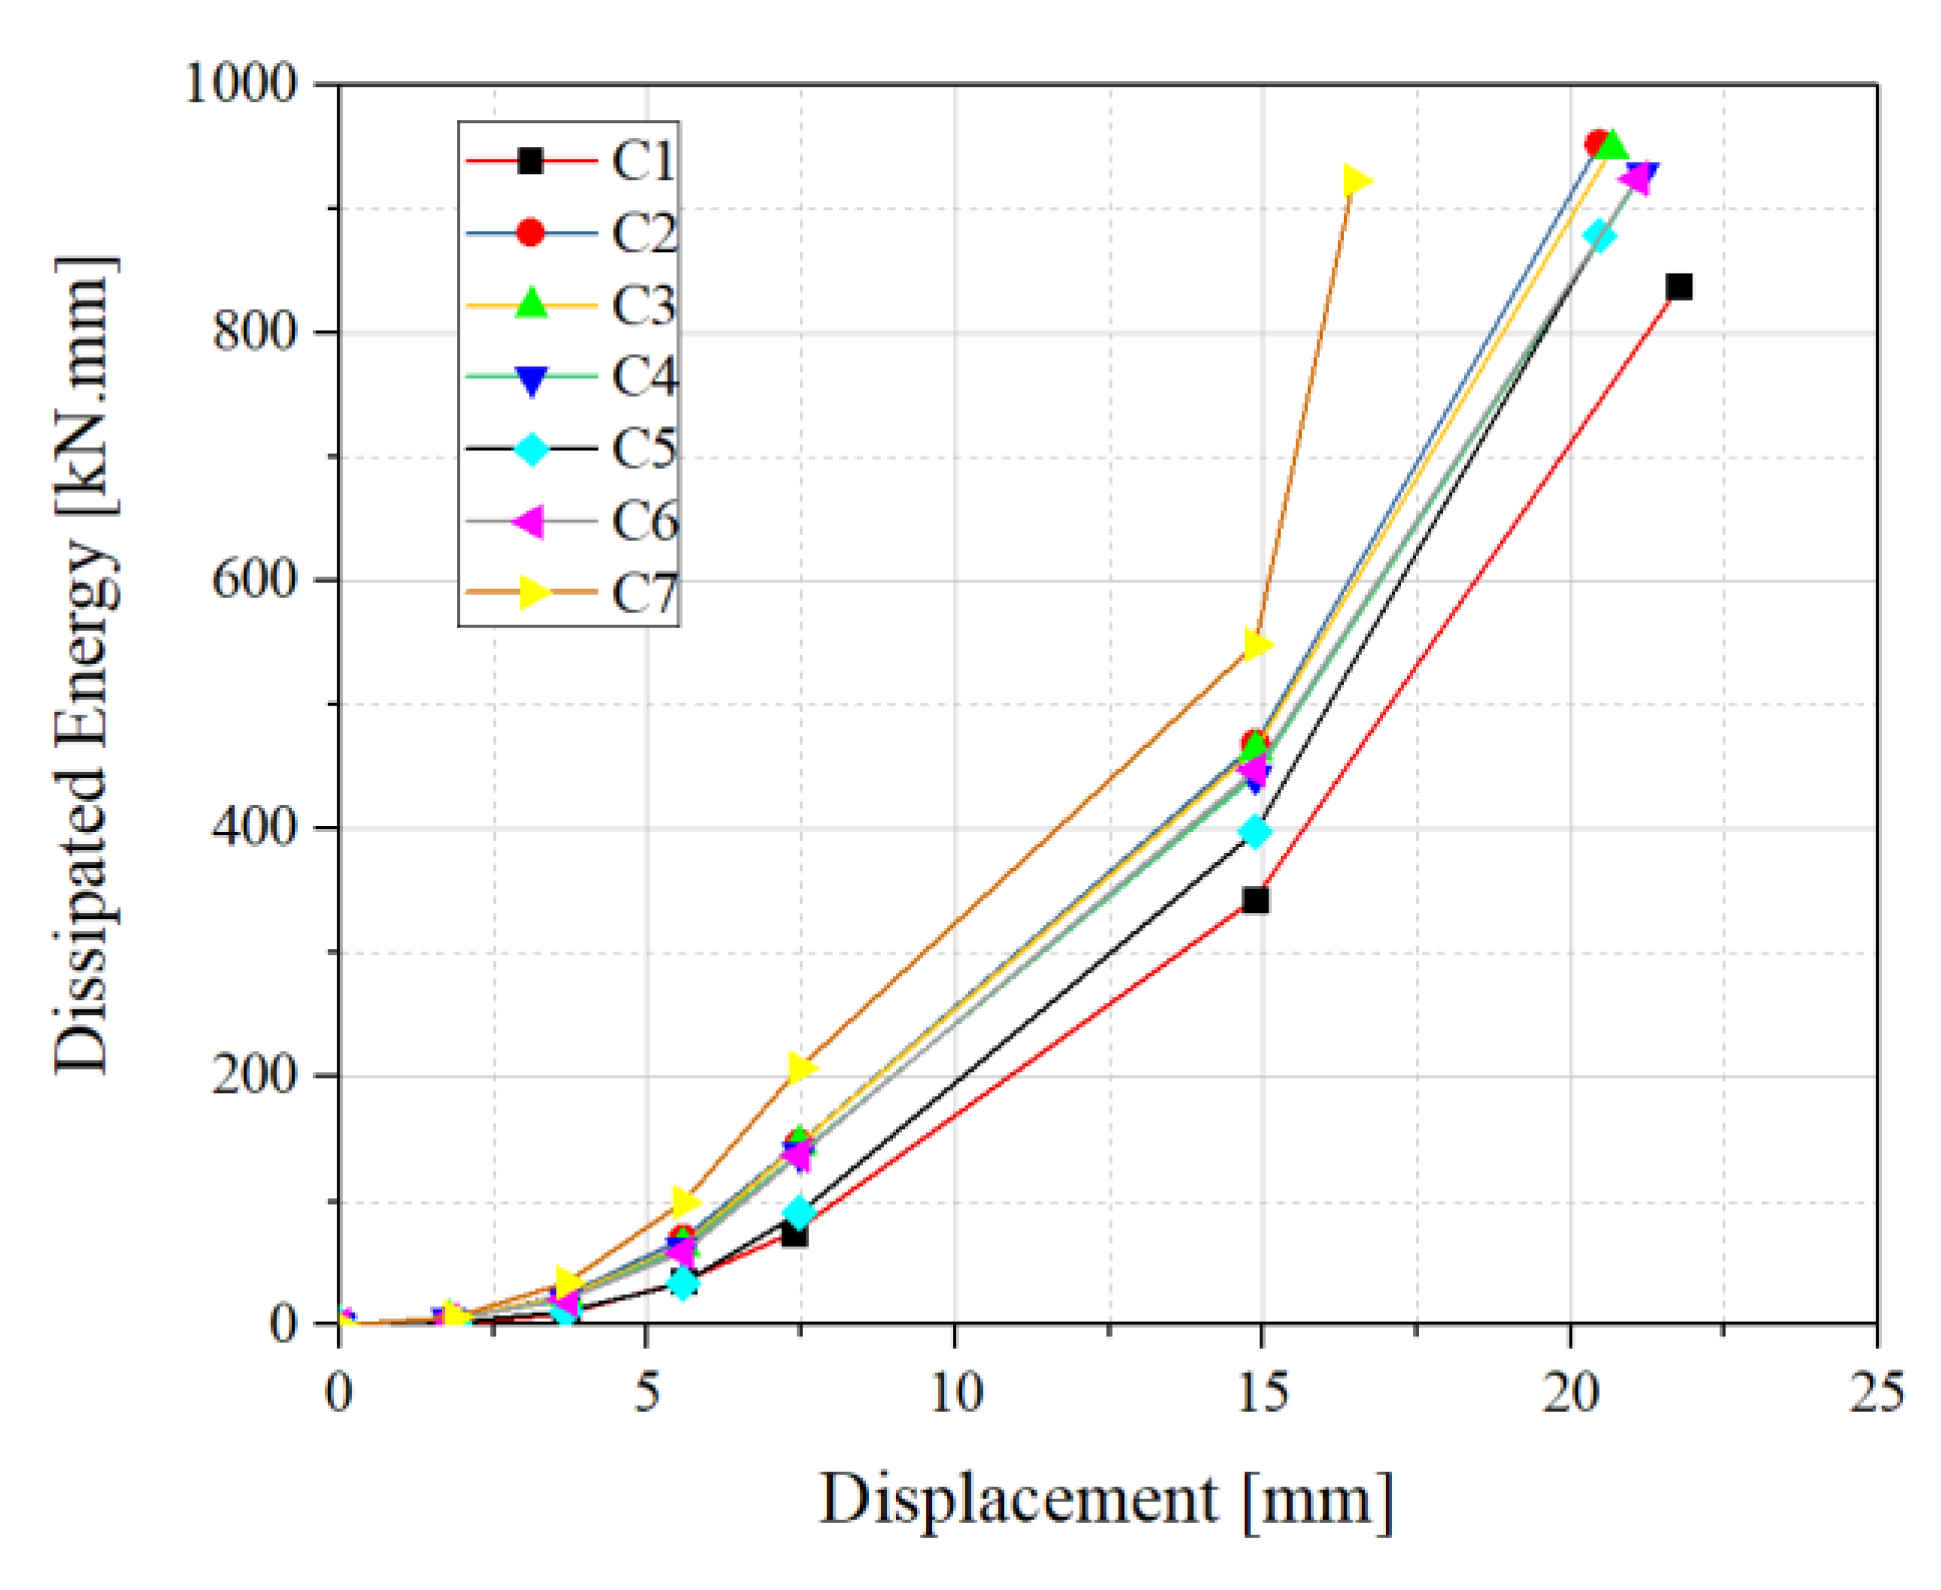
- Energy dissipation
- Impairment of strength
- Stiffness degradation
4. Conclusions
- Failure Modes and Structural Integrity
- Economic and Architectural Considerations
- Load-Displacement Characteristics
- Component Behavior
- Validation and Reliability
Author Contributions
Funding
Data Availability Statement
Acknowledgments
Conflicts of Interest
References
- Furtado, H. Rodrigues, A. Arêde, and H. Varum, “A review of the performance of infilled rc structures in recent earthquakes,” Appl. Sci., vol. 11, no. 13, p. 5889, 2021. [CrossRef]
- Ceccotti, “New technologies for construction of medium-rise buildings in seismic regions: The XLAM case,” Struct. Eng. Int. J. Int. Assoc. Bridg. Struct. Eng., vol. 18, no. 2, 2008. [CrossRef]
- M. Popovski and I. Gavric, “Performance of a 2-story CLT house subjected to lateral loads,” J. Struct. Eng., vol. 142, no. 4, p. E4015006, 2016. [CrossRef]
- Z. Mehdipour, E. Poletti, J. M. Branco, and P. B. Lourenço, “Numerical Analysis of Masonry-Infilled RC-CLT Panel Connections,” Buildings, vol. 12, no. 11, 2022, [Online]. Available: . [CrossRef]
- I. Lukacs, A. Björnfot, and R. Tomasi, “Strength and stiffness of cross-laminated timber (CLT) shear walls: State-of-the-art of analytical approaches,” Eng. Struct., vol. 178, 2019. [CrossRef]
- F. Stazi, M. Serpilli, G. Maracchini, and A. Pavone, “An experimental and numerical study on CLT panels used as infill shear walls for RC buildings retrofit,” Constr. Build. Mater., vol. 211, pp. 605–616, 2019. [CrossRef]
- S. Tesfamariam, J. Madheswaran, and K. Goda, “Displacement-Based Design of Hybrid RC–Timber Structure: Seismic Risk Assessment,” J. Struct. Eng., vol. 145, no. 11, p. 4019125, 2019. [CrossRef]
- I. Šušteršič, “Utrjevanje stavb s križno lepljenimi lesenimi ploščami: doktorska disertacija.,” Univerze v Ljubljani, 2017.
- A. Aloisio, F. Boggian, and R. Tomasi, “Design of a novel seismic retrofitting system for RC structures based on asymmetric friction connections and CLT panels,” Eng. Struct., vol. 254, 2022. [CrossRef]
- Gavric, M. Fragiacomo, and A. Ceccotti, “Cyclic Behavior of CLT Wall Systems: Experimental Tests and Analytical Prediction Models,” J. Struct. Eng., vol. 141, no. 11, 2015. [CrossRef]
- D. Casagrande, A. Polastri, T. Sartori, C. Loss, and M. Chiodega, “Experimental campaign for the mechanical characterization of connection systems in the seismic design of timber buildings,” 2016.
- J. Schneider, E. Karacabeyli, M. Popovski, S. F. Stiemer, and S. Tesfamariam, “Damage Assessment of Connections Used in Cross-Laminated Timber Subject to Cyclic Loads,” J. Perform. Constr. Facil., vol. 28, no. 6, 2014. [CrossRef]
- M. A. Parisi and M. Piazza, “Mechanics of Plain and Retrofitted Traditional Timber Connections,” J. Struct. Eng., vol. 126, no. 12, 2000. [CrossRef]
- G. D’Arenzo, W. Seim, and M. Fossetti, “Experimental characterization of a biaxial behaviour connector for CLT wall-to-floor connections under different load directions,” Constr. Build. Mater., vol. 295, 2021. [CrossRef]
- M. Popovski, J. Schneider, and M. Schweinsteiger, “Lateral load resistance of cross-laminated wood panels,” in 11th World Conference on Timber Engineering 2010, WCTE 2010, 2010, vol. 4, pp. 3394–3403.
- R. Tomasi and I. Smith, “Experimental Characterization of Monotonic and Cyclic Loading Responses of CLT Panel-To-Foundation Angle Bracket Connections,” J. Mater. Civ. Eng., vol. 27, no. 6, 2015. [CrossRef]
- M. Latour and G. Rizzano, “Seismic behavior of cross-laminated timber panel buildings equipped with traditional and innovative connectors,” Arch. Civ. Mech. Eng., vol. 17, no. 2, 2017. [CrossRef]
- L. Pozza, B. Ferracuti, M. Massari, and M. Savoia, “Axial – Shear interaction on CLT hold-down connections – Experimental investigation,” Eng. Struct., vol. 160, 2018. [CrossRef]
- J. Liu and F. Lam, “Experimental test of cross laminated timber connections under bi-directional loading,” 2016.
- T. M. Laggner, G. Flatscher, and G. Schickhofer, “Combined loading of self-tapping screws,” 2016.
- A. Polastri, I. Giongo, A. Angeli, and R. Brandner, “Mechanical characterization of a pre-fabricated connection system for cross laminated timber structures in seismic regions,” Eng. Struct., vol. 167, 2018. [CrossRef]
- W. Y. Loo, P. Quenneville, and N. Chouw, “A new type of symmetric slip-friction connector,” J. Constr. Steel Res., vol. 94, 2014. [CrossRef]
- A. Kramer, A. R. Barbosa, and A. Sinha, “Performance of Steel Energy Dissipators Connected to Cross-Laminated Timber Wall Panels Subjected to Tension and Cyclic Loading,” J. Struct. Eng., vol. 142, no. 4, 2016. [CrossRef]
- F. Sarti, A. Palermo, and S. Pampanin, “Fuse-Type External Replaceable Dissipaters: Experimental Program and Numerical Modeling,” J. Struct. Eng., vol. 142, no. 12, 2016. [CrossRef]
- A. Hashemi, P. Zarnani, R. Masoudnia, and P. Quenneville, “Seismic resistant rocking coupled walls with innovative Resilient Slip Friction (RSF) joints,” J. Constr. Steel Res., vol. 129, 2017. [CrossRef]
- F. Smiroldo, I. Paviani, I. Giongo, S. Zanon, R. Albatici, and M. Piazza, “An integrated approach to improve seismic and energetic behaviour of rc framed buildings using timber panels,” Sustain., vol. 13, no. 20, 2021. [CrossRef]
- F. Boggian, C. Tardo, A. Aloisio, E. M. Marino, and R. Tomasi, “Experimental Cyclic Response of a Novel Friction Connection for Seismic Retrofitting of RC Buildings with CLT Panels,” J. Struct. Eng., vol. 148, no. 5, 2022. [CrossRef]
- Standard, “Eurocode 3—Design of steel structures—,” BS EN, vol. 1, no. 1, p. 2005, 1993.
- EN-10025:, “EN10025: 2 (2005)—Hot rolled products of structural steels,” 2005.
- BSI, “BS EN 26891:1991. Timber Structures - Joints Made With Mechanical Fasteners - General Principles For The Determination Of Strength And Deformation Characteristics",” Bsi, 1991.
- EN 12512:2001. Timber structures - Test methods - Cyclic testing of joints made with mechanical fasteners.
- EN 1998-3:2005 - Eurocode 8: Design of structures for earthquake resistance - Part 3: Assessment and retrofitting of buildings. European Committee for Standardization.
- Sigrist, D. Casagrande, and M. Piazza, “Revision of testing standards to determine the seismic capacity of timber connections according to Eurocode 8,” 2021.
- Casagrande et al., “A methodology to determine the seismic low-cycle fatigue strength of timber connections,” Constr. Build. Mater., vol. 231, 2020. [CrossRef]


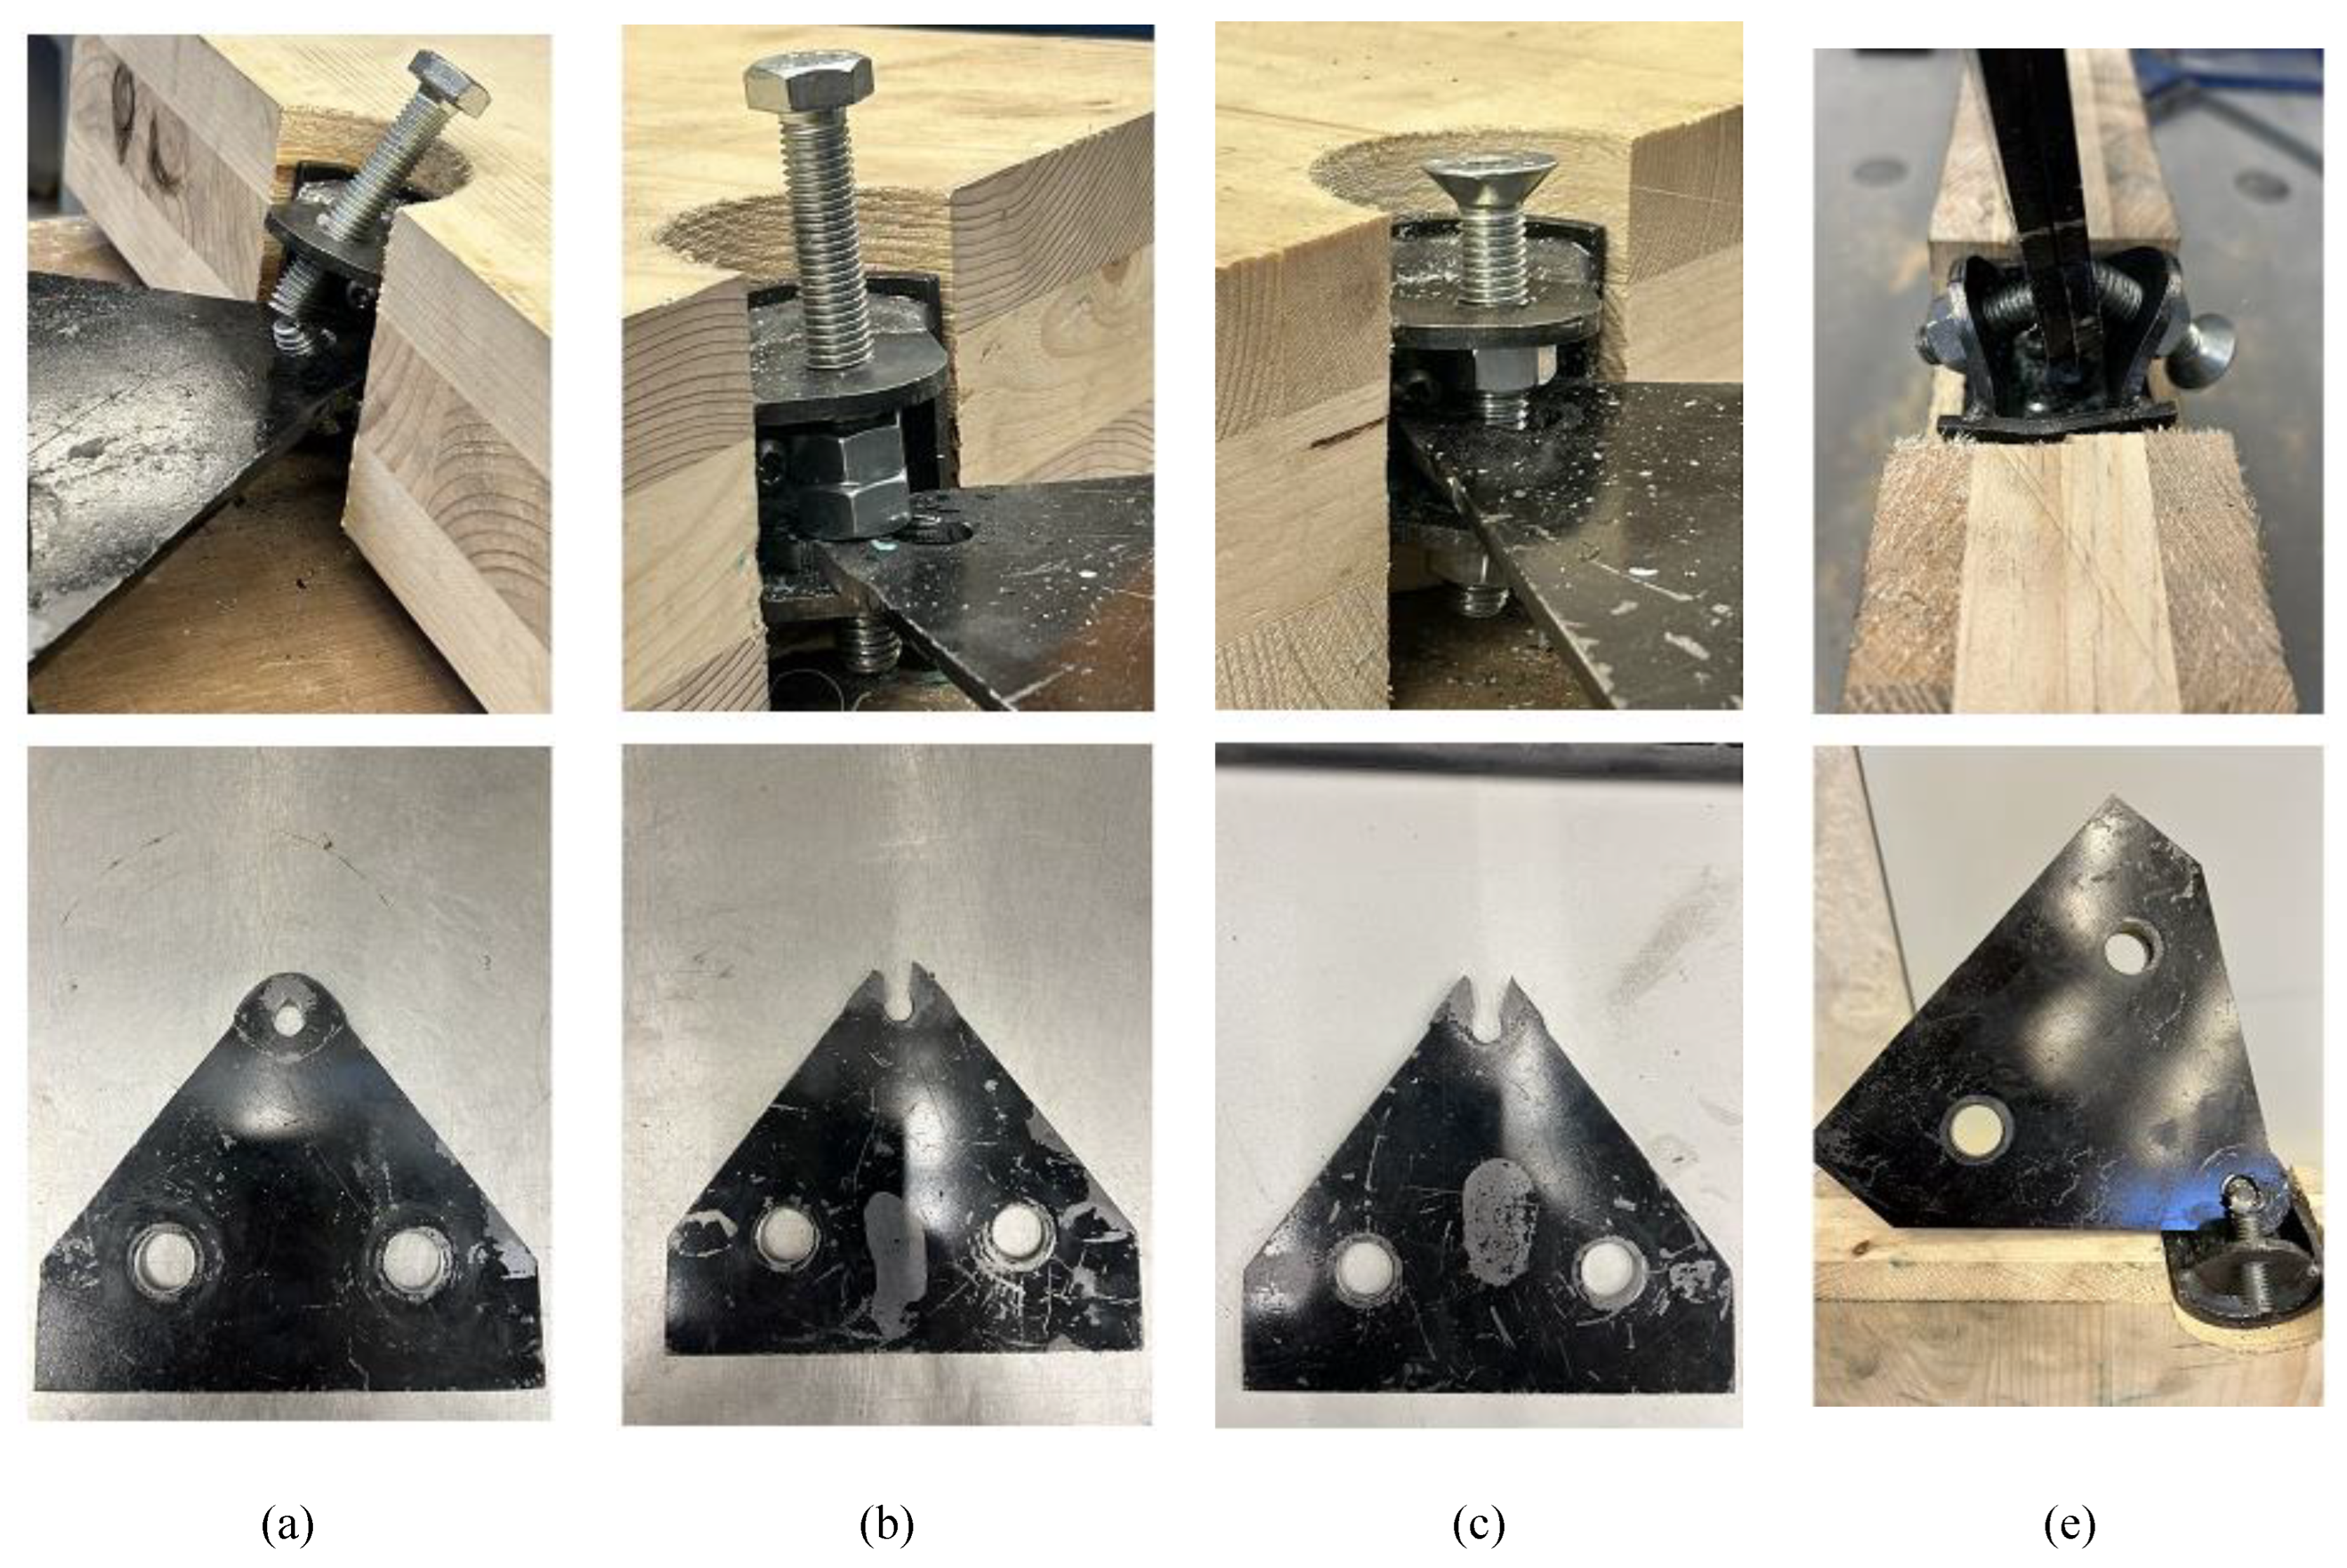
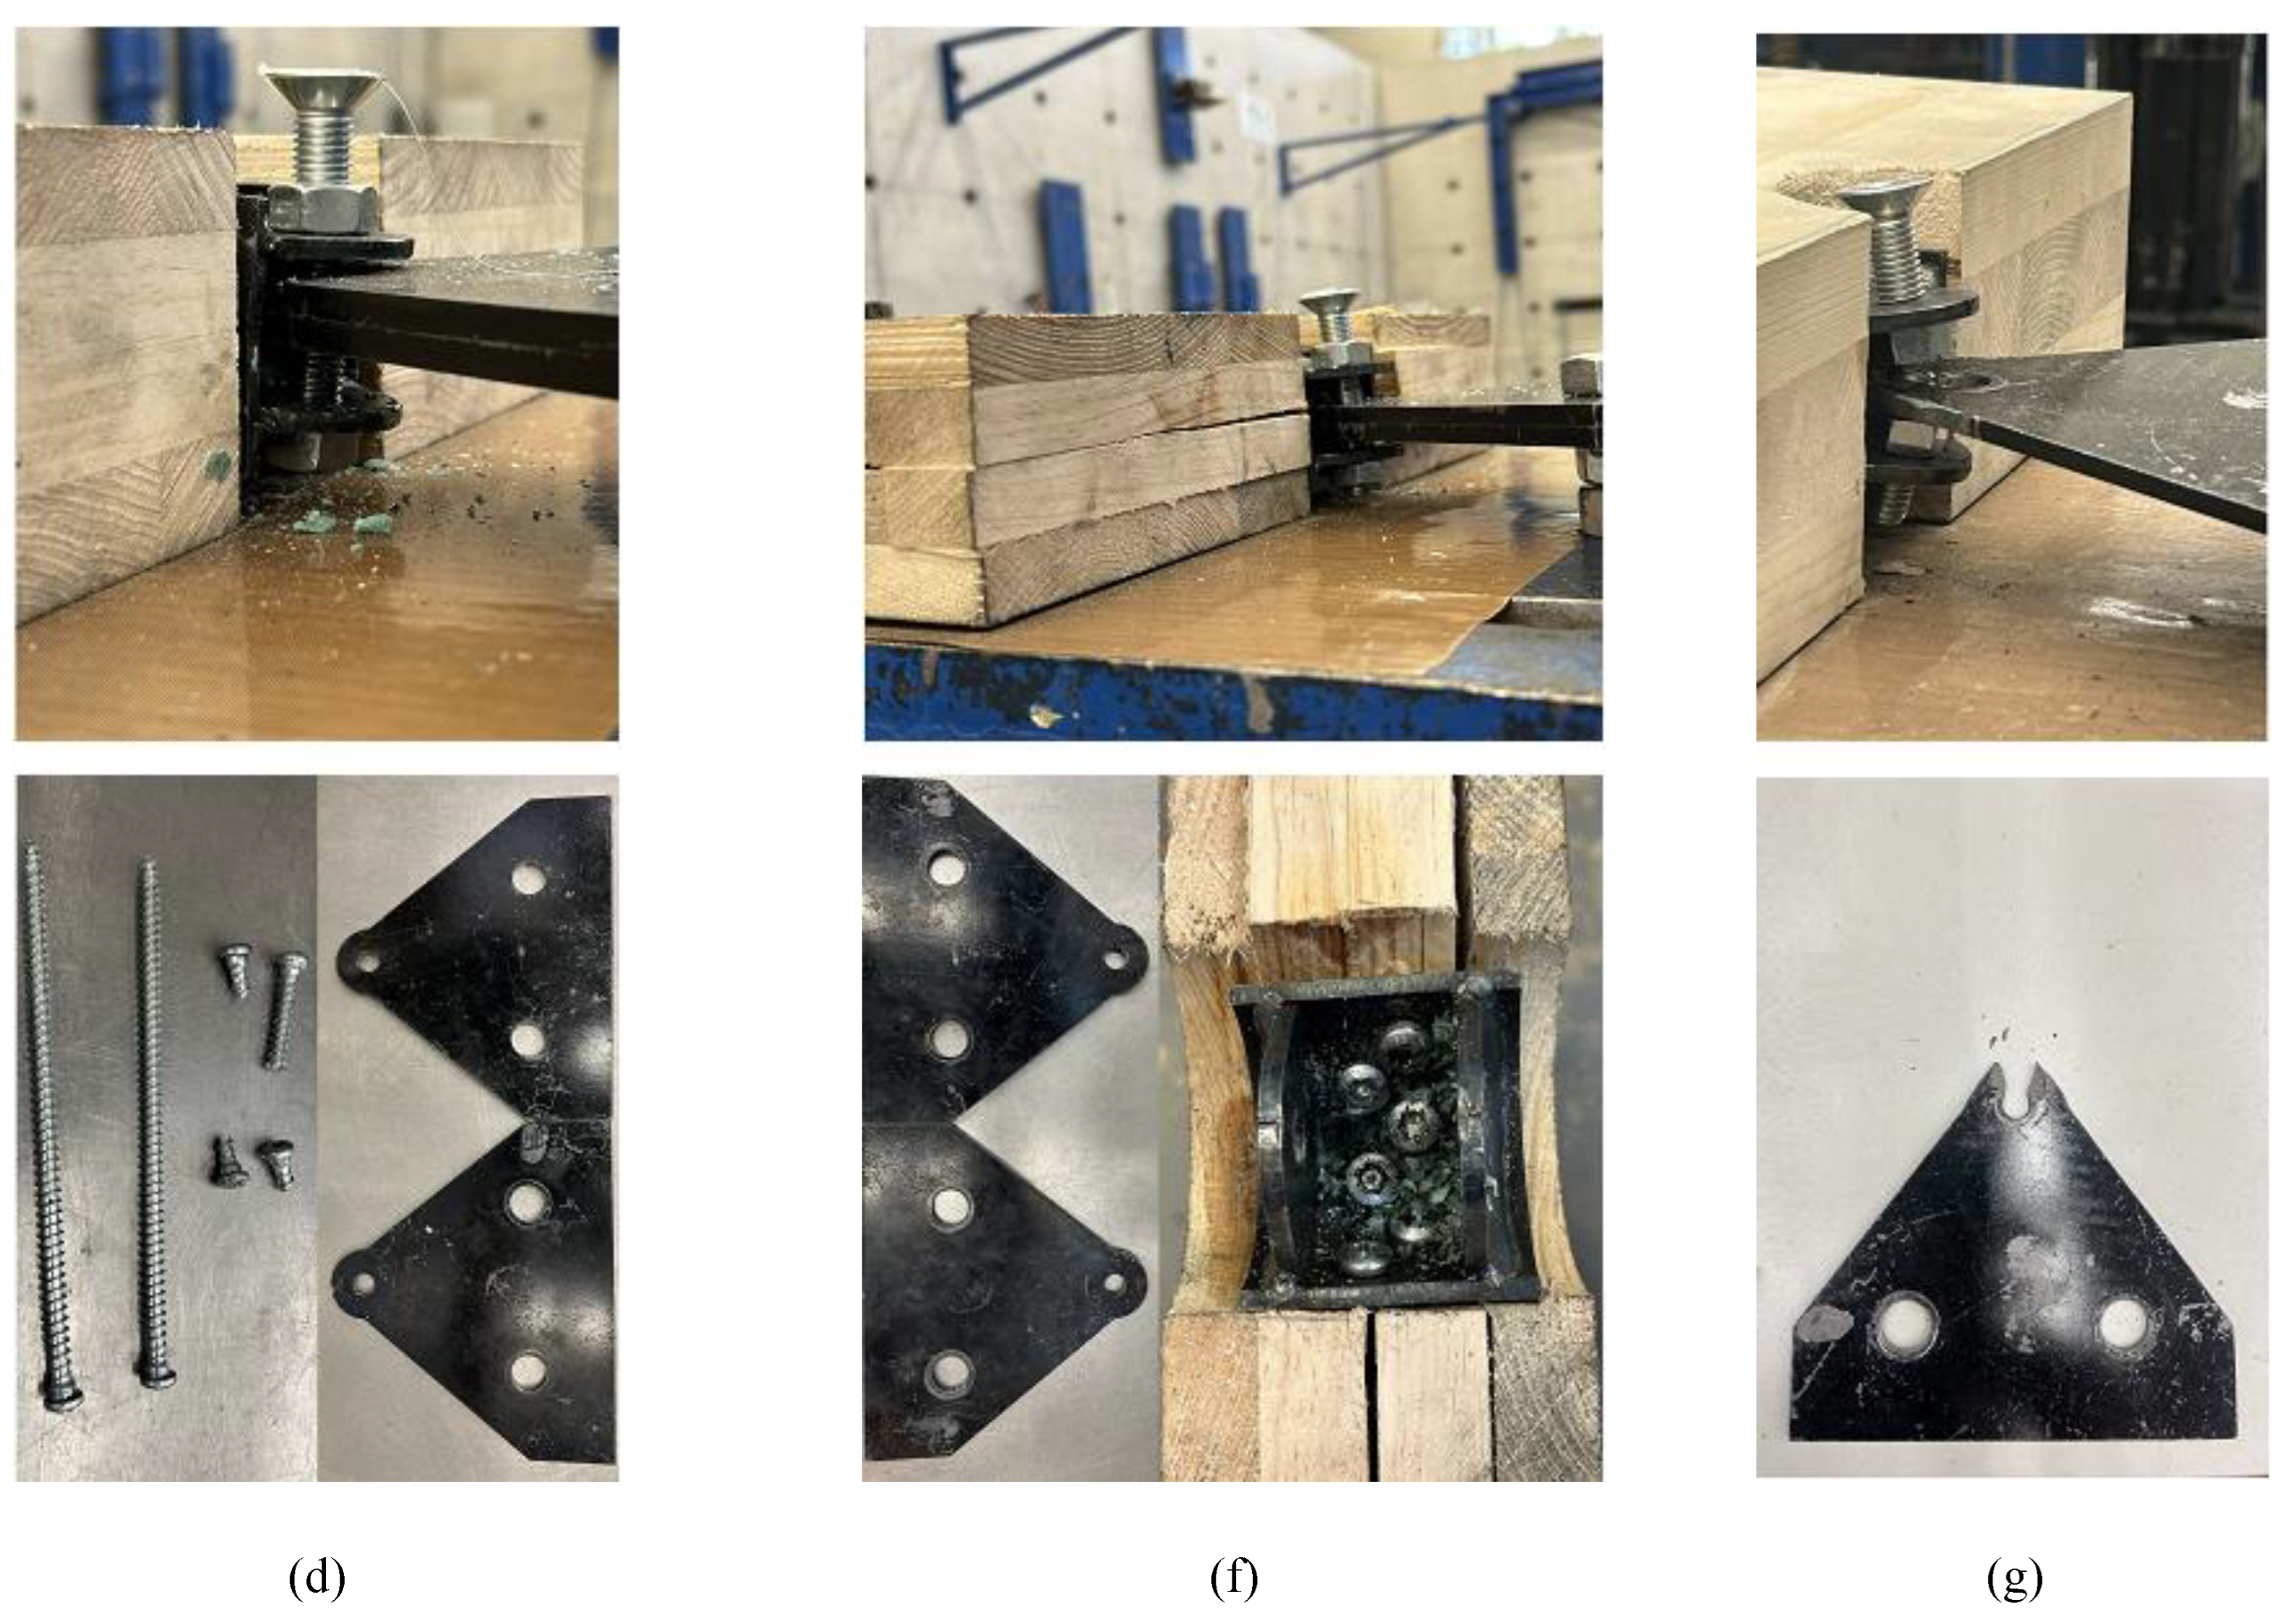
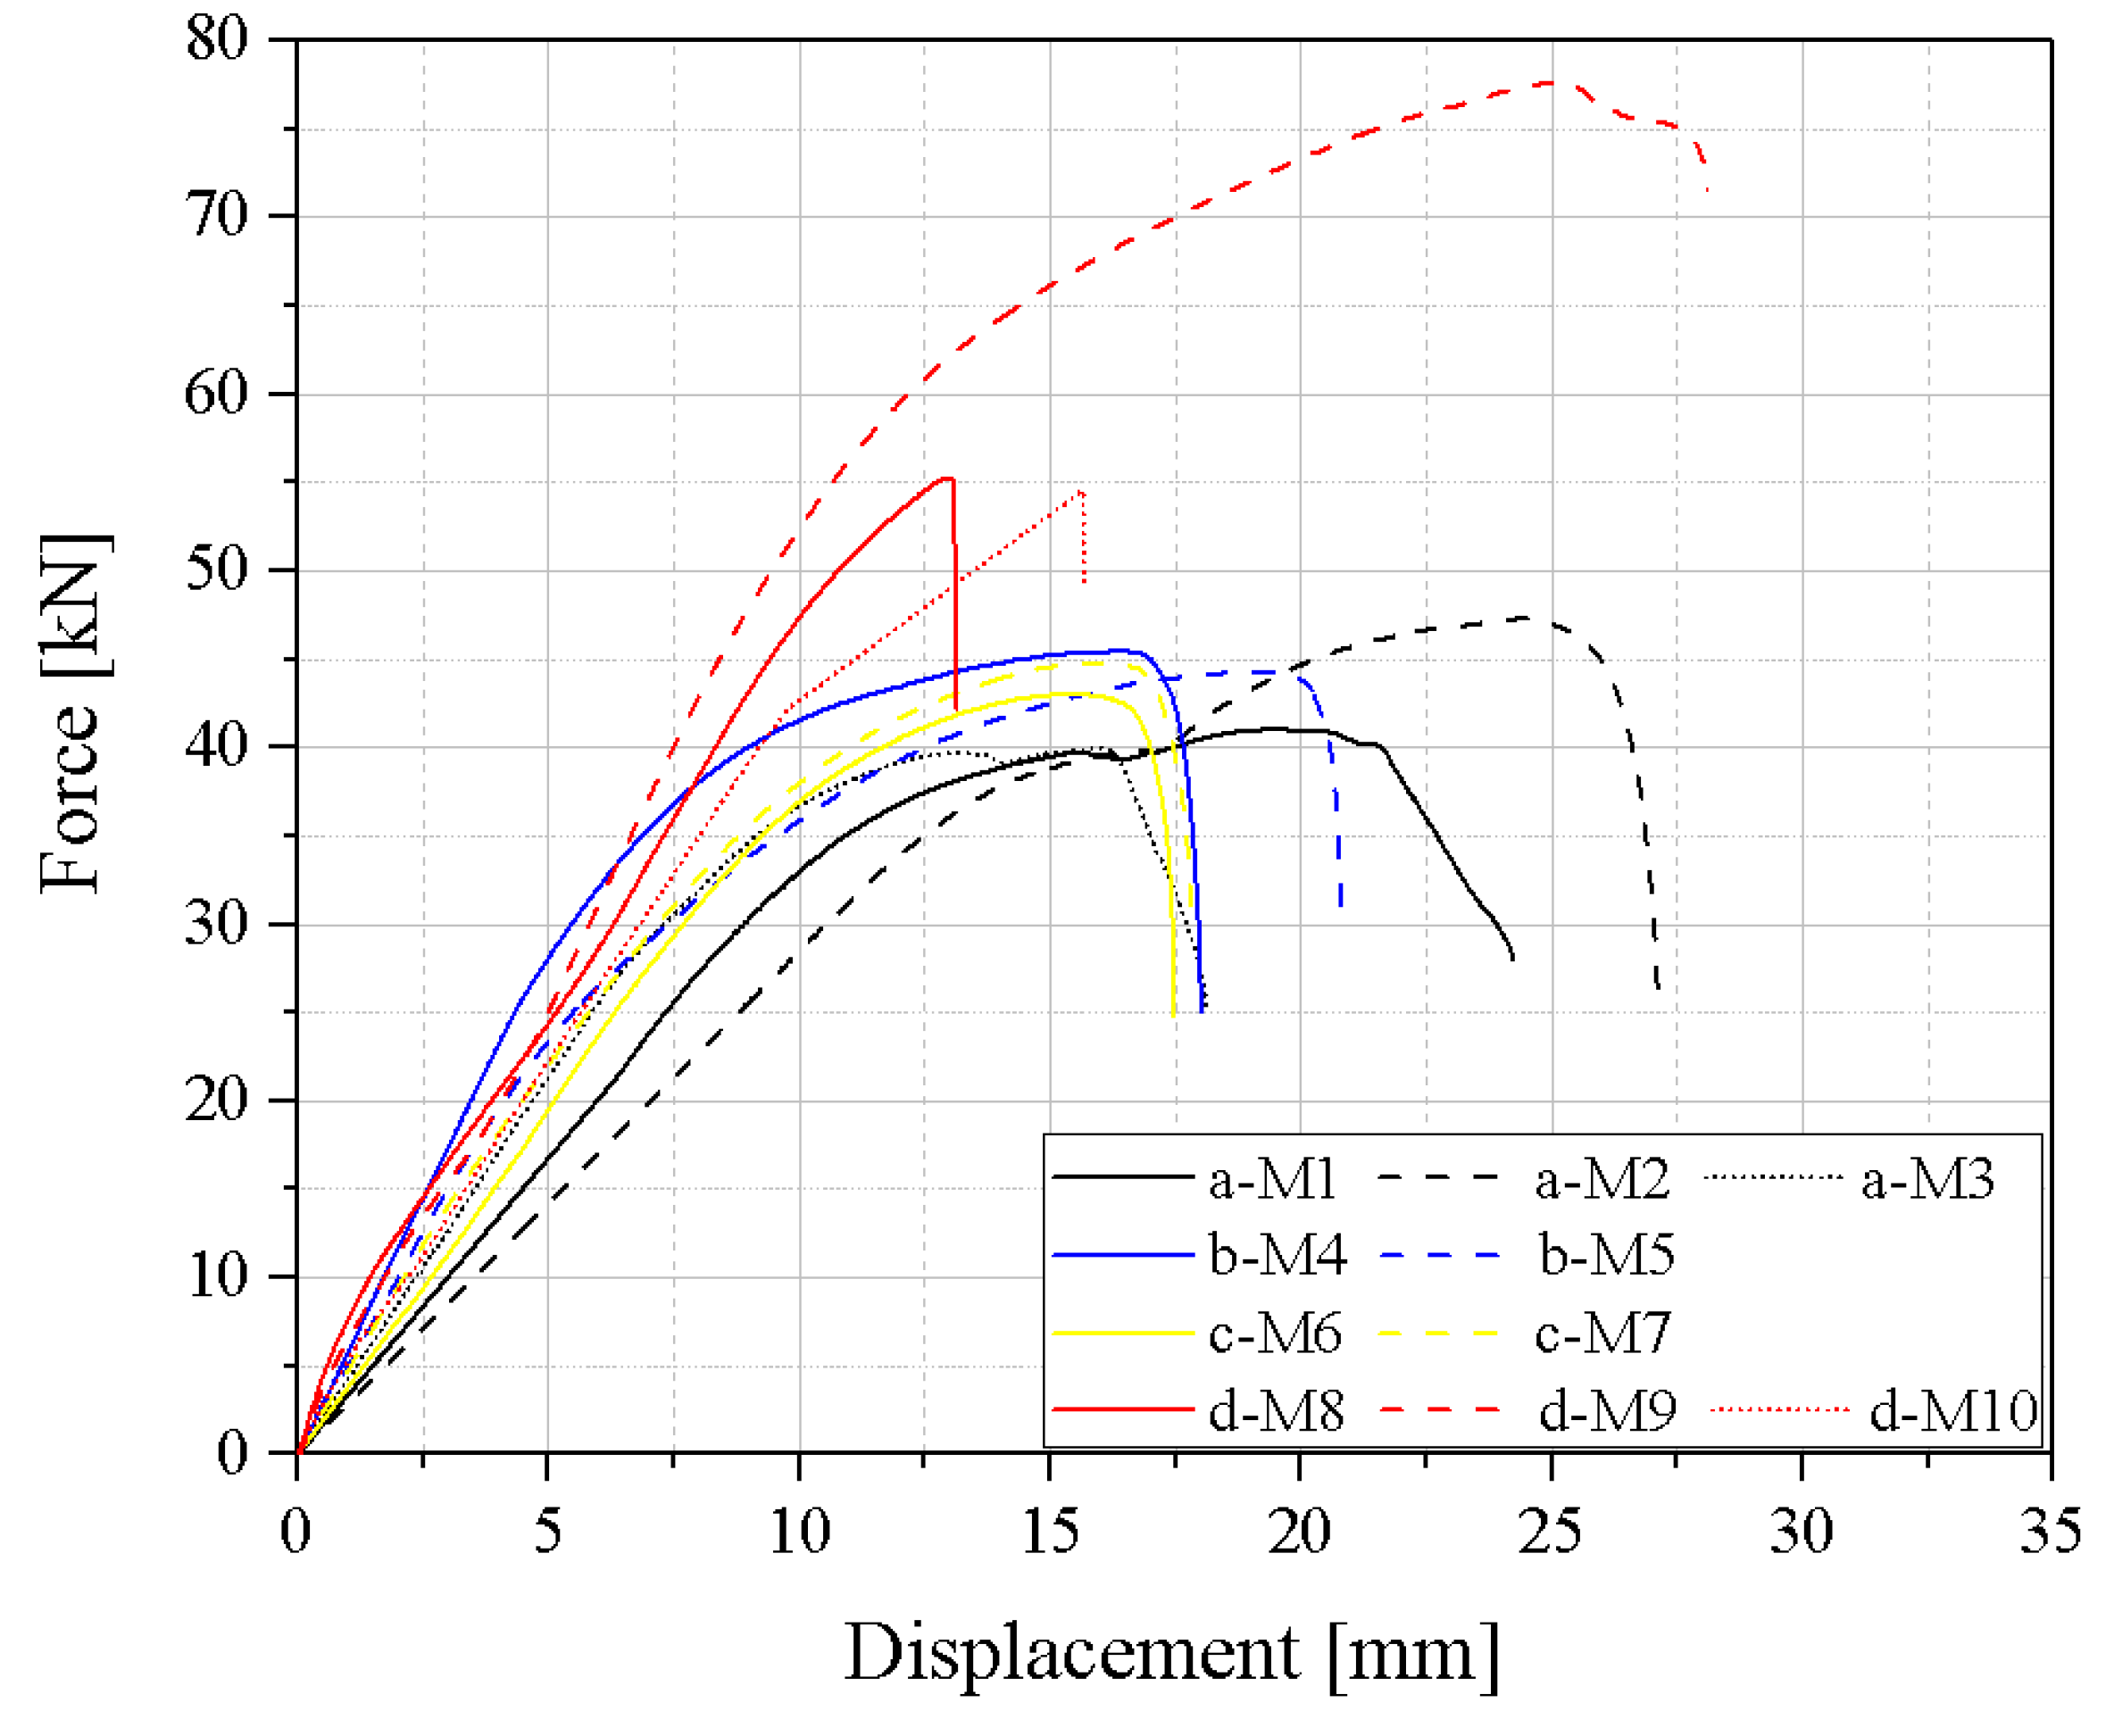
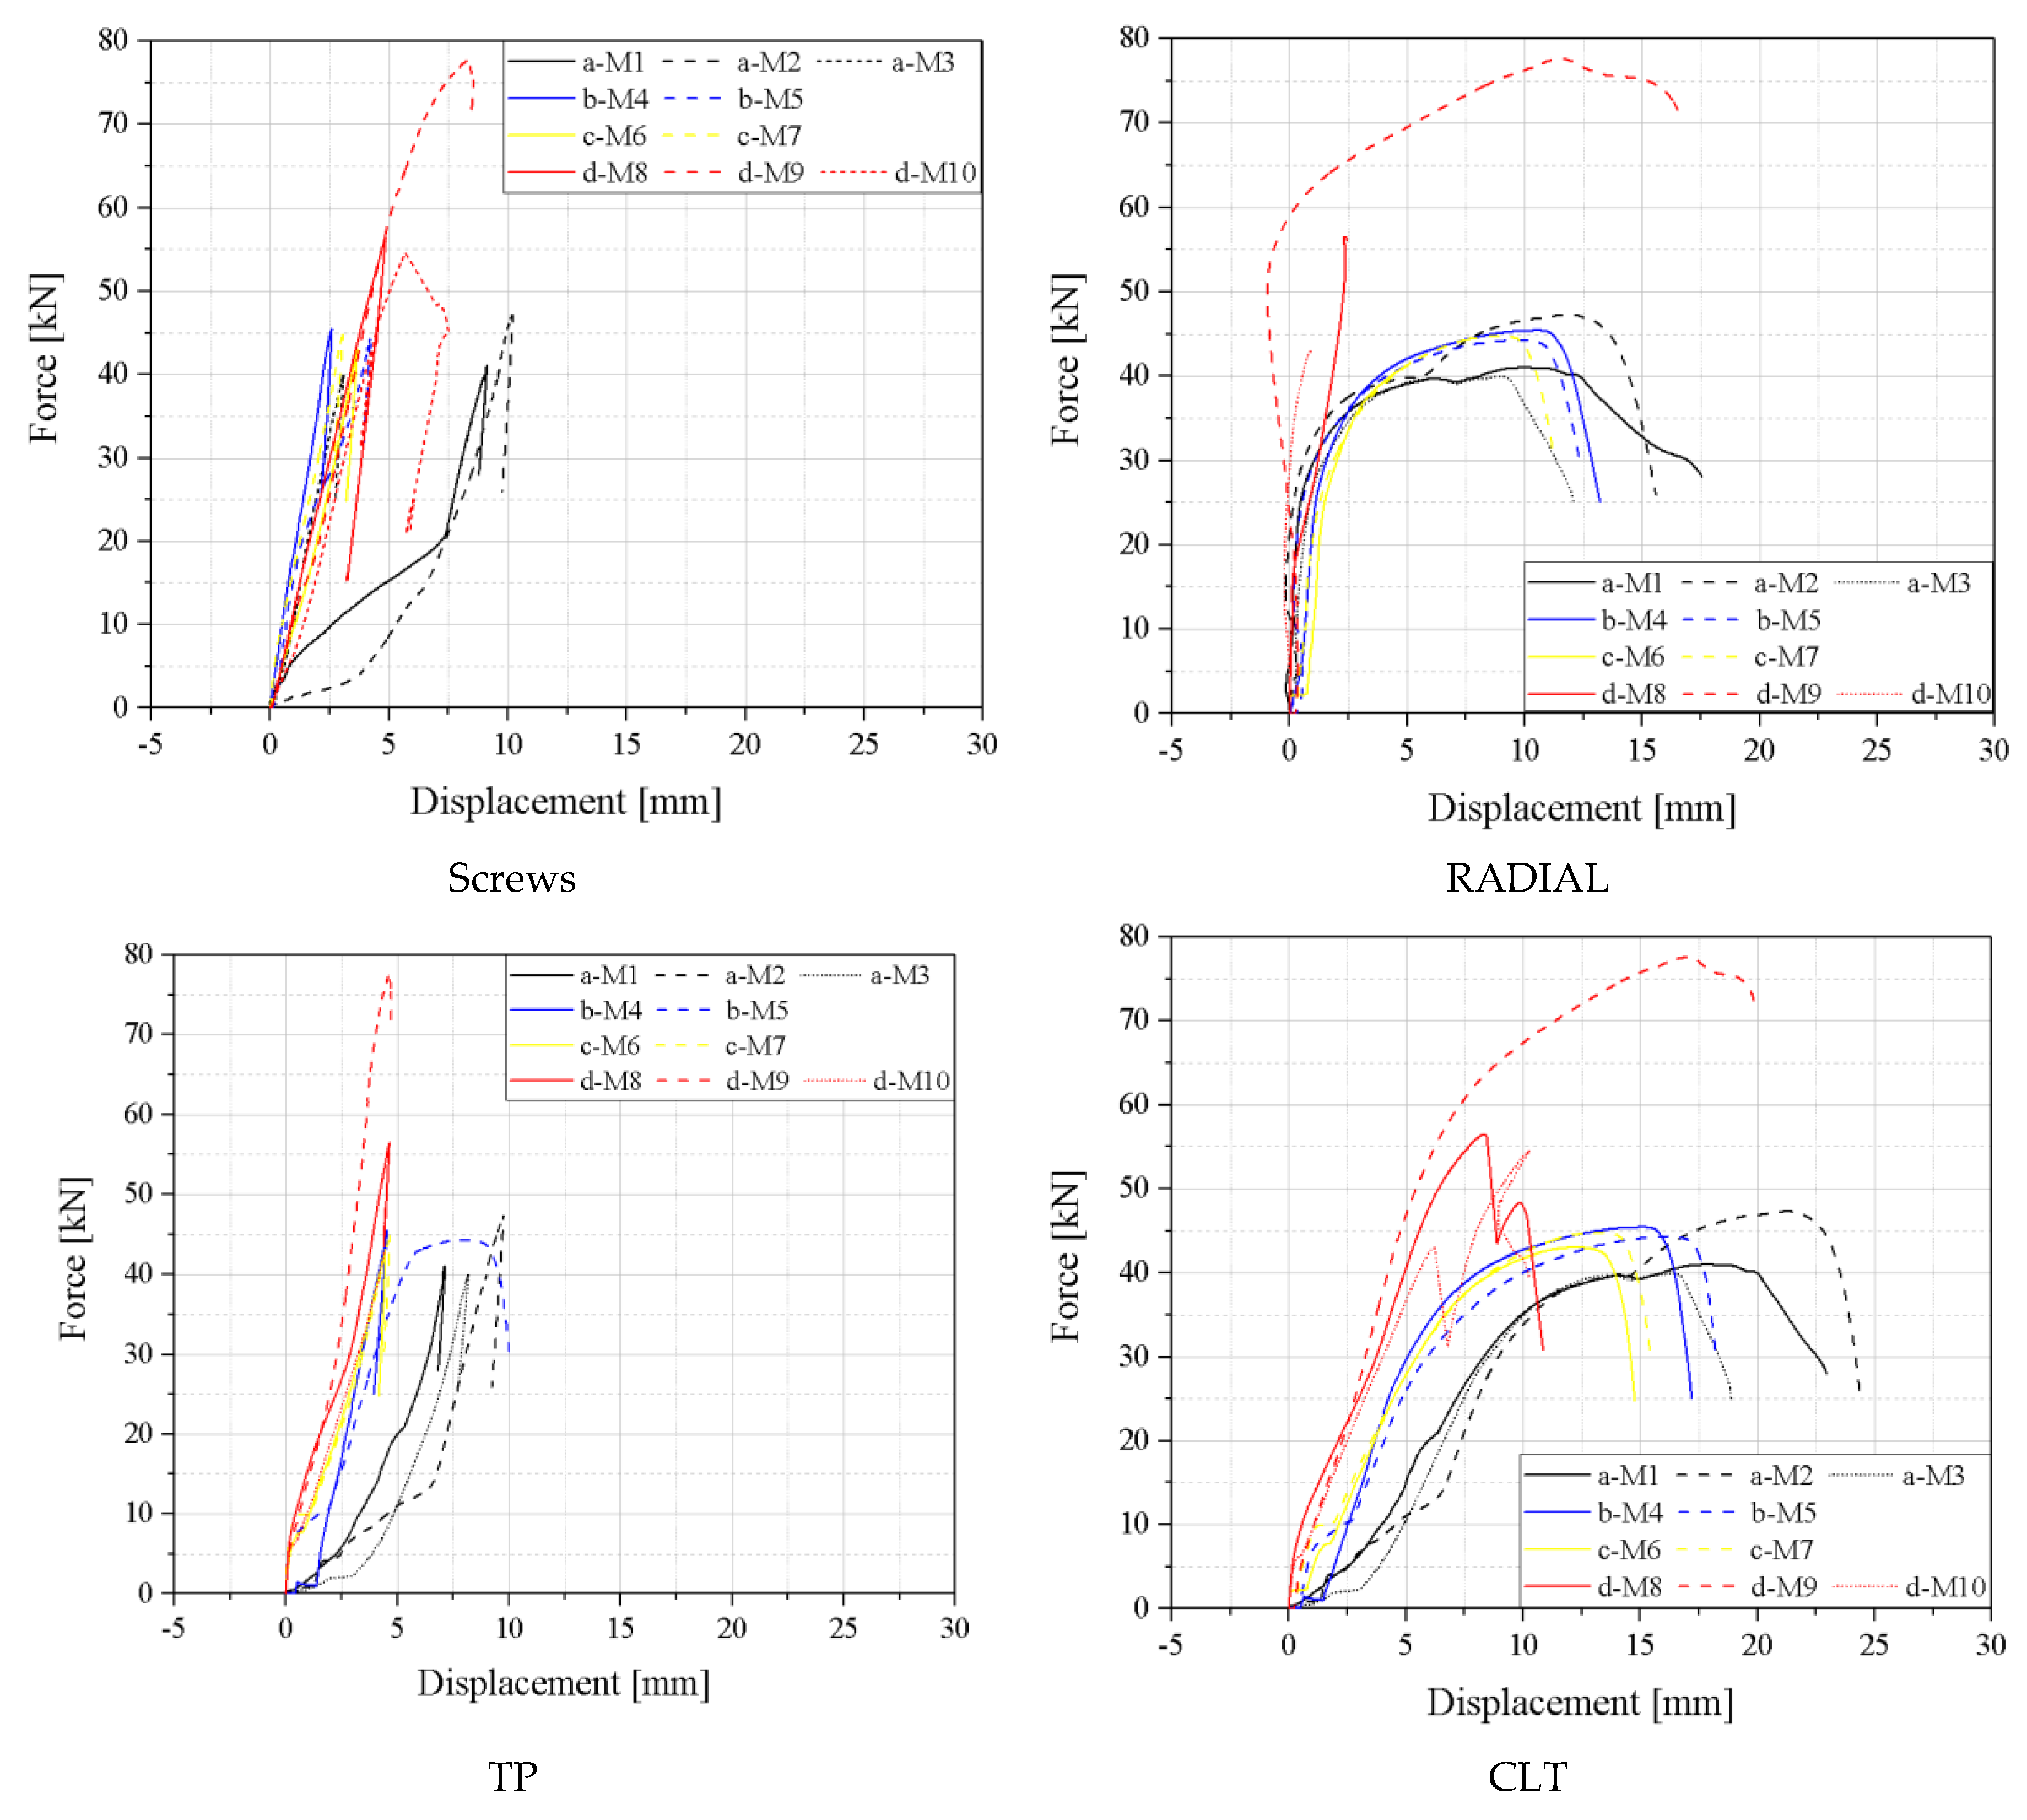
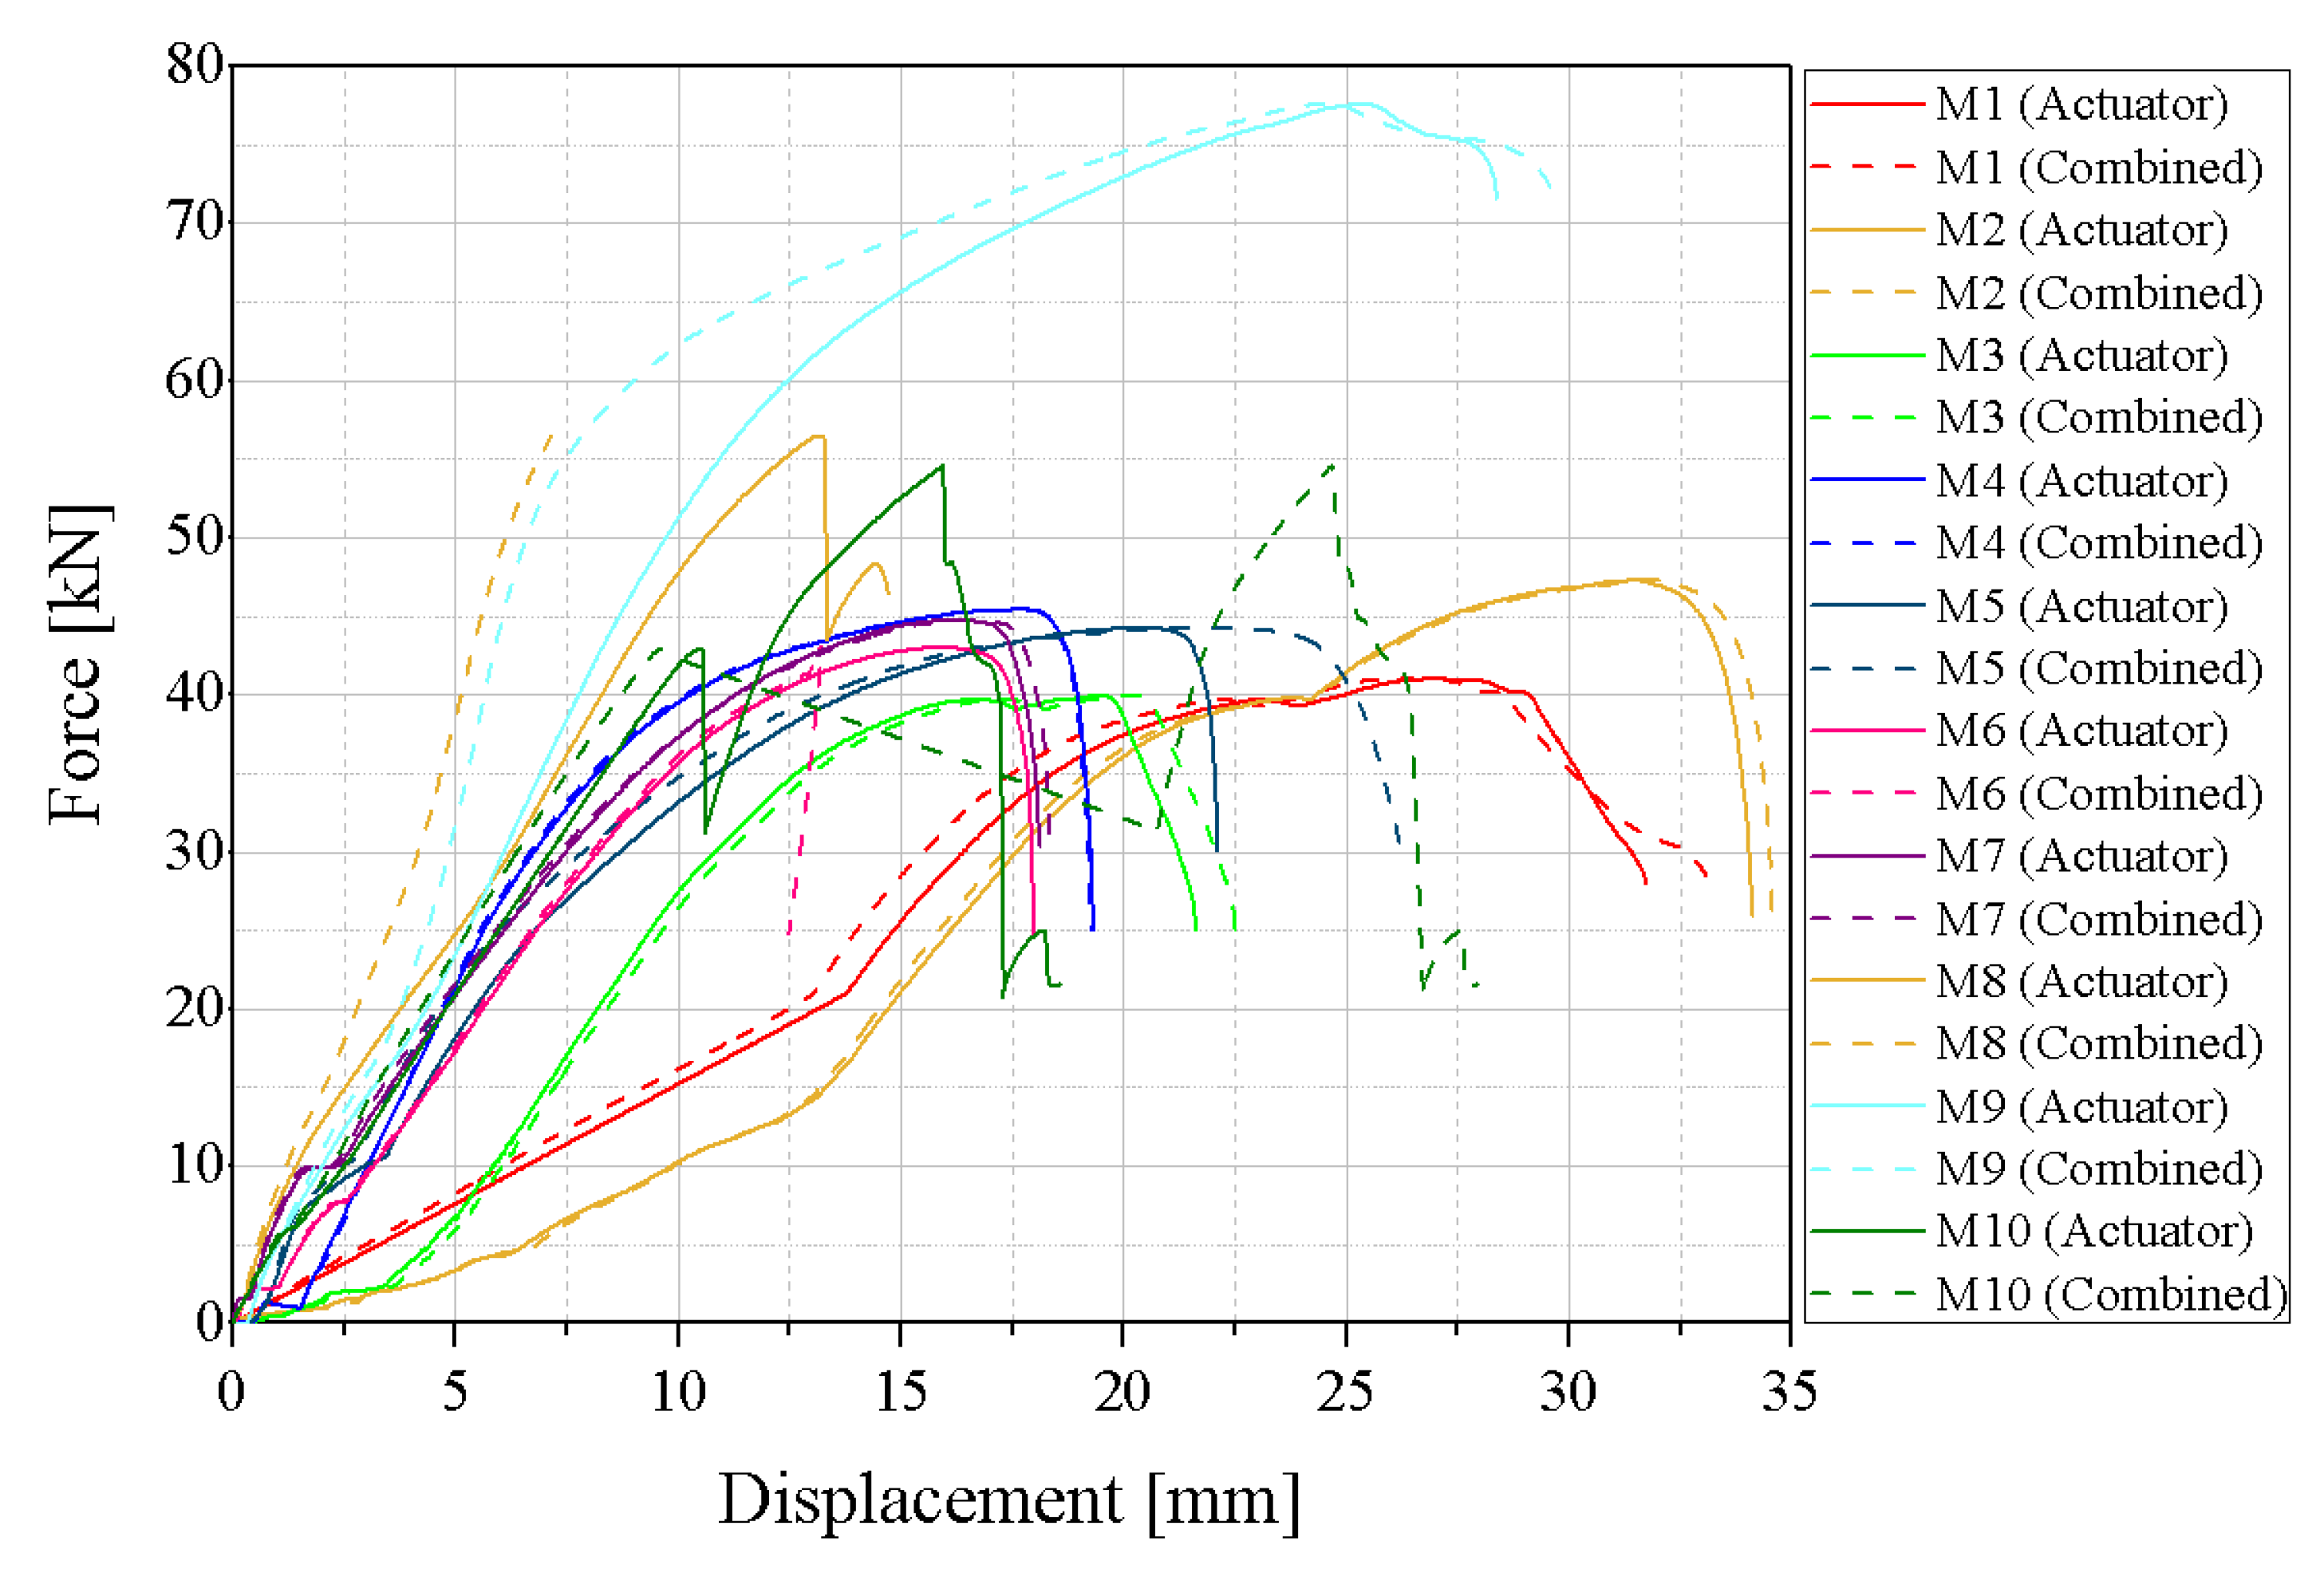
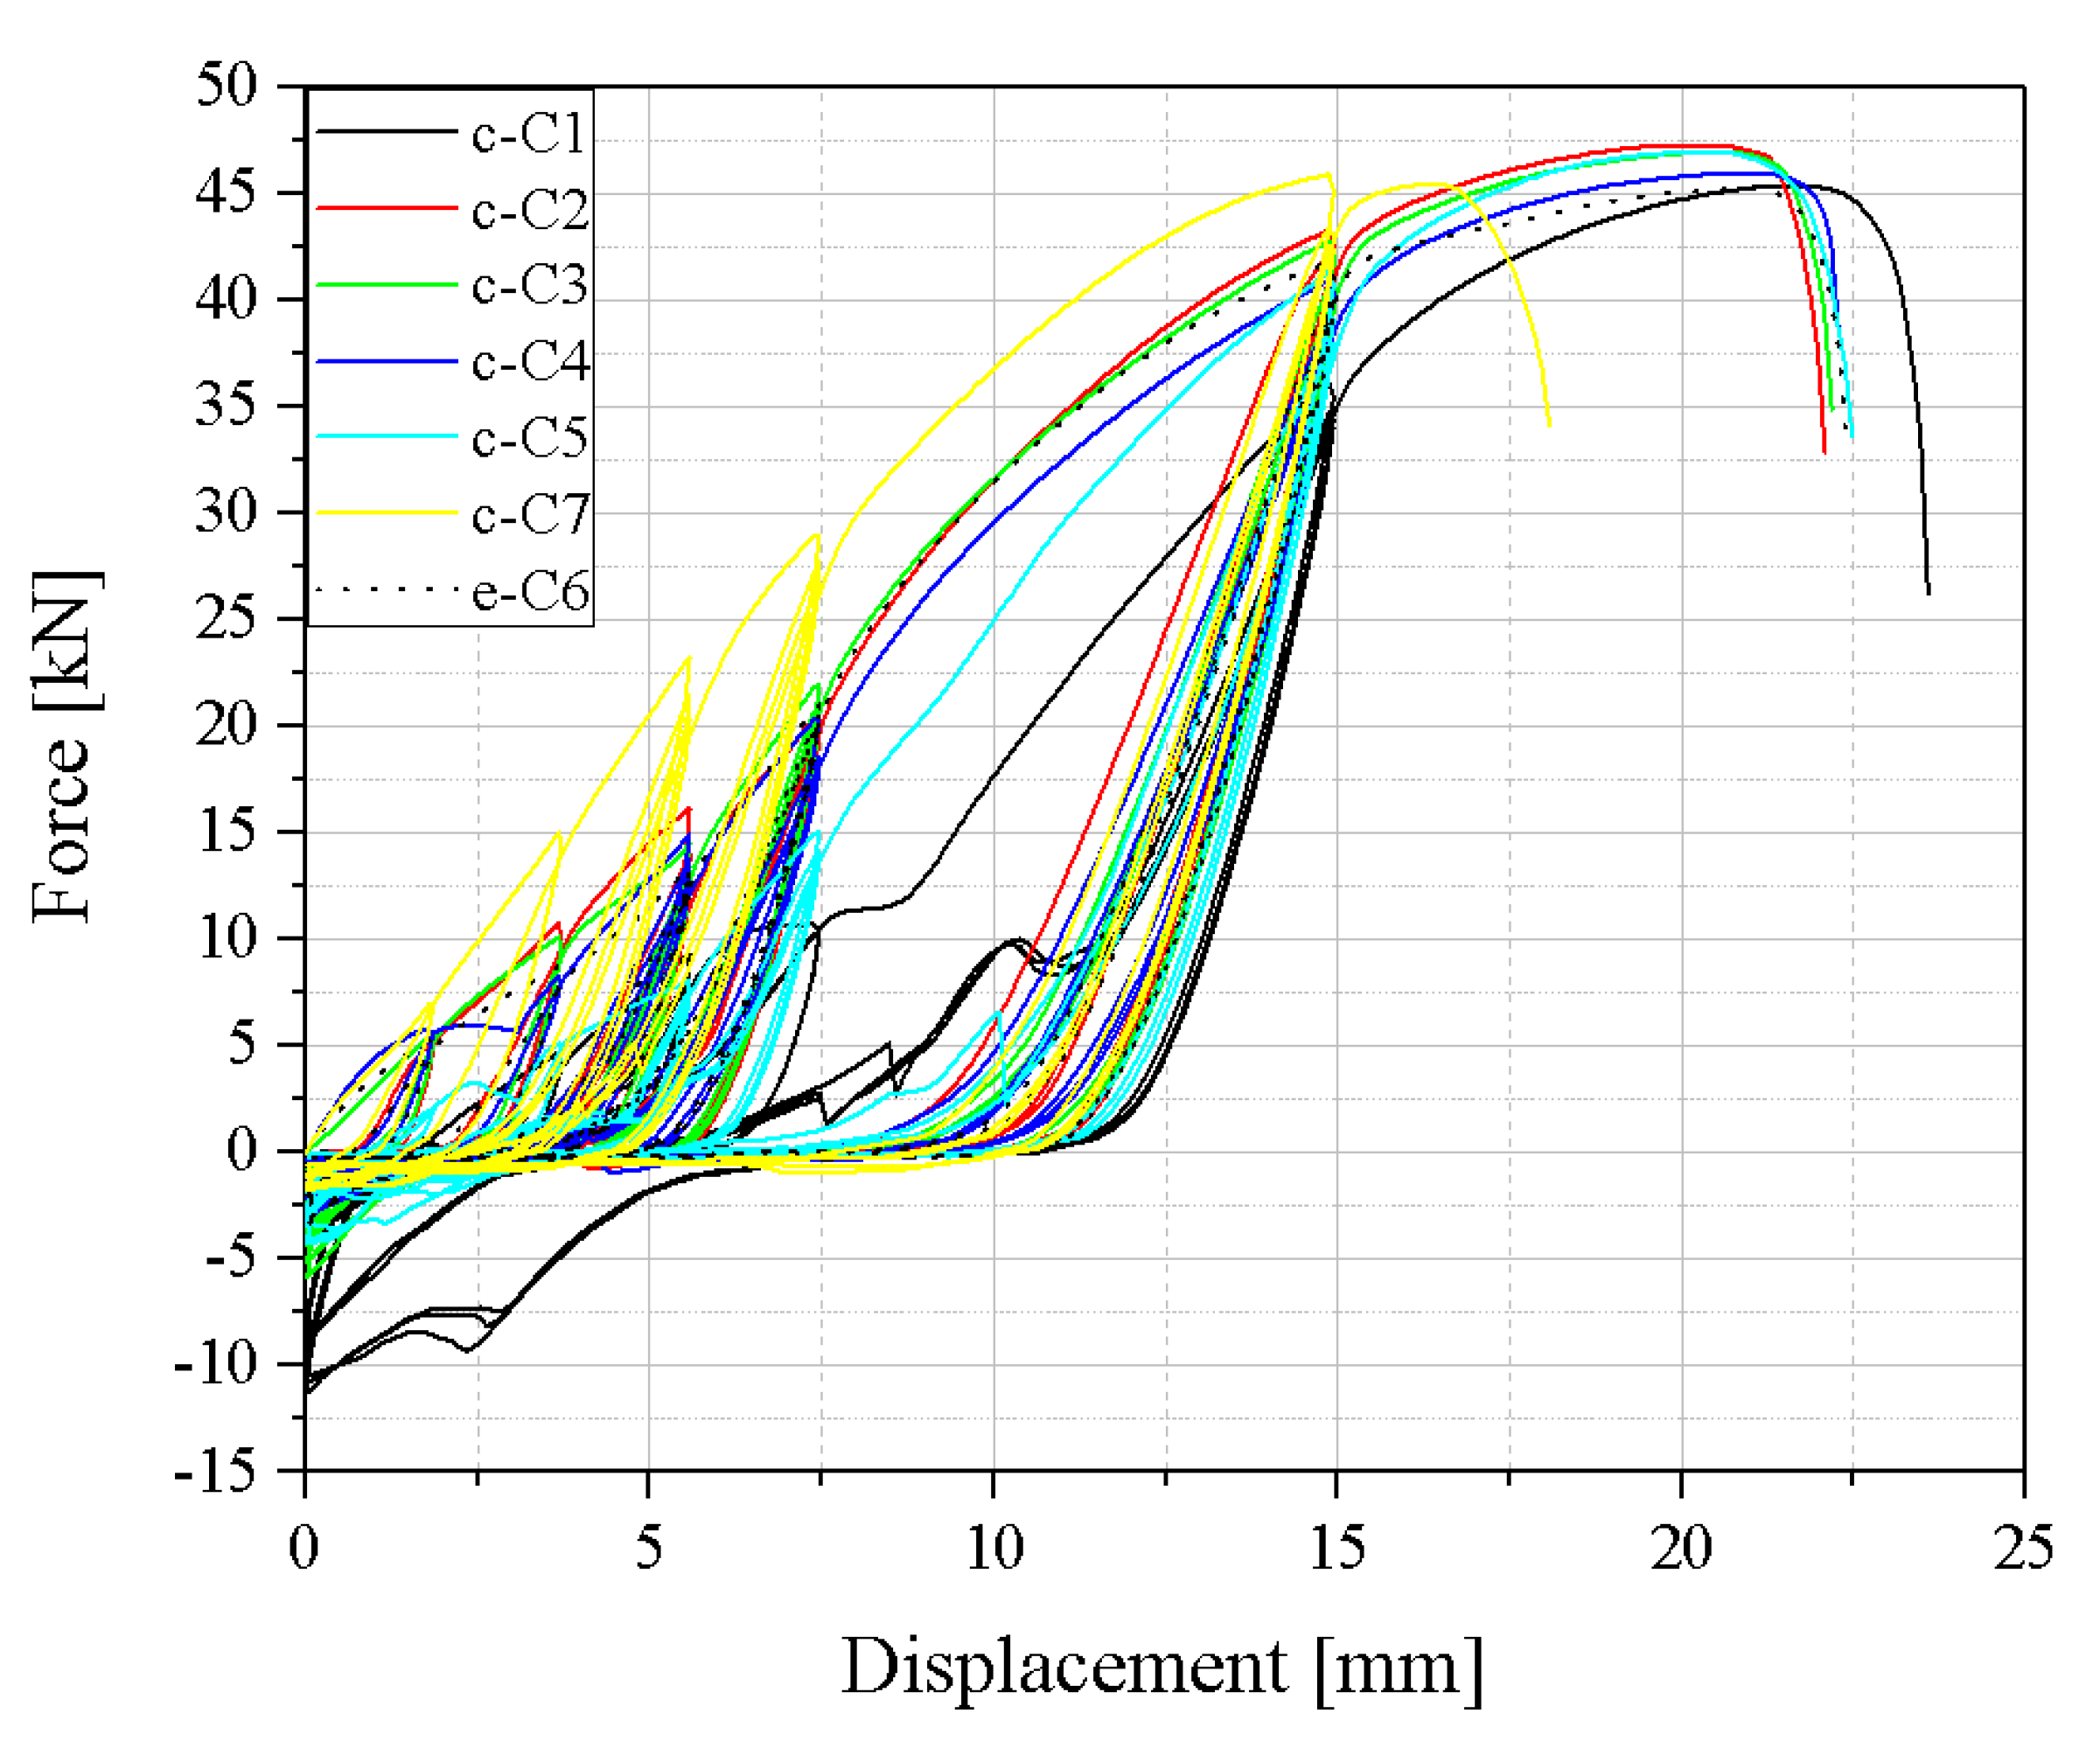
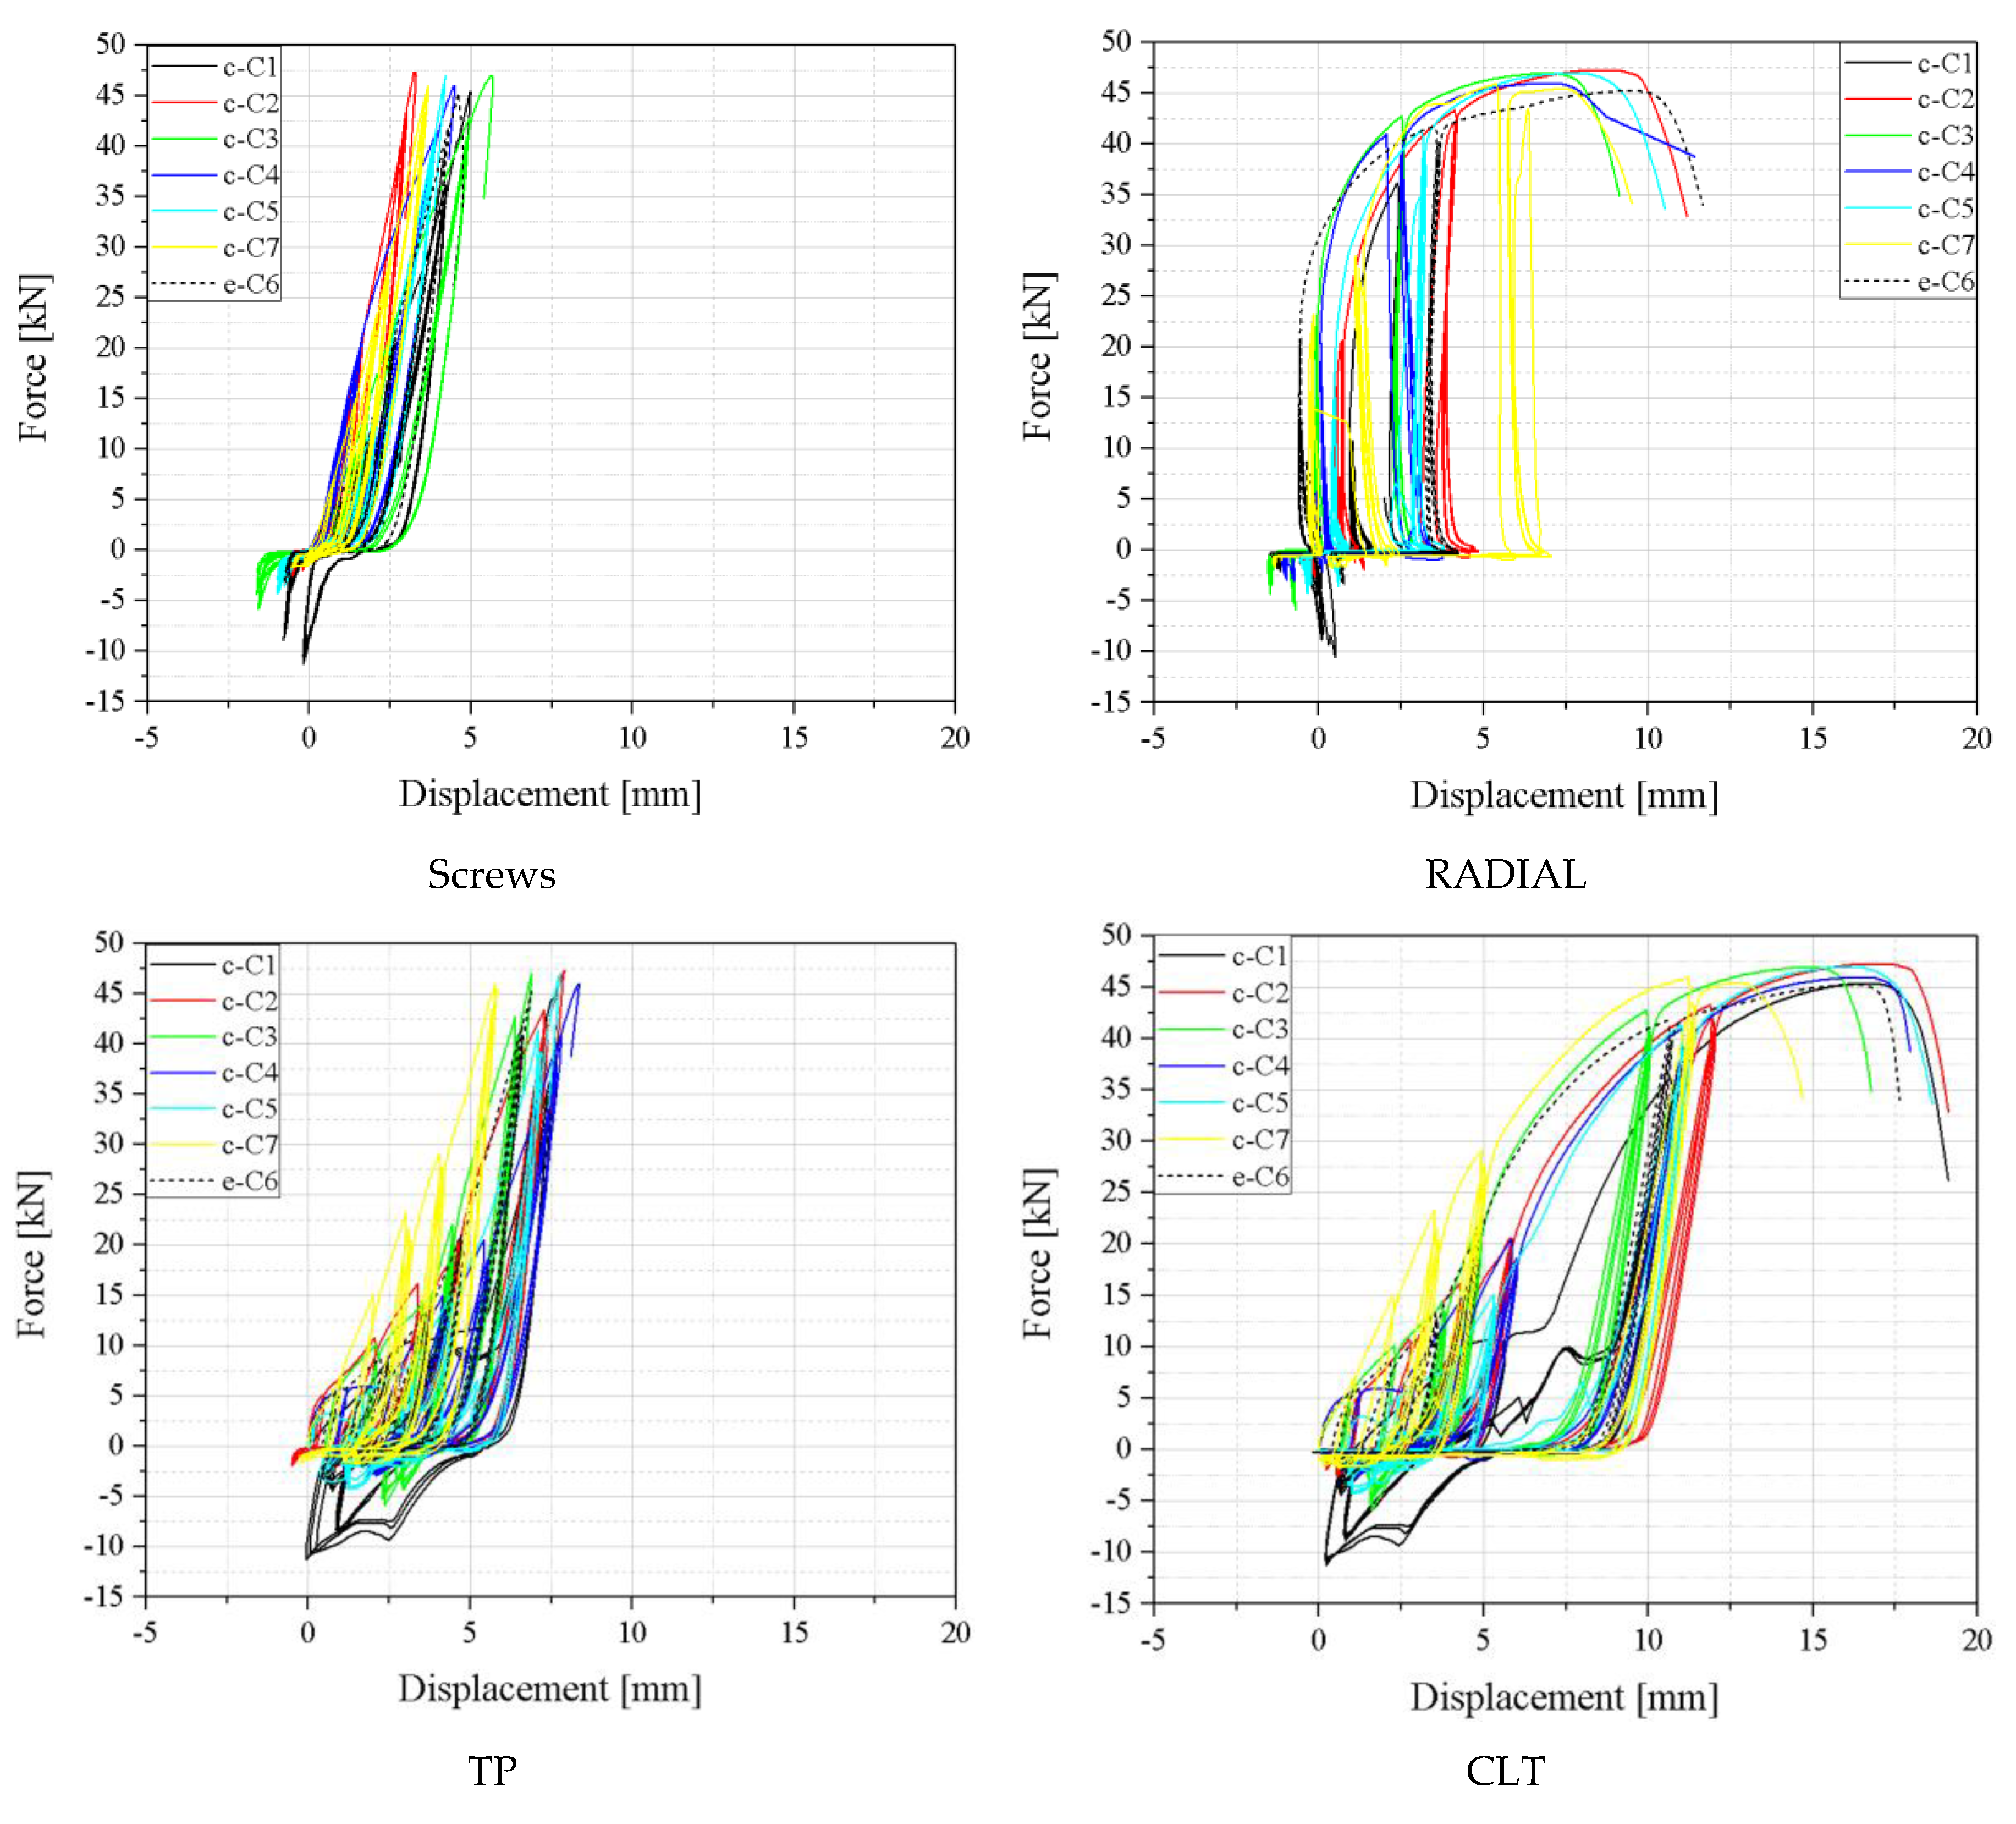
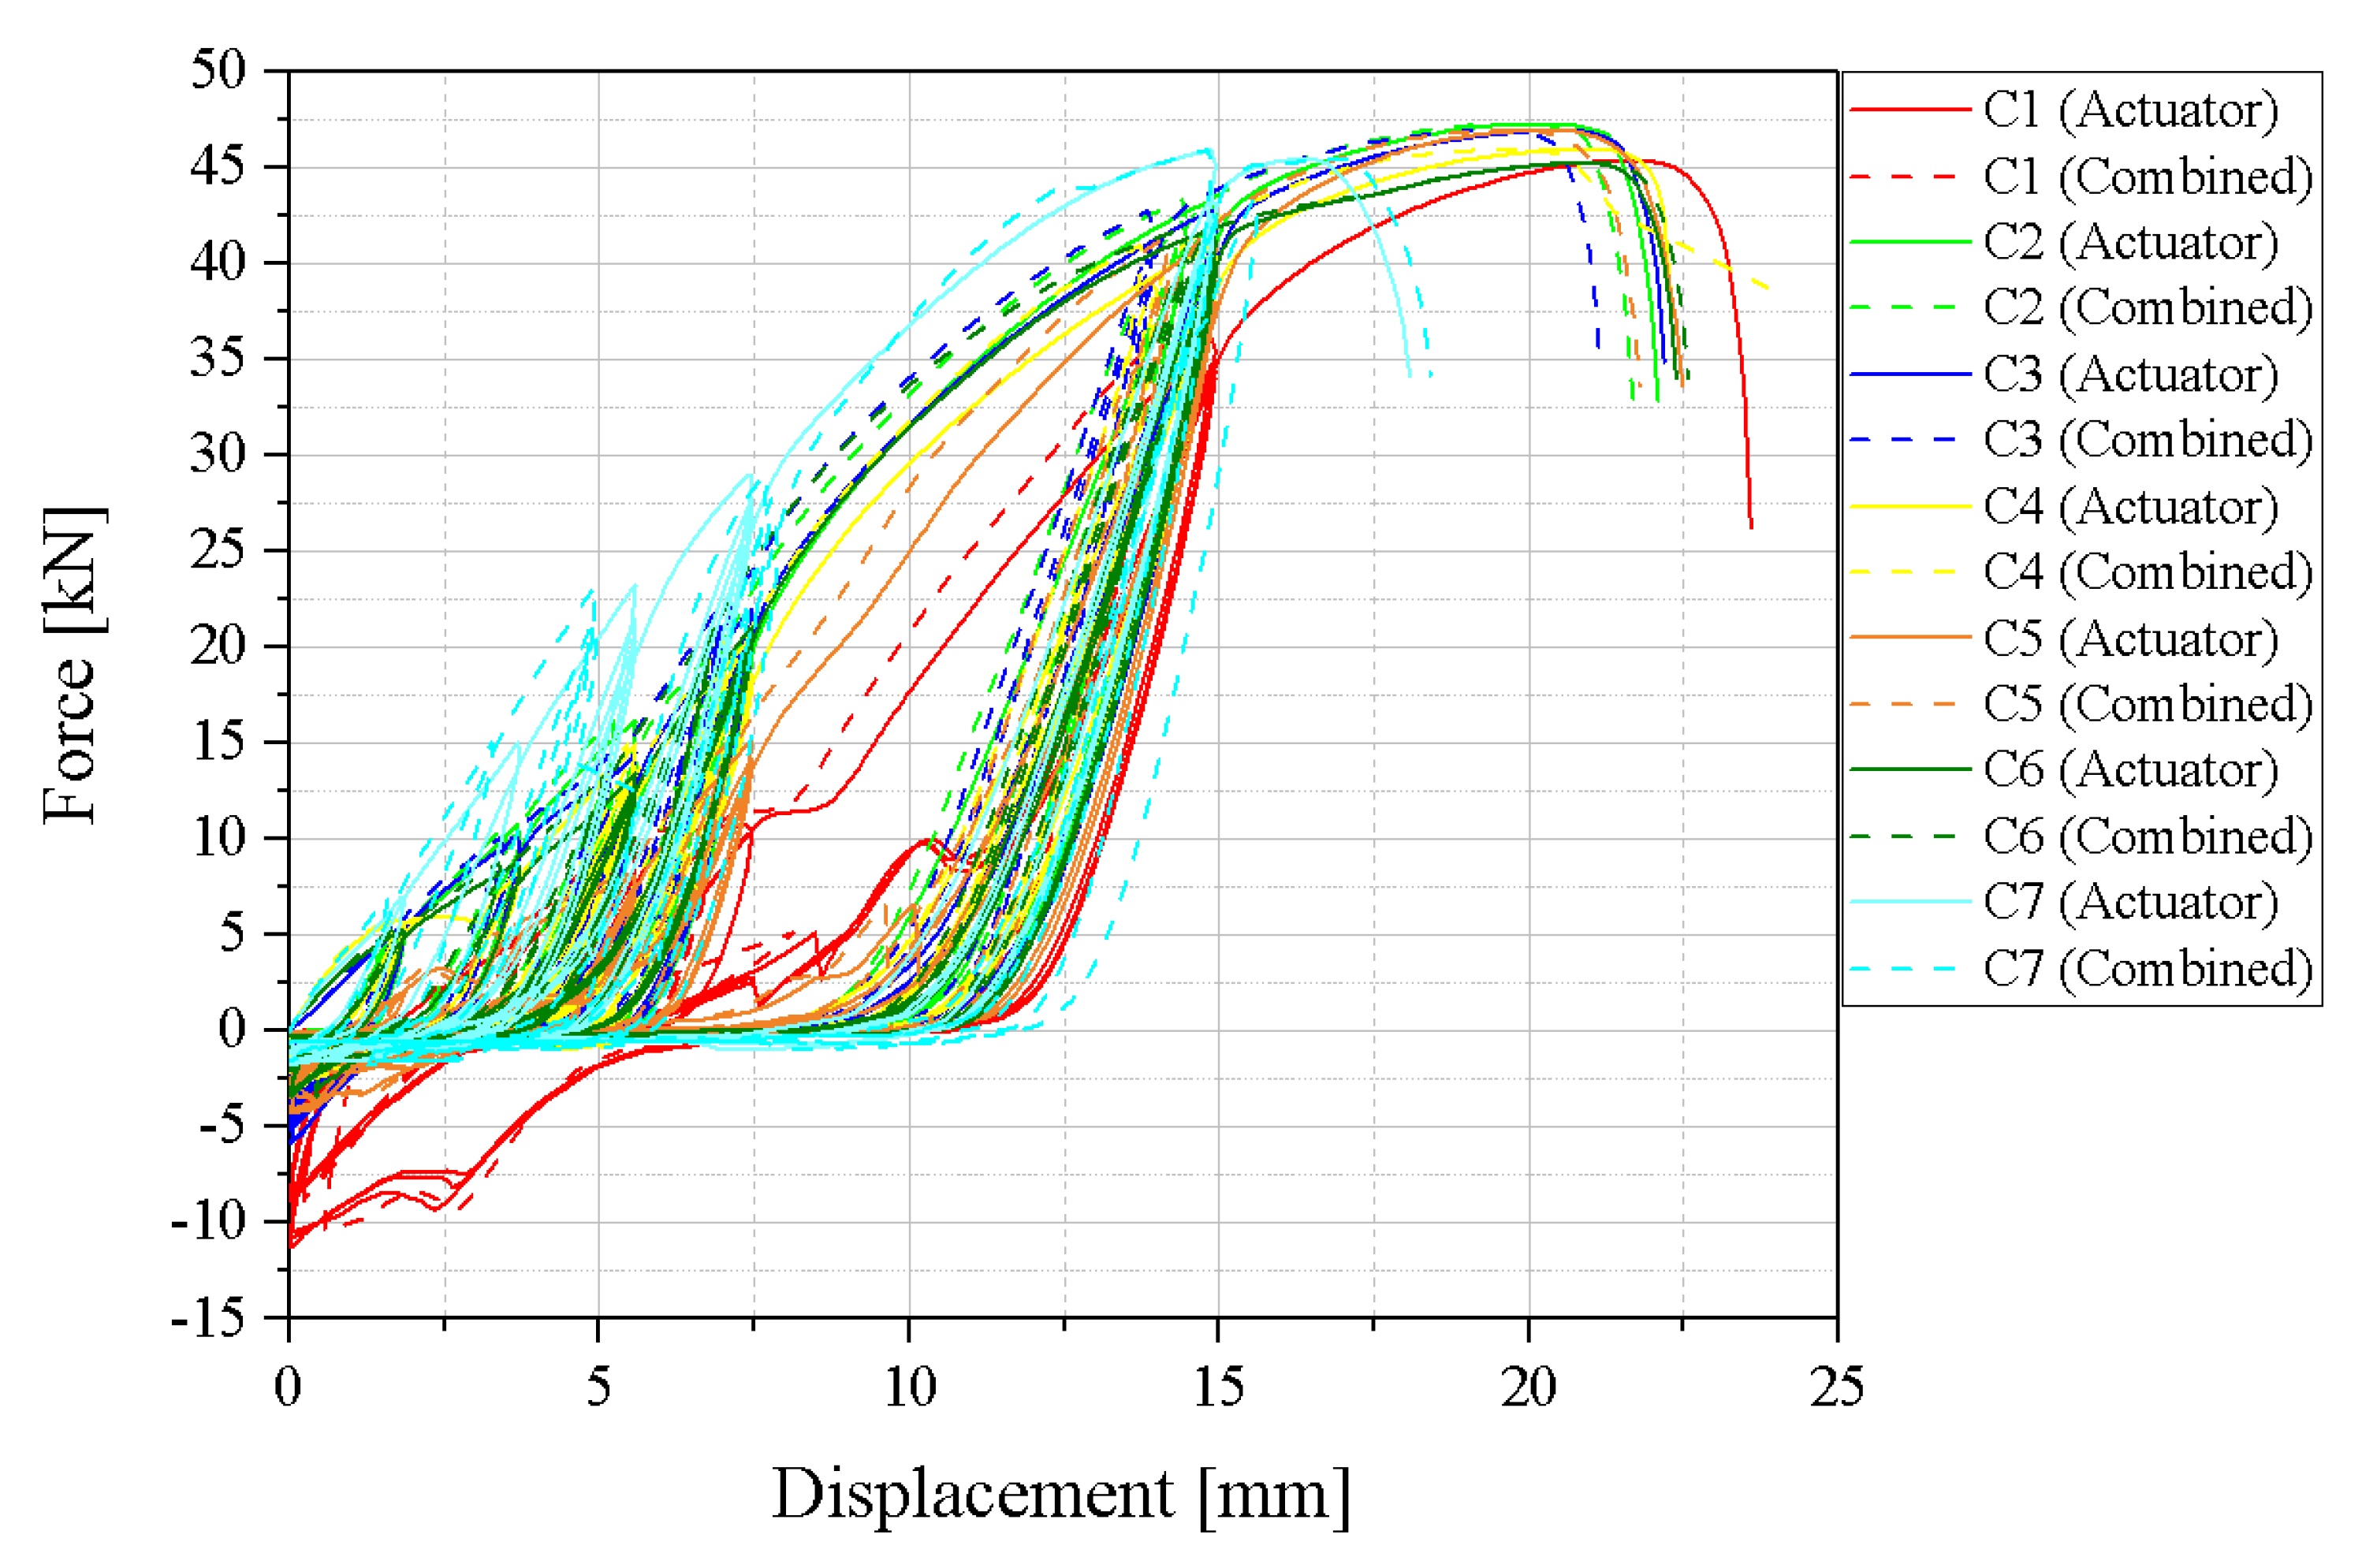
| Configuration | Test Name | CLT | Loading | TP number |
Screws | R2TP-BG | Nuts number |
|---|---|---|---|---|---|---|---|
|
a |
M1 | I | Monotonic | 1 | 6 LBS7x160 | 8.8 | 0 |
| M2 | |||||||
| M3 | |||||||
| b | M4 | 2 | |||||
| M5 | |||||||
|
c |
M6 | Monotonic |
1 |
6 LBS7x160 | 10.9 | 3 | |
| M7 | 4 LBS7x160 | ||||||
| C1 | Cyclic | 4 LBS7x160 | |||||
| C2 | 4 LBS7x160 | ||||||
| C3 | 4 LBS7x160 | ||||||
| C4 | 4 LBS7x160 | ||||||
| C5 | 5 LBS7x160 | ||||||
| C7 | 6 LBS7x160 | ||||||
|
d |
M8 | II | Monotonic |
2 |
5 LBS7x160 | 2 | |
| M9 | 6 LBS7x160 | ||||||
| M10 | 6 LBS7x160 | ||||||
| e | C6 | I | Cyclic | 1 | 6 LBS7x160 |
| Failure | Test | CLT panel | Screws | Bolt | RADIAL flanges | TP |
|---|---|---|---|---|---|---|
| a | M1 | (-) * | (-) | Shear | Bending | Bearing |
| M2 | ||||||
| M3 | ||||||
| b | M4 | Bending | Shear | |||
| M5 | ||||||
| c | M6 | (-) | (-) | |||
| M7 | ||||||
| C1 | ||||||
| C2 | ||||||
| C3 | ||||||
| C4 | ||||||
| C5 | ||||||
| C7 | ||||||
| d | M8 | Thread withdrawal | (-) | |||
| e | M9 | (-) | Shear | Bending | ||
| f | M10 | Delamination | (-) | (-) | ||
| g | C6 | (-) | Low bending | Low bending | Shear |
| No. | Connector’s configuration | Predominant failure | Other failures |
|---|---|---|---|
| 1 | 1 TP M12 C8.8 *, without nuts 4-6 screws LBS 7x160 |
Bending of bolt | Bending of flanges Bearing of TP |
| 2 | 1 TP 4-6 screws LBS 7x160 M12: 2.1. C8.8, fully equipped with nuts 2.2. C10.9, fully equipped with nuts 2.3. C10.9, partially equipped with nuts |
Shear of TP | 2.1. Bending in bolt/flanges 2.2. No bending in bolt/flanges 2.3. Low bending in bolt/flanges |
| 3 | 2 TP M12, C10.9, partially equipped with nuts 6 screws LBS 7x160 |
Bending of bolt | High bending of flanges Bearing of TPs |
| 4 | 2 TP M12, C10.9, partially equipped with nuts Less than 6 screws LBS 7x160 |
Thread withdrawal of screws | - |
| Test | Vy | Fy | Vmax | Fmax | Vu | Fu | tgα | tgβ | μ |
|---|---|---|---|---|---|---|---|---|---|
| [mm] | [kN] | [mm] | [kN] | [mm] | [kN] | ||||
| M1 | 10.82 | 36.30 | 19.29 | 41.03 | 23.18 | 32.83 | 3.35 | 0.56 | 2.14 |
| M2 | 15.07 | 42.90 | 24.32 | 47.29 | 26.74 | 37.88 | 2.85 | 0.47 | 1.78 |
| M3 | 8.05 | 34.33 | 16.02 | 40.00 | 17.47 | 32.01 | 4.27 | 0.71 | 2.17 |
| M4 | 6.08 | 35.41 | 16.42 | 45.47 | 17.81 | 36.32 | 5.83 | 0.97 | 2.93 |
| M5 | 6.96 | 34.37 | 19.09 | 44.33 | 20.73 | 35.36 | 4.93 | 0.82 | 2.98 |
| M6 | 10.30 | 39.83 | 15.29 | 43.05 | 17.34 | 34.52 | 3.88 | 0.65 | 1.68 |
| M7 | 8.74 | 39.48 | 15.78 | 44.74 | 17.69 | 35.85 | 4.49 | 0.75 | 2.02 |
| M8 | 11.72 | 54.37 | 12.95 | 55.28 | 13.13 | 42.51 | 4.41 | 0.74 | 1.12 |
| M9 | 13.49 | 68.09 | 25.06 | 77.61 | 28.10 | 71.60 | 4.94 | 0.82 | 2.08 |
| M10 | 12.02 | 52.02 | 15.65 | 54.58 | 15.68 | 49.23 | 4.24 | 0.71 | 1.30 |
| Mean | 10.33 | 43.71 | 17.99 | 49.34 | 19.79 | 40.81 | 4.32 | 0.72 | 2.02 |
| CoV (%) | 27.89 | 25.40 | 22.11 | 22.64 | 24.45 | 29.28 | 19.49 | 19.48 | 29.94 |
| Predominant failure | Vy | Fy | Vmax | Fmax | Vu | Fu | tgα | tgβ | μ | |
|---|---|---|---|---|---|---|---|---|---|---|
| [mm] | [kN] | [mm] | [kN] | [mm] | [kN] | |||||
| Shear in Bolt of grade 8.8 | Mean | 11.31 | 37.84 | 19.88 | 42.77 | 22.46 | 34.24 | 3.49 | 0.58 | 2.03 |
| CoV (%) | 31.25 | 11.86 | 21.03 | 9.22 | 20.82 | 9.28 | 20.64 | 20.90 | 10.69 | |
| Shear in Bolt of grade 10.9 | - | 13.49 | 68.09 | 25.06 | 77.61 | 28.10 | 71.60 | 4.94 | 0.82 | 2.08 |
| Shear in TP | Mean | 8.02 | 37.27 | 16.65 | 44.40 | 18.39 | 35.51 | 4.78 | 0.80 | 2.40 |
| CoV (%) | 23.44 | 7.48 | 10.18 | 2.29 | 8.54 | 2.17 | 17.15 | 16.87 | 27.19 | |
| Screw thread withdrawal | - | 11.72 | 54.37 | 12.95 | 55.28 | 13.13 | 42.51 | 4.41 | 0.74 | 1.12 |
| CLT delamination | - | 12.02 | 52.02 | 15.65 | 54.58 | 15.68 | 49.23 | 4.24 | 0.71 | 1.30 |
| Test | Vy | Fy | Vmax | Fmax | Vu | Fu | tgα | tgβ | μ |
|---|---|---|---|---|---|---|---|---|---|
| [mm] | [kN] | [mm] | [kN] | [mm] | [kN] | ||||
| C1 | 21.47 | 45.28 | 21.76 | 45.39 | 22.24 | 36.31 | 2.28 | 0.38 | 1.04 |
| C1 | 16.22 | 45.32 | 20.46 | 47.3 | 20.89 | 37.84 | 2.79 | 0.46 | 1.29 |
| C3 | 16.16 | 44.9 | 20.67 | 46.97 | 21.23 | 37.57 | 2.75 | 0.46 | 1.31 |
| C4 | 16.72 | 44.07 | 21.17 | 45.98 | 21.51 | 36.78 | 2.58 | 0.43 | 1.29 |
| C5 | 18.37 | 46.02 | 20.47 | 46.98 | 20.99 | 37.59 | 2.76 | 0.46 | 1.14 |
| C6 | 16.36 | 43.2 | 21.07 | 45.24 | 21.87 | 36.19 | 2.61 | 0.43 | 1.34 |
| C7 | 10.1 | 42.53 | 14.87 | 45.93 | 17.33 | 36.74 | 4.27 | 0.71 | 1.72 |
| Mean | 16.49 | 44.47 | 20.07 | 46.25 | 20.86 | 37.00 | 2.86 | 0.48 | 1.3 |
| CoV (%) | 20.63 | 2.83 | 11.65 | 1.78 | 7.82 | 1.79 | 22.51 | 22.54 | 16.31 |
| Test | 0.75Vy | Vy | 2Vy | |||
|---|---|---|---|---|---|---|
|
EC1-EC2 EC1 |
EC1-EC3 EC1 |
EC1-EC2 EC1 |
EC1-EC3 EC1 |
EC1-EC2 EC1 |
EC1-EC3 EC1 |
|
| C1 | 12.89 | 14.48 | 3.70 | 4.46 | 3.84 | 5.14 |
| C2 | 13.64 | 22.42 | 2.39 | 3.75 | 2.61 | 5.28 |
| C3 | 7.25 | 10.03 | 3.93 | 5.80 | 4.55 | 6.73 |
| C4 | 8.15 | 14.30 | 9.17 | 11.88 | 4.94 | 6.73 |
| C5 | 4.60 | 6.82 | 6.02 | 8.75 | 5.37 | 8.12 |
| C6 | 4.53 | 6.33 | 2.54 | 3.78 | 3.42 | 5.09 |
| C7 | 7.62 | 12.42 | 4.41 | 7.48 | 5.43 | 7.42 |
| Mean | 8.38 | 12.40 | 4.59 | 6.56 | 4.31 | 6.36 |
| CoV (%) | 43.29 | 44.41 | 51.30 | 45.99 | 24.59 | 19.01 |
| Test |
EC1-EC2 EC1 |
EC1-EC3 EC1 |
|---|---|---|
| C1 | 7.20 | 8.88 |
| C2 | 12.58 | 17.96 |
| C3 | 7.58 | 10.71 |
| C4 | 12.09 | 17.93 |
| C5 | 9.51 | 13.94 |
| C6 | 5.52 | 7.75 |
| C7 | 6.07 | 10.00 |
| Mean | 8.65 | 12.45 |
| CoV (%) | 32.60 | 33.83 |
Disclaimer/Publisher’s Note: The statements, opinions and data contained in all publications are solely those of the individual author(s) and contributor(s) and not of MDPI and/or the editor(s). MDPI and/or the editor(s) disclaim responsibility for any injury to people or property resulting from any ideas, methods, instructions or products referred to in the content. |
© 2024 by the authors. Licensee MDPI, Basel, Switzerland. This article is an open access article distributed under the terms and conditions of the Creative Commons Attribution (CC BY) license (http://creativecommons.org/licenses/by/4.0/).


