1. Introduction
Hydrogels are three-dimensional (3D) networks made of polymers that possess a high degree of flexibility due to the large water content that they can absorb. They are suitable substances for a wide variety of applications because they can retain a large amount of water or biological fluids under physiological conditions and are characterized by a soft rubbery consistency similar to living tissues [
1]. These materials are formed within an aqueous microenvironment through the cross-linking of hydrophilic polymer chains. They are widely used in several areas, such as tissue engineering, drug delivery, actuators, and wound dressings [
2].
Furthermore, this type of biomaterial has been largely applied to fabricate structures with cells incorporated through 3D extrusion-based printing techniques, including 3D printing, because of their cell-friendly environment and high water content [
3]. 3D printing, also known as additive manufacturing, involves creating objects layer by layer using digital design data. This process is guided by computer-aided design (CAD) files and can produce objects with complex shapes and structures [
4]. 3D printing is a growing field that has been applied in several areas, such as construction, biology, dentistry, prosthesis, and others [
5,
6,
7,
8]. For 3D bioprinting purposes, when cells and biomaterials are involved in the process, hydrogels are used and these biomaterials must present some features, such as biocompatibility, toughness, degradability, swelling behavior, and printability [
9].
In that manner, some biopolymers already present some outstanding properties for hydrogels formation, like alginate that is a natural linear (unbranched) polysaccharide, typically extracted from brown algae, based on d-mannuronic and l-guluronic acids, that is biodegradable, non-toxic, non-immunogenic, and presents a high biocompatibility [
10,
11]. Also, another biopolymer of interest for production of hydrogels is cellulose that, probably, is the most abundant renewable and biodegradable material found in nature, since it is generally obtained from plants, and is many times used in its derived form, carboxymethyl cellulose, with both presenting a high viscosity, low cost, and biocompatibility [
12,
13,
14]. Additionally, gelatin is a protein derived from collagen that has been partially hydrolyzed that presents some interesting characteristics aiming the production of hydrogels for 3D bioprinting purposes, like high water absorption capability, biodegradability, non-immunogenicity, and exceptional biocompatibility [
9]. All mentioned properties are important for 3D bioprinting techniques, and the mixture of these three biopolymers may produce hydrogels reliable for micro-extrusion processes, depending on the concentration that will be applied, which makes important the analysis of such conditions.
To optimize a study, it is preferable to combine numerous variables rather than creating an individual experiment for each one, since the number of necessary assays is expressively decreased, resulting in a greater understanding of the process. In such cases, Design of Experiments (DoE) is applied to study concurrent variables in the process [
15]. DoE consists of various applied statistic tools that are used to methodically classify and quantify cause-and-effect relations between variables and outcomes in the process under study, which can result in discovering the settings and conditions where the processes become optimized [
16]. The application of DoE presents several advantages, including enhanced productivity, reduced variability, reduced development time, and lower costs overall [
17].
Among the existing types of planning, central composite design (CCD) is an excellent choice that has emerged in the process of optimization and for finding the best possible product from a batch in progress. The CCD model is an essential part of response surface methodology, and one of its main advantages is that it is more accurate than previously applied one-variable-at-a-time models. Response Surface Methodology is a set of statistical and mathematical techniques based on the fit of a polynomial equation to the experimental data, which needs to represent the behavior of a data set with the aim of making statistical predictions. Therefore, it simultaneously optimizes the levels of several factors to obtain the best performance and has been applied in several areas, with the potential to be utilized for the selection of hydrogels [
18,
19,
20,
21,
22,
23].
The present study proposes the production of an optimized hydrogel for 3D printing process using CCD based on the evaluation of its swelling degree and printability. The findings of this research contribute to the advancement of micro-extrusion-based 3D bioprinting and biomedical applications by providing a valuable tool for developing optimized biomaterials. The enhanced hydrogel formulation offers a promising foundation for future research and development, potentially leading to improvements in healthcare, biotechnology, and bioengineering.
2. Materials and Methods
2.1. Materials
Calcium chloride dihydrate (Sigma, USA); Carboxymethyl cellulose sodium salt (Impex, Brazil); Dulbecco's Modified Eagle Medium (Sigma, USA); Gelatin P.A. (Dinâmica, Brazil); Phosphate buffered saline (PBS) (AMRESCO, USA); Sodium alginate (CRQ, Brazil).
2.2. Production of Hydrogels
To define the minimum and maximum concentration of each polymer for the production of the mixtures, the Google Scholar database was employed, and the first 30 articles that reported the production hydrogels using carboxymethyl cellulose (CMC), gelatin (GEL) and sodium alginate (SA), separately, were analyzed, and the minimum and maximum concentrations found were applied. The criteria for selecting articles from the Google Scholar search engine were based on the relevance of their content to the production of hydrogels using carboxymethyl cellulose, gelatin, and sodium alginate. No publication date restrictions were imposed, and articles in all languages were considered. The first 30 articles that met these criteria were chosen for further analysis.
These concentrations were then employed in Chemoface software [
24] using CCD, yielding 17 mixtures of hydrogels, with the central point being repeated 3 times. Subsequently, mixtures of hydrogels were produced by adding 0.5 mL of each polymer at the initial concentration provided by Chemoface into 24-well plates, and they were left overnight. The following morning, hydrogels were subjected to swelling assays.
2.3. Swelling Kinetics
Hydrogels produced the previous day were removed from the 24-well plate, cross-linked with 2% calcium chloride for 5 min, gently dried, and weighed, providing the initial weight (
w0) of the hydrogels. Subsequently, these hydrogels were placed in beakers with 6 mL of PBS, or DMEM, added separately to each beaker. They were stored in an oven at 37°C for 72 h. At intervals of 30 min, 1 h, 2 h, 4 h, 24 h, 48 h, and 72 h, the hydrogels were removed from the PBS or DMEM, gently dried, and weighed. The fluid absorption rate of each hydrogel was calculated using the following equation:
Where w is the weight of the hydrogel at different intervals. Swelling degree (SD) is presented in percentage and represents the maximum weight observed, not dependent on the time at which it was measured. Similarly, the degradation degree is presented as the maximum weight loss, not dependent on the time of the measurement. This assay was performed in quadruplicate, and the results are presented as the mean of each experiment.
2.4. Printability Assay
From all the 15 different combinations offered by Chemoface (the central point had three replicates reaching the 17 mixtures), the ones that presented higher swelling degrees in PBS and DMEM were chosen to be manually extruded. In this assay, hydrogel mixtures were produced, packed in 5 mL syringes, and geometric shapes were extruded manually on a flat surface.
Subsequently, the chosen mixtures were submitted to 3D printing tests. The 3D printer used for all tests was the Engine HR (Hyrel 3D, USA). A computer-aided design (CAD) model was produced for the tests. The model chosen was a cylinder with dimensions of 15 × 15 × 10 mm, with a layer height of 0.3 mm, and a speed of 4 mm/s for the perimeter and filling, with 40% filling.
2.5. Workflow
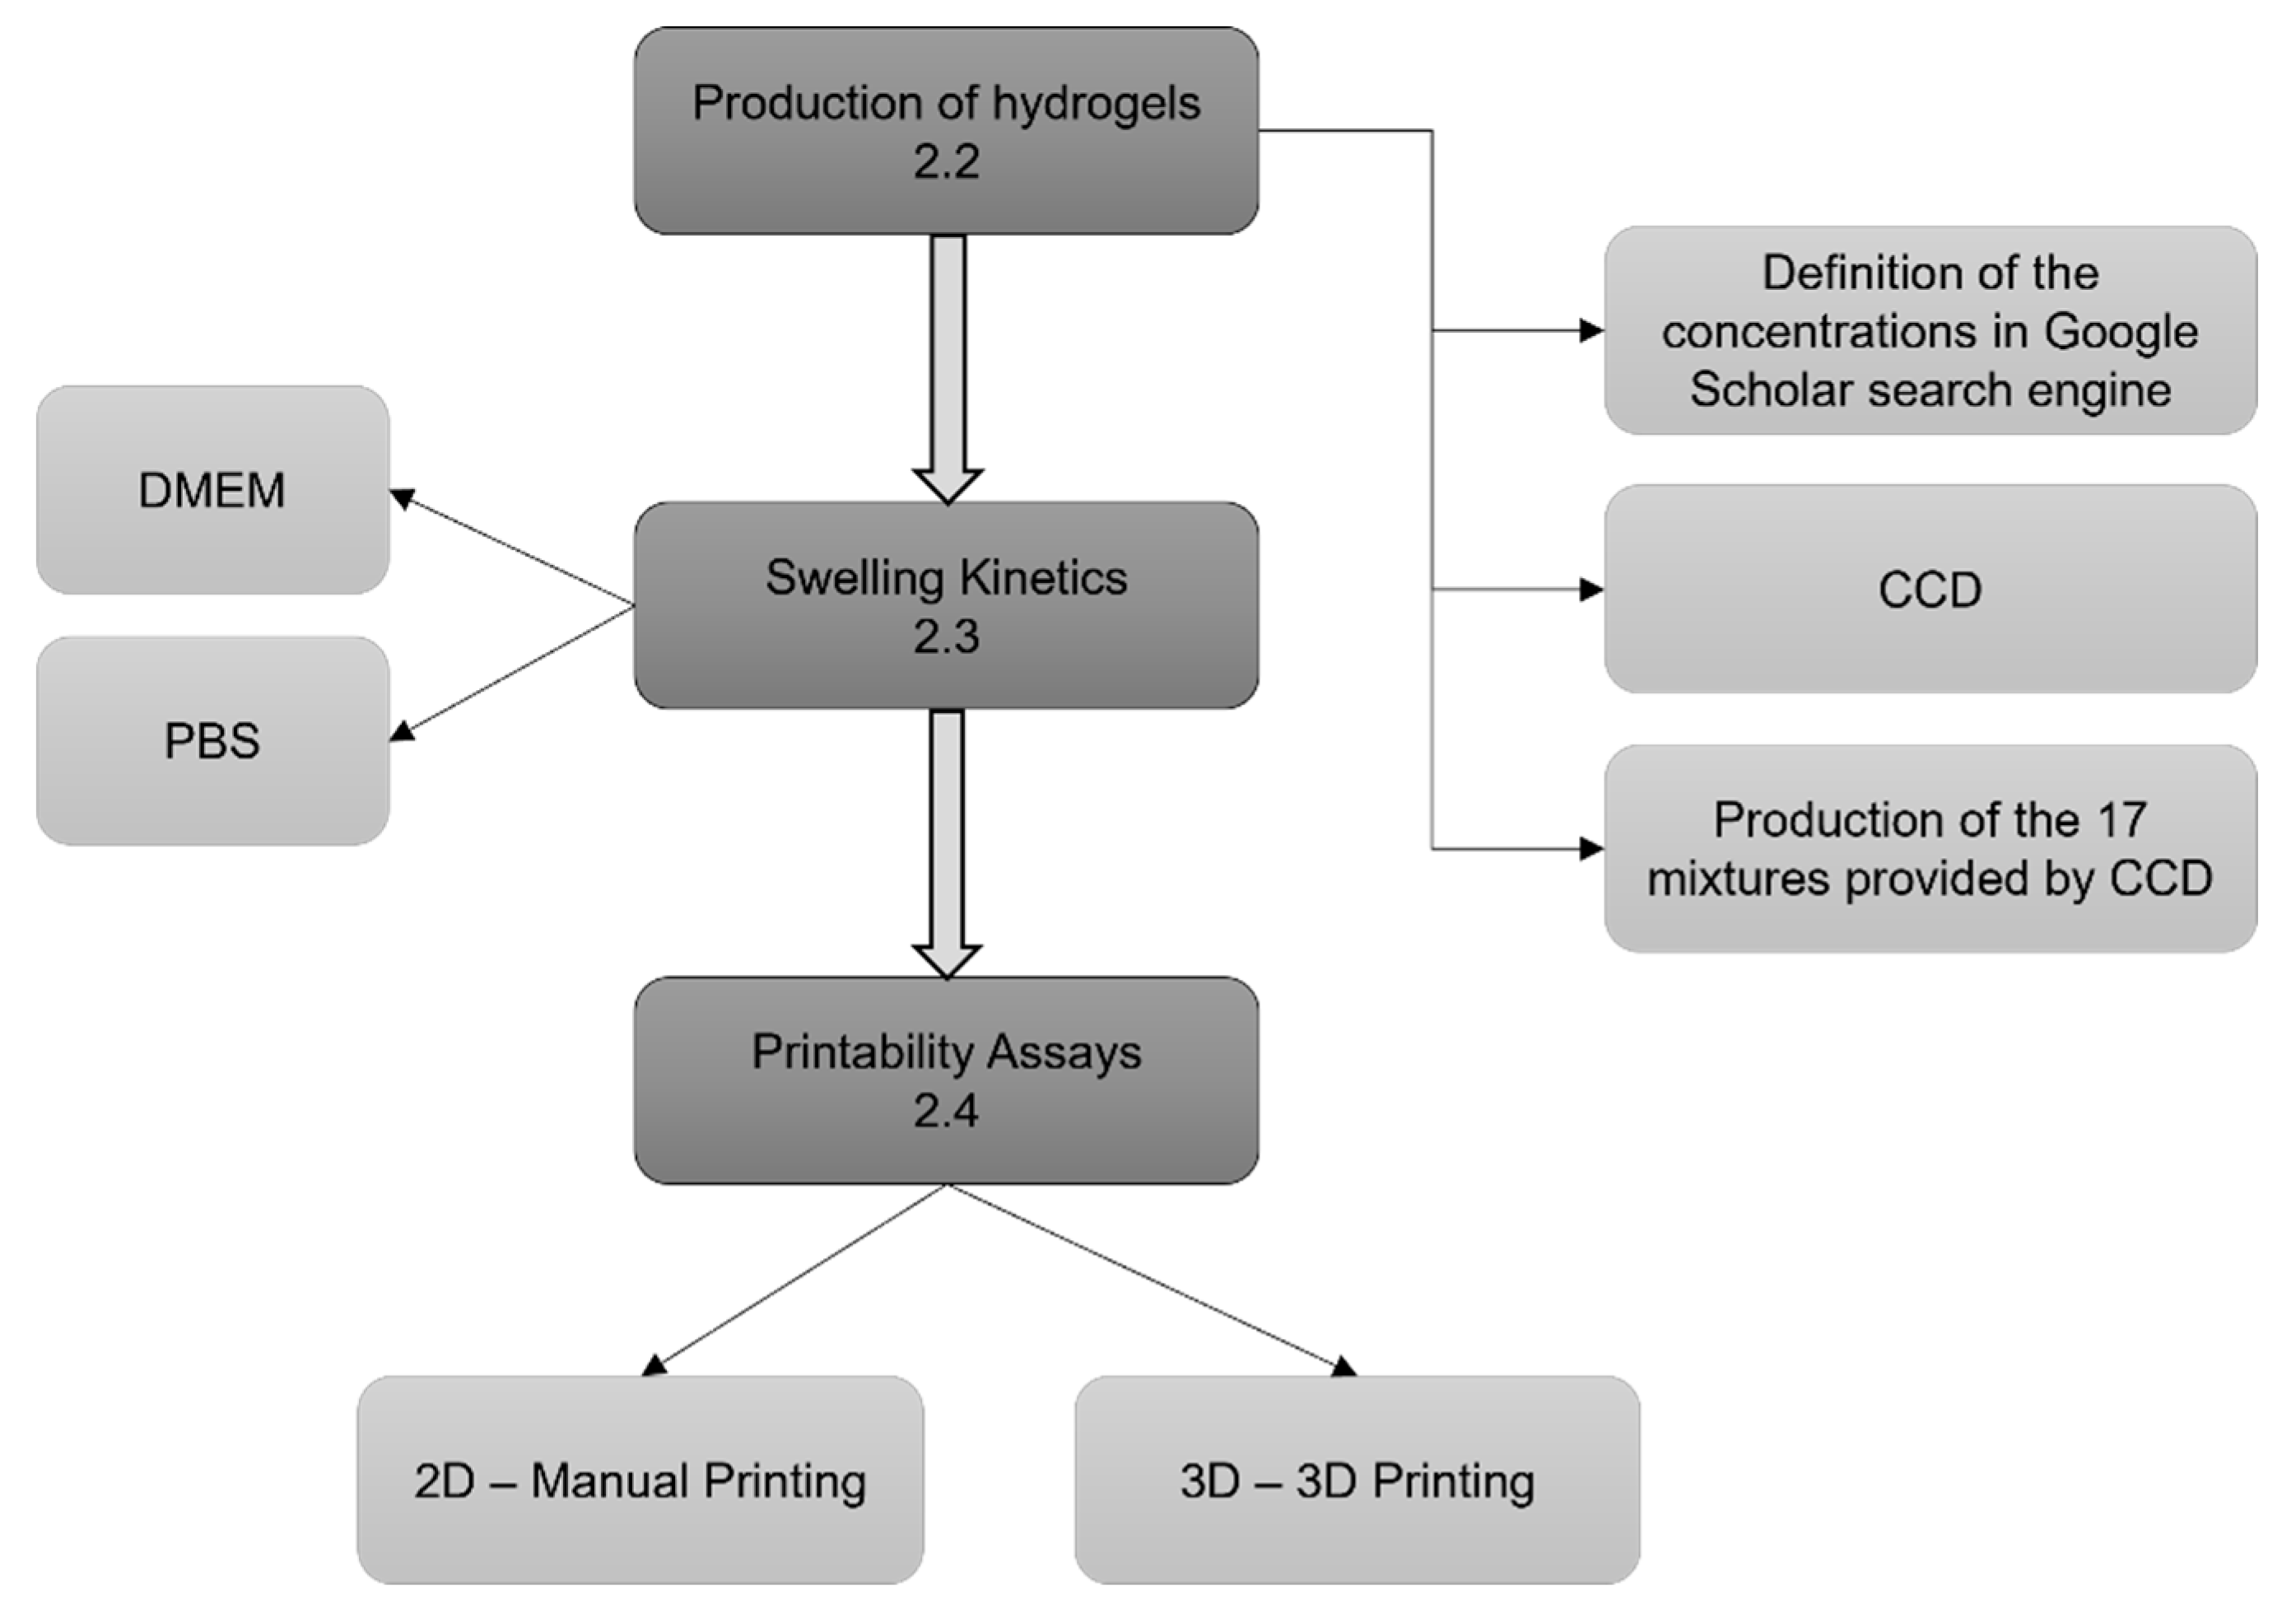
Figure 1 presents a flow chart for step-wise procedures described in this section.
3. Results and Discussion
3.1. Production of the Hydrogels
Table 1 shows the experiments proposed using Chemoface software, presenting the initial concentration of each biopolymer for each experiment, named from 1 to 17. The maximum and minimum concentrations defined were 7.5% and 1% for SA; 3% and 2% for CMC; and 10% and 5% for GEL, respectively, and the other concentrations were provided by CCD analysis.
CCD is a methodology that indicates experimental conditions based on the combination of factorial points (+1 and -1), axial points (+α and -α), and a central point (level zero) of the chosen variable levels. The maximum and minimum values chosen for each factor are known as factorial points; the axial points are extreme values that are calculated using the following equation:
Where
k represents the number of factors, in the case of this study,
k was defined as 3; and the central point is the mean between maximum and minimum values [
25].
Table 2 describes the points used for this study, with all the values presented in the table being percentages.
Similarly, Neto and Silva [
26] employed CCD to choose the concentration of sodium alginate, gelatin, and calcium chloride to form a biomaterial, aiming to understand how the crosslinking agent can act in the modulation of micro and nanomechanical properties of biopolymeric filaments. In addition, Vaz [
27] employed this type of design to select parameters for bioprinting on different 3D printers, such as the diameter of the needles, extrusion multiplier, and the printing speed to define the width of the filament produced.
After the production of each condition proposed, the hydrogels were unmolded and cross-linked using 2% calcium chloride for 5 min, gently dried, and submitted to swelling and degradation assays.
3.2. Swelling Kinetics
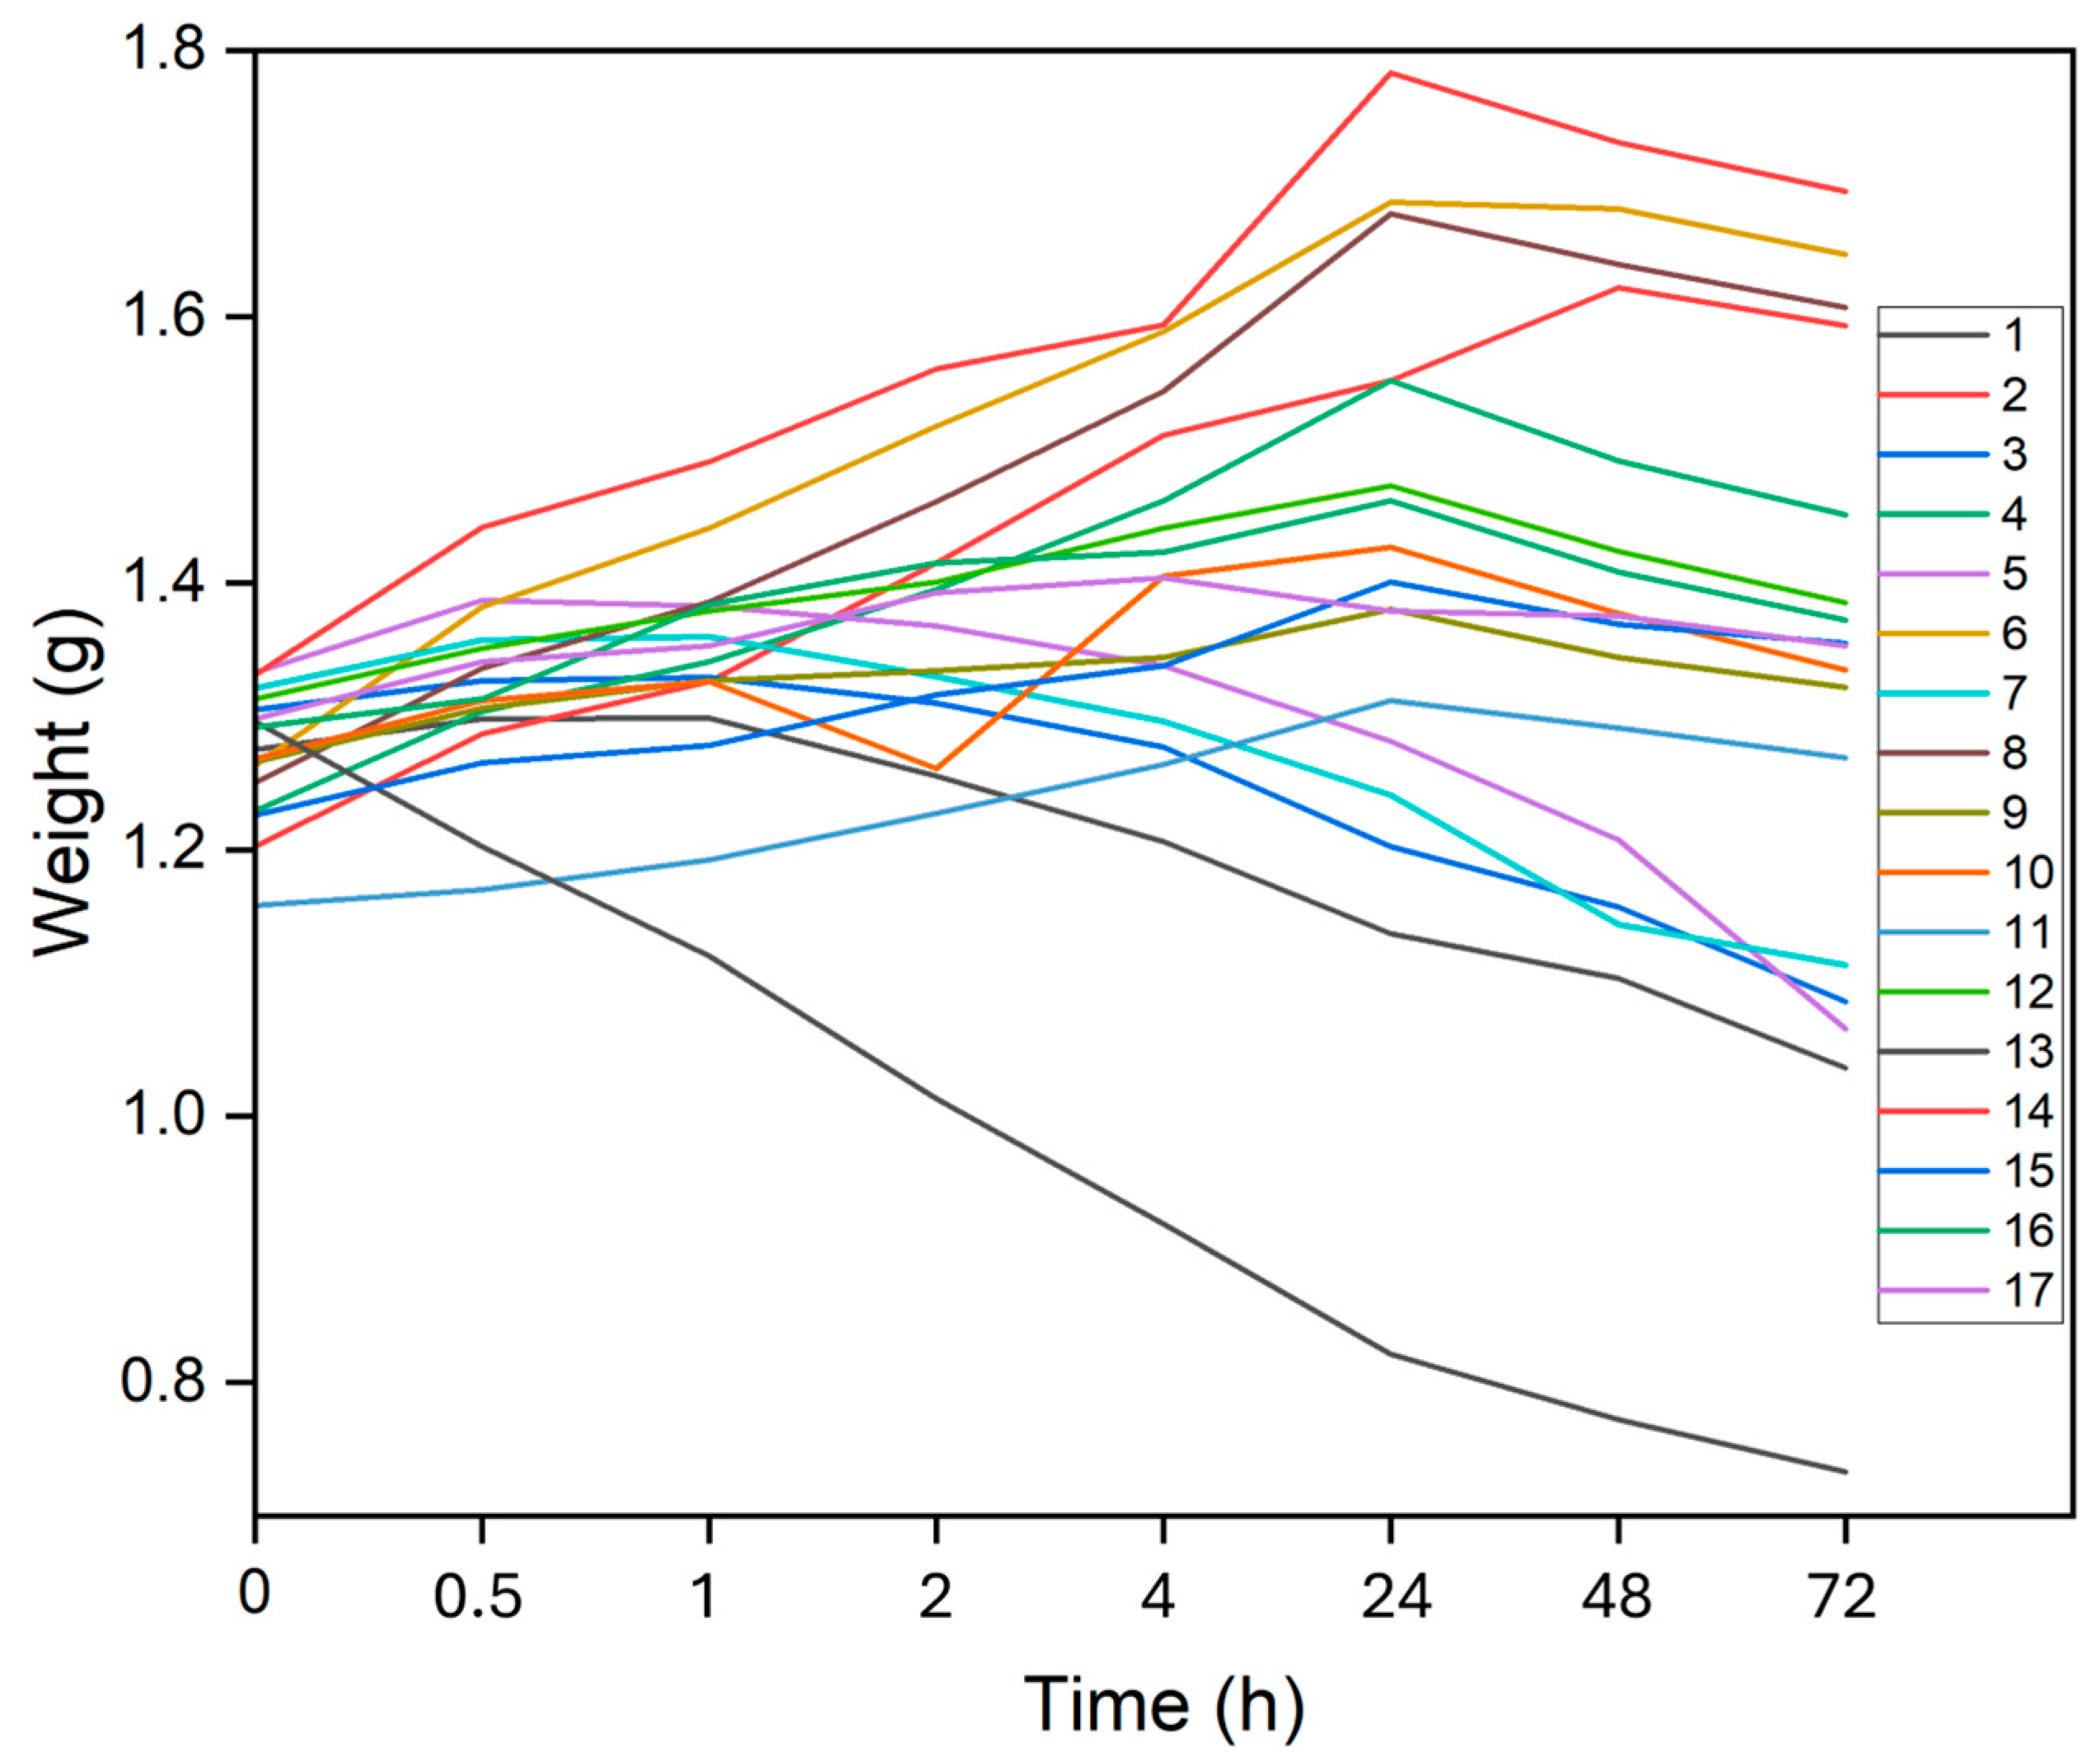
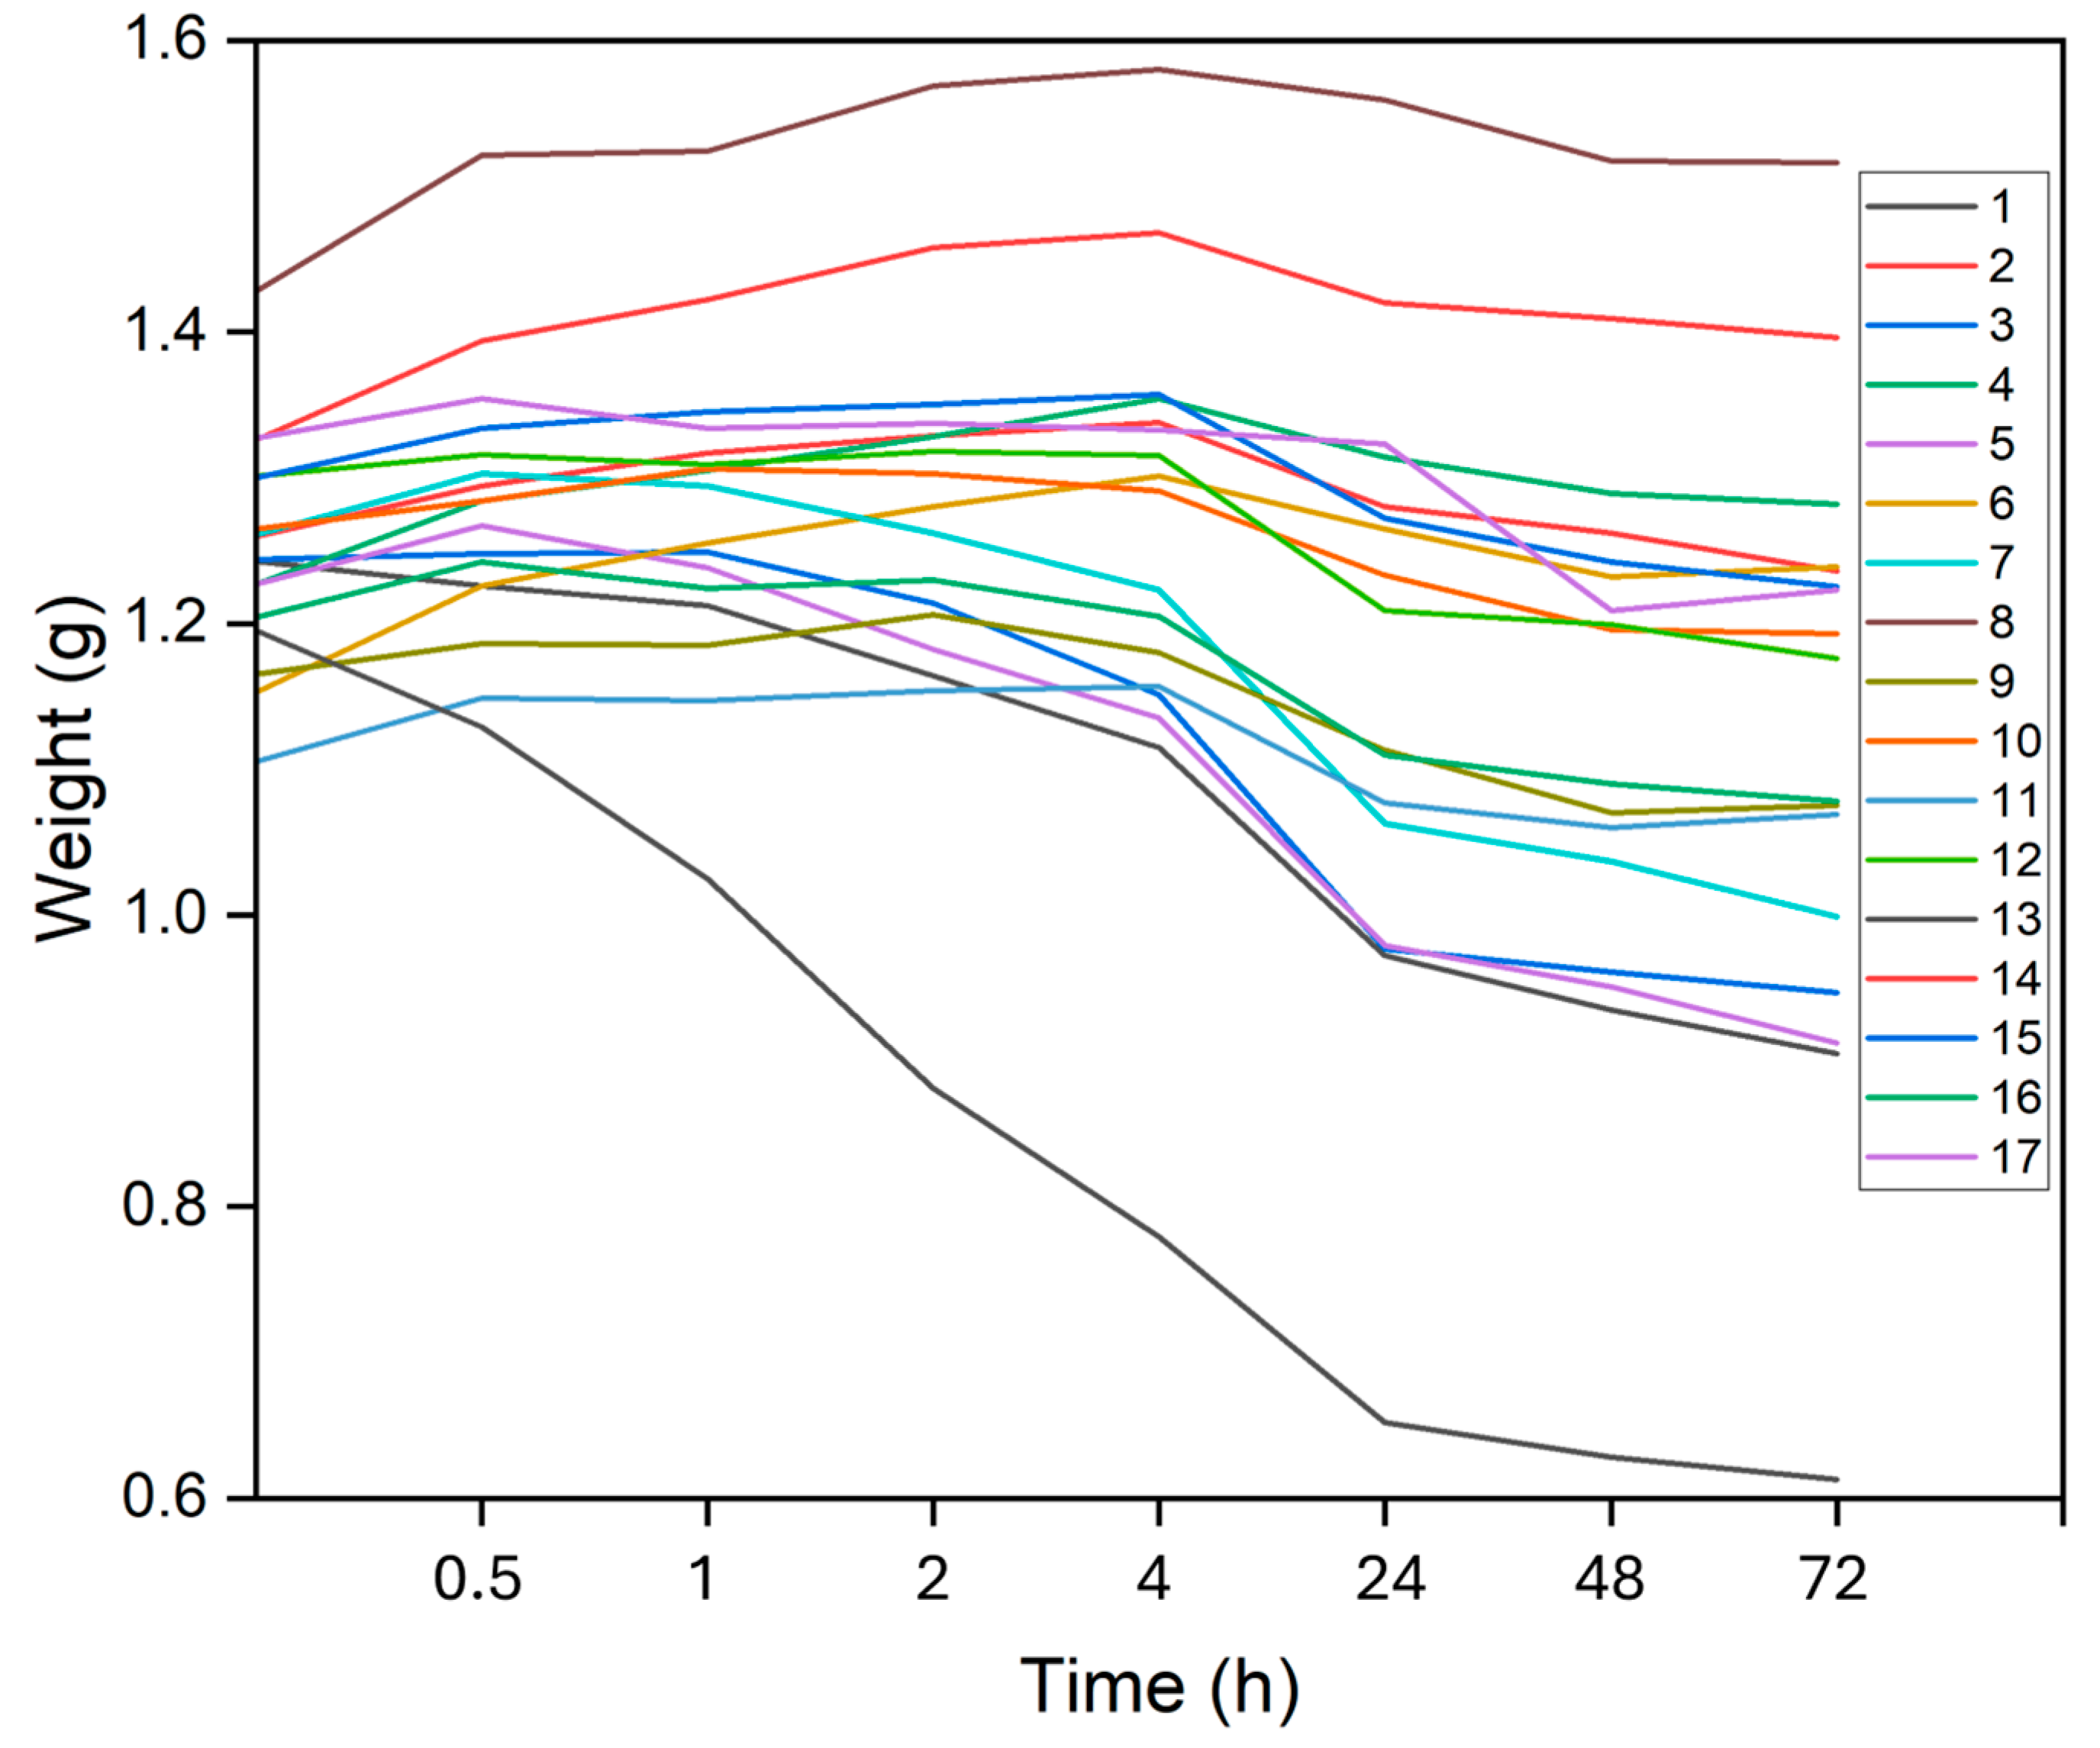
Figure 2 and
Figure 3 display the average results of the swelling degree and/or degradation of each hydrogel at various time intervals in PBS and DMEM, respectively. In PBS, the general pattern observed was that the hydrogels swelled up to 24 h before starting to degrade, at different rates and times. Exceptions to this were hydrogels 1, 3, 5, 7, and 13, which all contained lower concentrations of SA and exhibited swelling only up 1 or 2 h before degradation began. Notably, hydrogel 13, which had the lowest SA concentration at 1%, did not swell at all and instead showed mass loss at all observed times.
In DMEM, the hydrogels demonstrated a greater tendency to degrade compared to PBS: 8 hydrogels swelled up to 4 h, 2 swelled up to 2 h, 2 swelled up to 1 h, 3 swelled for only 30 min, and the 2 did not swell at all. Again, hydrogels with higher SA concentrations exhibited longer swelling times, while those with lower concentrations swelled for shorter durations or not at all.
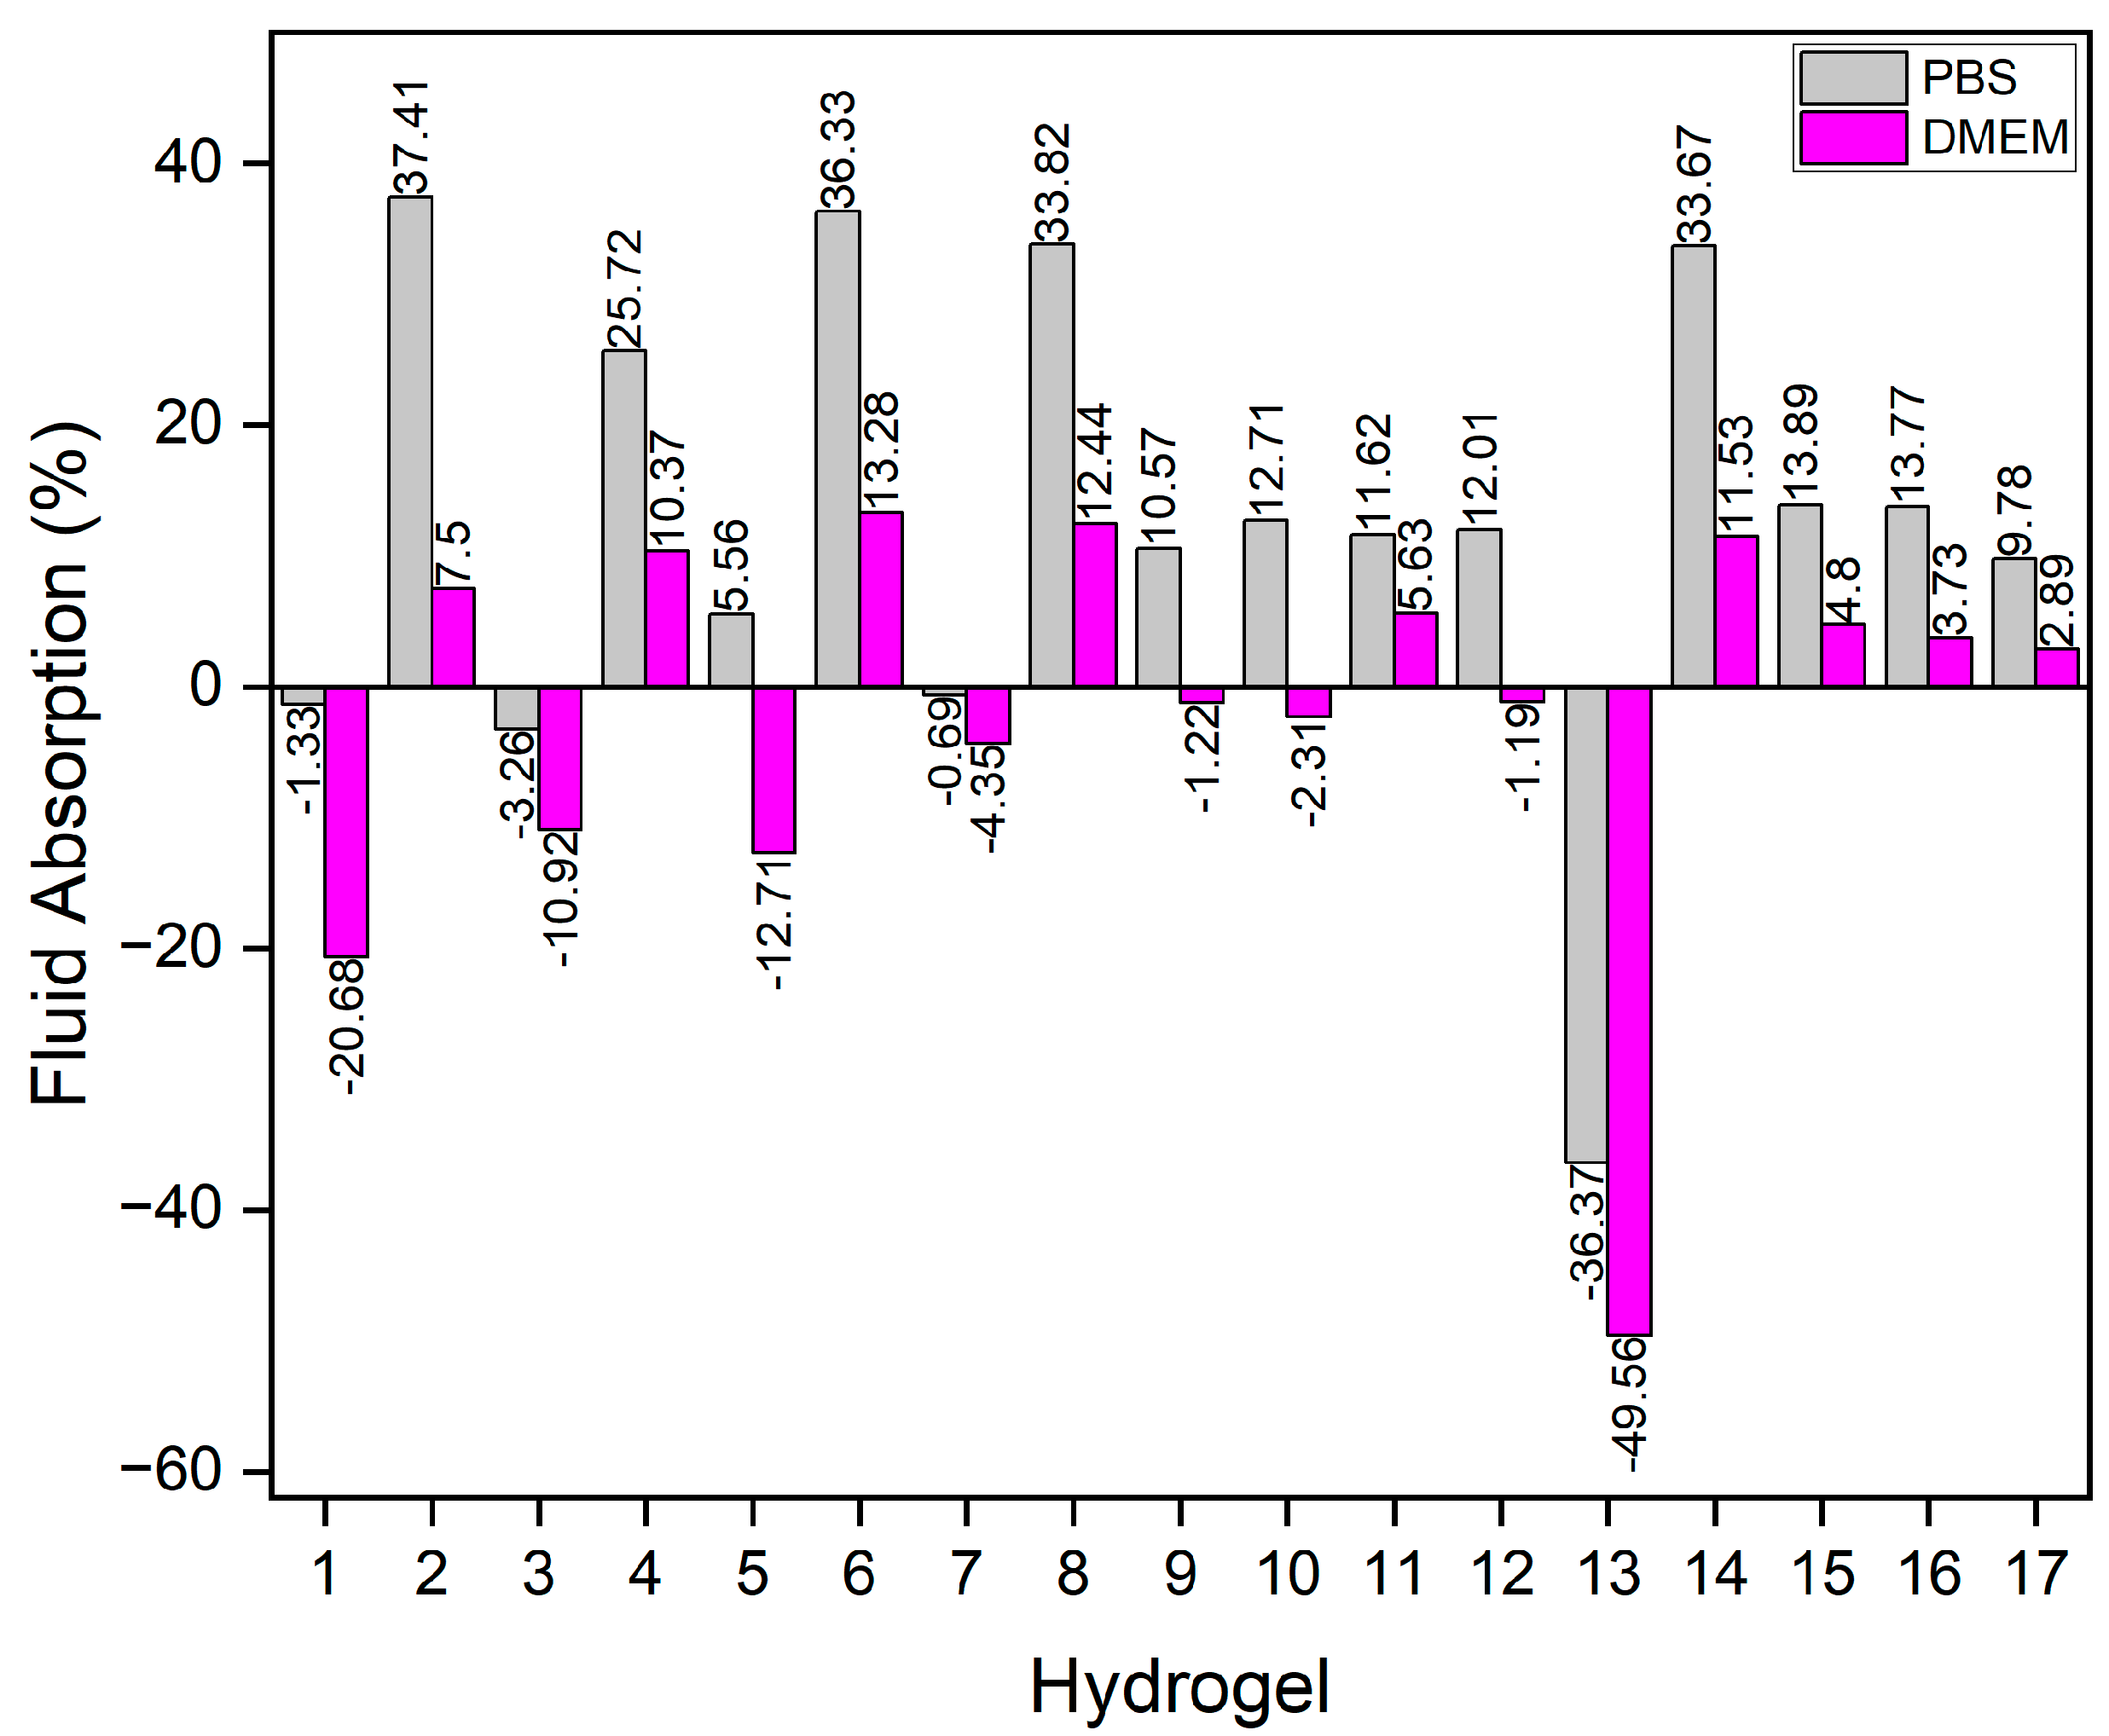
Figure 4 illustrates the swelling or degradation rates, representing the maximum weight gain or loss. It was also evident that hydrogels swelled more in PBS than in DMEM. The highest swelling rate observed in PBS was 37.41% for hydrogel 2, while in DMEM hydrogel 6 reached 13.26%. Hydrogel 13 exhibited the highest degradation rates in both PBS and DMEM, at -36.37% and -49.56%, respectively.
A probable reason for the great swelling observed in PBS is the ion-exchange process between Na
+ ions in PBS and Ca
+ ions bound to COO
- groups in the hydrogels. The exchange increases electrostatic repulsion between negatively charged -COO
- groups, leading to chain relaxation and enhanced gel swelling [
28].
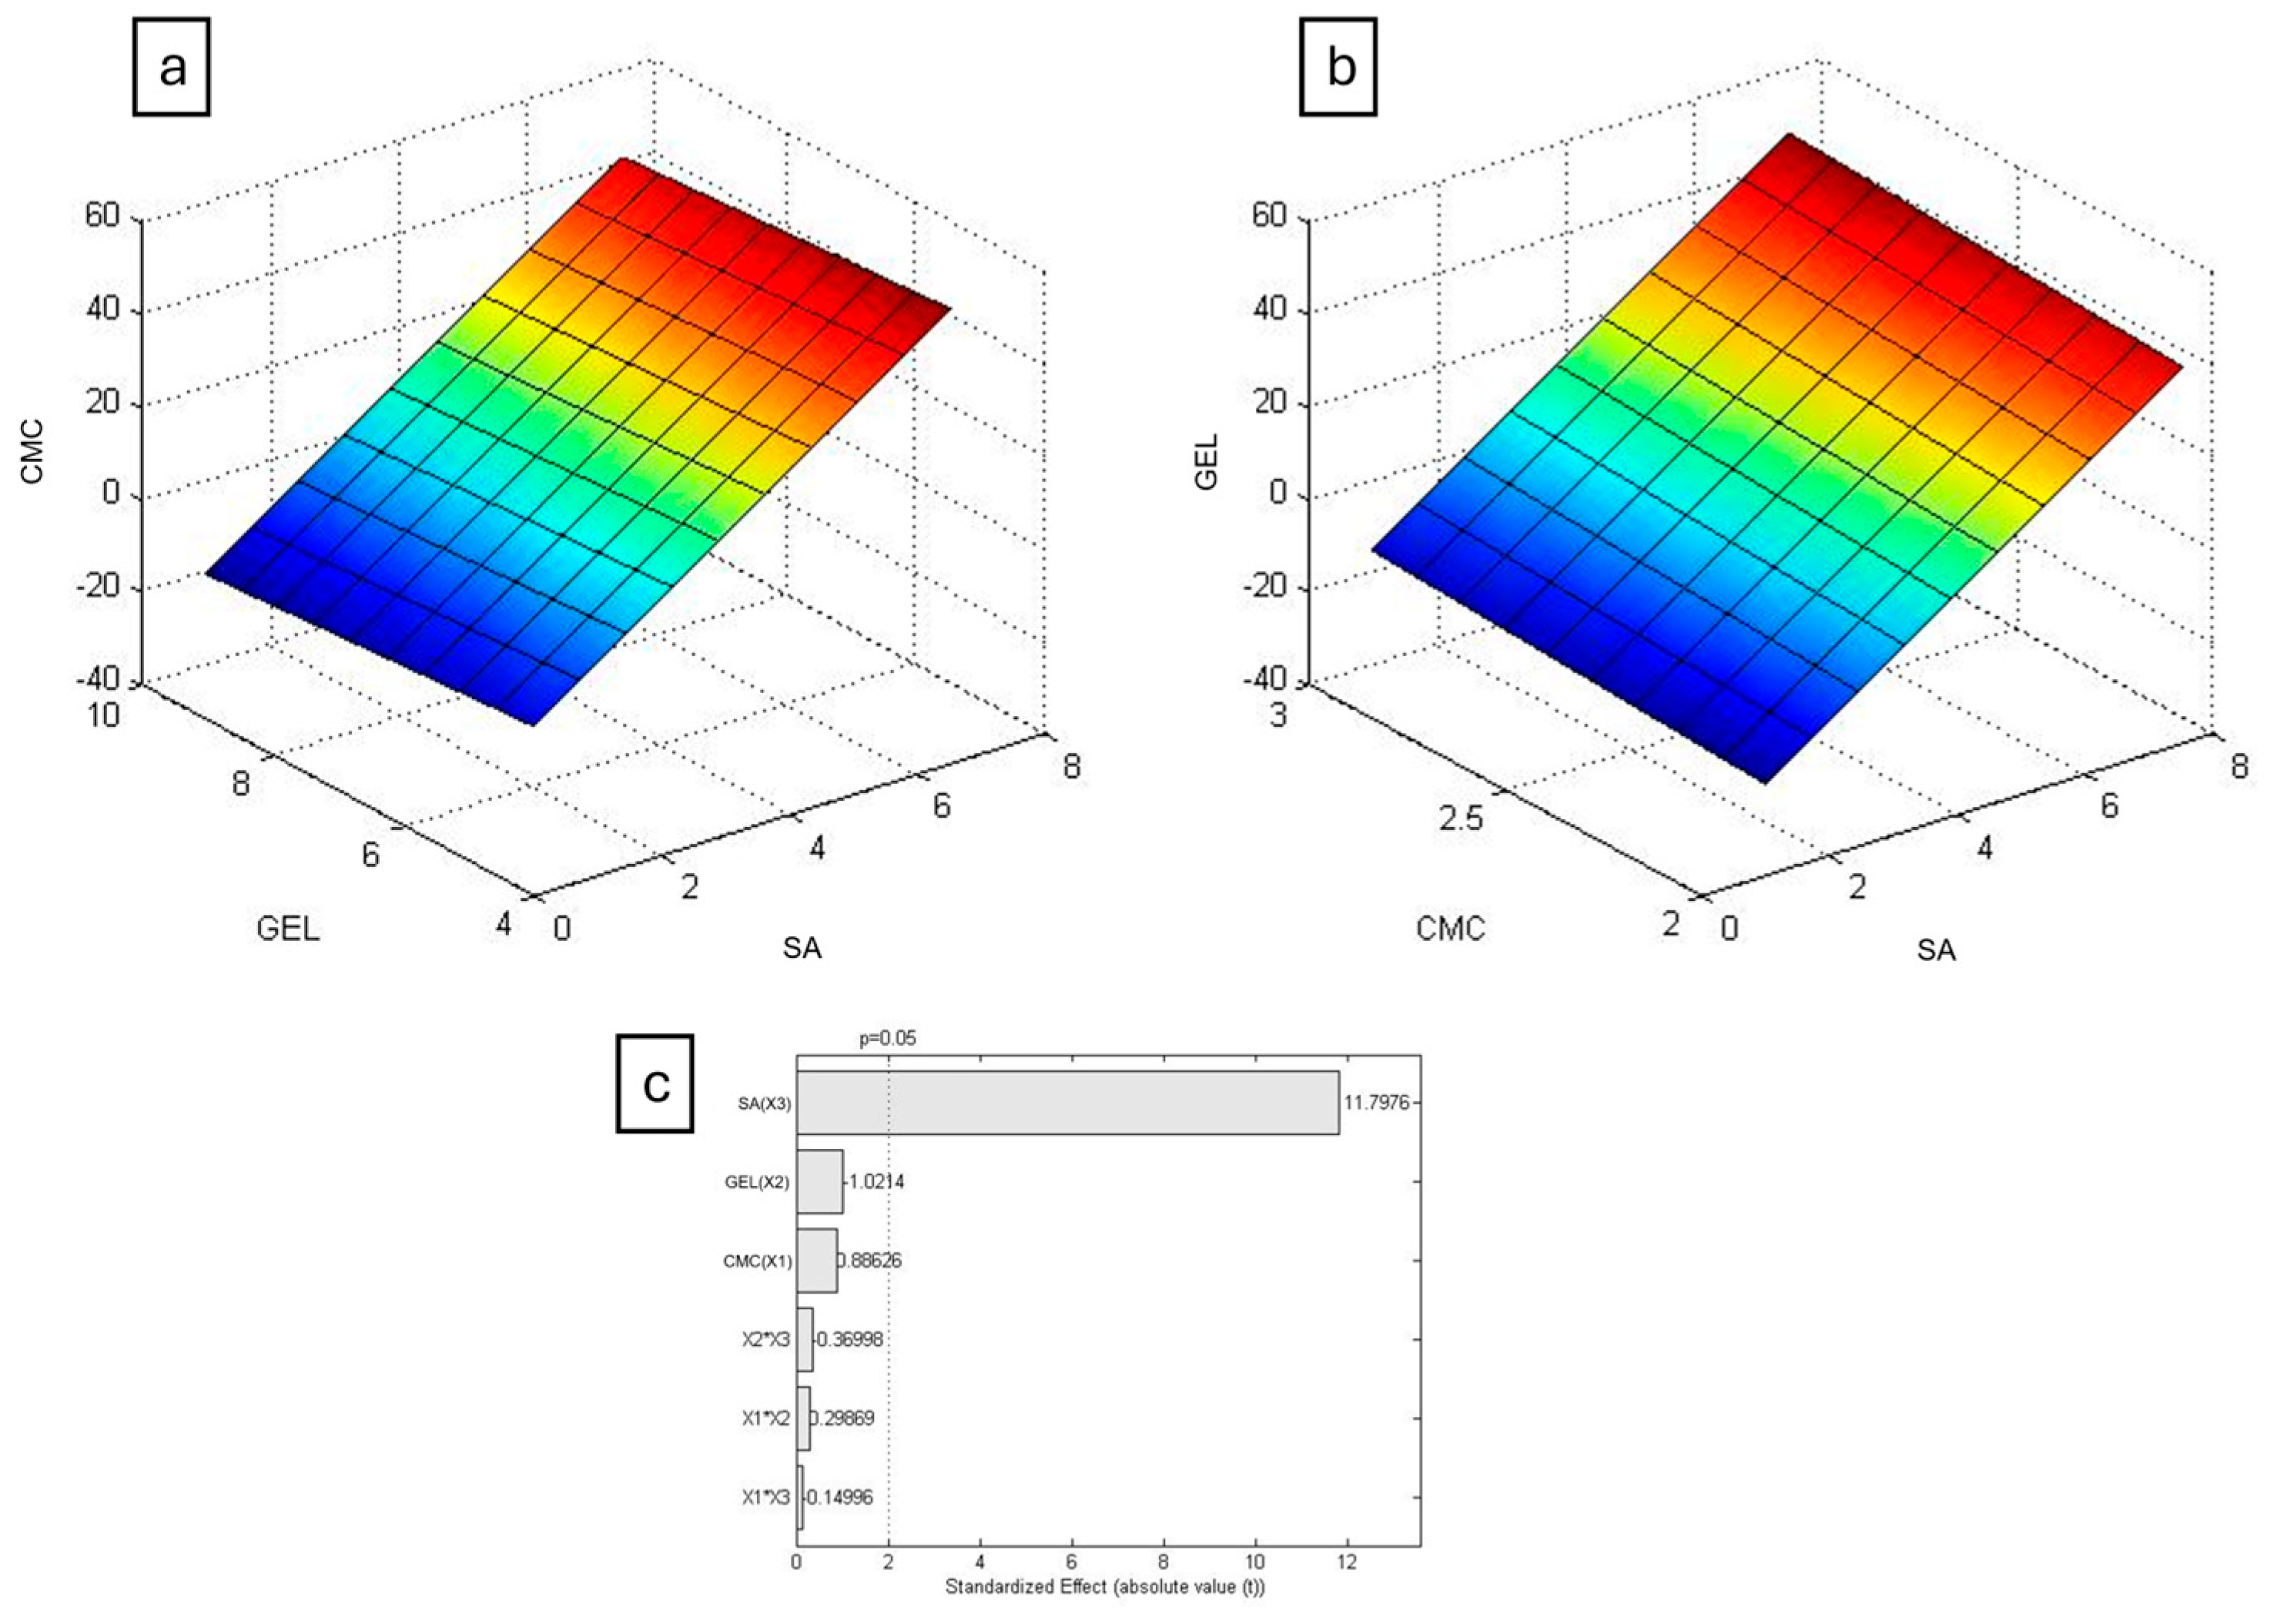
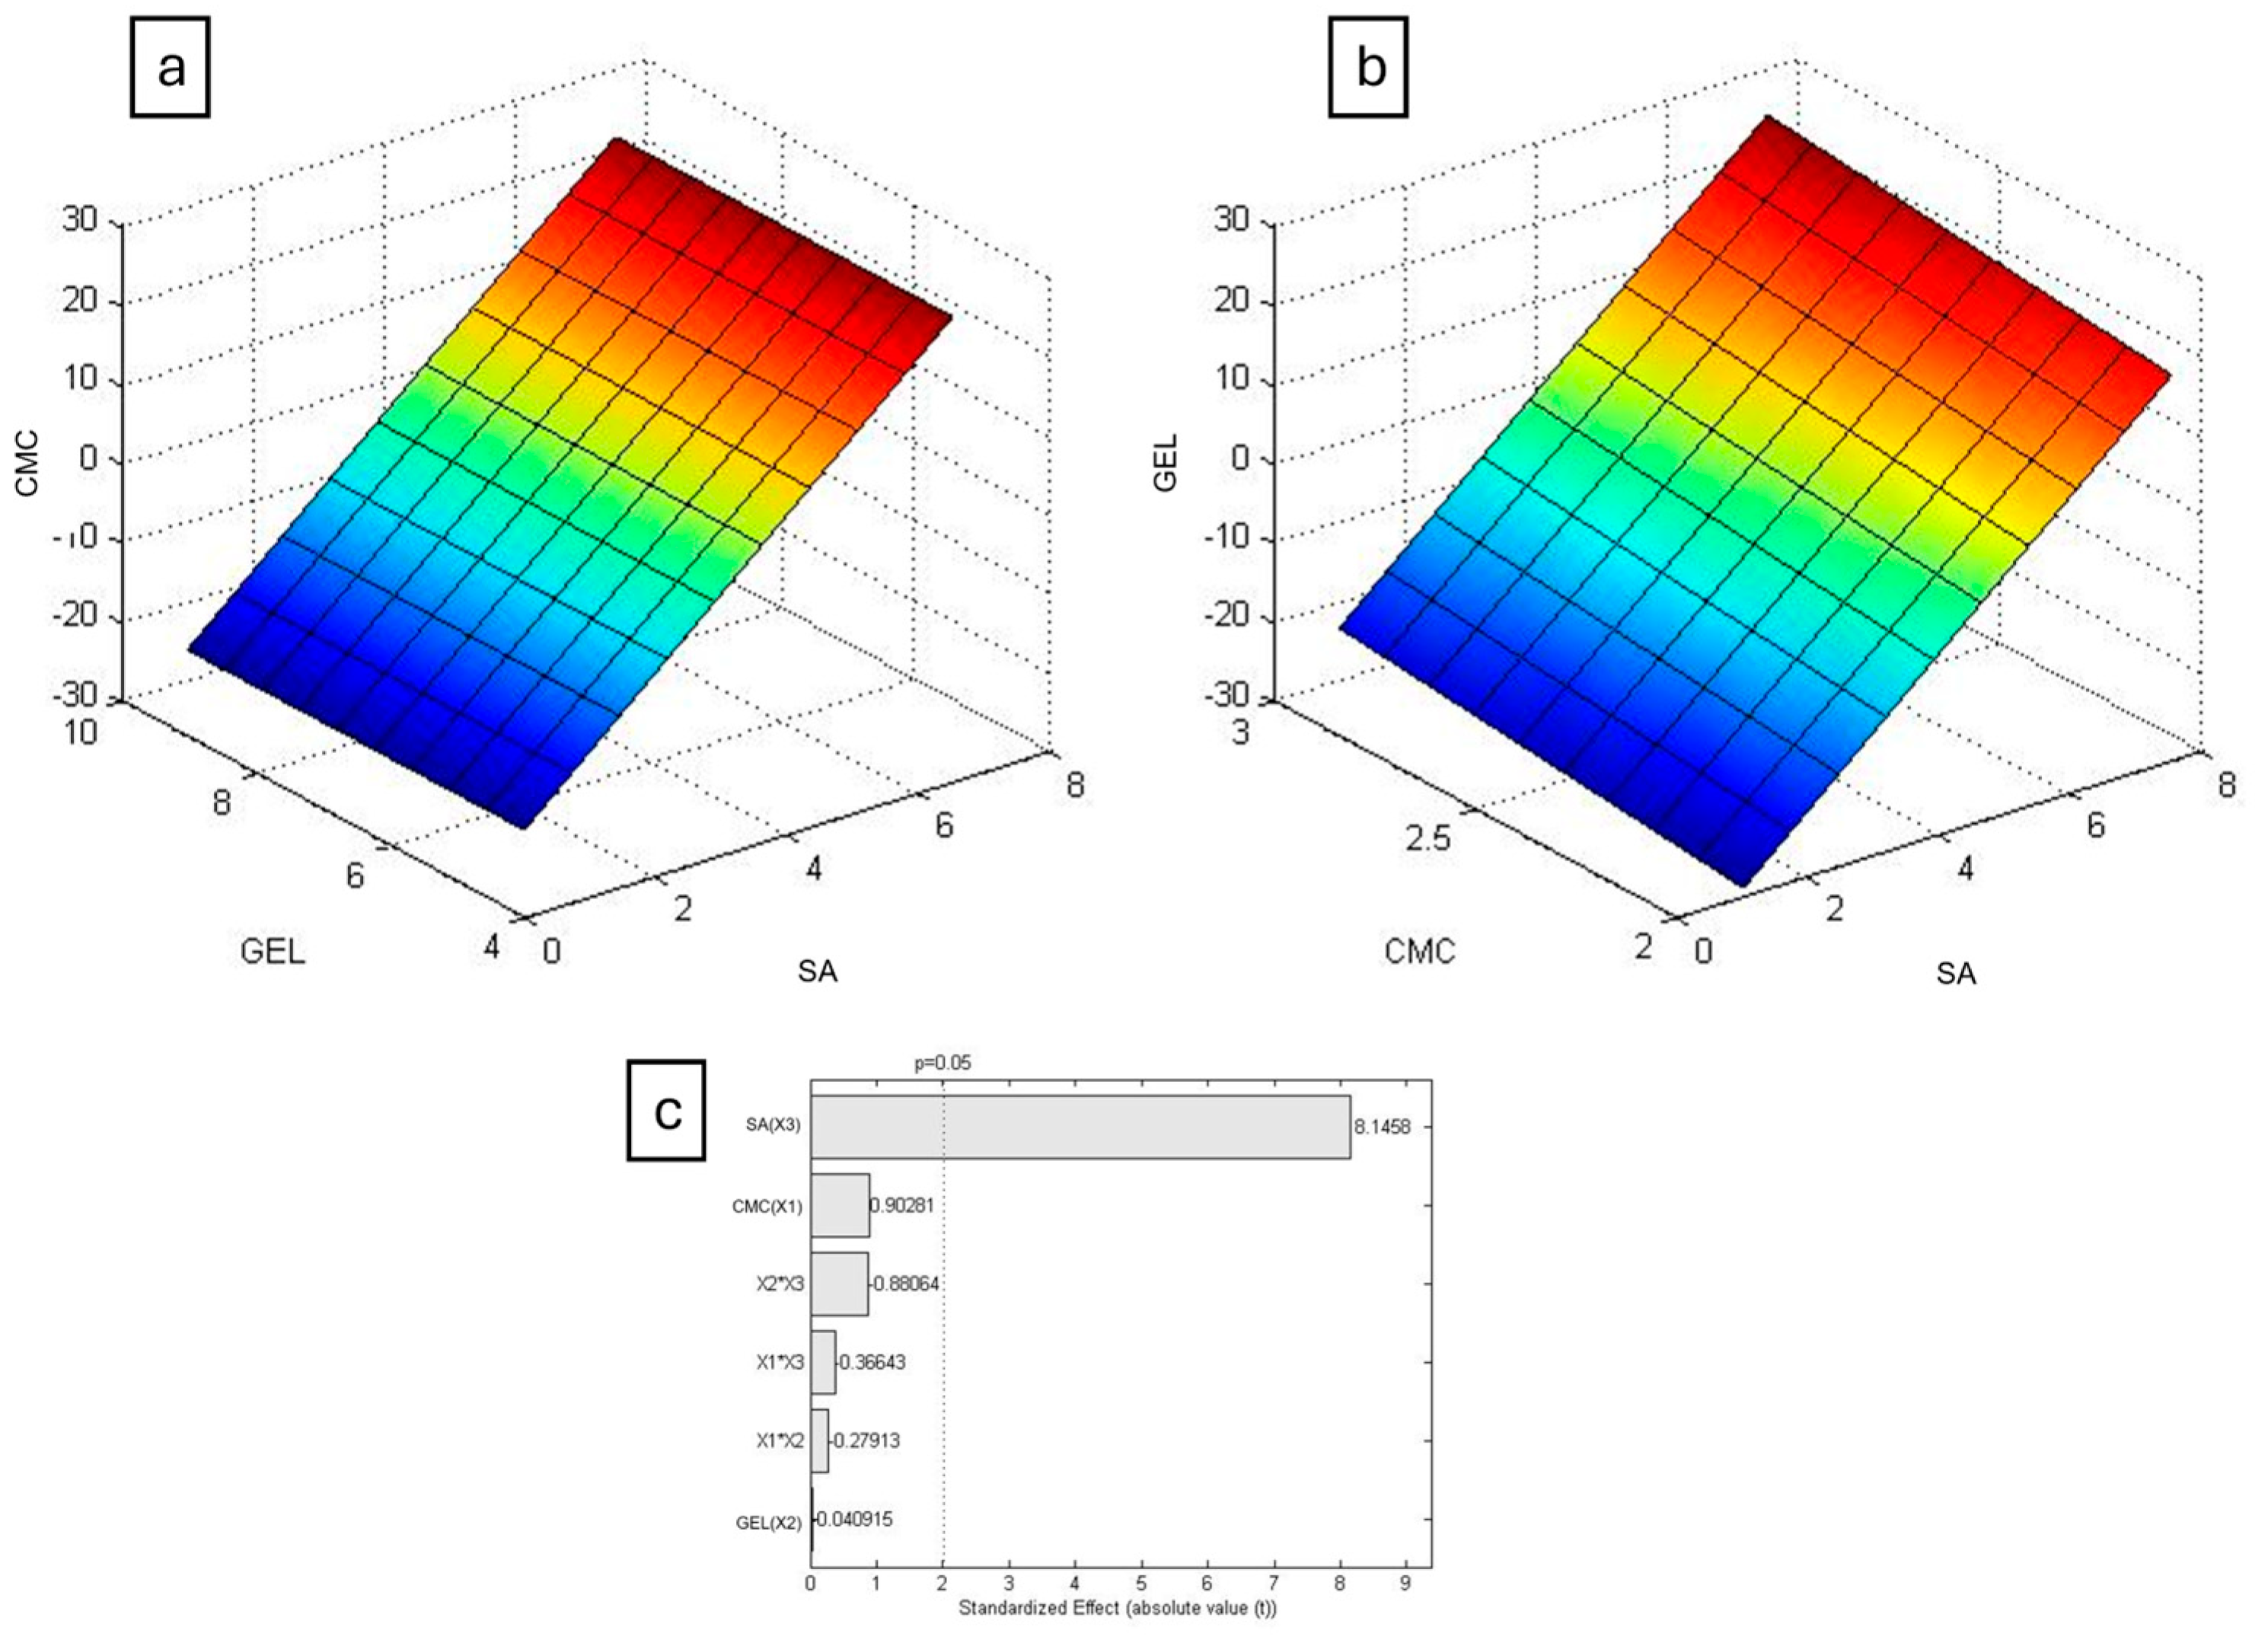
The results were plotted in Chemoface to create a response surface (
Figure 5 and
Figure 6), a three-dimensional graph illustrating how the swelling degree varies with respect to the concentrations of the polymers used. For both PBS and DMEM, the concentration of SA was the only statistically significant factor, as previously suggested.
Alginate gelation occurs by the formation of a three-dimensional network, known as the egg-box model, when Ca
2+ ions interacts ionically with glucuronic acid residues, as proposed by Grant et al. (1973) [
29]. It was observed that higher alginate concentrations resulted in firmer hydrogels, indicating that those mixtures achieved higher crosslinking rates, resulting in longer swelling times and lower degradation.
On the other hand, degradation likely occurs in the hydrogels once the Ca
2+ ions are released into the swelling environment. This is because it has been demonstrated that the swelling/degradation capability in SA hydrogels, crosslinked with calcium chloride, such as the ones produced in this study, is related to this event [
30].
In a previous study [
31], various hydrogels were produced using a different strategy, which involved mixing them in ternary combinations of Agar:CMC:GEL, resulting in 36 different combinations, with the highest SD found to be 21.32% in PBS. However, by changing agar to SA and utilizing CCD, it was possible to reduce the number of tested hydrogels to 17 and increase the SD to 33.83%. This demonstrates the advantages of the strategy employed in this study.
3.3. Printability of the Hydrogels
The first step in producing a 3D printed object is to create a computer-aided design (CAD) model. This model is then processed by software that converts it into codes, which are sent to the 3D printers. Unfortunately, the final printed form rarely matches its CAD model, a discrepancy that can be attributed to several factors, primarily the printability of a hydrogel. In general terms, printability can be defined as the ability to form and maintain a reproducible 3D structure with dimensional integrity. Printability is a crucial parameter to consider when using hydrogels in 3D printing, as hydrogels with good printability can more efficiently reproduce biomimetic structures [
32,
33].
Among all the produced hydrogels, the two with the highest swelling in both fluids were chosen for the printability assay: hydrogel 6 (36.33% in PBS and 13.28% in DMEM) and hydrogel 14 (33.67% in PBS and 11.56% in DMEM). Interestingly, both hydrogels contained the highest concentrations of SA: 6.2% for hydrogel 6 and 7.5% for hydrogel 14. Hydrogel 8 also exhibited high SD, but it was not selected due to its tendency to degrade faster in DMEM than hydrogel 14.
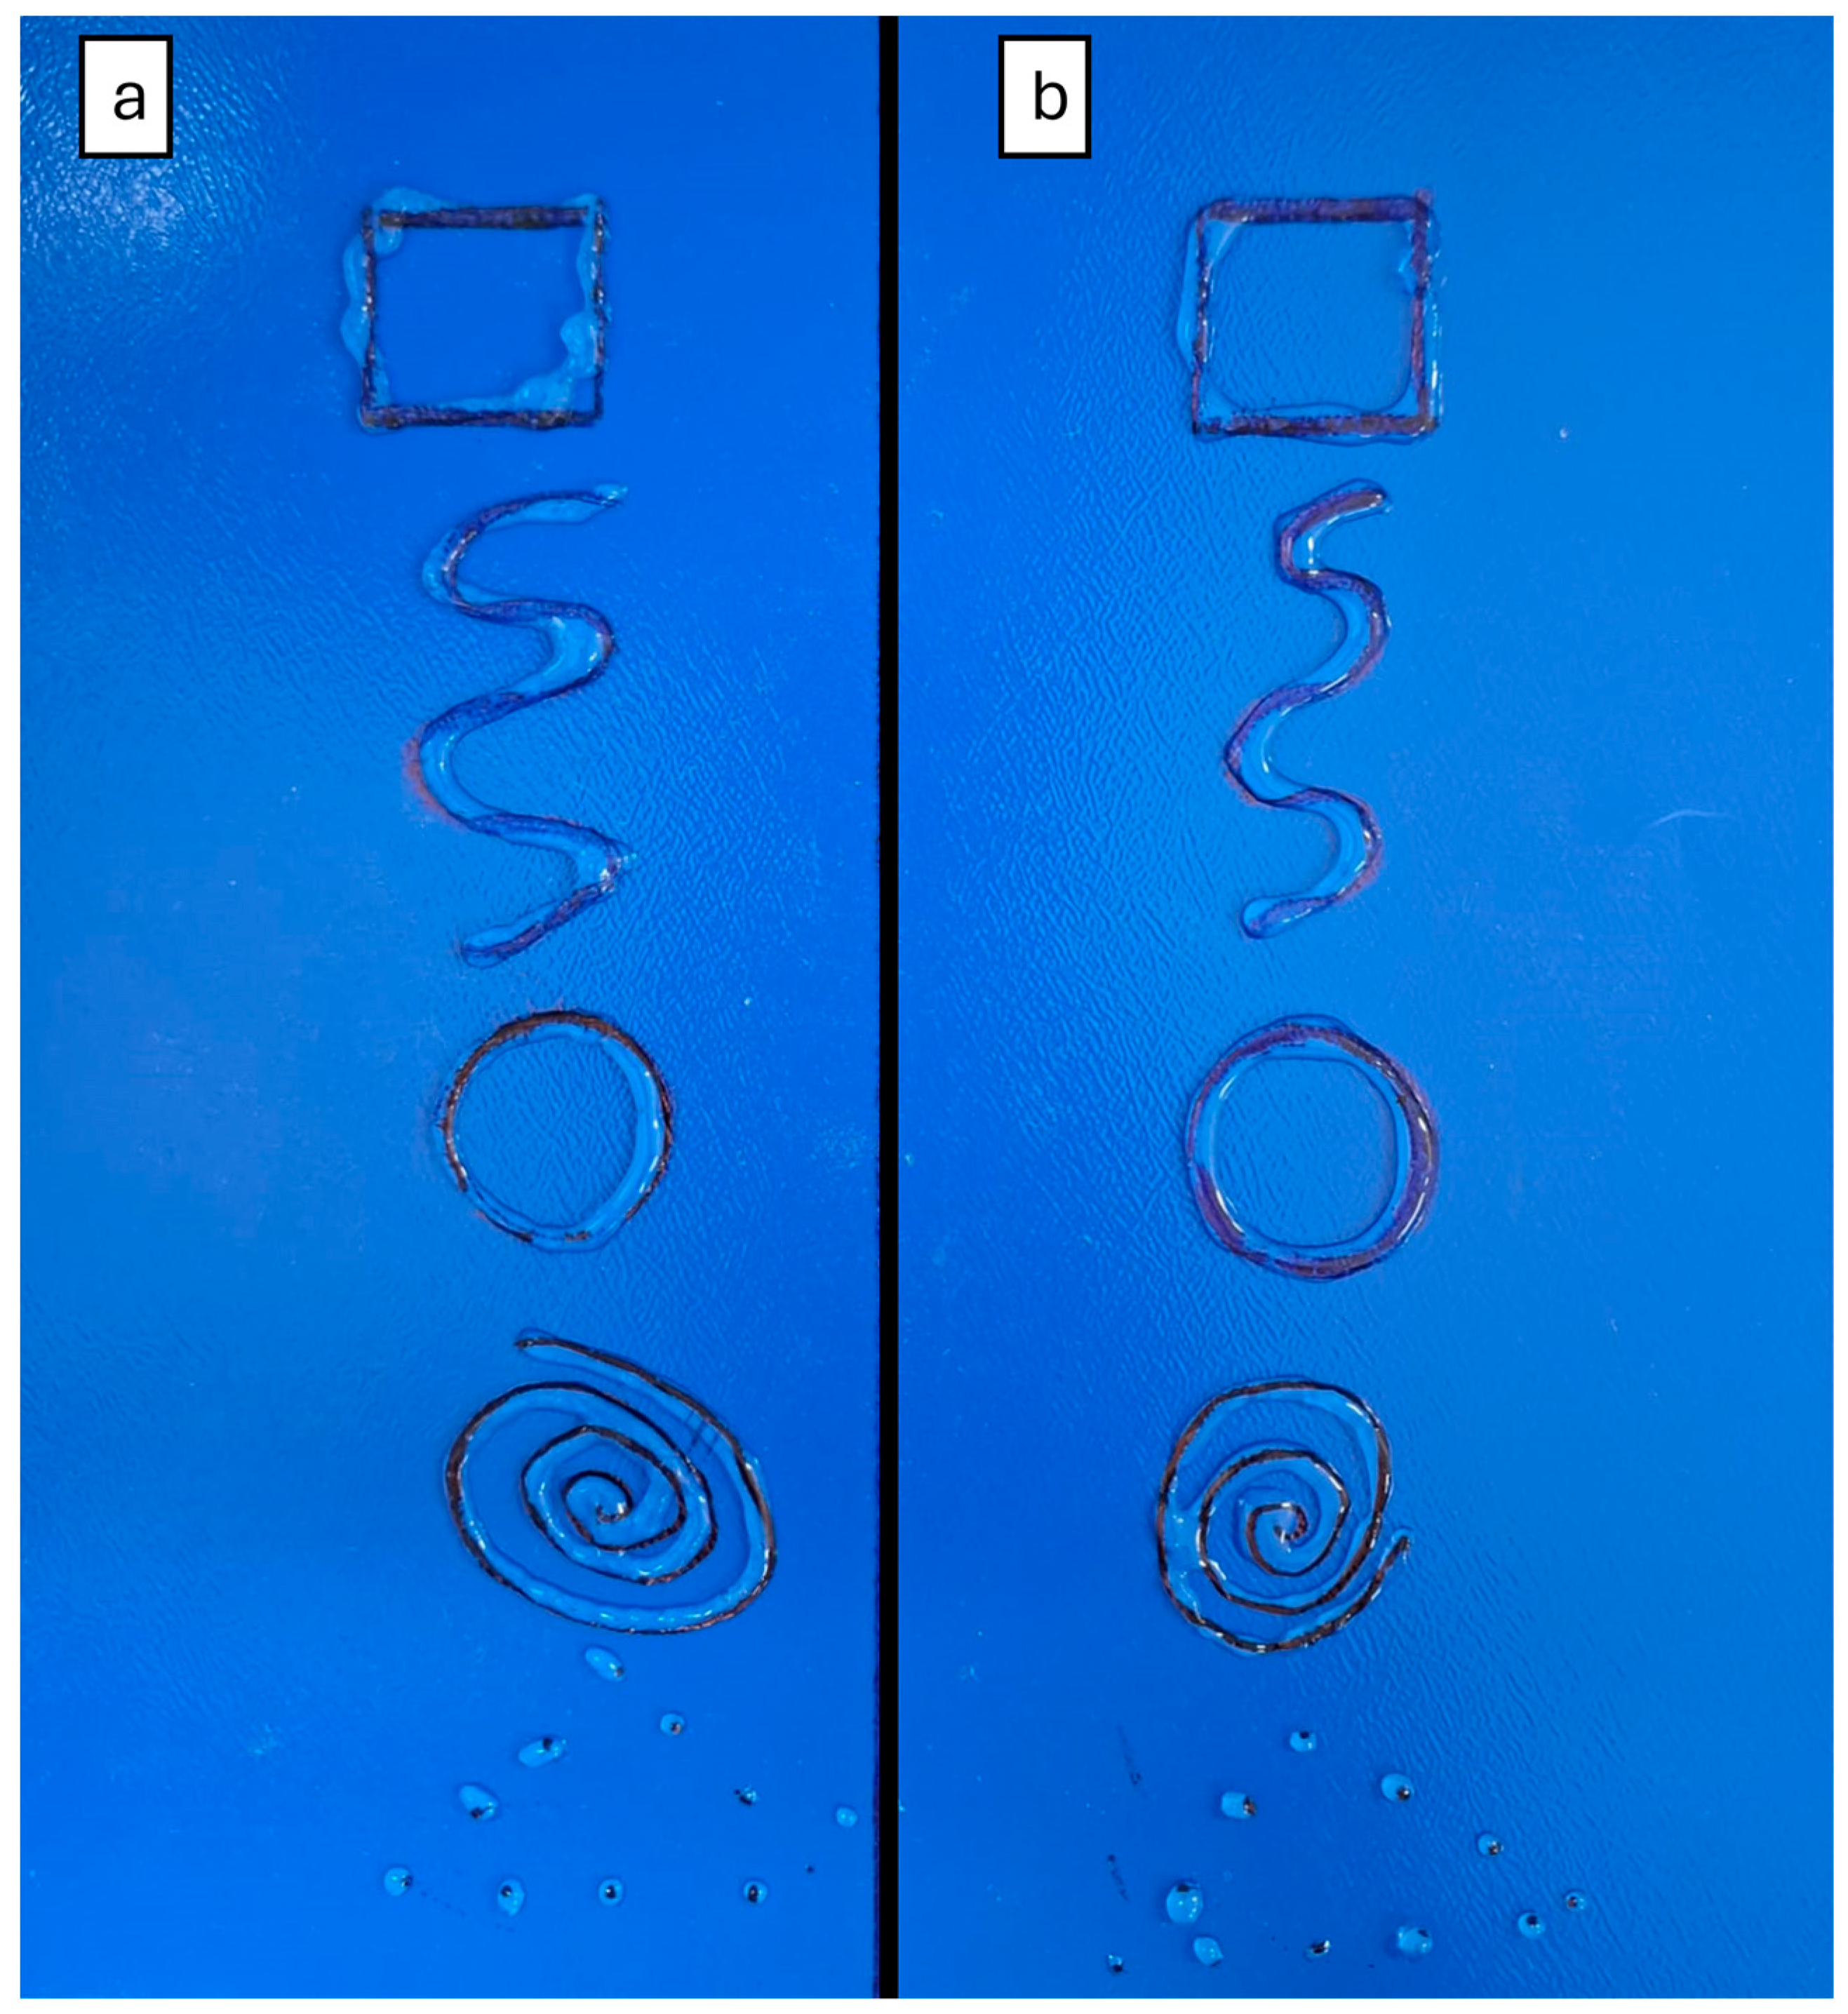
In manual extrusion tests, a two-dimensional (2D) assay, geometric forms were drawn and covered with the selected hydrogels to visually evaluate the hydrogel’s behavior, such as the formation of lumps or merged structures. These are considered undesirable parameters for hydrogels intended for 3D bioprinting applications [
31].
Figure 7 shows the two hydrogels after manual extrusion, with both exhibiting similar characteristics in the 2D assay.
Therefore, a 3D printing assay was performed using the Engine HR from Hyrel 3D. Micro-extrusion-based 3D printing technique involves the layer-by-layer deposition of a biomaterial (hydrogel) through a nozzle. The process begins with the generation of a CAD model of the desired structure, which serves as the digital blueprint. The biomaterial is prepared and loaded into a syringe-like cartridge and pushed through a nozzle, following the CAD model to create an object with the desired shape. Then, printability was assessed comparing the original CAD model to the final printed structures.
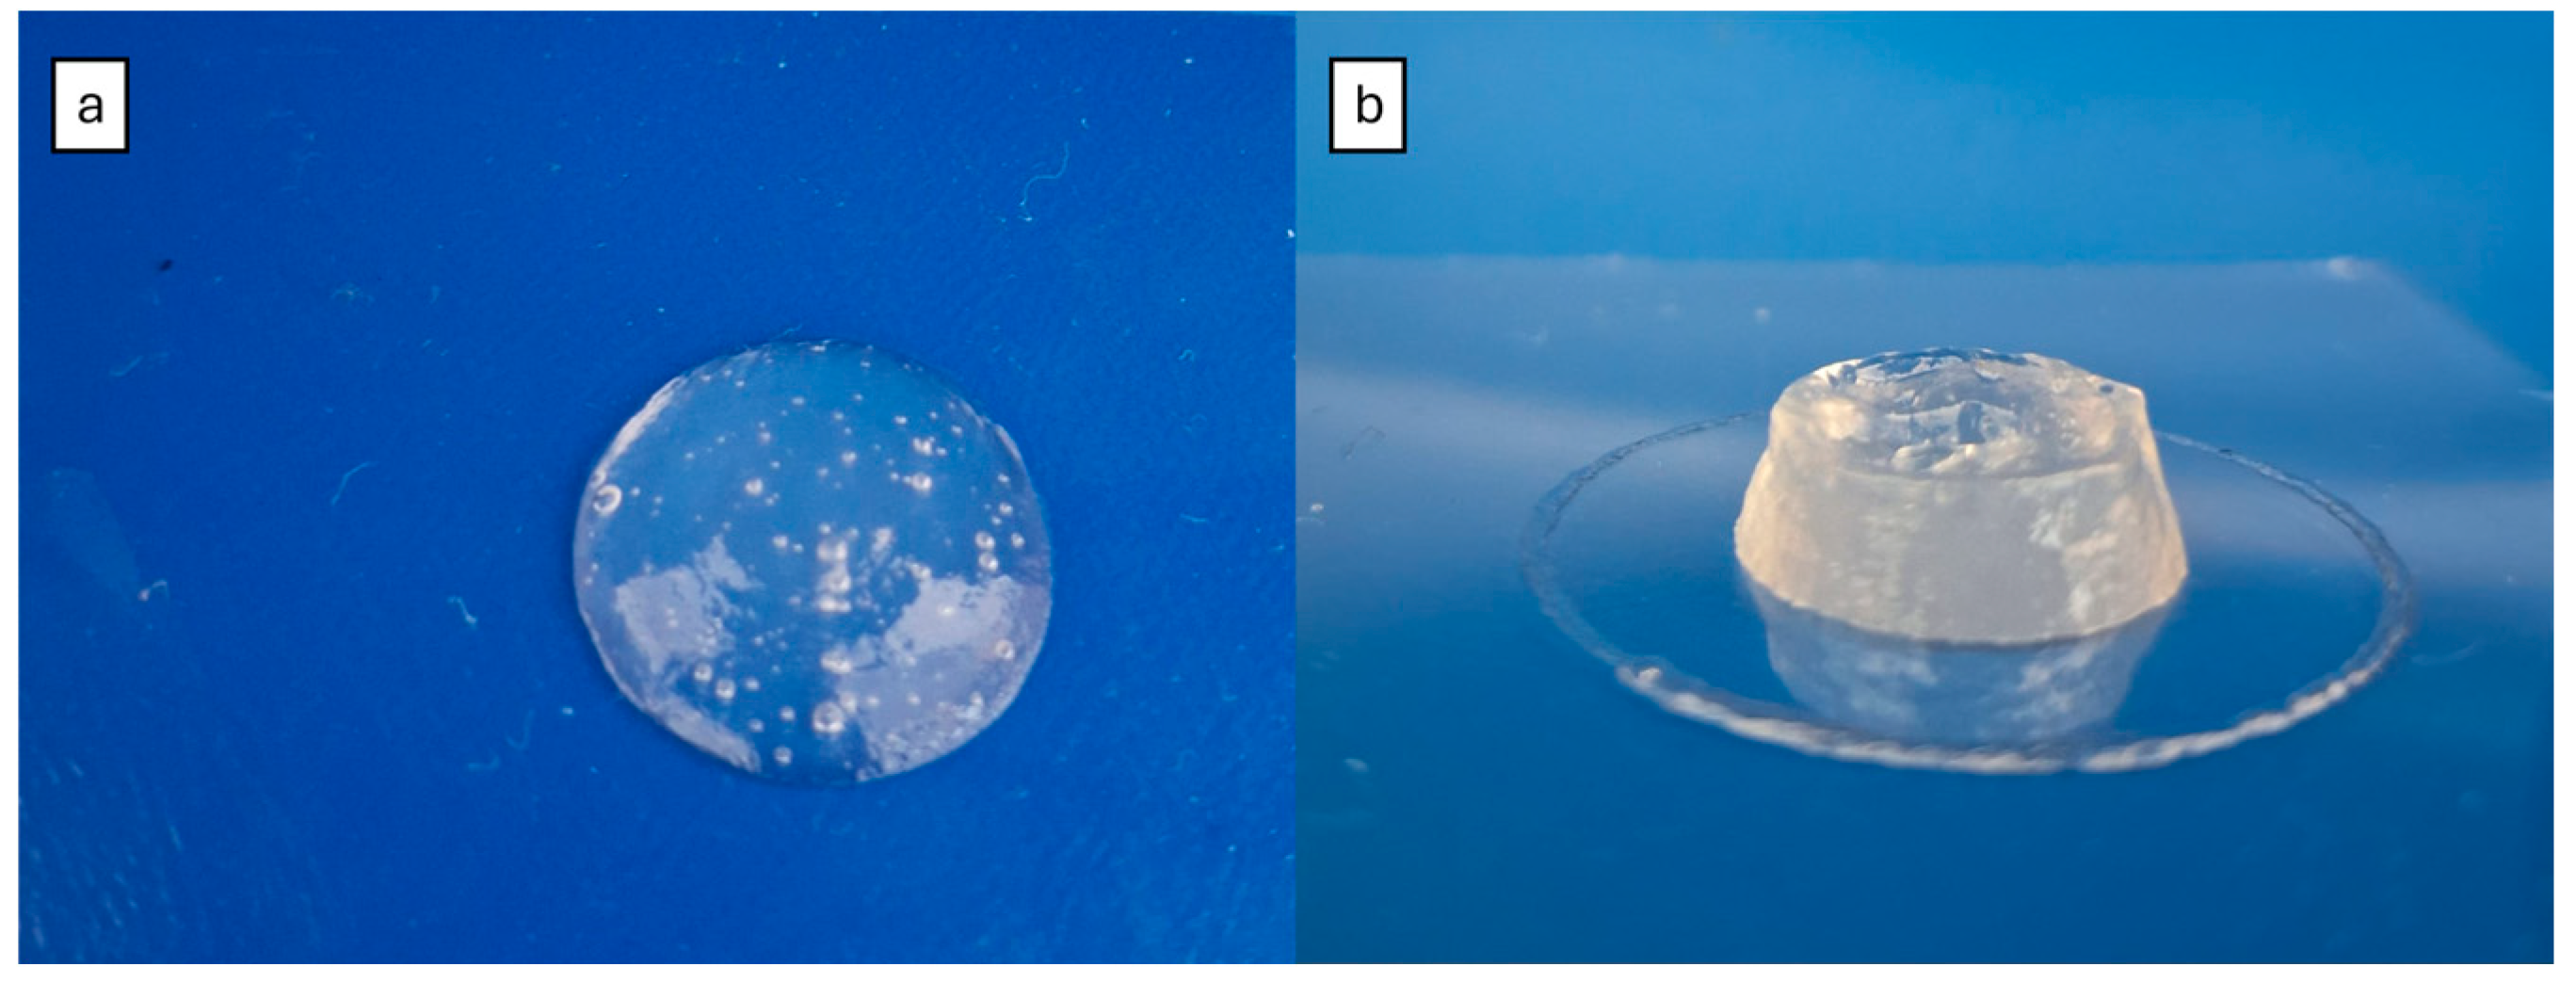
The cylinder structure formed with hydrogel 6 completely collapsed, forming a single lumped structure (
Figure 8a). In contrast, hydrogel 14 was able to form a 3D structure, with defined perimeters and a visible cylindrical form (
Figure 8b), indicating that it is a more suitable hydrogel for 3D printing.
Despite enhancing the mechanical strength of 3D bioprinted constructs, the crosslinking process of hydrogels is time-consuming. While the printing process is ongoing, the hydrogel may be in liquid or semi-liquid form and, consequently, may not acquire the CAD form [
34]. This is likely what happened to hydrogel 6, which presented a solid form with high swelling after crosslinking but proved to be unprintable.
Briefly, this study successfully optimized the production of hydrogels for 3D bioprinting using the CCD method. Hydrogel 14 emerged as the most promising candidate due to its swelling degree and 3D printability. These findings have significant implications for the development of advanced tissue engineering and drug delivery systems, with future research that can focus on further refining the hydrogel composition to enhance its mechanical properties and biocompatibility, as well as exploring its potential applications in various biomedical fields.
4. Conclusions
The present study focused on optimizing hydrogel formulations for 3D bioprinting applications, using the CCD method to systematically evaluate 15 different hydrogel mixtures. Key parameters such as swelling behavior and printability were assessed, emphasizing the critical role of hydrogel composition in determining print success. Notably, a hydrogels demonstrated superior performance, maintaining its 3D structure without the need for crosslinking agents. The results bullet pointed below highlight the potential for further experimentation with printing parameters to enhance quality and reproducibility:
This study aimed to optimize the production of hydrogels for 3D printing applications;
By employing the CCD method, it was possible to systematically evaluated 15 different hydrogel formulations, focusing on their swelling behavior and printability;
These findings highlight the importance of hydrogel composition in determining their suitability for 3D printing;
The CCD proved to be an excellent choice for enhancing the production process of hydrogels;
Out of the 15 different mixtures, two exhibited the highest SD in both PBS and DMEM in parallel: hydrogel 6, which contained 6.2% SA, 2.8% CMC, and 6% GEL; and hydrogel 14, which contained 7.5% SA, 2.5% CMC, and 7.5% GEL;
Despite presenting a solid form when crosslinked with calcium chloride, hydrogel 6 collapsed during the 3D printing assay, while hydrogel 14 was able to maintain a 3D form even without the crosslinking agent;
Therefore, hydrogel 14 is the most suitable for 3D printing process among all the studied mixtures;
Further experiment with different printing speeds, nozzle sizes, and temperature settings to enhance print quality and reproducibility may be produced to better understand the 3D printing parameters.
Author Contributions
Conceptualization: T.F.A. and L.P.S.; methodology, software, investigation, writing—original draft preparation, T.F.A.; formal analysis, writing—review and editing, supervision, funding acquisition, L.P.S. All authors have read and agreed to the published version of the manuscript.
Funding
This work was supported by the Brazilian agencies Coordenação de Aperfeiçoamento de Pessoal de Nível Superior (CAPES no. 23038.019088/2009-58), Conselho Nacional de Desenvolvimento Científico e Tecnológico (CNPq no. 311825/2021-4, 307853/2018-7, 408857/2016-1, 306413/2014-0, and 563802/2010-3), Fundação de Apoio à Pesquisa do Distrito Federal (FAPDF no. 193.001.392/2016), Empresa Brasileira de Pesquisa Agropecuária (Embrapa no. 23.17.00.069.00.02, 13.17.00.037.00.00, 21.14.03.001.03.05, 13.14.03.010.00.02, 12.16.04.010.00.06, 22.16.05.016.00.04, and 11.13.06.001.06.03), and Universidade de Brasília (UnB). This study was financed in part by the Coordenação de Aperfeiçoamento de Pessoal de Nível Superior – Brasil (CAPES) – Finance Code 001.
Data Availability Statement
Data are contained within this article.
Conflicts of Interest
The authors declare no conflicts of interest.
References
- Ullah, F.; Othman, M.B.H.; Javed, F.; Ahmad, Z.; Akil, H.M. Classification, processing and application of hydrogels: A review. Mater. Sci. Eng. C 2015, 57, 414–433. [Google Scholar] [CrossRef] [PubMed]
- Zhang, Y.S.; Khademhosseini, A. Advances in engineering hydrogels. Science 2017, 356, 1–10. [Google Scholar] [CrossRef] [PubMed]
- Naghieh, S.; Chen, X. Printability–A key issue in extrusion-based bioprinting. J. Pharm. Anal. 2021, 11, 564–579. [Google Scholar] [CrossRef] [PubMed]
- Bandyopadhyay, A.; Bose, S.; Das, S. 3D printing of biomaterials. MRS Bull. 2015, 40, 108–115. [Google Scholar] [CrossRef]
- Hanratty, N.; Khan, M.; McNally, C. The Role of Different Clay Types in Achieving Low-Carbon 3D Printed Concretes. Buildings 2024, 14, 1–26. [Google Scholar] [CrossRef]
- Huang, X.; Zhang, L.; Hang, J.; Quinn, T.; Nasar, N.K.A.; Lin, Y.; Hu, C.; Pang, X.; Chen, X.; Davis, T.P.; Qiao, R. 4D Printing Hybrid Soft Robots Enabled by Shape-Transformable Liquid Metal Nanoparticles. Adv. Mater. 2024, 2409789, 1–12. [Google Scholar] [CrossRef]
- Tian, Y.; Chen, C.; Xu, X.; Wang, J.; Hou, X.; Li, K.; Lu, X.; Shi, H.; Lee, E.; Jiang, H.B. A Review of 3D Printing in Dentistry: Technologies, Affecting Factors, and Applications. Scanning 2021, 1, 1–19. [Google Scholar] [CrossRef] [PubMed]
- Xie, S.; Cai, B.; Rasidi, E.; Yen, C.C.; Hsu, C.; Chow, H.T.; De Busscher, V.; Hsu, L.C. The use of a 3D-printed prosthesis in a Great Hornbill (Buceros bicornis) with squamous cell carcinoma of the casque. PLOS One. 2019, 14, 1–13. [Google Scholar] [CrossRef]
- Brahme, P.; Rarokar, N.; Kumbhalkar, R.; Saoji, S.; Khedekar, P. Natural and synthetic polymeric hydrogel: a bioink for 3D bioprinting of tissue models. J. Drug Deliv. Technol. 2024. [Google Scholar] [CrossRef]
- Pawar, S.N.; Edgar, K.J. Alginate derivatization: A review of chemistry, properties and applications. Biomaterials 2012, 33, 3279–3305. [Google Scholar] [CrossRef]
- Axpe, E.; Oyen, M.L. Applications of Alginate-Based Bioinks in 3D Bioprinting. Int. J. Mol. Sci. 2016, 17, 1–11. [Google Scholar] [CrossRef] [PubMed]
- Xiu, Q.; Chen, C.; Rosswurm, K.; Yao, T.; Janaswamy, S. A facile route to prepare cellulose-based films. Carbohydr. Polym. 2016, 149, 274–281. [Google Scholar] [CrossRef] [PubMed]
- Nashchekina, Y.; Militsina, A.; Elokhovskiy, V.; Ivan’kova, E.; Nashchekin, A.; Kamalov, A.; Yudin, V. Precisely Printable Silk Fibroin/Carboxymethyl Cellulose/Alginate Bioink for 3D Printing. Polymers 2024, 16, 1–19. [Google Scholar] [CrossRef]
- Xu, L.; Wang, Y.; Yang, Y.; Qiu, C.; Jiao, A.; Jin, Z. Pea protein/carboxymethyl cellulose complexes prepared using a pH cycle strategy as stabilizers of high internal phase emulsions for 3D printing. Int. J. Biol. Macromol. 2024, 269, 1–11. [Google Scholar] [CrossRef] [PubMed]
- Barrentine, L.B. An Introduction to Design of Experiments: a simplified approach, 1st ed.; Quality Pres.: Wisconsin, United States of America, 1999; pp. 1–13. [Google Scholar]
- Jankovic, A.; Chaudhary, G.; Goia, F. Designing the design of experiments (DoE) – An investigation on the influence of different factorial designs on the characterization of complex systems. Energy Build. 2021, 250, 1–12. [Google Scholar] [CrossRef]
- Montgomery, D.C. Design and Analysis Of Experiments, 9th ed.; John Wiley & Sons; Arizona, United States of America, 2017; pp. 1 – 21.
- Beg, S.; Swain, S.; Rahman, M.; Hasnain, M.S.; Imam, S.S. Application of Design of Experiment (DoE) in Pharmaceutical Product and Process Optimization. In Pharmaceutical Quality by Design. 1st ed.; S., Beg, Md.S., Hasnain, Eds.; Academic Press, Massachusetts, United States of America; pp. 43–64. [CrossRef]
- Granato, D.; Calado, V.M.A. The use and importance of design of experiments (DOE) in process modelling in food science and technology. In Mathematical and Statistical Methods in Food Science and Technology, 1st ed.; Granato, D., Ares, G., Eds.; John Wiley & Sons; Arizona, United States of America, 2014. pp. 3–18. [CrossRef]
- Battacharya, S. Central Composite Design for Response Surface Methodology and Its Application in Pharmacy. In Response Surface Methodology in Engineering Science, 1st ed.; Kayaroganam, P., Ed.; IntechOpen: London, United Kingdom, 2021; pp. 1–19. [Google Scholar] [CrossRef]
- Bezerra, M.A.; Santelli, R.E.; Oliveira, E.P.; Villar, L.S.; Escaleira, L.A. Response surface methodology (RSM) as a tool for optimization in analytical chemistry. Talanta 2008, 76, 965–977. [Google Scholar] [CrossRef]
- Kumar, A.; Shende, D.; Wasewar, K. Central Composite Design Approach for Optimization of Levulinic Acid Separation by Reactive Components. Ind. Eng. Chem. Res. 2021, 60, 13692–13700. [Google Scholar] [CrossRef]
- De Zordi, N.; Cortesi, A.; Kikic, I.; Moneghini, M.; Solinas, D.; Innocenti, G.; Portolan, A.; Baratto, G.; Dall’Acqua, S. The supercritical carbon dioxide extraction of polyphenols from Propolis: A central composite design approach. J. Supercrit. Fluids. 2014, 95, 491–498. [Google Scholar] [CrossRef]
- Nunes, C.A.; Freitas, M.P.; Pinheiro, A.C.M.; Bastos, S.C. Chemoface: a novel free user-friendly interface for chemometrics. J. Braz. Chem. Soc. 2012, 23, 2003–2010. [Google Scholar] [CrossRef]
- Teófilo, R.F.; Ferreira, M. Chemometrics II: spreadsheets for experimental design calculations, a tutorial. Quím. nova, 2006; 29, 338–20. [Google Scholar] [CrossRef]
- Neto, L.A.A.; Silva, L.P. Influence of biopolymer composition and crosslinking agent concentration on the micro- and nanomechanical properties of hydrogel-based filaments. J Mech Behav Biomed Mater. 2024, 150, 1–10. [Google Scholar] [CrossRef]
- Vaz, G.R.M. Printability of bioink for 3D extrusion bioprinting processes: design approach and printing parameters. Dissertation. Molecular Biology Post-graduate Program. University of Brasília, Brazil, 2021.
- Bajpai, S.K.; Sharma, S. Investigation of swelling/degradation behavior of alginate beads crosslinked with Ca2+ and Ba2+ ions. React. Funct. Polym. 2004, 59, 129–140. [Google Scholar] [CrossRef]
- Grant, G.T.; Morris, E.R.; Rees, D.A.; Smith, P.J.C.; Thom, D. Biological interactions between polysaccharides and divalent cations: the egg-box model. FEBS Lett. 1973, 32, 195–198. [Google Scholar] [CrossRef]
- Tavakoli, J.; Laisak, E.; Gao, M.; Tang, Y. AIEgen quantitatively monitoring the release of Ca2+ during swelling and degradation process in alginate hydrogels. Mater. Sci. Eng. C 2019, 104, 1–6. [Google Scholar] [CrossRef] [PubMed]
- Araujo, T.F.; Silva, L.P. Completely Green Synthesis of Antimicrobial Nanocomposites Based on Hydrogels Containing Silver Nanoparticles for 3D Biofabrication of Smart Scaffolds. J. Polym. Environ. 2022, 30, 2751–2758. [Google Scholar] [CrossRef]
- Naghieh, S.; Sarker, M.D.; Sharma, N.K.; Barhoumi, Z.; Chen, X. Printability of 3D Printed Hydrogel Scaffolds: Influence of Hydrogel Composition and Printing Parameters. Appl. Sci. 2020, 10, 1–18. [Google Scholar] [CrossRef]
- Rodríguez-Rego, J.M.; Mendoza-Cerezo, L.; Mendoza-Cerezo, A.; Carrasco-Amador, J.P.; Marcos-Romero, A.C. Methodology for characterizing the printability of hydrogels. Int J Bioprint. 2023, 9, 280–291. [Google Scholar] [CrossRef]
- Fu, Z.; Naghieh, S.; Xu, C.; Wang, C.; Sun, W.; Chen, X. Printability in extrusion bioprinting. Biofabrication 2021, 13, 1–10. [Google Scholar] [CrossRef]
|
Disclaimer/Publisher’s Note: The statements, opinions and data contained in all publications are solely those of the individual author(s) and contributor(s) and not of MDPI and/or the editor(s). MDPI and/or the editor(s) disclaim responsibility for any injury to people or property resulting from any ideas, methods, instructions or products referred to in the content. |
© 2024 by the authors. Licensee MDPI, Basel, Switzerland. This article is an open access article distributed under the terms and conditions of the Creative Commons Attribution (CC BY) license (http://creativecommons.org/licenses/by/4.0/).

