Preprint
Article

Thermal Deformation Behavior and Consitutive Equation of Uranium-50wt.%Zirconium Nuclear Fuel

Altmetrics

Downloads

39

Views

15

Comments

0

Submitted:

24 September 2024

Posted:

30 September 2024

You are already at the latest version

Alerts
Abstract
In order to study the thermal deformation behavior of uranium-50wt.%zirconium, used Gleeble 3800 thermal simulation testing machine to carry out compression deformation experiments at different temperatures for this material. The effects of deformation temperature and strain rate on the alloy were studied. The results show that the peak stress of U-50wt.%Zr metallic fuel decreases with the increase of deformation temperature after thermal deformation at 500°C~600°C, especially at 600°C compared with that at 500°C and 550°C. At the same temperature, the peak stress increases with the increase of strain rate, especially the peak stress at strain rate 0.1s-1 and 1s-1 is significantly higher than that at strain rate 0.01s-1, and then the microstructure and diffraction results of U-50wt.%Zr metal-type fuel after thermal deformation are compared and analyzed, and the Arrhenius-type constitutive equation and thermal proces550℃,έ=1s-1 diagram of U-50wt.%Zr metal-type fuel are established based on the peak stress.
Keywords: 
Subject: Chemistry and Materials Science  -   Metals, Alloys and Metallurgy

1. Introduction

There are two major types of fast reactor fuel forms used internationally: ceramic fuel and metal fuel. Metal fuel is characterized by high thermal conductivity, low fuel temperature, and high safety margin. Research and development of metal fuel mainly focus on U-Zr alloy and U-Pu-Zr alloy, which are widely used in reactors. Advanced technology fuel (ATF) helps to increase the heat transfer rate and reduce the stored energy in the reactor core. For the use of light water reactors (LWR), the design goal is to develop a high thermal conductivity fuel alternative to the currently used uranium dioxide (UO2) ceramic fuel form in LWR. Although UO2 has many attractive characteristics as nuclear fuel, its biggest drawback is its extremely low thermal conductivity. Therefore, when the fuel operates at high temperatures, it requires a significant amount of time to remove the residual heat after the reactor shutdown. This can be a particularly prominent issue in the event of core cooling failure. Therefore, there is a strong incentive to develop high thermal conductivity fuels. Generally, metal alloy fuels have excellent thermal properties. However, irradiation of metal fuels often leads to severe volume expansion and significant release of fission gases. In these aspects, U-50wt.%Zr alloy stands as an exception. This specific alloy, U-50wt.%Zr, exists in a δ-UZr2 phase structure below 600℃. Utilizing the δ-UZr2 phase, a high thermal conductivity nuclear fuel form can be developed that operates at low temperatures (below 600℃) and can easily remove residual heat. Adopting this fuel form in commercial LWR systems will enhance the safety threshold and reduce the likelihood of serious accidents due to insufficient fuel cooling. Currently, the failure mode impact and analysis for LWR is based on limited performance data from UO2 fuel in LWR and the metal fuel form U-10wt.%Zr used in sodium-cooled fast reactors. However, knowledge about U-50wt.%Zr fuel is insufficient for failure mode impact and quantitative analysis. Therefore, studying the model of temperature, stress, and strain distribution of U-50wt.%Zr alloy over time is crucial for evaluating the reliability of metal fuel performance and accelerating the engineering application of new nuclear fuel technologies—e.g., [1].
Internationally, in order to safely and effectively utilize the U-Zr alloy system as nuclear fuel, extensive research has been conducted on its phase stability and microstructure across various temperatures and compositions. Depending on temperature and composition, the U-Zr alloy system exhibits a multitude of stable intermetallic phases. Specifically, U-10wt.%Zr fuel comprises a dual-phase structure of orthorhombic α-U and hexagonal δ-UZr2, while U-80wt.%Zr features a dual-phase structure of hexagonal α-Zr and δ-UZr2. U-50wt.%Zr metal-type fuel can achieve a δ-UZr2 structure. In response to the δ-UZr2 structure, the Idaho National Laboratory has conducted research on various thermophysical and mechanical properties of as-cast U-50wt.%Zr metal-type fuel, including phase transition temperature, thermal diffusivity, specific heat, thermal expansion, thermal conductivity, hardness, elastic modulus, yield strength, and preliminary creep rate—e.g., [2]. The study found that compared to other U-Zr alloy systems, the δ-UZr2 structure exhibits very small volume expansion and fission gas release. The quantitative results of this study are shown in Table 1 below, with the last row of data (sample Zr1) corresponding to the δ-UZr2 phase sample —e.g., [3].
The degree of fission gas release and volume expansion in δ-UZr2 samples is significantly lower than that exhibited by other U-Zr compositions. Due to its excellent thermal conductivity and low expansion rate, it is being considered as a nuclear fuel for sodium-cooled fast reactors—e.g.,[4]. In fast reactors, nuclear fuel operates in an environment of high neutron flux (>1015 n/cm2) and stress (100MPa) at peak cladding temperatures (600℃). In this environment, various thermomechanical phenomena such as cladding thermal creep, nuclear fuel expansion, and thermomechanical effects on the core and cladding occur. At the same time, metal fuel is subjected to extreme conditions such as compressive deformation and large temperature gradients in the reactor, which can lead to complex thermal deformation of the fuel. This deformation can affect fuel performance—e.g., [5]. Therefore, optimizing the processing technology of nuclear fuel is of great significance for the operation and design of reactors. In order to prepare samples of different sizes, it is necessary to explore pressure processing techniques, but there are few research reports on the rheological stress of U-50wt.%Zr metal-type fuel during thermal compression.
This article utilizes the Gleeble3800 thermal simulator to conduct thermal compression tests on δ-UZr2 samples of U-50wt.%Zr metallic fuel. It analyzes the effects of temperature and strain rate on its true stress-true strain curve, studies the thermal deformation behavior and microstructure of the samples after thermal deformation, and establishes the constitutive equation and thermal processing diagram of the δ-UZr2 phase of U-50wt.%Zr metallic fuel.

2. Materials and Methods

1.1. Experimental Materials

Under vacuum, U-50wt.%Zr (U-72at%Zr) metal-type fuel was prepared using high-frequency induction melting furnace, utilizing metal uranium and zirconium metal with a purity of 99.9%. Figure 1 shows the crucible system of the high-frequency induction furnace, the ingot after melting, and the cut-open ingot. From the figure, it can be observed that the ingot exhibits metallic luster, indicating good melting. The ingot after melting was cut open along the diameter direction.

1.2. Test Method

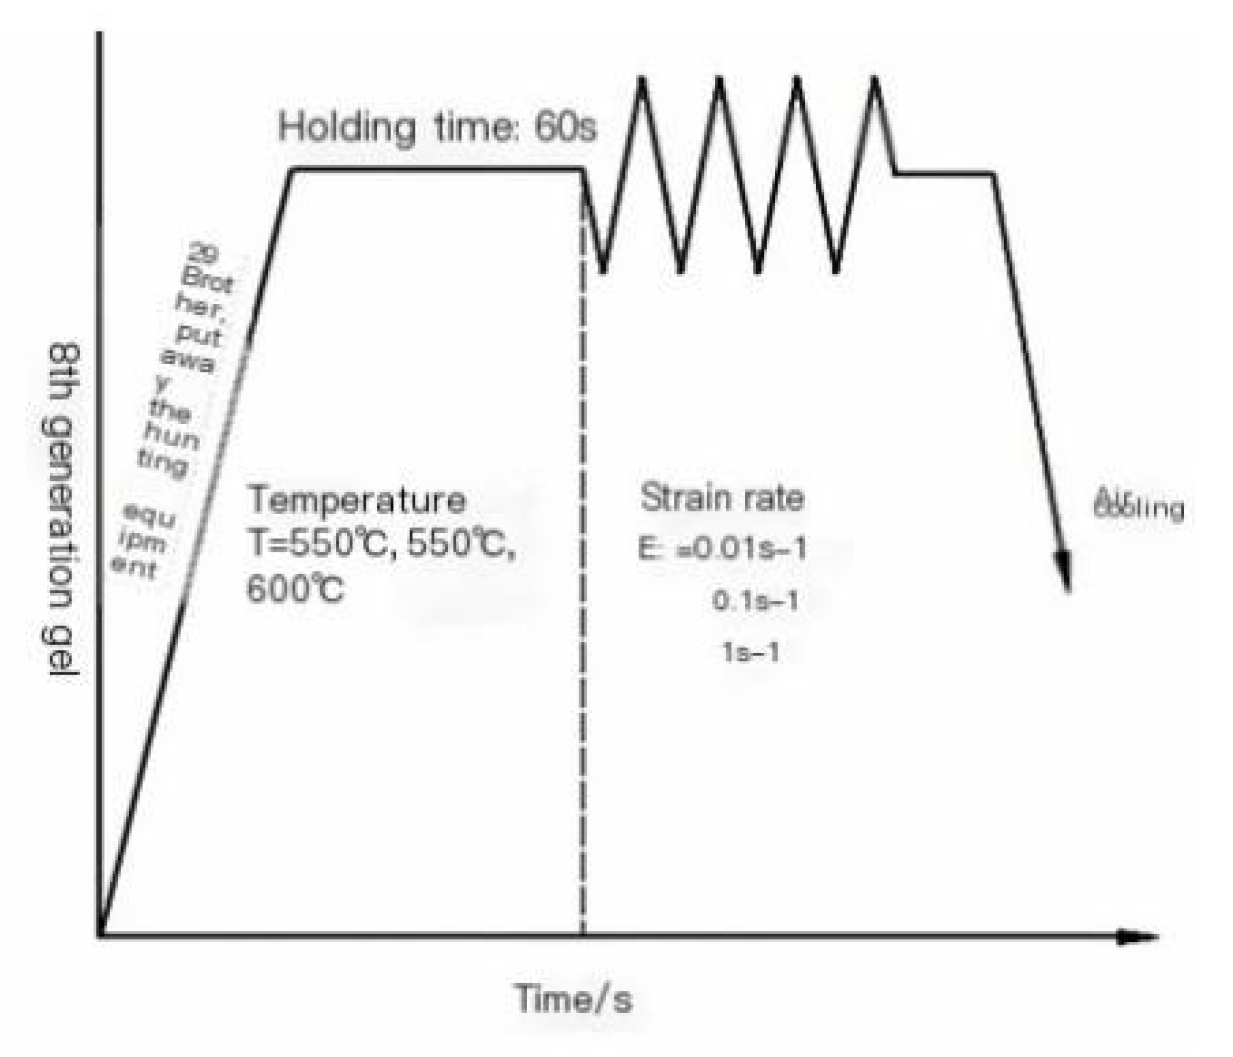
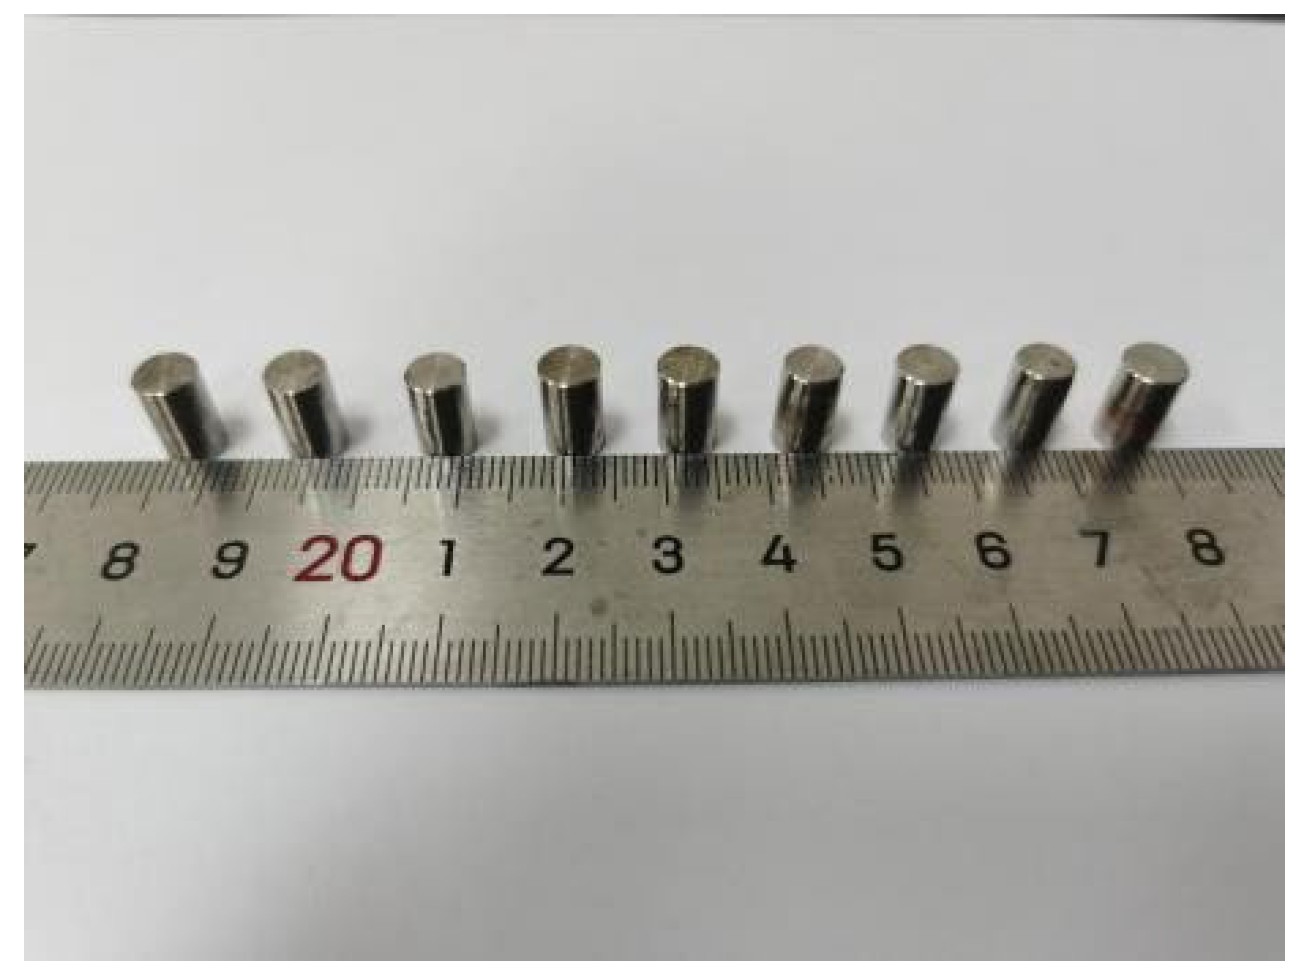
This experiment conducted a hot compression test on U-50wt.%Zr metallic fuel using a Gleeble3800 thermal simulator to study the hot deformation behavior of U-50wt.%Zr at temperatures ranging from 500℃ to 600℃. The upper end of the ingot was cut into a cylinder by wire cutting and machined into a φ6×10mm cylindrical specimen, as shown in Figure 2. A K-type thermocouple was welded at the center of the side surface of the cylindrical sample for measurement and temperature control. Subsequently, graphite sheets were placed on both ends of the sample and coated with high-temperature lubricant before being installed in the middle of the equipment ram to reduce the effect of friction. The hot compression rheological stress behavior under the conditions of a strain rate of 0.01s-1 ~1s-1 and a true strain of 0.2 was investigated. The hot compression test process is shown in Figure 3. First, the test was conducted using a heating rate of 5℃/s and held for 60s to ensure stable internal temperature of the specimen. The entire test was carried out under a vacuum degree of less than 50Pa, and the sample was cooled in the furnace after the test.
The microstructure morphology of the ingot before and after compression was observed using an Olympus metallurgical microscope and a VEGA 3 XMUX scanning electron microscope.
The D8 ADVANCE XRD diffractometer was used to determine the phase of the alloy before and after ingot compression, with a voltage of 40kV, current of 40mA, step size of 0.02º, and scanning range of 20-90º.

3. Results

2.1. Microstructure of U-50wt.%Zr Metallic Fuel Prepared

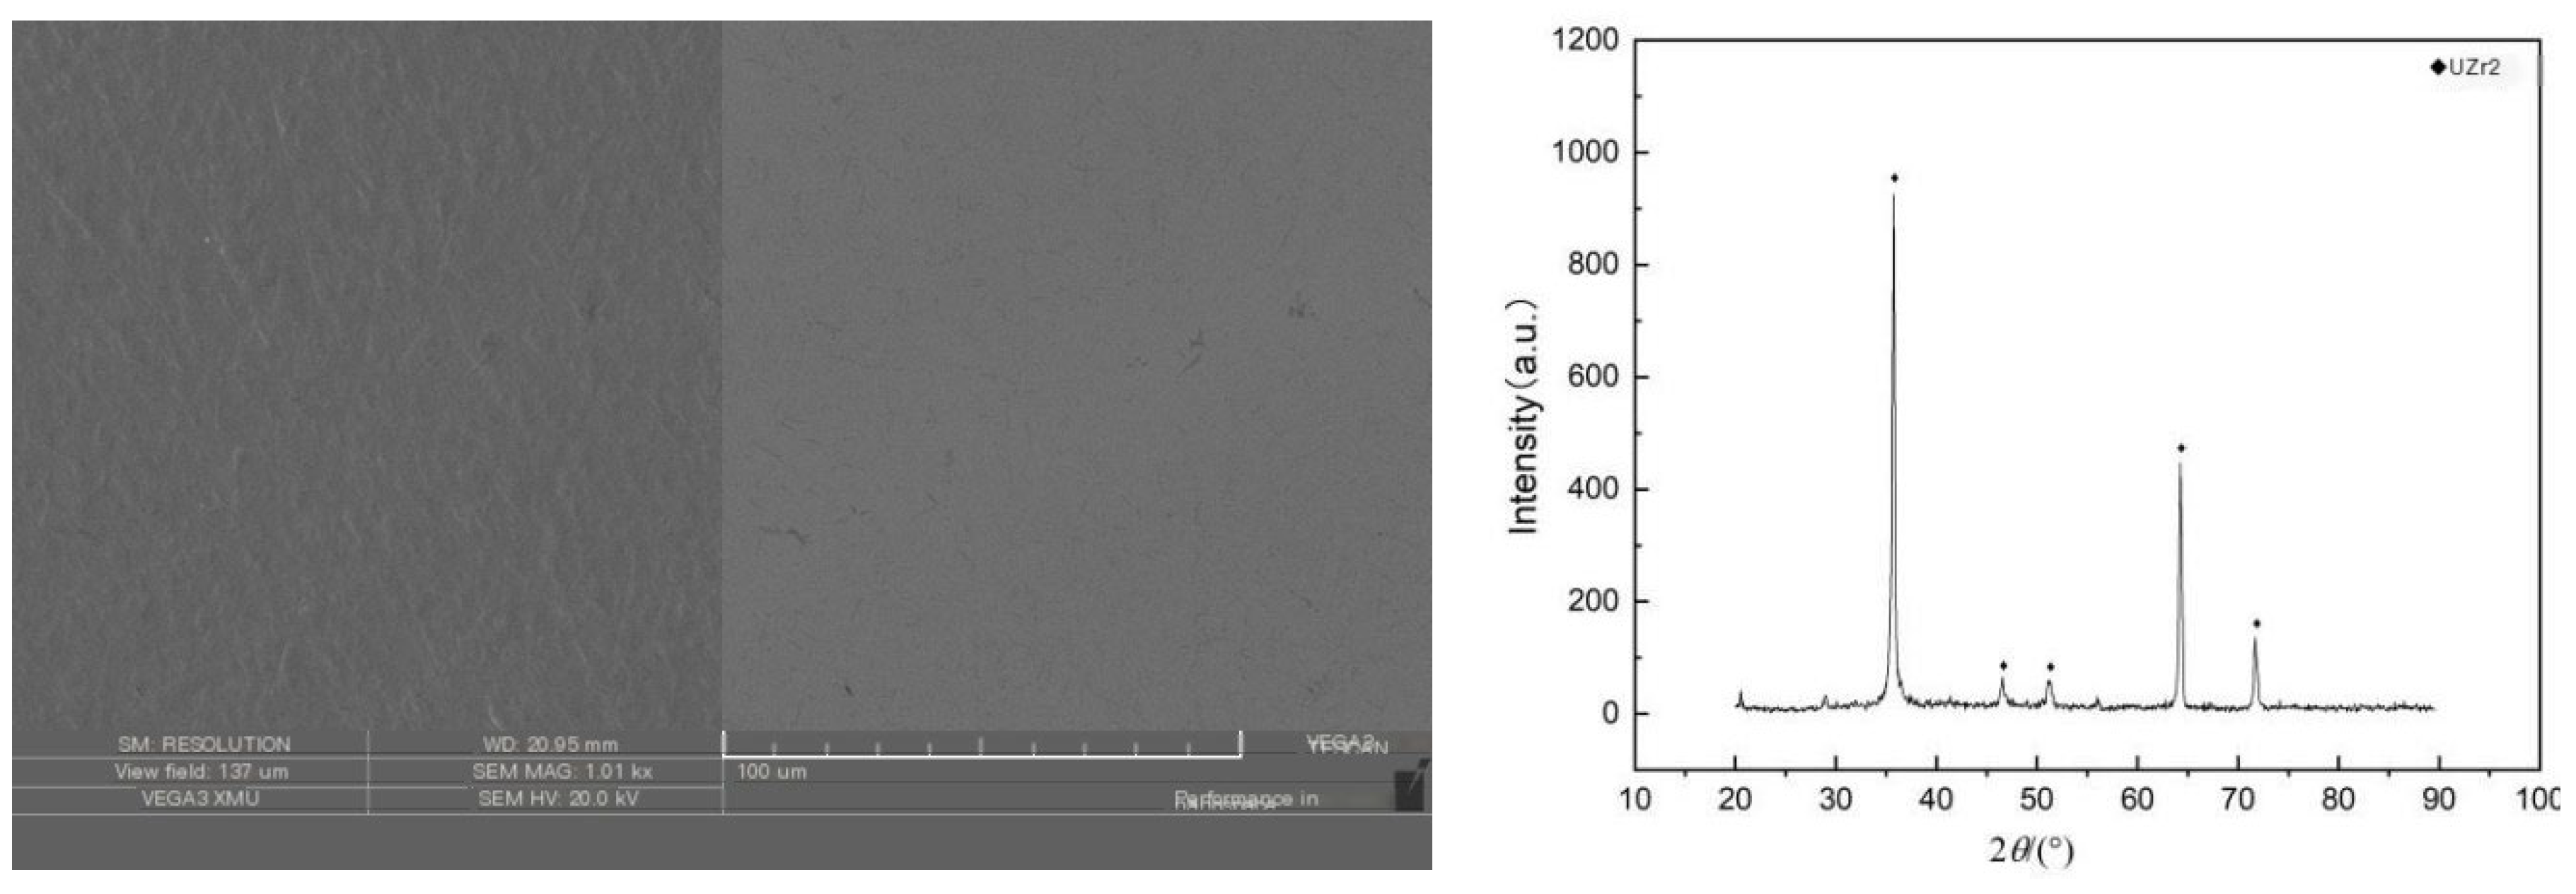
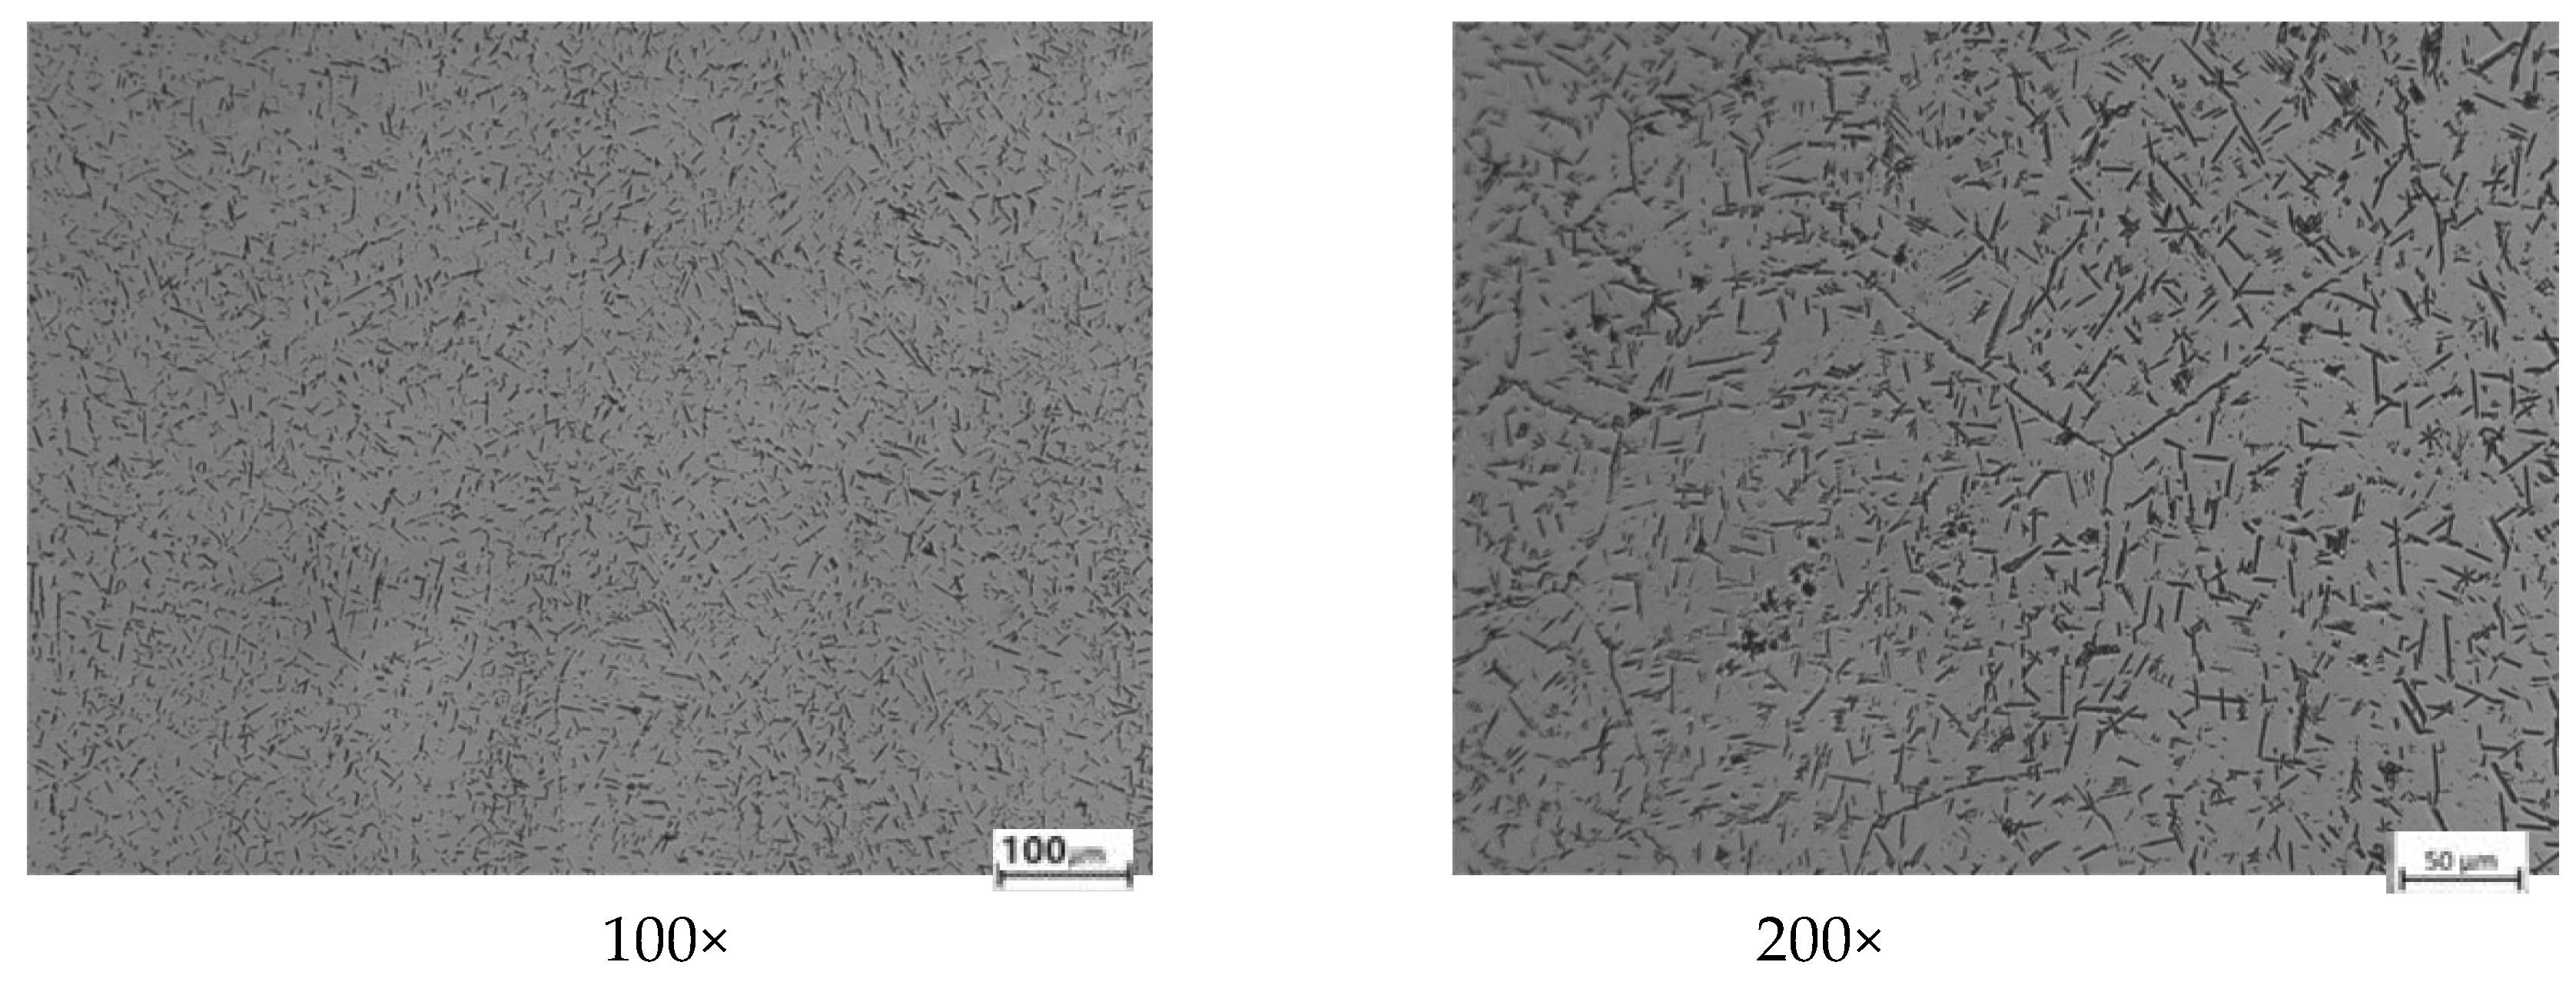
Before the experiment, scanning electron microscopy (SEM) and X-ray diffraction (XRD) tests were conducted on the U-50wt.%Zr metal-type fuel ingot. Figure 4 shows the SEM and XRD diffraction results, and the energy spectrum results indicate that the Zr content is 49.59wt.%. Figure 5 shows the metallographic photograph of U-50wt.%Zr metal-type fuel. No undissolved substances were observed in the sample. The XRD results show that the phase of U-50wt.%Zr metal-type fuel is UZr2, which is identified as δ phase based on the phase diagram.

2.2. Analysis of True Stress-True Strain Curve of U-50wt.%Zr Metal Fuel during Thermal Deformation

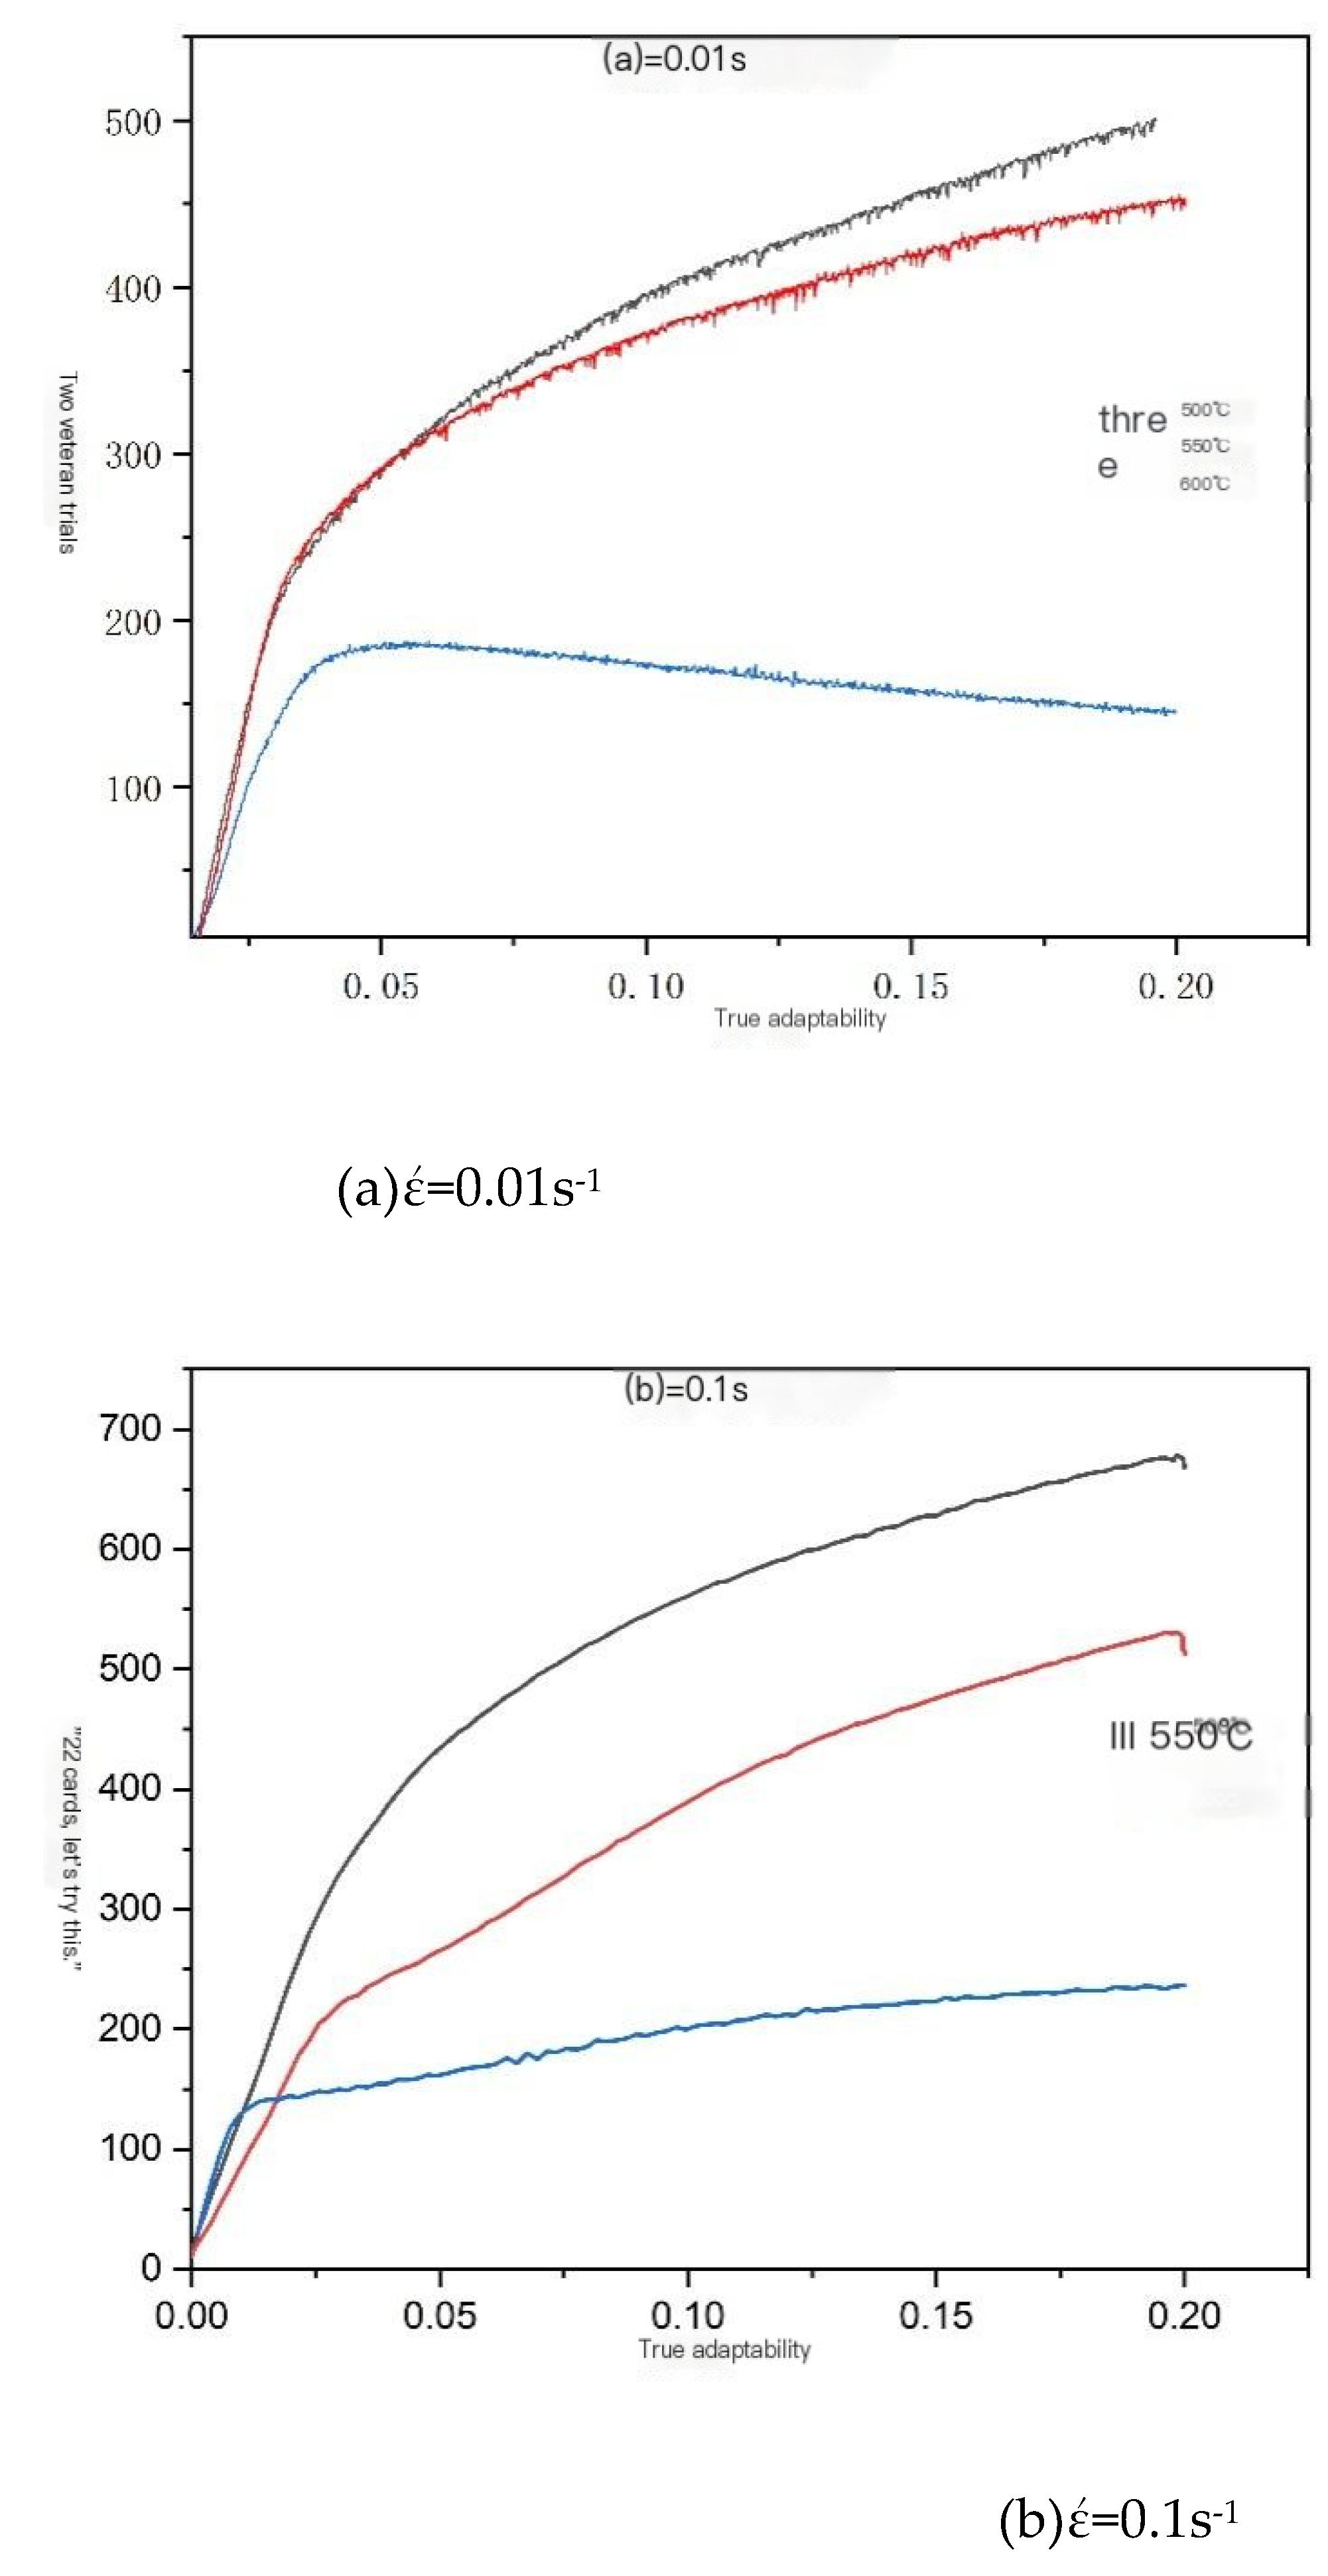
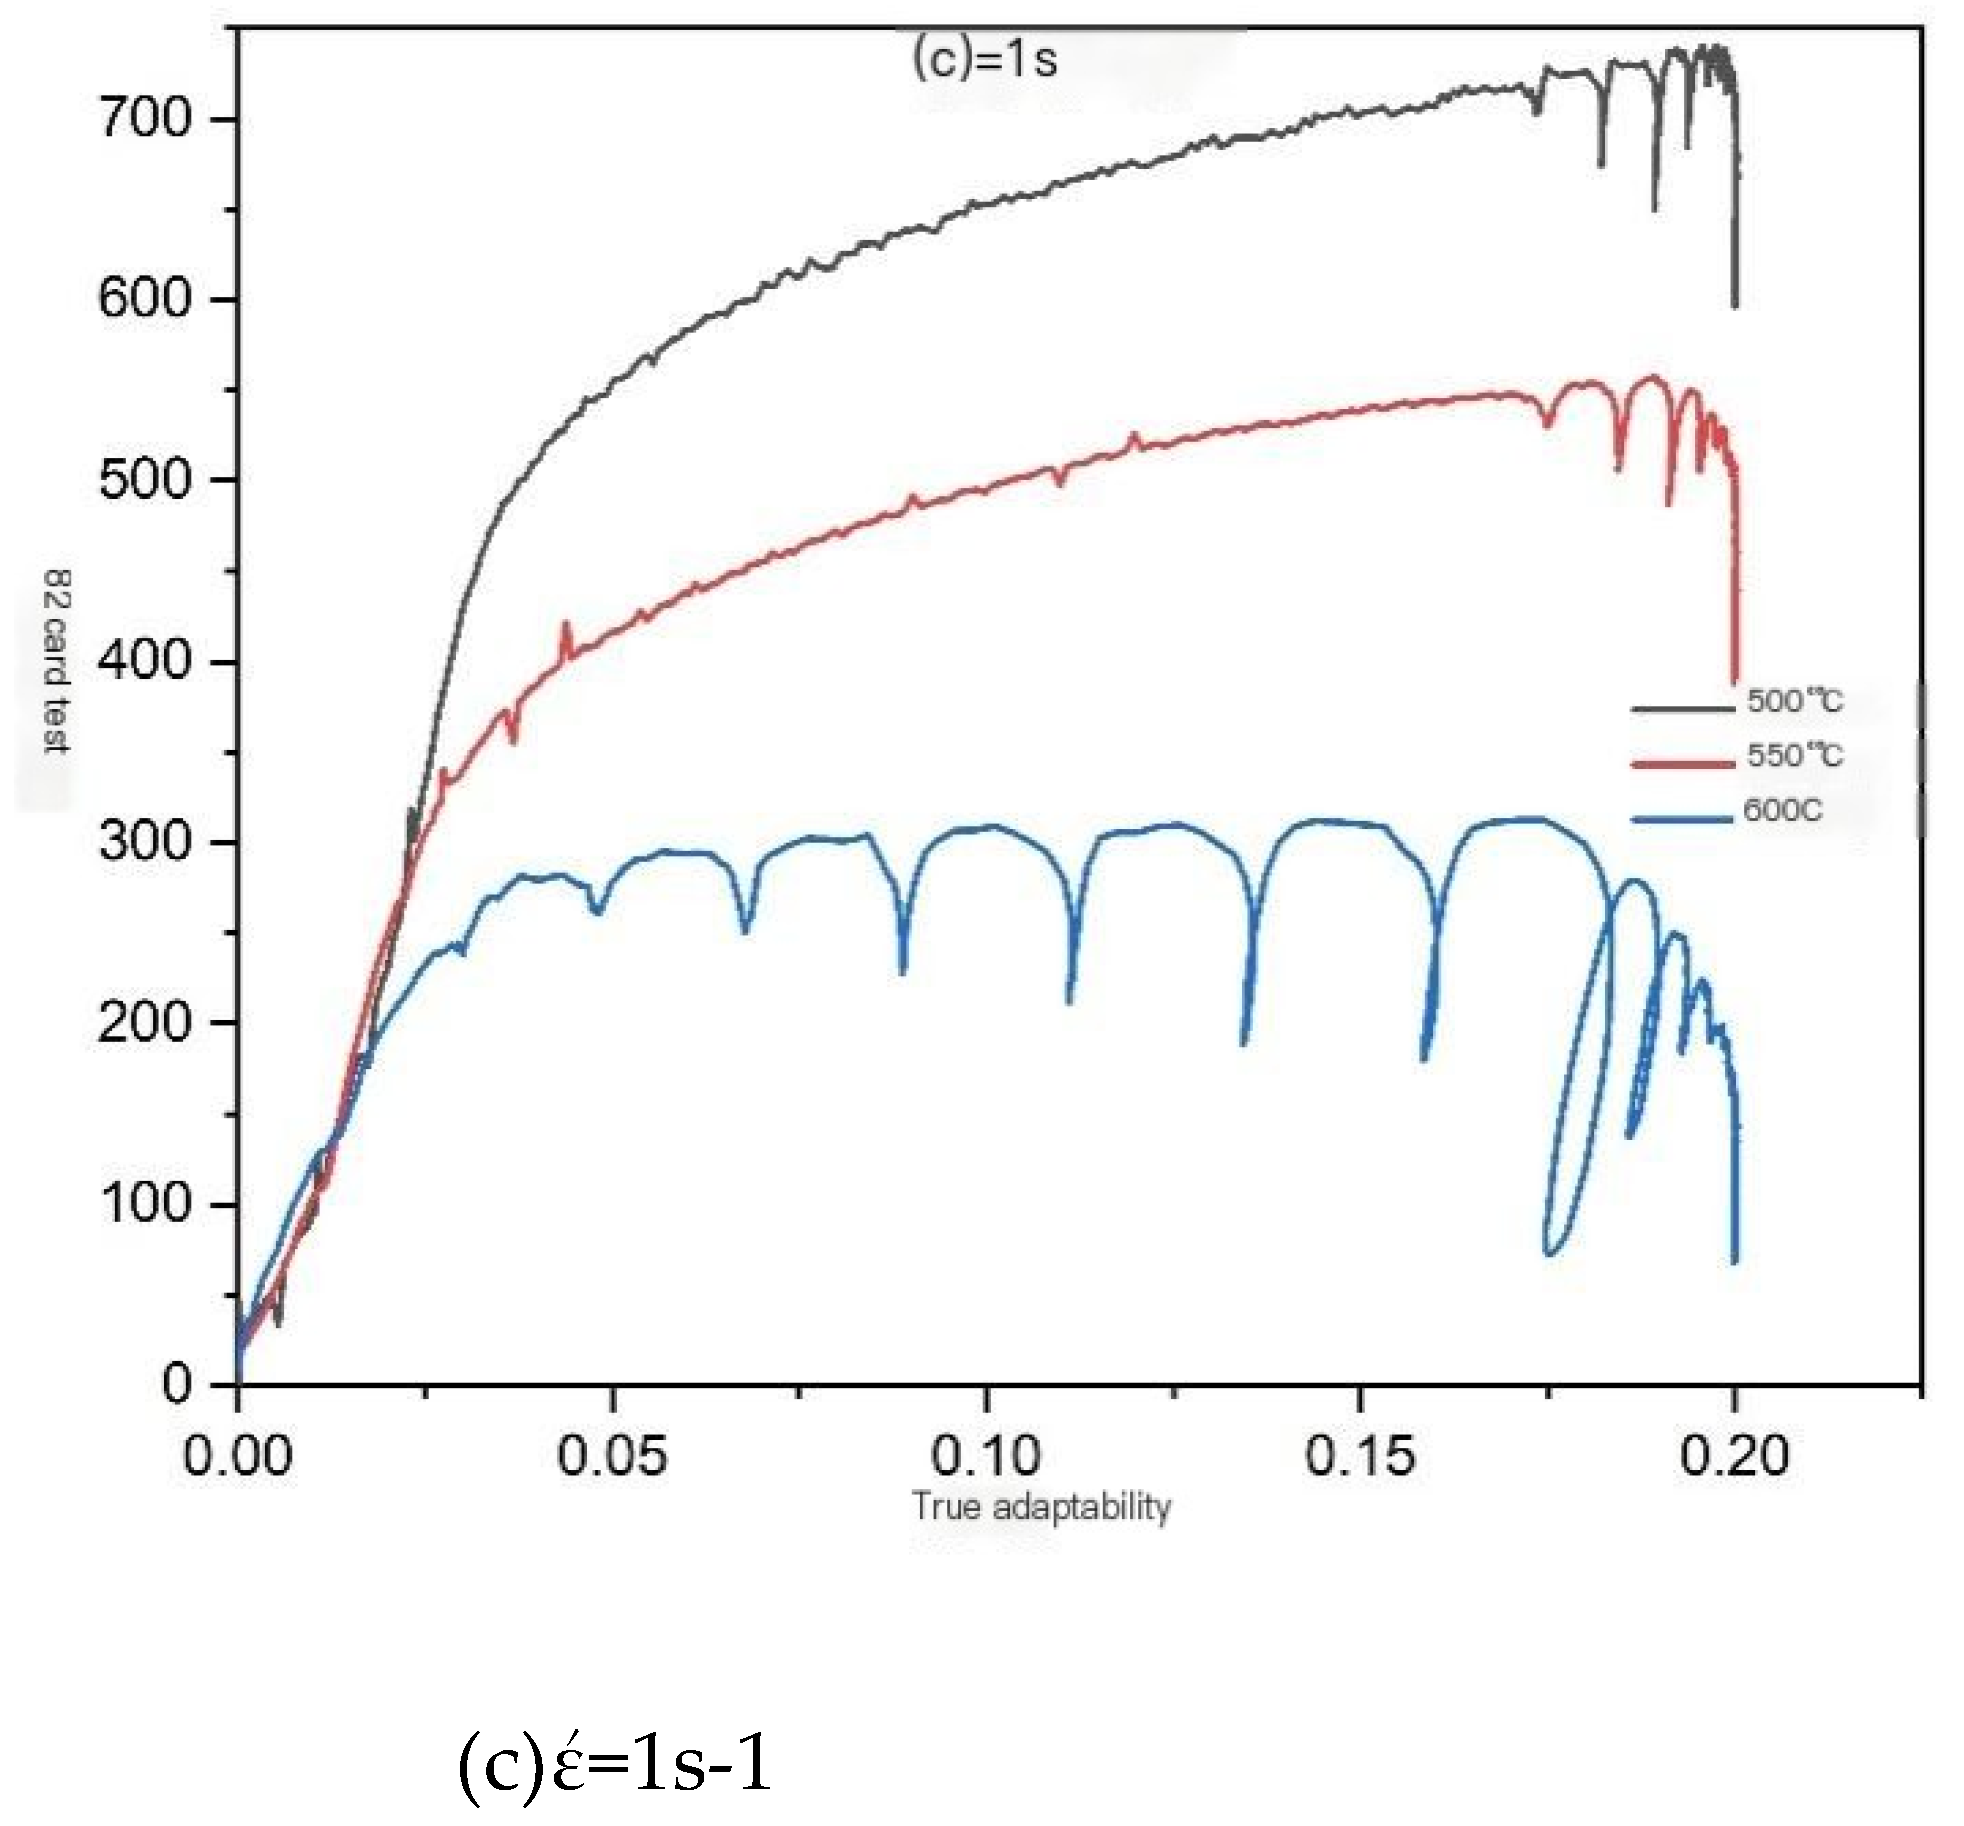
The true stress-true strain data obtained from the experiment were processed to obtain the true stress-true strain relationship curves at different temperatures under various strain rates, as shown in Figure 6. It can be observed from the figure that the deformation temperature, strain rate, and true strain have a significant impact on the rheological stress of the sample. In the initial stage of thermal deformation, the rheological stress increases rapidly with the increase of true strain. During this deformation stage, as the true strain increases, dislocations proliferate rapidly, and a large number of dislocations entangle and accumulate with each other, leading to a significant increase in work hardening. Therefore, the work hardening mechanism is the main reason for the increase in rheological stress in the initial stage of thermal deformation—e.g., [6,7].
At the same strain rate, the peak stress decreases with increasing deformation temperature. The peak stress reaches a maximum of 740MPa at deformation temperatures of 500℃ and 550℃, while it is around 200MPa at 600℃. As shown in Figure 6(a), the peak stress at a strain rate of 0.01 s-1 decreases by 10% at 550℃ compared to 500℃, and decreases by 59% at 600℃ compared to 550℃. As shown in Figure 6(b), the peak stress at a strain rate of 0.1 s-1 decreases by 24% at 550℃ compared to 500℃, and decreases by 54% at 600℃ compared to 550℃. As shown in Figure 6(c), the peak stress at a strain rate of 1 s-1 decreases by 25% at 550℃ compared to 500℃, and decreases by 44% at 600℃ compared to 550℃. From the above results, it can be seen that there is only a 50℃ difference between 550℃ and 600℃, but the peak stress difference is about 50%. Therefore, the U-50wt.%Zr metal-type fuel should undergo microstructural changes at 600℃.
Under the same deformation temperature, the peak stress increases with the increase of strain rate. At 500℃, the peak stress at a strain rate of 1s-1 increased by 48% compared to that at a strain rate of 0.01s-1. At 550℃, the peak stress at a strain rate of 1s-1 increased by 24% compared to that at a strain rate of 0.01s-1. At 600℃, the peak stress at a strain rate of 1s-1 increased by 68% compared to that at a strain rate of 0.01s-1. From the above results, it can be seen that the peak stress increases significantly with the increase of strain rate, mainly due to the sufficient time for dynamic recrystallization of U-50wt.%Zr metal fuel during thermal deformation, resulting in a significant decrease in peak stress at a strain rate of 0.01s-1 compared to that at strain rates of 0.1s-1 and 1s-1.
Based on the above analysis, it can be observed that the thermal deformation behavior of U-50wt.%Zr metal-type fuel at 600℃ with a strain rate of 0.01s-1 exhibits significant dynamic recrystallization. However, at 500℃ and 550℃ with higher strain rates, the dynamic recrystallization phenomenon is not evident, and the thermal deformation behavior is dominated by work hardening. Therefore, the true stress-strain curve of U-50wt.%Zr metal-type fuel can be divided into two types: one is the dynamic recrystallization type curve, as shown in the true stress-strain curves at different strain rates at 600℃ in the figure. Specifically, as the true strain increases, the flow stress gradually decreases until reaching a steady-state stress. This phenomenon weakens with an increase in strain rate. When the strain rate is 1s-1, the time of dynamic softening effect is shortened, and the stress curve exhibits severe fluctuations. The other type is the work hardening type curve, as shown in the true stress-strain curves at different strain rates at 500℃ and 550℃. The true stress increases with the increase of strain, showing an overall work hardening state without reaching steady-state flow.[8,9]
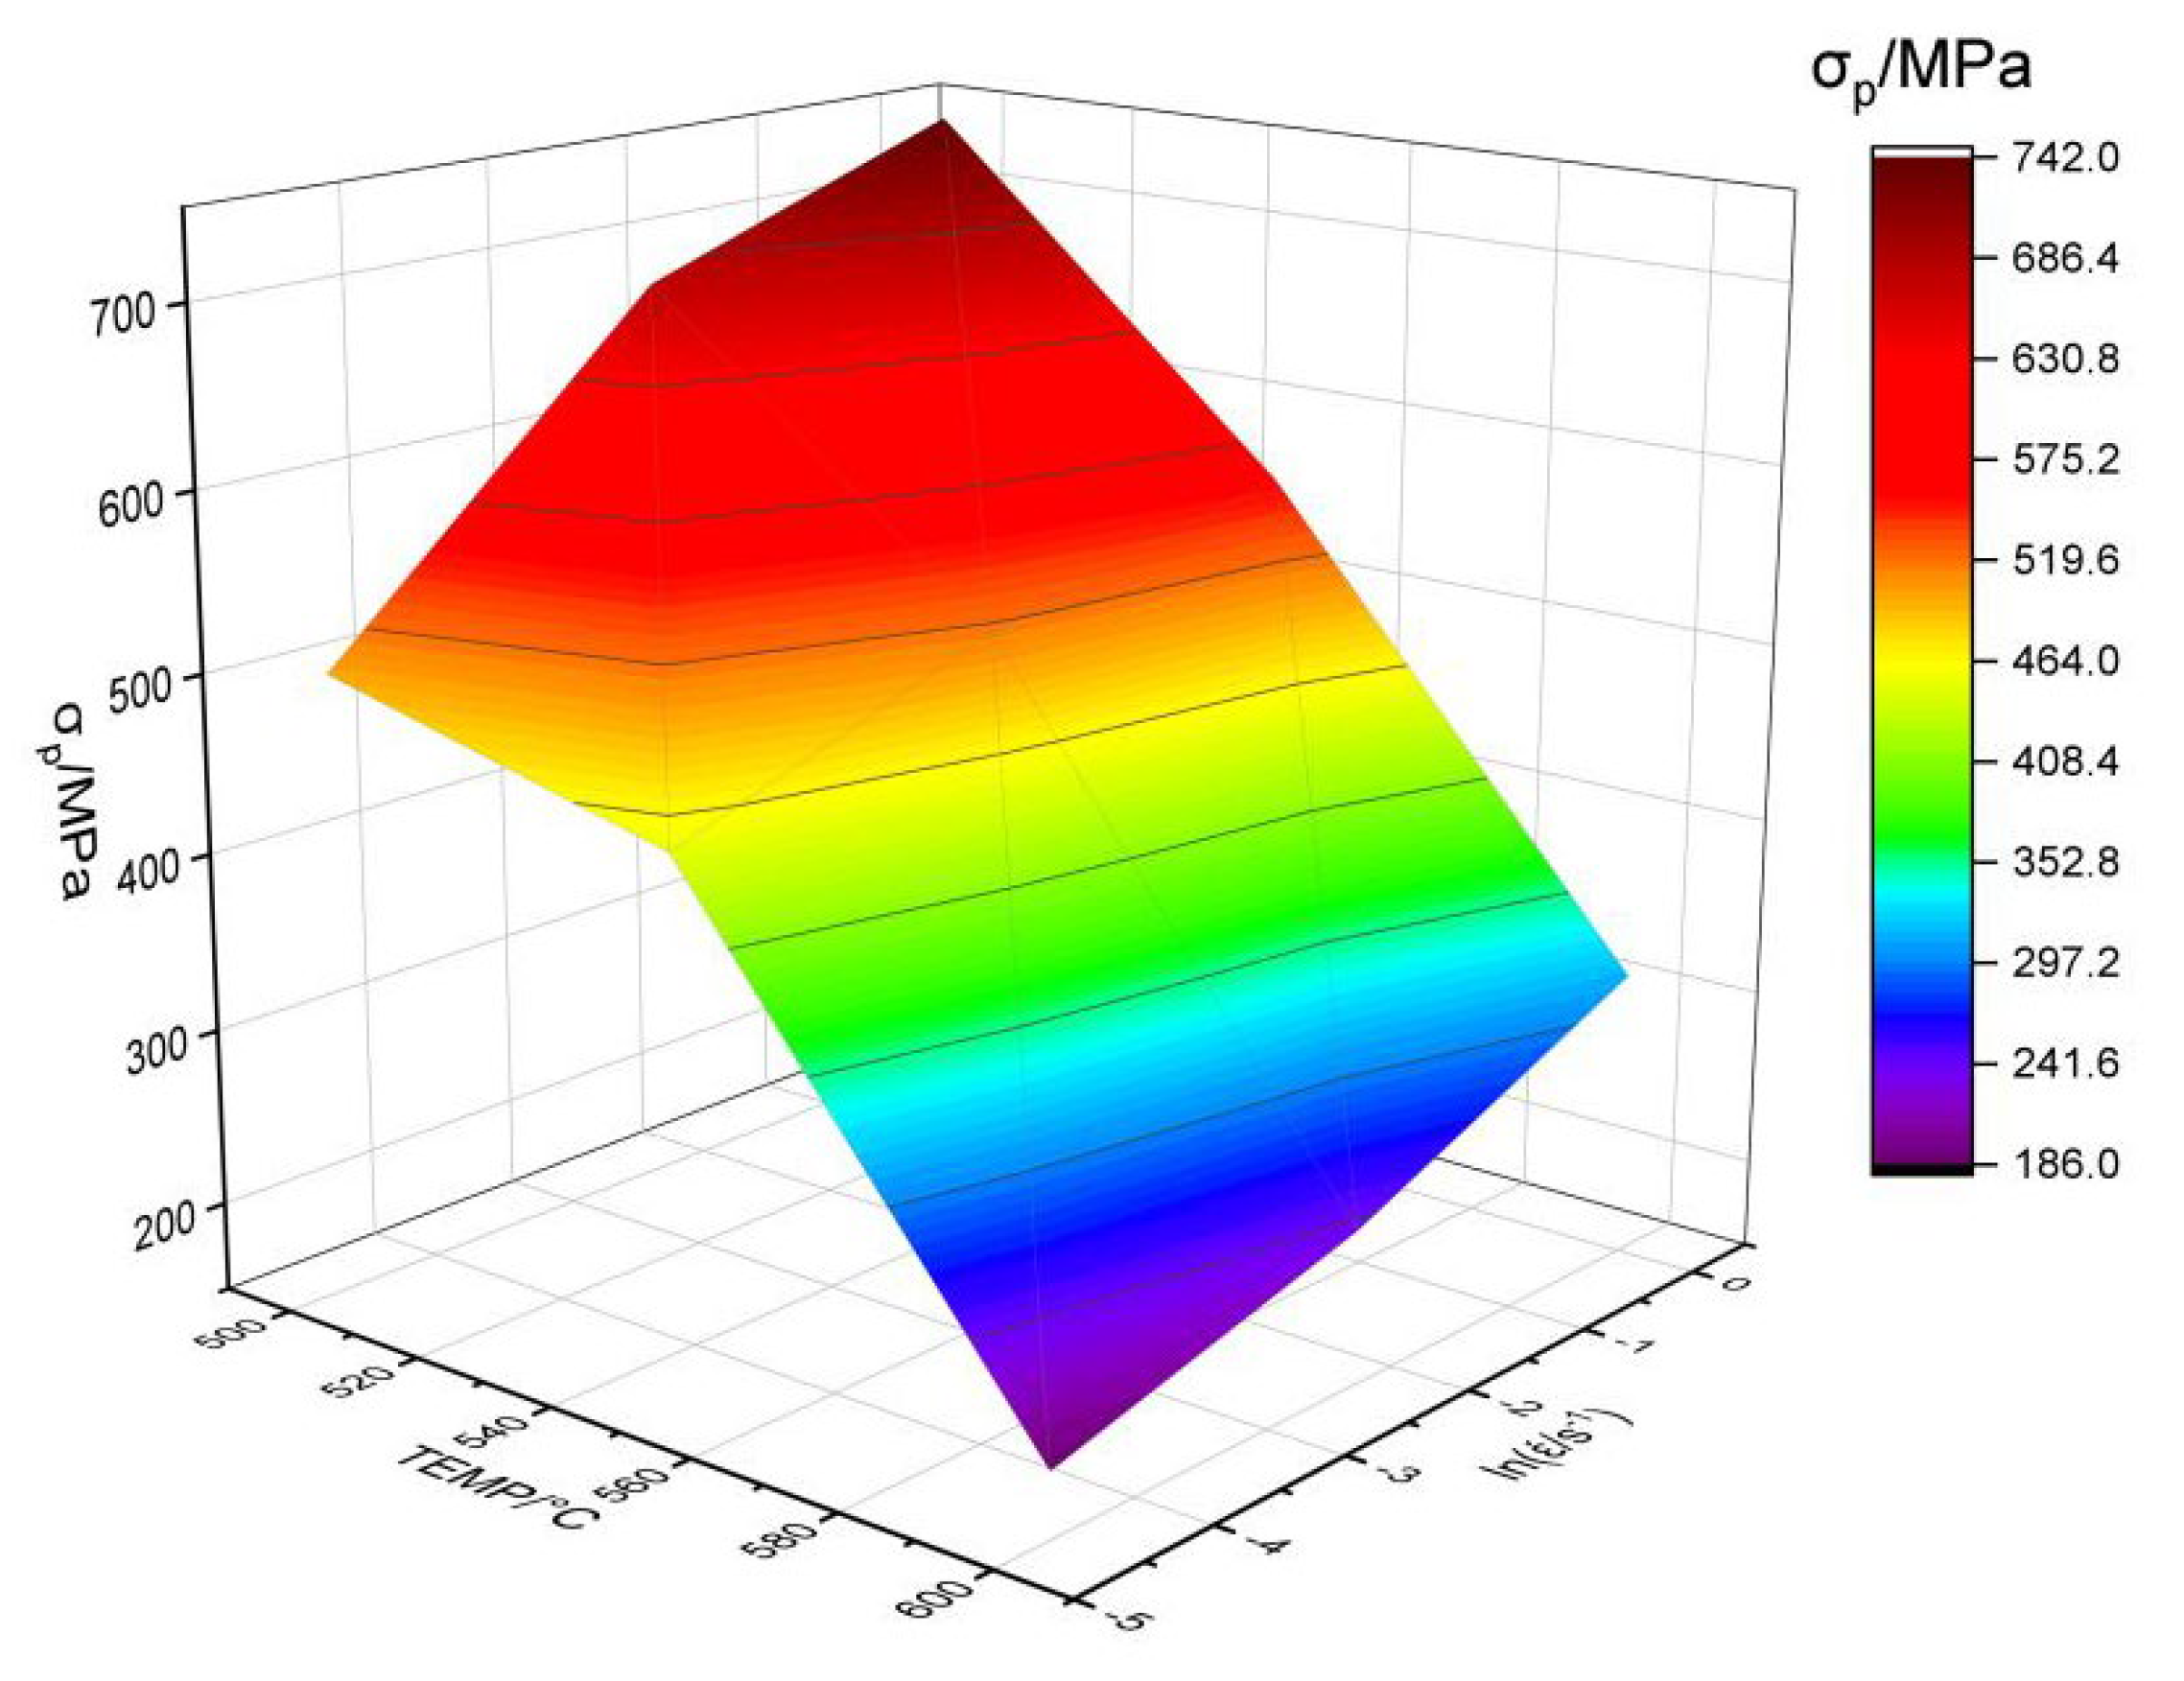
Figure 7 illustrates the 3D peak stress diagram of U-50wt.%Zr metal fuel under various deformation conditions. It can be observed that the peak stress decreases with increasing temperature and decreases with decreasing strain rate.

2.3. Microstructural Analysis of U-50wt.%Zr Metal-Type Fuel

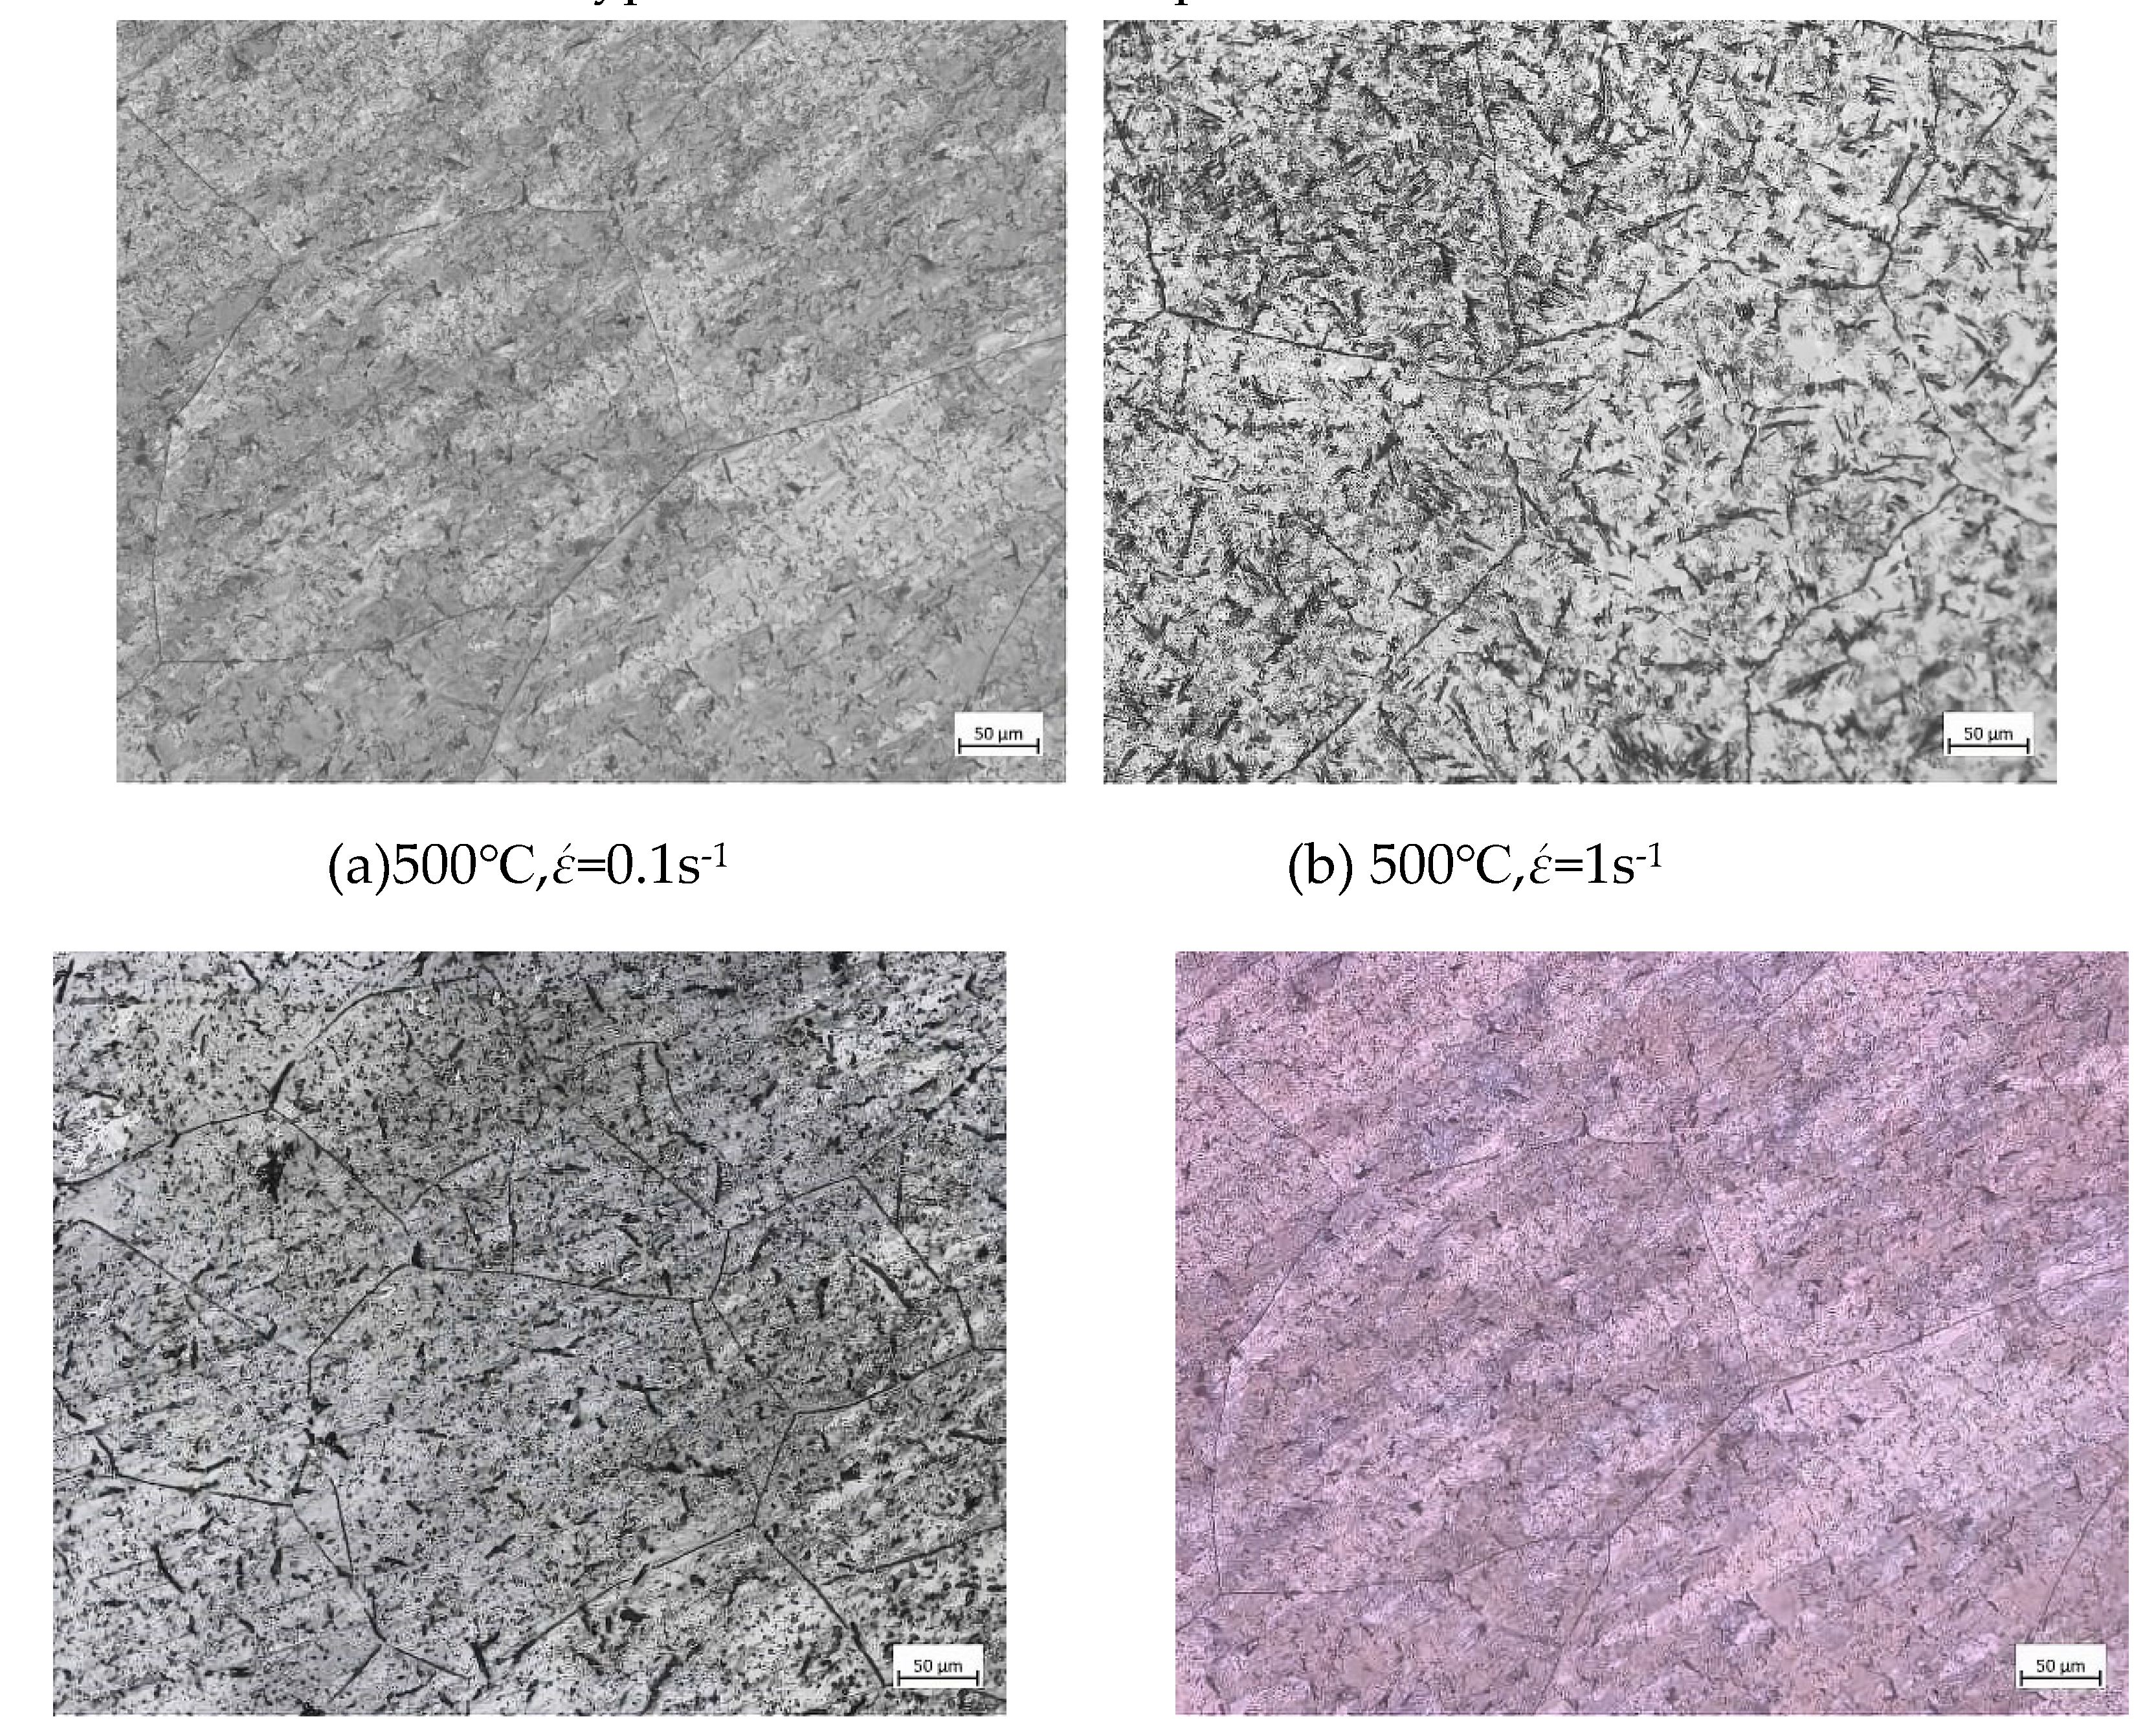
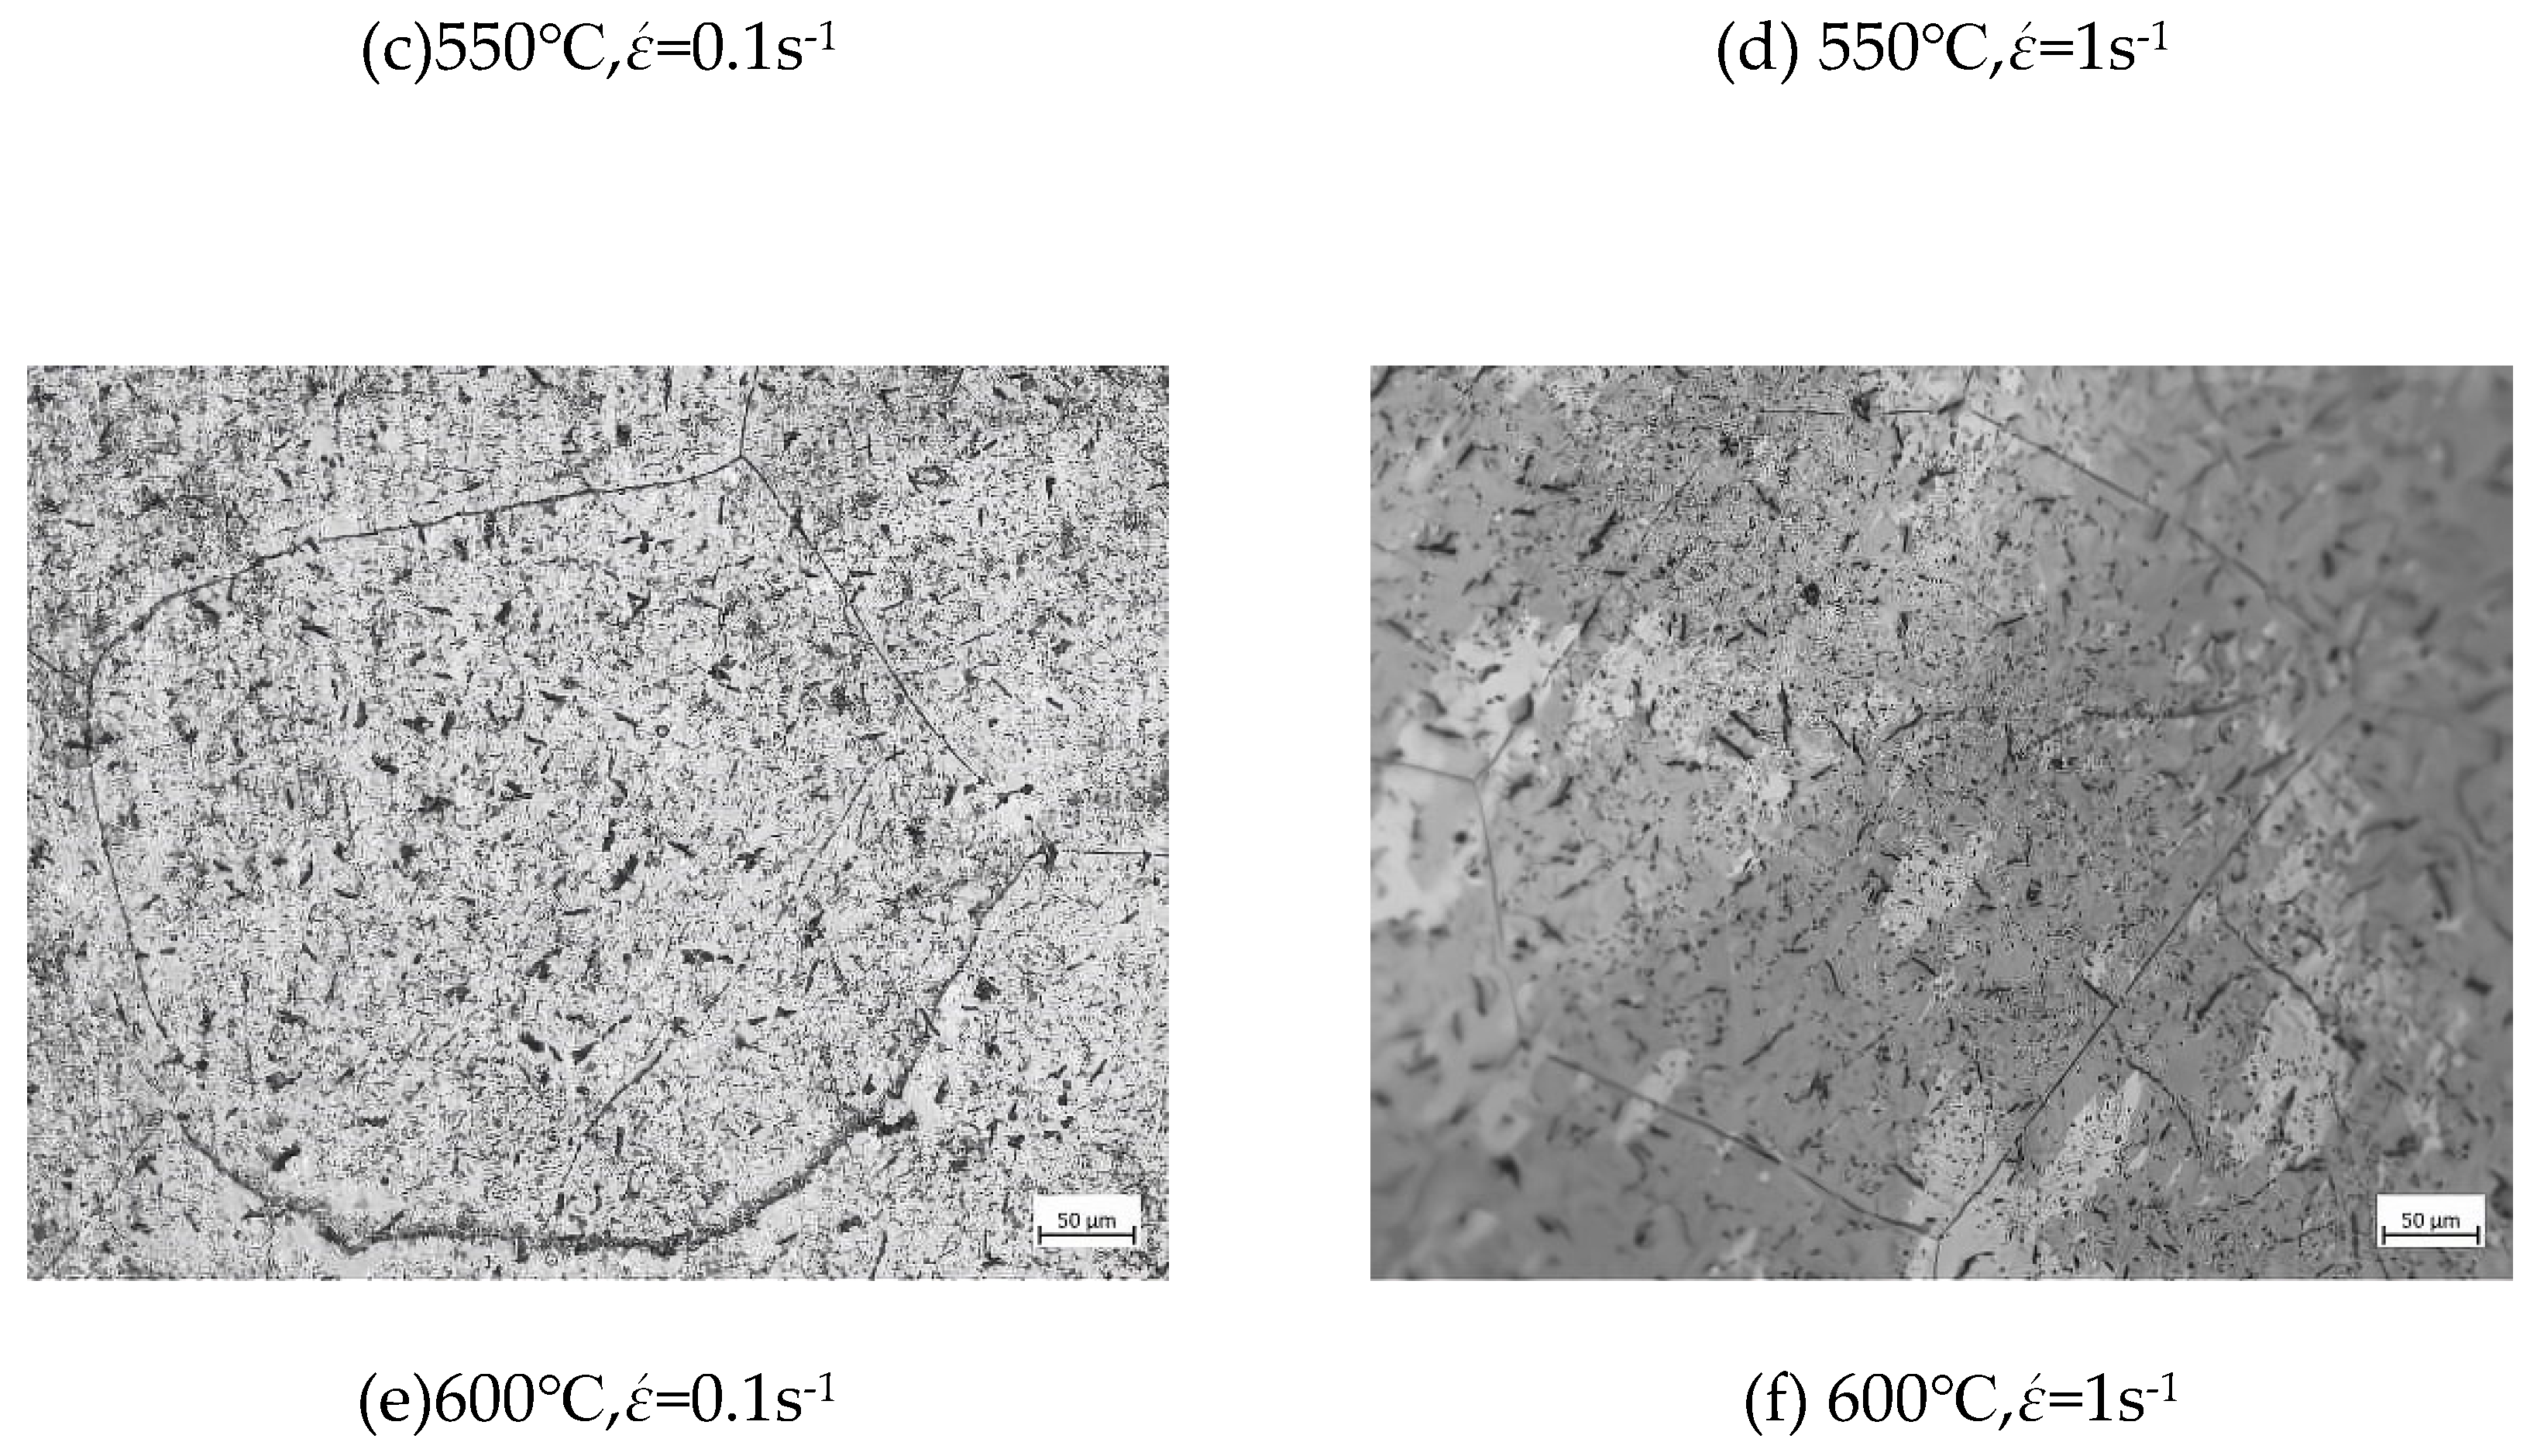
Metallographic examination was conducted on the cross-section of the deformed area of the thermally compressed sample. The results are shown in Figure 8. It was observed from the figure that under the same strain rate conditions, the thermal deformation temperature had an impact on its metallographic microstructure. At strain rates of 0.1s-1 and 1s-1, the grain size changes were not significant at 500℃ and 550℃, with grain sizes around 250μm. At 600℃, the grain size reached 493μm, indicating grain growth after thermal deformation at this temperature. As the strain rate increased, there were no significant changes in the shape and structure of the grain boundaries and grains of U-50wt.%Zr metal-type fuel at the same temperature.
The samples after the experiment were subjected to X-ray diffraction testing, and their phases were identified through a database. The phase results of U-50wt.%Zr metal-type fuel subjected to compression experiments at different strain rates and temperatures are shown in Figure 9. After thermal deformation, the U-50wt.%Zr metal-type fuel maintains the UZr2 phase, which is known as the δ phase according to the phase diagram —e.g., [10]. After thermal deformation at 500℃, 550℃, and 600℃, the U-50wt.%Zr metal-type fuel is in the δ-UZr2 phase.

2.4. Construction of Arrhenius Constitutive Equation for U-50wt.%Zr Metal-Type Fuel

Based on the results of the hot deformation test, the relationship between peak stress, strain rate, and temperature of U-50wt.%Zr metal-type fuel was fitted using the Arrhenius equation. The study focused on the relationship between temperature, deformation rate, and deformation resistance of U-50wt.%Zr metal-type fuel within a strain rate range of 0.01~1s-1 —e.g., [11,12,13,14].
ε ˙ = A F σ e x p ( Q R T )
In the formula: ε ˙ represents the strain rate, s-1; A is a constant; F σ is a σ function related to ; Q denotes the activation energy for thermal deformation, J/mol; represents the R gas constant, which is 8.314J/(mol·K); T stands for the thermodynamic temperature, K; and σ represents the peak stress, MPa.
F σ = σ n 1           ; α σ < 1.2 exp β σ         ; α σ > 1.2 [ s i n h ( α σ ) ] n         ;  
α In the formula n 1 , n , β , and are constants, where α = β n 1 Taking the natural logarithm on both sides of equation (1), we can obtain equations (3), (4), and (5) after rearranging.
l n ε ˙ = l n A 1 + n 1 l n σ Q R T
l n ε ˙ = l n A 2 + β σ Q R T
l n ε ˙ = l n A 3 + n l n [ sinh α σ ] Q R T
Where A 2 A 1 , and A 3 are constants.
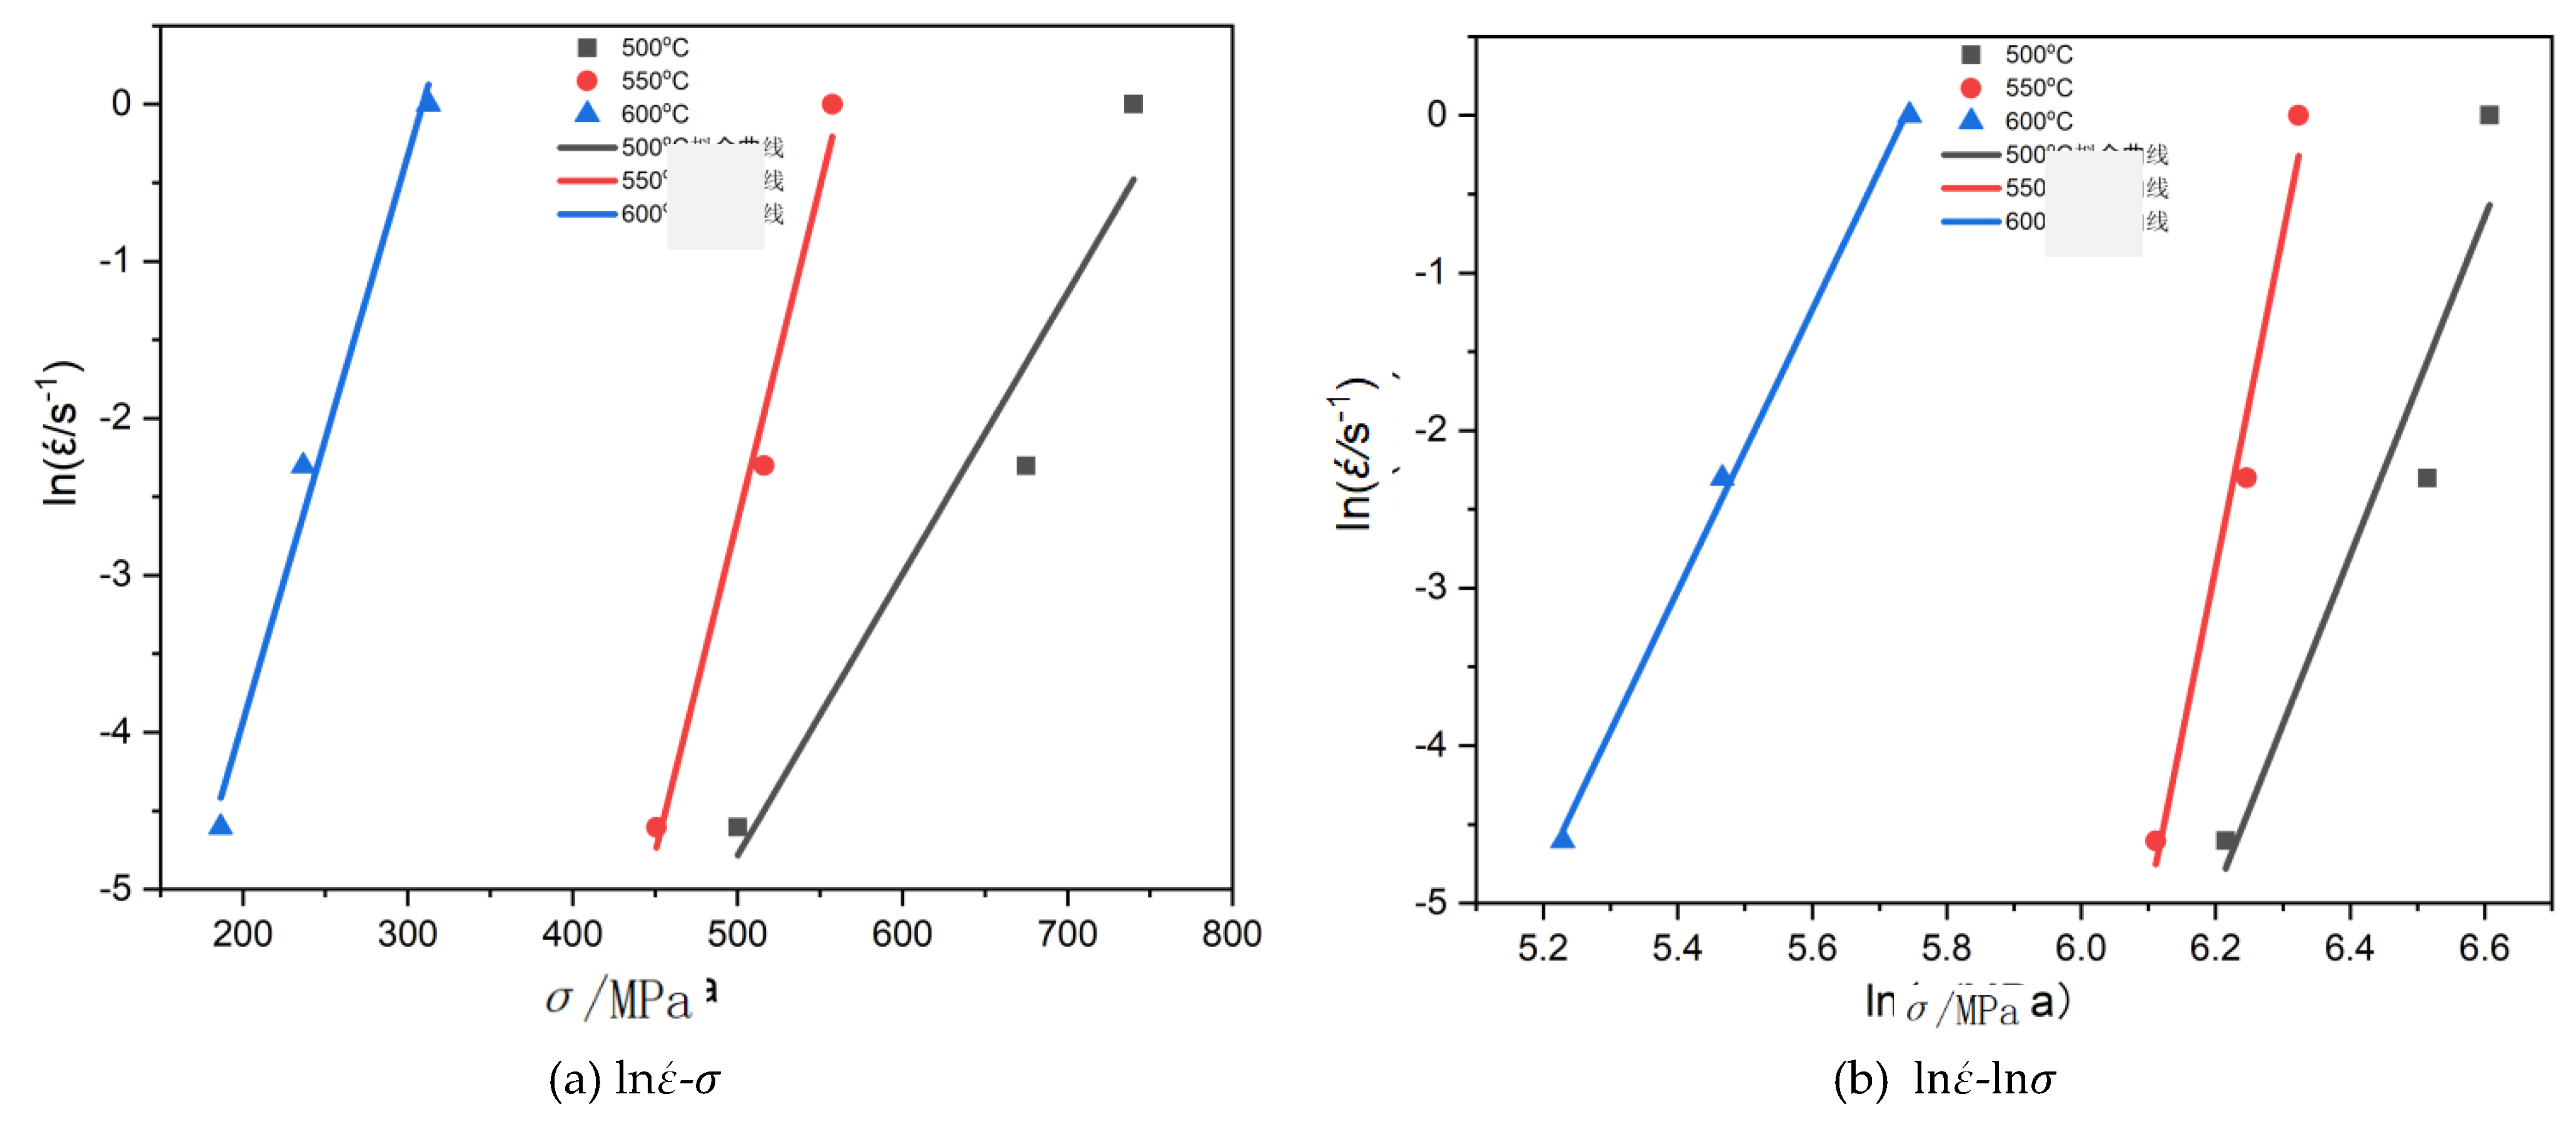
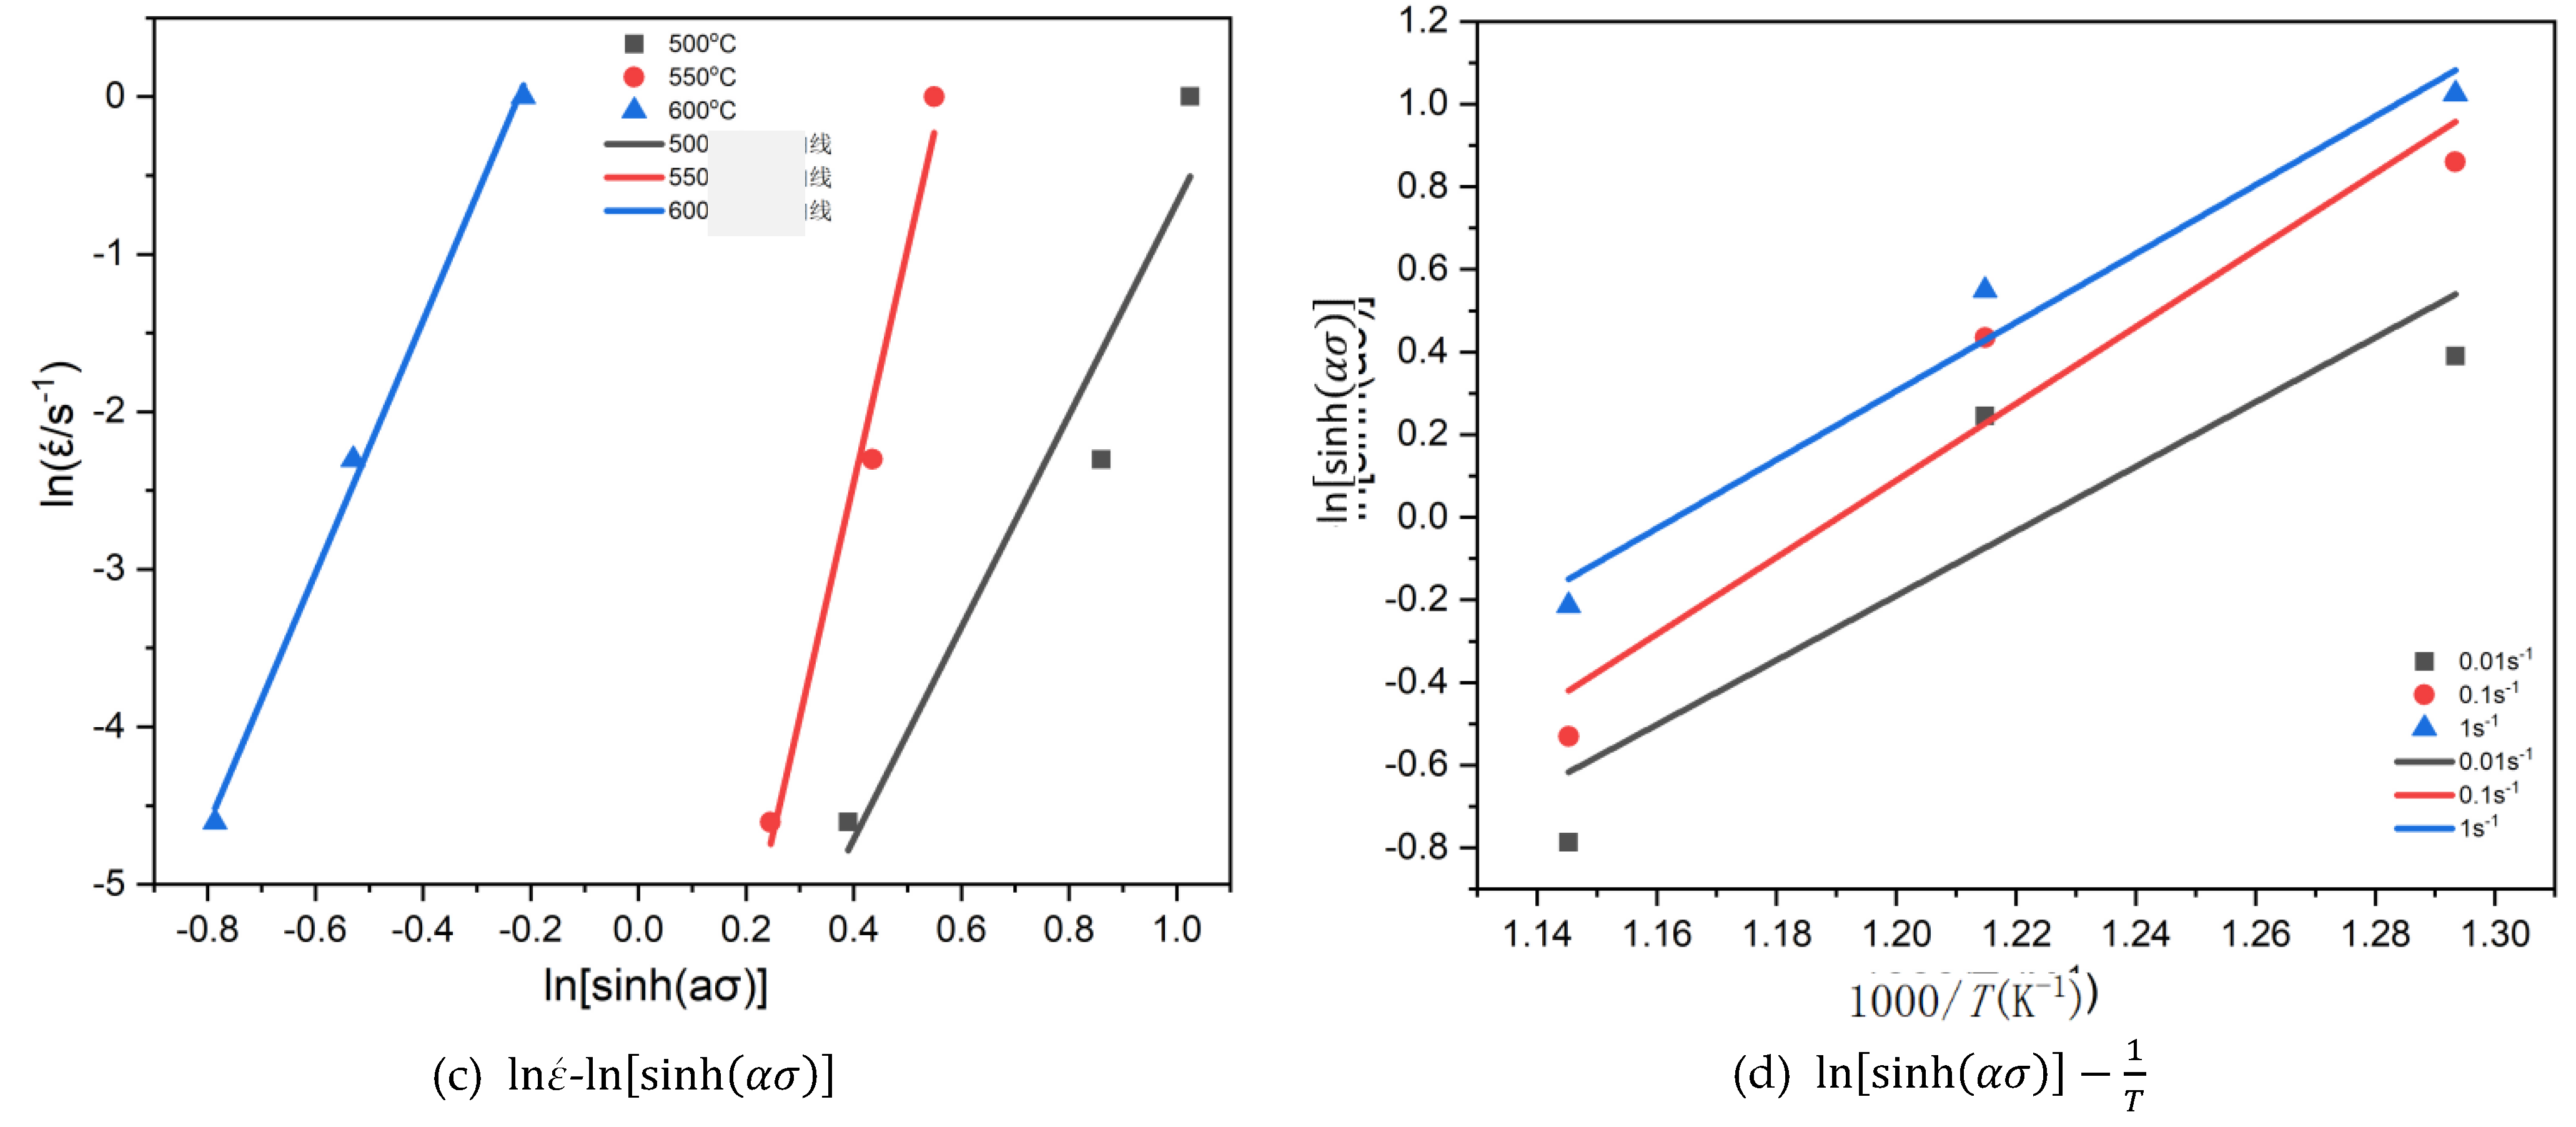
α Assuming that the peak stress, strain rate, and temperature have l n ε ˙ minimal influence on the activation energy of thermal deformation and remain constant l n ε ˙ l n [ sinh α σ ] , it can be observed from equations (3) and (4) that if we use l n σ and σ as the horizontal coordinates and as the vertical coordinate for fitting, and employ the least squares method for linear regression to determine the slope of the straight line, we can obtain and. As shown in Figure 10(a,b), by calculating the average values of the slopes of the fitted straight lines, we obtain n 1 = 13.6035, β = 0.03215, and α = β n 1 = 0.00236. Substituting the values of into equation (5) and performing a linear fitting, as shown in Figure 10(c). Zener and Hollomon proposed a Z parametric equation that can be used to represent the relationship between the strain rate and temperature during high-temperature plastic deformation of materials, as shown in equation (6). [15]
Z = ε ˙ exp Q R T = A [ s i n h ( α σ ) ] n
Taking the natural logarithm of both sides of equation (6) and rearranging, we obtain equation (7).
l n sinh α σ = Q 1000 n R · 1000 T + l n ε ˙ n l n A
From equation (7), it can be observed that under a constant strain rate Q 1000 n R l n sinh α σ 1000 T , a linear fit can be applied to Q , with the slope representing the n value of. Through further calculations, the thermal deformation activation energy can be determined. The slope of the straight line in Figure 10(d) Q is, and its average value is 9.8638. The average slope of the three fitted straight lines is 8.4734, and the thermal deformation activation energy is calculated to be 694.9 kJ/mol.
Taking the natural logarithm of both sides of equation (6) and rearranging, we can obtain equation (8).
l n Z = l n A + n l n sinh α σ
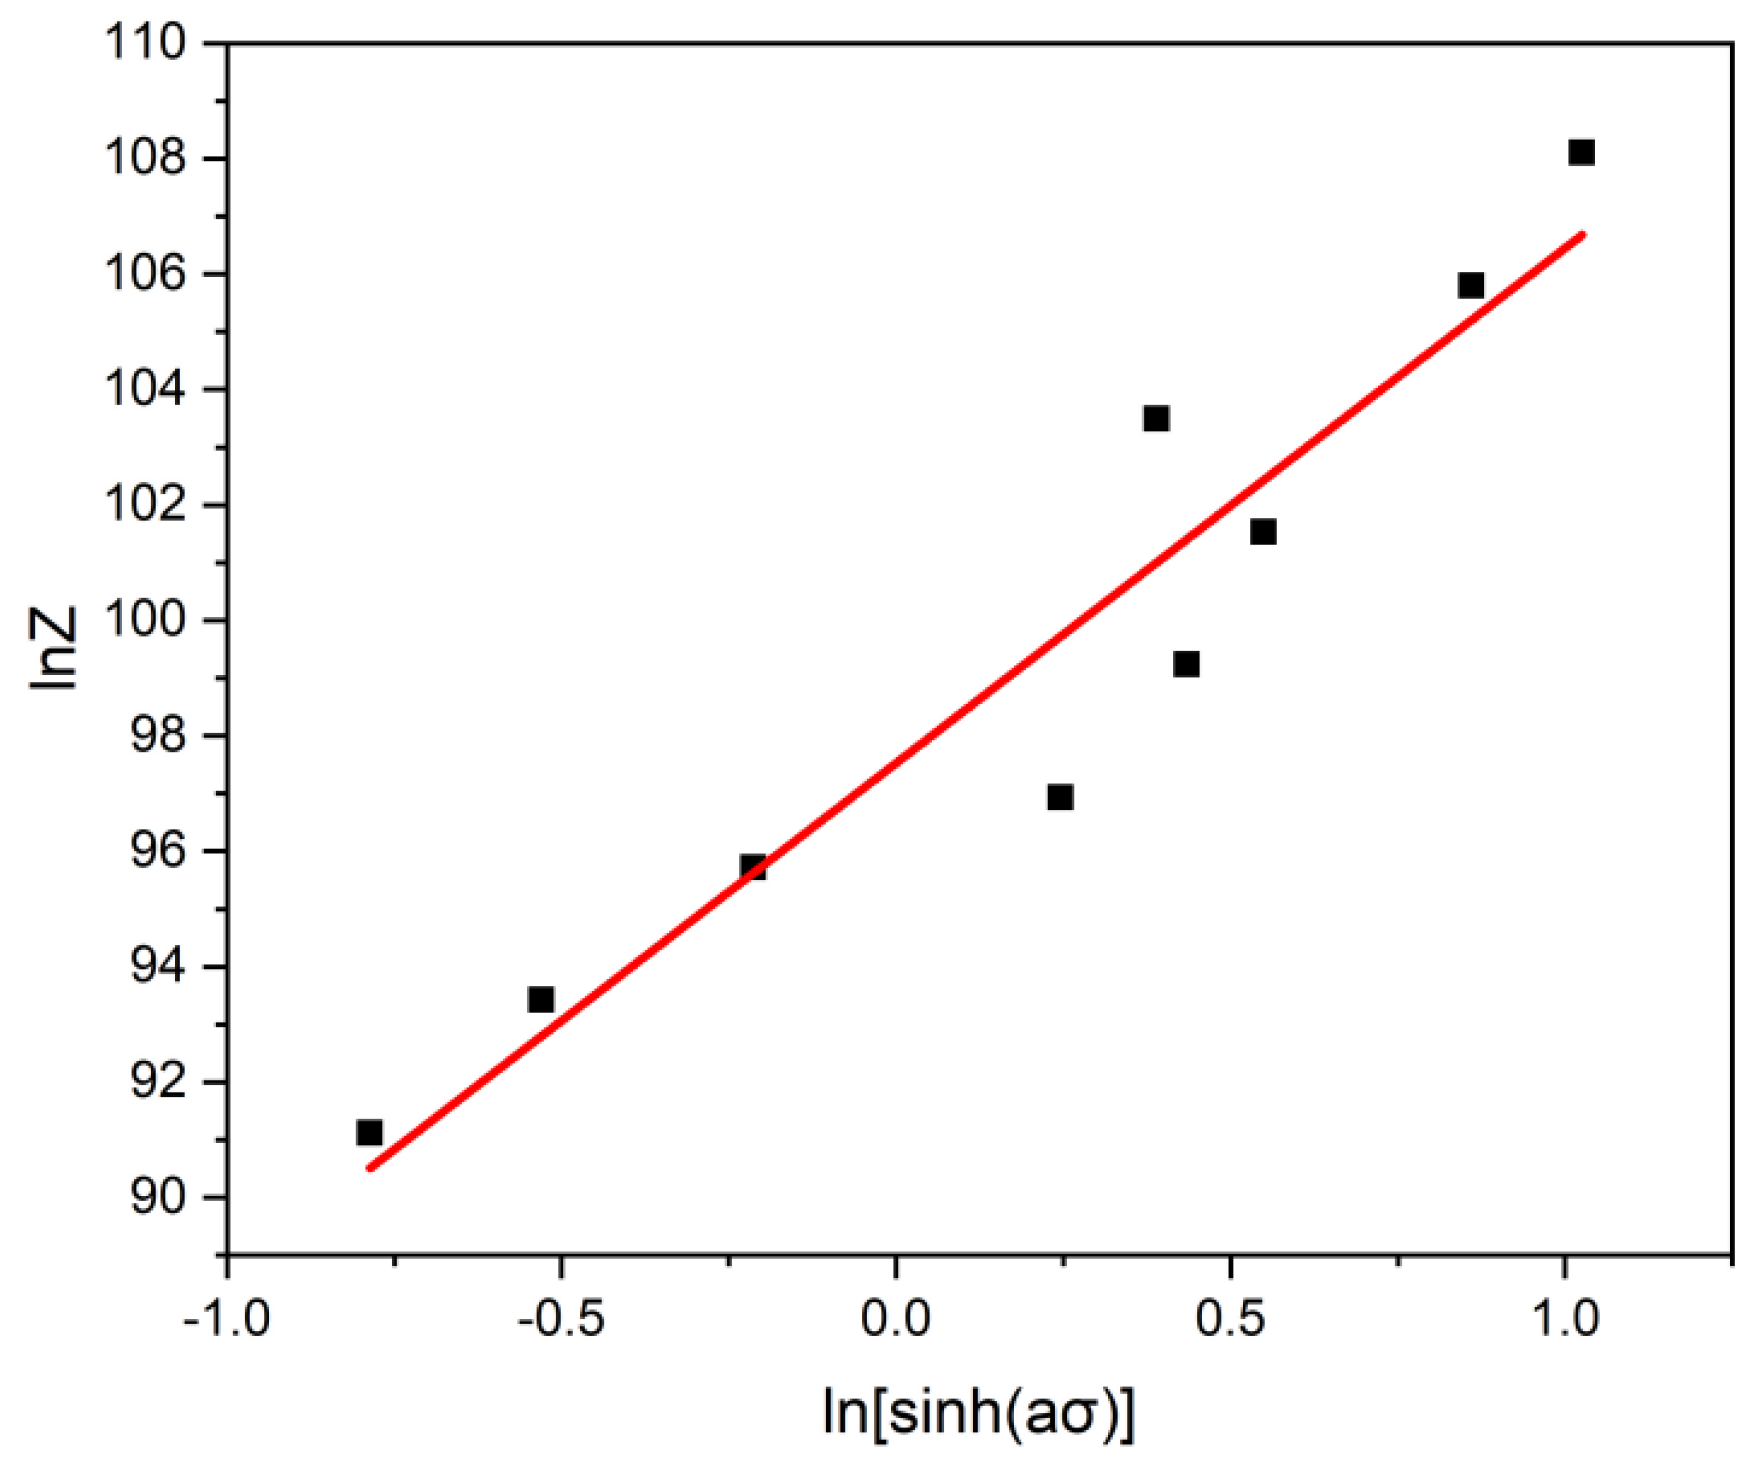
Substitute the corresponding strain rate, temperature, and thermal deformation activation energy into equation (6) Z to calculate the corresponding values, and then l n Z l n sinh α σ perform fitting. The slope n of the fitted line is , and the intercept of the line with the vertical axis is l n A .
The slope A of the fitted straight line in Figure 11 is 8.9236, with an intercept of 97.527 and a l n Z l n sinh α σ fitted value of 8.9236. The n calculated value is 2.267×10^42.
By R substituting n , α , A , Q and into formula (1), we can obtain the constitutive equation (9) for U-50wt.%Zr metal-type fuel.
ε ˙ = 2.267 × 10 42 s i n h 0.00236 × σ 8.9236 e x p 83579.923 T
By varying (9), we can obtain the relationship between peak stress, temperature, and strain rate (10).
σ = 1 0.00236 l n Z 2.267 × 10 42 1 8.9236 + Z 2.267 × 10 42 2 8.9236 + 1
Among them:
Z = έ e x p 694.9 × 10 3 R T
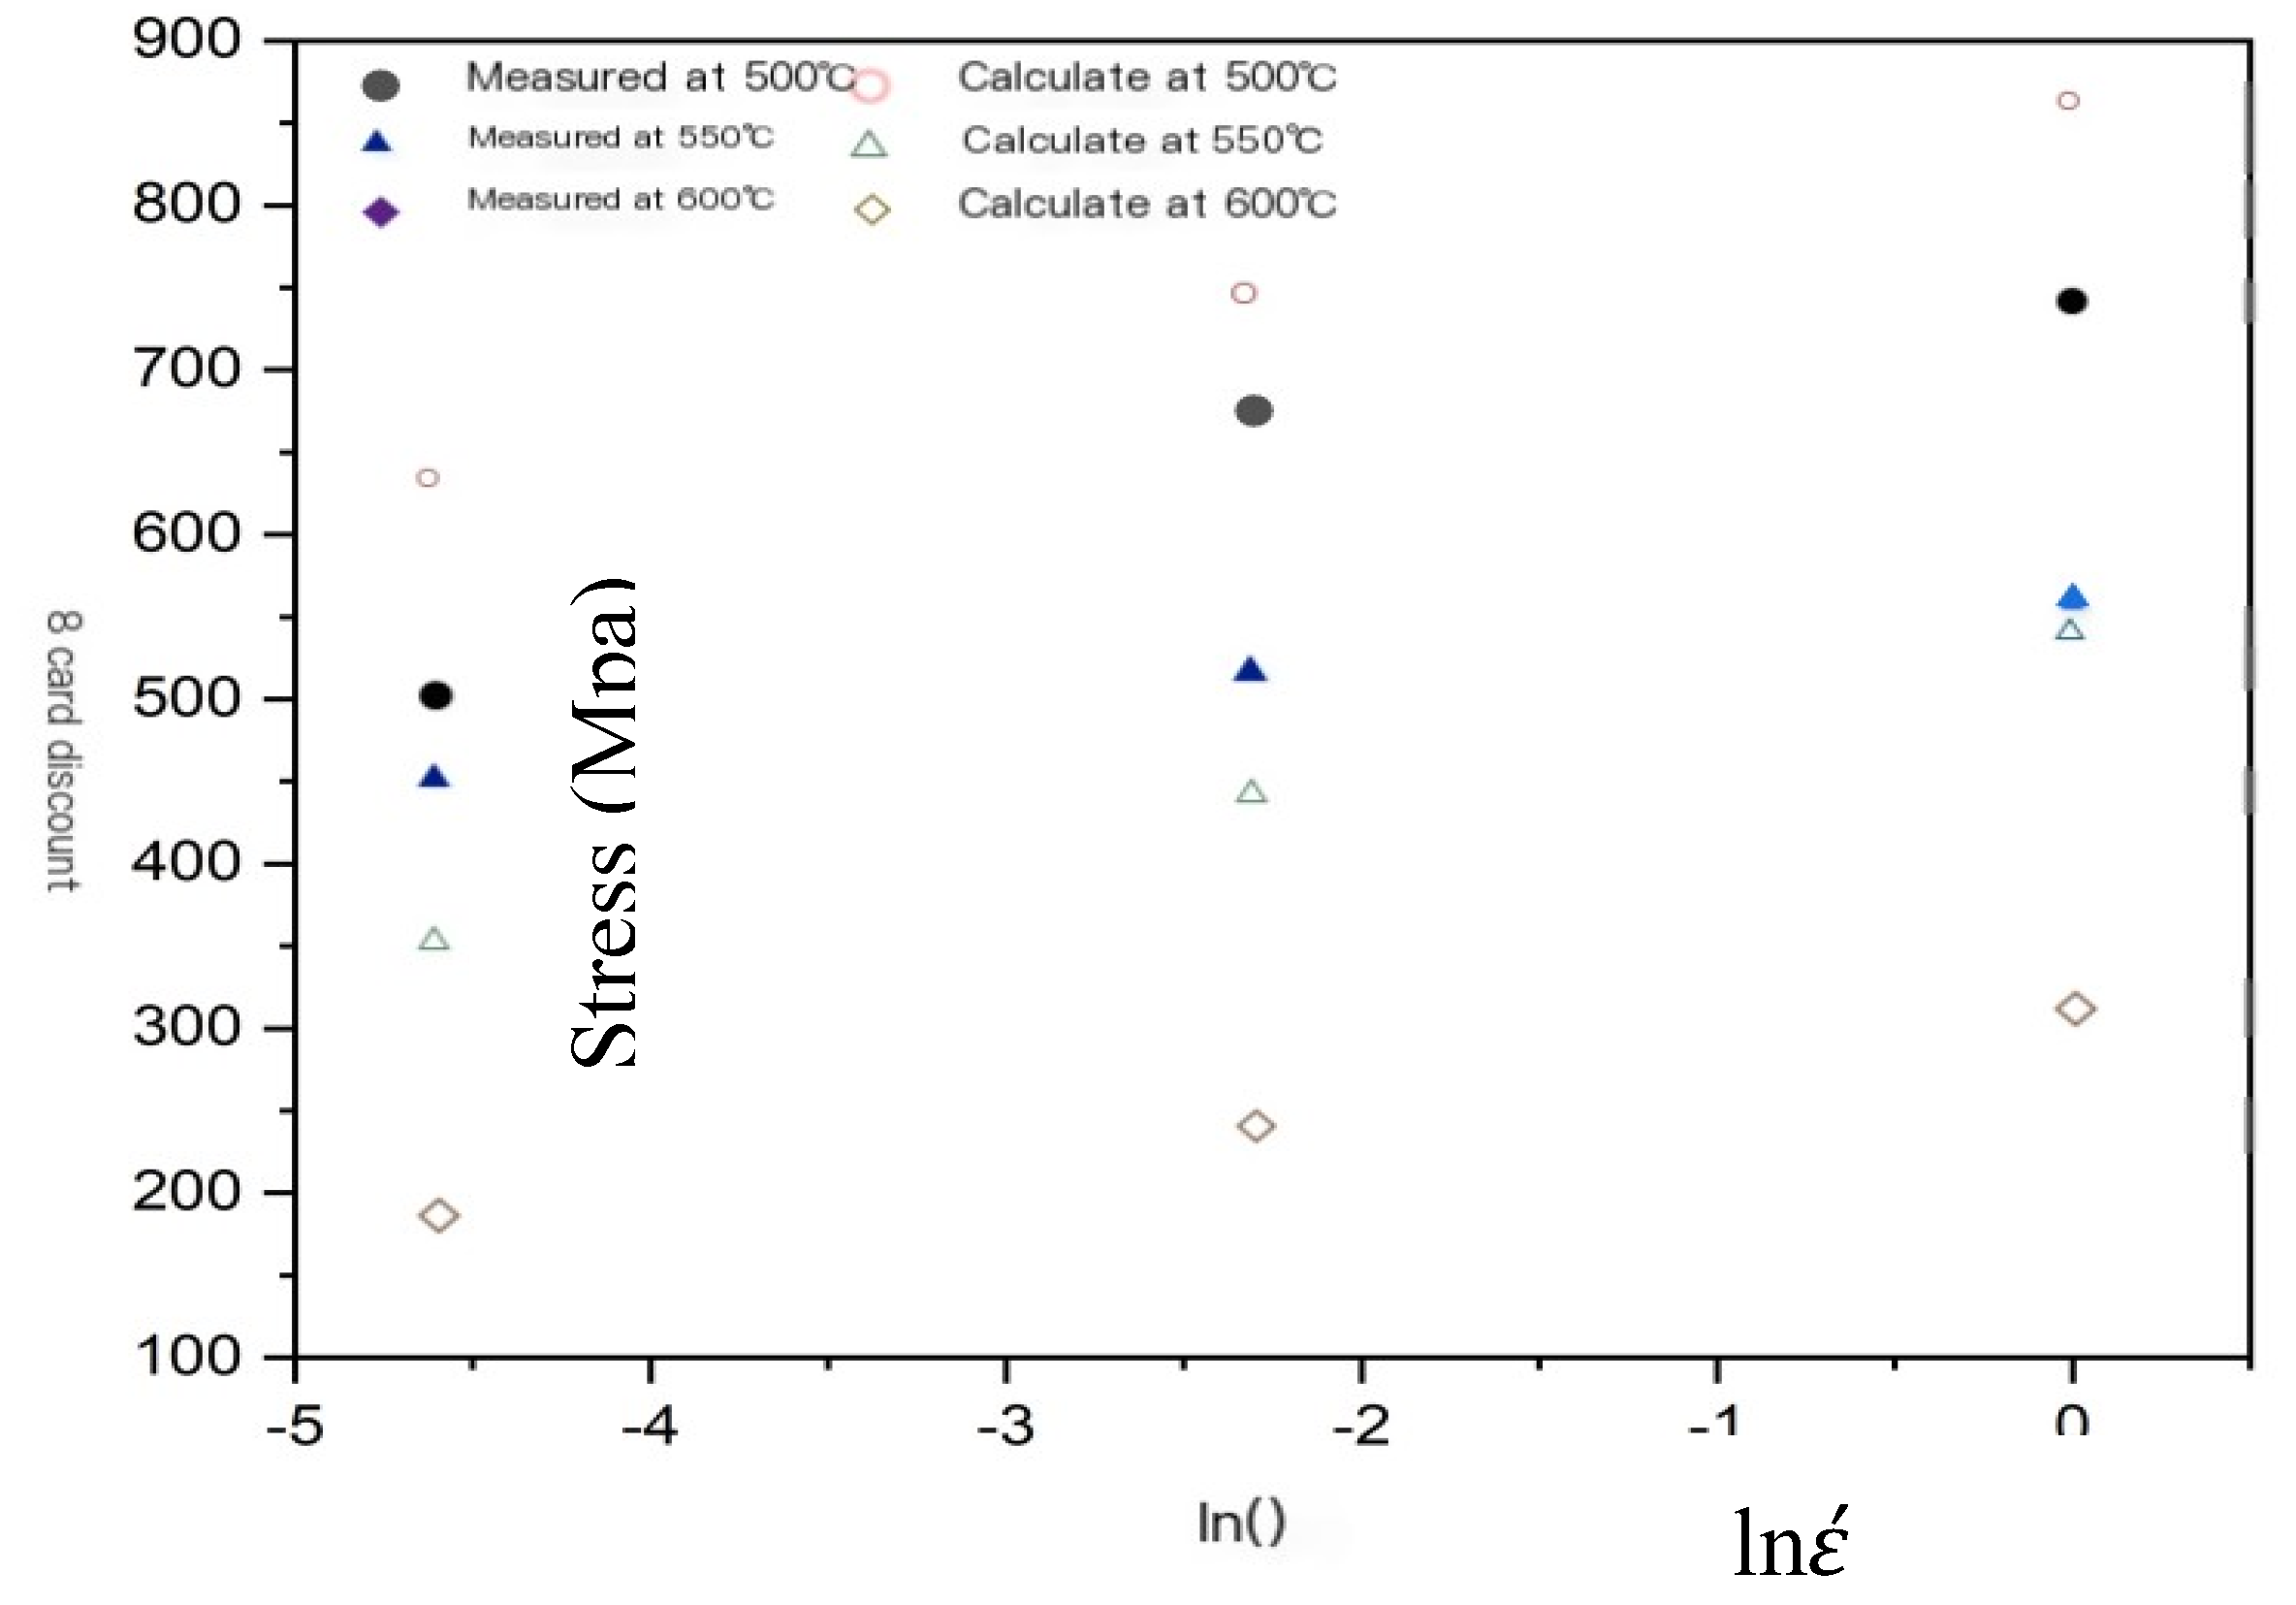
To verify the accuracy of the constitutive equation, the experimental results obtained under different temperatures and strain rates were substituted into equation (10) to theoretically calculate the peak stress. The calculated theoretical values were then compared with the measured peak stresses.
The theoretical and measured values of peak stress in Figure 12 are relatively close, indicating that the constitutive equation can effectively describe the relationship between temperature, deformation rate, and deformation resistance of U-50wt.%Zr metal-type fuel within the temperature range of 500℃~600℃ and strain rate range of 0.01s-1~1s-1.

2.5. Establishment of Hot Working Diagram

This article utilizes the DMM dynamic material model [16] to process experimental data from the Gleeble3800 thermal simulator, constructing a thermal processing diagram for U-50wt.%Zr metal-type fuel. During thermal deformation of the material, the total energy P can be calculated using equation (11).
P = G + J
In the formula: G represents the J energy consumed by plastic deformation (dissipation); represents the energy consumed by structural changes (dissipation).
During the deformation process of materials, the deformation stress and strain rate follow a power-law relationship, with the exponent being the strain rate sensitivity coefficient, which can be calculated using equation (12).
m = J G = l n σ l n ε ˙
J Calculate G using formulas (13) and (14).
G = 0 ε ˙ σ d ε ˙ = ε ˙ σ m + 1
J = 0 σ ε ˙ d σ = ε ˙ σ m m + 1
When m =1, the dissipation state of material thermal deformation is optimal, J reaching its maximum value, as shown in J m a x equation (15).
J m a x = ε ˙ σ 2
The energy dissipation efficiency of microstructural changes in materials during hot deformation can be calculated using equation (16).
η = J J m a x = 2 m m + 1
The instability of U-50wt.%Zr metal fuel during thermal deformation can be judged using criterion (17).
ξ ε ˙ = l n m m + 1 l n ε ˙ + m < 0
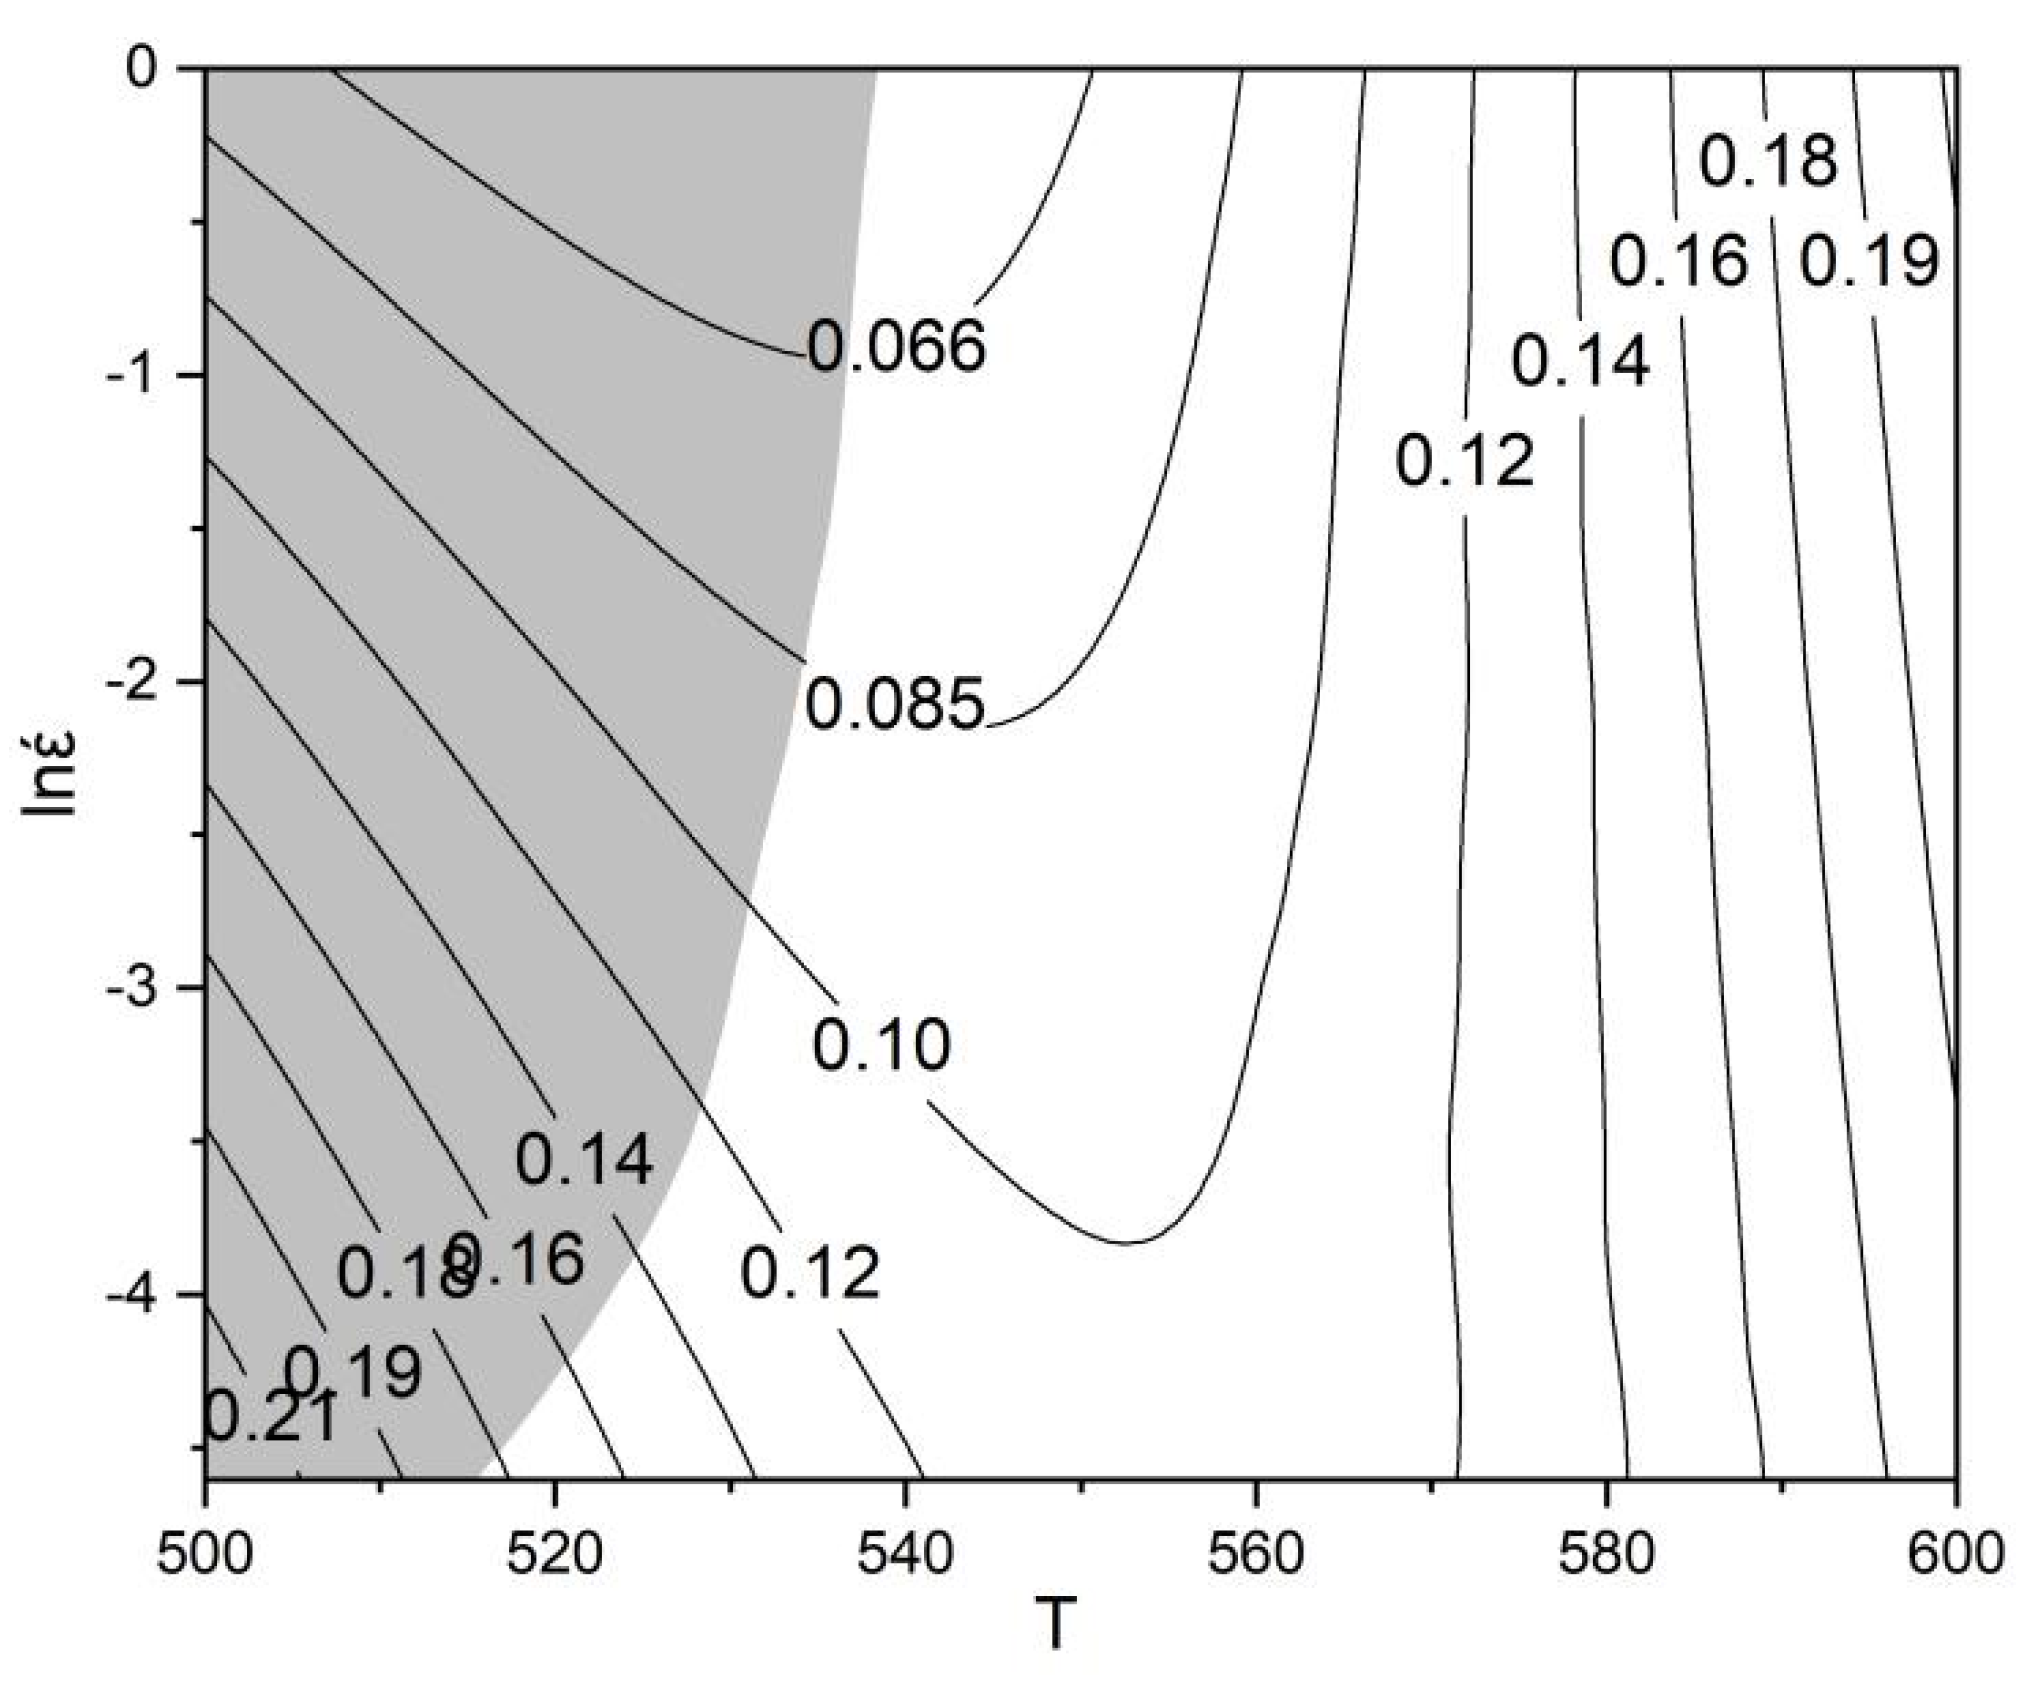
Using Origin, power dissipation diagrams and instability diagrams were plotted after arranging the data in a matrix η . These diagrams were then superimposed to establish a thermal processing diagram for U-50wt.%Zr metal-type fuel. Figure 13 shows the thermal processing diagram for U-50wt.%Zr metal-type fuel, where the contour lines represent the power dissipation factor. The gray area indicates the processing instability zone, while the white area represents the zone suitable for pressure processing. In the white zone, a higher power dissipation factor is beneficial for thermal pressure processing.

3. Conclusions

(1)The thermal deformation behavior of U-50wt.%Zr metal-type fuel at 600℃ under varying strain rates exhibits a pronounced dynamic recrystallization phenomenon. However, at 500℃ and 550℃, the dynamic recrystallization is less evident when the strain rate is high, with the thermal deformation behavior primarily characterized by work hardening. Under the same strain rate conditions, the higher the temperature, the lower the peak stress of deformation for U-50wt.%Zr metal-type fuel; conversely, at the same temperature, the faster the strain rate, the higher the peak stress of deformation for U-50wt.%Zr metal-type fuel.
(2) The microstructure of U-50wt.%Zr metal-type fuel was analyzed using a metallurgical microscope and an X-ray diffractometer. Under the same strain rate, the hot deformation temperature had an impact on its metallographic microstructure, such as changes in grain size. Overall, there were no significant changes in the shape and structure of grain boundaries and grains, and no phase transformation occurred in the microstructure. The XRD diffraction results showed that the phase of U-50wt.%Zr metal-type fuel after hot deformation was δ-UZr2 phase.
(3) During the thermal compression deformation of U-50wt.%Zr metal fuel, its peak stress, temperature, and strain rate basically satisfy the empirical Arrhenius hyperbolic sine equation. The constitutive equation fitted for U-50wt.%Zr metal fuel obtained through regression analysis method has a good agreement with the measured values at 600℃ during the experiment. Based on the dynamic material model, a thermal processing diagram for U-50wt.%Zr metal fuel was constructed. Through the thermal processing diagram, the instability zone and suitable temperature and strain rate parameters for pressure processing of U-50wt.%Zr metal fuel during processing were determined.

References

  1. Li Guanxing, Zhou Bangxin, Xiao Min. Research on the Overall Development Strategy of China’s New Generation Nuclear Energy and Nuclear Fuel [J]. China Engineering Science, 2019, 21(1): 6-11.
  2. Beausoleil G L, Cinbiz M N, Yao T, et al. U-50Zr Microstructure and Property Assessment for LWR Applications[R]. Idaho National Lab. (INL), Idaho Falls, No. INL/EXT-21-64614.
  3. (United States), 2021.
  4. Akabori, M, et al. 1995. “The Lattice Stability and Structure of δ-UZr2 at Elevated Temperatures.” Journal of Physics: Condensed Matter 7: 8249. [CrossRef]
  5. Raj S, B. Light water reactor (LWR) safety [J]. Nuclear Engineering and Technology, 2006, 38(8): 697-732.
  6. Huber Z F, Conte E R, Lavender C A, et al. Casting and Characterization of U-50Zr[R]. Pacific Northwest National Lab.(PNNL), Richland, WA (United States), 2023.
  7. Li Ning, Wang Chuanqi, Sun Zhenlin,et al.Hot Deformation Behavior and Constitutive Equation of an Ultralow-carbon Mircroalloyed Steel.[J/OL].Hot Wording Technology,2023. [CrossRef]
  8. Zhou Jialin, Tang Li, Ren Yong,et al.A Study on Behavior of Hot Deformation of Ultralow-carbon Nb-V-Ti Microalloyed Steel.[J].SPECIAL STEEL,2005,(03):15-18.
  9. Lu Yunjie, Liang Neng, Wu Shuai,et al.Hot deformation behavior and constitutive equation of low-carbon martensitic stainless steel.[J].Metallic Functional Materials, 2023, 30 (03) :41-49.
  10. Zhang Xuemin, Cao Fuyang, Yue Hongyan, et al. Establishment of constitutive equations of tc11 alloy during hot deformation [J]. Rare Metal Materials and Engineering, 2013, 42(5): 937-941.
  11. Eichel D. Atomic Diffusion in the Uranium-50wt. % Zirconium Nuclear Fuel System [D]. , 2013.
  12. Qing-song DAI, Yun-lai DENG, Jian-guo TANG, et al. Deformation characteristics and strain-compensated constitutive equation for AA5083 aluminum alloy under hot compression [J]. Transactions of Nonferrous Metals Society of China (English Version), 2019, 29(11): 2252-2261. [CrossRef]
  13. TIAN wei, LI Hong-bin, XU Shu-cheng, et al. Construction of material’s constitutive equation based on gleeble fast compression test[C]. //Proceedings of the 7th Annual Youth Academic Conference of China Metallurgy Society in 2014. 2014: 88-91. [CrossRef]
  14. Lun Jianwei, Liu Wei,Yang Yang, et al. High temperature plastic deformation behavior and constitutive equation establishment of 35CrMoV steel[J]. Forging Technology, 2021, 46(3): 216-220.
  15. Zener C, Hollomon J H.Effect of strain-rate upon the plastic flow of steel[J]. Journal of Physics D-Applied Physics. 1944, 15(1): 22-32. [CrossRef]
  16. Yao Zhihao, Dong Jianxin, Zhang Maicang, et al. Hot deformation behaviour of superalloy GH738[J]. Rare Metal Materials and Engineering, 2013, 42(6): 1199-1204.
Figure 1. High-frequency induction furnace used for casting U-50wt.%Zr metal fuel, along with photos of the melting ingot and its cross-sectional and longitudinal cuts.
Preprints 119217 g001
Figure 2. U-50wt.%Zr alloy processed into a cylindrical for sample of Φ6×10mm.
Preprints 119217 g002
Figure 3. Schematic diagram isothermal compression of test simple.
Preprints 119217 g003
Figure 4. Scanning Electron Microscope (SEM) and XRD testing results of U-50wt.%Zr metal-type fuel ingots.
Preprints 119217 g004
Figure 5. Metallographic examination results of U-50wt.%Zr metal-type fuel ingots.
Preprints 119217 g005
Figure 6. True stress-strain curves of U-50wt.%Zr metal fuel under different temperatures and strain rates.
Preprints 119217 g006aPreprints 119217 g006b
Figure 7. 3D peak stress diagram of U-50wt.%Zr metal fuel under different deformation conditions.
Preprints 119217 g007
Figure 8. Metallographic images (200×) of U-50wt.%Zr metal fuel after thermal deformation at different temperatures.
Preprints 119217 g008aPreprints 119217 g008b
Figure 9. XRD results of U-50wt.%Zr alloy after thermal deformation at different temperatures.
Preprints 119217 g009
Figure 10. The relationship between strain rate and peak strain under different temperature conditions.
Preprints 119217 g010aPreprints 119217 g010b
Figure 11. The relationship between l n Z l n sinh α σ .
Preprints 119217 g011
Figure 12. Comparison of theoretical and measured values calculated by constitutive equations.
Preprints 119217 g012
Figure 13. Thermal processing diagram of U-50wt.%Zr metal-type fuel.
Preprints 119217 g013
Table 1. Fission gas release (FGR) and volumetric swelling data for various U-Zr alloys ir radiated at approximately 600℃.
sample at% Zr FGR/% ΔV/V/(%)
Zr12 alloy 30 7.7 40
Zr14 alloy 30 7.2 46
Zr6 10 9.7 61
Zr7 30 12.5 67
Zr10 alloy 30 10.5 42
Zr5 alloy 10 15.7
Zr1(δ-UZr2) 70 0.02 3
Disclaimer/Publisher’s Note: The statements, opinions and data contained in all publications are solely those of the individual author(s) and contributor(s) and not of MDPI and/or the editor(s). MDPI and/or the editor(s) disclaim responsibility for any injury to people or property resulting from any ideas, methods, instructions or products referred to in the content.
Copyright: This open access article is published under a Creative Commons CC BY 4.0 license, which permit the free download, distribution, and reuse, provided that the author and preprint are cited in any reuse.
Prerpints.org logo

Preprints.org is a free preprint server supported by MDPI in Basel, Switzerland.

Subscribe

© 2024 MDPI (Basel, Switzerland) unless otherwise stated