1. Introduction
The composition of soil microbial communities is typically characterized by a mixture of highly abundant and low abundant types [
1]. The character of the community depends on physical environmental parameters such as temperature and humidity, but also strongly dependent on chemical parameters such as soil pH, salinity, organic nutrients and bioavailability of trace elements. In addition, ecological interactions between macro- and microorganisms are an important factor. This includes promotion or suppression by secondary metabolites and metabolic couplings among soil bacteria [
2].
Soils are built mostly by a complex spatial structure consisting of a hierarchy of inorganic and organic particles with sizes between millimetres and the nanometers and a corresponding pore size hierarchy. This results into a certain decoupling of small subspaces in which different compositions of microbial communities can evolve in close neighbourhood. The high microbial diversity found in many soils is related to this three-dimensional network of small local biocenoses, which are more or less weakly connected by – mostly diffusive – exchange of chemical components in the pore water and active motion of microorganisms.
The composition of a soil bacterial community has to be understood from its dynamic behaviour [
3]. It has to be assumed that in each local microbial community only a few types are highly metabolically active according to the specific local growth conditions. These fast growing types dominate the bacterial community in terms of abundance. Besides them, there have to be expected other slower growing types and non-growing types with a low level of metabolic activity and a huge number of low and very low abundant types without metabolic activity are to be expected, representing so-called “dormant” states [
4]. The large number of different low abundance bacteria which form the high diversity in soil is responsible for the flexibility in reaction of soil microbial communities on environmental changes. The ensemble of dormant types preserves information about earlier existing different environmental conditions. On the other hand, it forms a reservoir for responding to possible future environmental changes [
5,
6]. This above sketched picture of expected functions and structure of local soil bacterial communities results in a typical form of rank abundance distribution (RAD).
RADs are used for many decades to quantitatively describe the composition of communities. Typically, they are applied for ordering related species. The abundance functions are marked by a non-linear character, reflecting always the mixture of a few high abundance types with a moderate number of medium abundance types and a large number of low abundance species. Different models have been developed to describe RADs, including log-normal distributions [
7,
8,
9,
10,
11]. The quantitative mixture character should be understood not only as an expression of recent ecological relationships and niche differentiation, but is also to recognize as a result of a certain ecological evolution [
12]. The community reflects both recent local environmental conditions and their previous changes in the local past [
13,
14]. This view is consistent with the concept of “ecological memory”, in which each community has to be regarded as a product of the local environmental history of a place [
15]. The effect of ecological memory is relevant on short time scales, where highly dynamic bacterial communities evolve, but it also affects slow processes and larger time scales [
16].
Besides naturally occurring environmental changes, the impact of human activities on soil modifies the growth behaviour and competitive conditions of soil bacteria. Recent evidence suggests that components of soil bacterial communities can supply information about changes in soil due to the formerly use of places by humans [
17,
18,
19]. This human impact is quite obvious for recent changes due to industrial activities or the release of contaminations into the environment [
20,
21,
22,
23], but also seems to play a role for pre-industrial handcraft, settlement, mining and agricultural activities that may date back to prehistory [
24,
25,
26,
27,
28].
In the following, data sets of 16S rRNA sequences from soil samples from different places, including soil samples from archaeological excavations, are used to search for possible traces of ancient human impact in the abundance distributions of soil bacteria.
3. Results and Discussions
3.1. Temporal Order-Related Hypothesis for Interpretation of Rank Orders in Bacterial Abundances
Regarding the growth rate of bacteria, two different cases have to be distinguished at least: bacteria which grow and multiply rapidly under optimal conditions, but grow slowly or stagnate under less suitable environmental conditions, on the one hand, and bacteria that always grow slowly or stagnate, on the other hand. For the last-mentioned group, it is difficult to determine from NGS data whether the bacteria are active or inactive if their abundances are low compared to the abundances of other bacteria at the same place. It has to be assumed that such bacteria are usually present only in low concentrations.
In contrast, fast-growing bacteria can be high or low abundant, with high abundance always signalize a recent high growth activity or a high activity in the recent past. If the local environmental conditions – nutrients availability, humidity or others - are changed, a first growing bacterial type cannot grow any longer. Vegetative cells of this bacterium may die quickly. But, a certain part of the cells might switch into a dormant state, like spores in the case of spore-forming species. In this state, it can survive for a long time, in principle. Meanwhile, there are evidences that such dormant cells can survive and remain capable of reproduction for millennia or even millions of years under suitable conditions. It can be assumed that the concentration of dormant cells of a formerly active bacterium also decreases, but much more gradually than in the case of vegetative cells. This would result in a decay function with kinetic parameters depending on the sensitivity of the bacterium and the aggressiveness of the changed environment. Despite of these individual differences, a certain tendency can be expected, that bacteria which had been active for a long time will be decayed to lower concentrations than bacteria with formerly active phases in the recent past. As a result, the rank orders of bacterial abundance include to a certain extend a temporal order of formerly activity of bacterial types.
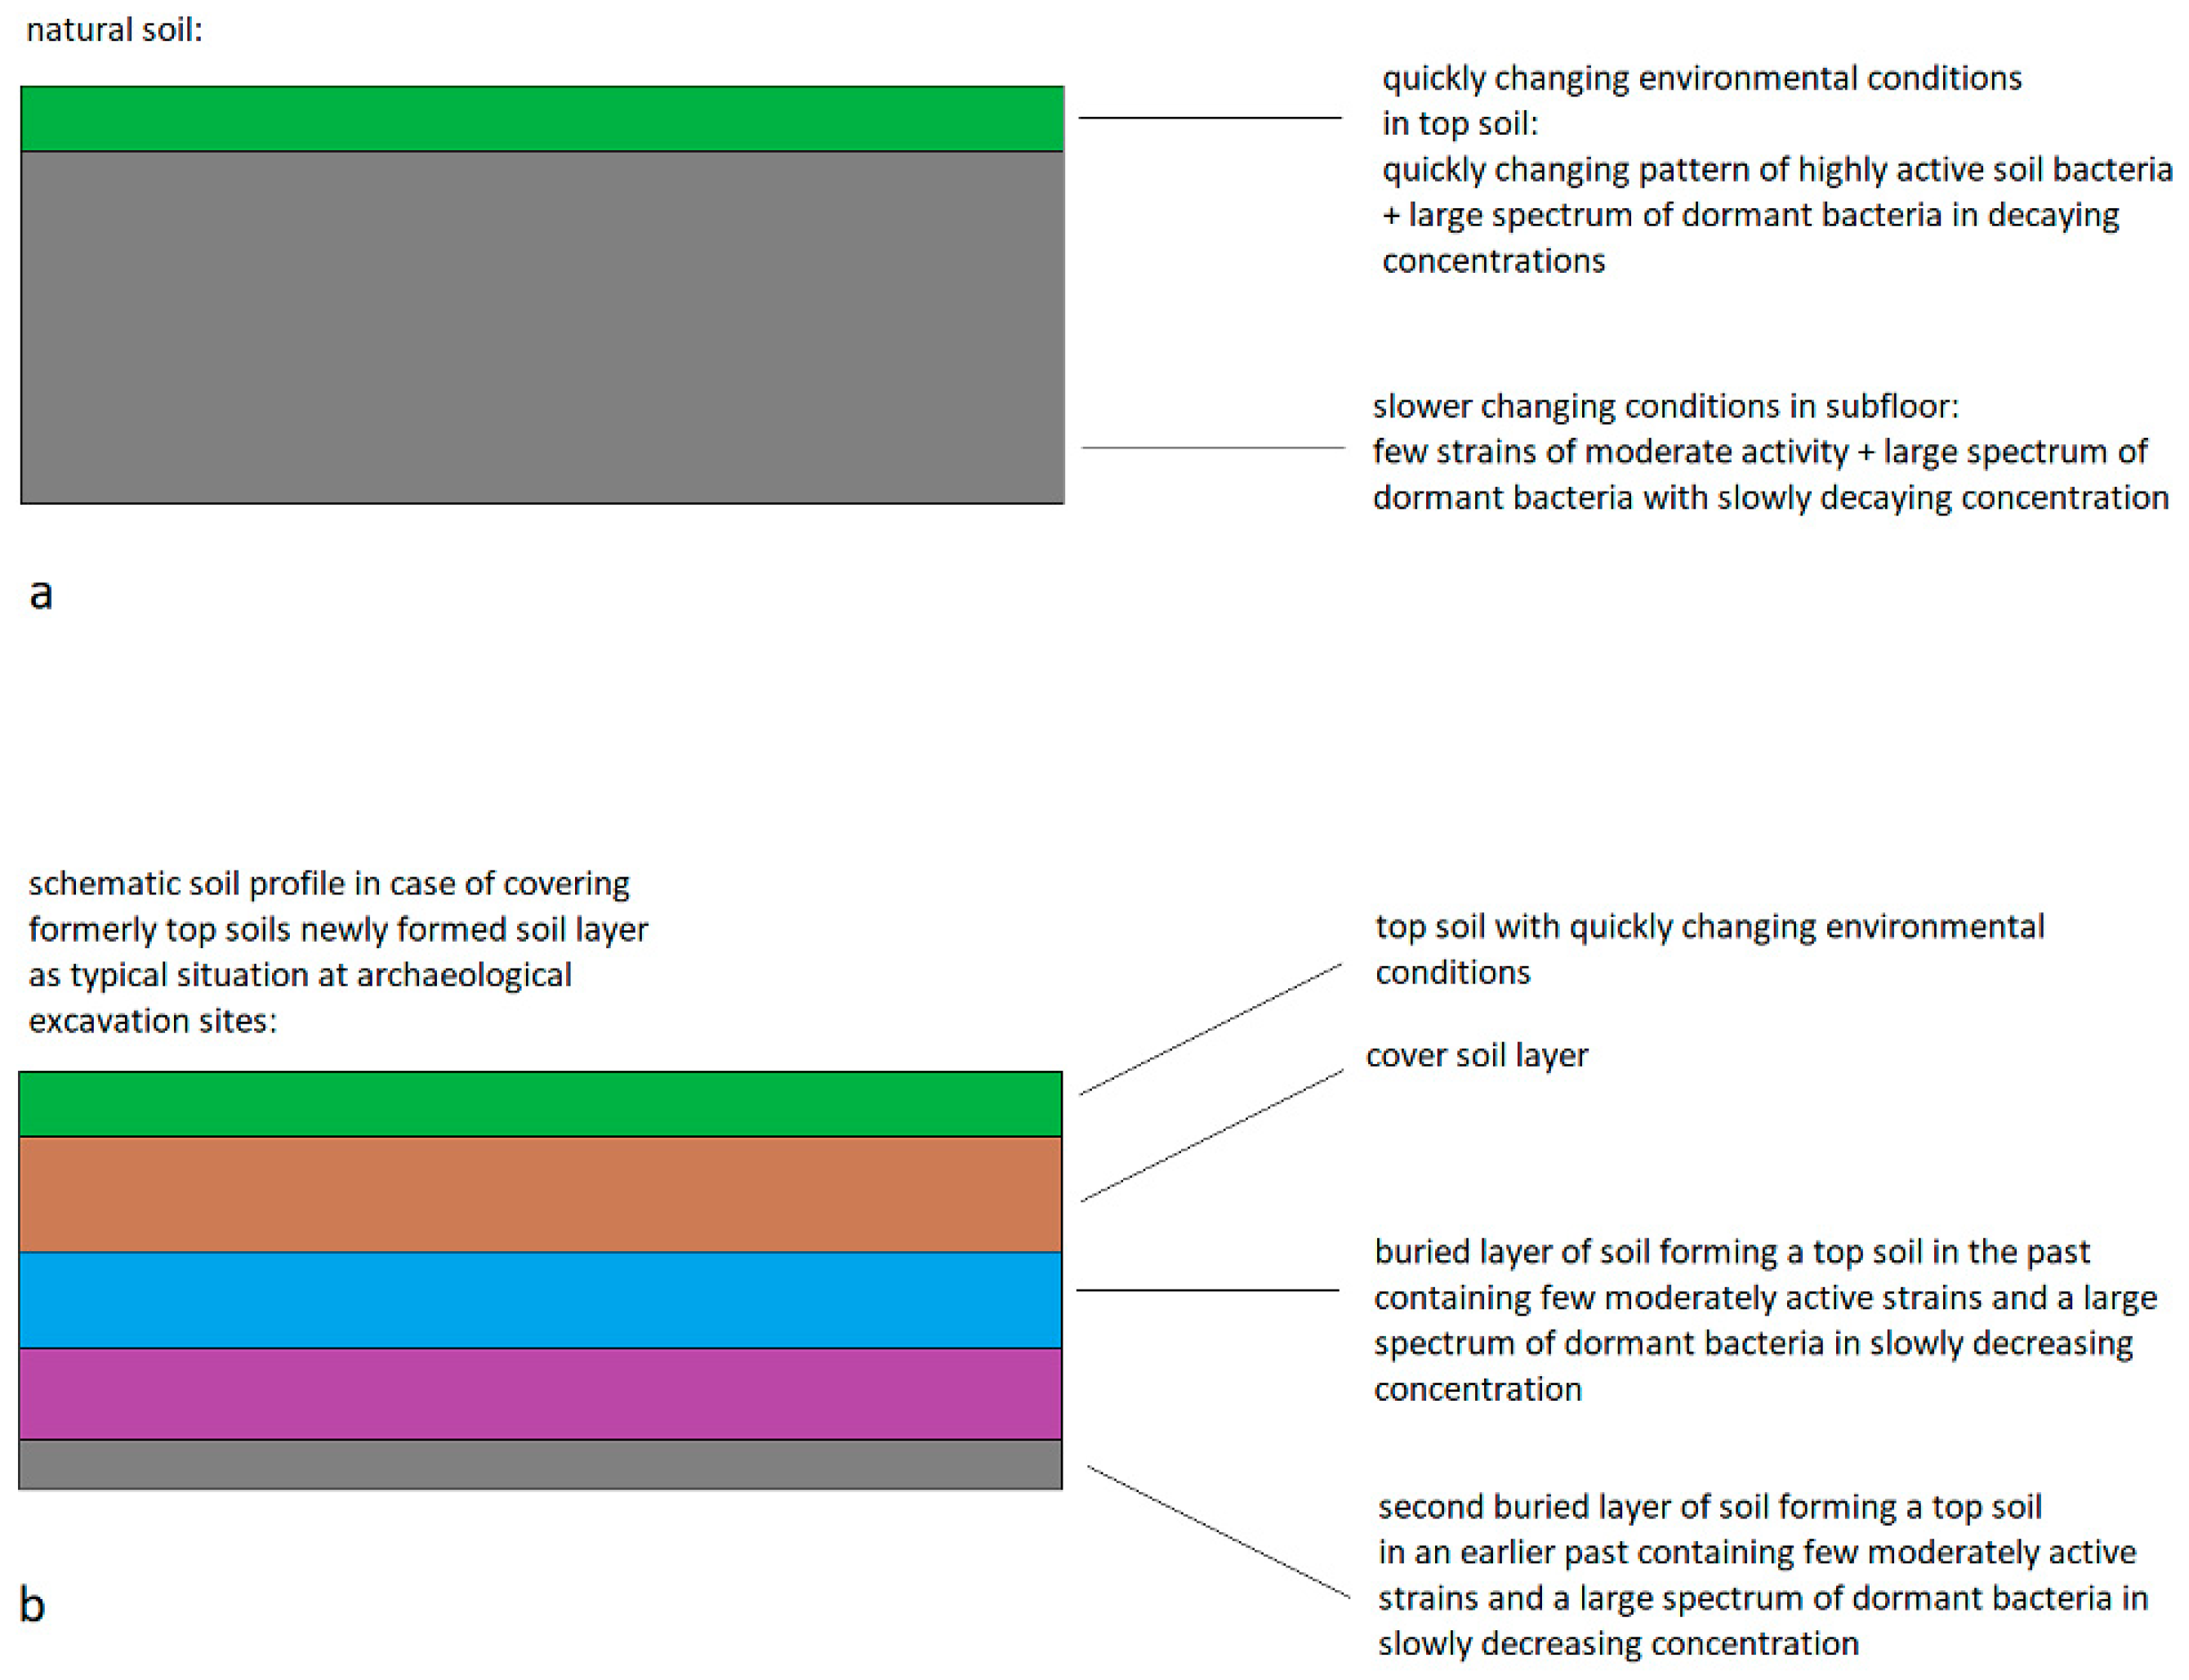
It has to be assumed that the decay functions are different in the top soil and the bottom soil: It must be considered that the faster and stronger changing environmental conditions in the top soil cause a rapid change in the patterns of highly active bacterial strains. The decay of less active and dormant bacteria is probably slower in deeper layers of undisturbed soil. When formerly active topsoil layers are buried by natural or human activities, the topsoil layers and their bacterial community are brought into a ground soil situation. On the one hand, chemical conditions of the soil can be stored and cause a certain composition of the bacterial community in the buried soil. On the other hand, the concentrations of formerly types of active and less active bacteria are slowly decreasing (
Figure 1). Therefore, it can be expected that bacterial community patterns of soil samples from archaeological excavations are not only storing information about preserved specific chemical conditions in the soil (e.g. composition of nutrients, pH, salinity, toxic components), but also carry information about non-preserved formerly soil conditions corresponding to less abundant decaying components of formerly bacterial communities.
3.2. Model of Formation of Rank Order Functions by Successive Change of Growth Conditions
In this section, a very simple model is proposed to quantitatively describe the formation of a rank order function of soil bacterial communities. This model is based on the assumption that the rank order function is determined, at least partially, by a succession of dominant bacteria due to changing environmental conditions. It is clear that the environmental changes occur on very different time scales and include periodic changes – such as seasonal conditions. Thus, the resulting abundances have to be understood as a complex superposition of the responses of all bacteria to changes on different time scales. Despite this complexity, a highly simplified approach is proposed below to develop a way to illustrate the possible formation of rank order functions of bacterial abundances which is mainly determined by the temporal succession of bacterial activities.
First, it is postulated that the transition between a dormant and a highly active state of a bacterial type occurs quickly. This assumption is based on the fact that exponential growth of the newly promoted bacterial type is most likely after a change in conditions. After exponential growth, the concentration of active bacteria will pass through a more or less extended maximum and then decline.
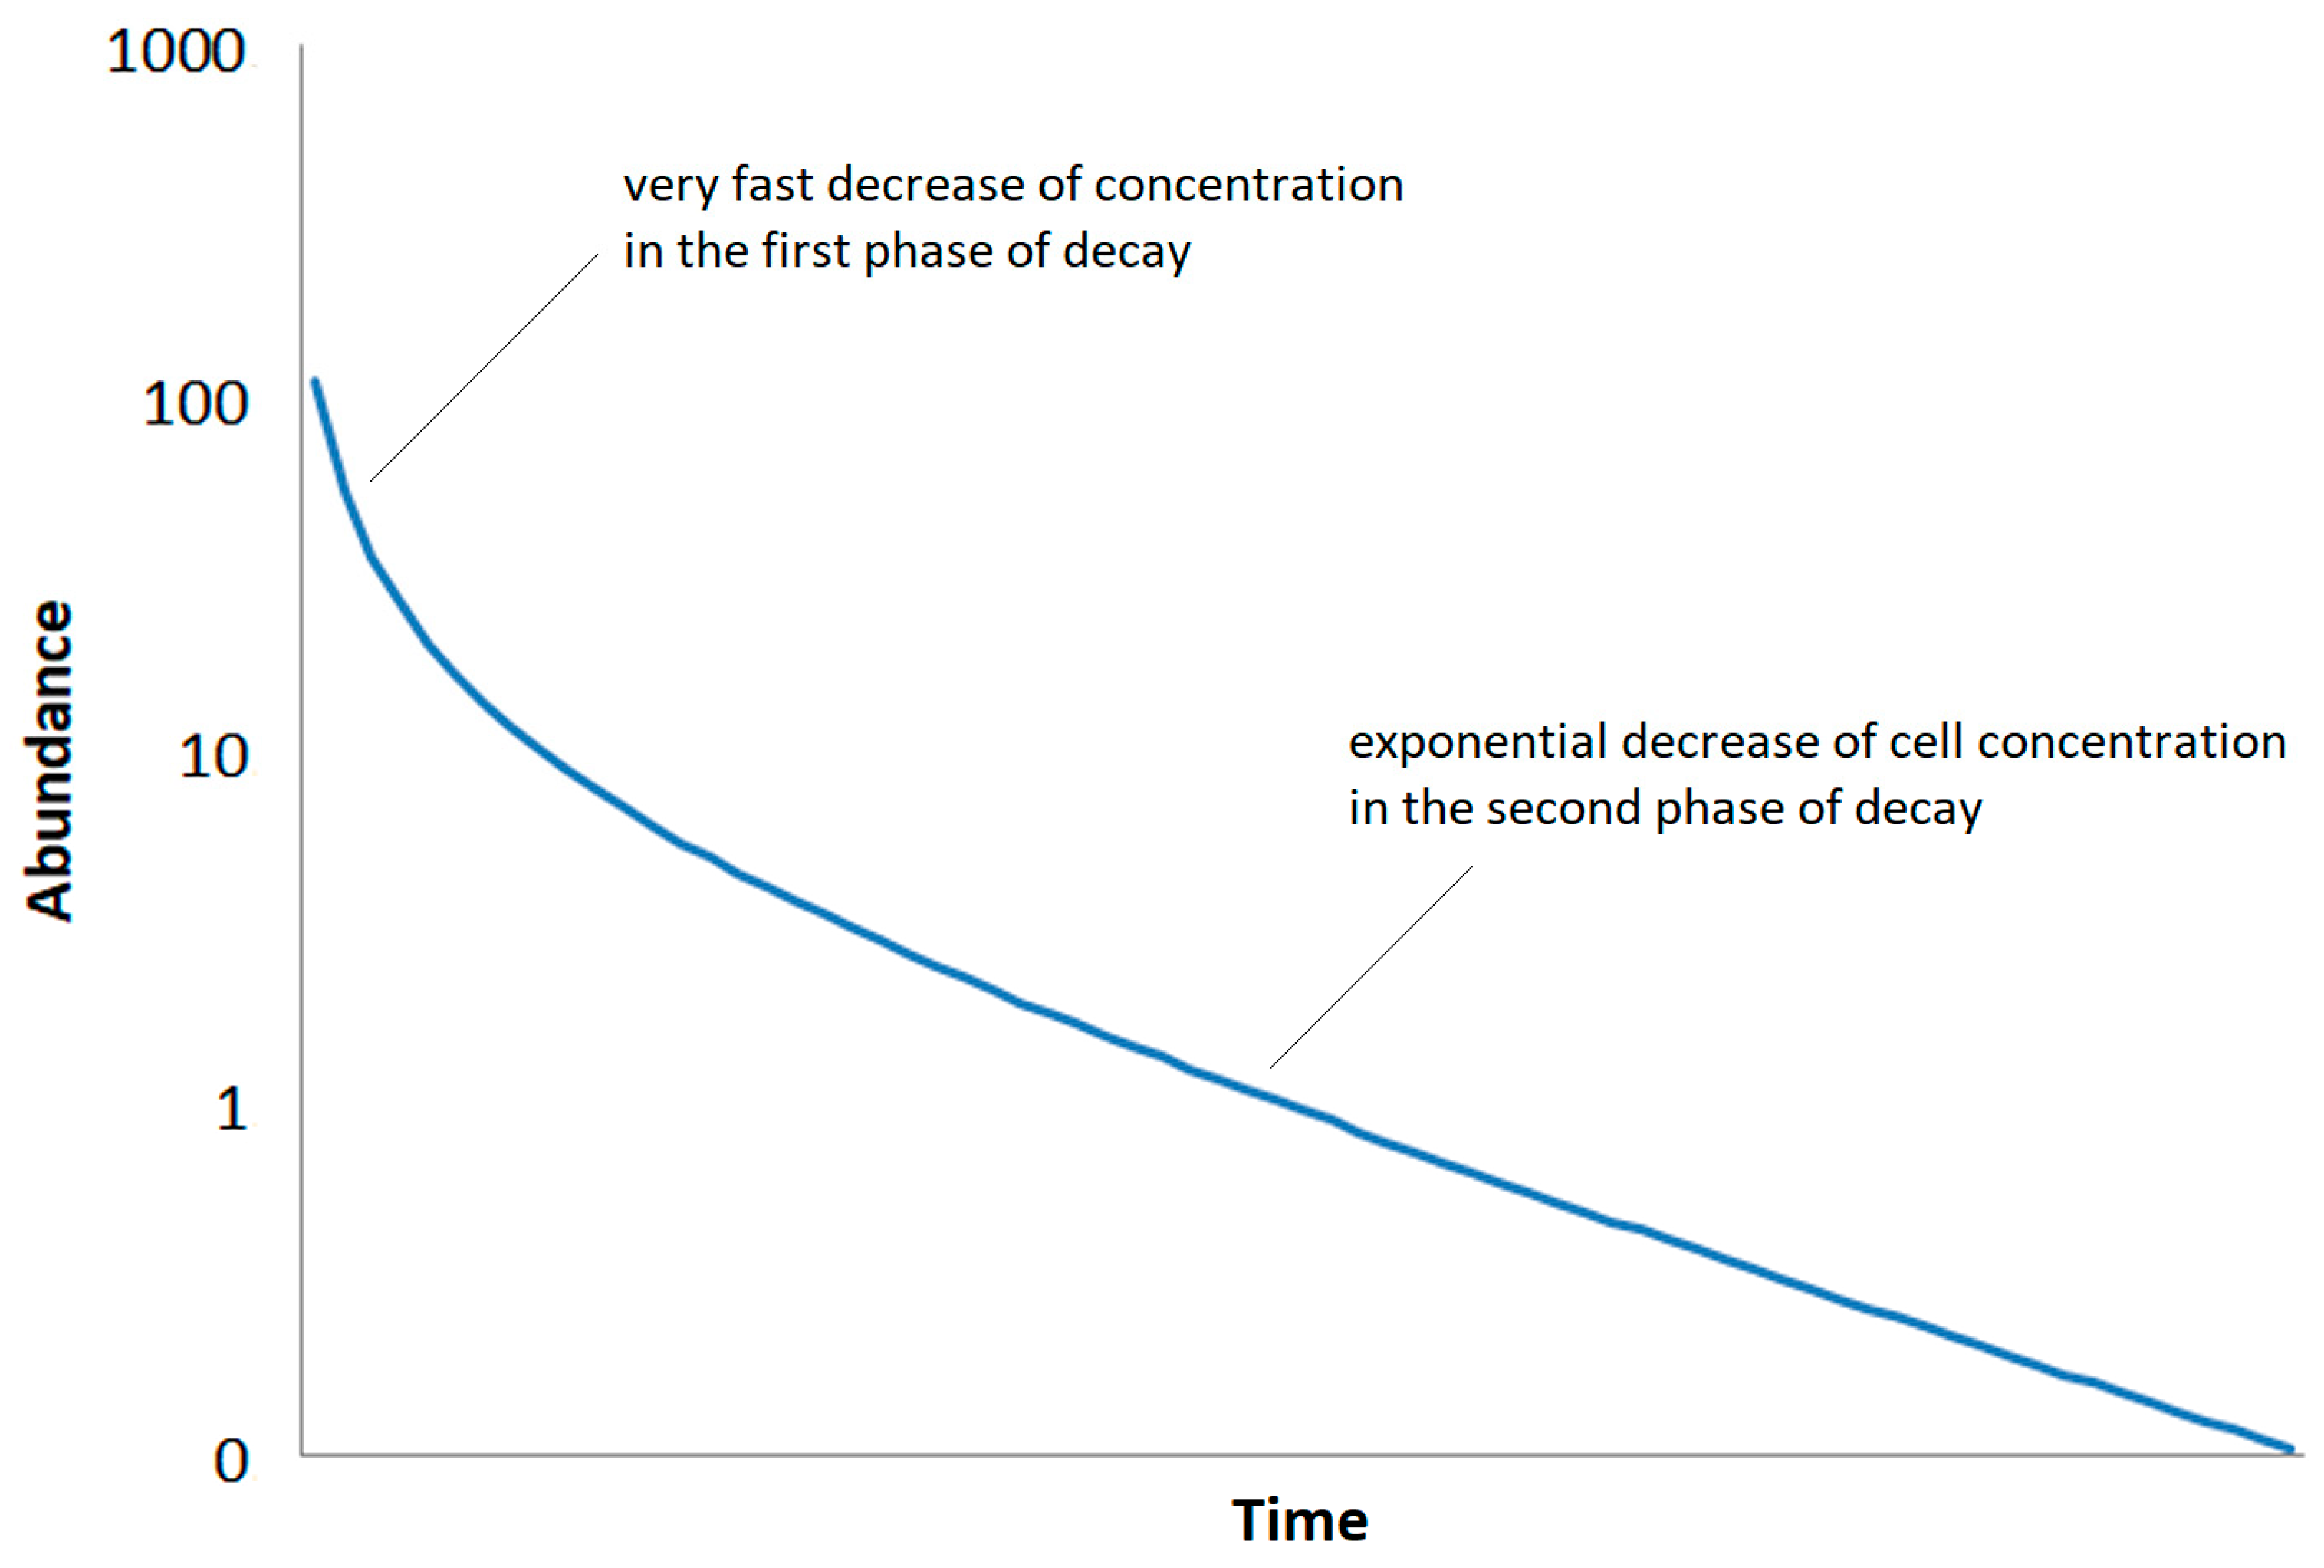
Second, it is assumed that the decay after a phase of high activity is divided into two phases: In the first phase, a fast decrease in the concentration of bacteria associated with the death of vegetative cells. The second phase is determined by the gradual decrease in the concentration of the dormant forms of cells. This decrease is much slower than the decrease in the first phase (
Figure 2). This behaviour can be easily simulated by following the iterative decay function:
The cell concentration for each step c
i are given by the cell concentration in the previous step c
(i-1) and the rate constants for the both decay reactions k
1 and k
2. The strong decay in the first process is simulated by the exponent a (in case shown in
Figure 2: a = 1.8).
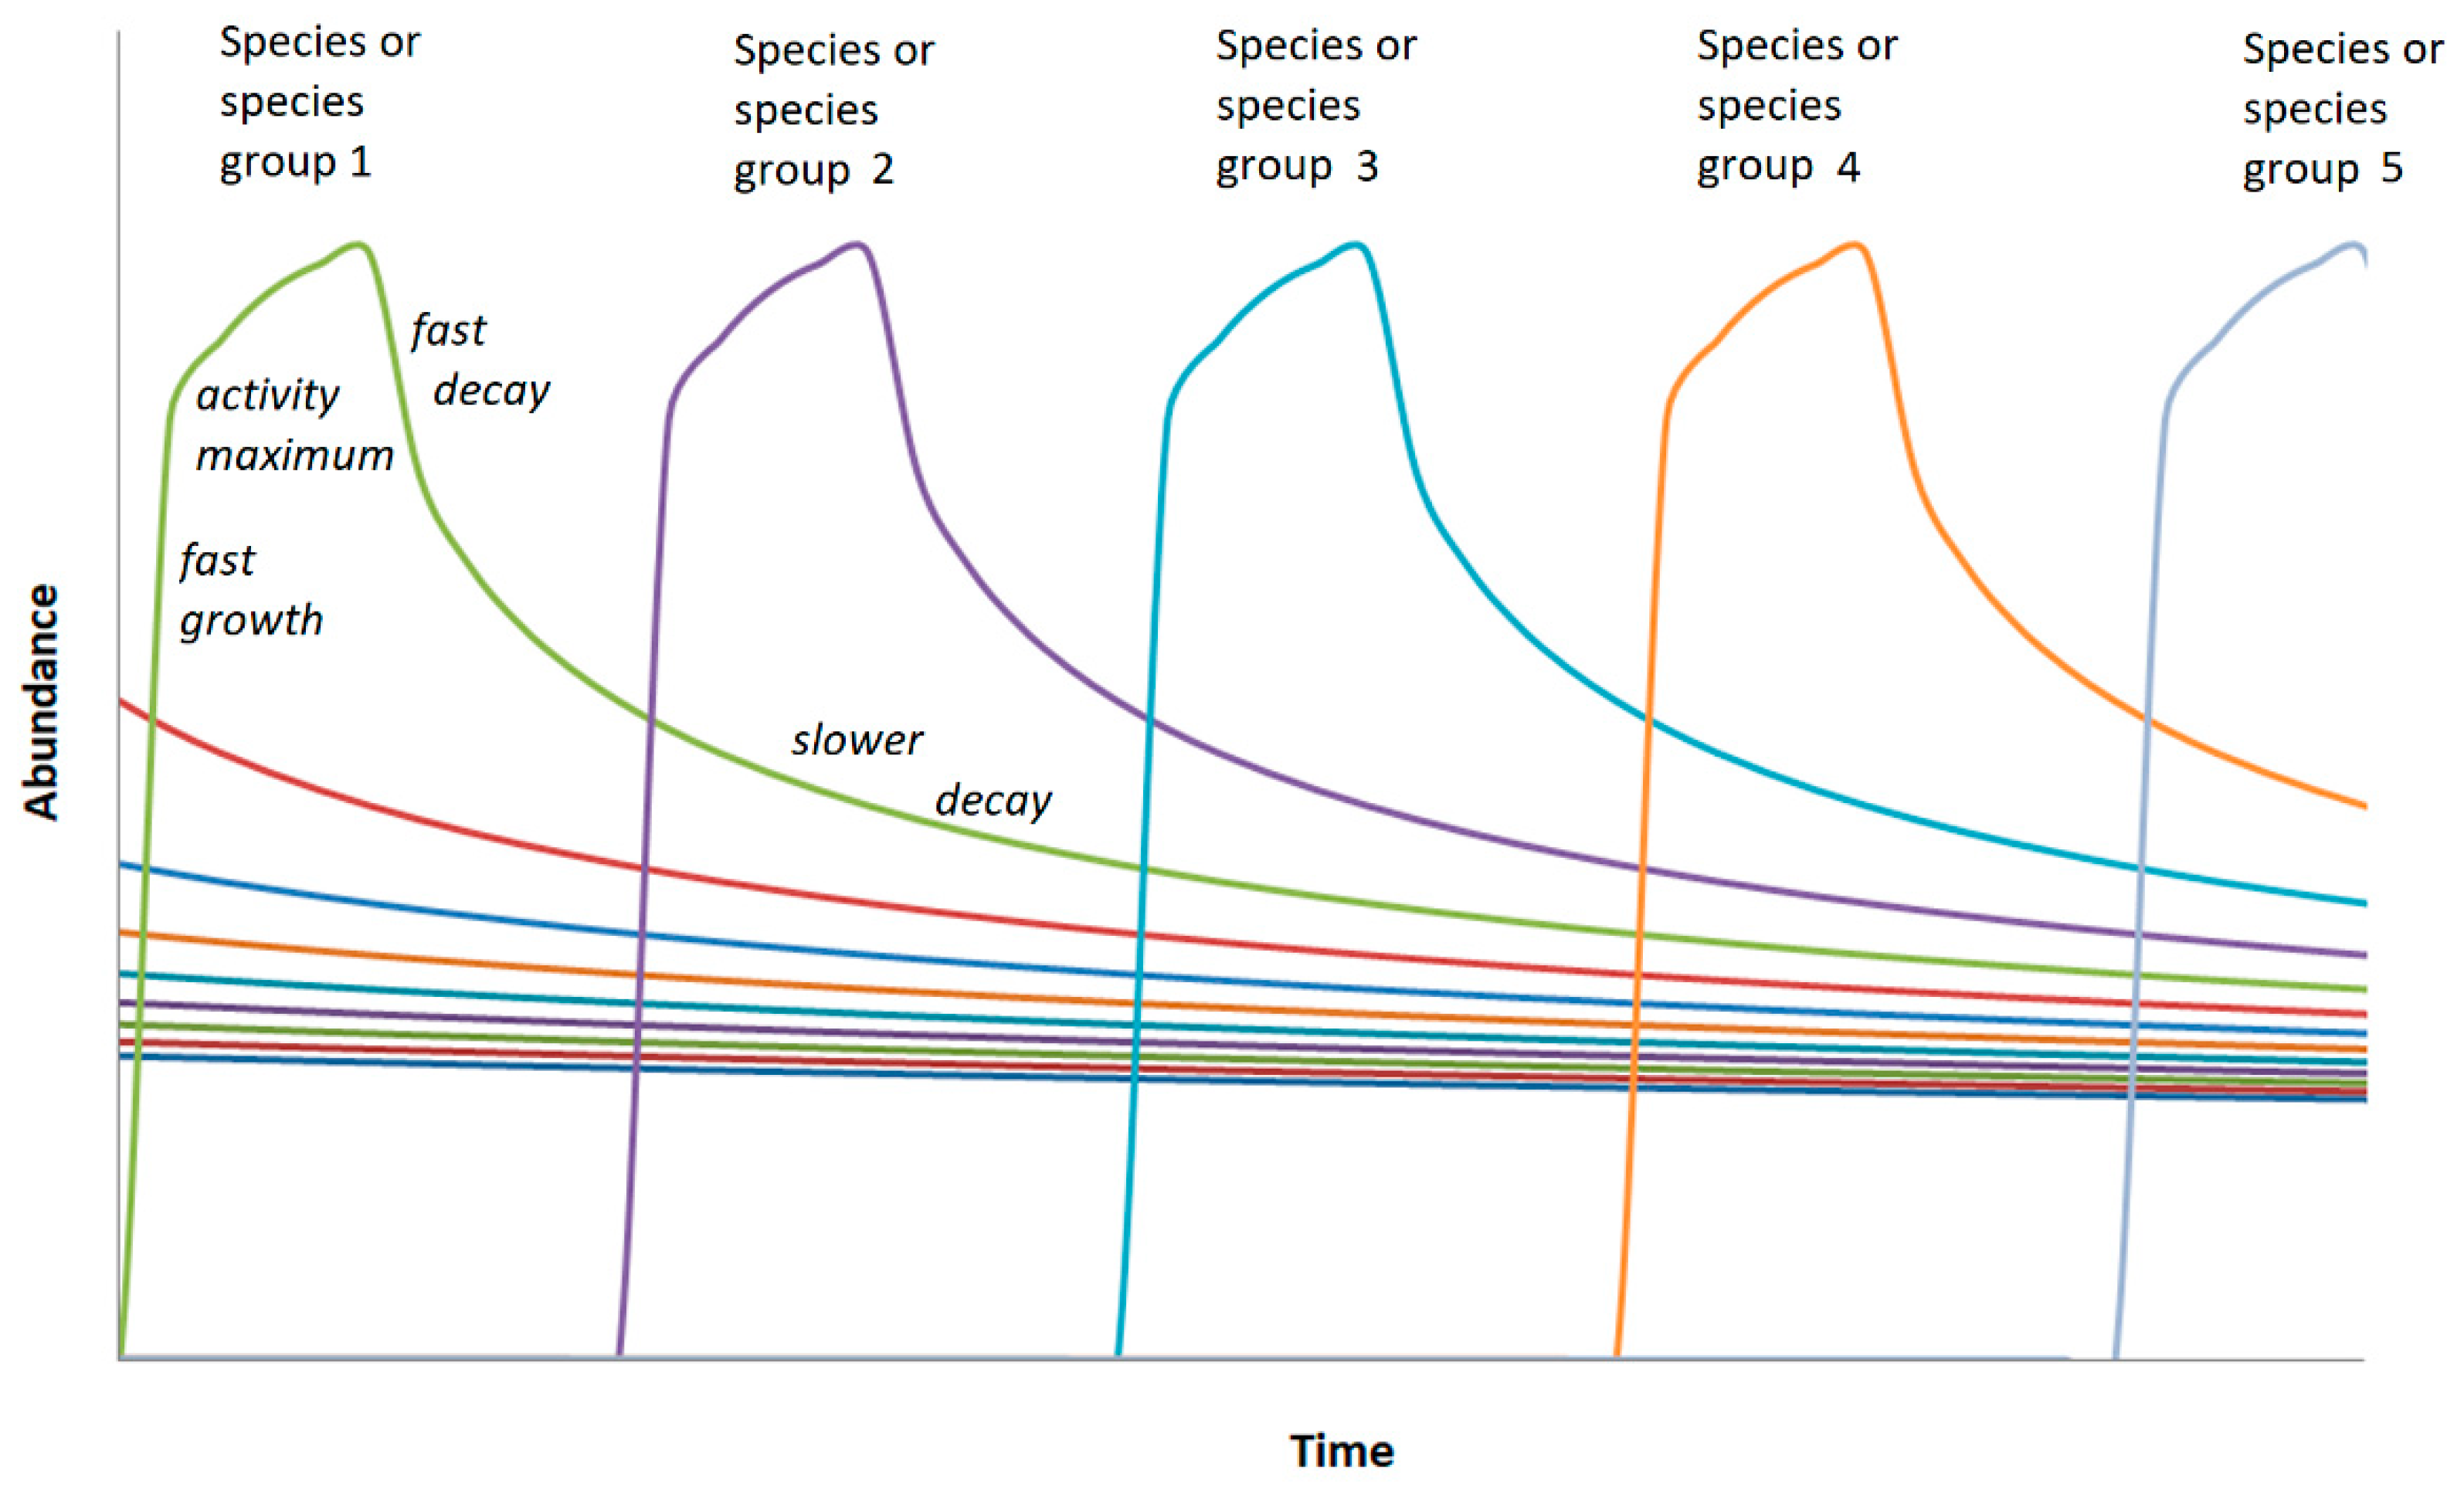
Third, it is assumed that the abundance rank function results from a succession of dominant bacteria. For the simulation, a simple regular succession is assumed (scheme in
Figure 3). The resulting abundance distribution then results from the superposition of the successively active bacteria.
Following the above described simple kinetic rules described above for the single bacteria types, a general rank order function is obtained. This general rank order function can also be described by the superposition of two decay functions. The number of reads N as a function of inverse rank i (ordered by decreasing number of reads) can be described in dependence of two decay rate constants f
1 and f
2 with two additional fitting parameters adapted to the order of magnitude of highest read number N
max and an extrapolated starting read number N
0 for assuming a simple exponential decay, considering only OTUs with lower and intermediate read numbers:
In a logarithmic plot, the graph of this function shows a typical shape with a nonlinear decay for the OTUs wit highest abundances (lowest invers rank) and a nearly linear decay for the OTUs with mediate and low abundances (highest invers rank; scheme in
Figure 4).
The character of this model-derived rank order corresponds rather well with the typical general character of simple rank order functions of experimentally found in many soil samples. It reflects the expected character of the abundance distribution with a low number of high abundance types and a high number of low abundance bacteria.
3.3. Comparison of Simulated Rank Order Functions with Abundance Functions of Selected Human-Impacted Places
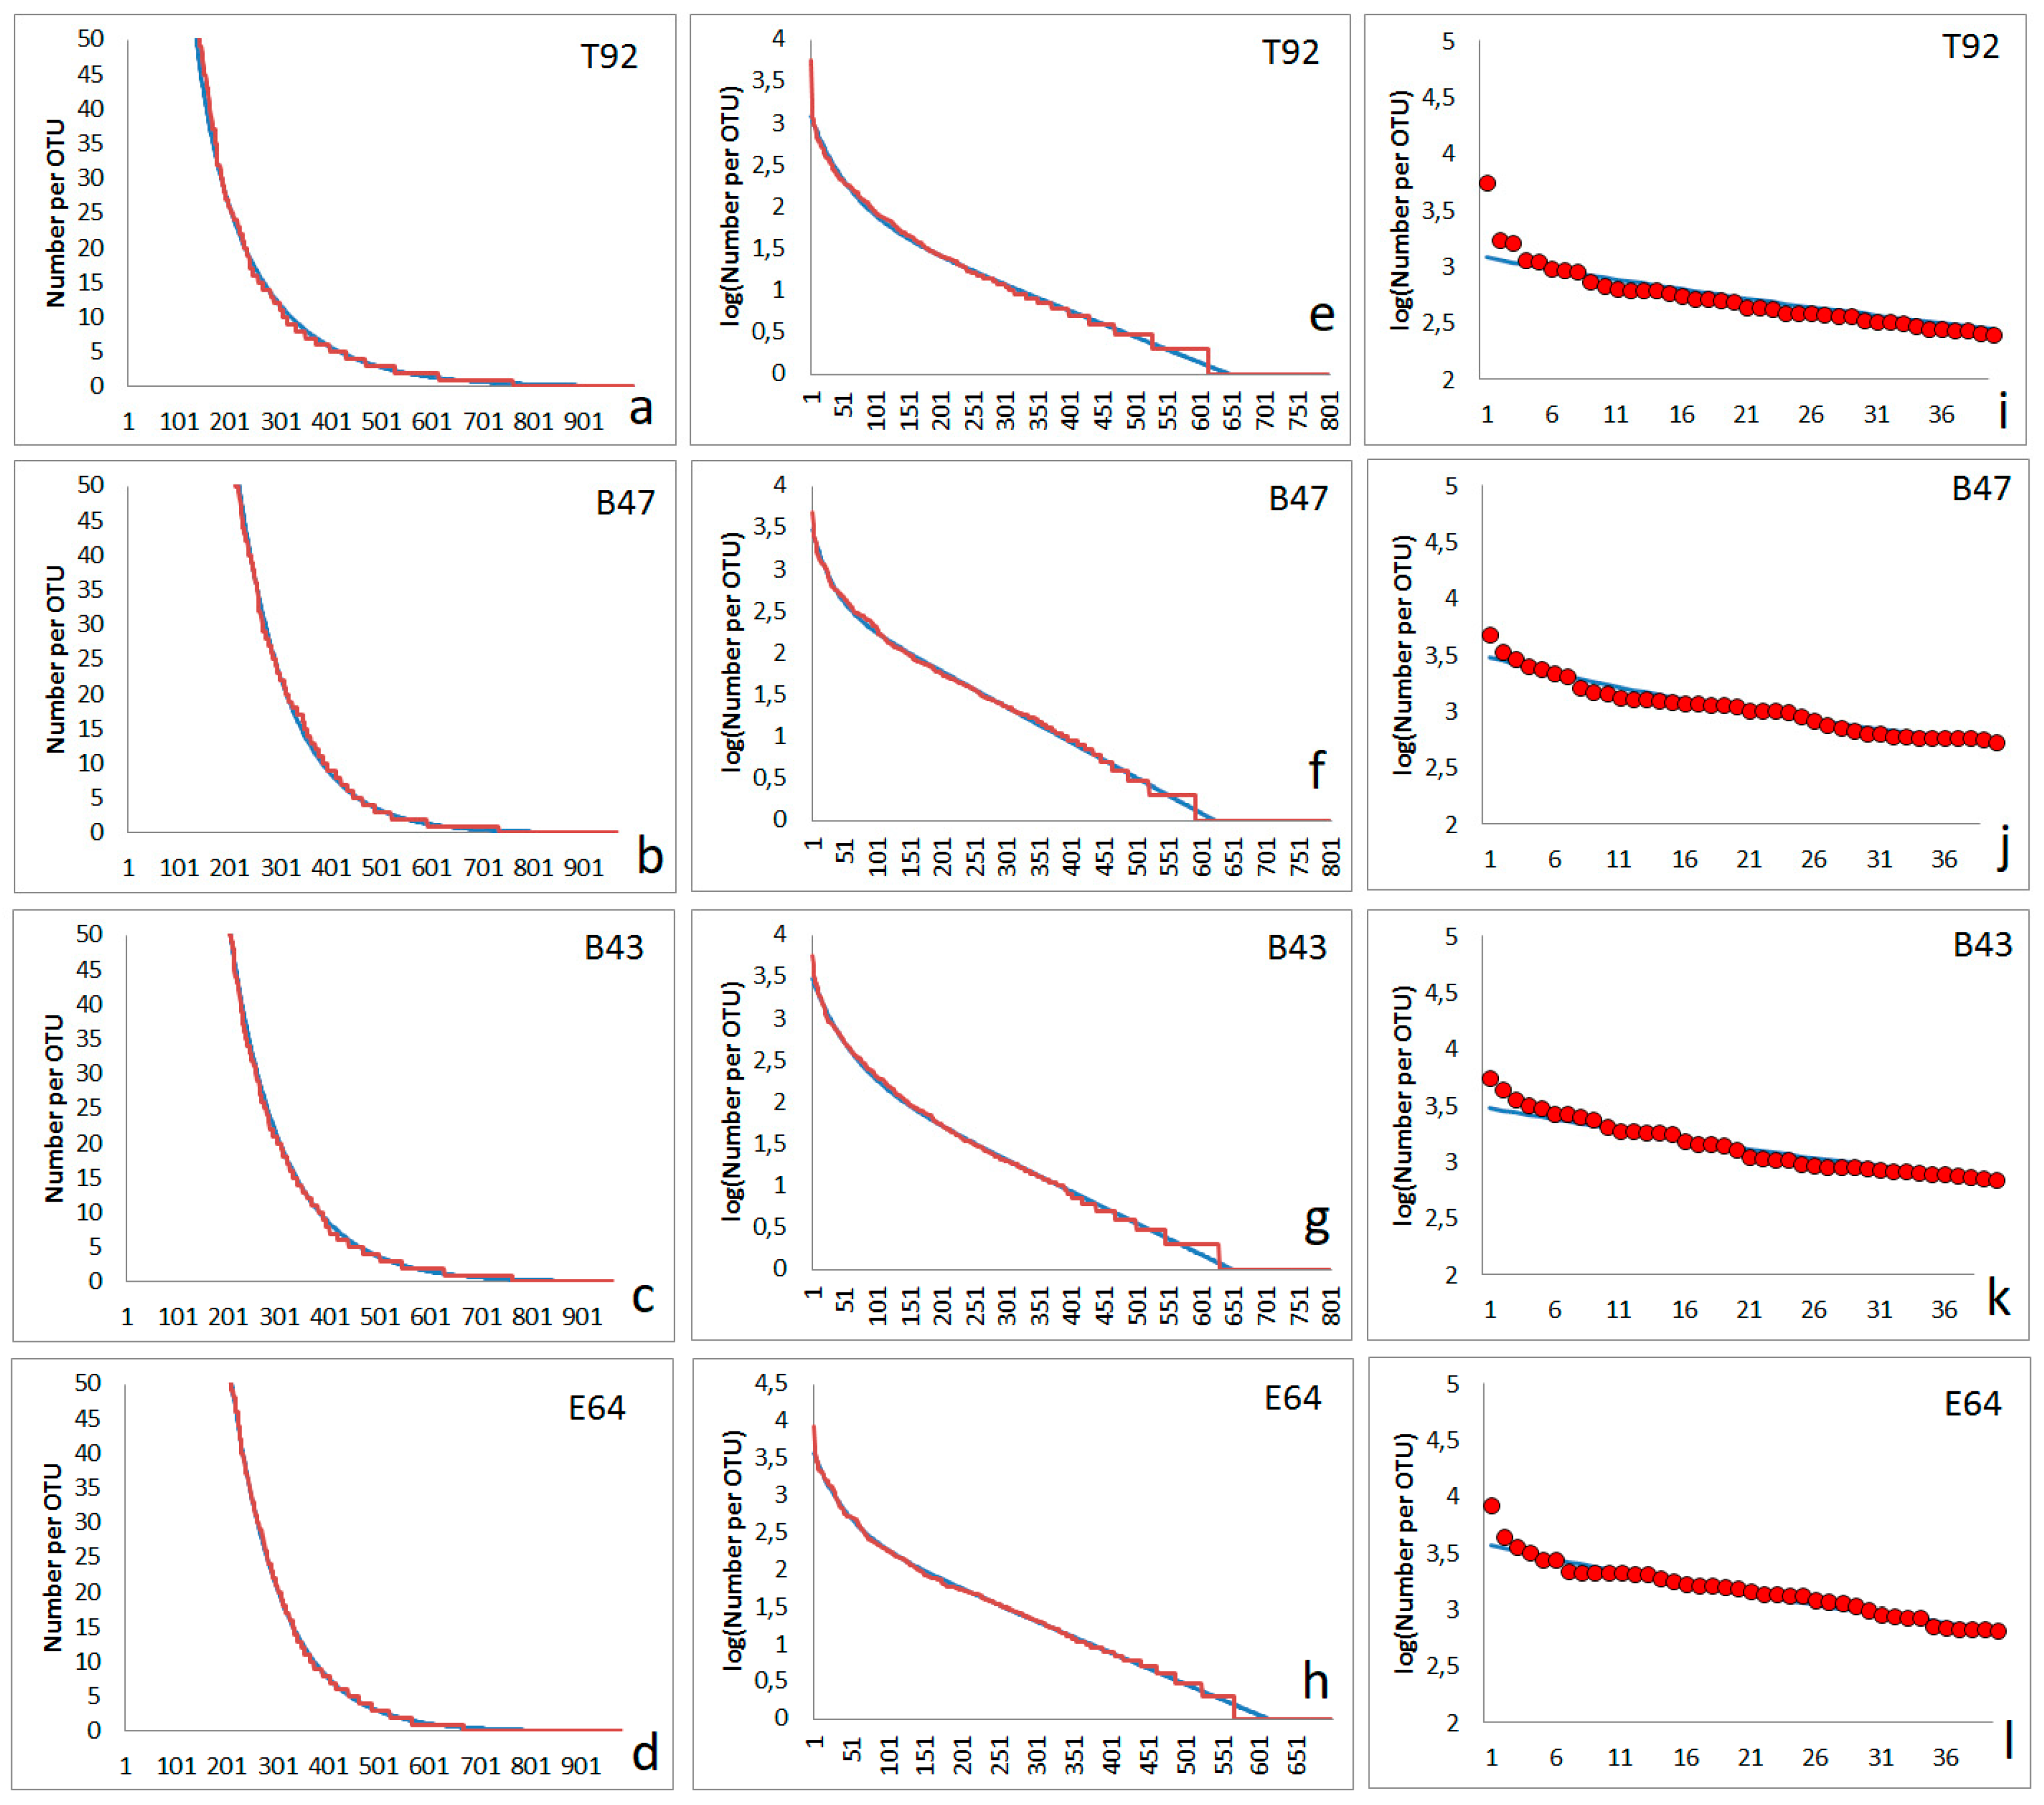
The character of many rank functions observed in the soil bacterial communities can quite well approximated by the simple model proposed above. Four examples of approximation of experimentally found rank functions are shown in
Figure 5. The abundances of overwhelming part of bacterial types fit satisfactorily with the two step model (
Figure 5a–d). Several hundred OTUs (bacterial types) are following an abundance distribution matching the two-step model (
Figure 5e–h). However, the few types with the highest abundances appear to have higher abundances than expected
Figure 5i–l). The four soil samples were taken from the surface. Two of them (T92, B43) are originating from forest soil, one from agricultural area (B47) and one from the surface of a pre-industrial copper mine deposit (E64).
The interpretation of the fitting parameters has to do carefully. It has to be taken in mind that the values of obtained constants f
1 and f
2 are directly dependent on the number of observed OTUs in total in one sample. In case of a high diversity (many OTUs) these constants are lower and they increase with decreasing number of totally observed OTUs. More remarkable is the fact that the fitting of the read numbers of the overwhelming part of OTUs is nearly non-effected by the appearance of one or a few OTUs with very high abundances (lowest inverse ranks, as visible for example for the first dots in
Figure 5i–l).
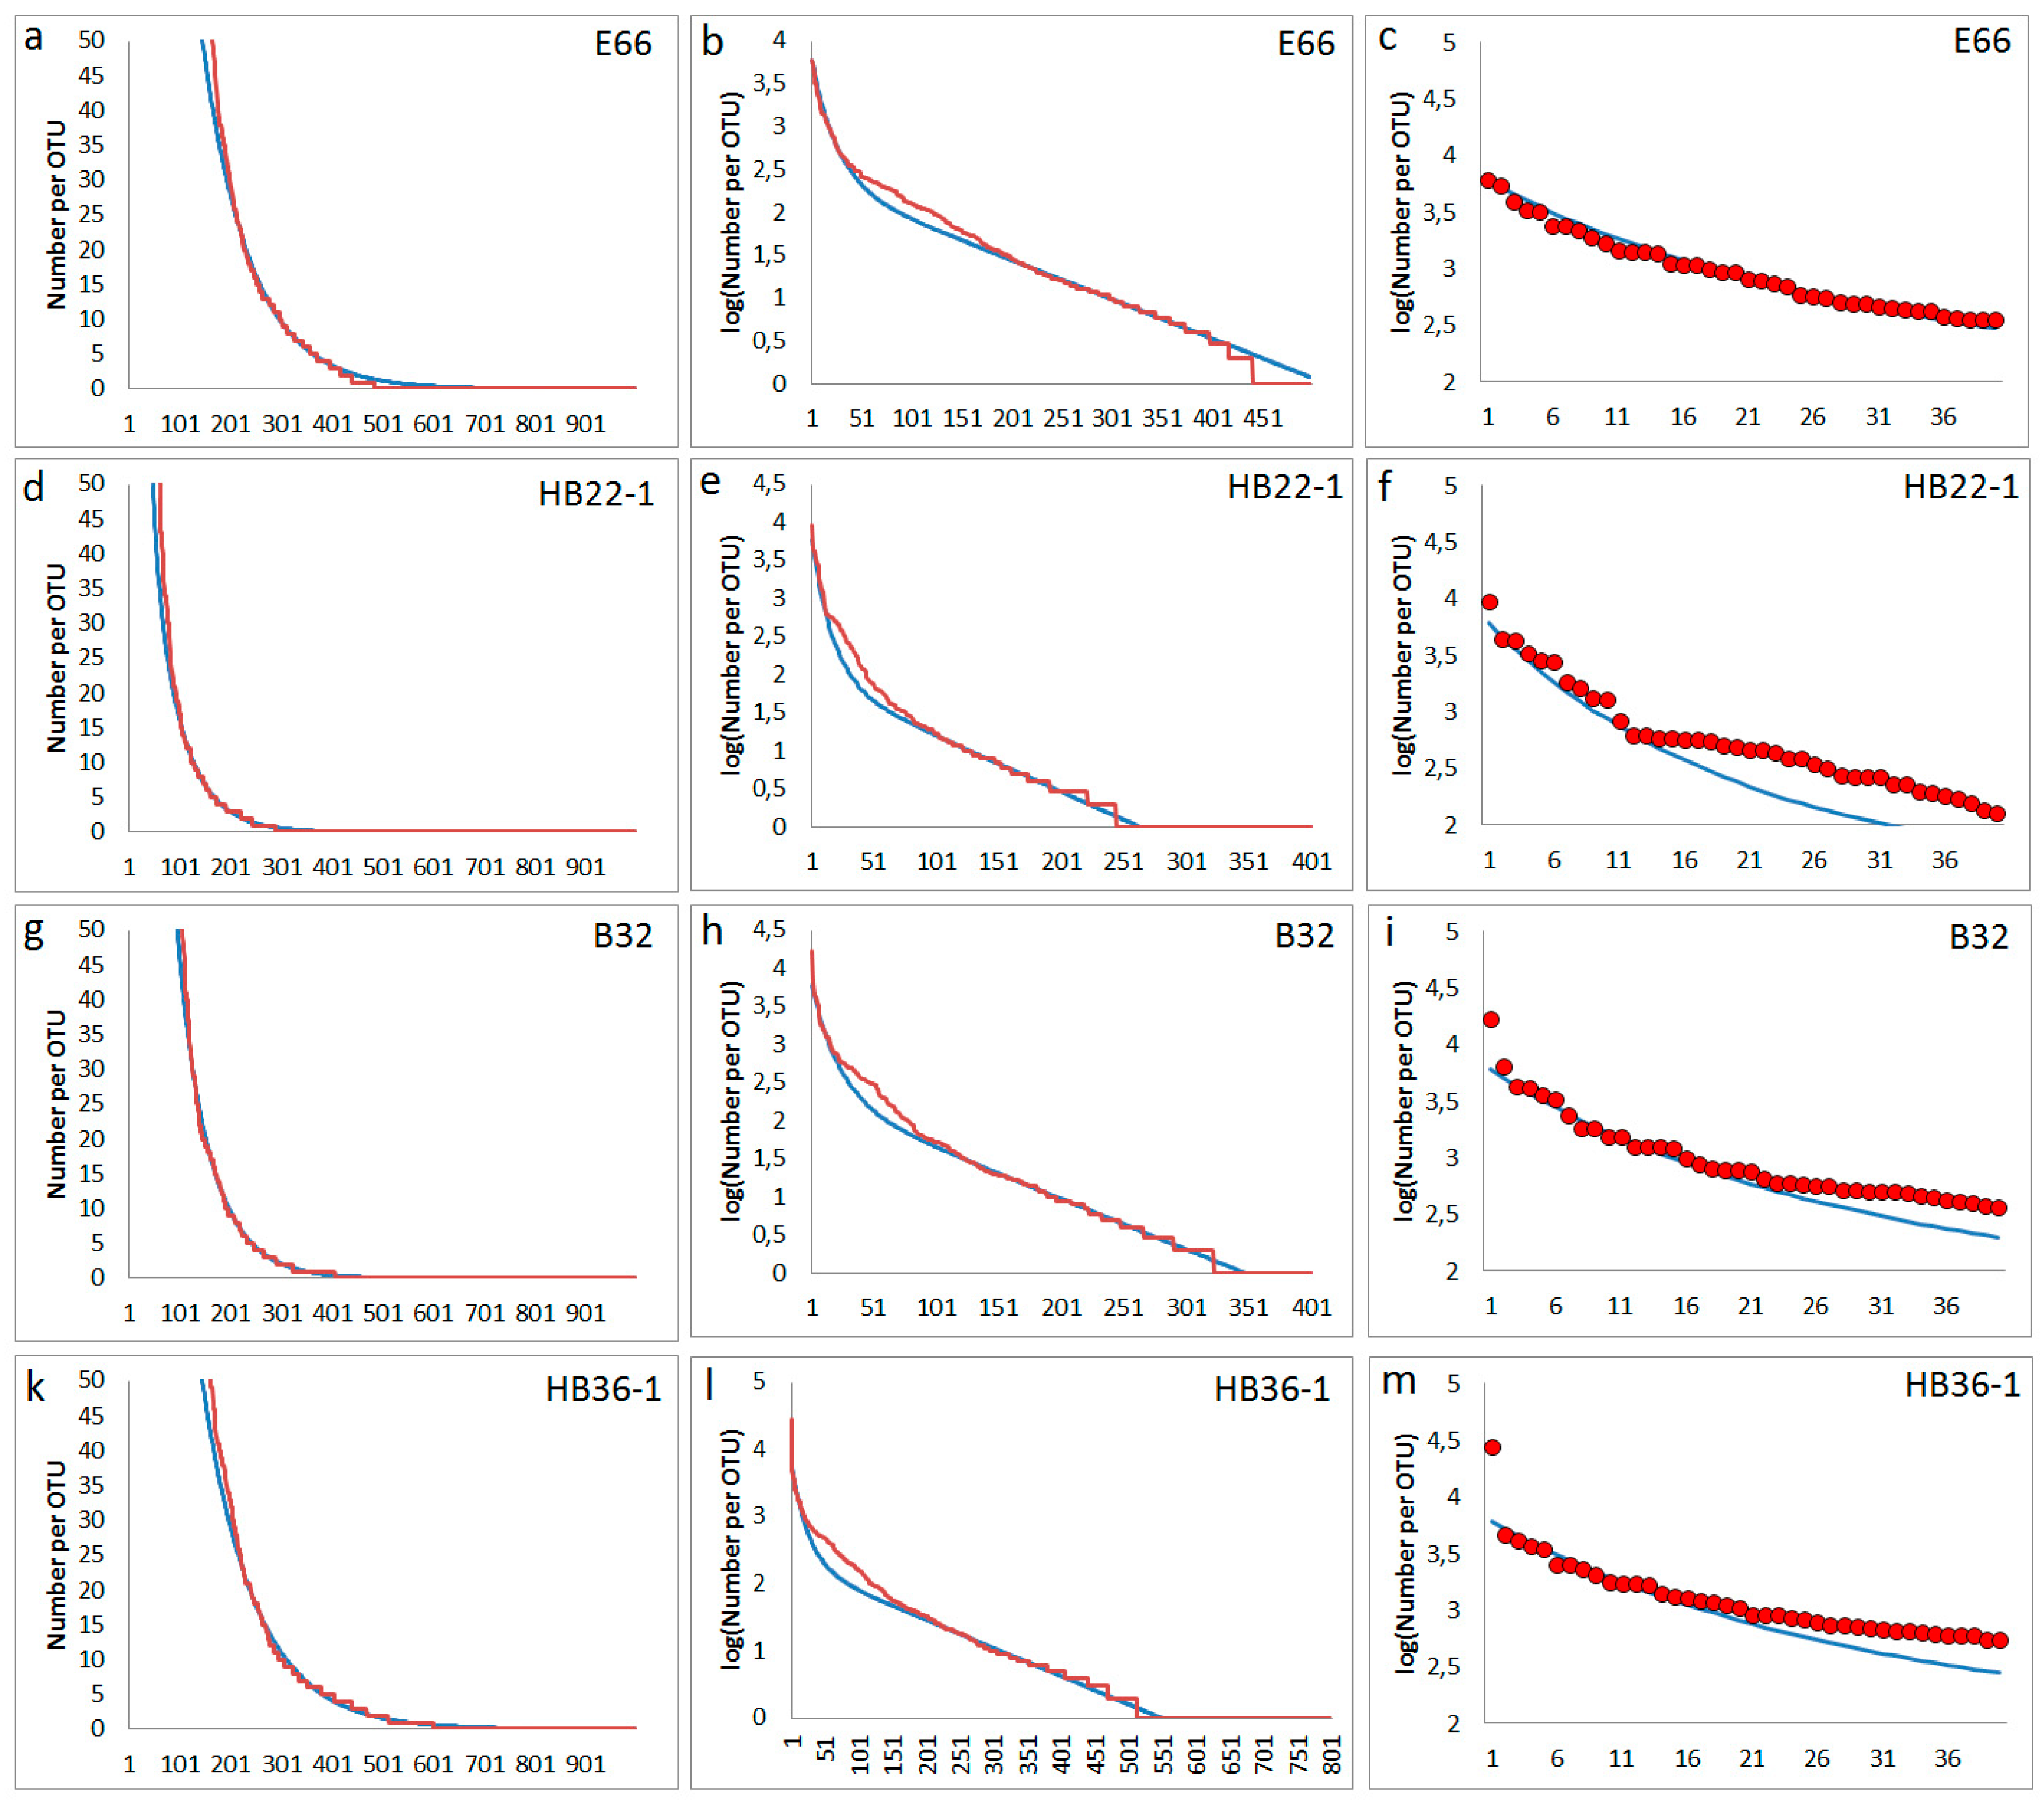
In some cases, deviations from the simple general rank order function were observed concerning a larger group of mediate abundant OTUs. A typical phenomenon is the formation of a weak shoulder (
Figure 6). It was supposed that these deviations may be related to perturbations of soil bacterial communities, such as translocation of soil material and its burial by deposition of cover layers [
29]. Such an event can mean a rapid and drastic change in local environmental conditions. Such a disturbance could cause a strong reduction of all contained bacteria and the development of new types. Two of the samples come from archaeological excavations, one (HB22-1) from the direct environment of a recovered prehistorical bronze ring, the other one (HB36-1) from excavation of a pre-industrial tannery area [
19]. The other both samples come from surface soil, one from a pre-industrial copper mining area (E66), the other (B32) from forest.
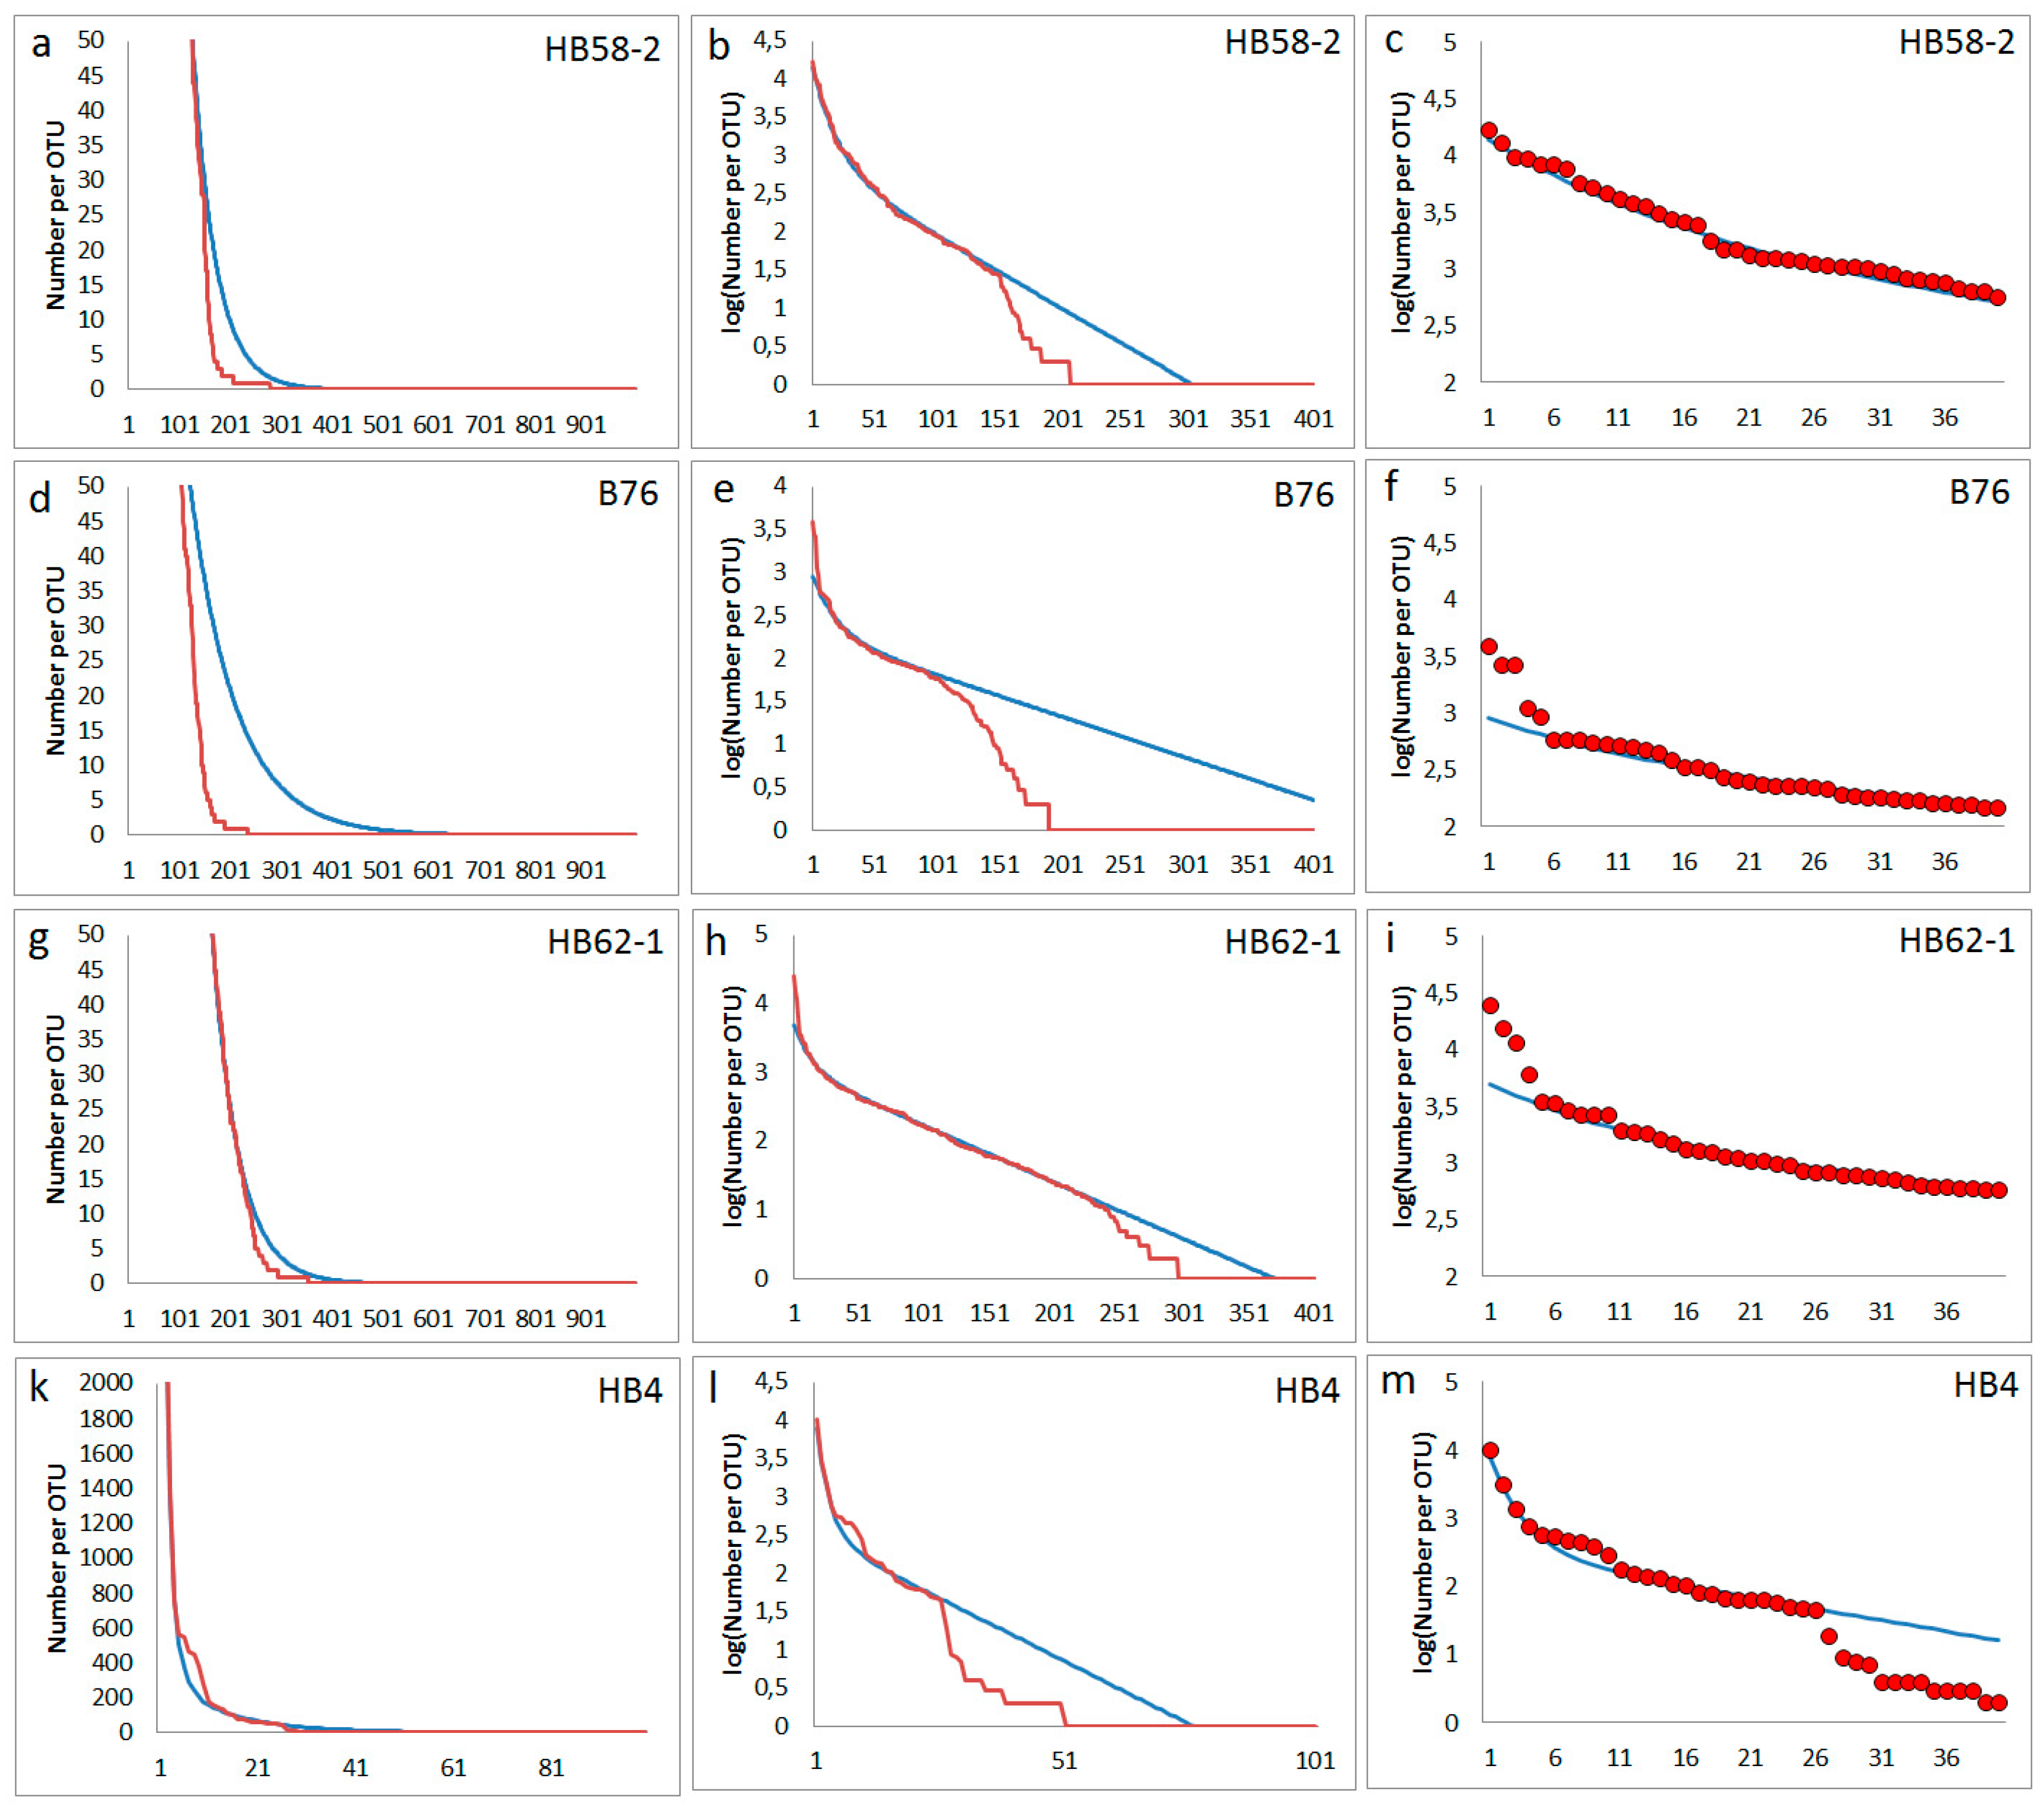
Some samples supplied rank orders in which a massive step in the abundance distribution is observed (
Figure 7). Such plots seem to reflect the missing of many mediate and low abundance types. Perhaps, a particular massive disturbance in the past of the local soil at sampling site occurred. A similar behaviour was found often in soil samples from archaeological excavations or very special sampling sites: Sample HB58-2 was taken from filling material from a prospection shaft of pre-industrial coal mining near Bennstedt. The different character of filling material and the surrounding soil material was clearly shown by archaeological findings confirming a translocation of soil material [
29]. Sample B76 was taken from the entrance area of a karst cave near Bad Frankenhausen. Here, in the 1950ies, a bronze age cave sanctuary was investigated by archaeological excavations [
30]. The sample HB62-1 is originating from an archaeological cut of an ash deposit of a pre-industrial saline place (Bad Dürrenberg). It is marked by a particularly high electrical conductivity due to the high salt content preserved up to now in the related soil layer [
31]. HB4 comes from a place in the castle area of the city of Altenburg (Germany). The sample was taken because a non-ferrous metal handyman worked in the Middle Ages at this place. Among other bacteria, the sample supplied a strain of Rhodococcus erythropolis with an exceptionally high tolerance to cobalt [
32].
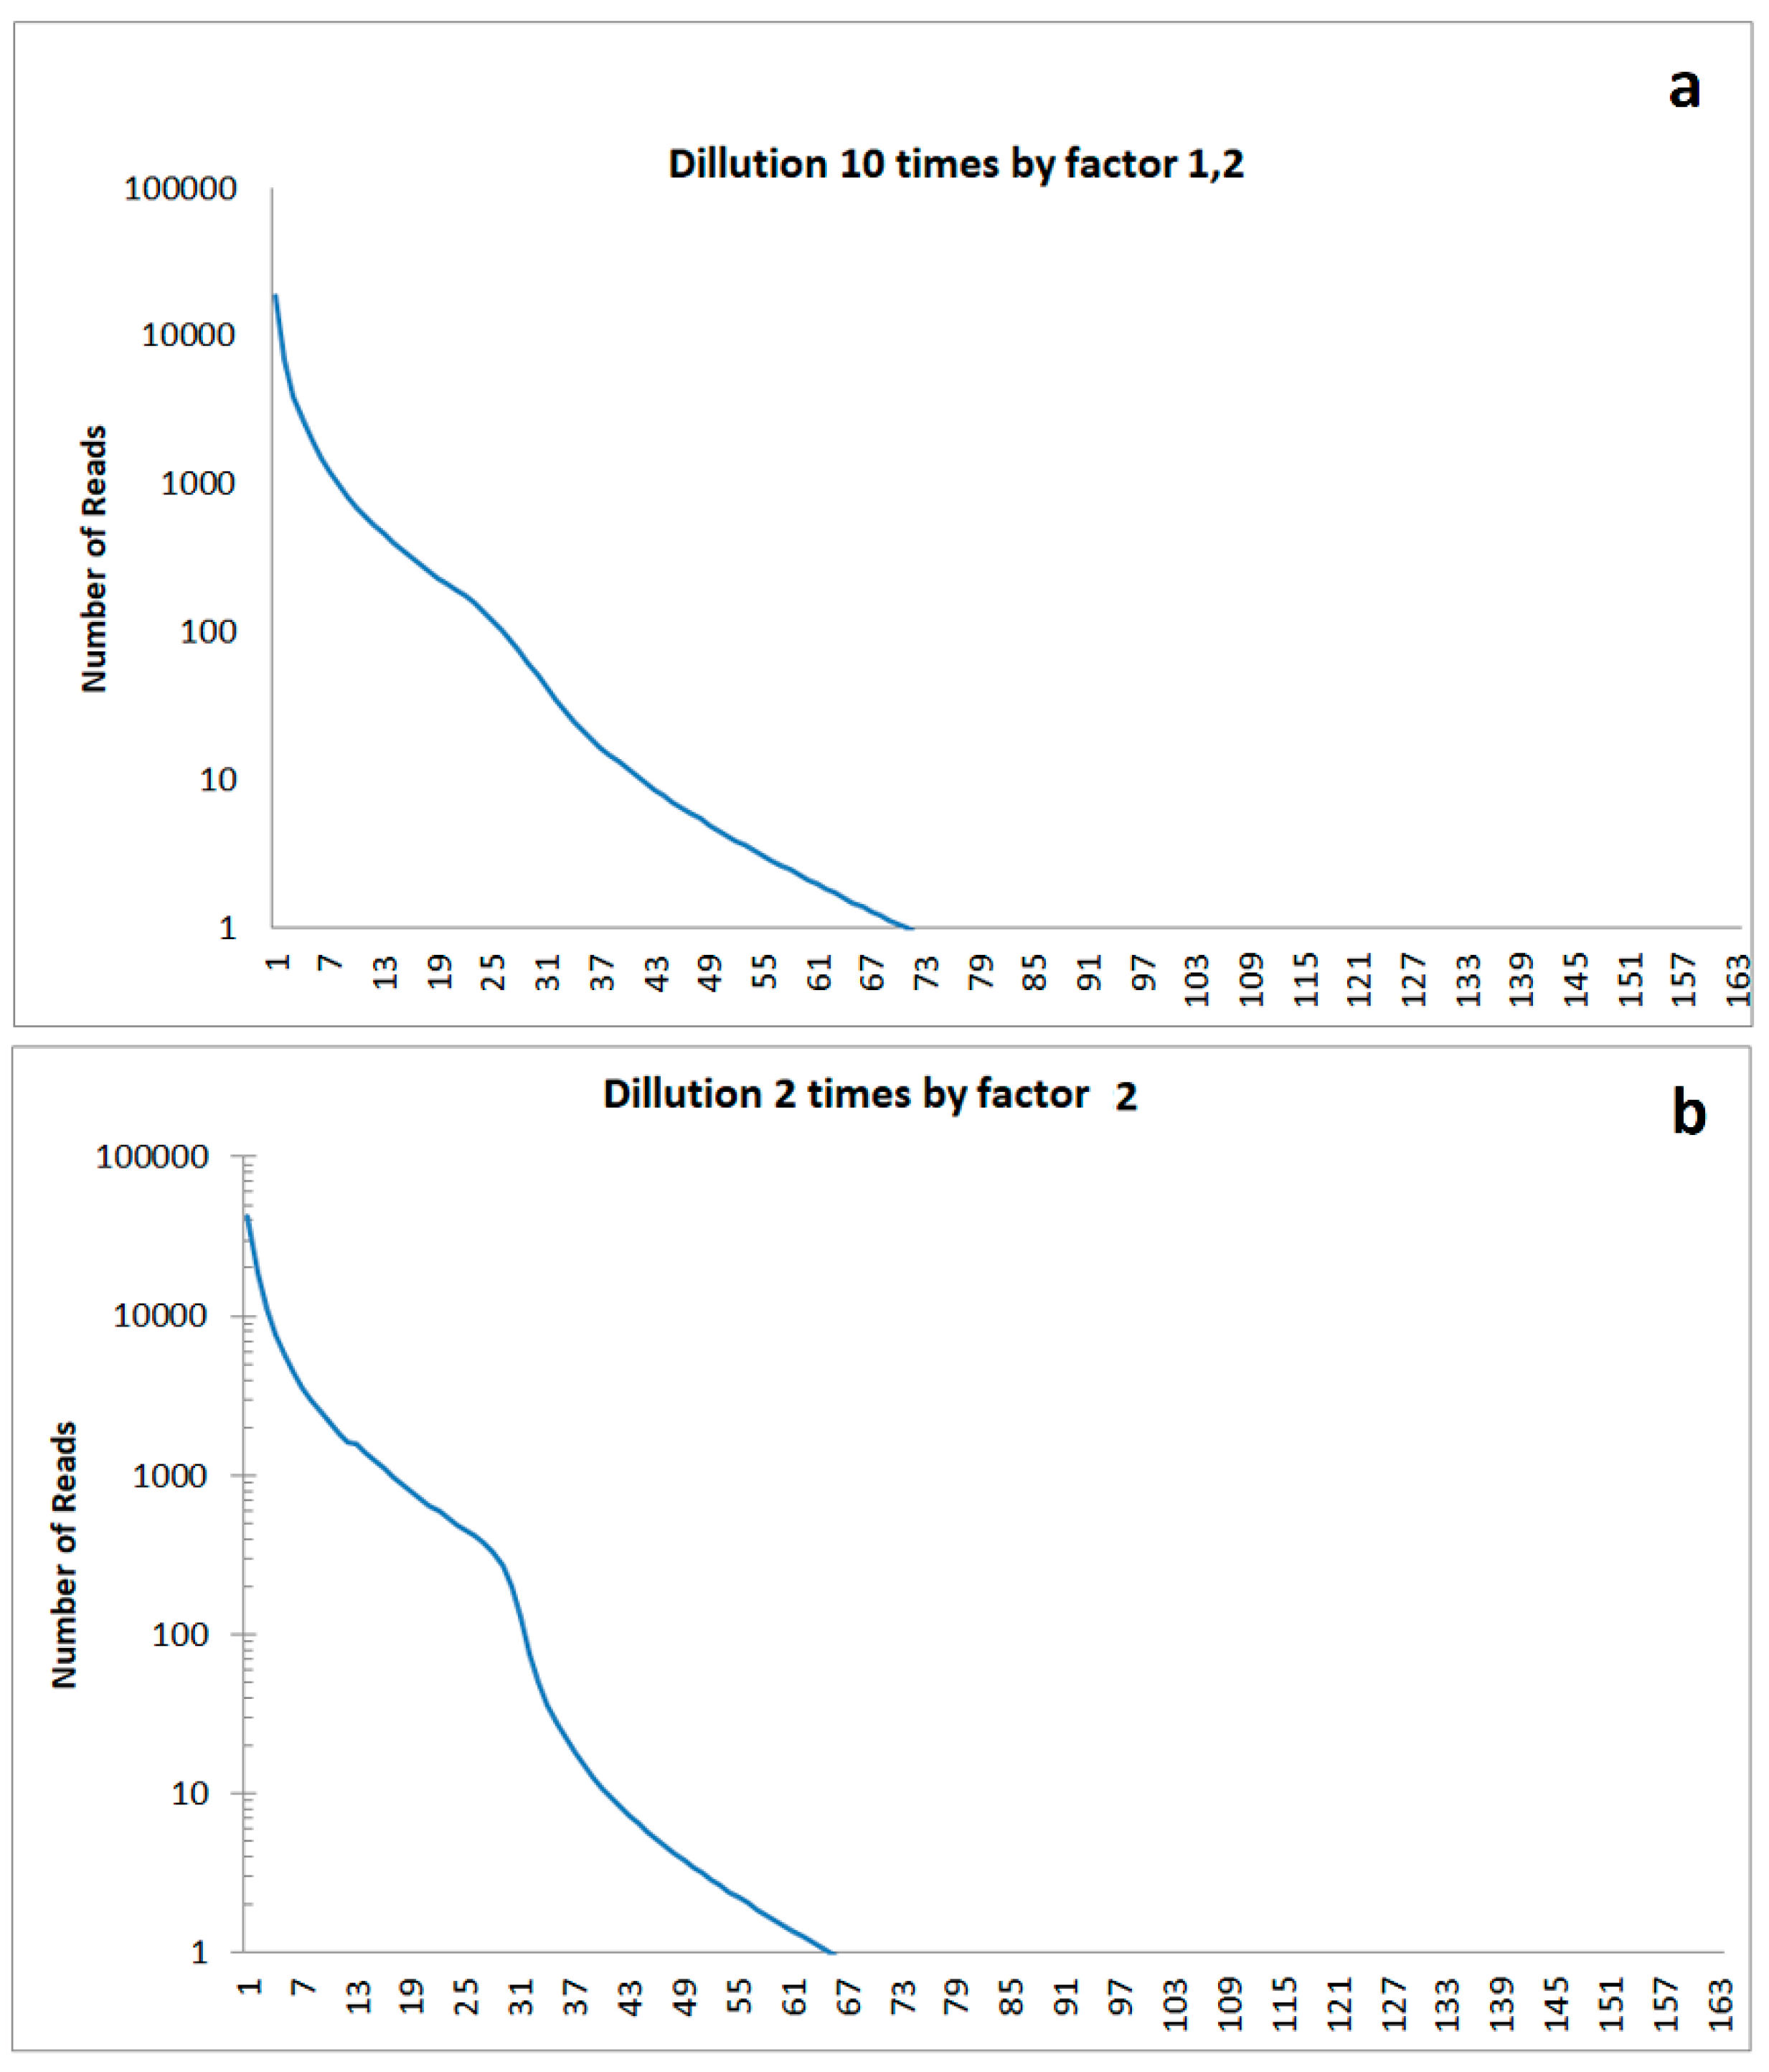
For modelling, a dilution event was simulated, in which concentration of all bacteria present was reduced. After this event, new species or bacteria evolved. The resulting model rank order functions are marked by a shoulder. The height of this shoulder depends on the dilution factor for the bacterial community existing before the disturbance. The position of the shoulder in the rank order function depends on the time span since disturbance: A shoulder at higher abundances indicates a comparatively recent disturbance, a shoulder at lower values in the rank order function indicates an event in the earlier past (
Figure 8).
Figure 1.
Soil profile (schematically) in case of natural - widely undisturbed – layers (a) and an example of human impacted soil including translocation of soil material and burial of former surface material, and soil containing deposits connected with ancient human activities.
Figure 1.
Soil profile (schematically) in case of natural - widely undisturbed – layers (a) and an example of human impacted soil including translocation of soil material and burial of former surface material, and soil containing deposits connected with ancient human activities.
Figure 2.
Assumed decay of abundance of a bacterial soil type (density of cells) after a phase of high activity following decay function of eq. (1).
Figure 2.
Assumed decay of abundance of a bacterial soil type (density of cells) after a phase of high activity following decay function of eq. (1).
Figure 3.
Scheme of succession of dominant OTUs or small groups of them marked by a fast growth, a comparatively short phase of high activity (dominance in the soil bacterial community) and decay following a decay function as described by eq. (1).
Figure 3.
Scheme of succession of dominant OTUs or small groups of them marked by a fast growth, a comparatively short phase of high activity (dominance in the soil bacterial community) and decay following a decay function as described by eq. (1).
Figure 4.
Scheme of a simplified general decay function in abundances of OTUs in soil samples (following eq. (2)); the graph was obtained by superposition of simulated decay of densities of cells following the scheme shown in
Figure 3.
Figure 4.
Scheme of a simplified general decay function in abundances of OTUs in soil samples (following eq. (2)); the graph was obtained by superposition of simulated decay of densities of cells following the scheme shown in
Figure 3.
Figure 5.
Rank order functions without shoulders obtained from four different soil samples: red lines and circles are experimental abundance data obtained from NGS, blue lines are fits obtained from the assumed model; First column (a-d): rank function (number of reads) for lower abundant OTUs, second column (e-h): logarithm of abundances for all OTUs), third column (i-l): abundances (number of reads) for highest abundant OTUs of each sample; first line (a, e, i): sample T92 (parameters for simulation following eq. (2): Nmax= 1200, N0= 96, f1 = 0.003075, f2= 0.016); second line (b, f, j): sample B47 (parameters for simulation following eq. (2): Nmax= 3000, N0= 420, f1 = 0.00423, f2= 0.03); third line (c, g, k): sample B43(parameters for simulation following eq. (2): Nmax= 3000, N0= 268, f1 = 0.00375, f2= 0.016); fourth line (d, h, l): sample E64 (parameters for simulation following eq. (2): Nmax= 3700, N0= 375, f1 = 0.00421, f2= 0.022).
Figure 6.
Experimentally observed deviations from the simplified general rank function by a should at mediate abundances: red lines and circles are experimental abundance data obtained from NGS, blue lines are fits obtained from the assumed model; First column (a-d): rank function (number of reads) for lower abundant OTUs, second column (e-h): logarithm of abundances for all OTUs), third column (i-l): abundances (number of reads) for highest abundant OTUs of each sample; first line (a, e, i): sample E66 (parameters for simulation following eq. (2): Nmax= 6000, N0= 227, f1 = 0.00457, f2= 0.040); second line (b, f, j): sample HB22-1 (parameters for simulation following eq. (2): Nmax= 6000, N0= 85, f1 = 0.00732, f2= 0.06); third line (c, g, k): sample B32 (parameters for simulation following eq. (2): Nmax= 6000, N0= 268, f1 = 0.00662, f2= 0.045); fourth line (d, h, l): sample HB36-1 (parameters for simulation following eq. (2): Nmax= 6000, N0= 199, f1 = 0.00419, f2= 0.040).
Figure 7.
Experimentally observed deep steps from high to mediate and low abundances in the rank function: red lines and circles are experimental abundance data obtained from NGS, blue lines are fits obtained from the assumed model; First column (a-d): rank function (number of reads) for lower abundant OTUs, second column (e-h): logarithm of abundances for all OTUs), third column (i-l): abundances (number of reads) for highest abundant OTUs of each sample; first line (a, e, i): sample HB58-2 (parameters for simulation following eq. (2): Nmax= 14000, N0= 785, f1 = 0.00952, f2= 0.048); second line (b, f, j): sample B76 (parameters for simulation following eq. (2): Nmax= 900, N0= 192, f1 = 0.00481, f2= 0.050); third line (c, g, k): sample HB62-1 (parameters for simulation following eq. (2): Nmax= 5000, N0= 1136, f1 = 0.00826, f2= 0.070); fourth line (d, h, l): sample HB4 (parameters for simulation following eq. (2): Nmax= 8000, N0= 311, f1 = 0.03286, f2= 0.35).
Figure 8.
Simulated rank functions in case of disturbance of soil in the past resulting in a dilution of cells: a) Cell dilution modelled by ten small dilution steps of factor 1.2 resulting in a weak shoulder in the abundance rank distribution; b) Cell dilution modelled by two high dilution steps of factor 2 resulting in a high shoulder in the abundance rank distribution.
Table 1.
Soil samples.
| Intern. lab-code |
Place |
GK-Coordinates |
sample character |
| B32 |
Katzhütte |
4434,441/5600,633 |
silicate rock-based forest soil |
| B43 |
Sondershausen |
4418,896/5690,400 |
shell limestone forest soil, prehistoric rampart |
| B47 |
Hachelbich |
4428,625/5690,096 |
soil of arable land |
| B76 |
Bad Frankenhausen |
4435,851/5693,032 |
lime stone cave, prehistoric cult place |
| E64 |
Welfesholz |
4467,256/5722,008 |
pre-industrial copper mining area |
| E66 |
Hettstedt |
4467,304/5722,211 |
pre-industrial copper mining area |
| HB4 |
Altenburg |
4531,000/5650,500 |
Medieval non-ferrous metal forge |
| HB22-1 |
Großengottern |
about 4400/5669 |
archaeological excavation/bronze ring |
| HB36-1 |
Jena |
4471,400/5643,900 |
preindustrial tannery area |
| HB58-2 |
Bennstedt |
4488,789/5706,398 |
preindustrial coal prospection shaft |
| HB62-1 |
Bad Dürrenberg |
4504,487/5685,134 |
preindustrial saline ash deposit place |
| T92 |
Bad Kösen |
4479,712/5663,779 |
forest soil near a Middle Age Castle |
