1. Introduction
Lava fountaining is the mild explosive activity characteristic of the initial phases of a basaltic effusive or flank eruption, discharging lava into the atmosphere at rates of a few hundred cubic meters per second [
1,
2,
3,
4,
5,
6]. The earliest lava fountain model proposed by Wilson and Head [
7] considered shallow magma degassing as the driver of the process, starting with magma ascending and degassing as bubbly flows, and transitioning to dispersed flows once the porosity reaches 75 percent. Jaupart and Vergniolle [
8] and Vergniolle and Jaupart [
9], based on laboratory experiments simulating a shallow conduit, provided an alternative lava fountain model, where gas bubbles accumulate as a foam layer at the roof of the subvolcanic reservoir. In their model, lava fountains result from violent annular flows triggered by collapse of the foam layer once a critical thickness is reached.
Magma rise speed is the most important factor causing the transition from Strombolian type explosive activity to lava fountaining, with gas content and viscosity determining the rise speed at which this transition occurs [
10]. The height reached by lava fountaining is a function of the gas content within the magma [
9,
11,
12], whereas a decrease in gas content causes a transition to passive effusion of vesicular lava [
10].
Lava fountains usually occur along eruptive fissures and with time concentrate at discrete vents [
4,
13]. They can last for a few minutes to hours, days or even months, and often occur as episodic events [
14,
15,
16]. This periodic lava fountain behavior is explained by the existence of a shallow storage regularly refilled by a gas-rich magma batch from depth, thus allowing a possible forecast of the next event on a statistical basis [
15]. Episodic lava fountains at Kilauea were accompanied by rapid inflation and deflation of the summit recorded by tiltmeters and accompanied by seismic tremor [
14], again suggesting the replenishment of a shallow storage. The length of the repose times between episodes could be influenced by the amount of gas released by magma in the shallow conduit, while disruptive events such as erosion of the conduit or crater wall collapses could determine a change on the frequency of lava fountain events and on the duration of eruptive pauses [
16]. At fissure eruptions, the pulsating behavior of lava fountains is related to the size of the feeder dike and to the depth of the lava within the conduit and/or lava pond [
4]. Episodic fountaining was observed several times at Kilauea volcano (Hawaii) between 1959 and 1986 [
17,
18,
19], during the 2014-15 Holuhraun and the 2021 Geldingadalir eruptions in Iceland [
4,
16] and at Etna volcano in Italy during the last 25 years [
6,
20].
Lava fountain episodes display a rather slow buildup [
2,
21] but quit abruptly, ending in chaotic bursts of gas and dense spatter as lava ponded around the vent is swallowed back down into the conduit [
1] (Mangan et al., 2014), or is erupted as rheomorphic or clastogenic flows [
2,
22,
23,
24].
Significant differences exist between lava fountaining episodes occurring along an eruptive fissure, and as such declining with time and concentrating in one or more vents [
3,
13,
16,
17,
25], and those occurring from a single vent, namely one of the summit craters of the volcano, which seems to be typical of open-conduit volcanoes such as Etna and Stromboli [
6,
20,
26,
27,
28]. In fact, lava fountaining occurring along eruptive fissures commonly evolve into major effusive activity and form spatter ramparts accompanying the widening of the fissure and the emplacement of the feeder dike [
17,
29], whereas lava fountaining focused at an open vent or summit crater can occur in sequences not followed by effusive activity, but representing an alternative way used by a steady-state volcano to release the magma accumulated into the shallow storage [
20,
30,
31].
Lava fountaining at Etna volcano is normally referred to as explosive paroxysms. Paroxysmal explosive activity at the summit craters of Etna volcano is typified by increasing Strombolian activity, evolving to transitional explosions, and then to paroxysmal lava fountains raising above the crater for thousand meters and feeding a sustained eruptive column expanding up to 15 km above sea level (a.s.l.) for several minutes to a few hours [
2,
6,
21,
32,
33]. The eruptive column gives rise to a sustained ash plume and eventually to tephra fallout, causing hazard and sometimes disruption to the local international airport of Catania, and to the viability along the motorway running along the east coast of Sicily, as well as damage to cars, buildings and infrastructures and threatening the health of the local population [
34,
35,
36].
These paroxysmal explosions at Etna are often preceded, accompanied and/or followed by lava flow outputs from the base of the crater, lasting just a few hours and often comprising rheomorphic or clastogenic lava from the flowage of agglutinated spatter fallout emplaced on a steep slope [
2,
21,
22,
23,
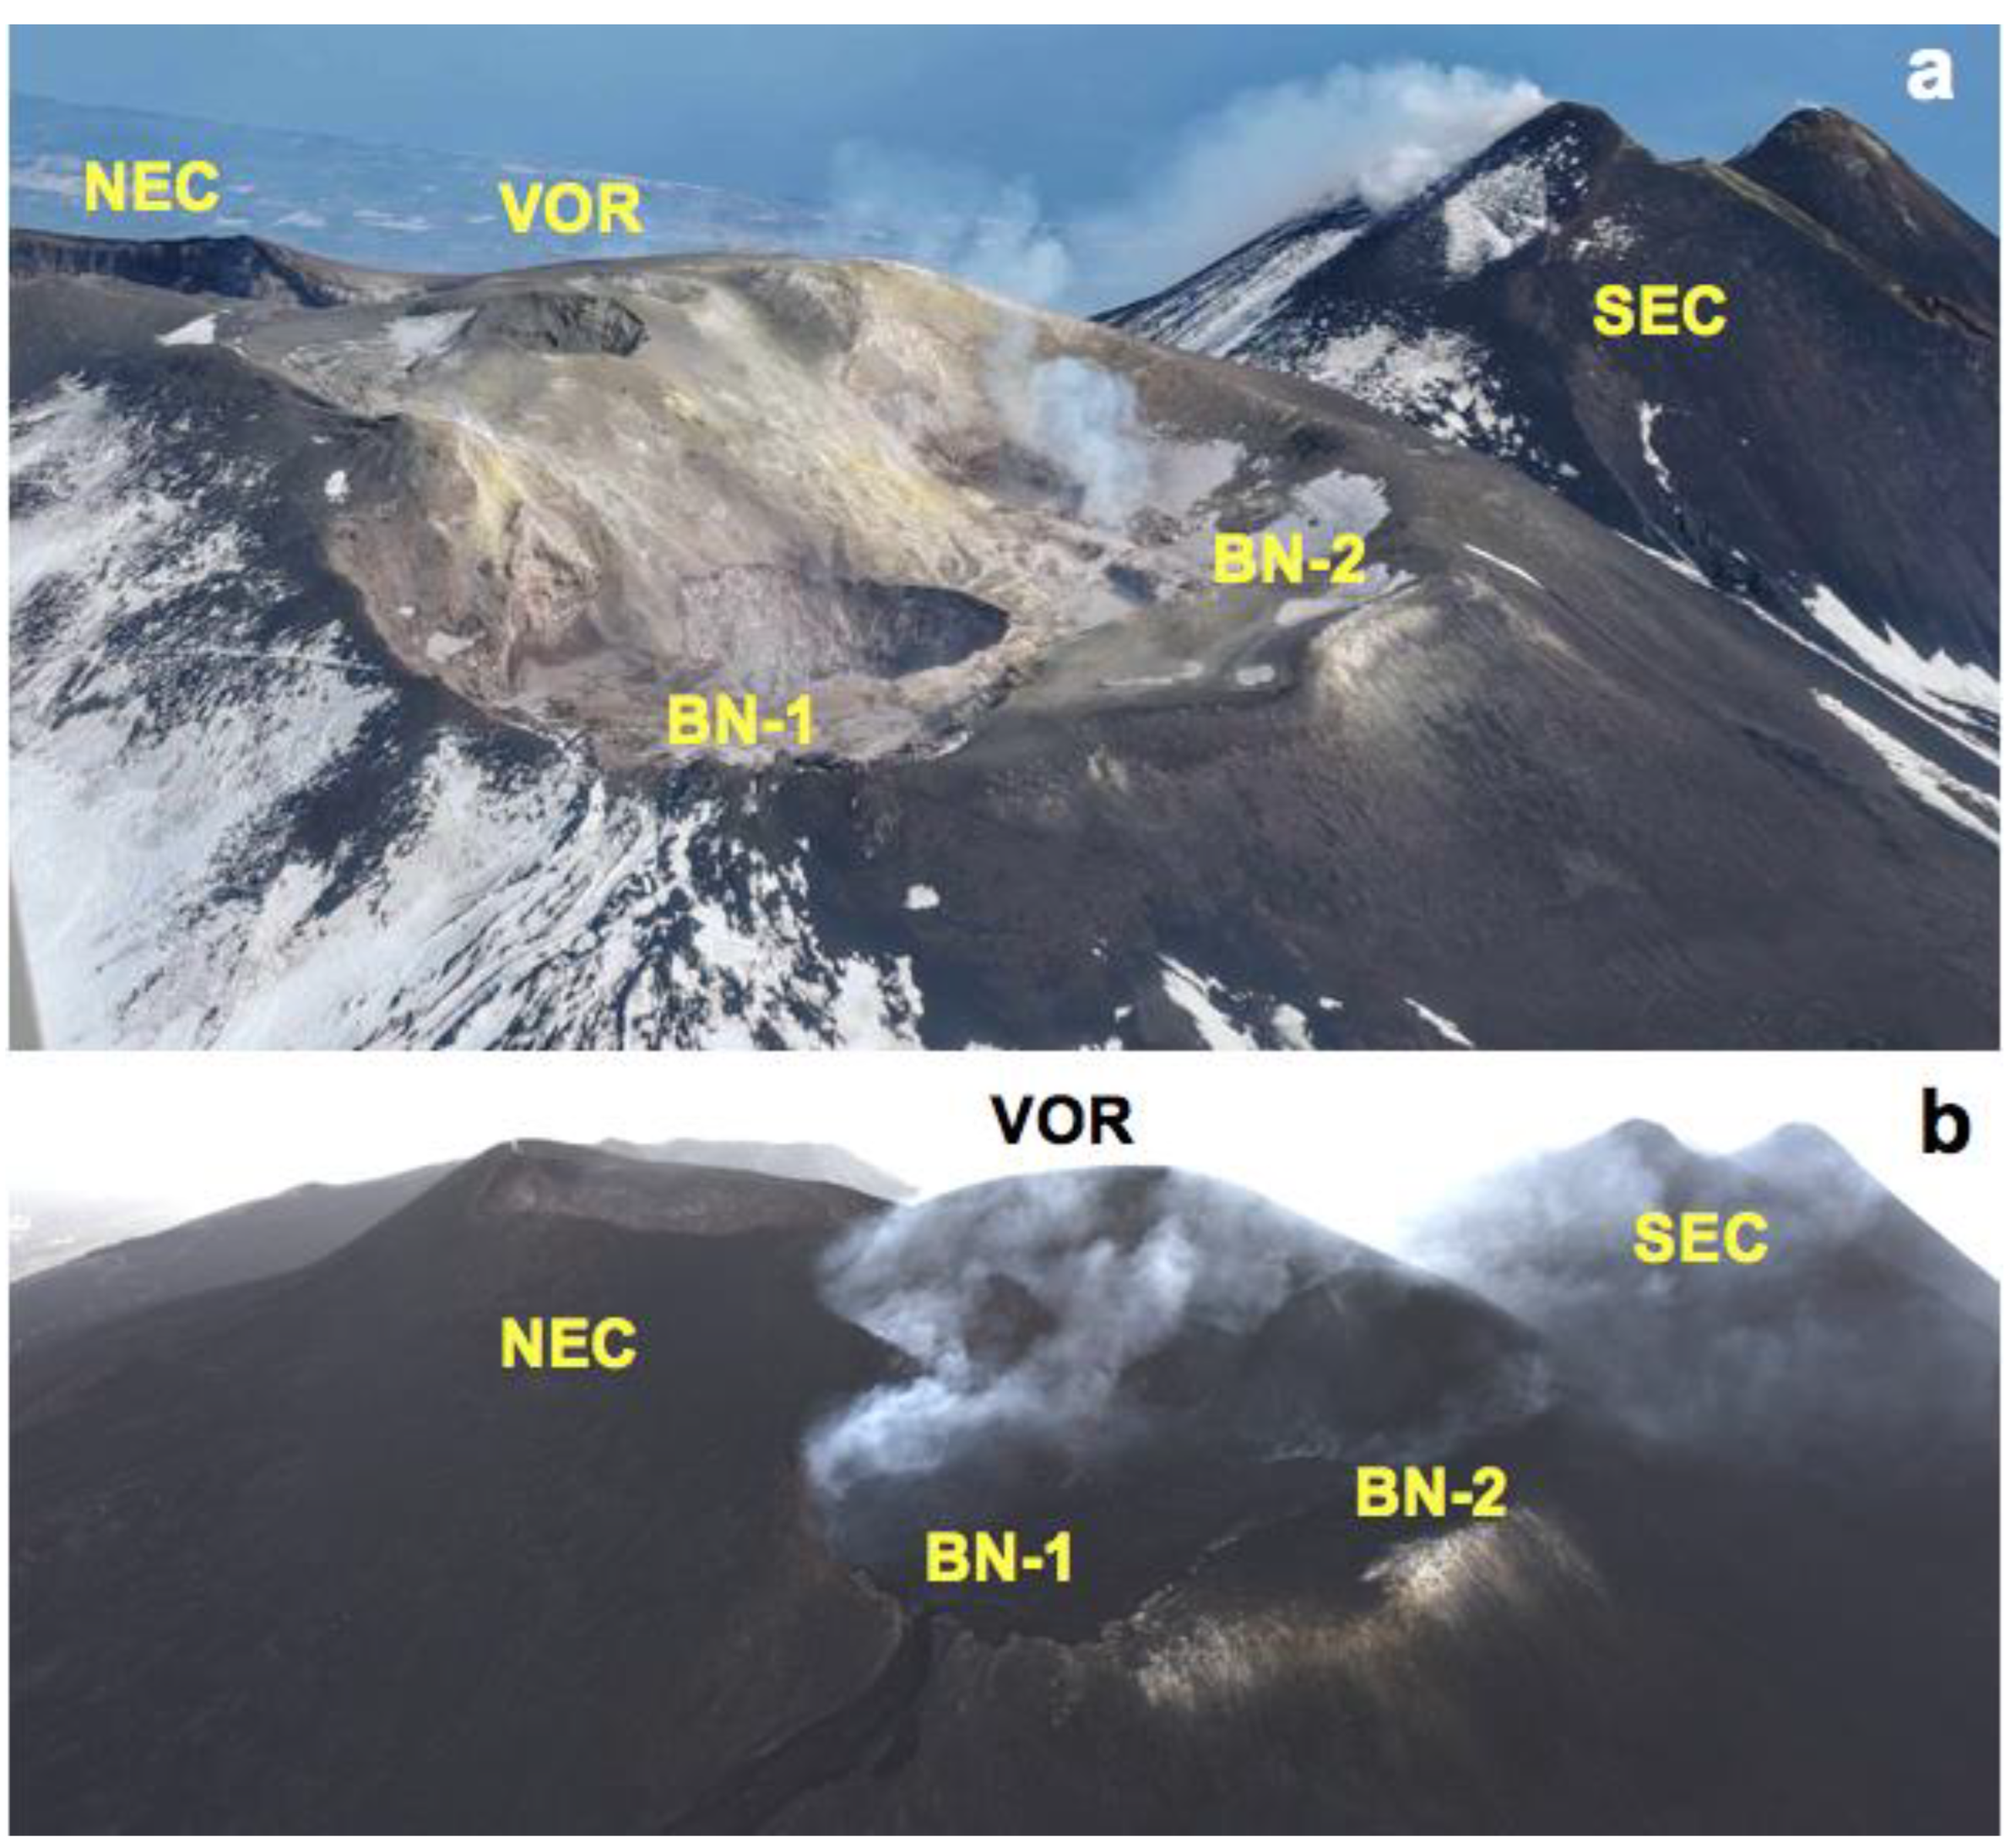
24]. This paroxysmal activity occurred, between 2000 and 2023, mostly at the South-East Crater (SEC), which is the youngest of the four Etna’s summit craters [
37,
38] (
Figure 1). Looking backwards in time, this explosive activity became increasingly more common after 1971, precisely following the formation and growth of the SEC (
Figure 1;
Table 1). SEC opened as a depression at the base of the Central Cone during the 1971 flank eruption [
39] and now is the highest peak of the volcano [
38,
40]. The Central Crater, or Voragine (VOR;
Figure 1), is the oldest and was the only active crater until 1911, when the North-East Crater (NEC;
Figure 1) formed as a separated cinder cone [
41]. Then, in 1968, within the Central Crater and next to VOR there was the opening of a collapse pit only two meters wide, named Bocca Nuova (BN=New Vent) [
41] that eventually grew reaching almost the same size as the VOR and comprises now two pits, BN-1 and BN-2 (
Figure 1). Interesting enough, despite the idea that Etna volcano produces mainly effusive eruptions, since 1986 and up to 22 February 2022, it gave rise to more than 281 paroxysmal explosive events, most of them comprising eruptive sequences [
6,
20,
42,
43].
During the last few decades all the four summit craters produced occasionally paroxysmal explosive episodes, giving rise to powerful lava fountaining extending 1-5 km above the crater, and feeding extensive eruptive columns and ash plumes up to 15 km a.s.l. [
2,
42,
44]. Since 2000, the lava fountaining activity from the SEC became more and more common, with 64 episodes occurred during that year [
45], and additional sequences recorded in 2011-2013 (68 episodes; [
2]) and 2020-2022 (66 episodes; [
20]). The SEC lava fountains are caused by the sudden emptying of a bubble foam layer accumulated at 1.5 km below the crater or 1.5 km a.s.l. [
46]. NEC displayed very rarely this type of activity that occurred as single episodes rather than as eruptive sequences, with the last powerful episode occurred in 1998 and 2013 [
2,
47]. VOR has occasionally produced paroxysmal episodes, with the most remarkable events occurred on 22 July 1998 [
48,
49], on 4 September 1999 [
50,
51], a sequence of four powerful paroxysms occurred between 3 and 5 December 2015 [
44], and three episodes between 18 and 21 May 2016 [
6]. It is worth noting that the volume erupted by VOR during one single episode (8.5 x 10
6 m
3 for the 3 Dec 2015 episode [
44]) is much greater than the average of each SEC paroxysmal event (~ 2.5 x 10
6 m
3 [
2]). In addition, the depth of the shallow storage for the VOR paroxysms is much deeper than the SEC, given that the estimated depth for the VOR paroxysmal episodes occurred in 2015 was 1.5 km below sea level (b.s.l.) [
44], then 3 km deeper than the SEC shallow storage [
46]. During the 2015 sequence it was possible to calculate for the first time ever the volume of both the pyroclastic material and of the total fluid erupted (comprising gas and pyroclastic materials). The results revealed that the explosive sequence was characterized by a decreasing trend of erupted pyroclastic material with time, going from 41% (first event) to 13% (fourth event) of the total erupted pyroclastic volume [
44]. Moreover, the total erupted volume of pyroclastic material was ~ 12 x 10
6 m
3 [
44,
52] and the volume ratio fluid/pyroclastic increased markedly in the fourth and last event [
44] forecasting the end of the eruptive sequence. In this paper, we use the thermal images recorded by the INGV-OE monitoring system, applying to the analysis of the images the automatic routine developed by Calvari and Nunnari [
53], in order to calculate the erupted volumes of the paroxysmal explosive sequence occurred at VOR between 4 July and 15 August 2024 and evaluate its hazards implications.
Being the effects of paroxysmal activity a matter of high concern for the local population because of its impact on the territory, it is becoming of paramount importance to be able to forecast its evolution and possibly its end [
20,
30,
44]. This is what we try to infer with the study here presented.
2. The Voragine (VOR) Eruptive Activity in 2024
The VOR crater was quiet for several months when Strombolian activity started on 13-14 June 2024, accompanied by small lava flows spreading within the crater [
54]. It is worth noting that the composition of the products erupted during this phase was more evolved than the last paroxysmal episode occurred in December 2023 [
54], and thus presumably involved the output of magma left over within the conduit from the previous eruptive activity. The explosive activity increased gradually giving rise at 16:15 UTC on 4 July to the first paroxysmal lava fountain episode occurred at VOR, that ended on the early morning of 5 July at 01:50 UTC leaving the crater silent [
55]. The eruptive column formed during this first episode grew up to 4.5 km a.s.l. and expanded SE reaching the town of Siracusa, ~ 120 km to SE [
55]. The seismic tremor accompanying the explosive activity decreased between 14:30 and 15:00 (UTC), suggesting a small explosive pause. At the end of the paroxysmal episode a lava flow from the VOR spread into BN-1 (
Figure 1) and overflowed the west crater rim stopping in a few days [
56].
Strombolian explosive activity started again on 6 July, gradually increasing and eventually evolving to the second lava fountain episode at 02:00 UTC on 7 July and ended at 08:00 UTC of the same day [
55]. The eruptive column spread east reaching the maximum elevation of 9.7 km a.s.l., while the fallout filling the summit crater overflowed the western rim spreading for a few hundred meters [
55]. The cumulated lava flow volume erupted during the two paroxysmal episodes of 4 and 7 July was ~ 1.1 ± 0.5 Mm
3 [
55], this being just the effusive portion of the paroxysmal event. The lava fountain fallout deposited to SE causing a growth of the VOR of 15 m (reaching on 8 July 3412 m a.s.l.), and accumulating a deposit of up to 107 m thick [
55]. The composition of volcanic glass particles erupted by VOR during the strombolian phase preceding the paroxysms and the paroxysms of 4 and 7 July 2024 testifies that the earlier products were substituted by a more primitive magma feeding the lava fountains [
56].
The third lava fountain episode started at 17:42 UTC at VOR on 15 July, climaxed at 22:57 UTC during the output of a lava flow and ended at 23:40 of the same day [
57]. The eruptive column reached the maximum elevation of 8.8 km a.s.l. at 21:12 UTC and spread SE, whereas the erupted lava volume from the overflows covering the W rim of the summit crater was ~ 0.41 Mm
3 [
57].
The fourth lava fountain episode from VOR occurred between 02:08 and 08:15 of 23 July. The eruptive column reached 7.4 km a.s.l. at 06:57 UTC spreading SSE, and was accompanied by overflows from the W crater rim with a total volume of 0.5 Mm
3 [
58].
The fifth paroxysmal episode started at 02:30 UTC and ended at 07:10 UTC on 4 August. The eruptive cloud reached 10 km a.s.l. spreading E and SE, accompanied by several overflows from the western crater rim for a volume of 0.45 Mm
3 [
59].
The sixth lava fountain episode started at 22:30 UTC on 14 August and ended at 01:20 on 15 August, and produced an eruptive column 9.5 km high a.s.l. that expanded towards SSW and ESE [
60]. The paroxysmal event was followed by overflow from the W crater rim that emplaced a lava volume of 0.40 Mm
3 [
60].
3. Results
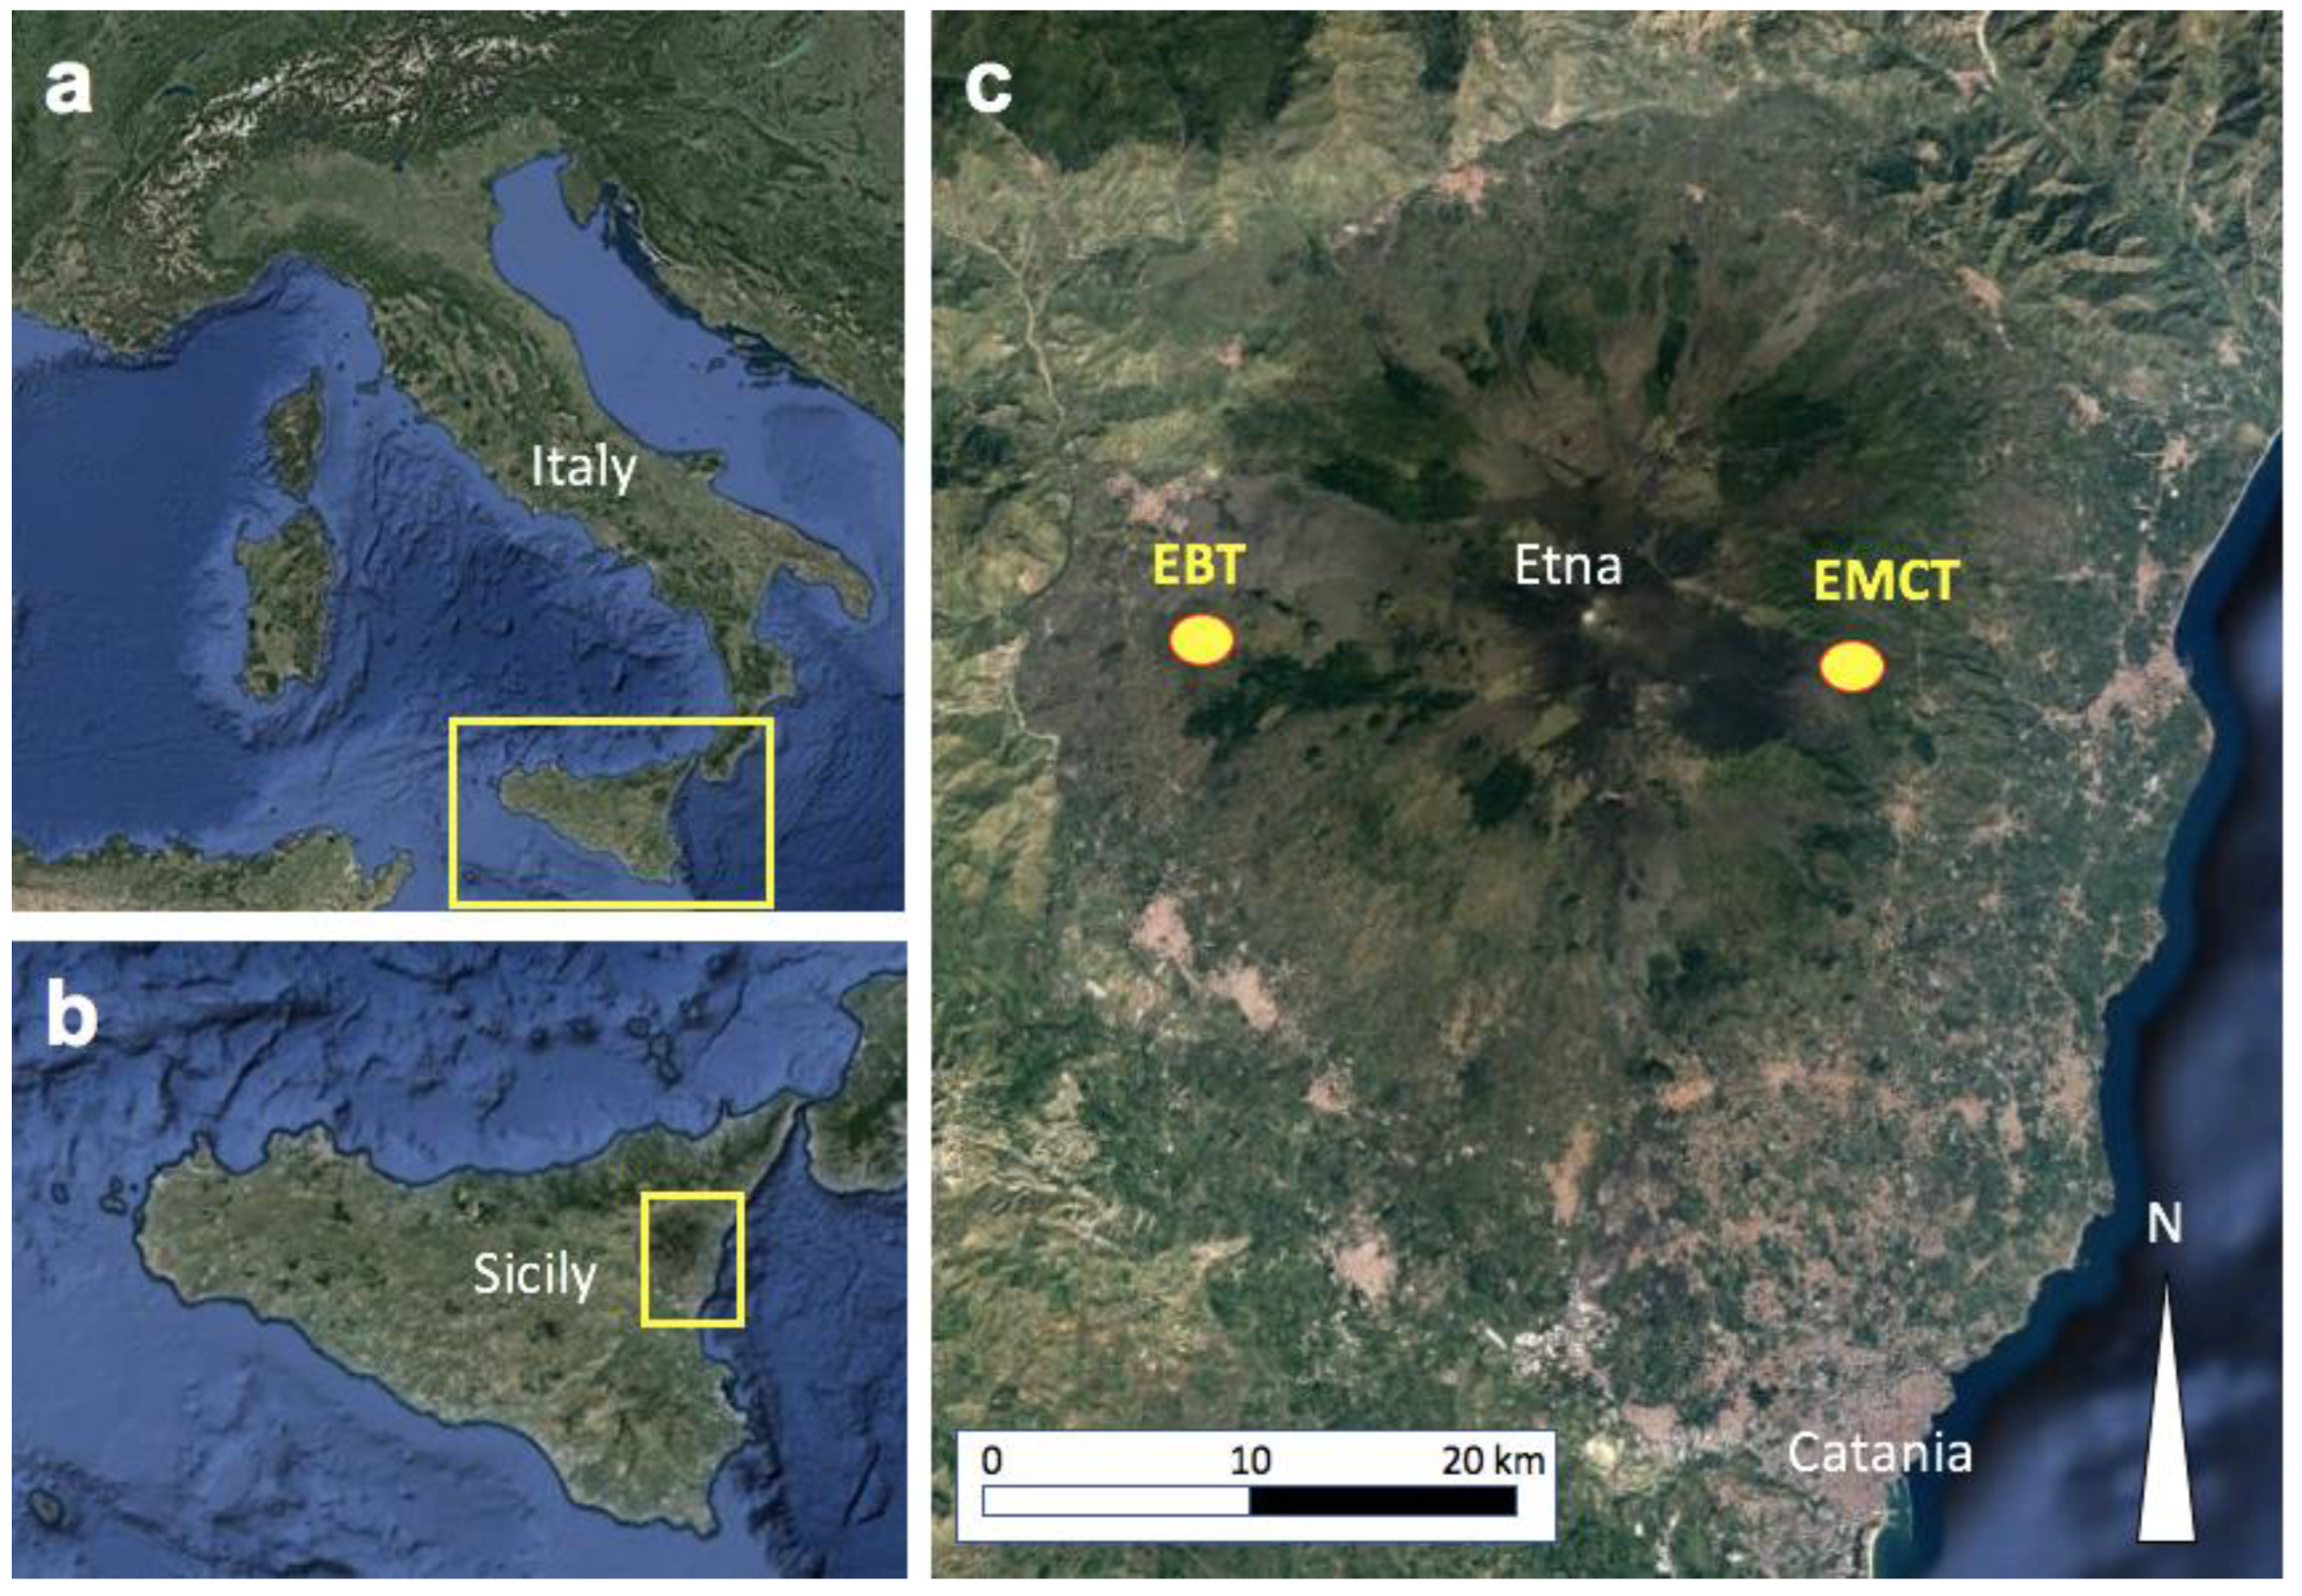
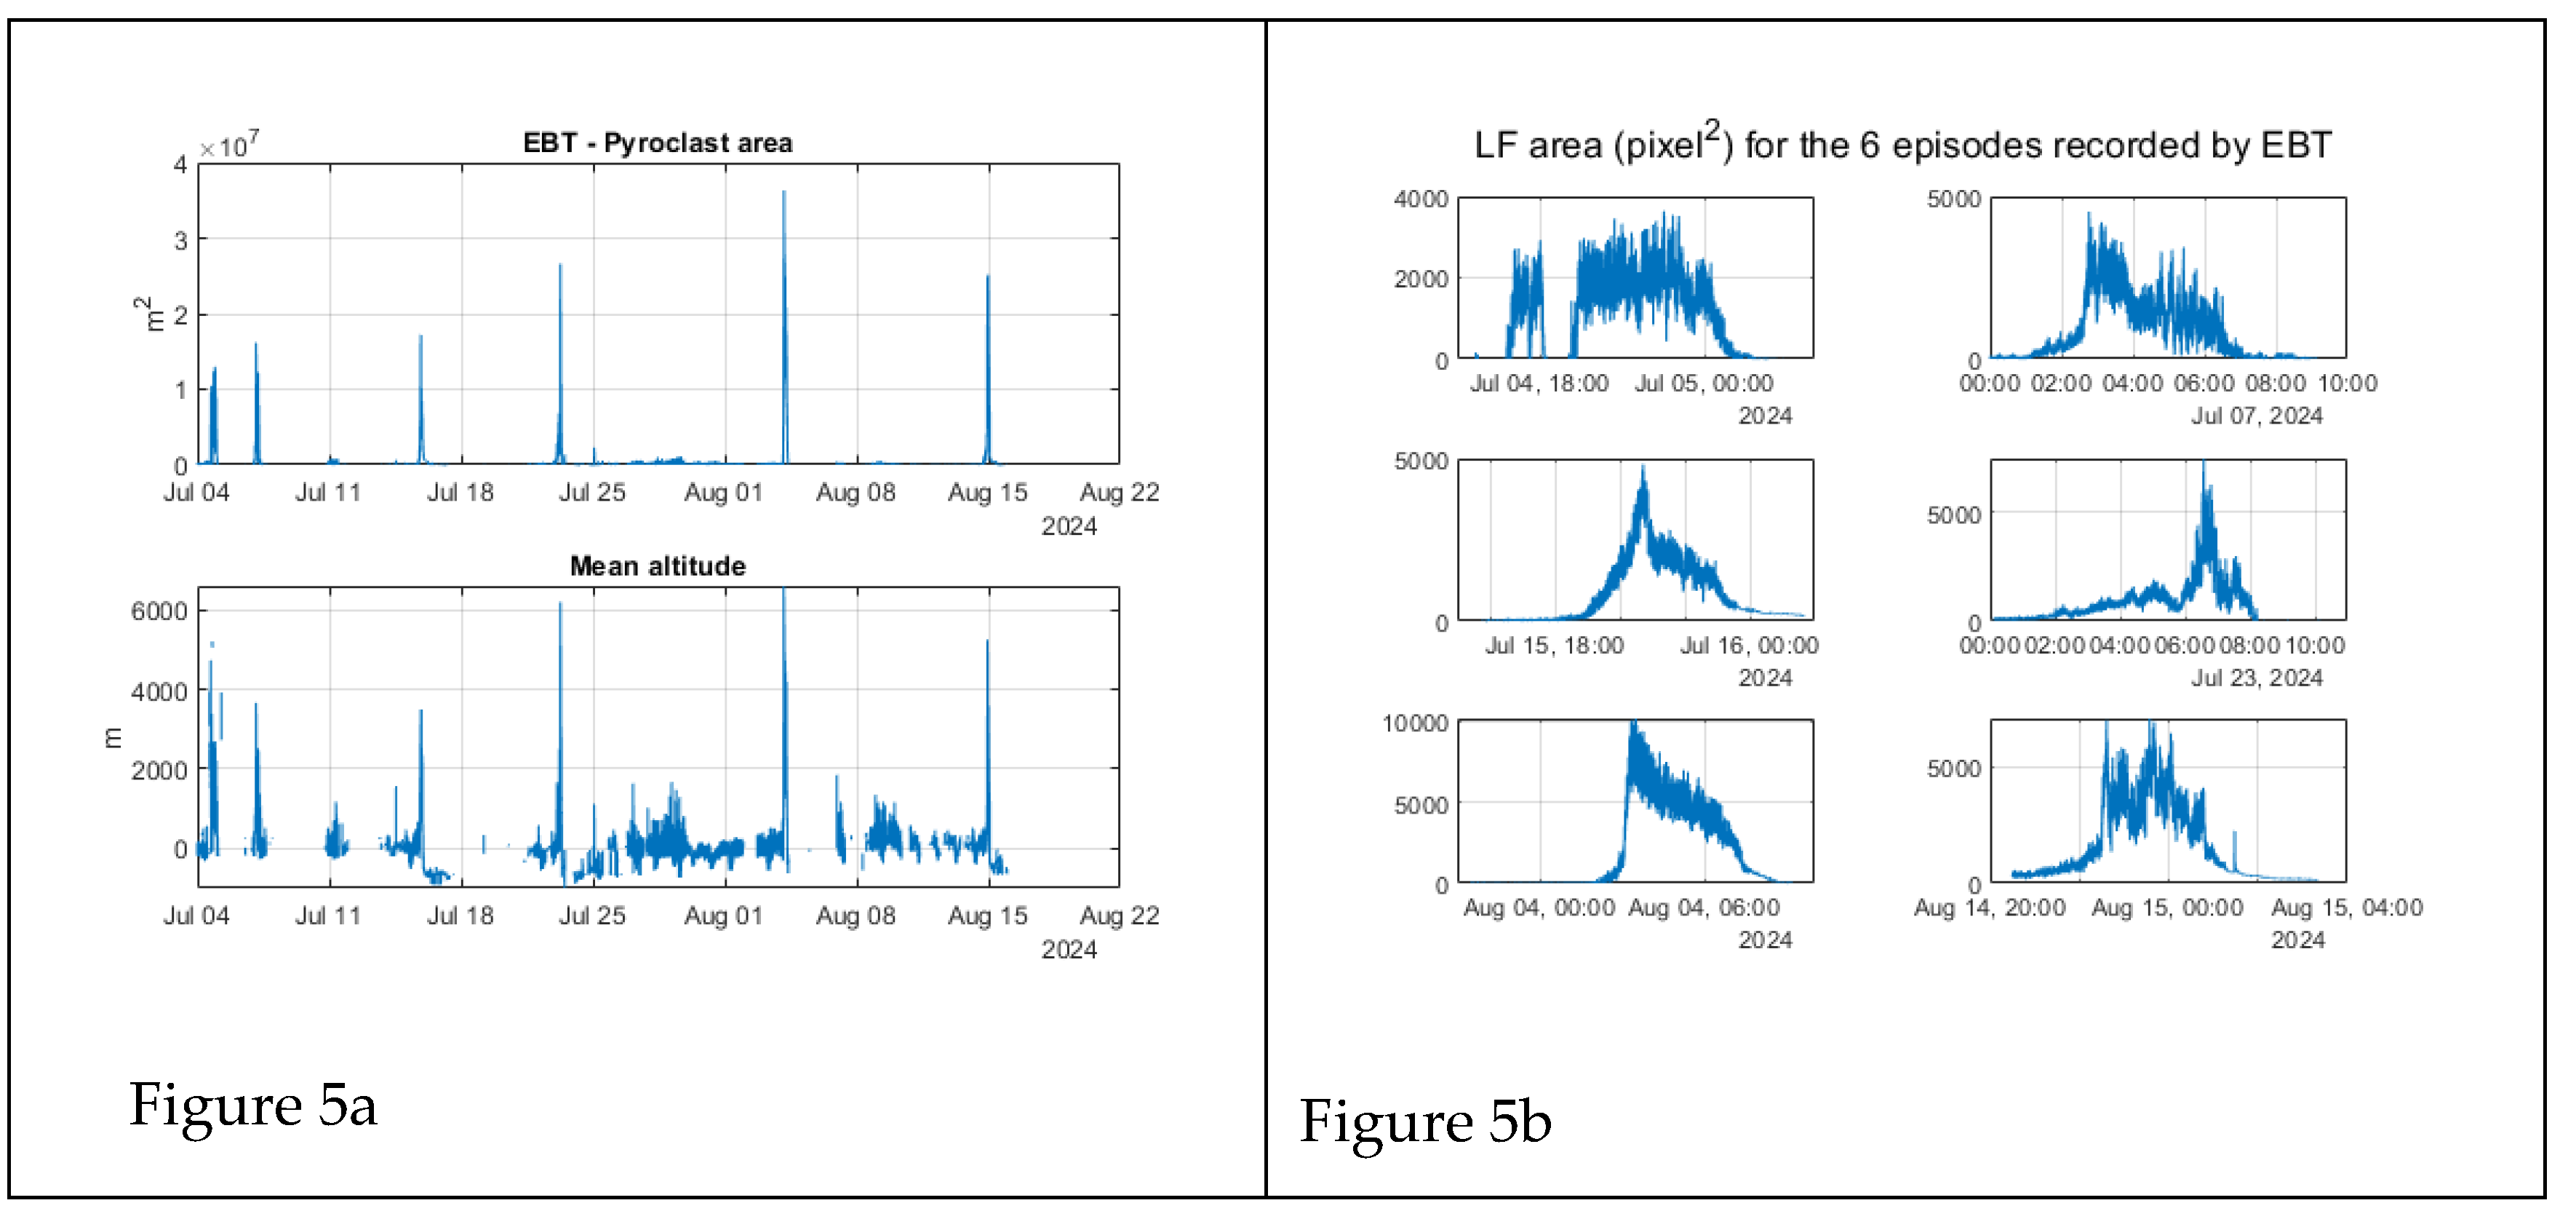
Analyzing the thermal images recorded by the EBT thermal camera, located on the western flank of the volcano and as such offering a clear view of the VOR crater (
Figure 1c), six explosive paroxysmal events occurred at VOR were detected between 4 July and 4 September 2024: on 4-5 July, 7 July, 15 July, 23 July, 4 August, and 14-15 August (
Figure 5).
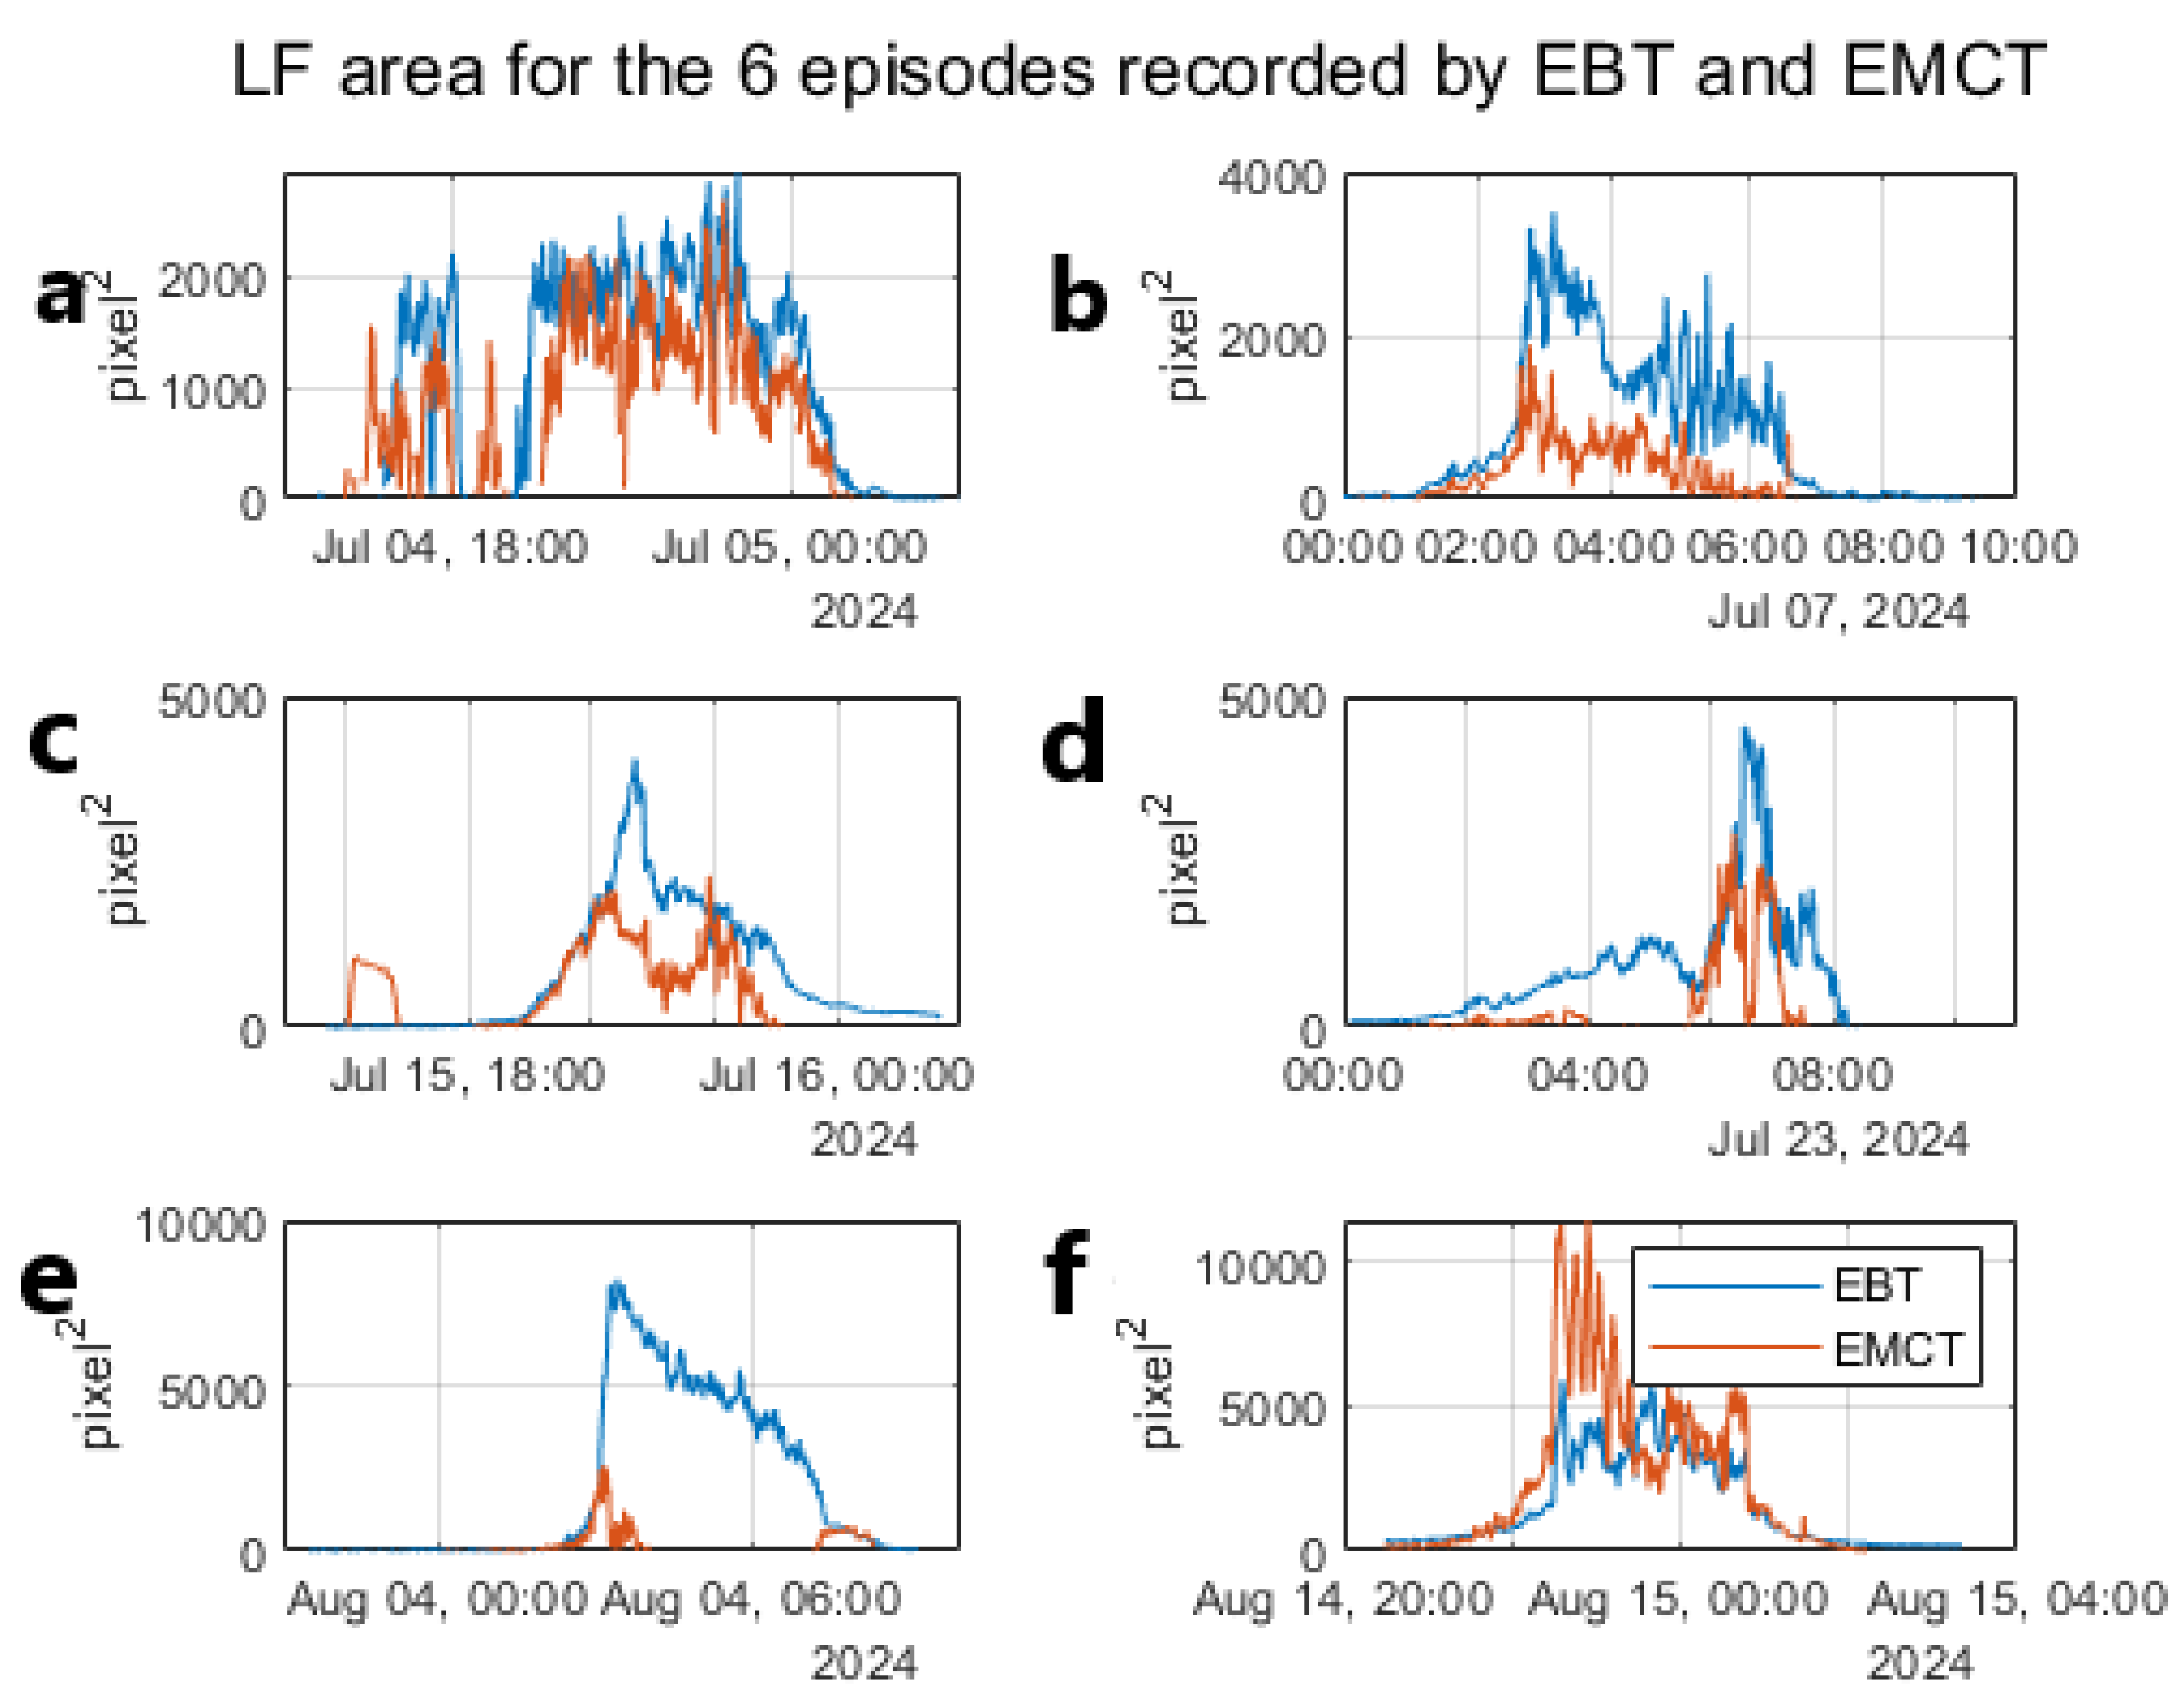
The data related to the LF area detected by the EMCT camera are shown in
Figure 6, along with those from the EBT. As can be observed, due to weather conditions, the EMCT signals are in general more discontinuous compared to those of the EBT, which is why the latter was preferred for the continuation of the work.
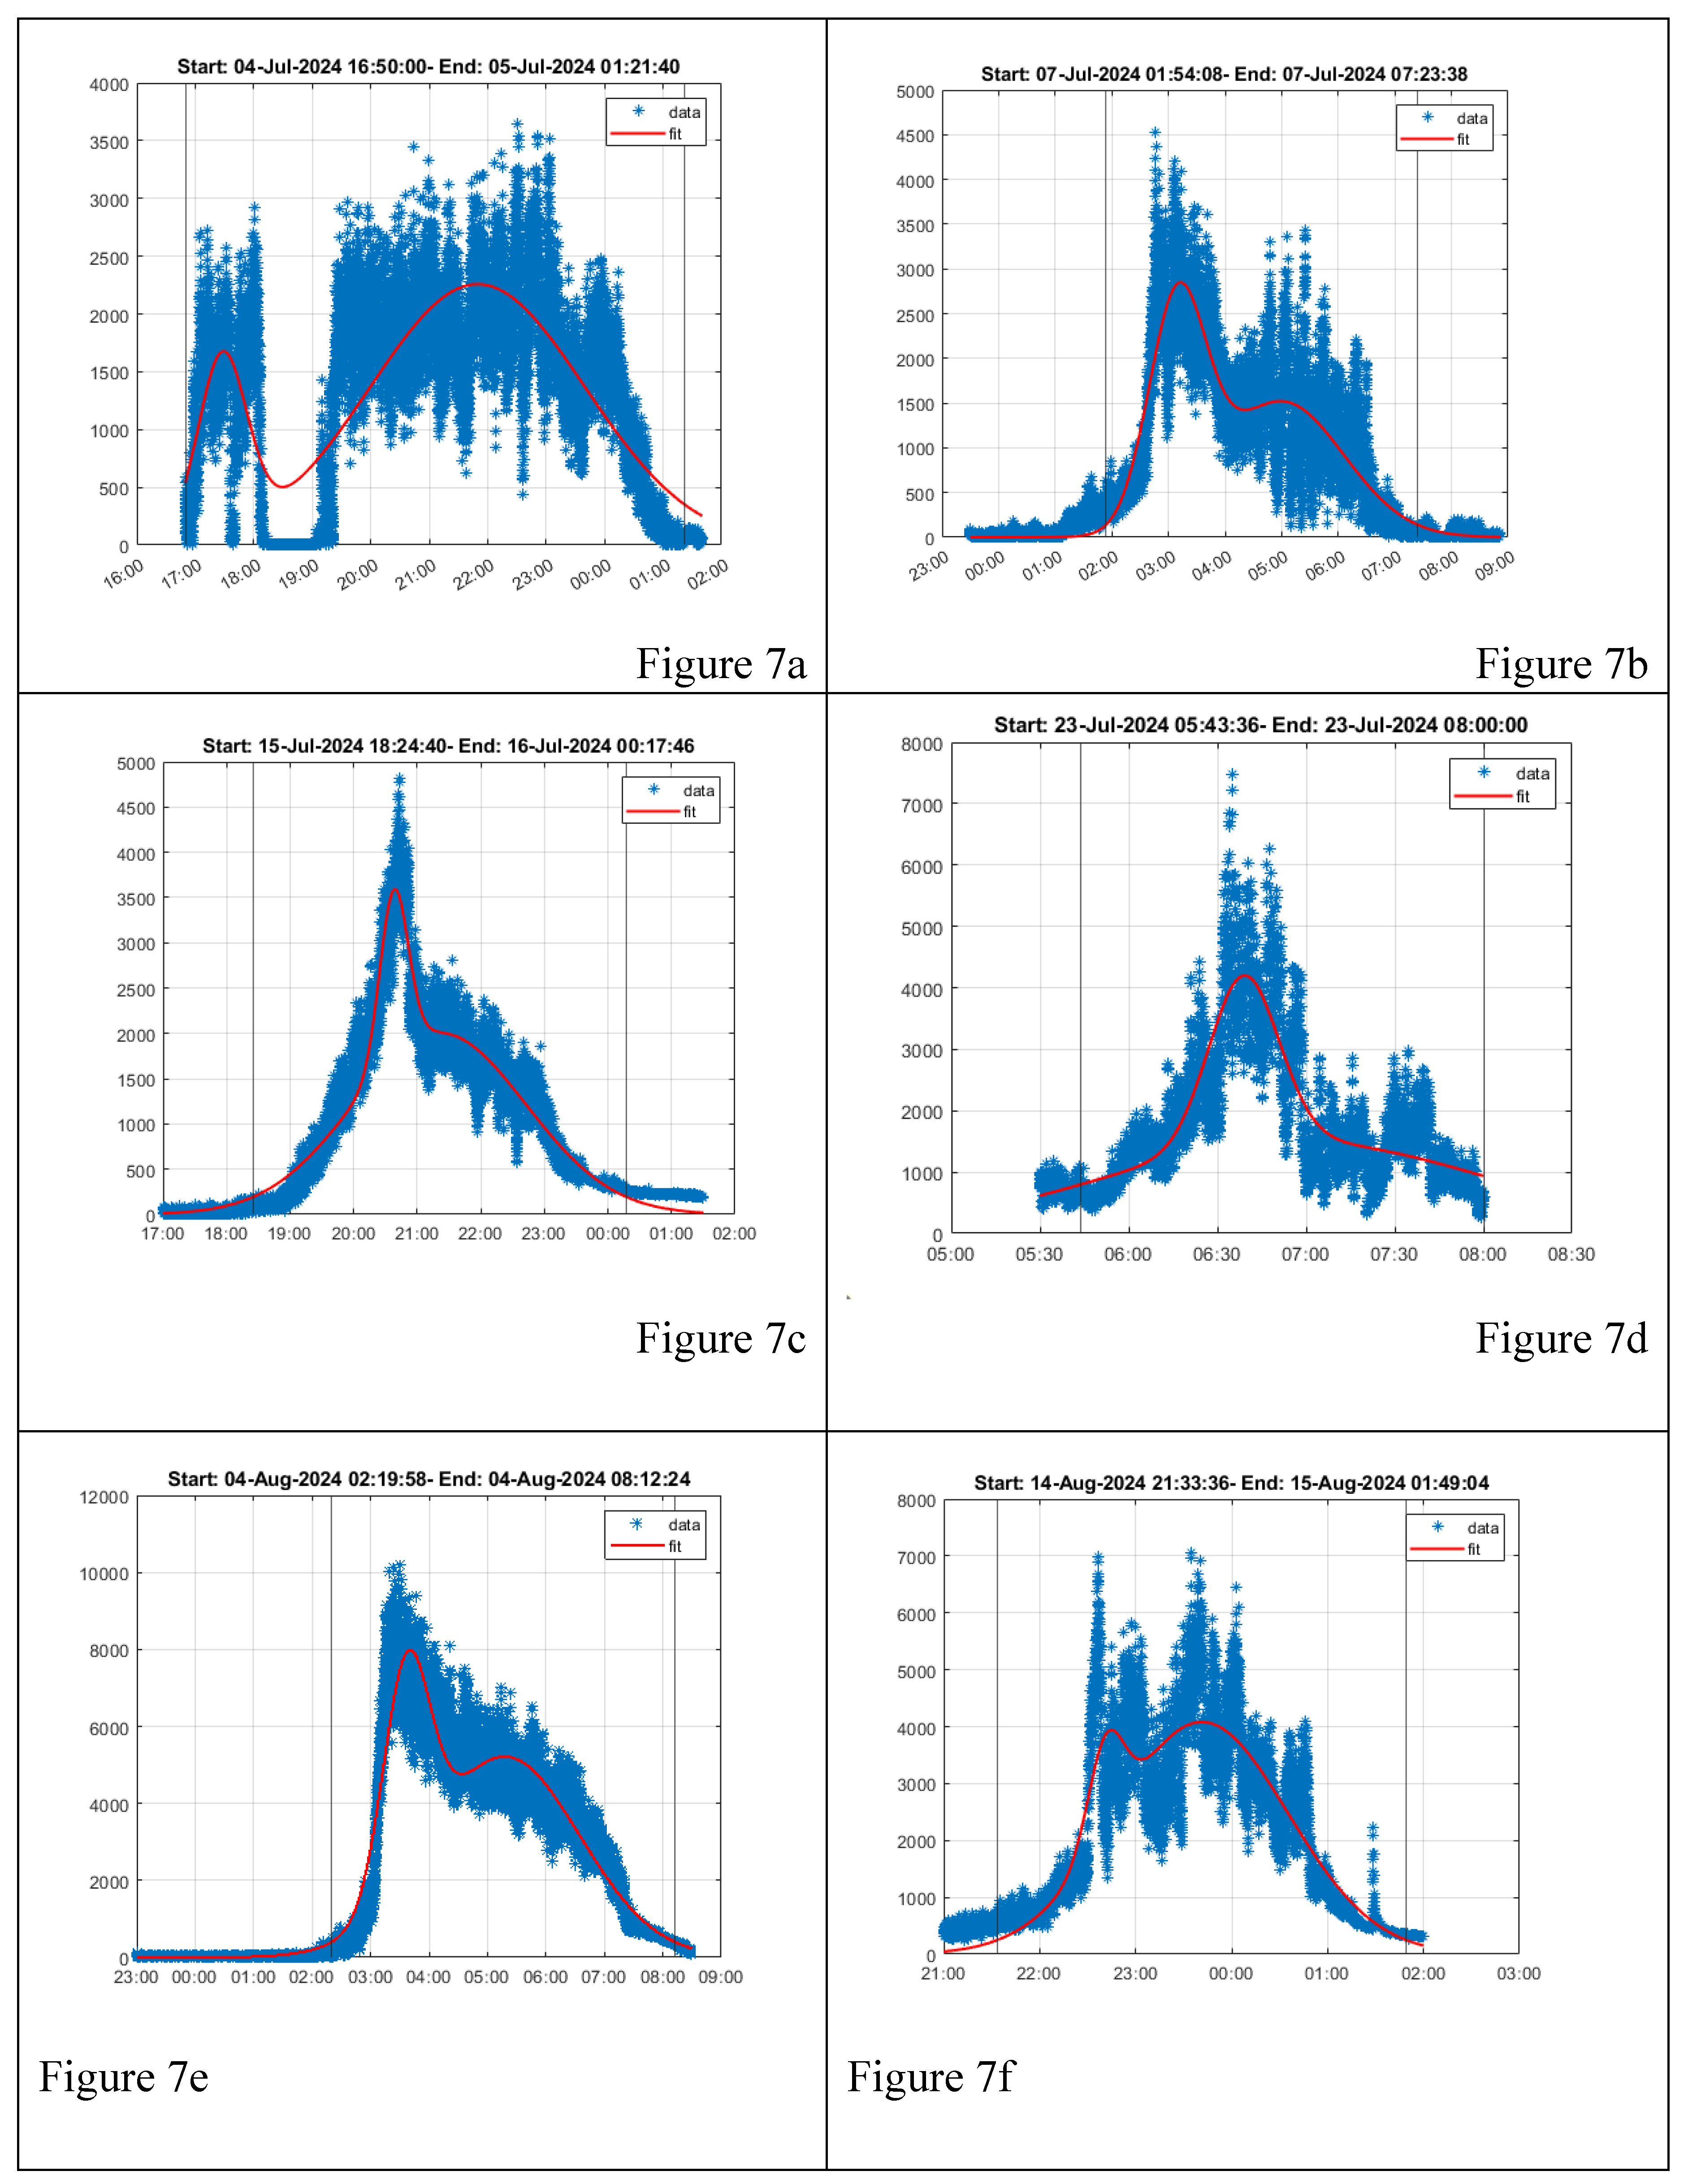
The first episode (
Figure 6a,
Figure 7a,
Figure 8a-c) began its paroxysmal phase around 16:50 on July 4, 2024, and showed two phases, as the activity significantly decreased around 18:00 (
Figure 7a), to resume shortly after 19:00 (
Figure 7a), decline (
Figure 8c) and finally end around 01:21 on July 5, 2024. However, upon reviewing the footage, it was evident that between 18:00 and 19:00, there was no a real decrease in activity, but the field of view of the EBT camera was obscured by cloud cover (
Figure 7a,
Figure 8a), thus the resulting erupted volume is underestimated. The presence of clouds had already prevented the visualization of the Strombolian activity starting from 12:00. The review of the images confirms that the paroxysmal activity ended around 01:21 on July 5, 2024, and then continued as Strombolian activity (
Figure 6a,
Figure 7a).
The second episode (
Figure 6b,
Figure 7b,
Figure 8d-f), starts its paroxysmal phase at approximately 01:54 on 07 July and presents a maximum intensity at around 03:00 (
Figure 8e). Subsequently the intensity decreases and after a relative peak around 05:20 it ends at 07:23. The measured LF area data can be well fitted with a superposition of two Gaussian functions as shown in
Figure 7b. Some frames showing the beginning, the maximum intensity and the terminal phase are shown in
Figure 8 d-f.
The third episode (
Figure 6c) begins its paroxysmal phase at approximately 18:24 on July 15 and presents a maximum intensity around 20:43. Subsequently, the intensity gradually decreases and ends around 00:17. Measured data can be well fitted by superimposing a pair of Gaussian functions, as shown in
Figure 7c. Some frames showing the onset, the maximum intensity and the terminal phase are shown in
Figure 8 g, h and I, respectively.
The fourth episode (
Figure 6d) begins its paroxysmal phase at approximately 05:43 on July 23 and presents a maximum intensity around 06:45. Subsequently, the intensity gradually decreases and ends around 08:00. Given the regularity of the episode, the measured data can be well fitted by a Gaussian function, as shown in
Figure 7d. Some frames showing the onset, the maximum intensity and the terminal phase are shown in
Figure 8 j, k and l, respectively.
The fifth episode (
Figure 6e) starts its paroxysmal phase at about 02:19 on 04 August and presents a maximum intensity around 03:20. Subsequently the intensity gradually decreases and ends around 08:12. The measured data can be well fitted by a pair of Gaussian functions, as shown in
Figure 7e. Some frames showing the onset, the maximum intensity and the terminal phase are shown in
Figure 8 m, n and o, respectively.
The sixth episode (
Figure 6f) begins its paroxysmal phase at approximately 21:33 on 14 August and presents several intensity maxima between 22:30 and 00:05. Subsequently, the intensity gradually decreases and ends around 01:49. The measured data can be well fitted by a triplet of Gaussian functions, as shown in
Figure 7f. Some frames showing the onset, the maximum intensity and the terminal phase are shown in
Figure 8 p, q and r, respectively.
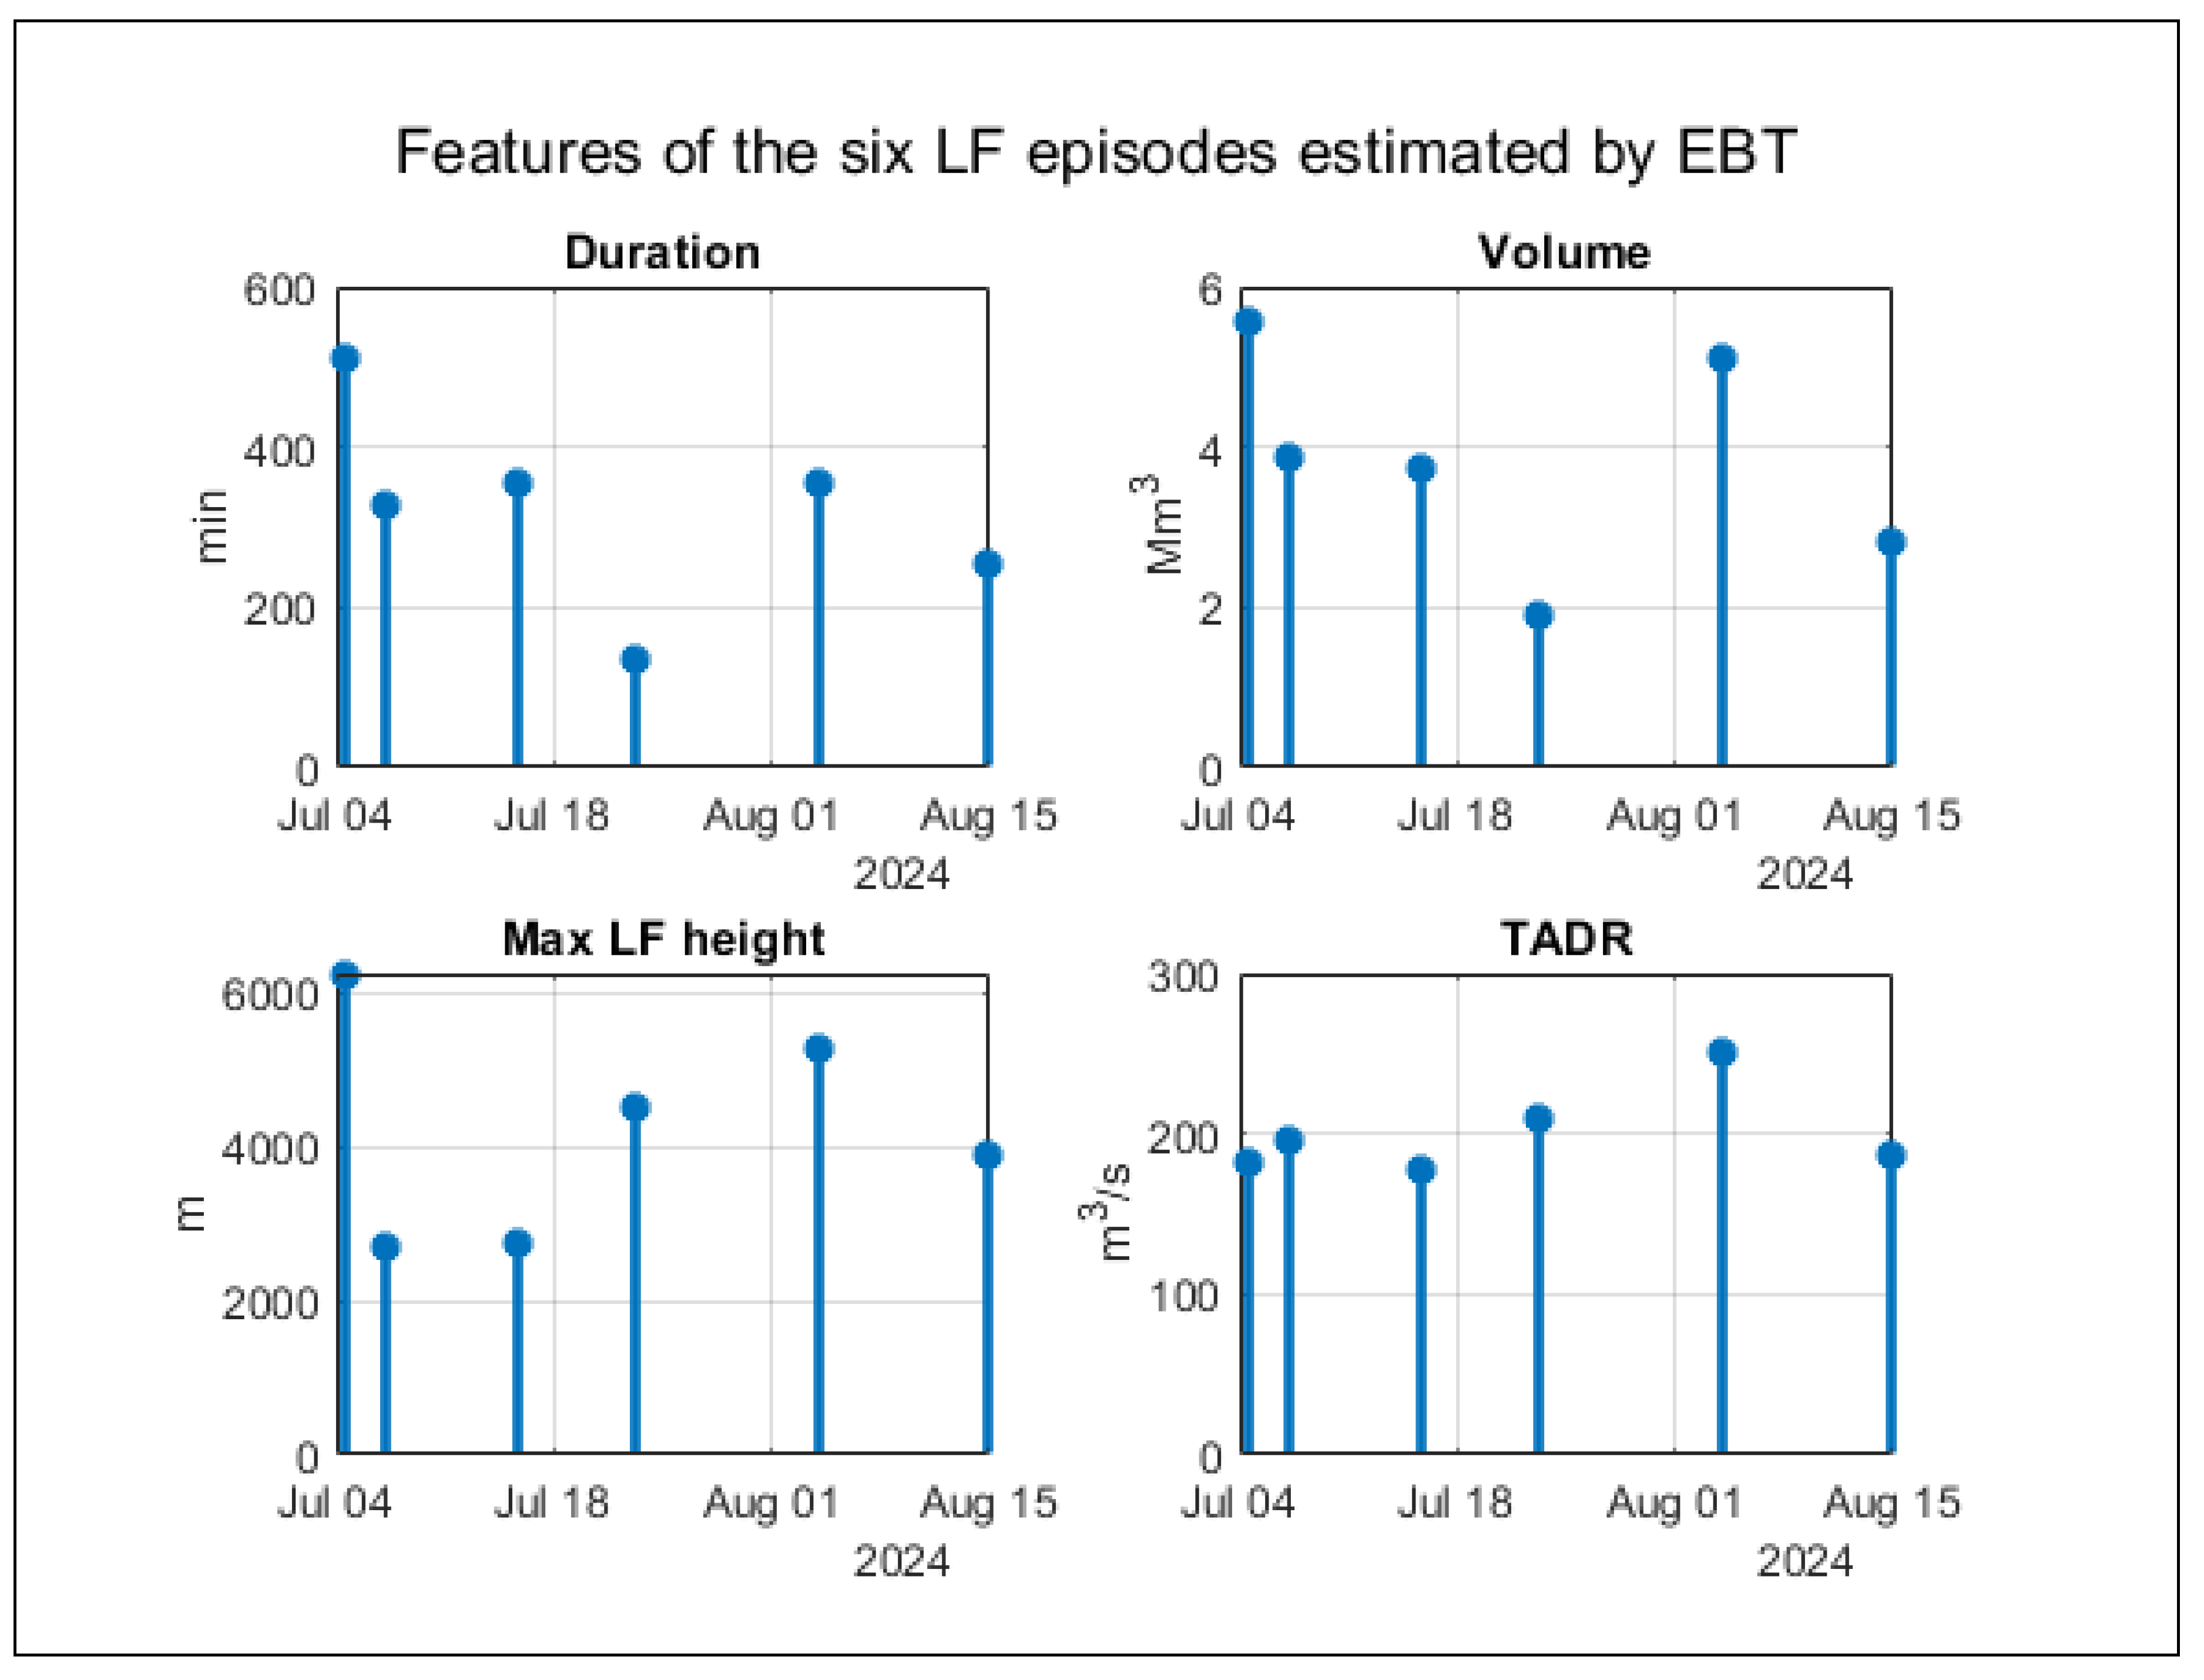
The starting and ending times and duration of each event, together with the lava fountains height (maximum and average), erupted volume of pyroclastic material, and time averaged discharge rate (TADR; [
61]) are reported in
Table 2 and graphically represented in
Figure 9.
From
Figure 9 it is evident that the first of the six studied episodes is clearly the most energetic, characterized by the longest duration, largest volume, and highest maximum LF height. In contrast, the fourth episode is marked by the shortest duration and smallest volume.
4. Discussion and Conclusive Remarks
The observed episodic fountaining described above are consistent with two models: (i) magma collection and (ii) pulsed supply [
51]
. The magma collection model (i) considers a shallow reservoir full of gas-rich magma that accumulates a foam layer at the roof up to a threshold thickness [
8]. The collapse of the foam layer, once reached the threshold thickness, causes one or more closely spaced fountaining episodes, allowing the shallow storage to be tapped [
62]. This model would involve an almost constant erupted volume for each cycle of storage emptying [
21]. The second model (ii) considers each paroxysmal episode being fed by a gas-rich magma batch entering the shallow storage and triggering a pressurization-depressurization cycle by increasing rise rate and volatile flux coupled with rapid exsolution during ascent [
51]
. This model would involve a random distribution of the erupted volumes, and is supported by a slightly different composition, crystallinity and gas content of the products erupted during the 2015 VOR paroxysms [
63]. If we consider the trends of duration and erupted volume of each of the 2024 VOR paroxysms (
Figure 9), it appears a clear trend grouping the first four episodes which display a decreasing duration and a decreasing erupted volume with time, already observed for the four episodes occurred at VOR in 2015 [
44], that would be compatible with the emptying of a shallow storage. As a proxy for the volume of the shallow storage, we can use the estimation of [
44] and [
52] for the 4 closely-spaced paroxysmal episodes occurred at VOR in 2015, which erupted ~ 12 Mm
3 magma in just 3 days. The total volume erupted during the first four 2024 VOR paroxysmal episodes is ~ 15 Mm
3 (
Table 3), which is remarkably close to the total volume estimated for the sequence of four paroxysms occurred at VOR in 2015 [
44,
52]. In this framework, the last two paroxysmal explosive events occurred at VOR in 2024, that erupted almost 10 Mm
3 (
Table 3), could represent a partial replenishment of the shallow storage occurred during the twelve days spanning between the end of the fourth and the start of the fifth episode, possibly induced by the decompression due to the magma output of the previous four episodes. In the hypothesis that the shallow storage of VOR has a capacity of ~ 12-15 Mm
3, it is thus possible that one or two additional explosive paroxysmal events could occur in the future.
We can then speculate, on the basis of the calculated erupted volume from VOR, that the size of the shallow supply system of this crater has a capacity of ~ 12-15 Mm
3, and following previous geophysical results [
44] is located at a depth of 1.5 km b.s.l. Compared to the results obtained from the SEC, it appears that the supply system of the SEC conduit is much shallower, being ~ 1.5 km a.s.l. [
46], thus 3 km higher in the crust than that of the VOR, and the capacity of this storage much smaller, apparently of the order of ~ 2.5 Mm
3 [
2]. Thus, while the SEC storage is able to feed just one paroxysmal event, that of the VOR can be emptied with a sequence of episodes cumulating all together ~ 12-15 Mm
3. Recent data from Calvari and Nunnari [
20] on the temporal distribution of lava fountains at SEC from 2011 to 2022 agrees with this hypothesis, showing that the inter-event times of the paroxysmal sequences at SEC follow a power-law distribution. This indicates that lava fountains at SEC are governed by complex, non-linear dynamics rather than by regular, periodic processes.
Following the results presented in this paper and considering the eruptive history of the four Etna’s summit craters, we can speculate that BN and NEC did not produce paroxysmal explosive sequences, but just occasional and rare paroxysmal events, because their shallow supply systems are small, possibly being lateral branches of the main feeder conduit. By contrary, SEC and VOR have a supply system much wider and often refilled by gas-rich magma that accumulates at different depths and separated storages and could be released by paroxysmal explosive sequences. The supply system of VOR is probably much larger than that of SEC, being located at a greater depth. Unfortunately, the lack of a mathematical model that can fully interpret the phenomenon of lava fountain sequences makes all these considerations rather speculative, although they can represent a useful starting point for future more in depth and more quantitative studies. We therefore intend to work in the future to fill this gap.
Figure 1.
Photos of Etna’s summit craters, taken from helicopter on 9 February (a) and 9 July (b) 2024. NEC= North-East Crater; SEC= South-East Crater; BN-1 and BN-2 are the two pits of the Bocca Nuova Crater; VOR= Voragine. The comparison between the two photos taken five months apart shows the growth of the Voragine owing to the eruptive activity occurred between February and July 2024. (a) Photo by Maria Catania, INGV-OE. (b) Photo by Stefano Branca, INGV-OE.
Figure 2.
(a) Google Earth map of Italy, with the yellow rectangle showing Sicily, framed in b. (b) Google Earth map of Sicily, with the yellow rectangle showing Mt. Etna volcano, framed in c. (c) Google Earth map of Etna volcano, with the summit where the name Etna is displayed, and the position of the EBT INGV-OE thermal camera.
Figure 3.
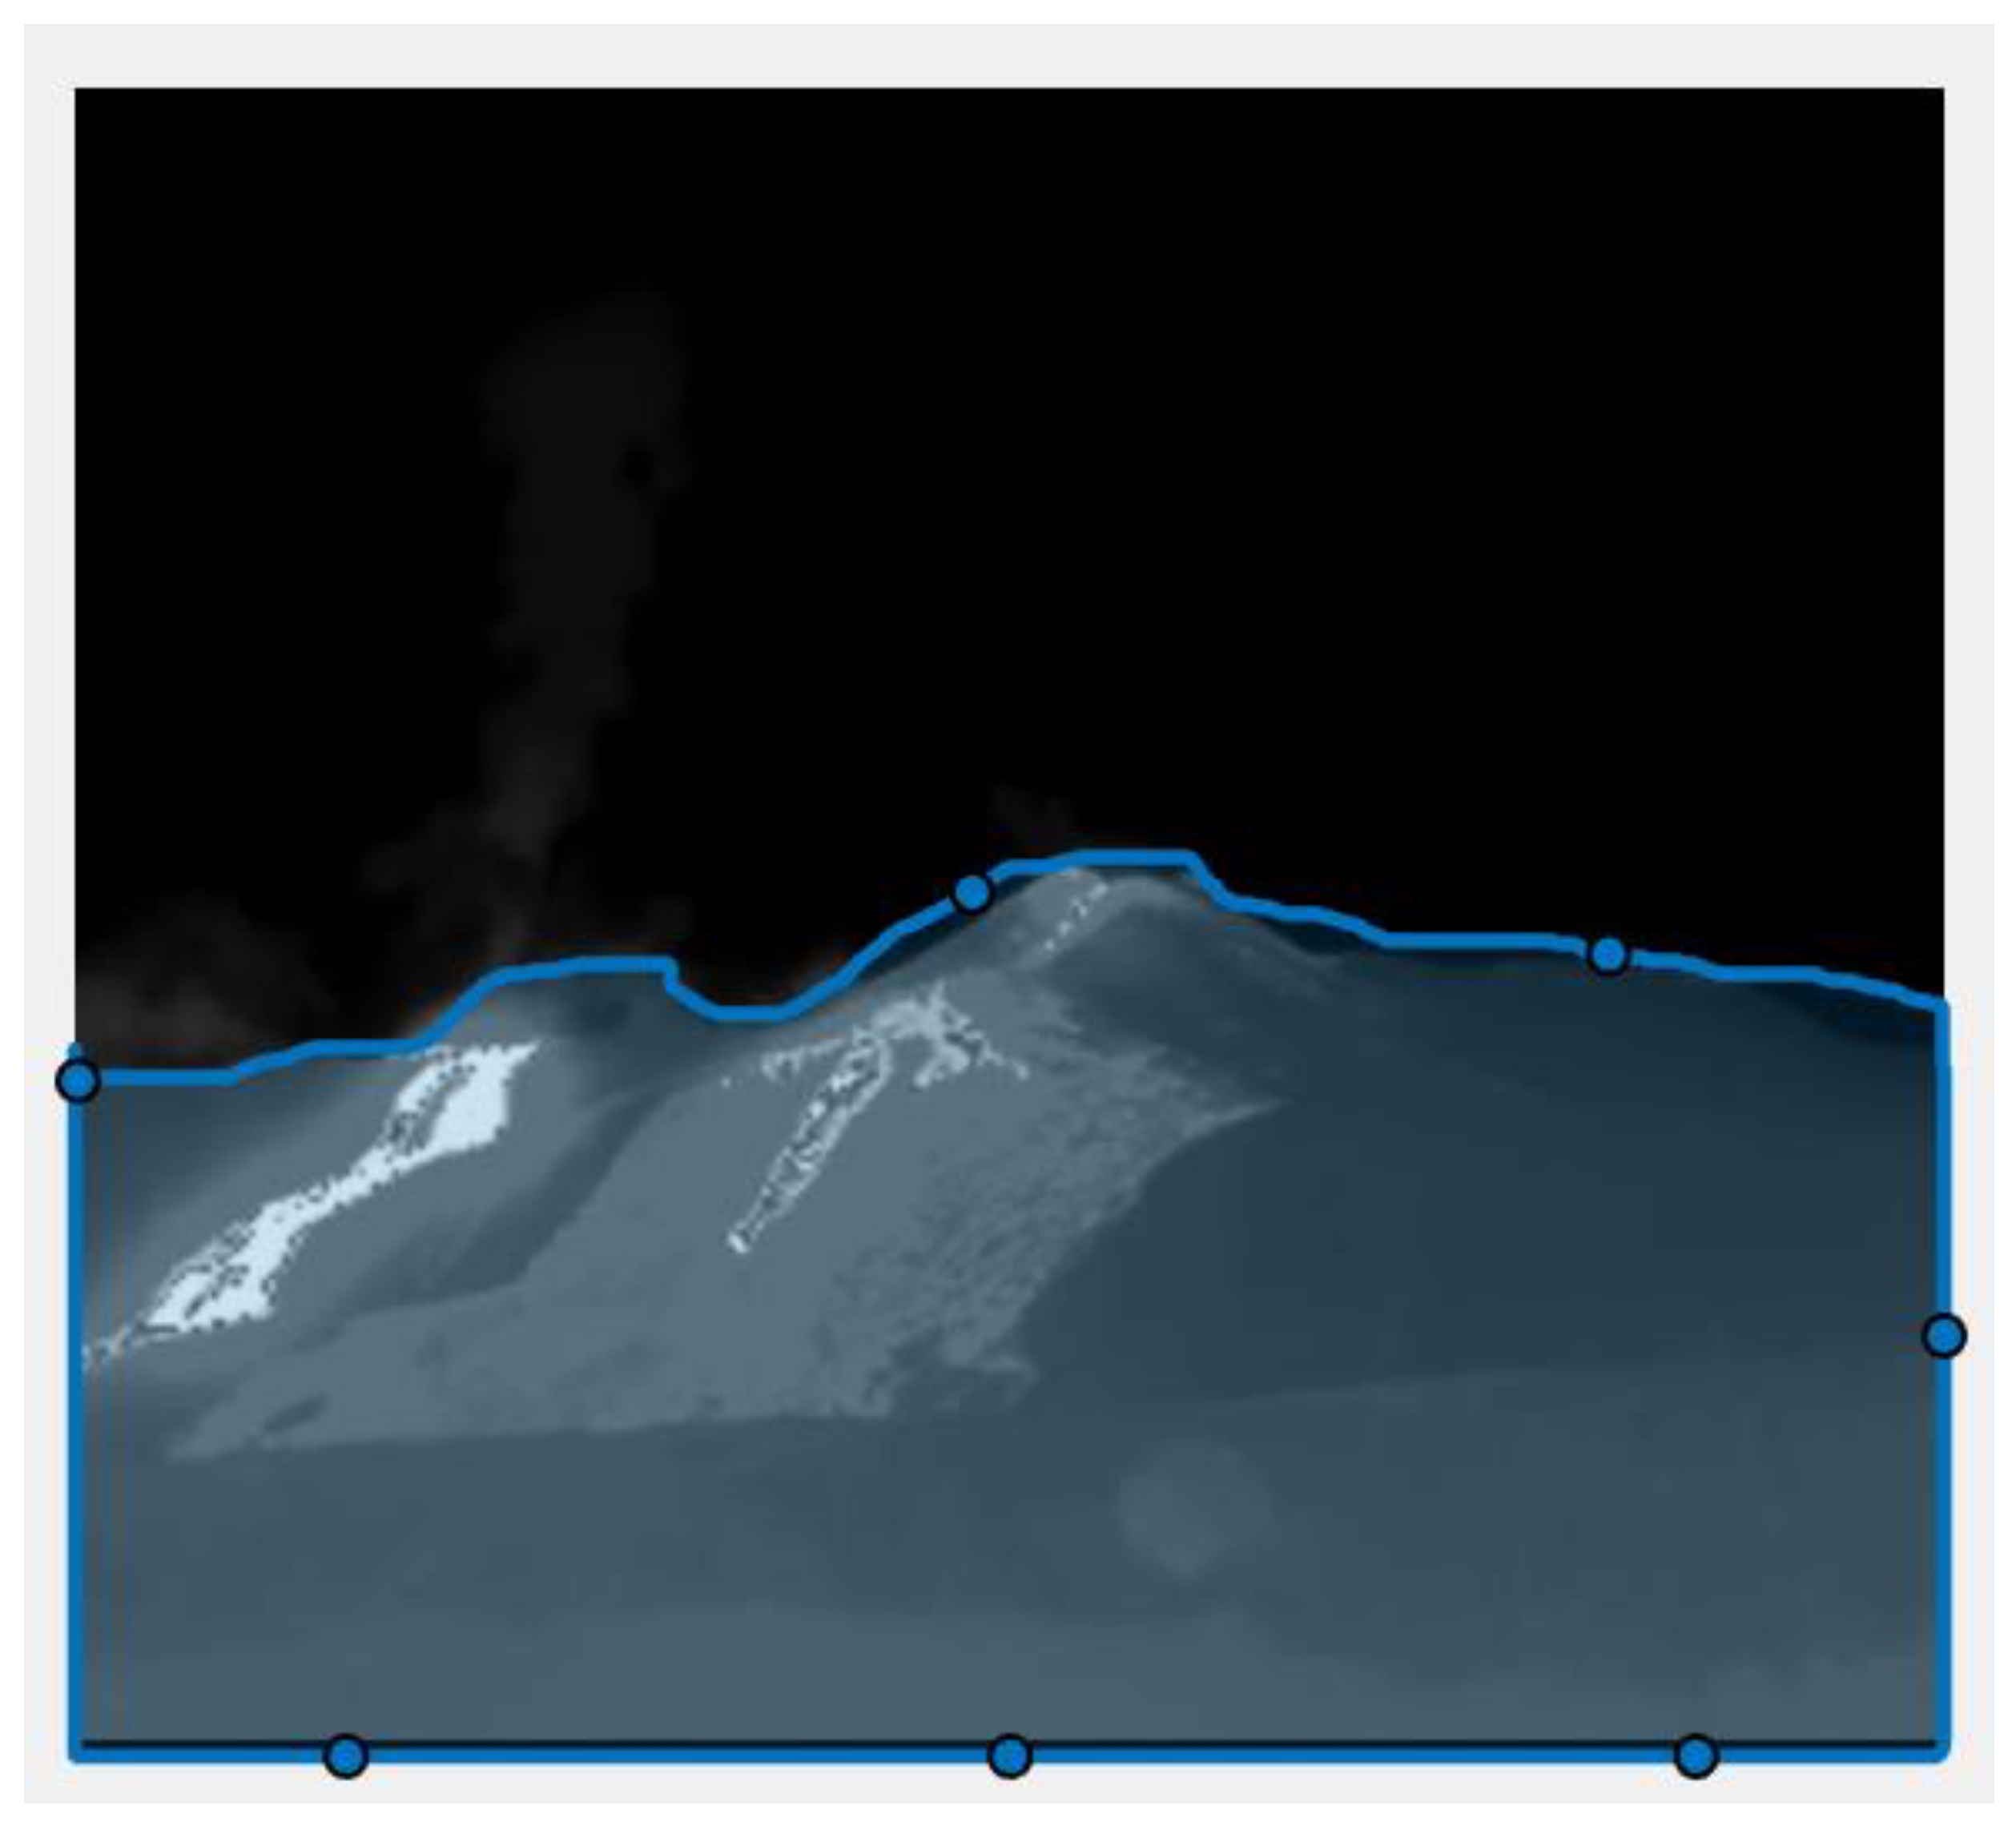
Delimiting a mask (blue line with blue dots): this defines the region of interest (ROI) as the black area above the mask.
Figure 3.
Delimiting a mask (blue line with blue dots): this defines the region of interest (ROI) as the black area above the mask.
Figure 4.
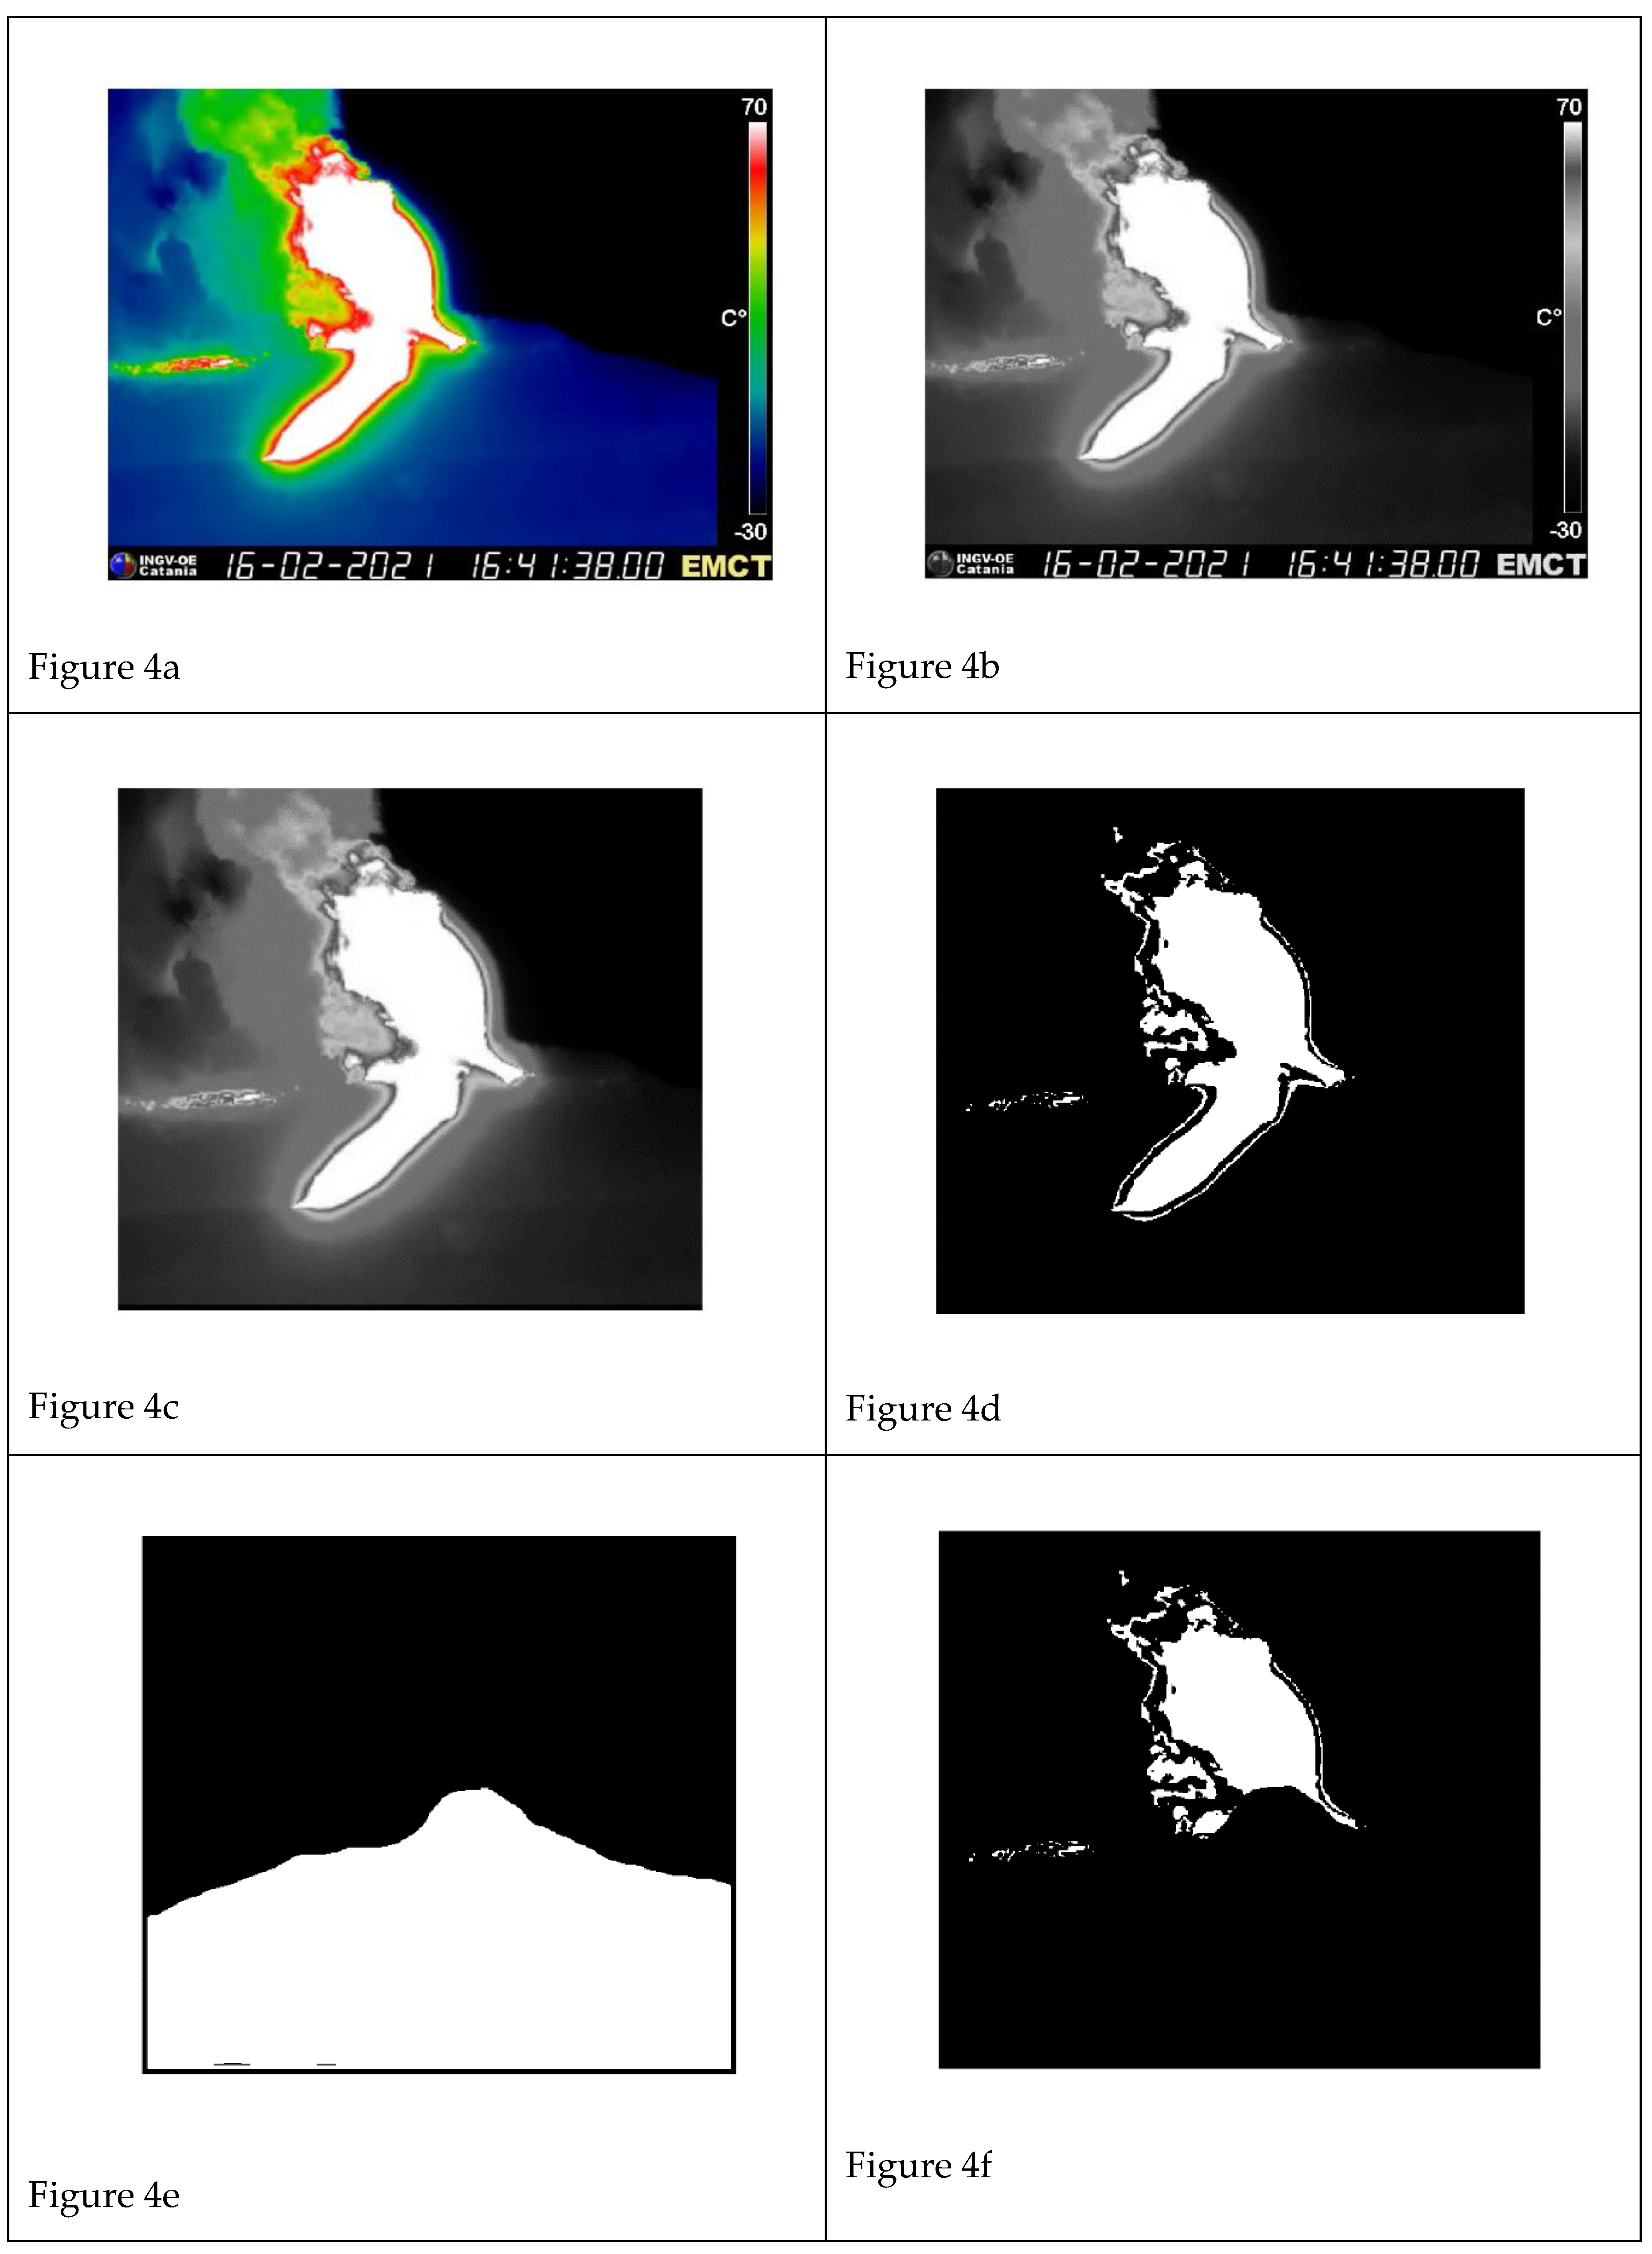
(a) RGB frame showing an ongoing lava fountain and associated lava flows spreading in multiple directions. The frame also includes a color bar (right) and a bar with the camera name, date and time (bottom). (b) The same image in (a) after conversion to grayscale using an appropriate threshold. (c) The cropped image with the right and bottom bars removed. (d) The binarized image. (e) The mask (white) to delimit the region of interest (ROI) and exclude the lava flow area. (f) The final image after the preprocessing sequence.
Figure 5.
(a) Pyroclast area (above) and mean altitude (below) obtained from 4 July to 22 Aug 2024 on the thermal images recorded by EBT. (b) Details of the lava fountain (LF) area for the six episodes, as recorded by EBT.
Figure 5.
(a) Pyroclast area (above) and mean altitude (below) obtained from 4 July to 22 Aug 2024 on the thermal images recorded by EBT. (b) Details of the lava fountain (LF) area for the six episodes, as recorded by EBT.
Figure 6.
Lava fountain (LF) area recorded by the EBT (blue line) and EMCT (red line) thermal cameras. Explosive paroxysm of 4 July 2024 (a), 7 July 2024 (b), 15-16 July 2024 (c), 23 July 2024 (d), 4 August 2024 (e), and 14-15 August 2024 (f). The x-axis is time (UTC), the y-axis is graduated in . In this figure, for clarity the signals have been down-sampled at a rate of 1 minute.
Figure 7.
Area (in pixels) occupied by the pyroclastic portion of the lava fountains recorded by the EBT station. The experimental area data is shown in blue, with red curves representing the fit obtained using a basis of Gaussian functions. The thin black vertical lines mark the start and end times of each episode, as estimated using the threshold algorithm mentioned in
Section 2.1. (a-f) are showing data of the episodes 1 to 6, respectively.
Figure 8.
Frames from the EBT camera showing the initial, climax and declining phases of each of the six paroxysmal episodes occurred at VOR crater between July and August 2024. In each image north is on the left, south is on the right. The color bar on the right displays the scale of apparent temperature. (a): frame of 4 July 2024 at 16:50:00, with the warm ash plume bending to the right and the blue cold cloud to the left of the image; (b) frame of 4 July 2024 at 21:01:50; (c) frame of 5 July 2024 at 00:32:58; (d) frame of 7 July 2024 at 02:02:08; (e) frame of 7 July 2024 at 03:01:34; (f) frame of 7 July 2024 at 06:01:54, with the blue portion of the plume showing the ash cloud spreading north (left); (g) frame of 15 July 2024 at 19:01:30; (h) frame of 15 July 2024 at 20:31:30; (i) frame of 15 July 2024 at 23:01:54, with a lava flow starting from the right base of the crater; (j) frame of 23 July 2024 at 06:01:34, with a lava flow starting from the right base of the crater; (k) frame of 23 July 2024 at 06:46:42, with a lava flow starting from the right base of the crater; (l) frame of 23 July 2024 at 07:31:36, with a lava flow starting from the right base of the crater; (m) frame of 4 August 2024 at 02:31:08; (n) frame of 4 August 2024 at 03:31:44, with a lava flow starting from the base of the crater; (o) frame of 4 August 2024 at 07:01:30, with a lava flow spreading from the right and central portion of the crater; (p) frame of 14 August 2024 at 22:01:24, with two lava flows starting from the right and central parts of the crater; (q) frame of 14 August 2024 at 23:31:40, with at least three lava flows spreading from the base of the crater, and ash plume fallout to the right; (r) frame of 15 August 2024 at 01:01:30, with four lava branches expanding from the base of the crater. All times are expressed in UTC.
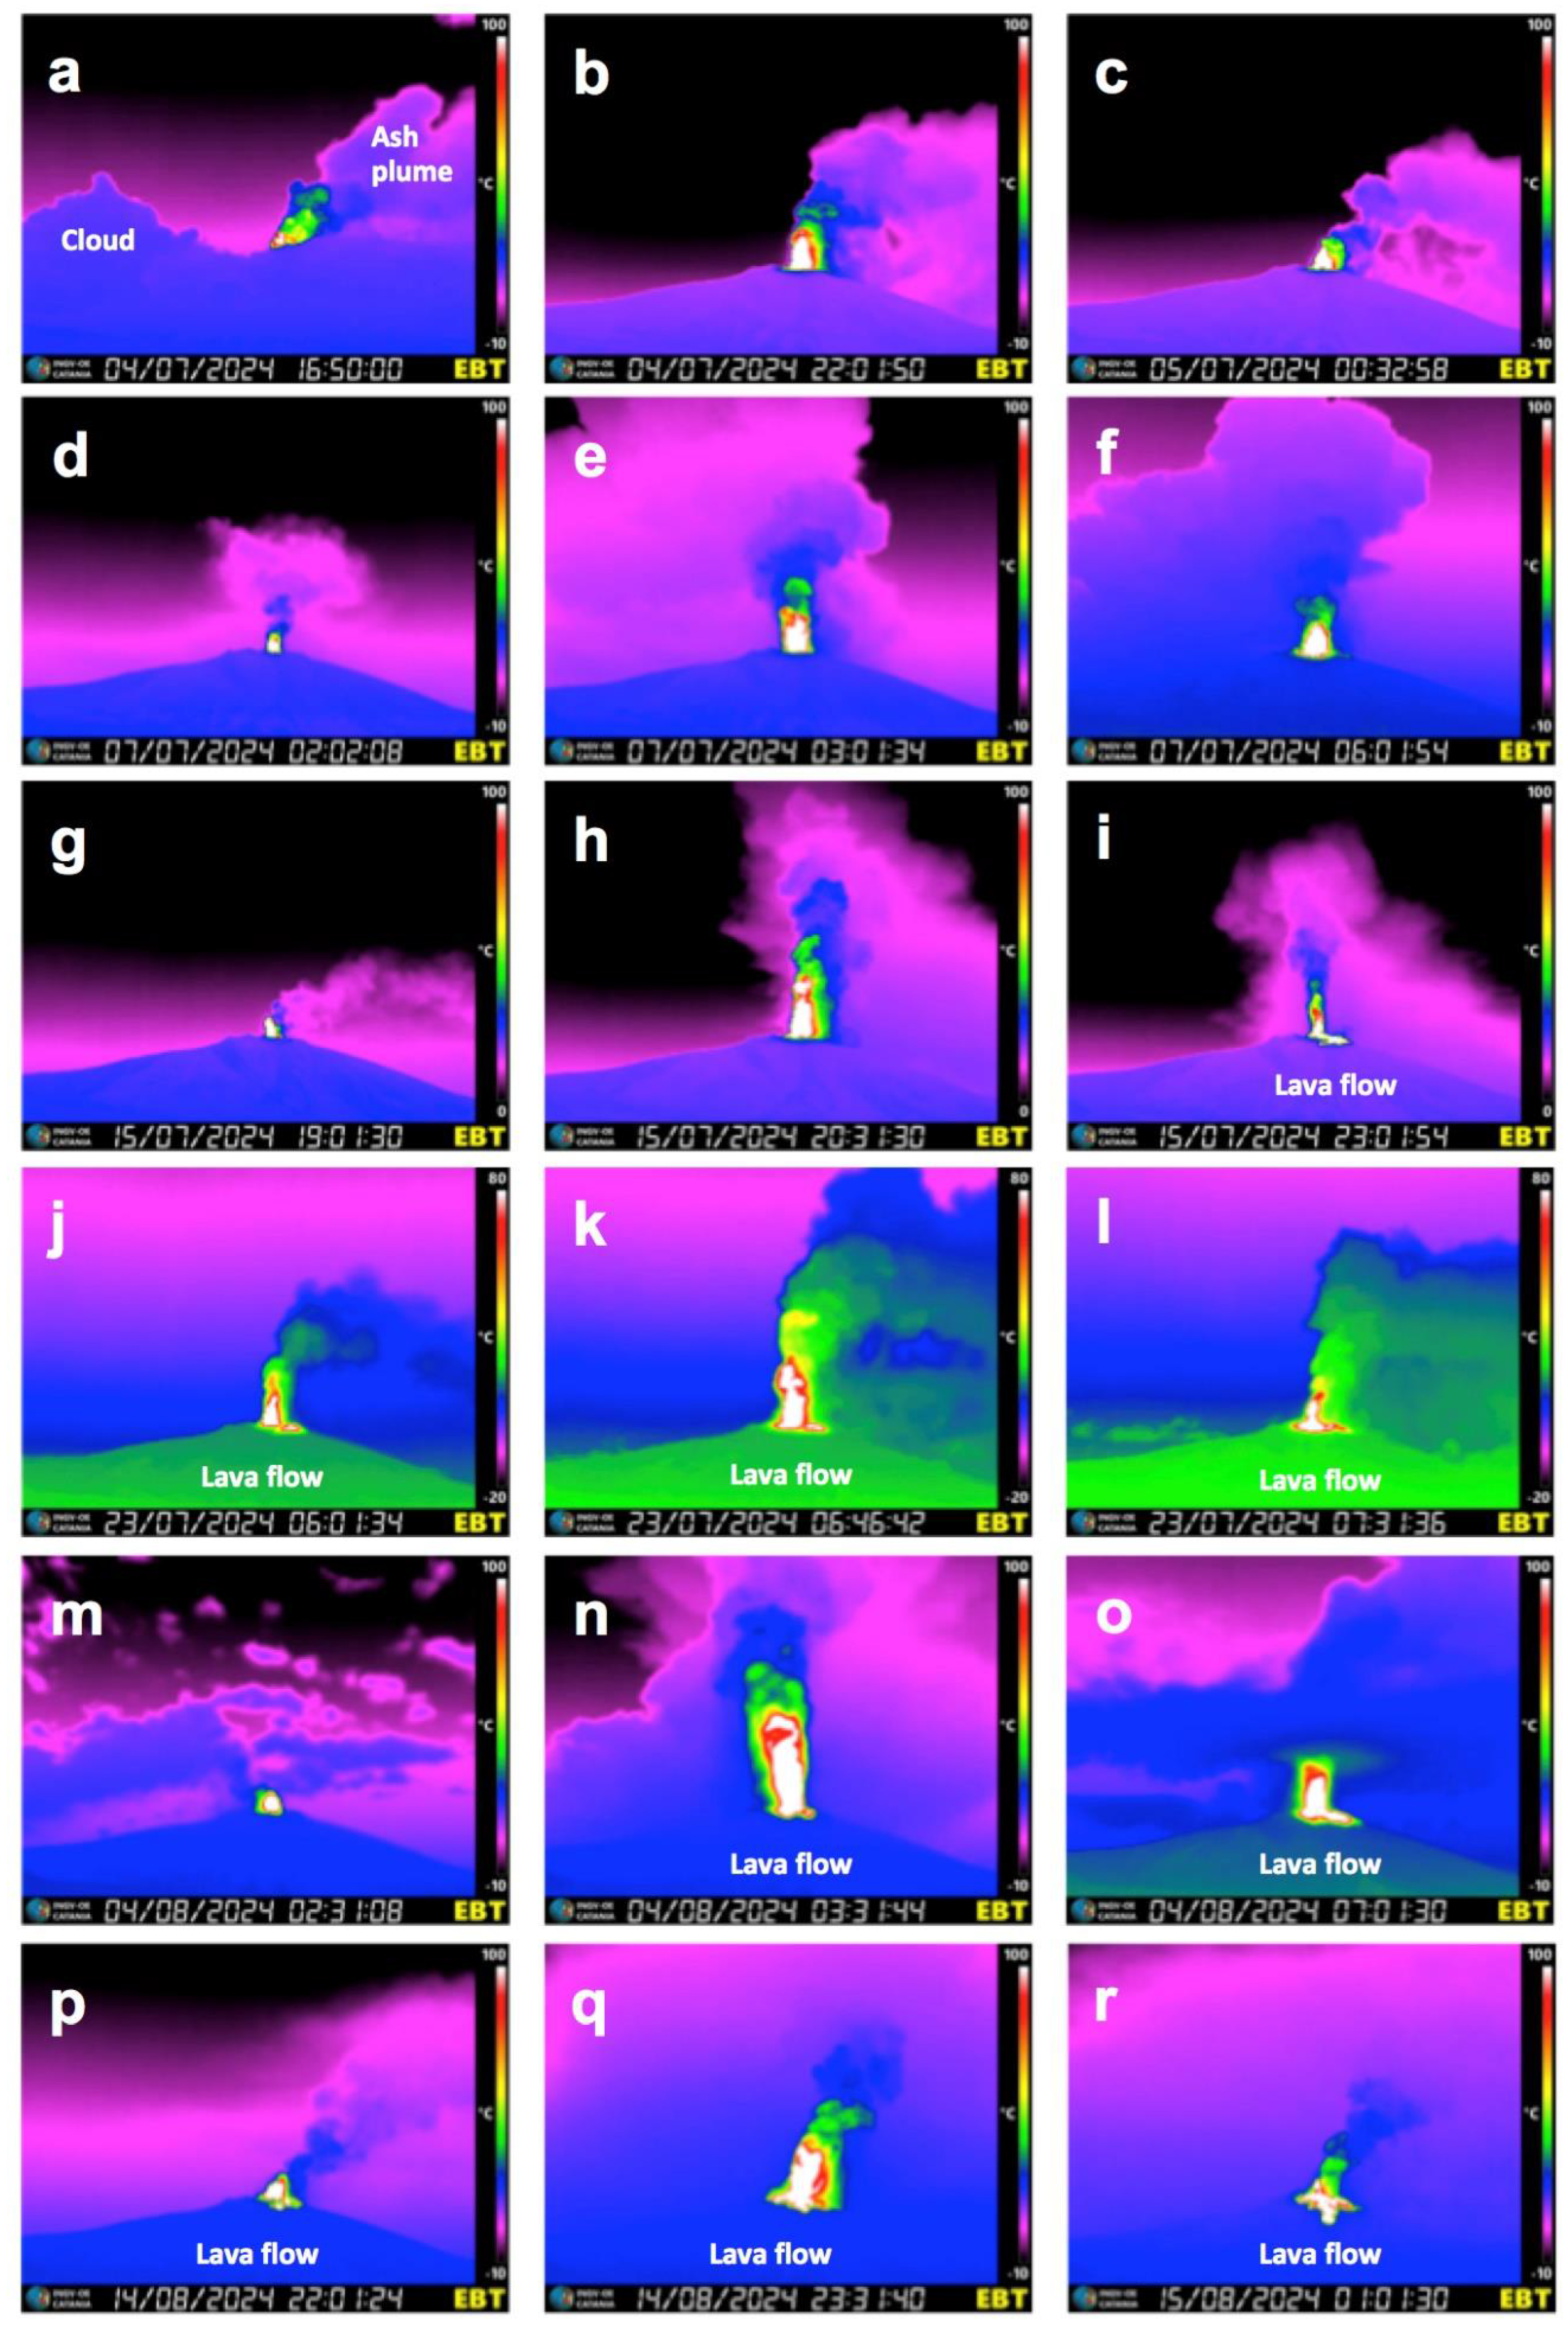
Figure 9.
Duration, volume, maximum height and time-averaged discharge rate versus time for the six lava fountain episodes.
Figure 9.
Duration, volume, maximum height and time-averaged discharge rate versus time for the six lava fountain episodes.
Table 1.
List of the features of the EBT thermal camera used in this paper.
Table 1.
List of the features of the EBT thermal camera used in this paper.
| Label |
Type |
Location |
Distance from the craters (km) |
Frame rate |
Field of view |
| EBT |
Thermal FLIR A320 |
Bronte, NW flank
85 m a.s.l. |
13.5 |
2 frames/s |
25° x 18.8° |
| EMCT |
Thermal FLIR A320 |
Mt. Cagliato, east flank
1160 m a.s.l. |
8.3 |
1 frame/s |
320 x 240 pixels |
Table 2.
List of lava fountains parameters obtained from the EBT thermal camera. Max and Mean LF refers to the maximum and average height of the lava fountain measured above the crater rim. Pyro volume refers to the volume of pyroclastic material erupted during the lava fountain phase, and TADR is the time–averaged discharge rate.
Episode
# |
Date
dd/mm/yyyy |
Start
time UTC |
End
time UTC |
Duration
minutes |
Max LF
(m) |
Mean LF
(m) |
Pyro Volume
(Mm3) |
TADR
(m3s-1) |
| 1 |
04/07/2024 |
16:50 |
01:21 |
511 |
6258 |
1345 |
5.58 |
182 |
| 2 |
07/07/2024 |
01:54 |
07:23 |
329 |
2677 |
1278 |
3.86 |
195 |
| 3 |
15/07/2024 |
18:24 |
00:17 |
353 |
2753 |
1095 |
3.74 |
177 |
| 4 |
23/07/2024 |
05:43 |
08:00 |
137 |
4524 |
1567 |
1.92 |
209 |
| 5 |
04/08/2024 |
02:19 |
08:12 |
353 |
5291 |
2242 |
5.10 |
251 |
| 6 |
14/08/2024 |
21:33 |
01:49 |
256 |
3910 |
1228 |
2.80 |
186 |
Table 3.
Comparison between the start and stop timing of the 6 lava fountaining episodes here described and obtained by our routine from the images of the EBT thermal camera, and the timing defined by INGV-OE* on the basis of the seismic and infrasound signals. Timing in UTC, duration in minutes. Volumes are in Mm3. N.A. = Not available. The lava volume of 07/07/2024 refers to the cumulate of the first two paroxysmal episodes. Lava volume (INGV-OE*) are obtained from satellite.
| Episode # |
Date |
Start
EBT |
Start INGV-OE* |
Stop EBT |
Stop
INGV-OE* |
Volume of pyro
EBT |
Duration
EBT |
Duration
INGV-OE* |
Lava Volume INGV-OE* |
| 1 |
04/07/2024 |
16:50 |
16:15a
|
01:21 |
01:50 a
|
5.58 |
511 |
575 |
N.A. |
| 2 |
07/07/2024 |
01:54 |
02:00 |
07:23 |
08:00 |
3.86 |
329 |
360 |
1.10a
|
| 3 |
15/07/2024 |
18:24 |
17:42 |
00:17 |
23:40 |
3.74 |
353 |
358 |
0.41b
|
| 4 |
23/07/2024 |
05:43 |
02:08 |
08:00 |
08:15 |
1.92 |
137 |
367 |
0.50 c
|
| 5 |
04/08/2024 |
02:19 |
02:30 |
08:12 |
07:10 |
5.10 |
353 |
280 |
0.45d
|
| 6 |
14/08/2024 |
21:33 |
22:30 |
01:49 |
01:20 |
2.80 |
256 |
170 |
0.40e
|
