1. Introduction
Biochar filtration systems are designed with bio-materials, mostly biowastes such as coconut coir, corn cobs, corn husks and rice husk in the environment as an adsorbent to remove pollutants from wastewater [
1]. The use of wastewater for irrigation supplements rain-fed agriculture especially in urban and peri-urban areas. Thus, treatment of wastewater before use is indispensable to reduce public health risks associated with eating vegetables irrigated with wastewater. Filtration systems are low-tech, low-cost well-suited systems for reducing organic load, pathogens and heavy metals in wastewater. Re-purposing biowastes and wastewater are key to achieving a circular economy [
2].
Wastewater treatments methods include precipitation, ion exchange, and adsorption [
3]. Precipitation involves the removal of contaminants from wastewater by causing them to transforming them into insoluble solid particles [
4]. Ion exchange improves wastewater quality by replacing contaminant ions with non-objectionable ones [
5] and adsorption causes substances to adhere to materials particularly on solids [
6]. Filtration systems reduce pollutant load by sieving and having contaminants settle on the media.
The focus of this study is to test the efficiency of coconut coir biochar filtration systems by examining design parameters such as bed thickness, effective size, optimal hydraulic retention time (HRT) and the cleaning mechanism. Unlike slow sand filtration systems, the design characteristics of biochar filtration systems have not been fully explored and well documented. Therefore, this study seeks to investigate some key operational parameters of the system that enhance the quality of wastewater [
7].
Biochar is biowaste which has been re-purposed, re-engineered and reused. Biochar technology is particularly advantageous for developing countries due to its multiple environmental and agronomic benefits, which distinguish it from other affordable water treatment methods [
8]. Coconut biochar as an adsorbent, a porous, carbon-rich material, produced by heating biomass, such as wood, crop residues, or animal manure, in a low-oxygen environment by a controlled process called pyrolysis [
9]. It is environmentally friendly as it is biodegradable. It is low-cost, easy to construct and requires minimal maintenance. It has been found to have high adsorption capacity leading to a high removal efficiency for a wide range of contaminants, including heavy metals, organic pollutants, and pathogens. Sachan and Kumar reports that coconut biochar has ahigh adsorption capacity due to its high surface area, microporosity, low ash content which influences its cleaning mechanism in wastewater [
10].
Biochar filtration systems work by allowing water to flow through a bed of biochar, where contaminants are adsorbed onto the surface of the biochar particles. The effectiveness of this process depends on key design parameters like optimal effective size, bed depth, HRT, and cleaning mechanism, which are not well understood. King-Nyamador
et al. and Deepa
et al. argued that the effective size is responsible for porosity and permeability of the filter bed while the depth influences the contact time between water and biochar [
11,
12]. The HRT is the amount of time water spends in the filtration system, thus, the longer the HRT, the more time contaminants interact with biochar and get adsorbed, resulting in cleaner water [
13]. Chen
et al. confirms that HRT is a critical factor in determining the efficiency of biochar filtration systems [
14]. Studying HRT and cleaning mechanisms helps to provide more insight into the design of biochar filtration systems by outlining the significant role these design parameters play in improving the overall treatment process. This is significant in the optimization of treatment efficiency, improvement of treatment design, and validation of performance of the biochar filtration systems [
15].
Reusing wastewater after treatment is recommended for irrigation especially in urban areas because it reduces public health risks and reduces reliance of treated water for watering crops. Designing filtration systems from biowastes lead to the reduction of waste output in the environment, reducing methane emission among others [
16].
The cleaning mechanism of biochar filtration systems involve physical chemical and biological processes. The adsorption of contaminants onto the biochar particles is a physical process of attraction between the biochar surface and contaminants. This attraction is due to the chemical characteristics of the biochar, such as its surface chemistry and functional groups. Biochar also provides a surface for microbial growth which removes contaminants through biological processes such as biodegradation and bio-reduction by the formation of the biofilm called Schmutzecke [
11,
17,
18] .
King-Nyamador
et al. investigated bed depth and effective size and how they lead to the improvement in quality of treated wastewater [
11]. This study focuses on determining the optimal HRT for the maximum removal of pollutants and evaluating how the system cleans the water to maintain the effectiveness of the biochar. The design and operation of biochar-based wastewater treatment systems will be significantly impacted by the study’s findings [
6,
7,
8].
The use of coconut biochar filtration systems for water treatment has the potential to generate a cost-effective, environmentally friendly, and efficient solution to the challenges of water pollution and contamination. Additionally, the reduction of waste in the environment makes the use of coconut biochar an effective solid waste management prospect. However, the performance of the system depends on several factors being examined in this study.
2.Method
2.1. Description of Study Site
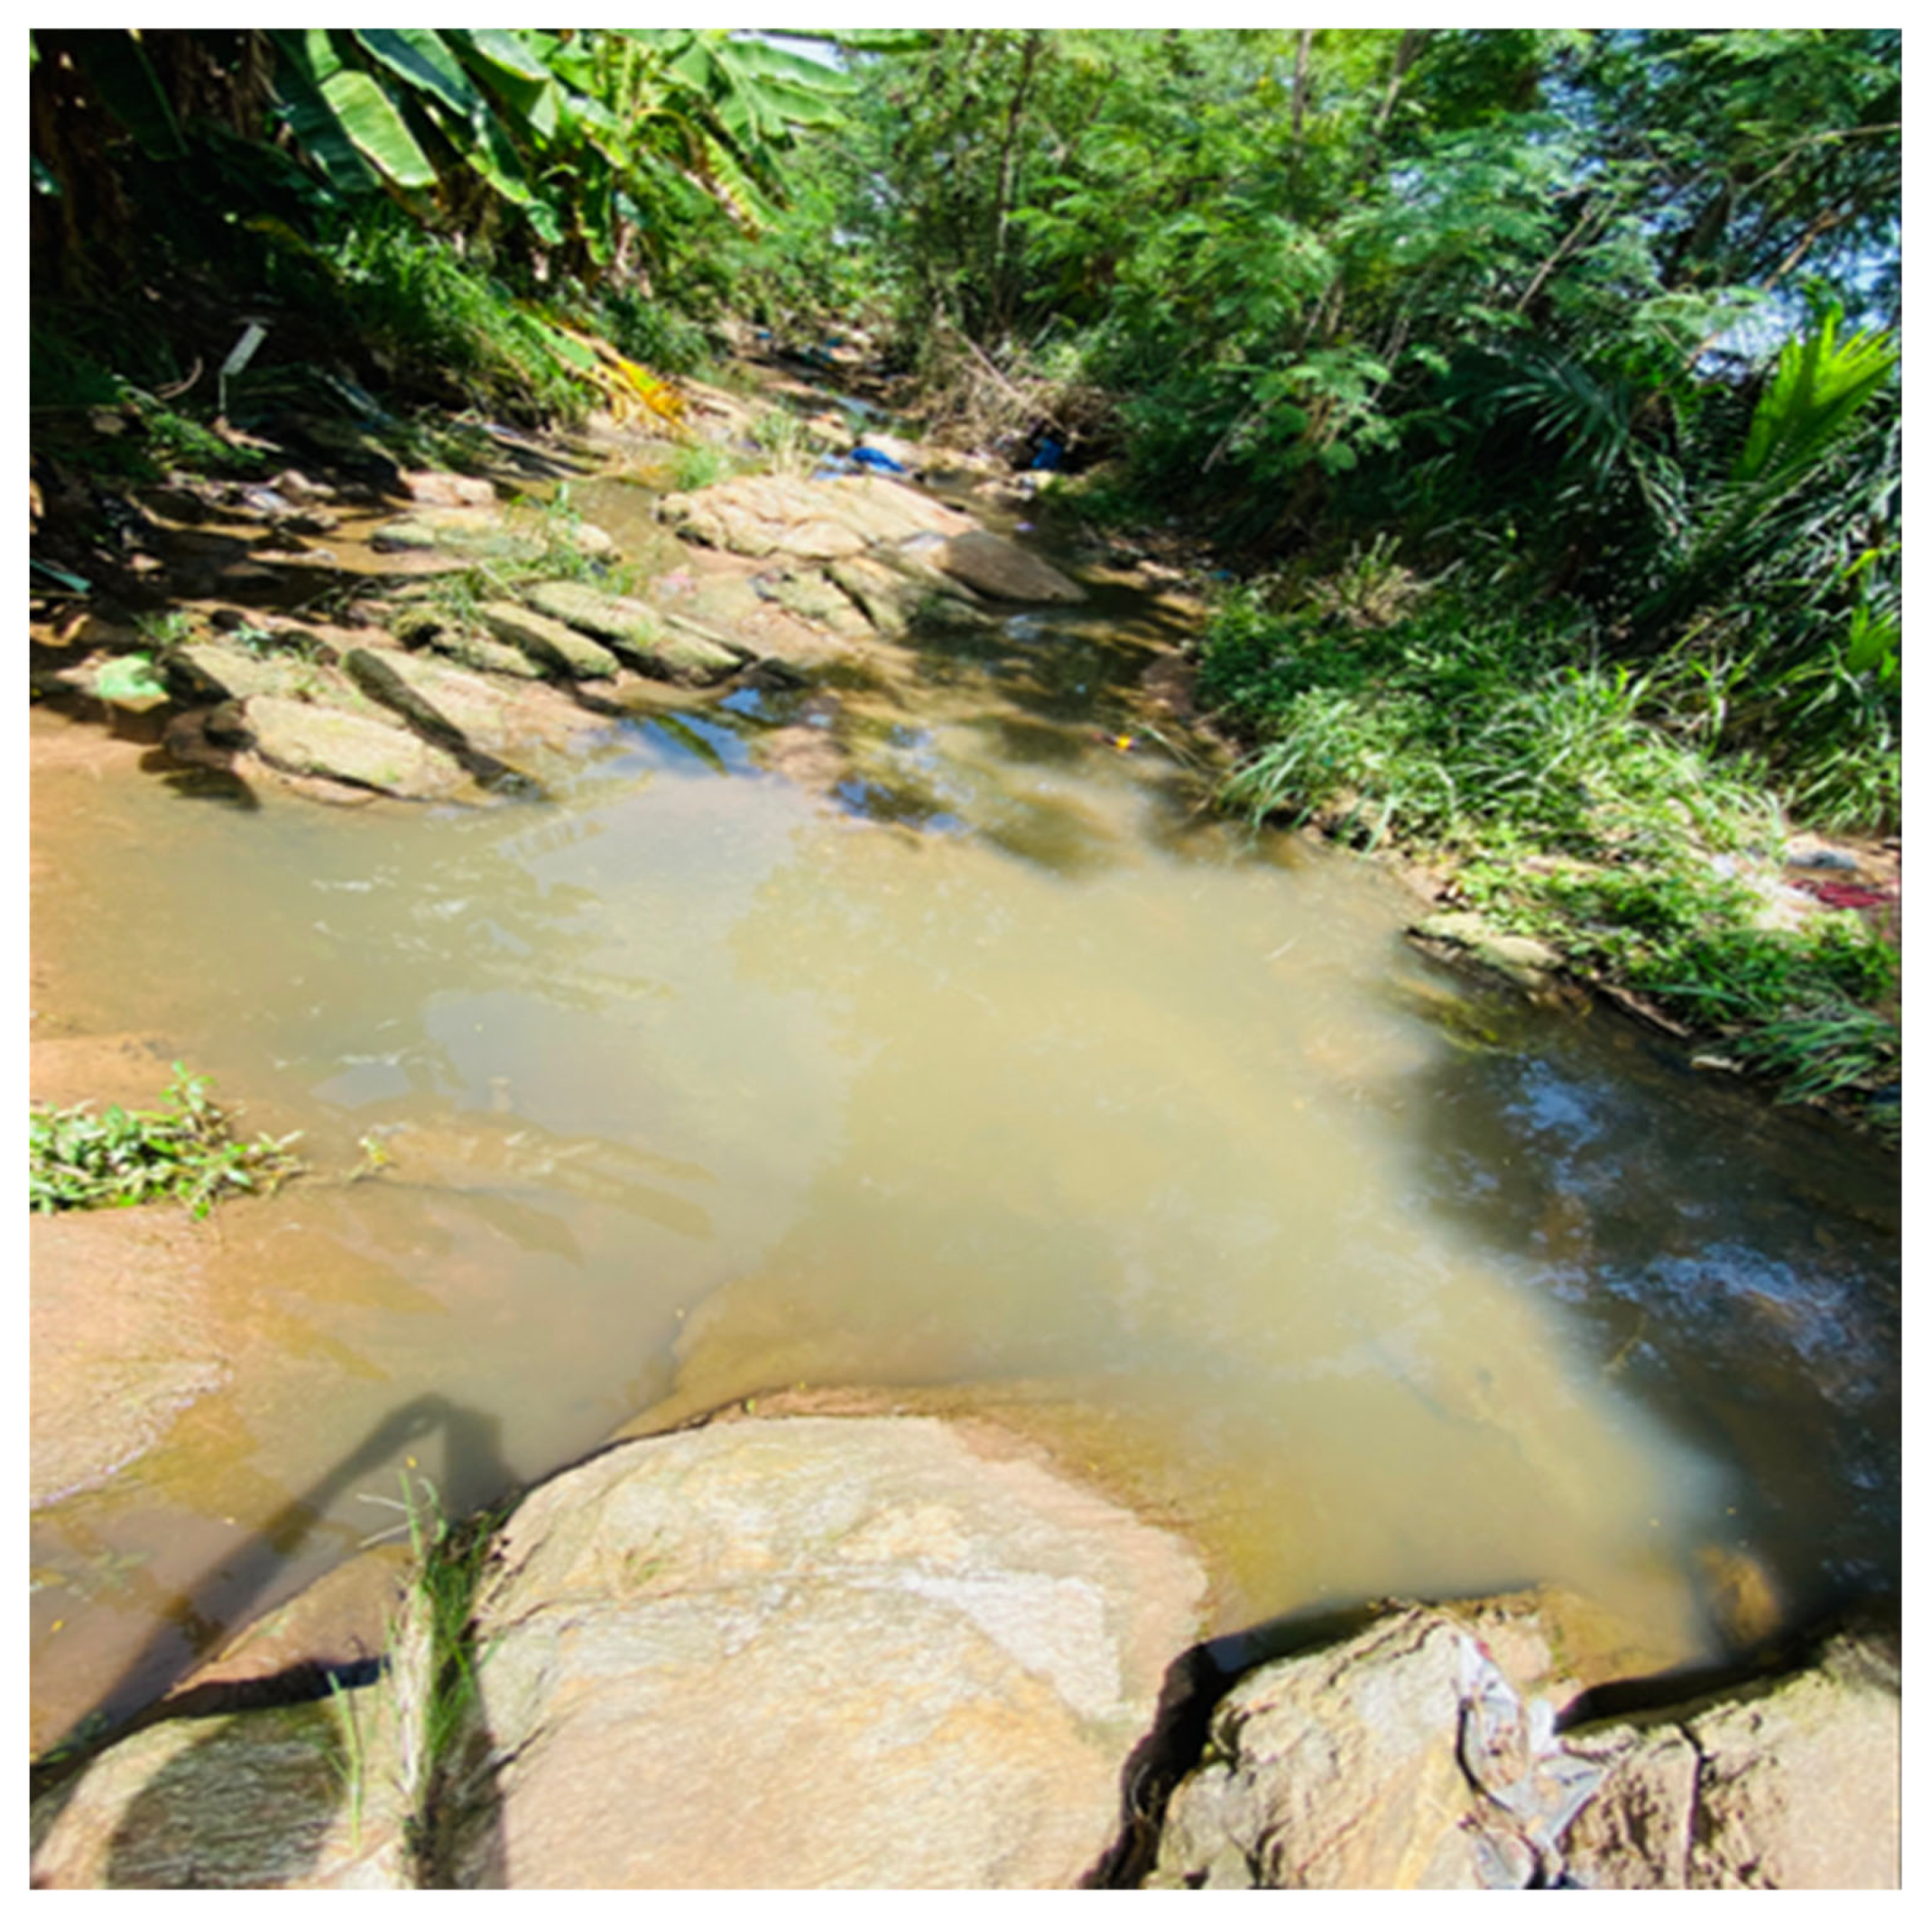
Wastewater was taken from a drainage around Okponglo, near Nii-Kwablah Ashong Avenue in the Greater Accra region of Ghana. Residents engage in small-scale farming in this area, cultivating crops such as cabbage, okra, lettuce and tomatoes. The primary source of water for irrigation is from the drain (
Figure 1).
2.2. Materials and Experimental Setup
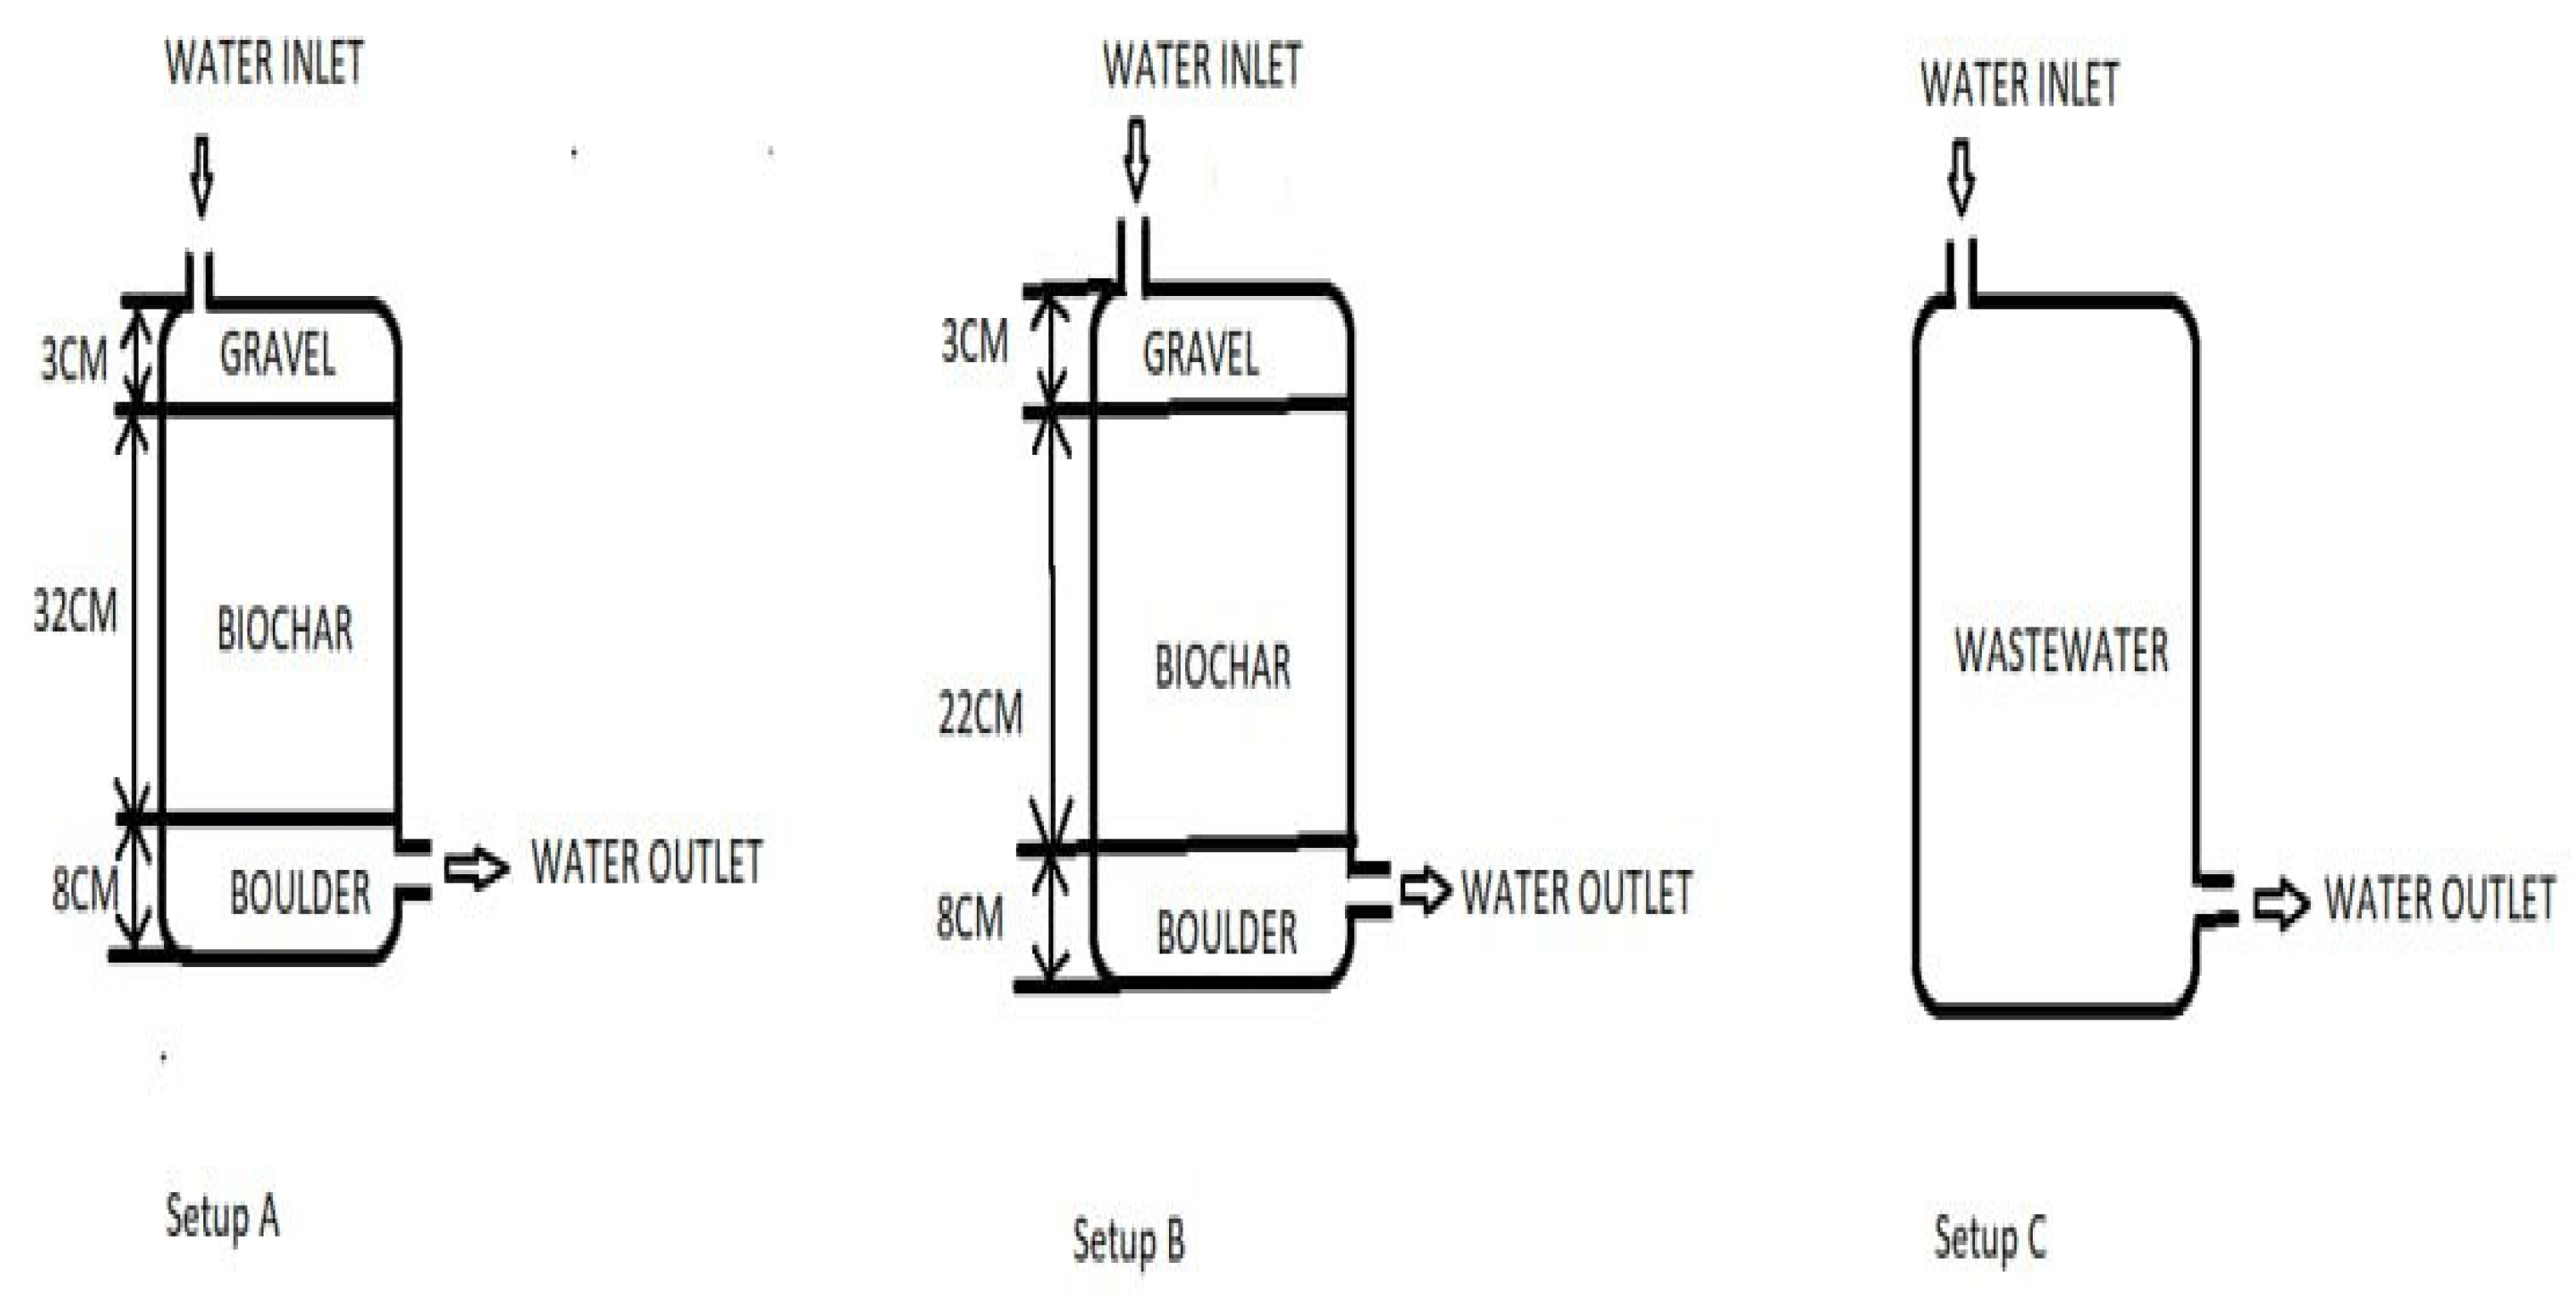
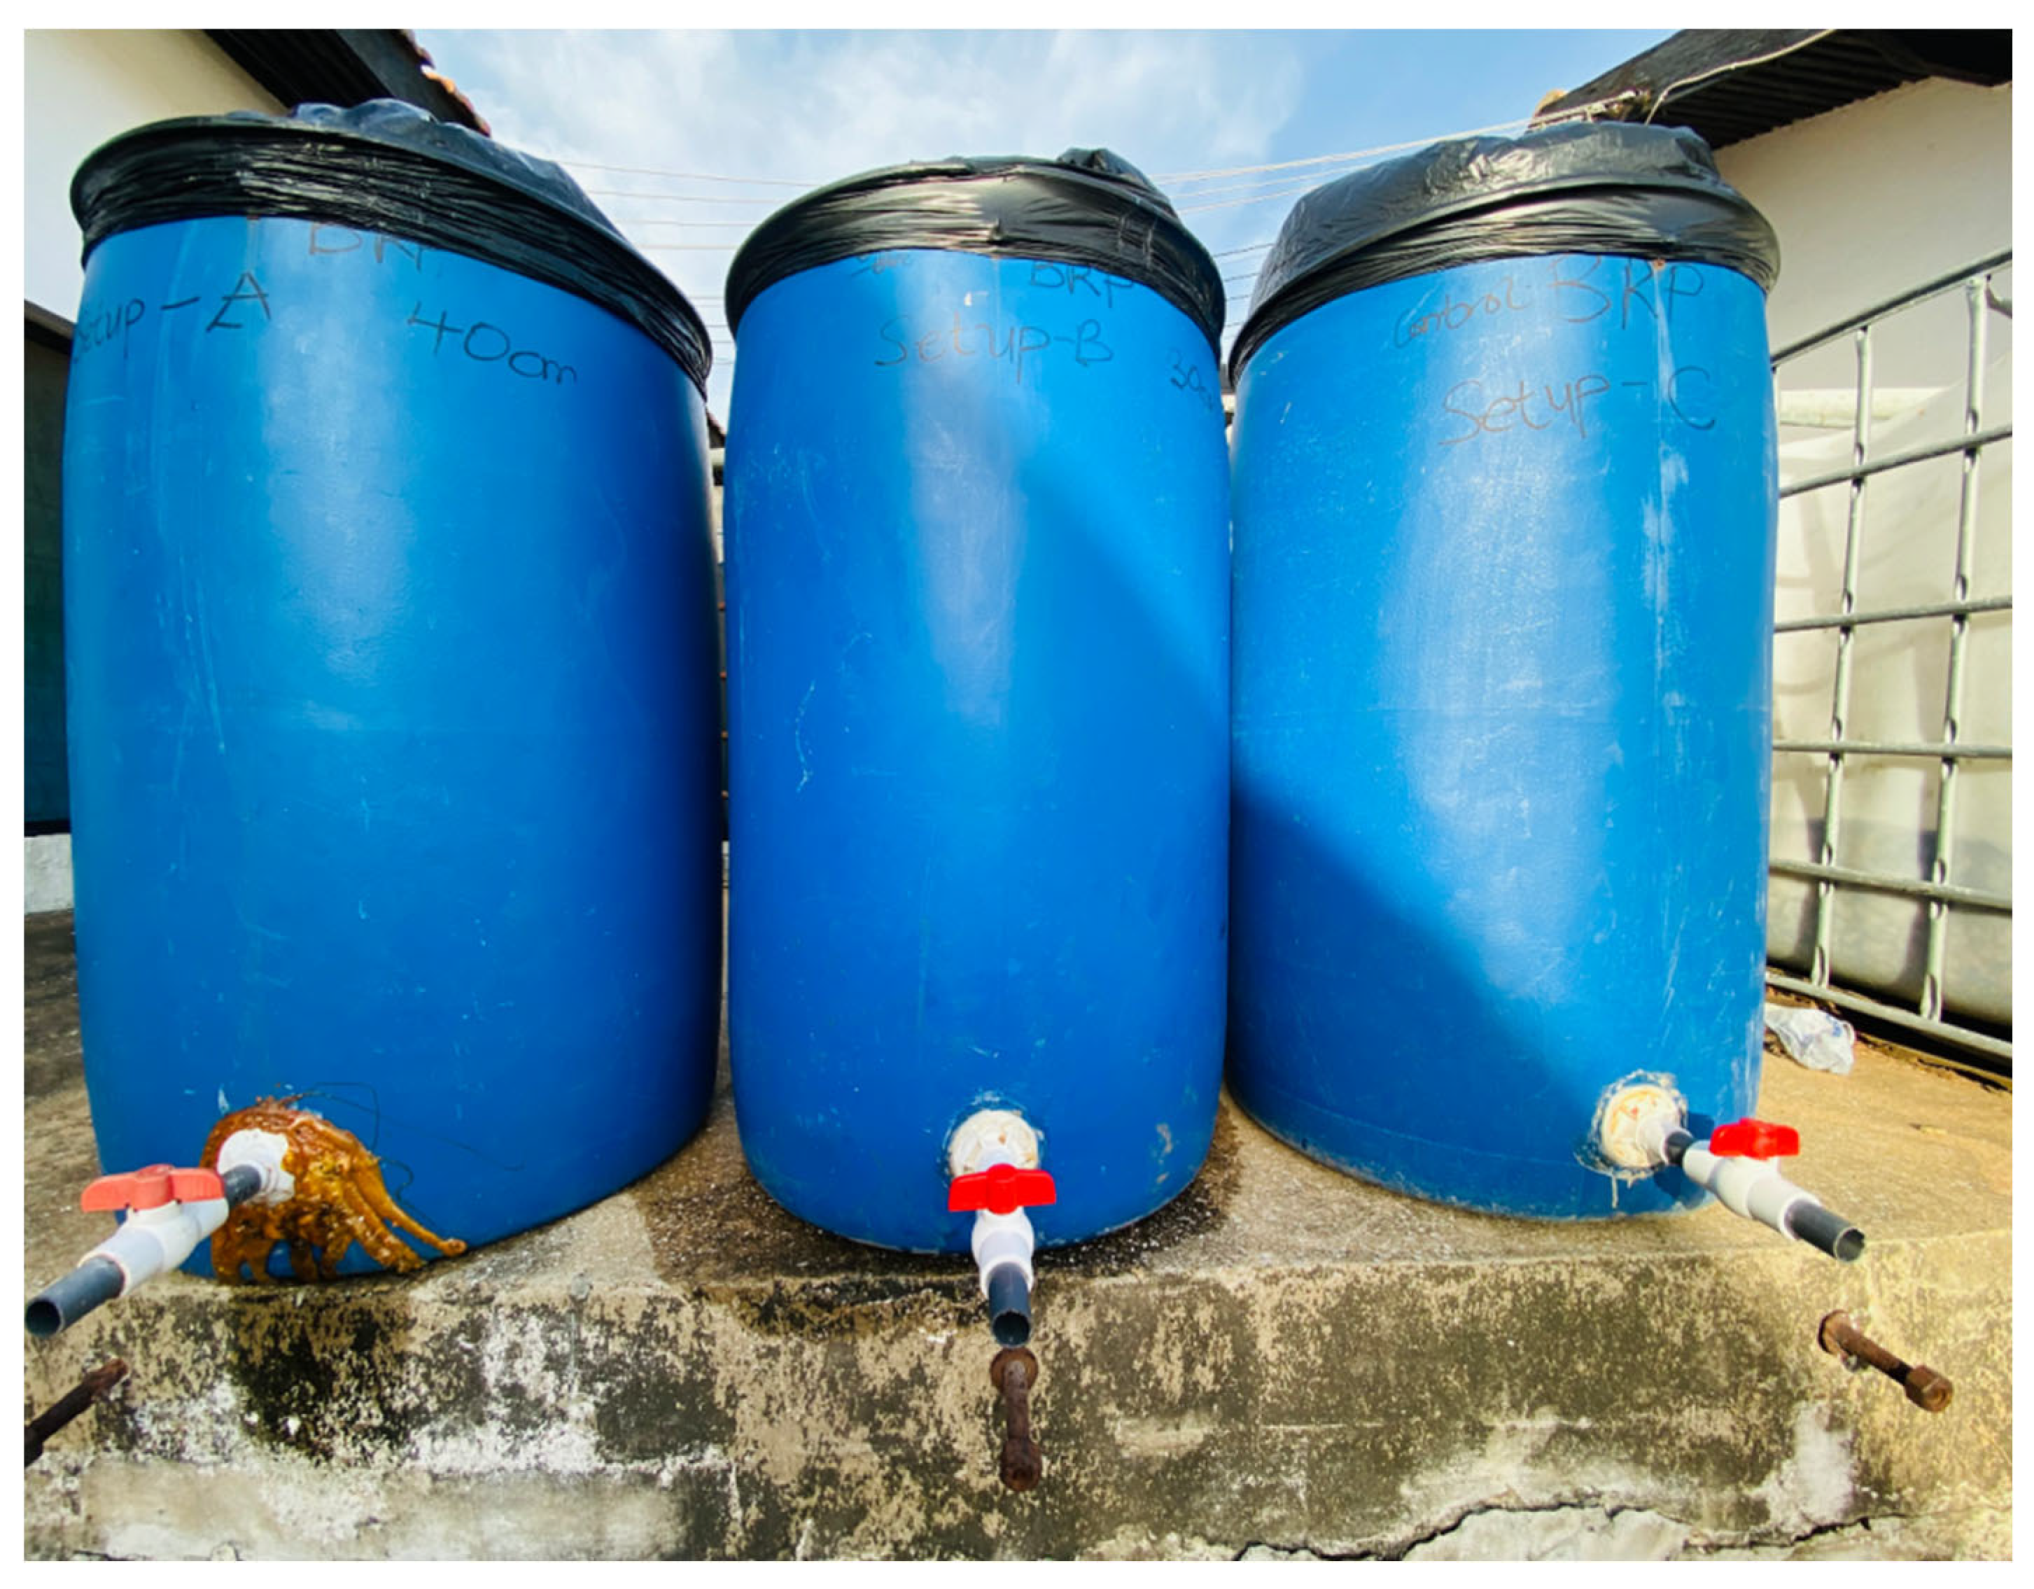
The experimental setup was conducted at the Agricultural Engineering workshop using three identical barrels labelled A, B, and C. Barrels had a height of 91 cm, diameter of 53 cm and a volume of 200 L. Setup A had a 40 cm layer of biochar beneath a 10 cm layer of gravel, while Setup B (
Figure 2 and
Figure 3) had a 30 cm layer of biochar below a 10 cm layer of gravel. Setup C served as the control experiment with no biochar or gravel.
Setup A (
Figure 2 and
Figure 3) has an 8 cm layer biochar with an average diameter of 21.2 cm at the bottom, and a 32 cm layer with an average diameter of 5.24 cm above. Setup B followed a similar arrangement. The tap at the base of all three barrels facilitated water sampling for testing and for controlling effluent flow rate.
2.3. Preparation of adsorbent
Coconut coir was procured and dried for approximately six weeks at the Agricultural Engineering workshop. They were sorted into two distinct sizes of average diameters, 21 cm and 5 cm. Representative samples were measured accurately using a thread and a meter rule.
Biochar preparation involved pyrolysis of coconut coir at the Engineering school. A controlled temperature of 405℃ was maintained for 2 to 3 hours. After cooling, biochar was packed into sacks for transportation.
2.4. Filtration Process
Water from the study area was transported to the Agricultural Engineering workshop. Setups A and B were filled until the water was above the gravel layer; Setup C served as the control. Water samples were collected after 24 hours, 48 hours, and 1 week and sent to the Ecology laboratory at University of Ghana for testing.
2.5. Characterization of Biochar Sample
In order to understand the cleaning mechanism of wastewater, the chemical and physical characterization of biochar was conducted using Transform Infrared Spectroscopy (FTIR) and Scanning Electron Microscopy (SEM) analysis respectively. Biochar samples were pulverised, and FTIR (Alpha II Spectrometer) was used at the School of Engineering Sciences, University of Ghana to identify the functional groups. Subsequently, biochar samples were also prepared and analysed at the Earth Science Department of the University of Ghana using SEM (PhenomTM ProX Desktop).
2.6. Determination of Hydraulic Retention Time
The hydraulic retention time for the coconut coir filtration system involved setting up the system, adjusting flow rates with a tap, and measuring the time to fill 500 ml bottles. This was done for Setups A, B, and C at intervals of 24, 48, and 168 hours. HRT for Setups A and B was determined using flow rates and filter bed volume.
2.7. Statistical Method
To measure significant differences in the percentage removal of pollutants from wastewater, a one-way Analysis of Variance (ANOVA) was employed at significance level (α) of 0.05. The null hypothesis for the wastewater quality analysis is in two parts–there is no significant difference among the percentage removal of setups A, B and C which have bed depths of 30 cm and 40 cm respectively. The second is there is no significant difference among the percentage removal at HRTs of 24, 48 and 168 hours. As with all ANOVA tests, the null hypothesis is rejected if Fcalculated > Fcritical else we fail to reject (or accept). With respect to p-values, the null hypothesis is rejected if p-value<alpha=0.05 for the test to be statistically significant.
3. Results and Discussion
3.1. Wastewater Quality Analysis
The results of water quality analysis of heavy metals and biological contaminants, the physical and chemical characterisation of biochar and the statistical analysis of the efficiency of the biochar filtration system are presented in this section.
Table 1 gives the results of the analysis of heavy metals in the wastewater before and after treatment. There was significant reduction in the heavy metal concentration even though the influent levels were lower than the FAO (2004) limits for irrigation. With varying HRTs, all setups consistently showed high removal efficiencies of 92% for Pb and 100% for Cu. HRT of one week resulted in nearly 100% removal.
Unlike slow sand filtration systems, the influence of bed thickness in biochar filtration systems was quite inconsistent in this experiment as Setup A which is 40 cm was expected to have higher removal efficiency than setup A after 24 and 168 hours but improved after 48 hours. In a slow sand filtration system tested in the [
11] study, a 40 cm filter bed performed better in all than the 30 cm one which leaves room for more studies on biochar filtration systems. The control experiment showed a consistent reduction in contaminant levels with increasing HRT. This means that the heavy metals considered breaks down or precipitates in wastewater when allowed to settle or exposed to open air.
Similarly, for biological contaminants removal, total coliform concentration consistently reduced with increasing HRT in all setups even though the effluent quality exceeds FAO (2004) limits. It is clear from the results that the 30 cm bed had a better removal efficiency compared to the 40 cm bed even with increasing HRT. E-coli removal on the other hand is highly inconsistent, increasing in all setups except after HRT of 168 hours where there was a minimal reduction. The concentration of E-coli in effluent was higher than the FAO limits implying that coconut biochar can only improve wastewater after about a week. As with the heavy metal removal, Setup B still performs unexpectedly better than setup A.
A summary of the removal efficiency of both heavy metals and biological contaminants are presented in
Table 2. As explained earlier, Setup B which has a bed thickness of 30 cm performed better than setup A of 40 cm in the removal of all contaminants tested.
The results show that for the coconut biochar filtration system, HRT has a great influence on the treatment efficiency. The study is however not conclusive on bed thickness as a higher bed thickness did not perform better. In study [
11], 40 cm minimum bed depth is adequate for contaminant removal in the slow sand filtration system. The inconsistency of biochar bed thickness in biochar filtration system leaves room for further research. This will be tackled in a continuing study.
The control experiment (setup C) without any filter bed surprisingly improved consistently with increasing HRTs. The decrease in concentration of contaminants in setup C as shown in
Table 1 may be due to sedimentation, adsorption onto the filtration tank and oxidation over wastewater residence time [
11].
3.2. Statistical Analysis
The results of a one-way Analysis of Variance (ANOVA) performed to establish the significance in percentage removal of contaminants of different biochar bed thicknesses (30 cm, 40 cm and the control) and HRT on the effective removal of contaminants from the wastewater is presented in
Table 3.
It can be seen from all setups that p-values for the removal of heavy metals and total coliforms, obtained from the analysis, are lower than the significant level of 0.05. This implies a significant difference in percentage removal of heavy metals among the setups, providing strong evidence to reject the null hypothesis. This suggests that the removal efficiency is affected by the changes in HRT and the bed thickness as heavy metal removal improved with increasing HRT.
With respect to bed thickness,
p-values indicate a significant difference in the removal efficiency suggesting that we reject the null hypothesis, suggesting that heavy metal removal increases with bed thickness though water quality analysis shows otherwise. For biological contaminants,
p-values for total coliform removal with varying HRTs indicates a significant difference in between the two setups and the control. The null hypothesis is also rejected in this case. Consistently, a positive trend in percentage removal is observed with increasing HRT [
19].
On the other hand, E. coli removal for all setups gave higher p-values than the significance level (0.05). This indicates that there is no significant difference in E. coli removal among the setups. Thus, we fail to reject the null hypothesis. The negative average removal percentages (as shown in Table 4), suggest that E. coli removal is not effective. E. coli. removal from biochar treatment systems and the influence of bed thickness in reducing contaminant load will be further studied.
3.3. Cleaning Mechanism
An understanding of the cleaning mechanism of the coconut biochar filtration system was investigated by examining the physical and chemical properties of the biochar that permit adsorption. FTIR and SEM techniques were used to investigate the surface characteristics of biochar. The results are presented and analysed in the next sections.
3.3.1. FTIR Characterization
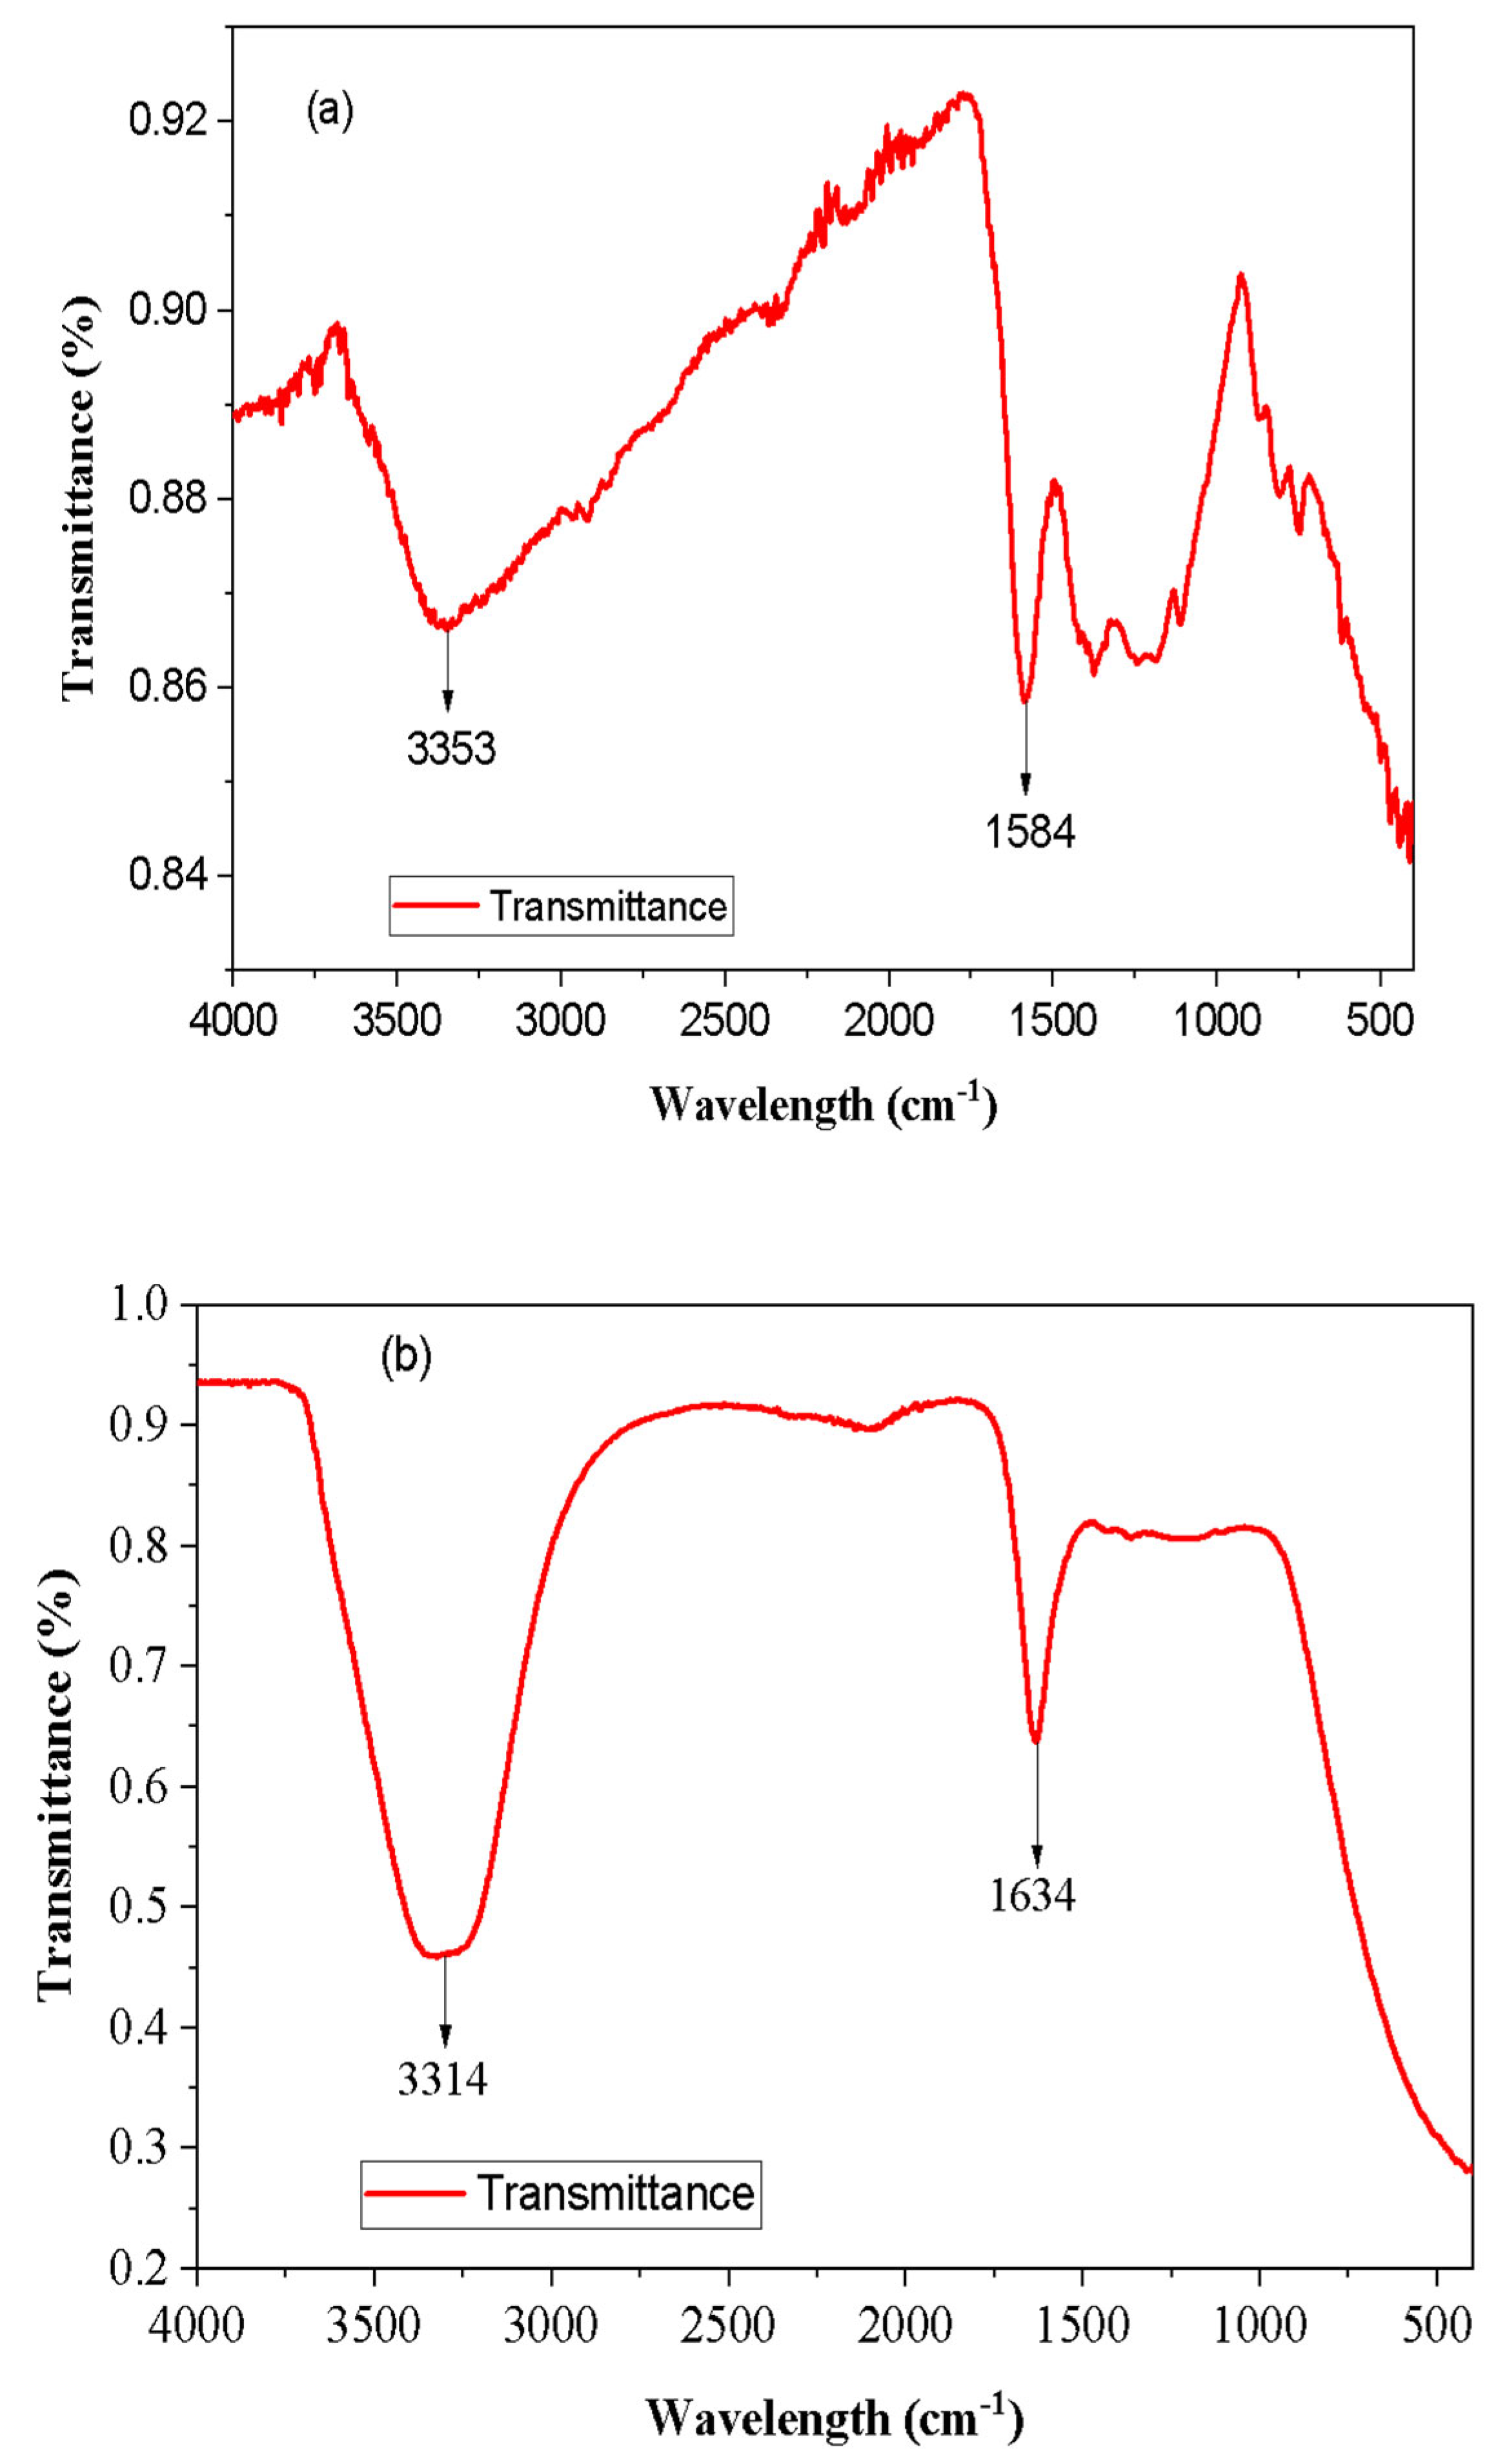
The FTIR results of the coconut biochar sample before and after filtration provided insights into the changes in the functional groups and their potential implications for the cleaning mechanism of the filtration system.
The spectrum of the biochar sample shown in Figure
1 (a) gives characteristic peaks related to specific functional groups. The presence of a peak at 3353 cm
-1 suggests the presence of an O-H stretching vibration, indicating the presence of hydroxyl (-OH) groups. The broad peak indicates hydrogen bonding suggesting interactions between the biochar surface and water molecules and play a role in the adsorption of contaminants [
20]. Similar study conducted on rice husk (RH) and orange peel powder (OPP) by Appiah
et al. for arsenic removal showed a peak at 3400 cm
-1 for RH, representing OH stretching. OPP also exhibited a peak between 3324 cm
-1 and 3365 cm
-1, indicating bonded OH groups [
17]. These findings collectively contribute to a deeper understanding of adsorption processes and molecular interactions in the context of contaminant removal from wastewater.
Another noteworthy peak is observed at 1584 cm
-1, indicating the presence of a C=O stretching vibration. This peak corresponds to beta diketones (enolic) functional groups which are known to exhibit adsorption properties and can capture and remove certain contaminants from the wastewater [
21].
After filtration, the spectrum exhibited similar functional groups as observed in
Figure 4 (b). The presence of the O-H stretching peak (3400 – 3200 cm
-1) suggests that the hydrogen bonding capability of the biochar is retained even after the filtration process. This indicates that the biochar is capable of being used for a long time before being discarded. It also indicates the ability to be used to treat a more heavily polluted water than the sample in this study. The presence of the C=O stretching peak (1640 – 1540 cm
-1) also suggests the persistence of beta diketones (enolic) functional groups and further indicates that the biochar retains its adsorption potential for capturing certain contaminants [
22].
3.4.2. SEM Characterization
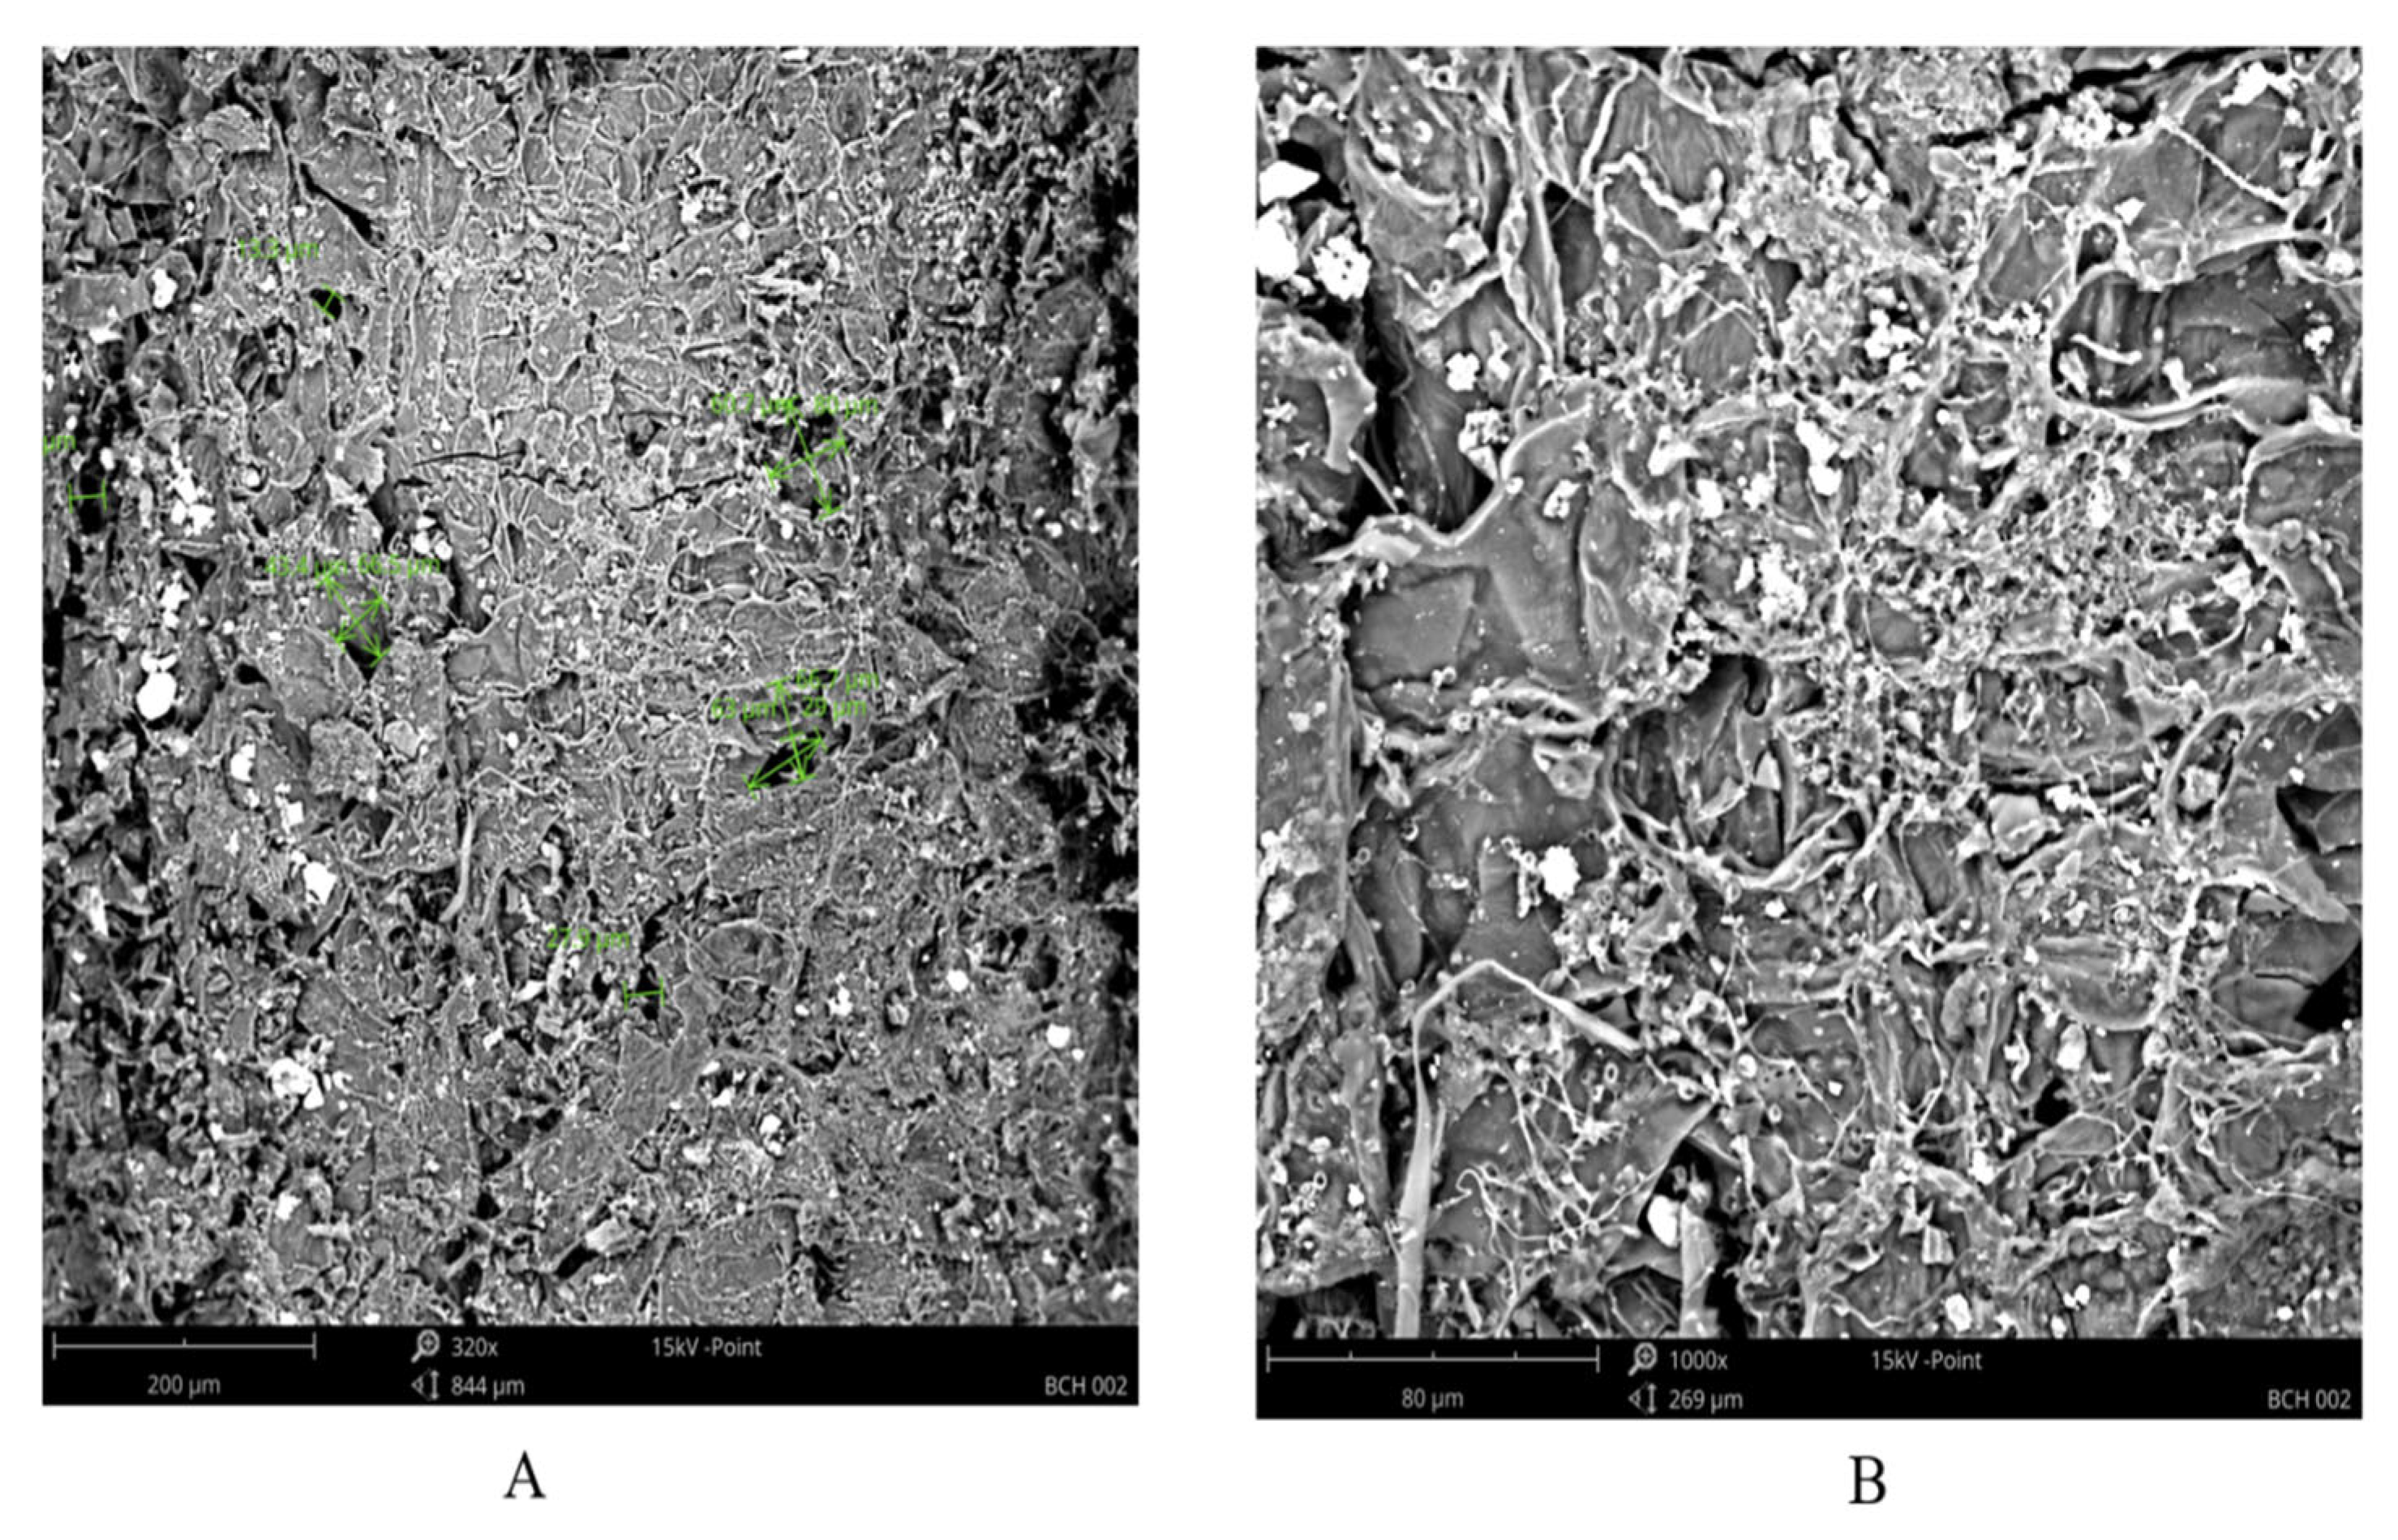
The SEM characterization provided details on the surface characteristics like porosity and topology of the biochar sample as shown by the SEM imaging in
Figure 5 (A & B). The images offer a comprehensive view of the biochar’s surface features, including its roughness, texture, and structural heterogeneity. The topology plays a crucial role in the adsorption process as it shows the available surface area for interaction with contaminants in water. A rougher surface with irregularities and protrusions provide a larger surface area, facilitating adsorption by offering more active sites for attachment and binding of pollutants [
23]. The structural heterogeneity shows structural variations on the surface of the biochar, manifested as cracks, fissures, or unevenness. This contributes to an increased surface area and also altered the flow of contaminants within the biochar material.
Furthermore, the SEM images reveal the characterization and evaluation of pore sizes, pore volume, and pore distribution within the biochar (see Figure
5A). Pores of different size ranges were observed on the surface of the biochar as mesopores (2 – 50 µm) and macropores (greater than 50 µm). The presence of these pores contributes to the increased surface area and consequently, enhances the adsorption capability.Mesopores and macropores may accommodate bulky contaminants, while smaller-sized pores are beneficial for the adsorption of molecules or ions with specific dimensions. Also, the specific pore size distribution can influence the kinetics of adsorption. Pores of varying sizes can facilitate faster or slower diffusion of contaminants into the adsorbent material [
17] .
