Submitted:
29 September 2024
Posted:
30 September 2024
You are already at the latest version
Abstract
Keywords:
1. Introduction
2. Materials and Methods
- Experimental Design 1
- Experimental Design 2
- Raw material dehydration process
- Flavonoids extraction process
- Sample Reception
- Soxhlet
- Cooling
- Rotary evaporator
- Weighing and Storage
- Application of the Soxhlet method
- Rotavaporator
- Lyophilization
- Sample reception
- Ultrafreezing
- Lyophilization
- Storage
- Quantification of total flavonoids by ultraviolet light spectrophotometer
- Reagent Preparation
- Sample in plates
- Quantification of total flavonoids with the Folin-Ciocalteu method
- Sample in plates
- Procedure for Inoculating Saccharomyces cerevisiae in Papa Dextrose Agar (PDA)
- Preparation of Papa Dextrose Agar (PDA)
- Medium Inoculation
- Measurement with the Spectrophotometer
- Cuvette Filling
- Interpretation of Optical Density
- Scales of Measurement
- DNA Extraction
- Preparation for Extraction
- Neutralization and Purification
- Preparation for PCR
- Preparation of Tryptic Soy Agar (TSA)
- Medium Inoculation
- DNA extraction
- Neutralization and Purification
- Preparation for PCR
- Minimum Inhibitory Concentration (MIC) of extracts in fruit juices
3. Results
- Dehydration of Orange peel (Citrus sinensis), Onion peel (Allium cepa), Tamarillo (Solanum betaceum) and Cocoa (Theobroma cacao).
- Orange peel
- Onion peel
- Tamarillo
- Cocoa
- Extraction of flavonoids
- Application of the Soxhlet method
- Loss of soluble solids
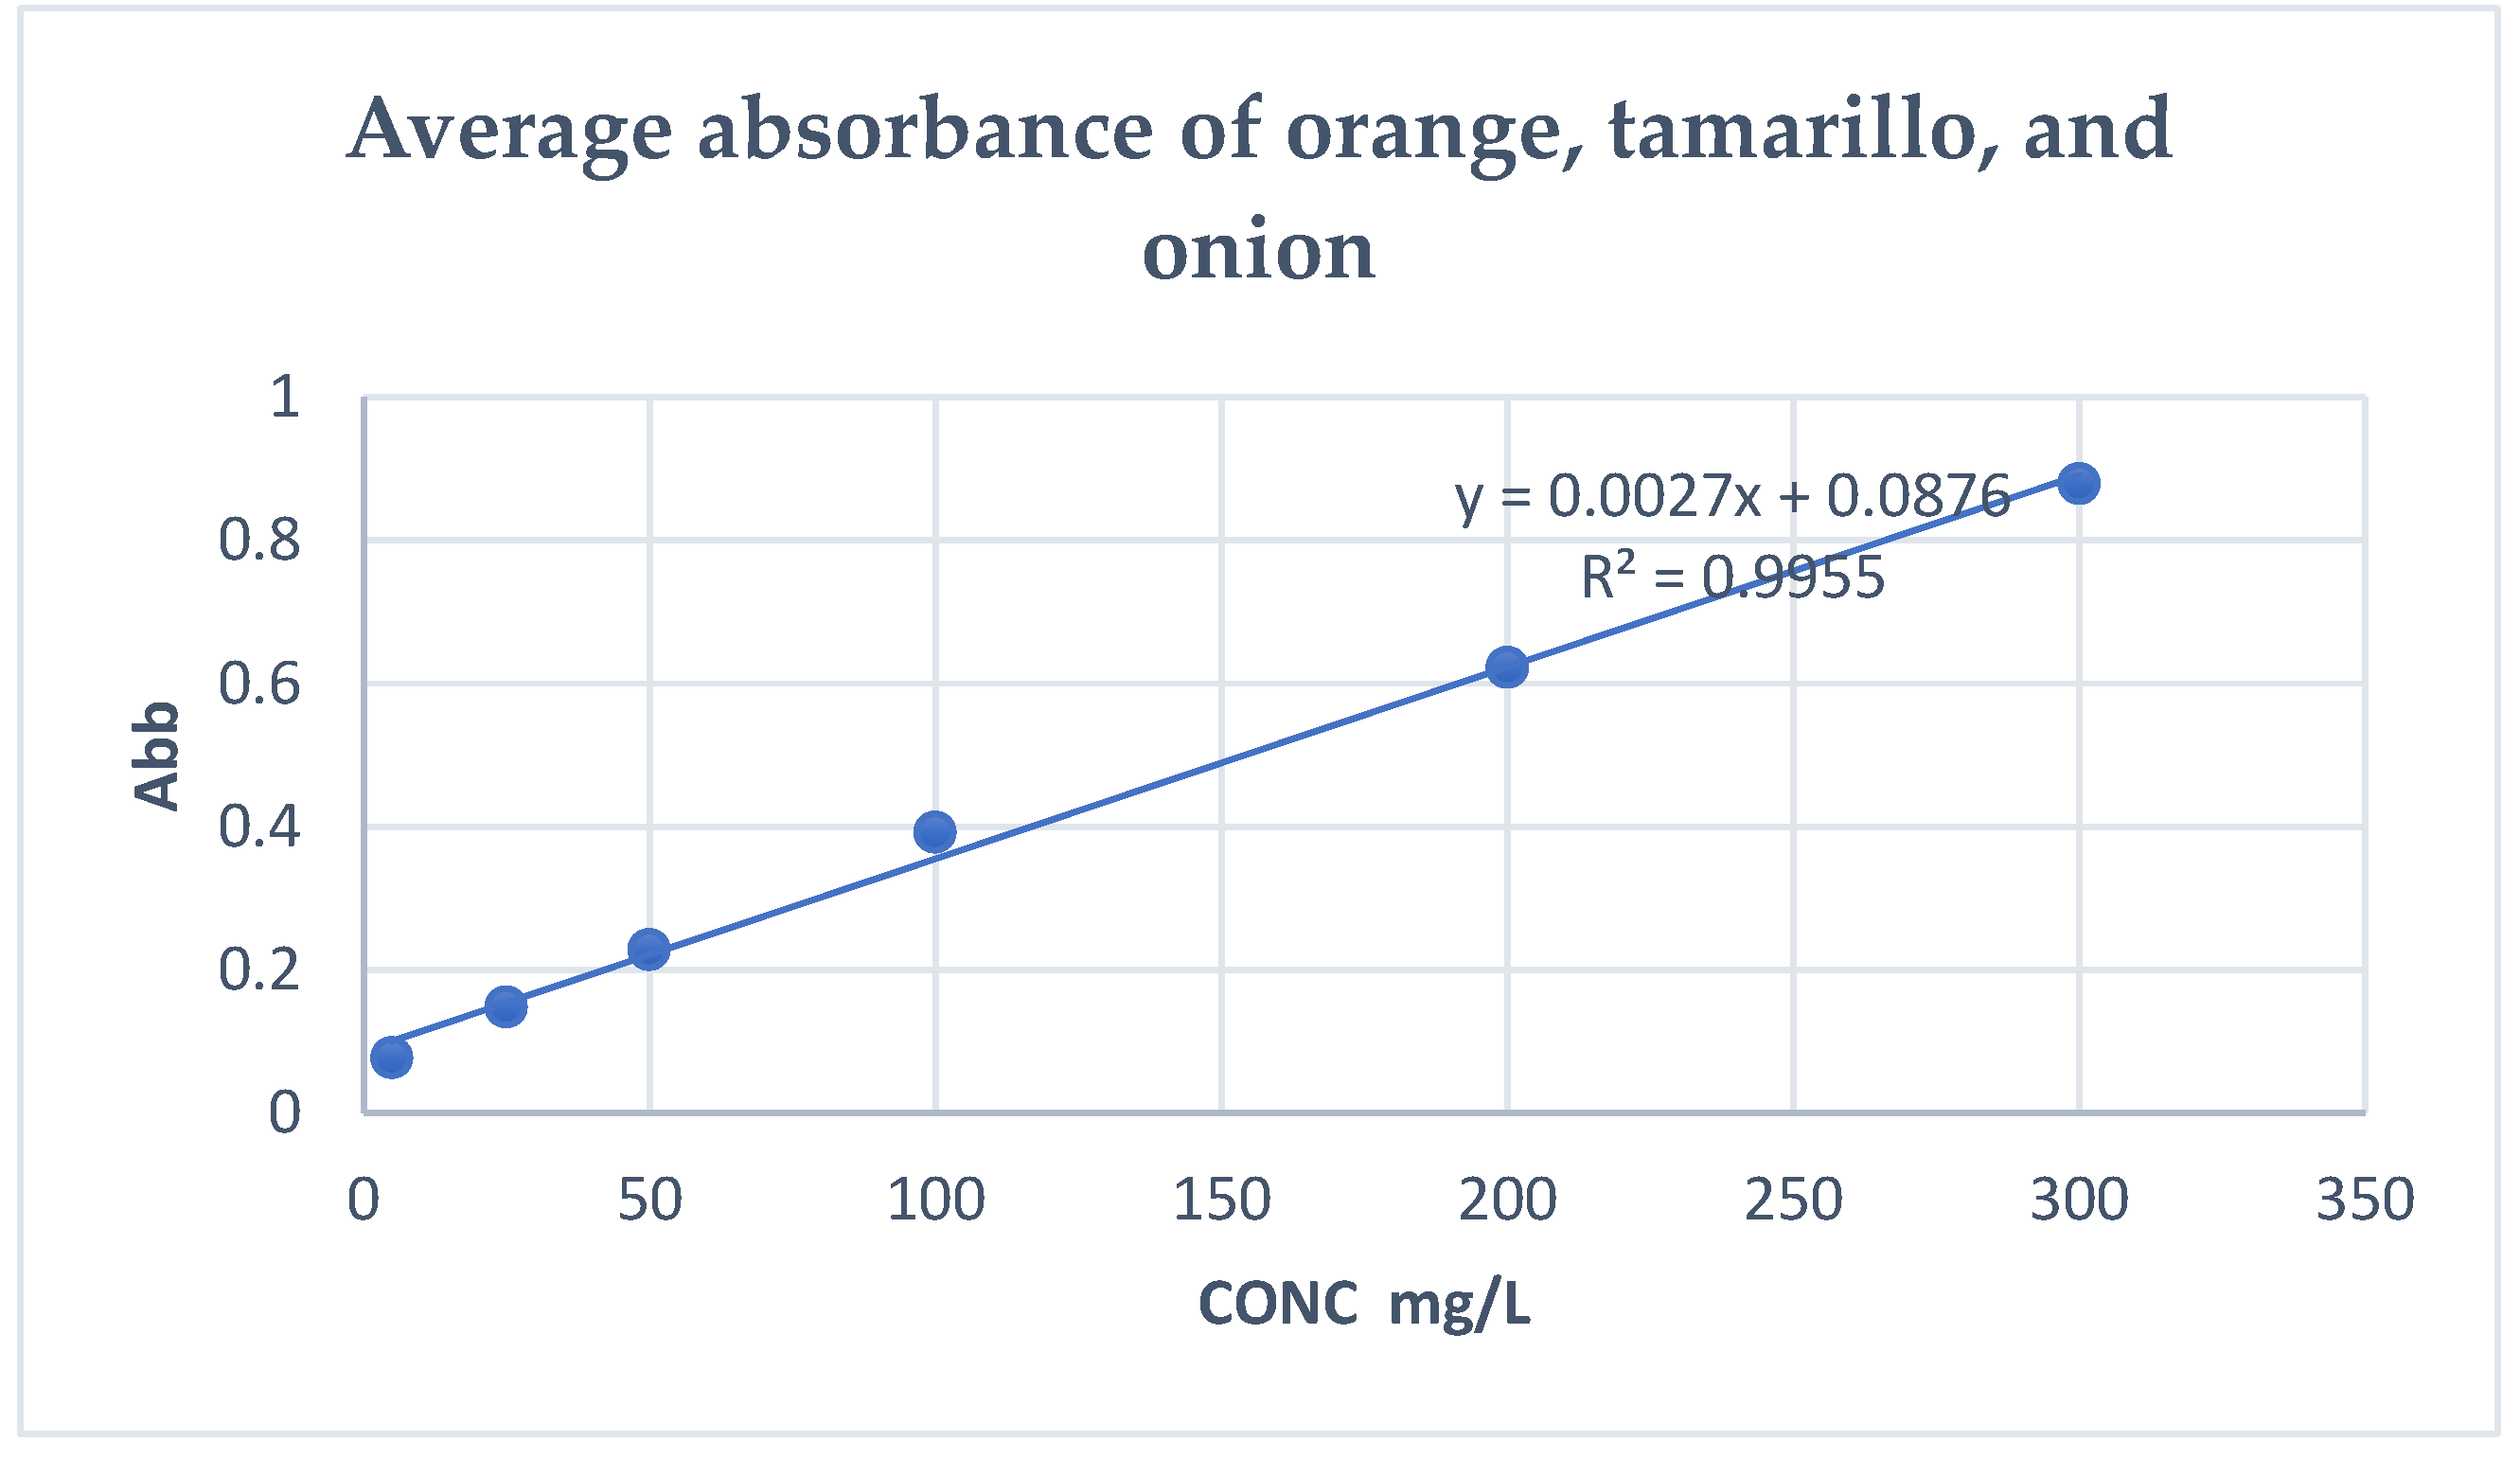
- Quantification of total flavonoids by UV light spectrophotometer
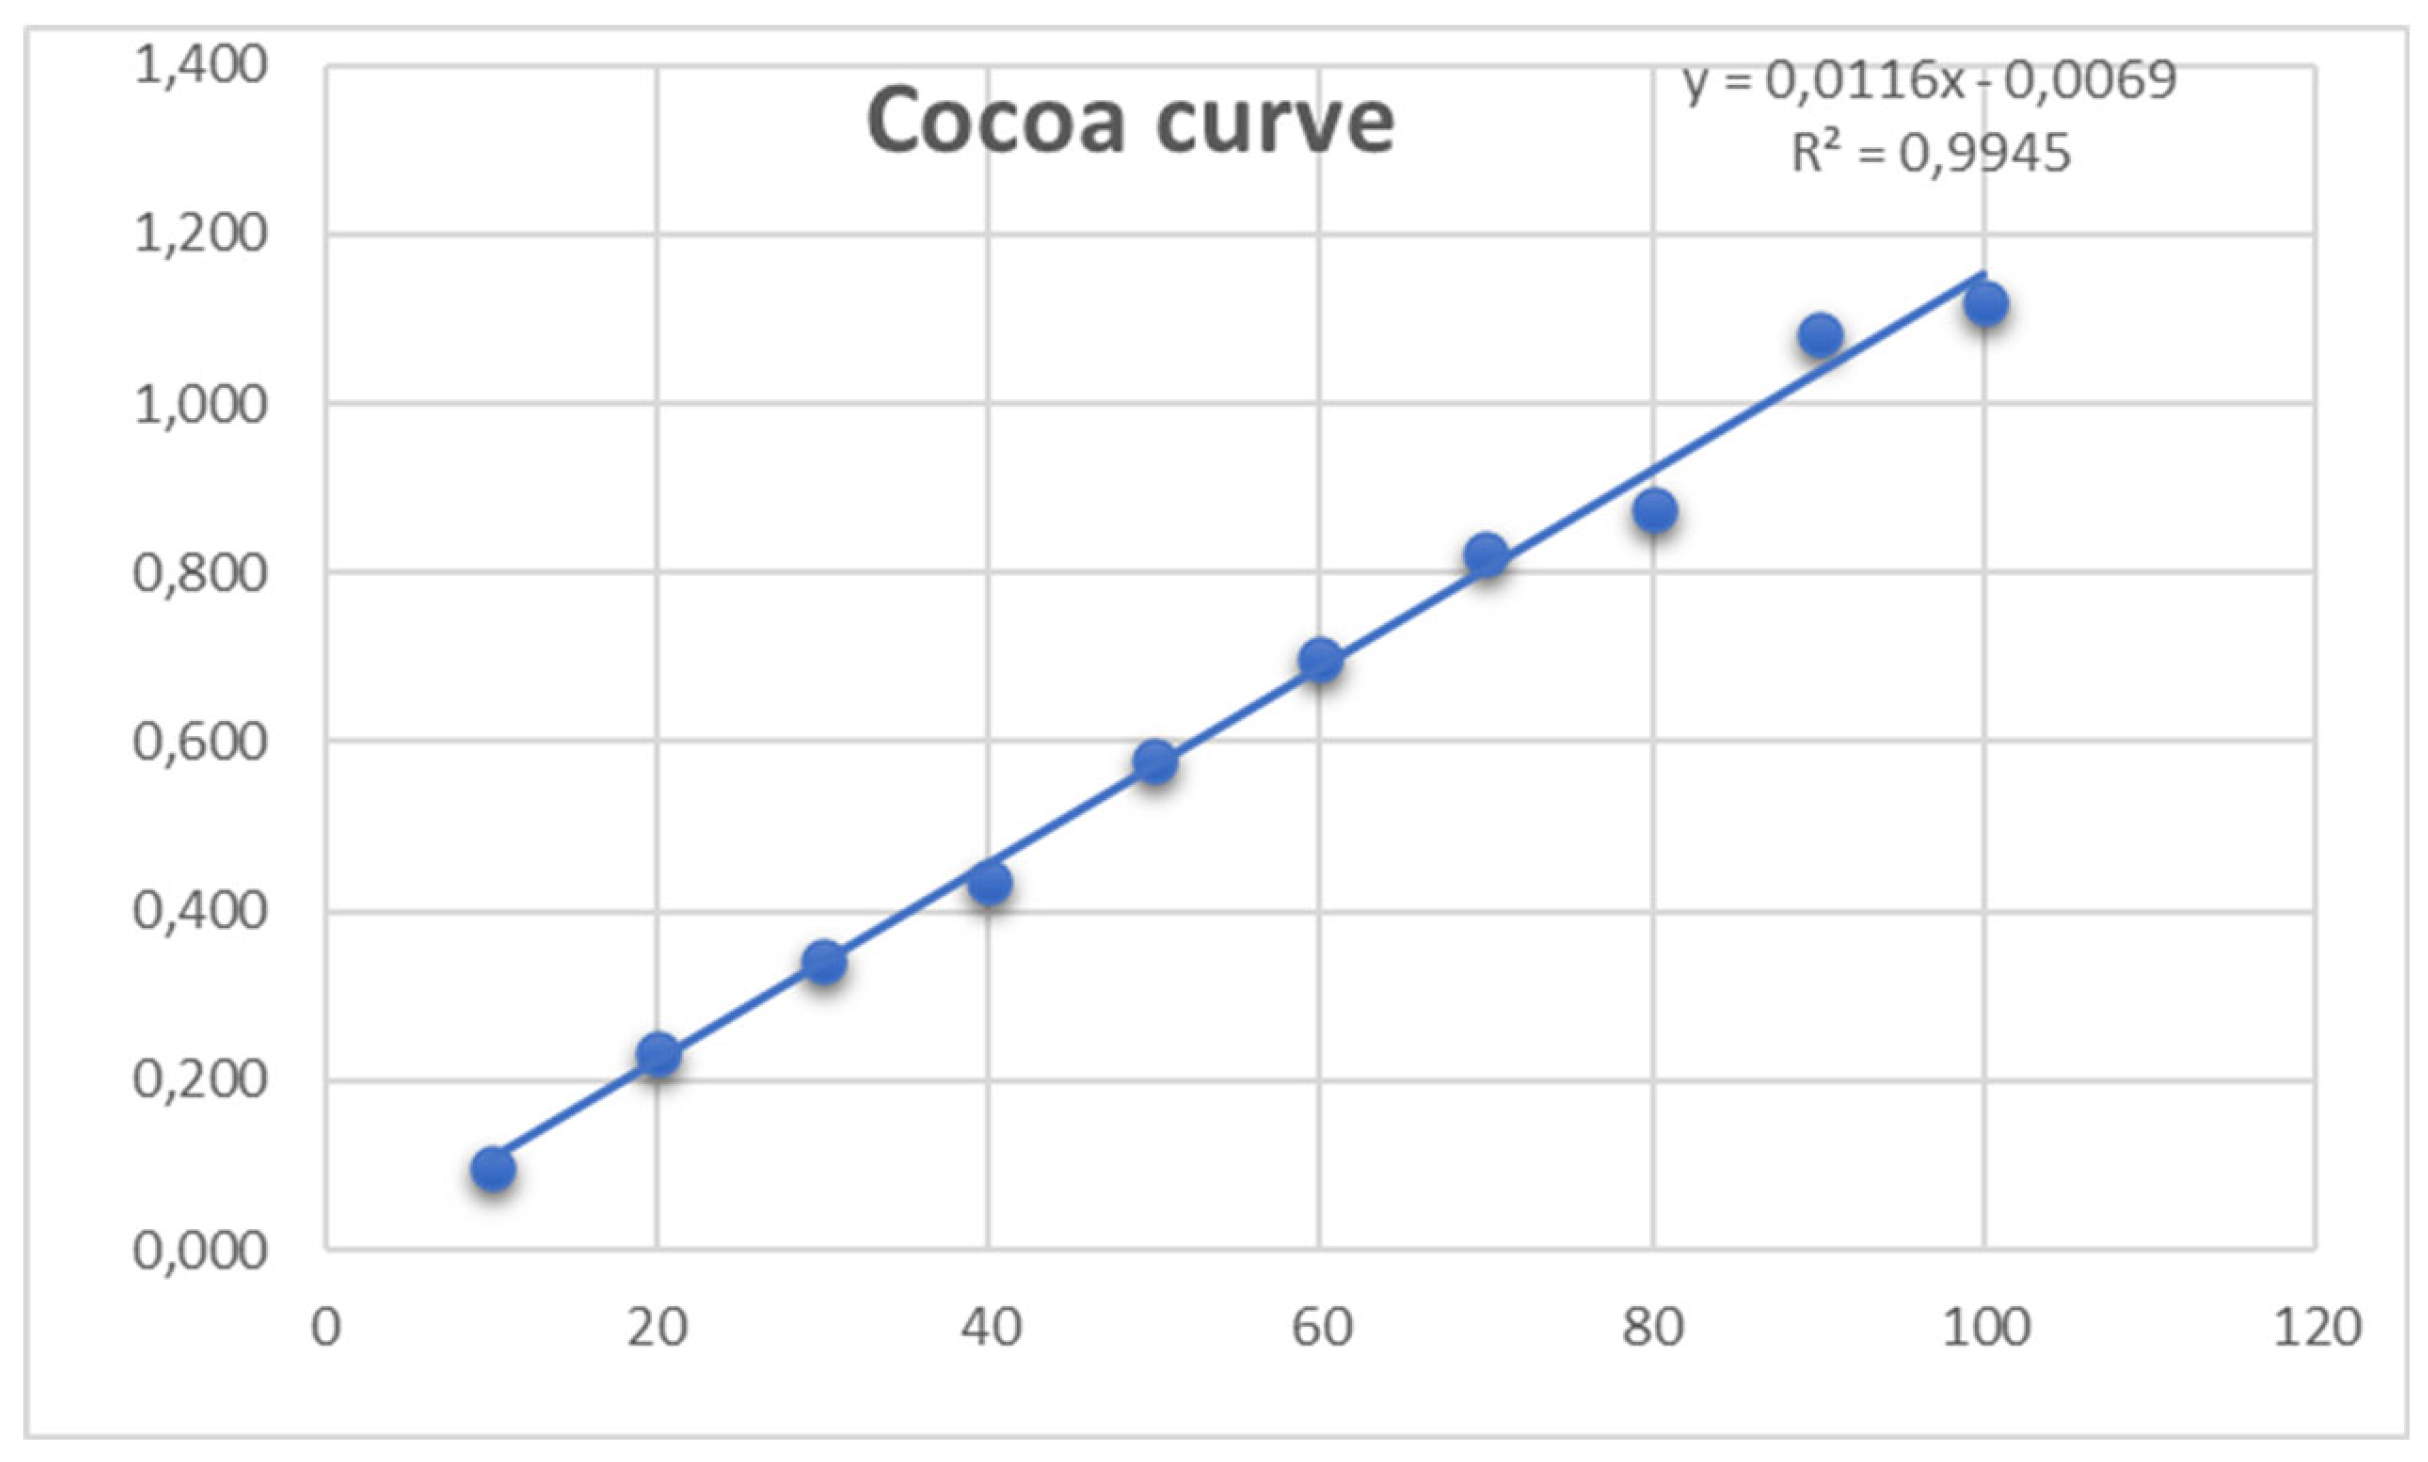
- Quantification of total flavonoids with the Folin-Ciocalteu method
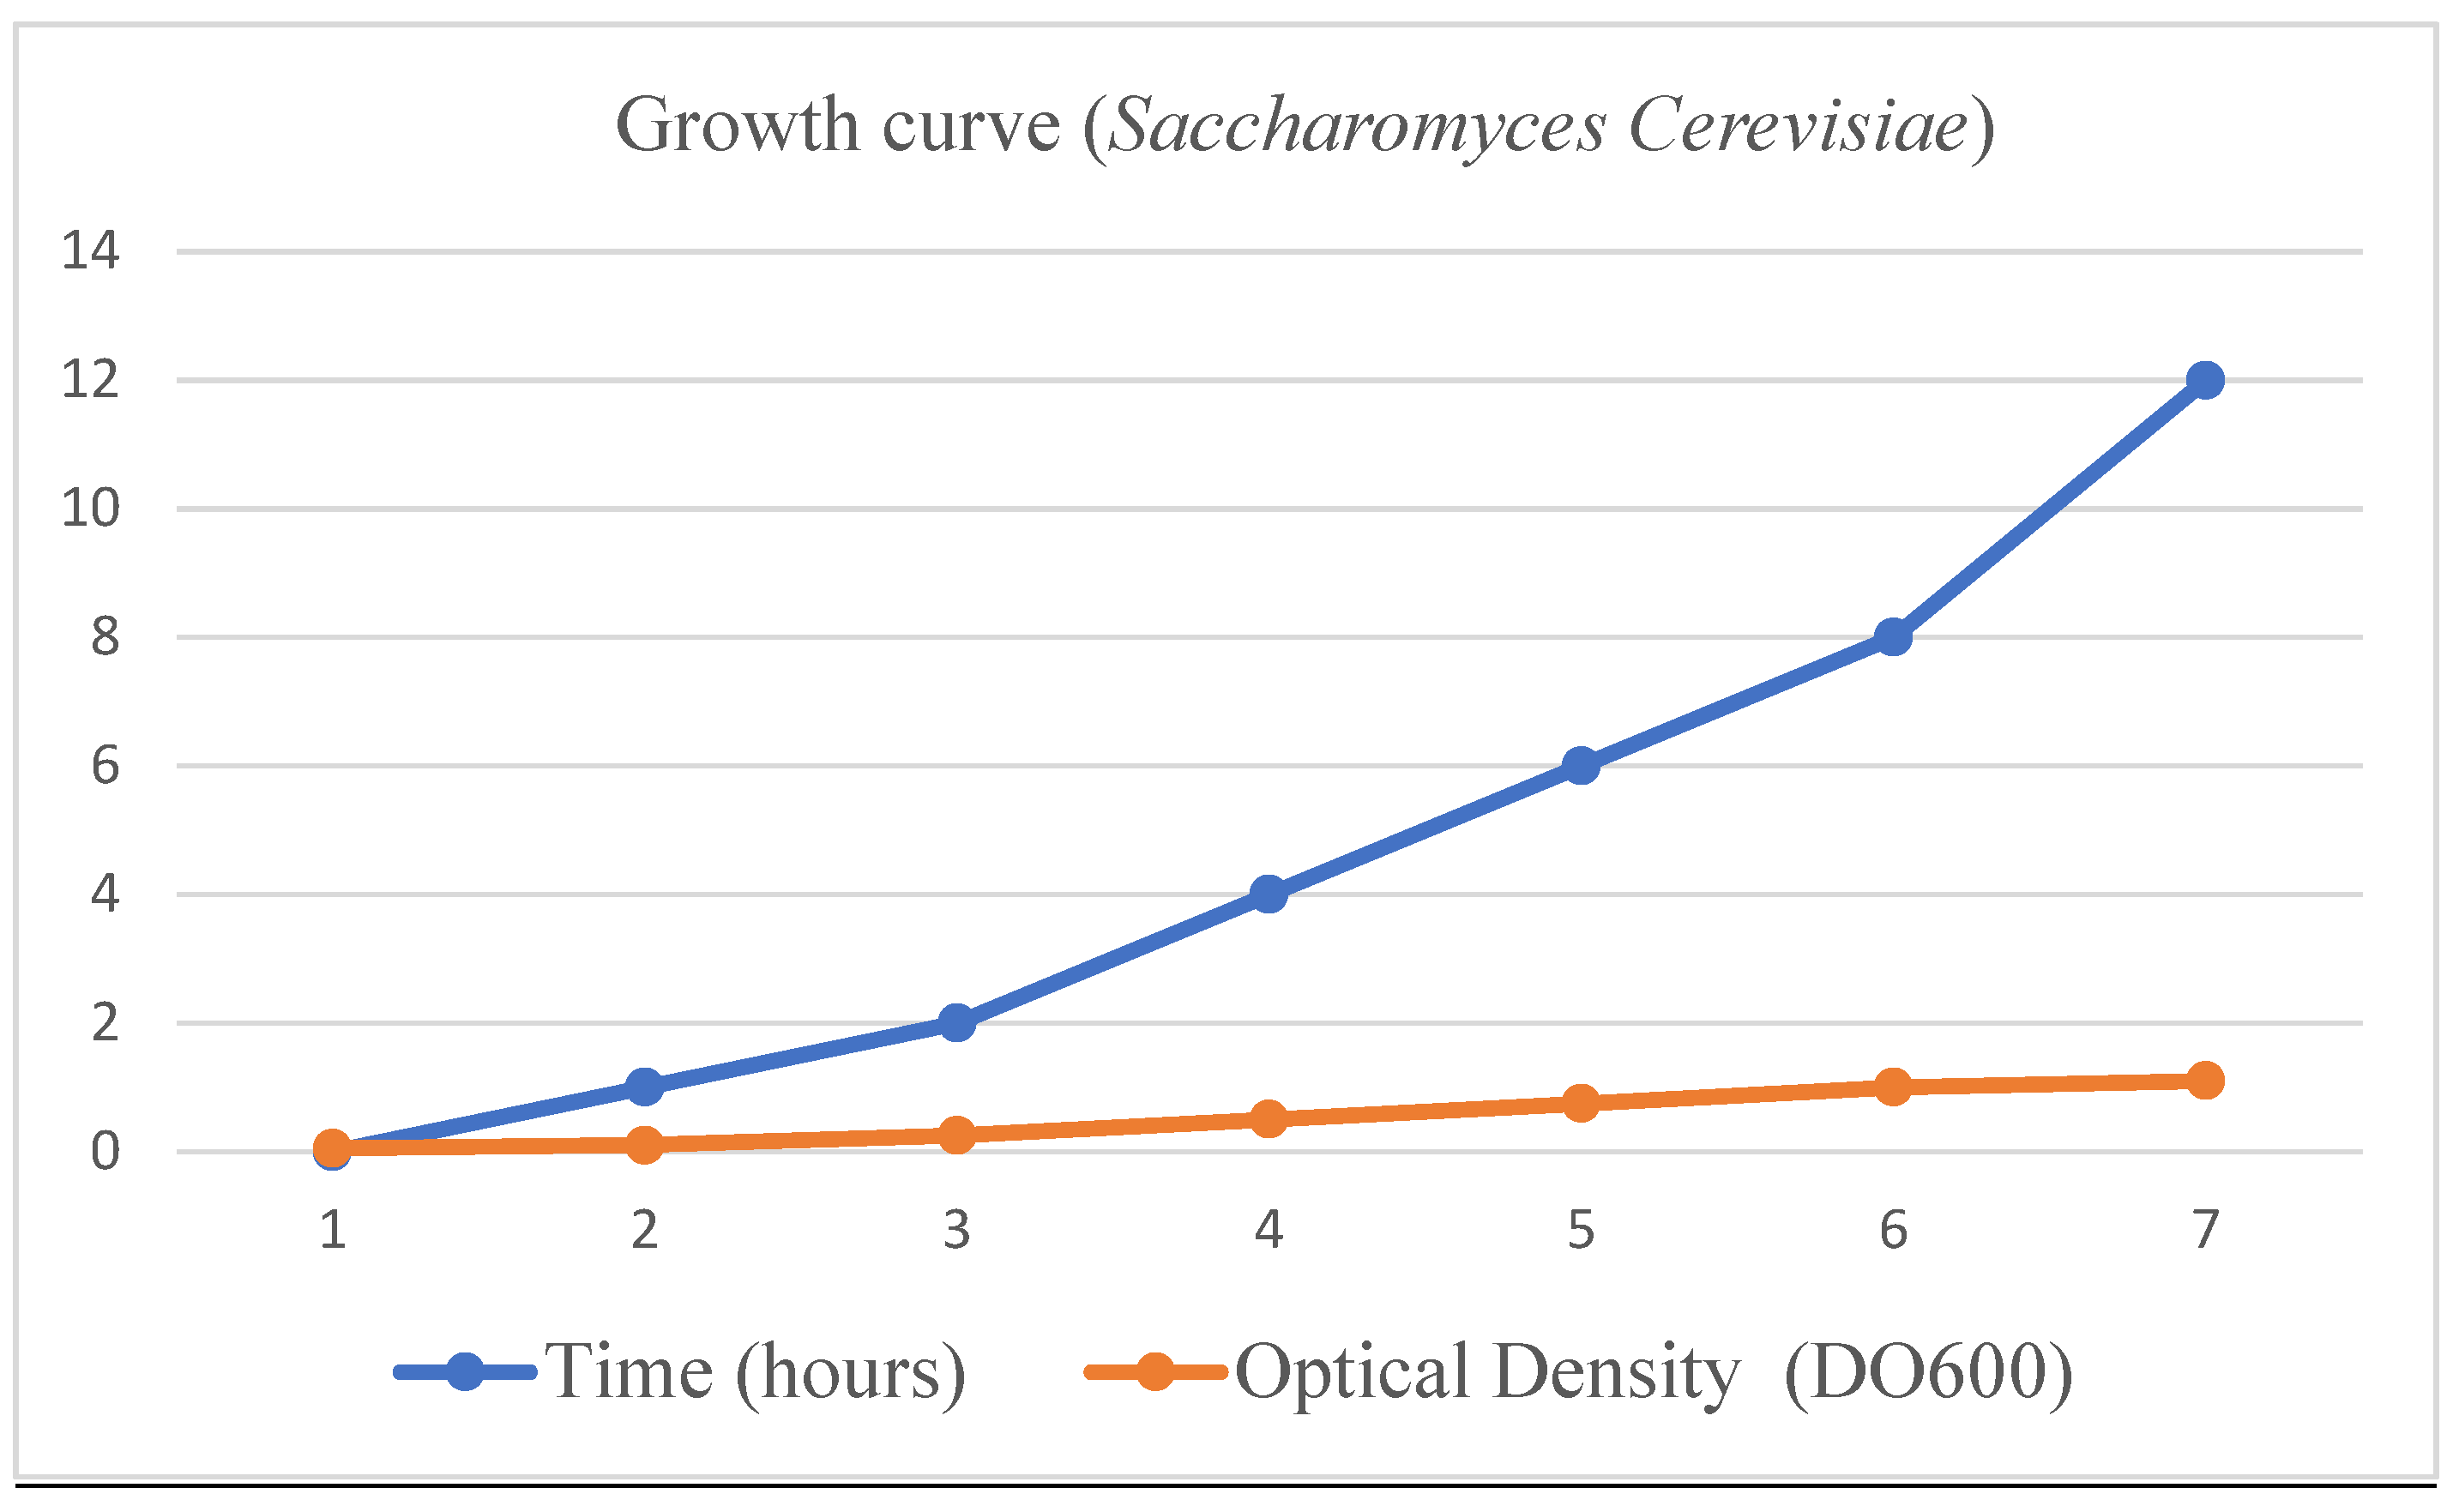
- Isolation, multiplication and DNA extraction of the yeast Saccharomyces cerevisiae
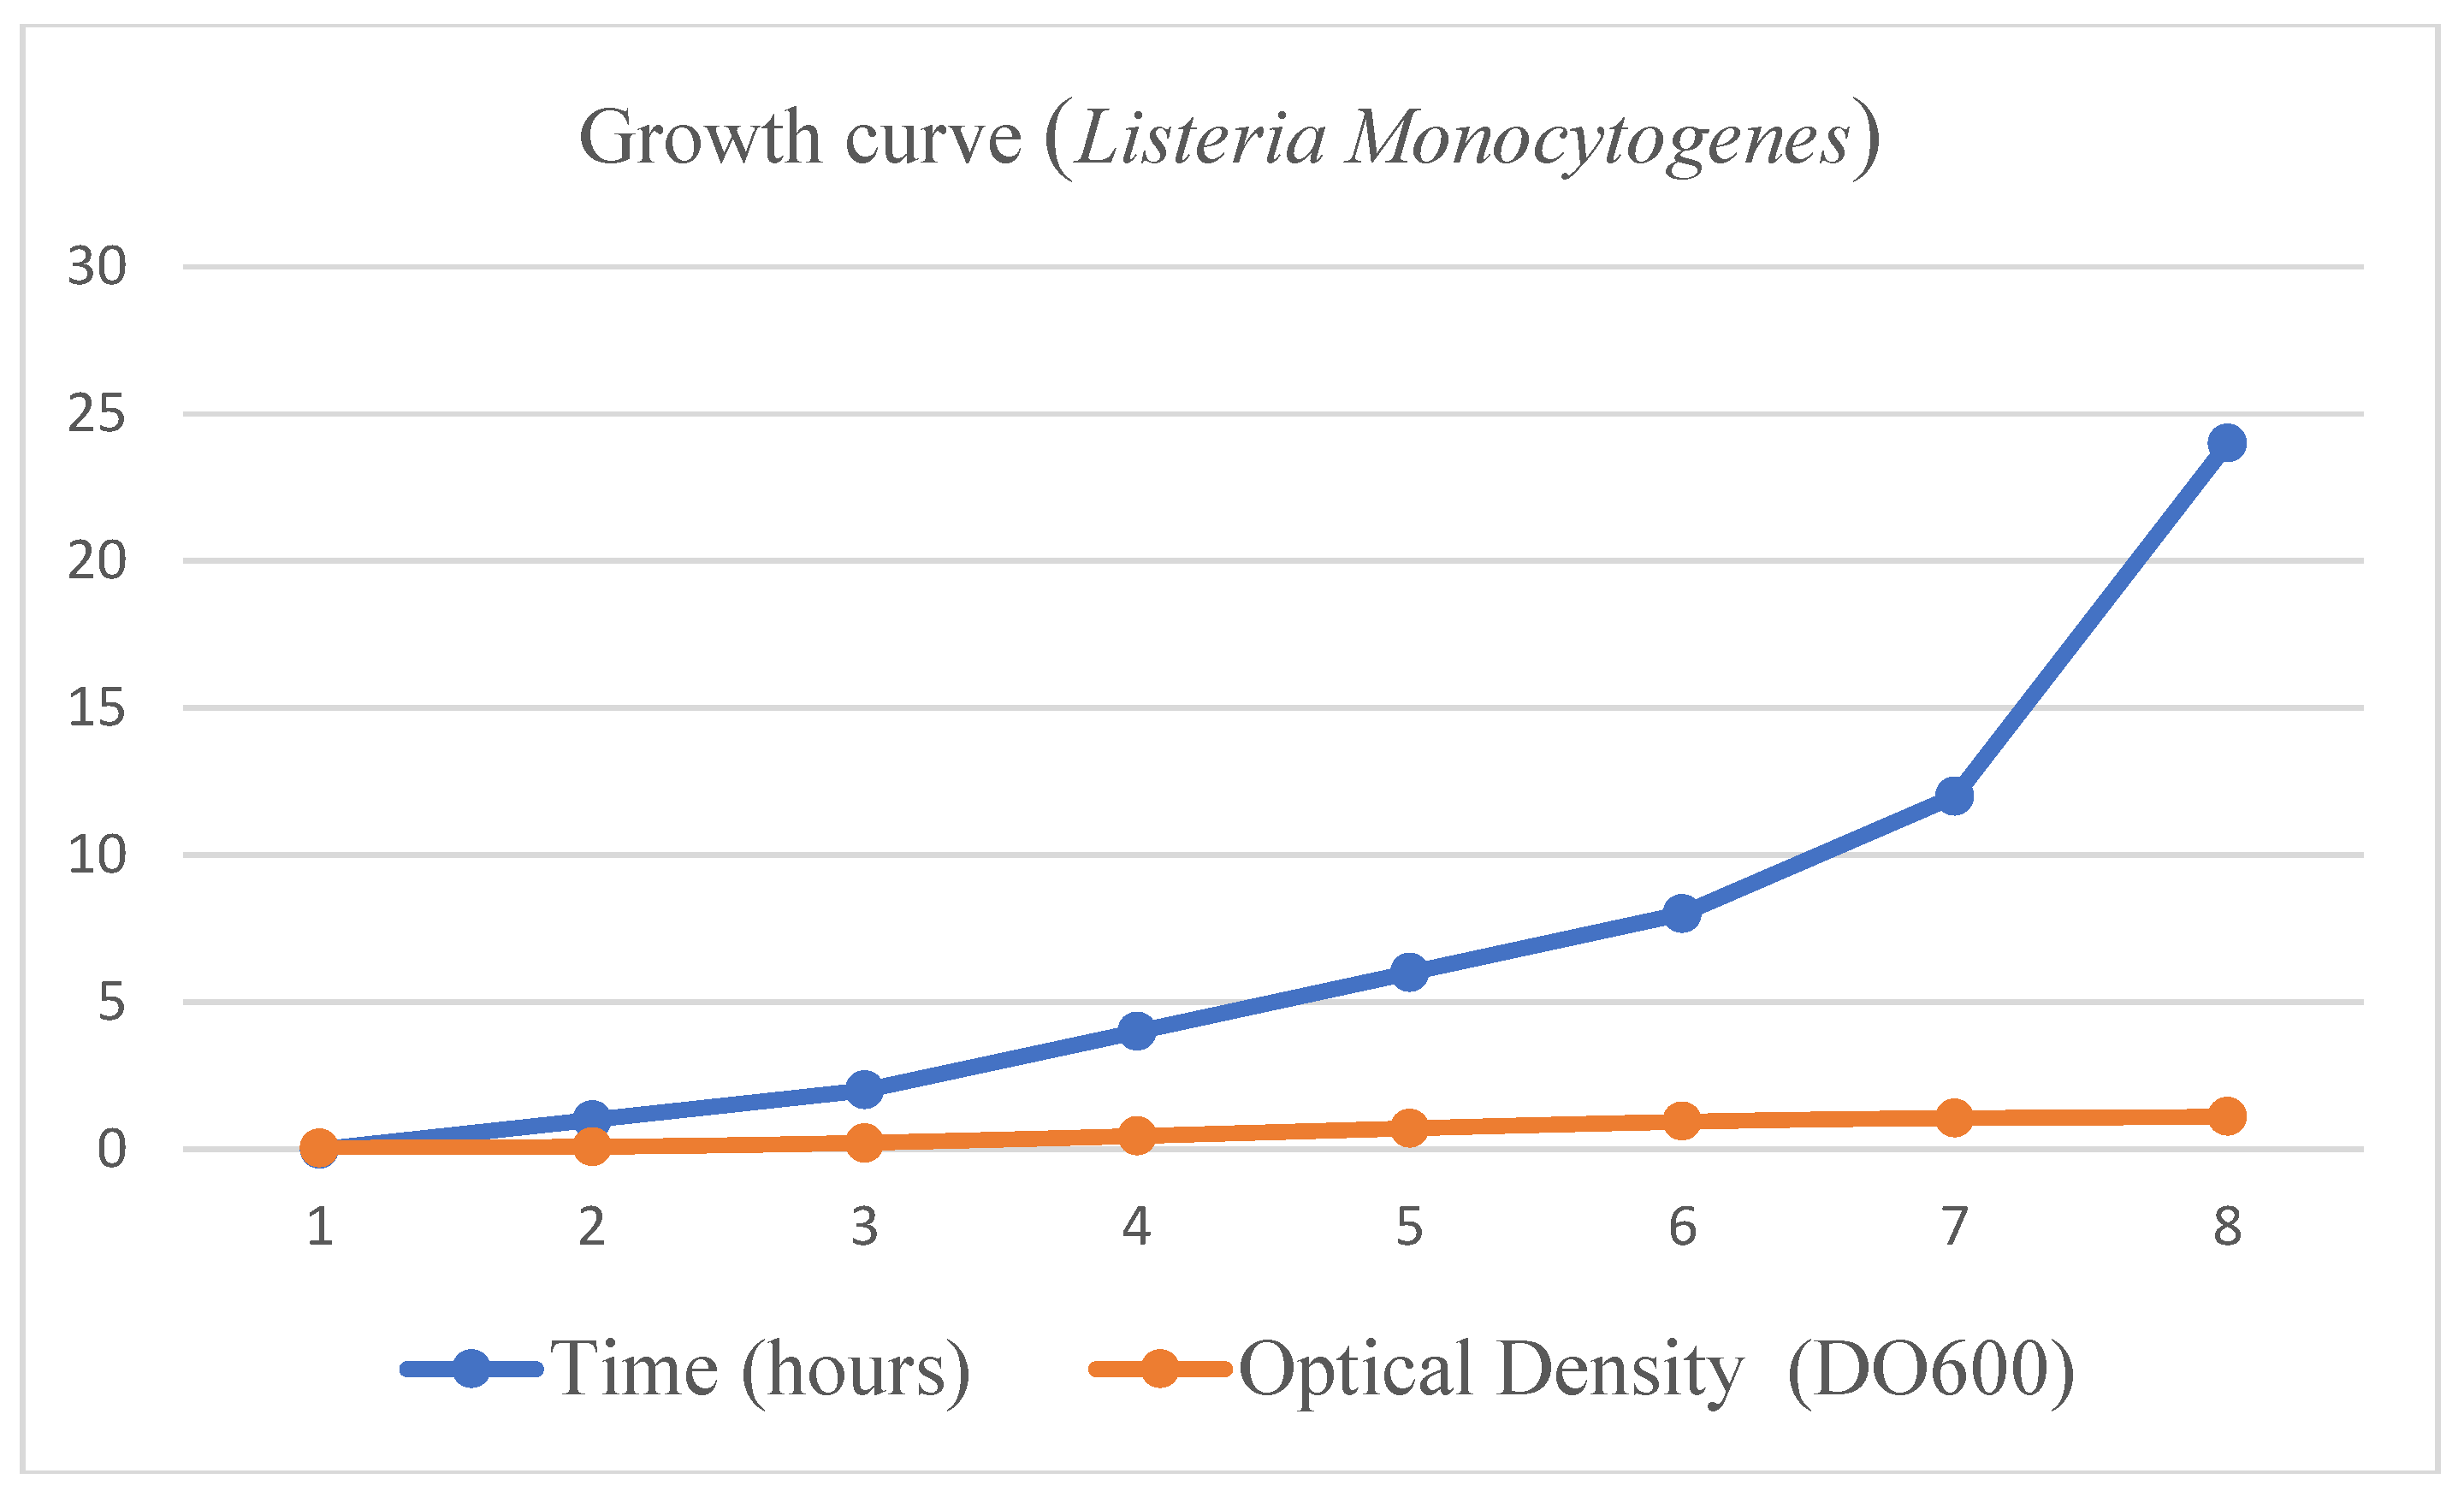
- Isolation, multiplication and DNA extraction of the yeast Listeria Monocytogenes
4. Discussion
5. Conclusions
Author Contributions
Acknowledgments
Conflicts of Interest
References
- Rodríguez ABB, Fuertes MMP, Ramírez GEM, Rodríguez ABB, Fuertes MMP, Ramírez GEM. Uso potencial de residuos agroindustriales como fuente de compuestos fenólicos con actividad biológica. MediSur 2023, 21, 1322–1330. [Google Scholar]
- De la Fuente-Salcido NM, Villarreal-Prieto JM, Díaz León MÁ, et al. Evaluación de la actividad de los agentes antimicrobianos ante el desafío de la resistencia bacteriana. Revista mexicana de ciencias farmacéuticas 2015, 46, 7–16. [Google Scholar]
- Rodríguez-Auad, JP. Panorama de la infección por Listeria monocytogenes. Revista chilena de infectología 2018, 35, 649–657. [Google Scholar] [CrossRef] [PubMed]
- Salazar-López NJ, Enríquez-Valencia SA, Zuñiga Martínez BS, et al. Residuos agroindustriales como fuente de nutrientes y compuestos fenólicos. Epistemus (Sonora) 2023, 17, 60–69. [Google Scholar] [CrossRef]
- Fiallos Maravilla, N. Obtención de Compuestos Polifenolicos Con Actividad Antimicrobiana a Partir de Residuos Agroindustriales.; 2022. [CrossRef]
- Mejía-Barajas JA, Montoya-Pérez R, Cortés-Rojo C, Saavedra-Molina A. Levaduras Termotolerantes: Aplicaciones Industriales, Estrés Oxidativo y Respuesta Antioxidante. Información tecnológica 2016, 27, 03–16. [Google Scholar] [CrossRef]
- Almanza Cano A, Cruz Hilacondo W, Cáceres Iparraguirre H; et al. Identificación y selección de Saccharomyces cerevisiae nativas para mejorar el proceso productivo del Pisco a partir de uva Quebranta. Revista Peruana de Biología 2023, 23. [Google Scholar] [CrossRef]
- Bringas LB, Vidaurre LV, Verde DZ, Martínez PM. INHIBICIÓN DEL CRECIMIENTO DE Listeria monocytogenes ATCC 19115 Y Pseudomonas aeruginosa ATCC 27853 POR ACEITE ESENCIAL DE Citrus sinensis (L.) Osbeck. REBIOL 2020, 40, 141–148. [Google Scholar]
- Muñoz AI, Rodríguez EC. Distribución y caracterización fenotípica y genotípica de Listeria monocytogenes en aislamientos de alimentos, Colombia, 2010-2018. Biomédica 2021, 41, 165–179. [Google Scholar] [CrossRef]
- Vargas M de LV y, Brito HF, Cortez JAT, López VMT, Huchin VMM. Aprovechamiento de cáscaras de frutas: análisis nutricional y compuestos bioactivos. CIENCIA ergo-sum, Revista Científica Multidisciplinaria de Prospectiva 2019, 26. Available online: https://www.redalyc.org/journal/104/10458194006/html/ (accessed on 27 August 2024).
- Terrones Rodriguez, EA.; “Extracción de flavonoides de la cebolla roja (Allium cepa L.) en un equipo SOXHLET con mezcla de solventes etanol – agua.” Repositorio institucional – UNAC. Published online 2018. Available online: https://repositorio.unac.edu.pe/handle/20.500.12952/3881 (accessed on 27 August 2024).
- Urbina Calero, WR.; Obtención de un extracto rico en carotenoides con capacidad antioxidante a escala de banco a partir de residuos agroindustriales del tomate de árbol (Solanum betaceum). bachelorThesis. Universidad Técnica de Ambato. Facultad de Ciencia e Ingeniería en Alimentos y Biotecnología. Carrera de Ingeniería Bioquímica; 2019. Available online: https://repositorio.uta.edu.ec:8443/jspui/handle/123456789/30542 (accessed on 27 August 2024).
- Castromonte M, Wacyk J, Valenzuela C, Castromonte M, Wacyk J, Valenzuela C. Encapsulación de extractos antioxidantes desde sub-productos agroindustriales: una revisión. Revista chilena de nutrición 2020, 47, 836–847. [Google Scholar] [CrossRef]
- Ramos RTM, Bezerra ICF, Ferreira MRA, Soares LAL. Spectrophotometric Quantification of Flavonoids in Herbal Material, Crude Extract, and Fractions from Leaves of Eugenia uniflora Linn. Pharmacognosy Res 2017, 9, 253–260. [Google Scholar] [CrossRef]
- Aparna B, Hema BP. Preliminary Screening and Quantification of Flavonoids in Selected Seeds of Apiaceae by UV-Visible Spectrophotometry with Evaluation Study on Different Aluminium Chloride Complexation Reaction. INDJST 2022, 15, 857–868. [Google Scholar] [CrossRef]
- Wabaidur SM, Obbed MS, Alothman ZA, et al. Total phenolic acids and flavonoid contents determination in Yemeni honey of various floral sources: Folin-Ciocalteu and spectrophotometric approach. Food Sci Technol 2020, 40, 647–652. [Google Scholar] [CrossRef]
- Fernandez Taype R, Contreras Paco JL, Curasma Ccente J; et al. Efecto de Saccharomyces cerevisiae y tiempos de fermentación sobre la composición química del ensilado de avena y cebada. Revista de Investigaciones Veterinarias del Perú 2021, 32. [Google Scholar] [CrossRef]
- Velázquez Molinero R, Zamora de Alba E, Álvarez M. La inoculación de levaduras killer Saccharomyces cerevisiae en la fase de tiraje mejora la crianza y la calidad del cava. Enología del siglo XXI 2017, 30–34. [Google Scholar]
- Osorio-Cadavid E, Ramírez M, López WA, Mambuscay LA. Estandarización de un protocolo sencillo para la extracción de adn genómico de levaduras. Published online 2009. Available online: https://repositorio.unal.edu.co/handle/unal/24639 (accessed on 14 September 2024).
- García JP, Gil JE, Botero S, et al. Control de crecimiento de Listeria monocytogenes en co-cultivo con Lactobacillus plantaram. Revista Colombiana de Biotecnología 2018, 20, 68–77. [Google Scholar] [CrossRef]
- lopez de avila lina maria, Mejía Gómez CE. Evaluación de métodos de extracción de ADN para detección de Listeria monocytogenes en productos cárnicos. Revista MVZ Córdoba 2012, 17, 3169. [Google Scholar] [CrossRef]
- Baltodano Bringas L, Velásquez Vidaurre L, Zavaleta Verde D, Martínez PM. Inhibición del crecimiento de listeria monocytogenes atcc 19115 y pseudomonas aeruginosa atcc 27853 por aceite esencial de citrus sinensis (l.) Osbeck. Revista de Investigación Científica REBIOL 2020, 40, 141–148. [Google Scholar]
- Stechina D, Pauletti M, Cives H, et al. Estudios de aprovechamiento integral de cáscara de naranja. Ciencia, Docencia y Tecnología Suplemento 2017, 7. Available online: https://pcient.uner.edu.ar/index.php/Scdyt/article/view/393 (accessed on 14 September 2024).
- Tinoco H, Ospina D. Análisis del proceso de deshidratación de cacao para la disminución del tiempo de secado. 2010, 13, 53–63. [CrossRef]
- Aguilar J, González G, Fuentes G. Evaluación de la actividad antioxidante de extractos obtenidos a partir de la cáscara de naranja valencia (Citrus sinensis L.). Published online , 2015. 28 October.
- Vega Contreras NA, Torres Salazar ML, Vega Contreras NA, Torres Salazar ML. Evaluación de compuestos fenolicos de (Citrus sinensis) y su capacidad antioxidante. Ciencia en Desarrollo 2021, 12, 109–117. [Google Scholar] [CrossRef]
- Pilco CJ, Mejía CM, Toalombo RM, Azogue DM, Báez MP. Identificación y cuantificación de levaduras Saccharomyces Cerevisiae en la fermentación de mostos de vinos: Identification and quantification of Saccharomyces Cerevisiae yeasts in the fermentation of wine musts. LATAM Revista Latinoamericana de Ciencias Sociales y Humanidades 2023, 4, 2430–2445. [Google Scholar] [CrossRef]
- Jones GS, D’Orazio SEF. Listeria monocytogenes: Cultivation and Laboratory Maintenance. Curr Protoc Microbiol 2013, 31, 9B.2.1–9B27. [Google Scholar] [CrossRef]
- Tönz A, Freimüller Leischtfeld S, Stevens MJA, et al. Growth Control of Listeria monocytogenes in Raw Sausage via Bacteriocin-Producing Leuconostoc carnosum DH25. Foods 2024, 13, 298. [Google Scholar] [CrossRef] [PubMed]
- Álvarez-Martínez FJ, Barrajón-Catalán E, Herranz-López M, Micol V. Antibacterial plant compounds, extracts and essential oils: An updated review on their effects and putative mechanisms of action. Phytomedicine 2021, 90, 153626. [Google Scholar] [CrossRef] [PubMed]
- Tam C, Nguyen K, Nguyen D; et al. Antimicrobial properties of tomato leaves, stems, and fruit and their relationship to chemical composition. BMC Complementary Medicine and Therapies 2021, 21. [Google Scholar] [CrossRef]
| Orange (A) | Onion (B) | Cocoa (C) |
|---|---|---|
| A1E1 (200 µg/mL) | B1E1 (200 µg/mL) | C1E1 (200 µg/mL) |
| A2E1 (300 µg/mL) | B2E1 (300 µg/mL) | C2E1 (300 µg/mL) |
| A3E1 (400 µg/mL) | B3E1 (400 µg/mL) | C3E1 (400 µg/mL) |
| Extract | Concentration (µg/ml) | Replica 1 | Replica 2 | Replica 3 |
|---|---|---|---|---|
| Orange | 200 | E1 | E2 | E3 |
| Orange | 300 | E4 | E5 | E6 |
| Orange | 400 | E7 | E8 | E9 |
| Onion | 200 | E10 | E11 | E12 |
| Onion | 300 | E13 | E14 | E15 |
| Onion | 400 | E16 | E17 | E18 |
| Cocoa | 200 | E19 | E20 | E21 |
| Cocoa | 300 | E22 | E23 | E24 |
| Cocoa | 400 | E25 | E26 | E27 |
| Tamarillo | 200 | E28 | E29 | E30 |
| Tamarillo | 300 | E31 | E32 | E33 |
| Tamarillo | 400 | E34 | E35 | E36 |
| Orange (A) | Onion (B) | Cocoa (C) | Tamarillo (D) |
|---|---|---|---|
| A1E1 (200 µg/mL) (3 units /1mL H2O) |
B1E1 (200 µg/mL) (3 units /1mL H2O) |
C1E1 (200 µg/mL) (3 units /1mL H2O) |
D1E1 (200 µg/mL) (3 units /1mL H2O) |
| A2E1 (300 µg/mL) (3 units /1mL H2O) |
B2E1 (300 µg/ml) (3 units /1mL H2O) |
C2E1 (300 µg/mL) (3 units /1mL H2O) |
D2E1 (300 µg/mL) (3 units /1mL H2O) |
| A3E1 (400 µg/mL) (3 units /1mL H2O) |
B3E1 (400 µg/ml) (3 units /1mL H2O) |
C3E1 (400 µg/mL) (3 units /1mL H2O) |
D3E1 (400 µg/mL) (3 units /1mL H2O) |
| Extract | Concentration (µg/ml) | Yeast Colonies | Replica 1 | Replica 2 | Replica 3 |
|---|---|---|---|---|---|
| Orange | 200 | 3 units/mL | E1 | E2 | E3 |
| Orange | 300 | 3 units/mL | E4 | E5 | E6 |
| Orange | 400 | 3 units/mL | E7 | E8 | E9 |
| Onion | 200 | 3 units/mL | E10 | E11 | E12 |
| Onion | 300 | 3 units/mL | E13 | E14 | E15 |
| Onion | 400 | 3 units/mL | E16 | E17 | E18 |
| Cocoa | 200 | 3 units/mL | E19 | E20 | E21 |
| Cocoa | 300 | 3 units/mL | E22 | E23 | E24 |
| Cocoa | 400 | 3 units/mL | E25 | E26 | E27 |
| Tamarillo | 200 | E28 | E29 | E30 | |
| Tamarillo | 300 | E31 | E32 | E33 | |
| Tamarillo | 400 | E34 | E35 | E36 |
| M.Raw | Initial Weight | Final Weight |
|---|---|---|
| Cocoa | 320,40 gr | 110,10 gr |
| C. Onion | 138,10 gr | 18,63 gr |
| C. Orange | 280,74 gr | 89,96 gr |
| C. Tamarillo | 728,55 gr | 104,10 gr |
| Samples | Weight Balls | Weight of Centrifuge tubes |
|---|---|---|
| Cocoa | m1: 115,3200 gr m2: 123,4500 gr m3: 121,7890 gr |
t1: 10,5000 gr t2: 10,6000 gr t3: 10,4500 gr |
| C. Onion | m1: 109,0225gr m2: 97,5165gr m3: 132,4163gr |
t1:10,1162 gr t2: 9,9466 gr t3: 9,9649 gr |
| C. Orange | m1: 169,7243 gr m2:168,1958 gr m3: 180,4852g |
t1:10,7882 gr t2:10,1897 gr t3: 10,2107gr |
| C. Tamarillo | m1: 109,0127g m2: 97,5113g m3: 132,4039g |
t1: 9,7225gr t2: 9,6373gr t3: 10,0843 gr |
| Samples | Weight Centrifuge Tubes (Vacuum) | Weight of Lyophilized Centrifuge Tubes | Total Extract |
|---|---|---|---|
| Cocoa | t1: 10,2000 gr t2: 10,3000 gr t3: 10,1500 gr |
T1L: 12,5000 gr T2L: 12,6000 gr T3L: 12,5500 gr |
Ext 1: 2,3000 gr Ext 2: 2,4000 gr Ext 3: 2,3500 gr |
| C. Onion | t1: 10,1162 gr t2: 9,9466 gr t3: 9,9649 gr |
T1L: 12,8867 gr T2L: 12,7436 gr T3L: 12,7429 gr |
Ext 1: 2,7705 gr Ext 2: 2,7970 gr Ext 3: 2,7780 gr |
| C. Orange | t1: 10,7882 gr t2: 10,1897 gr t3: 10,2107 gr |
T1L: 12,4329 gr T2L: 12,3501 gr T3L: 11,9363 gr |
Ext 1: 2,2547 gr Ext 2: 2,1604 gr Ext 3: 1,7256 gr |
| C. Tamarillo | t1: 9,7225 gr t2: 9,6373 gr t3: 10,0843 gr |
T1L: 12,7195 gr T2L: 12,7456 gr T3L: 13,1384 gr |
Ext 1: 2,9970 gr Ext 2: 3,1083 gr Ext 3: 3,0541 gr |
| Samples | Weight Centrifuge Tubes (Vacuum) | Weight of Lyophilized Centrifuge Tubes | Soluble Solids Loss |
|---|---|---|---|
| Cocoa | t1: 10,2000 gr t2: 10,3000 gr t3: 10,1500 gr |
T1L: 12,5000 gr T2L: 12,6000 gr T3L: 12,5500 gr |
Ps 1: 2,3000 gr Ps 2: 2,4000 gr Ps 3: 2,3500 gr |
| C. Onion | t1: 10,1162 gr t2: 9,9466 gr t3: 9,9649 gr |
T1L: 12,8867 gr T2L: 12,7436 gr T3L: 12,7429 gr |
Ps 1: 3,2295 gr Ps 2: 3,203 gr Ps 3: 3.222 gr |
| C. Orange | t1: 10,7882 gr t2: 10,1897 gr t3: 10,2107 gr |
T1L: 12,4329 gr T2L: 12,3501 gr T3L: 11,9363 gr |
Ps 1: 4,7453gr Ps 2: 4,8396 gr Ps 3: 5,2744gr |
| C. Tamarillo | t1: 9,7225 gr t2: 9,6373 gr t3: 10,0843 gr |
T1L: 12,7195 gr T2L: 12,7456 gr T3L: 13,1384 gr |
Ps 1: 4 gr Ps 2: 3,8917 gr Ps 3: 3,9459 gr |
| 1 | 2 | 3 | 4 | 5 | 6 | 7 | 8 | 9 | 10 | 11 | 12 | |
|---|---|---|---|---|---|---|---|---|---|---|---|---|
| A | 0,151 | 0,161 | 0,155 | 0,151 | 1,077 | 1,14 | 1,161 | 1,178 | 0,195 | 0,183 | 0,205 | 0,204 |
| B | 0,278 | 0,304 | 0,294 | 0,28 | 1,174 | 1,099 | 1,191 | 1,244 | 0,213 | 0,233 | 0,215 | 0,203 |
| C | 0,388 | 0,399 | 0,396 | 0,406 | 1,042 | 1,075 | 1,062 | 1,049 | ||||
| D | 0,497 | 0,487 | 0,479 | 0,506 | 0,925 | 0,891 | 0,896 | 0,916 | ||||
| E | 0,624 | 0,634 | 0,627 | 0,656 | 0,819 | 0,823 | 0,755 | 0,821 | ||||
| F | 0,287 | 0,74 | 0,753 | 0,77 | 0,589 | 0,621 | 0,637 | 0,618 | ||||
| G | 0,878 | 0,87 | 0,871 | 0,893 | 0,057 | 0,054 | 0,054 | 0,054 | ||||
| H | 1,051 | 0,896 | 0,883 | 0,898 | 0,221 | 0,229 | 0,233 | 0,239 |
| 1 | 2 | 3 | 4 | 5 | 6 | 7 | 8 | 9 | 10 | 11 | 12 | |
|---|---|---|---|---|---|---|---|---|---|---|---|---|
| A | 0,096 | 0,106 | 0,1 | 0,096 | 1,022 | 1,085 | 1,106 | 1,123 | 0,14 | 0,128 | 0,15 | 0,149 |
| B | 0,223 | 0,249 | 0,239 | 0,225 | 1,119 | 1,044 | 1,136 | 1,189 | 0,158 | 0,178 | 0,16 | 0,148 |
| C | 0,333 | 0,344 | 0,341 | 0,351 | 0,987 | 1,02 | 1,007 | 0,994 | ||||
| D | 0,442 | 0,432 | 0,424 | 0,451 | 0,87 | 0,836 | 0,841 | 0,861 | ||||
| E | 0,569 | 0,579 | 0,572 | 0,601 | 0,764 | 0,768 | 0,7 | 0,766 | ||||
| F | 0,232 | 0,685 | 0,698 | 0,715 | 0,534 | 0,566 | 0,582 | 0,563 | ||||
| G | 0,823 | 0,815 | 0,816 | 0,838 | 0,002 | -0,001 | -0,001 | -0,001 | ||||
| H | 0,996 | 0,841 | 0,828 | 0,843 | 0,166 | 0,174 | 0,178 | 0,184 |
| Spectrophotometer reading | Average | Concentration total flavonoids | |||||||
|---|---|---|---|---|---|---|---|---|---|
| Sample | ABS 1 | ABS 2 | ABS 3 | ABS 4 | ABS average |
(mg Q/L) 1 | (mg Q /L) 2 | (mg Q /L) 3 | (mg Q/L) 4 |
| Cocoa 1 | 0,987 | 1,02 | 1,007 | 0,994 | 1,002 | 85,68 | 88,53 | 87,41 | 86,28 |
| Cocoa 2 | 0,87 | 0,836 | 0,841 | 0,861 | 0,852 | 75,59 | 72,66 | 73,09 | 74,82 |
| Cocoa 3 | 0,764 | 0,768 | 0,7 | 0,766 | 0,750 | 66,46 | 66,80 | 60,94 | 66,63 |
| Orange 1 | 1,031 | 0,993 | 1,094 | 1,039 | 349,27 | 335,19 | 372,60 | 0,250 | 0,011 |
| Orange 2 | 0,919 | 0,942 | 0,900 | 0,920 | 307,79 | 316,31 | 300,75 | 0,250 | 0,011 |
| Orange 3 | 0,964 | 0,985 | 1,010 | 0,986 | 324,45 | 332,23 | 341,49 | 0,250 | 0,011 |
| Onion 1 | 0,873 | 0,875 | 0,889 | 0,879 | 290,89 | 291,63 | 296,81 | 0,250 | 0,011 |
| Onion 2 | 1,442 | 1,503 | 1,532 | 1,492 | 501,63 | 524,22 | 534,96 | 0,250 | 0,011 |
| Onion 3 | 0,643 | 0,678 | 0,669 | 0,663 | 205,70 | 218,67 | 215,33 | 0,250 | 0,011 |
| Tamarillo1 | 0,701 | 0,646 | 0,641 | 0,663 | 227,19 | 206,81 | 204,96 | 0,250 | 0,011 |
| Tamarillo2 | 0,352 | 0,331 | 0,365 | 0,349 | 97,93 | 90,15 | 102,74 | 0,250 | 0,011 |
| Tamarillo3 | 0,026 | 0,028 | 0,027 | 0,027 | -22,81 | -22,07 | -22,44 | 0,250 | 0,011 |
| Extract preparation | Dilution factor | Concentration total flavonoids | Average | Standard deviation | ||||
|---|---|---|---|---|---|---|---|---|
| g | L | FD | (mg Q /g) 1 | (mg Q /g) 2 | (mg Q /g) 3 | (mg Q /g) 4 | (mg Q /g) | SD |
| 8 | 0,05 | 1 | 0,54 | 0,55 | 0,55 | 0,54 | 0,00 | 0,01 |
| 8 | 0,05 | 1 | 0,47 | 0,45 | 0,46 | 0,47 | 0,46 | 0,01 |
| 8 | 0,05 | 1 | 0,42 | 0,42 | 0,38 | 0,42 | 0,41 | 0,02 |
| 8 | 0,08 | 1 | 0,47 | 0,49 | 0,51 | 0,49 | 0,49 | 0,02 |
| 3 | 46,103 | 44,246 | 49,183 | 46,511 | 2,49 | 0,52 | 24,68 | 26,79 |
| 3 | 40,628 | 41,752 | 39,699 | 40,693 | 1,03 | 0,45 | 20,47 | 22,79 |
| 3 | 42,828 | 43,855 | 45,077 | 43,920 | 1,13 | 0,51 | 22,66 | 25,23 |
| 3 | 38,397 | 38,495 | 39,180 | 38,691 | 0,43 | 0,43 | 19,68 | 22,23 |
| 3 | 66,215 | 69,197 | 70,615 | 68,676 | 2,25 | 0,81 | 35,59 | 39,34 |
| 3 | 27,153 | 28,864 | 28,424 | 28,147 | 0,89 | 0,33 | 14,45 | 15,98 |
| 3 | 29,988 | 27,300 | 27,055 | 28,114 | 1,63 | 0,27 | 14,27 | 15,39 |
| 3 | 12,926 | 11,900 | 13,562 | 12,796 | 0,84 | 0,14 | 6,83 | 7,34 |
| 3 | -3,012 | -2,914 | -2,963 | -2,963 | 0,05 | -0,03 | -1,48 | 1,72 |
| Extract | Concentration (µg/ml) | Replica 1 | Replica 2 | Replica 3 | Colony Average |
|---|---|---|---|---|---|
| Orange | 200 | 2 | 2 | 1 | 1,67 |
| Orange | 300 | 0 | 0 | 0 | 0,00 |
| Orange | 400 | 0 | 0 | 0 | 0,00 |
| Onion | 200 | 4 | 3 | 3 | 3,33 |
| Onion | 300 | 2 | 1 | 2 | 1,67 |
| Onion | 400 | 0 | 0 | 0 | 0,00 |
| Cocoa | 200 | 3 | 3 | 2 | 2,67 |
| Cocoa | 300 | 1 | 1 | 1 | 1,00 |
| Cocoa | 400 | 0 | 0 | 0 | 0,00 |
| Tamarillo | 200 | 5 | 4 | 5 | 4,67 |
| Tamarillo | 300 | 3 | 2 | 3 | 2,67 |
| Tamarillo | 400 | 1 | 1 | 1 | 1,00 |
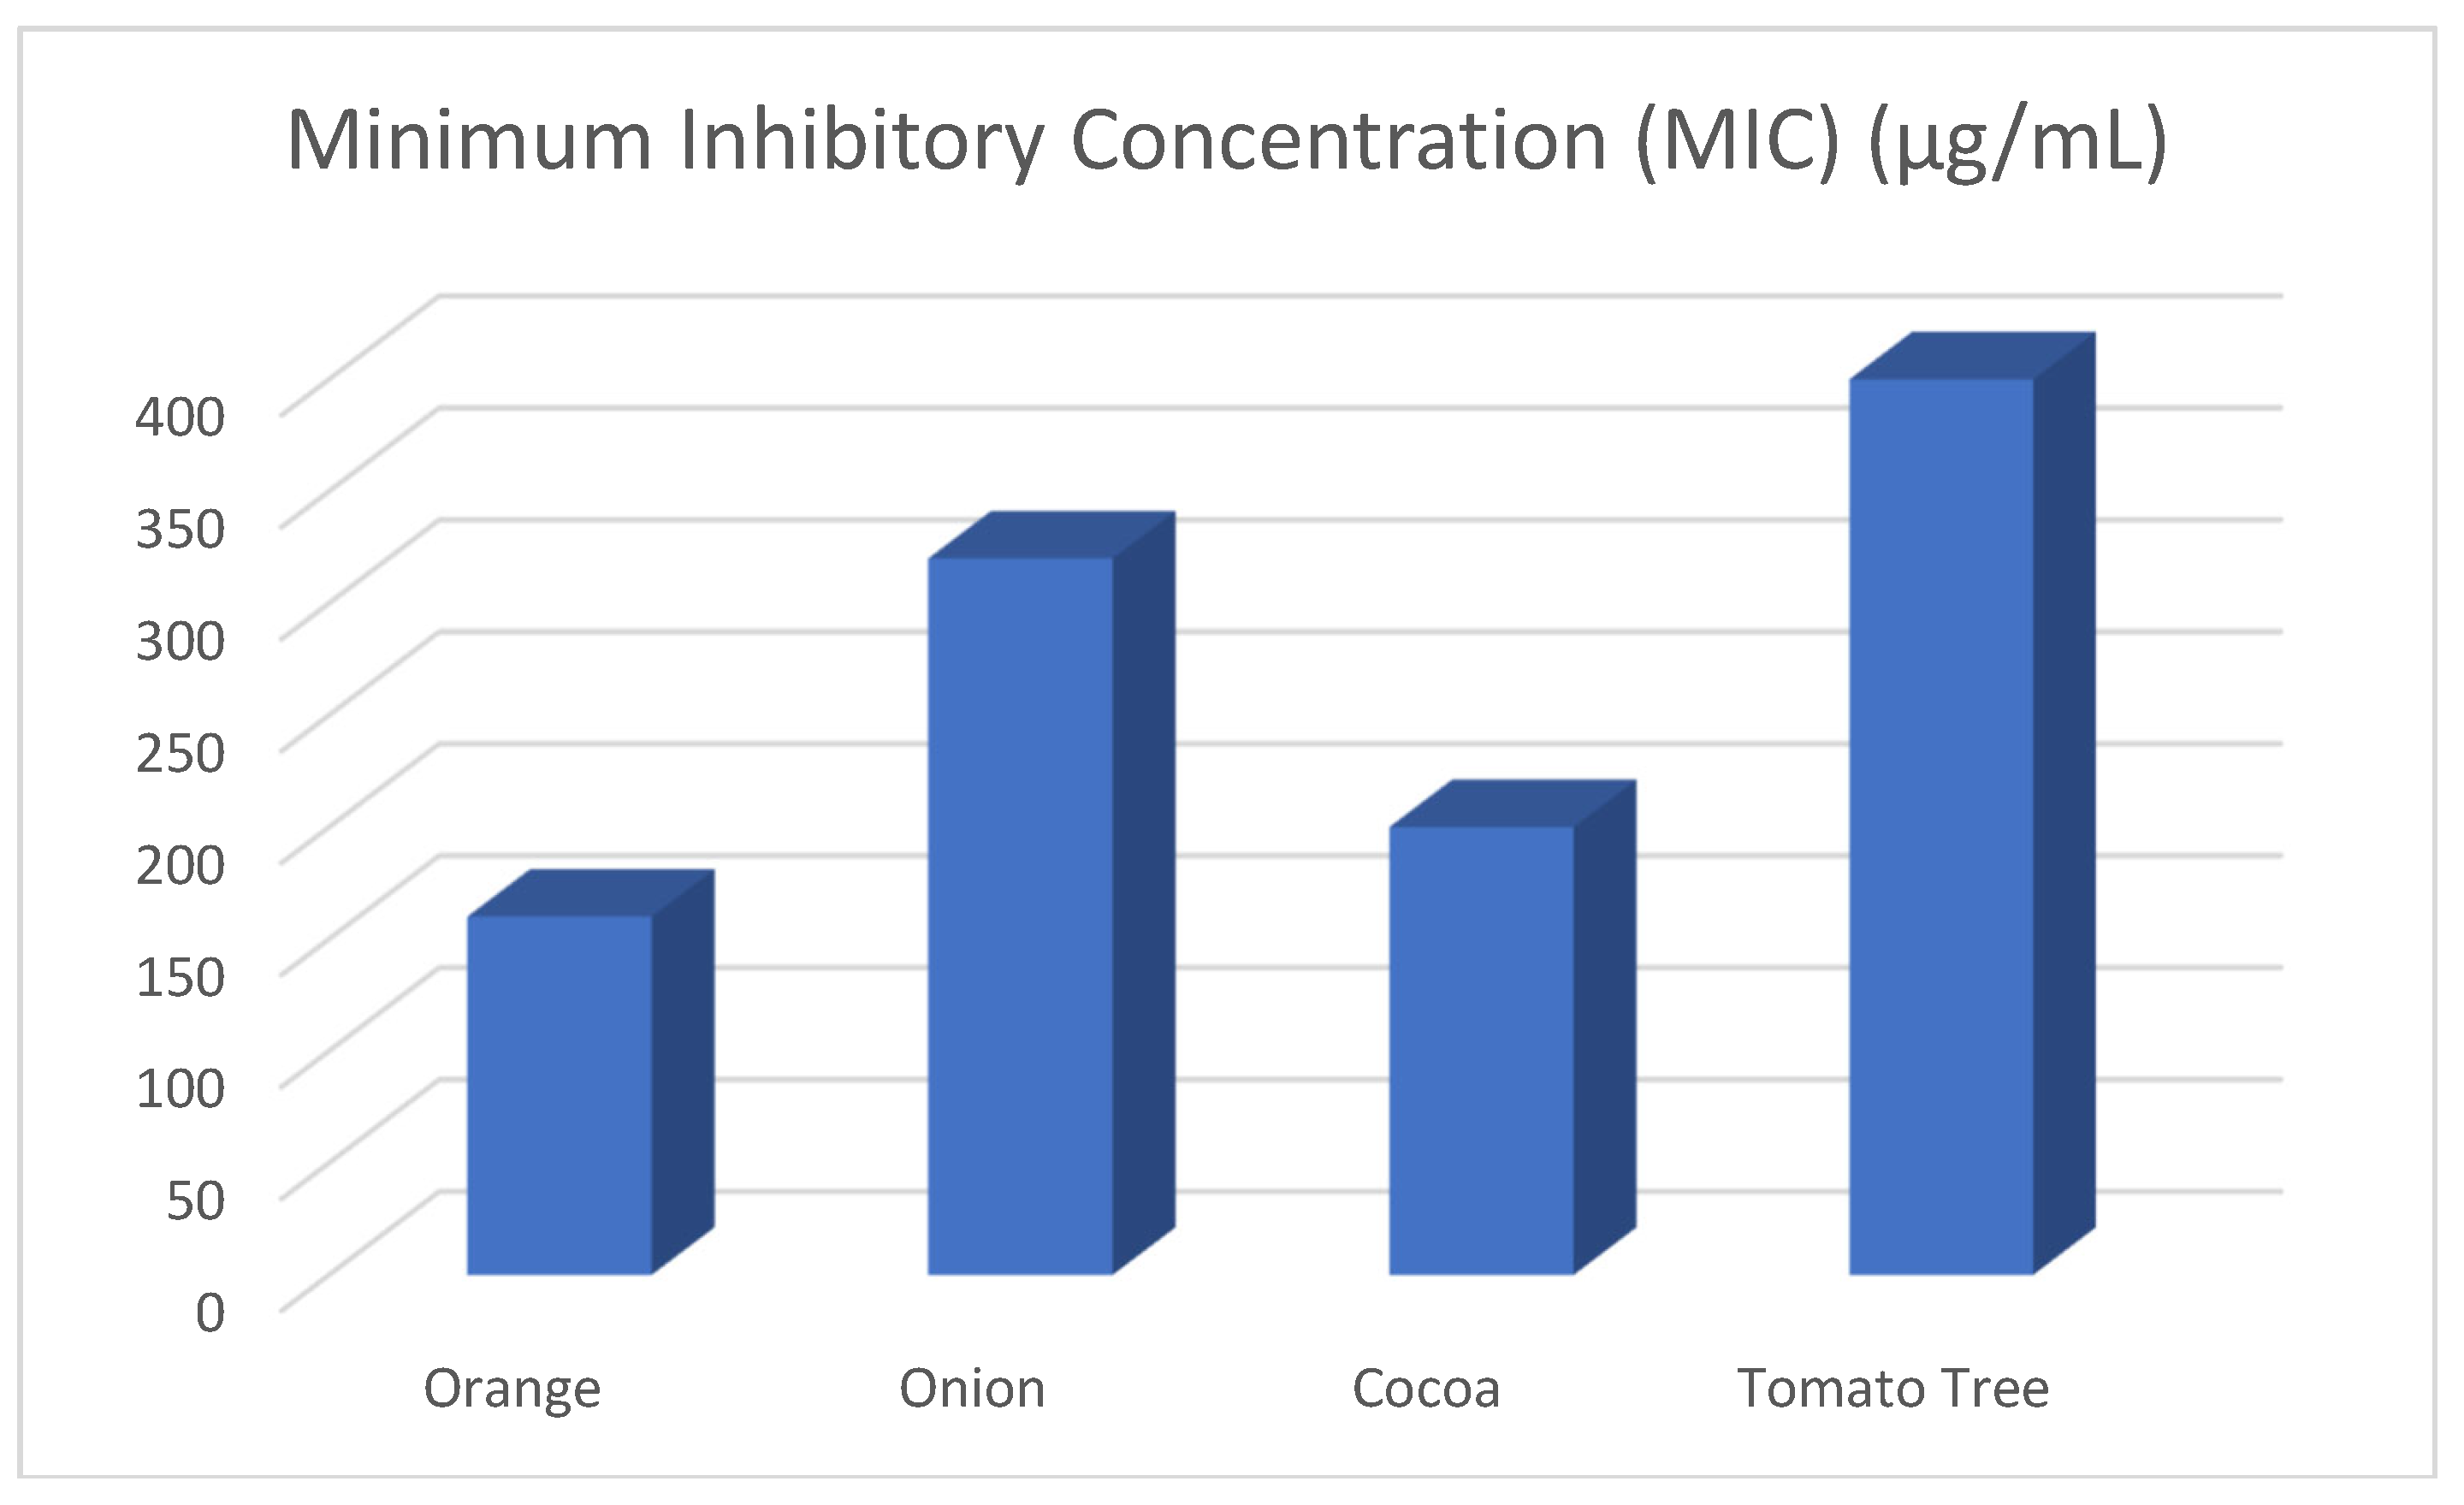
| Extract | Minimum Inhibitory Concen-tration (MIC) (µg/mL) |
|---|---|
| Orange | 300 |
| Onion | 400 |
| Cocoa | 400 |
| Tamarillo | 400 |
Disclaimer/Publisher’s Note: The statements, opinions and data contained in all publications are solely those of the individual author(s) and contributor(s) and not of MDPI and/or the editor(s). MDPI and/or the editor(s) disclaim responsibility for any injury to people or property resulting from any ideas, methods, instructions or products referred to in the content. |
© 2024 by the authors. Licensee MDPI, Basel, Switzerland. This article is an open access article distributed under the terms and conditions of the Creative Commons Attribution (CC BY) license (http://creativecommons.org/licenses/by/4.0/).


