
Submitted:
30 September 2024
Posted:
01 October 2024
You are already at the latest version
Abstract
A simple and sensitive method for Cu²⁺ detection was developed using the Cu⁺-catalyzed alkyne-azide cycloaddition reaction, Fe3O4 magnetic nanoparticles (MNPs) as the reaction platform, and a portable blood glucose meter (PGM) as the detection method. Gold nanoparticles (AuNPs) were labeled with glucose oxidase (GOx) and alkyne-functionalized and terminally thiolated ssDNA (C1). In the presence of Cu²⁺ and ascorbate, the functionalized AuNPs were captured onto MNPs modified with azide-functionalized ssDNA (C2) via the Cu⁺-catalyzed alkyne-azide cycloaddition reaction. GOx on the AuNPs surface oxidized glucose (Glu) into gluconic acid and H2O2, reducing the Glu content in the reaction solution, which was quantitatively detected by the PGM. Under optimal conditions, the PGM response of the system showed a good linear relationship with the logarithm of Cu²⁺ concentration in the range of 0.05 to 10.00 μmol/L, with a detection limit of 0.03 μmol/L (3σ). In actual tap water samples, the spiked recovery rate of Cu²⁺ was between 92.30% and 113.33%, and the relative standard deviation was between 0.14% and 0.34%, meeting the detection requirements for Cu²⁺ in real water samples.
Keywords:
Personal glucose meter
; Copper ion
; Fe3O4 magnetic nanoparticles
; Alkyne-azide cycloaddition reaction
1. Introduction
Copper, apart from Fe²⁺ and Zn²⁺, is the third essential trace element required by the human body and is also a crucial component of body reductases, participating in various oxidation-reduction reactions within the human body, thus holding significant physiological functions[1]. Adequate Cu²⁺ can promote the synthesis of hemoglobin, facilitate hematopoietic function, maintain the normal physiological functions of bones, blood vessels, and skin, boost metabolism, and enhance cellular immunity, among other benefits. Nevertheless, prolonged exposure to high levels of Cu²+-based toxins can result in gastrointestinal discomfort, as well as potential harm to the liver, kidneys, and may lead to various neurological disorders[2,3,4,5]. The World Health Organization (WHO), the United States Environmental Protection Agency (EPA), and the Chinese Ministry of Health have set the maximum allowable levels of Cu²⁺ in drinking water at 2 mg/L, 20 μmol/L and 1 mg/L, respectively[6]. Currently, methods for detecting Cu²⁺ primarily include stripping voltammetry[7], atomic absorption spectroscopy[8], electrochemical methods[9], photoelectrochemical methods[10], and fluorescence analysis[11]. While these methods exhibit good selectivity and high sensitivity, they are associated with expensive instruments, complex sample preparation, and high detection costs. Therefore, there is an urgent need to develop a rapid, sensitive, operationally simple, and high-throughput screening method for the real-time detection of Cu²⁺.
The personal glucose meter (PGM) serves as an optimal portable detection platform owing to its advantages of portability, short analysis time, low cost, ease of operation and reliable quantitative results[12,13], and it has been found application in the detection of various analytes, including ions[14,15], small molecules[16], nucleic acids[17], proteins[18], etc. The Cu+-catalyzed alkyne-azide cycloaddition reaction entails the reaction between an alkyne and an azide group, resulting in the formation of a 1,2,3-triazole under the catalysis of Cu+[19]. A trace amount of Cu+, produced through the reduction of Cu2+ in the presence of sodium ascorbate, serves as a catalyst, facilitating the efficient conjugation between the azide and alkyne groups, thereby providing a crucial copper-mediated signal for the detection of Cu2+[20].
In this study, we have developed a method for the detection of Cu2+ using a portable glucose meter as the detection device. The approach utilizes MNPs as an efficient carrier for immobilizing ssDNA probes modified with alkyne, gold nanoparticles (AuNPs) labeled with azide group modified ssDNA and glucose oxidase were served as signal transduction labels. The recognition element for target Cu2+ is based on the Cu+-catalyzed azide-alkyne cycloaddition which result in chemical ligation of ssDNA modified with alkyne and azide groups. Compared to other Cu2+ sensors, this method utilizes magnetic nanoparticles as efficient carriers for the bio-recognition element, allowing for rapid isolation and enrichment of target molecules from complex samples, thereby reducing interference effects on the detection signal. The utilization of a portable glucose meter as the detection tool offers advantages such as simplicity of operation, low cost, portability, and ease of use without the need for specialized training. This approach addresses the limitations of traditional instrumental analytical methods and presents a novel avenue for the development of portable Cu2+ detection devices.
2. Materials and Methods
2.1. Reagents and Apparatus
Sodium ascorbate, tris-(hydroxypropyltriazolylmethyl) amine (THPTA), HAuCl4·H2O, Triton X-100, 3-aminopropyltriethoxysilane (APTES), tetraethoxysilane (TEOS), Triton X100, Ammonium hydroxide, 1-(3-(dimethylamino)-propyl)-3-ethylcarbodiimidehydro-chloride (EDC) and N-hydroxysulfosuccinimide sodium salt (sulfo-NHS) were purchased from Sigma-Aldrich (St. Louis, MO, USA). Sodium citrate, CuCl2·2H2O, Fe Cl 3·6H2O, Fe SO4·7H2O and other metal salts were obtained from Sinopharm Chemical Reagent Co., Ltd. (Shanghai, China). GOx was purchased from Sangon Biotech (Shanghai, China). The oligonucleotides probe was synthesized by Sangon Biotech (Shanghai, China), and the sequences of the oligonucleotides were listed as follows:C1: 5′-COOH-TAGTCTGATTGC- azide-3′; C2: 5′- alkyne -ATCCTTATCAAT- SH -3′. Personal glucose meter and testing strips were provided by Acon Biotech Co., Ltd. (Hangzhou, China).
Transmission electron microscopy observations were carried out using the FEI Tecnai F20 microscope (Hillsboro, USA). Particle Size and Zeta potential were collected on a Zetasizer Nano ZS-90 (Malvern Instruments Ltd., UK). The ultraviolet visible absorption spectrum was measured using a UV-2600 ultraviolet spectrophotometer (Shimadzu, Kyoto, Japan). The magnetic property was analyzed by LakeShore 7404 Vibrating Sample Magnetometer (LakeShore, USA). Fourier Transform Infrared (FT-IR) spectroscopy was collected on an Avatar370 Fourier Infrared Spectrometer (Thermo Nicolet, USA).
2.2. Synthesis of MNPs-NH2 Nanoparticles
MNPs were prepared by co-precipitation method reported by Cao et al. [21]. 0.02 M of Fe Cl 3·6H2O and 0.01 M of Fe SO4·7H2O were dissolved in 200 mL of deionized water, heated to 85°C under nitrogen protection with continuous stirring. Then, 10 mL of ammonia hydroxide was rapidly injected into the system, and the mixture was heated for 25 minutes before cooling to room temperature. The black precipitate was washed repeatedly with ethanol and deionized water, and finally vacuum dried into powder at room temperature.
Then, the Fe3O4 MNPs were coated with silica by the reverse microemulsion method as previously described[22] with the following modifications. A reverse microemulsion system was composed of 75 mL of cyclohexane, 18 mL of n-hexanol, 17.7 mL of Triton X100, and 5 mL of water. Approximately 2 mg of dried MNPs was dispersed into the microemulsion with sonicated for about 10 minutes, and thoroughly stirred for 1 h. Ammonium hydroxide (0.6 mL, 28%) and tetraethoxysilane (TEOS) (1 mL) were then added sequentially to initiate hydrolysis, and the reaction continued for 12 hours to produce silica-coated magnetic nanoparticles.
Finally, 1 mL of 3-aminopropyltriethoxysilane (APTES) was added, and the reaction continued for another 12 h at room temperature. The final product (MNPs-NH2) was collected magnetically, washed 5 times with ethanol and water, and then vacuum dried form a powder.
2.3. Preparation of the MNPs-NH2-C1 Conjugates
In order to prepare MNPs-NH2-C1, 1mL MNPs-NH2 (1mg/mL) suspension was added 2 mg EDC and 3 mg NHS and kept stirring for 1 hour. Then the mixture was magnetically separated to remove the excessive EDC and NHS and was dispersed into 50 mM PBS (pH = 7.5) buffer. Addition of 50 μL of C1 (5 μmol/L) to the aforementioned solution was followed by overnight stirring at room temperature. After magnetic separation, the precipitate (MNPs-NH2-C1) was dispersed in 1 mL of PBS (pH = 7.5, 50 mmol/L) and stored at 4°C for later use.
2.4. Preparation of AuNPs-GOx-C2 Conjugates
The method in reference [23] was used to synthesize AuNPs. 1 mL of 1% (w/w) HAuCl4·4H2O was placed in a round-bottom flask, followed by the addition of 100 mL of deionized water. The mixture was refluxed to boiling under vigorous stirring, and then 0.75 (47.5 nm) mL of 1% (w/w) sodium citrate was quickly added, changing the color from light yellow to wine red. After cooling to room temperature, it was stored at 4°C. A 1 mL solution of AuNPs was taken and adjusted to pH 8.0-9.0 with Na2CO3 (0.01 mol/L), followed by the addition of 400 μL of GOx (1 mg/mL) and 100 μL of C2 (5 μmol/L). The mixture was reacted overnight at 4°C, centrifuged, and the precipitate (AuNPs-GOx-C2) dispersed in 1 mL of 50 mmol/L PBS (pH = 7.5) at 4°C for storage and subsequent use [24].
2.5. PGM Measurement toward Target Cu2+
Take 100 μL of AuNPs-GOx-C2 and place it in a centrifuge tube. Add 100 μL of MNPs-NH2-C1 and 100 μL of different concentrations of Cu2+ (100 nmol/L), then add 2 μL of 1mM THPTA and 2 μL of 600 μM sodium ascorbate. Incubate at room temperature for 45 minutes. Perform magnetic enrichment, wash the precipitate once with deionized water. Add 50 μL of Glu solution (20 mmol/L) and incubate at 37°C for 50 min. After magnetic enrichment, take 5 μL of the supernatant and drop it onto a PGM test strip, and record the PGM signal value.
3. Results and Discussion
3.1. The Principle of of PGM-Based Cu2+ Sensing Platform
The principles of the PGM for Cu2+ detection is shown in Figure 1. Two oligonucleotides, C1, which contains an azide group at 3′ end and is carboxy modified at 5′ end and C2, which contains an alkyne group at 3′ end and is thiol-modified at 5′ end, were designed. Firstly, C1 is fixed to the amino-functionalized nanomagnetic bead surface via an amide bond, forming the MNPs-NH2-C1 complex. Simultaneously, C2 and GOx are respectively covalently decorated on the AuNPs surface via Au-S and Au-N bonds, forming the AuNPs-GOx-C2 complex. When Cu2+ and a reductant (sodium ascorbate) are present, Cu+-catalyzed azide-alkyne cycloaddition would result in chemical ligation of C1 and C2, which allowing MNPs-NH2-C1 to capture the AuNPs-GOx-C2 complex. GOx on the surface of AuNPs-GOx-C2 complex catalyzes the oxidation of Glu to gluconic acid and H2O2, leading to a decrease in Glu concentration in the reaction solution, which is quantitatively monitored using PGM. With the increase in Cu2+ concentration, the amount of AuNPs-GOx-C2 complex captured by MNPs-NH2-C1 also increases, resulting in a decrease in Glu concentration in the reaction solution (PGM reading), thus establishing an inverse relationship between Cu2+ concentration and PGM reading.
3.2. Characterization of MNPs-NH2-C1 Conjugate
To realize our design, the most fundamental prerequisite for the successful construction of MNPs-NH2-C1 is essential. TEM, Zeta potential, UV-VIS absorbance, VSM and FTIR were carried out to characterize the morphology of MNPs-NH2-C1 nanoparticles. Figure 2a shows that most of the particles are core-shell and spherical, and the average size of the nanoparticles are 71.26 ±4.23 nm after modified.
The Zeta potential measurements are shown in Figure 2b, upon SiO2 modification, the magnetic beads exhibited a Zeta potential of -32.1 mV, attributed to the introduction of negatively charged silanol groups (SiO-). Following the subsequent modification with amino groups (-NH2), the Zeta potential shifted positively to -25.2 mV. Further conjugation of the probe C1 to the MNPs resulted in the Zeta potential returning to approximately -30.3 mV, due to the negatively charged nucleic acid backbone[25].
UV-VIS absorbance spectroscopy was conducted to certify the successful preparation of MNPs-NH2-C1. As shown in Figure 2c, MNPs exhibit no significant absorption peaks, and the background signal is weak (curve a). After C1 is modified on the MNPs surface through an amide bond, a characteristic absorption peak of DNA appears at 260 nm, which is consistent with the results reported previously[26].
The magnetic property of the MNPs-NH2-C1 nanocomposite is an important characteristic for Cu²⁺ detection. The magnetic hysteresis curve of MNPs shown in Figure 2d displays a typical curve for superparamagnetic nanomaterials without any hysteresis. Although silanization then further modification with oligonucleotide C1 could weaken the magnetic saturation value of the sample, the magnetic property of the MNPs-NH2-C1 nanocomposite is still strong enough to achieve rapid separation within 3 minutes using a permanent magnet.
Moreover, the synthesis and modification of MNPs were confirmed by FTIR spectroscopy. As shown in the Figure 2e, the strong absorption band around 580 cm-1 arises from Fe–O stretching. The asymmetric stretching vibration of the Si–O–Si bond at 1066 cm-1 and the symmetric stretching vibration at 850 cm-1 indicate that silica has successfully coated the surface of MNPs through the hydrolysis of TEOS. The absorption band at 2930 cm-1 is attributed to CH3 in APTES, while the two bands at 3460 cm-1 and 1578 cm-1 are attributed to the N-H stretching and bending vibrations of free –NH2, respectively. These findings suggest that –NH2 groups have been bonded onto the surface of silica-coated MNPs through a reaction between –OH and APTES[22]. Furthermore, the characteristic peaks observed between 1600-1700 cm-1 corresponding to the stretching vibrations of C=O and C=N bonds in the bases[26], as well as the characteristic absorption peak at 2100 cm-1 from the stretching vibration of the azide compound N=N=N group[27], indicate that the azide-modified single-stranded nucleic acids have been successfully modified onto the MNPs surface.
3.3. Characterization of AuNPs-GOx-C2 Conjugate
As described above, the hydrolysis of glucose is mediated by glucose oxidase immobilized on the AuNPs-GOx-C2 nanocomplex. Therefore, the successful preparation of AuNPs-GOx-C2 is crucial. The transmission electron microscopy image of the AuNPs-GOx-C2 complex, shown in Figure 3a, indicates that the nanostructures of the complex were uniformly dispersed in the buffer, which provides a precondition for the development of the assay method. Additionally, we used dynamic light scattering to study the size of the gold nanoparticles before and after the reaction with glucose oxidase and C2. As seen in Figure 3b, the average size of the nanoparticles increased from 46.25±2.24 to 53.45 ±3.17 nm, and the increase in size was due to the labeled proteins, consistent with the results reported in the literature[28]. The Zeta potential of AuNPs-GOx-C2 (−37.5 mV) altered obviously compared to AuNPs (−33.6 mV), demonstrating successful modification of C2 and GOx with AuNPs (Figure 3c)[29]. To further verify the presence of the proteins on the nanocomplex, we used UV–vis absorption spectroscopy to investigate the AuNPs-GOx-C2. As is well known, the characteristic absorption peaks of gold colloids, proteins, and oligonucleotides are 520 nm, 280 nm, and 260 nm, respectively [30]. As seen from Figure 3d, the synthesized nanocomposite had two distinct absorption peaks at 520 nm and 280 nm. However, possibly due to the relatively less amount of labeled oligonucleotide, we did not observe the characteristic peak of the oligonucleotide[31].
3.4. Feasibility Analysis
As shown in Figure 4, when MNPs-NH2-C1 is present alone, the PGM value (column b) is not significantly different from column a, indicating that MNPs-NH2-C1 has no oxidation effect on Glu. When AuNPs-GOx-C2 is added, MNPs-NH2-C1 does not undergo a cycloaddition reaction with AuNPs-GOx-C2, and the PGM value (column c) is not significantly changed compared to column a, indicating that GOx-AuNPs-S2 has no significant specific adsorption to MNPs-NH2-C1. When different concentrations of Cu2+ are present (taking 0.1 and 1 μmol/L as examples), MNPs-NH2-C1 and GOx-AuNPs-S2 connect through a cycloaddition reaction, resulting in a significant decrease in the PGM signal, which decreases as the target concentration increases (column d, column e), indicating the feasibility of this experimental approach.
3.5. Optimization of the Experimental Conditions
Since the PGM response comes from the signal value of Glu oxidation by GOx, it is necessary to optimize the ratio of C2 to GOx labeled on the surface of AuNPs. In theory, a high loading of GOx can enhance the sensitivity of the Cu2+ sensor. However, an excess of GOx molecules can affect the cycloaddition reaction between C1 and C2, which is unfavorable for signal response. As shown in Figure 5a, the optimal volume ratio of C2 to GOx is 1:4 for PGM response signal. Therefore, 400 μL of GOx (1 mg/mL) and 100 μL of C2 (5 μmol/L) were used to prepare AuNPs-GOx-C2.
The amount of sodium ascorbate, which used as a reducing agent, and THPTA, which was used to increased Cu+ binding, can affect the efficiency of cycloaddition reaction[32,33]. The relationship between the PGM signal and different concentrations of sodium ascorbate and THPTA were investigated. As the concentration of sodium ascorbate increased, the PGM signal gradually decreased until it plateaued at 600 μM (Figure 5b). Therefore, the optimal concentration of sodium ascorbate was determined to be 600 μM. Meanwhile, A THPTA concentration of 1 mM gave the best sensing performance (Figure 5c).
pH also has a significant impact on cycloaddition reactions[34]. Similar to previous findings [32], the PGM signal remains relatively constant within the pH range of 6.0 to 8.0 and reaches its minimum at pH 7.0 (Figure 5d), hence pH 7.0 conditions were used in the experiment.
The changing of the PGM signal depended on the yield of the click ligation ssDNA product, which corresponded to the reaction time for the Cu+-catalyzed cycloaddition. As shown in Figure 5e, the minimum PGM signal occurs at 45 minutes, with little change thereafter. Therefore, 45 min was chosen as the optimal reaction time.
Glucose hydrolysis is a key factor affecting the PGM signal in the detection system, and the reaction time directly impacts the detection results. As shown in Figure 5f, when the reaction time is less than 50 minutes, the PGM signal gradually decreases with increasing reaction time; after exceeding 50 minutes, the signal stabilizes. Therefore, the optimal hydrolysis time for glucose is 50 minutes.
3.6. Detection of Cu2+ under the Optimum Experimental Conditions
Under the optimal experimental conditions, the response signal of different concentrations of Cu2+ was determined using PGM. As shown in Figure 6a, the PGM signal gradually decreases with increasing concentrations of the target substance Cu2+. Within the range of Cu2+ concentrations from 0.05 to 10.00 μmol/L, there is a good linear relationship between the PGM signal and the logarithm of Cu2+ concentration, with a linear equation of y = -0.95x + 17.21 and an R2 value of 0.9975. The detection limit is 0.03 μmol/L (3σ). This detection limit is lower than the WHO’s (∼30 μmol/L or 2 ppm) [35] and US EPA’s (∼20 μmol/L or 1.3 ppm) [36]maximum allowable amount of Cu2+ in drinking water. Besides, compared to the methods for detecting Cu2+ reported in the Table 1, this method exhibits significant superiority.
Moreover, as shown in Figure 6b, only Cu2+ caused a significant decrease in the PGM signal, while other interfering ions at the same concentration (Zn²⁺, Pb²⁺, Fe²⁺, Mg²⁺, Ca²⁺, and Ba²⁺) did not cause any noticeable signal change, indicating that this method has good selectivity for Cu2+. Subsequently, the relative standard deviations for detecting 0.1, 0.5, and 5.0 μmol/L of Cu²⁺ were 0.8%, 1.2%, and 0.9%, respectively, indicating good reproducibility of this method.
3.7. Detection of Cu2+ in Real Samples
Tap water samples were selected for testing the potential application of our fabricated biosensor. As shown in Table 2, the spiked recovery rates for Cu²⁺ at different added concentrations ranged from 92.30% to 113.33%, with an RSD of 0.14% to 0.34%, indicating excellent practical application ability in real analytical samples.
4. Conclusions
In summary, based on the PGM platform and Cu+-catalyzed click chemistry, a new method for detecting Cu2+ was successfully developed. This method is simple to operate, with good sensitivity and specificity, portability, and low cost, making it suitable for detecting Cu2+ in tap water samples. This study not only provides an effective solution for on-site sample testing but also offers new ideas for the development of portable Cu2+ detectors.
Author Contributions
All authors have made significant contributions. Conceptualization, B.D. and W.L.; methodology, B.D. and H.C.; validation, T.C., A. H and H.C; writing—original draft preparation, B.D. and A. H; writing—review and editing, W.L.; funding acquisition, B.D. and W.L. All authors have read and agreed to the published version of the manuscript.
Funding
This research was funded by This work was supported by the Guizhou Provincial Key Technology R&D Program (QKHZC [2023]009), Guiyang University Xue Ke Ren Cai Fund (GYURC-43(20221.1~2024.12.31))
Institutional Review Board Statement
Not applicable.
Informed Consent Statement
Not applicable.
Data Availability Statement
The original contributions presented in the study are included in the article, further inquiries can be directed to the corresponding author.
Conflicts of Interest
The authors declare no conflicts of interest
References
- Wang, W.; Fu, A.; You, J.; Gao, G.; Lan, J.; Chen, L. Squaraine-based colorimetric and fluorescent sensors for Cu2+-specific detection and fluorescence imaging in living cells. Tetrahedron. 2010, 66, 3695–3701. [Google Scholar] [CrossRef]
- Georgopoulos, P.G.; Roy, A.; Yonone-Lioy, M.J.; Opiekun, R.E.; Lioy, P.J. Environmental copper: Its dynamics and human exposure issues. J Toxicol Env Heal B. 2004, 4, 341–394. [Google Scholar] [CrossRef] [PubMed]
- Hahn, S.H.; Tanner, M.S.; Danke, D.M.; Gahl, W.A. Normal Metallothionein Synthesis in Fibroblasts Obtained from Children with Indian Childhood Cirrhosis or Copper-Associated Childhood Cirrhosis. Biochemical & Molecular Medicine. 1995, 54, 142–145. [Google Scholar]
- Brown, D.R.; Kozlowski, H. Biological inorganic and bioinorganic chemistry of neurodegeneration based on prion and Alzheimer diseases. Dalton Transactions. 1917. [Google Scholar]
- Brewer George, J. The risks of copper toxicity contributing to cognitive decline in the aging population and to Alzheimer’s disease. Journal of the American College of Nutrition. 2009, 28, 238–242. [Google Scholar] [CrossRef]
- Xiao-Hong, M.; Jing-Jing, T.; Yang-Zi, Z.; Zai-Hui, D.U.; Yuan, Z. Wen-Tao XU. Ultrasensitive and Colorimetric Detection of Copper(Ⅱ) Based on Dual-DNAzymes. Chinese Journal of Analytical Chemistry. 2018, 46, 1945–1952. [Google Scholar]
- Si-Si, H.; Xu, Z.; Sha-Hua, Q. [Preconcentration of Trace Cu(II) in Water Samples with Nano-Sized ZnO and Determination by GFAAS]. Guang Pu Xue Yu Guang Pu Fen XI. 2015, 35, 2420–2423. [Google Scholar]
- Chan, M.; Huang, S. Direct determination of cadmium and copper in seawater using a transversely heated graphite furnace atomic absorption spectrometer with Zeeman-effect background corrector. Talanta.
- Min, Qing, Shunbi, et al. Click Chemistry Reaction-Triggered 3D DNA Walking Machine for Sensitive Electrochemical Detection of Copper Ion. Analytical Chemistry. 2018, 90, 11439. [Google Scholar] [CrossRef]
- Mei, L.P.; Jiang, X.Y.; Yu, X.D.; Zhao, W.W.; Xu, J.J.; Chen, H.Y. Cu Nanoclusters-Encapsulated Liposomes: Toward Sensitive Liposomal Photoelectrochemical Immunoassay. Analytical Chemistry. 2018, 90, 2749. [Google Scholar] [CrossRef]
- Liang, G.X.; Liu, H.Y.; Zhang, J.R.; Zhu, J.J. Ultrasensitive Cu2+ sensing by near-infrared-emitting CdSeTe alloyed quantum dots. Talanta. 2010, 80, 2172–2176. [Google Scholar] [CrossRef]
- Lin, B.; Liu, D.; Yan, J. , et al. Enzyme-Encapsulated Liposome-Linked Immunosorbent Assay Enabling Sensitive Personal Glucose Meter Readout for Portable Detection of Disease Biomarkers. ACS Appl Mater Interfaces.
- Gao, X.; Li, X.; Sun, X. , et al. DNA Tetrahedra-Cross-linked Hydrogel Functionalized Paper for Onsite Analysis of DNA Methyltransferase Activity Using a Personal Glucose Meter. Analytical chemistry. 2020, 92, 4592–4599. [Google Scholar] [CrossRef]
- Zhenli, Qiu, Jian, et al. Invertase-labeling gold-dendrimer for in situ amplified detection mercury(II) with glucometer readout and thymine-Hg(2+)-thymine coordination chemistry. Biosensors & bioelectronics. 2016, 77, 681–686. [Google Scholar]
- Ming, J.; Fan, et al. Portable and sensitive detection of copper(II) ion based on personal glucose meters and a ligation DNAzyme releasing strategy. Sensors and Actuators, B Chemical. 2017, 240, 1091–1098. [Google Scholar] [CrossRef]
- Tan, Q.; Zhang, R.; Kong, R.; Kong, W.; Zhao, W.; Qu, F. Detection of glutathione based on MnO2 nanosheet-gated mesoporous silica nanoparticles and target induced release of glucose measured with a portable glucose meter. Microchimica Acta. 2018, 185, 1–7. [Google Scholar] [CrossRef]
- Wu, T.; Cao, Y.; Yang, Y.; Zhang, X.; Zhang, X. Three-Dimensional DNA Walking Machine for Ultrasensitive Dual-Modal Detection of MiRNA with Fluorimeter and Personal Glucose Meter. Nanoscale.
- Ma, X.; Chen, Z.; Zhou, J. , et al. Aptamer-based portable biosensor for platelet-derived growth factor-BB (PDGF-BB) with personal glucose meter readout. Biosensors & Bioelectronics. 2014, 55, 412–416. [Google Scholar]
- VVR; LGG; VVF; KBS. A Stepwise Huisgen Cycloaddition Process- Copper(I)-Catalyzed Regioselective Ligation of Azides and Terminal Alkynes. Angew Chem Int Ed. 2002, 41, 2596–2599. [Google Scholar] [CrossRef]
- Zhang, W.K. Visual Detection of Copper(II) by Azide- and Alkyne-Functionalized Gold Nanoparticles Using Click Chemistry. Angewandte Chemie. 2008, 47, 7454–7456. [Google Scholar]
- Cao, H.; He, J.; Deng, L.; Gao, X. Fabrication of cyclodextrin-functionalized superparamagnetic Fe3O4/amino-silane core–shell nanoparticles via layer-by-layer method. Applied Surface Science. 2009, 255, 7974–7980. [Google Scholar] [CrossRef]
- Bai, Y.; Cui, Y.; Paoli, G.C.; Shi, C.; Wang, D.; Shi, X. Nanoparticles Affect PCR Primarily via Surface Interactions with PCR Components: Using Amino-Modified Silica-Coated Magnetic Nanoparticles as a Main Model. ACS Applied Materials & Interfaces. 2015, 7, 13142–13153. [Google Scholar]
- Byzova, N.A.; Zherdev, A.V.; Khlebtsov, B.N.; Burov, A.M.; Khlebtsov, N.G.; Dzantiev, B.B. Advantages of Highly Spherical Gold Nanoparticles as Labels for Lateral Flow Immunoassay. Sensors. 2020, 20, 3608. [Google Scholar] [CrossRef]
- Shi, W.P.; Cai, J.; Yang, Y.N.; Luo, H.H.; Liu, B.Q.; Qiu-Ping, F.U. Portable Glucose Meter for Detection of Mercury(Ⅱ) Ion. Chinese Journal of Analytical Chemistry. 2019, 47, 1337–1343. [Google Scholar]
- Cao, L.; Zhang, Q.; Dai, H.; Fu, Y.; Li, Y. Separation/Concentration-signal-amplification in-One Method Based on Electrochemical Conversion of Magnetic Nanoparticles for Electrochemical Biosensing. Electroanalysis. 2018, 30, 517–524. [Google Scholar] [CrossRef]
- Fayazi, R.; Habibi-Rezaei, M.; Heiat, M.; Javadi-Zarnaghi, F.; Taheri, R.A. Glycated albumin precipitation using aptamer conjugated magnetic nanoparticles. Scientific Reports. 2020, 10, 10716. [Google Scholar] [CrossRef] [PubMed]
- Lemos, M.F.; Mendes, L.C.; Bohn, M.; Keicher, T. Application of azide-containing molecules as modifiers of HTPB. Journal of Thermal Analysis and Calorimetry. 2019, 137, 411–419. [Google Scholar] [CrossRef]
- Lin, Y.; Zhou, Q.; Lin, Y.; Tang, D.; Niessner, R.; Knopp, D. Enzymatic Hydrolysate-Induced Displacement Reaction with Multifunctional Silica Beads Doped with Horseradish Peroxidase–Thionine Conjugate for Ultrasensitive Electrochemical Immunoassay. Analytical Chemistry. 2015, 87, 8531–8540. [Google Scholar] [CrossRef]
- Zhou, J.; Duan, L.; Huang, J.; et al. Portable detection of colorectal cancer SW620 cells by using a personal glucose meter. Analytical Biochemistry. 2019, 577, 110–116. [Google Scholar] [CrossRef]
- Tang, D.; Liu, B.; Niessner, R.; Li, P.; Knopp, D. Target-Induced Displacement Reaction Accompanying Cargo Release from Magnetic Mesoporous Silica Nanocontainers for Fluorescence Immunoassay. Analytical Chemistry. 2013, 85, 10589–10596. [Google Scholar] [CrossRef]
- Zhang, J.; Tang, Y.; Teng, L.; Lu, M.; Tang, D. Low-cost and highly efficient DNA biosensor for heavy metal ion using specific DNAzyme-modified microplate and portable glucometer-based detection mode. Biosensors and Bioelectronics. 2015, 68, 232–238. [Google Scholar] [CrossRef]
- Ge, C.; Chen, X.; Wang, D. An array of femtoliter wells for sensitive detection of copper using click chemistry. Talanta. 2024, 274, 125973. [Google Scholar] [CrossRef]
- Wang, Y.; Wang, L.; Xue, J.; et al. Signal-Amplified Lateral Flow Test Strip for Visual Detection of Cu2+. PLOS ONE. 2017, 12, e0169345. [Google Scholar] [CrossRef]
- Shen, Q.; Li, W.; Tang, S.; et al. A simple “clickable” biosensor for colorimetric detection of copper(II) ions based on unmodified gold nanoparticles. Biosensors and Bioelectronics. 2013, 41, 663–668. [Google Scholar] [CrossRef]
- Organization, WH. Guidelines for Drinking-Water Quality. 2004.
- Agency USEP. National Primary Drinking Water Regulations. 2009.
Figure 1.
Schematic diagram of Cu2+ detection based on portable glucose meter MNP: Fe3O4 nano-magnetic beads; AuNPs: Gold nanoparticle; GOx: Glucose oxidase; Glu: Glucose.
Figure 1.
Schematic diagram of Cu2+ detection based on portable glucose meter MNP: Fe3O4 nano-magnetic beads; AuNPs: Gold nanoparticle; GOx: Glucose oxidase; Glu: Glucose.
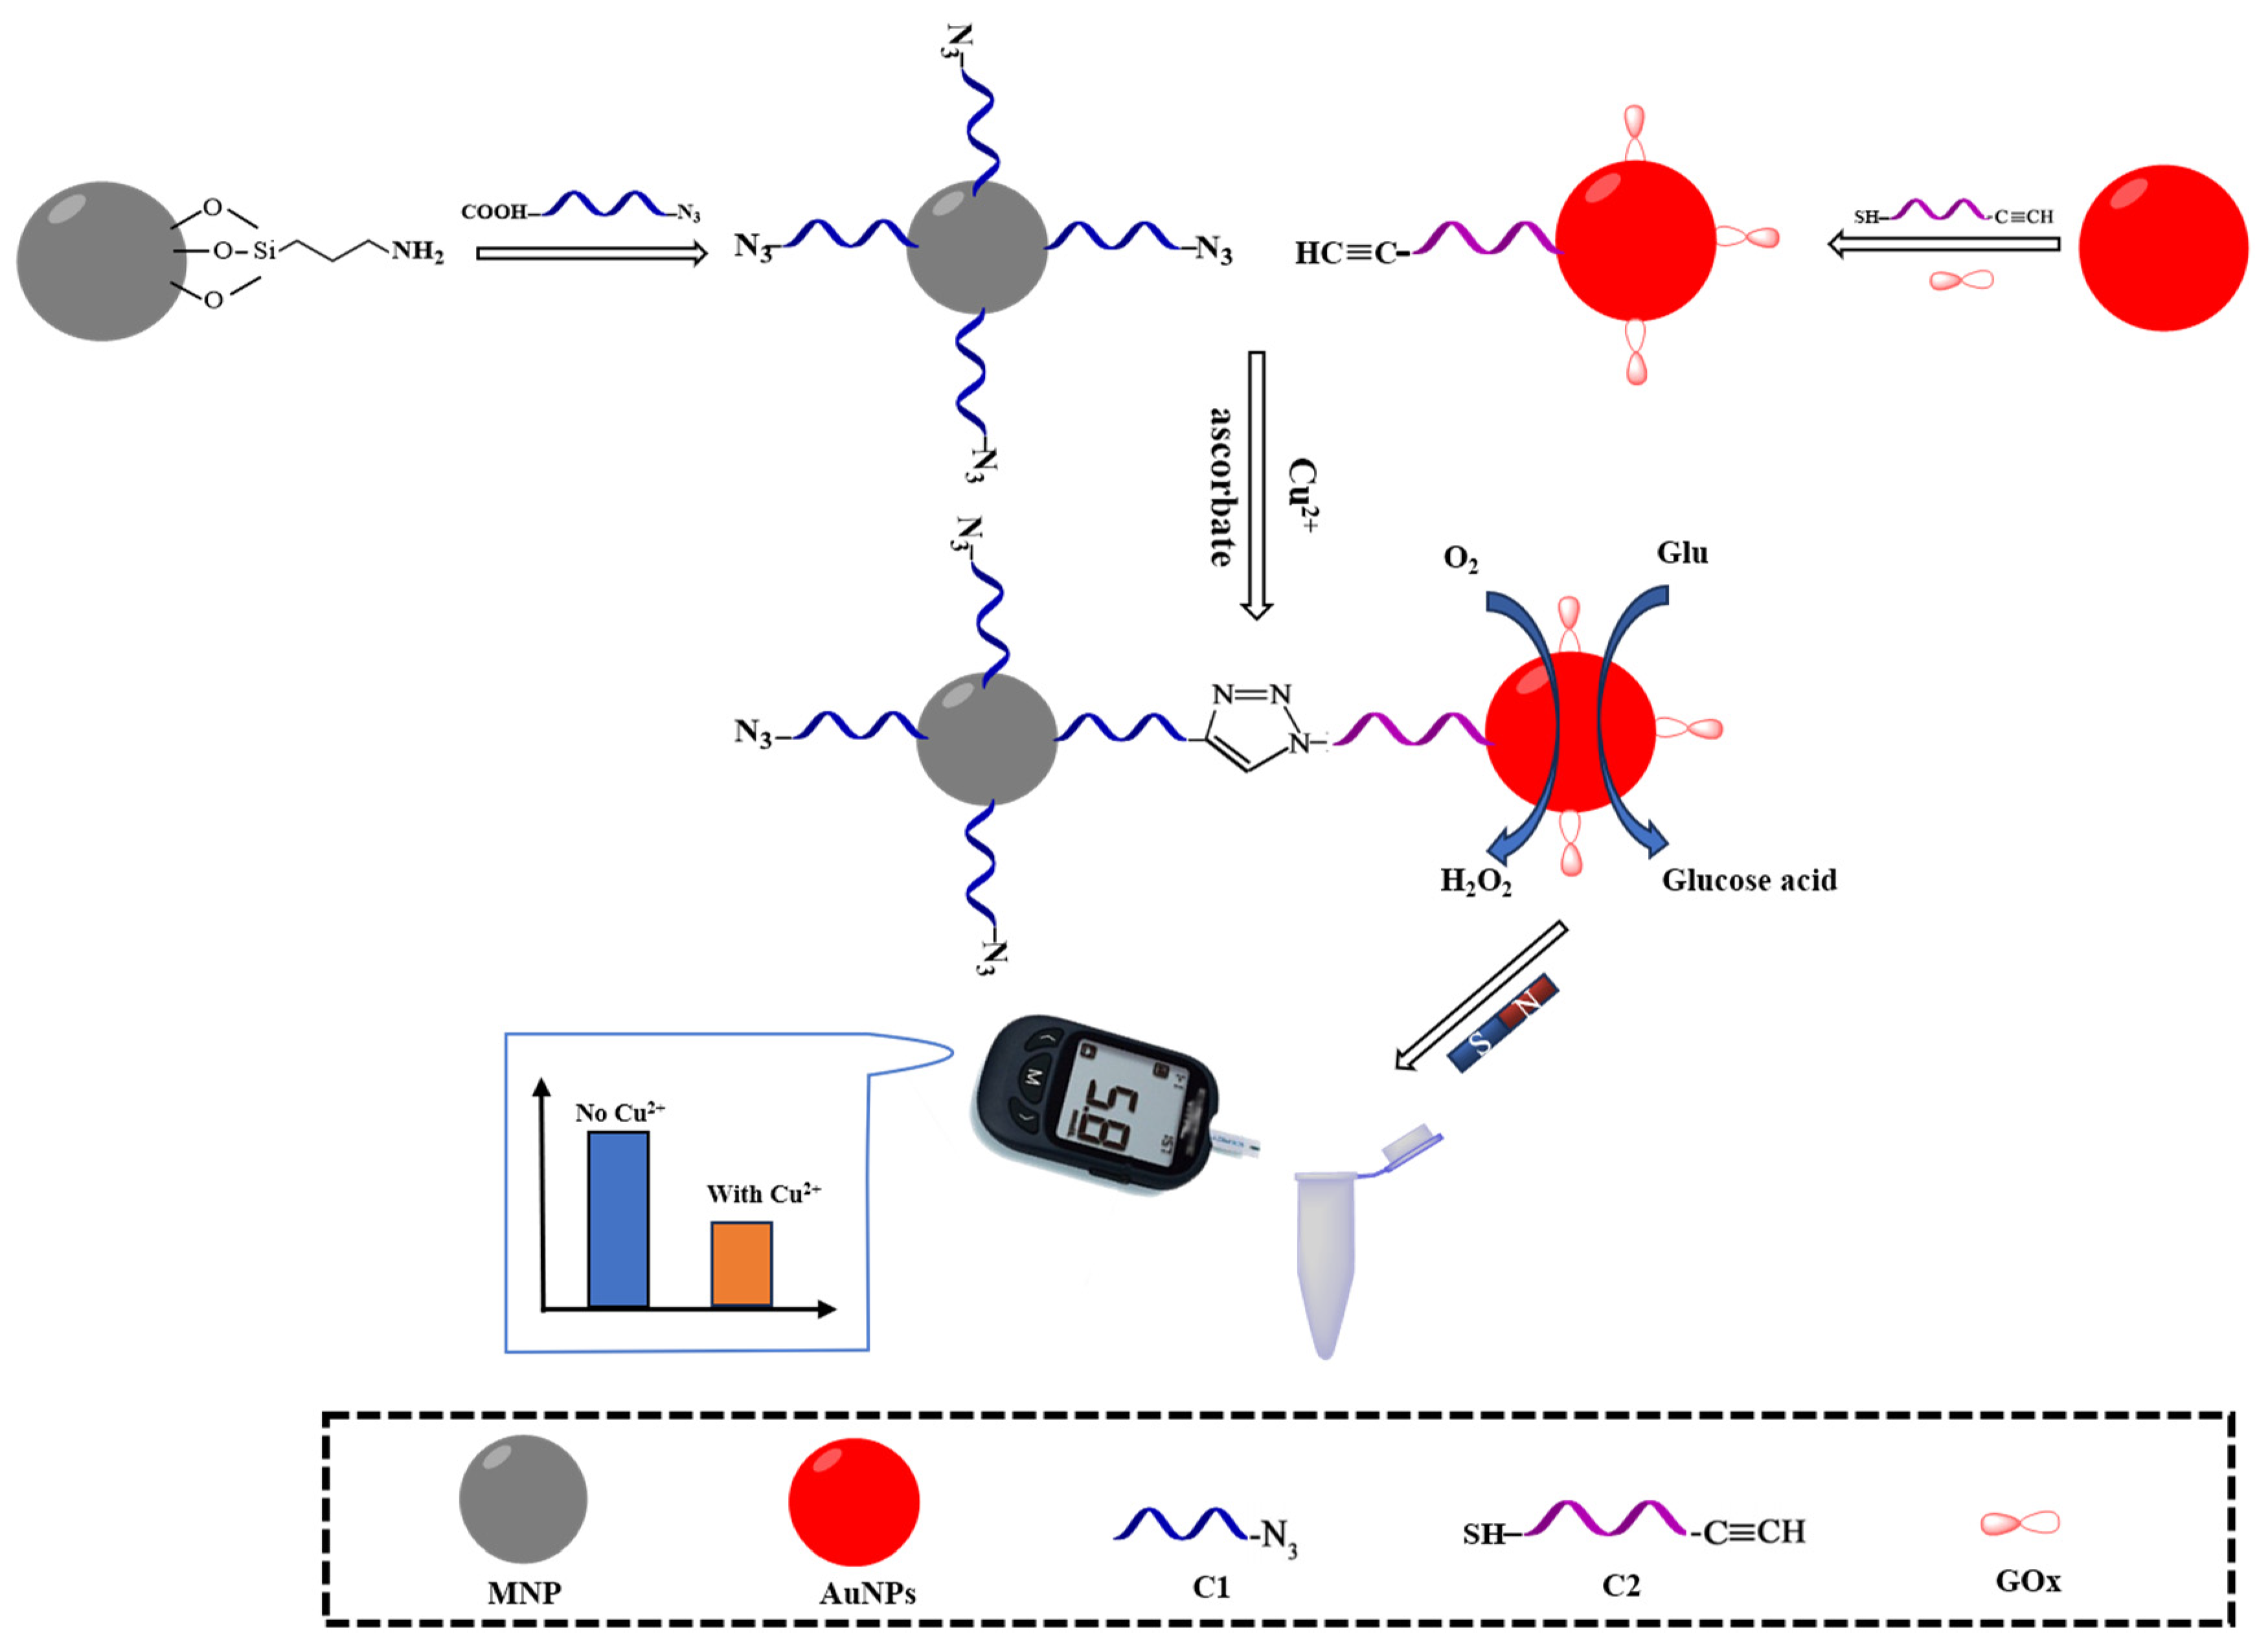
Figure 2.
(a) TEM image of MNPs-NH2-C1, (b) VSM magnetization curve of MNPs, MNPs-CH2 and MNPs-NH2-C1, (c) Zeta potentials of MNPs, MNPs-CH2 and MNPs-NH2-C1, (d) UV-Vis absorbance spectroscopy of MNPs and MNPs-NH2-C1 and (e) FTIR of MNPs and MNPs-NH2-C1.
Figure 2.
(a) TEM image of MNPs-NH2-C1, (b) VSM magnetization curve of MNPs, MNPs-CH2 and MNPs-NH2-C1, (c) Zeta potentials of MNPs, MNPs-CH2 and MNPs-NH2-C1, (d) UV-Vis absorbance spectroscopy of MNPs and MNPs-NH2-C1 and (e) FTIR of MNPs and MNPs-NH2-C1.
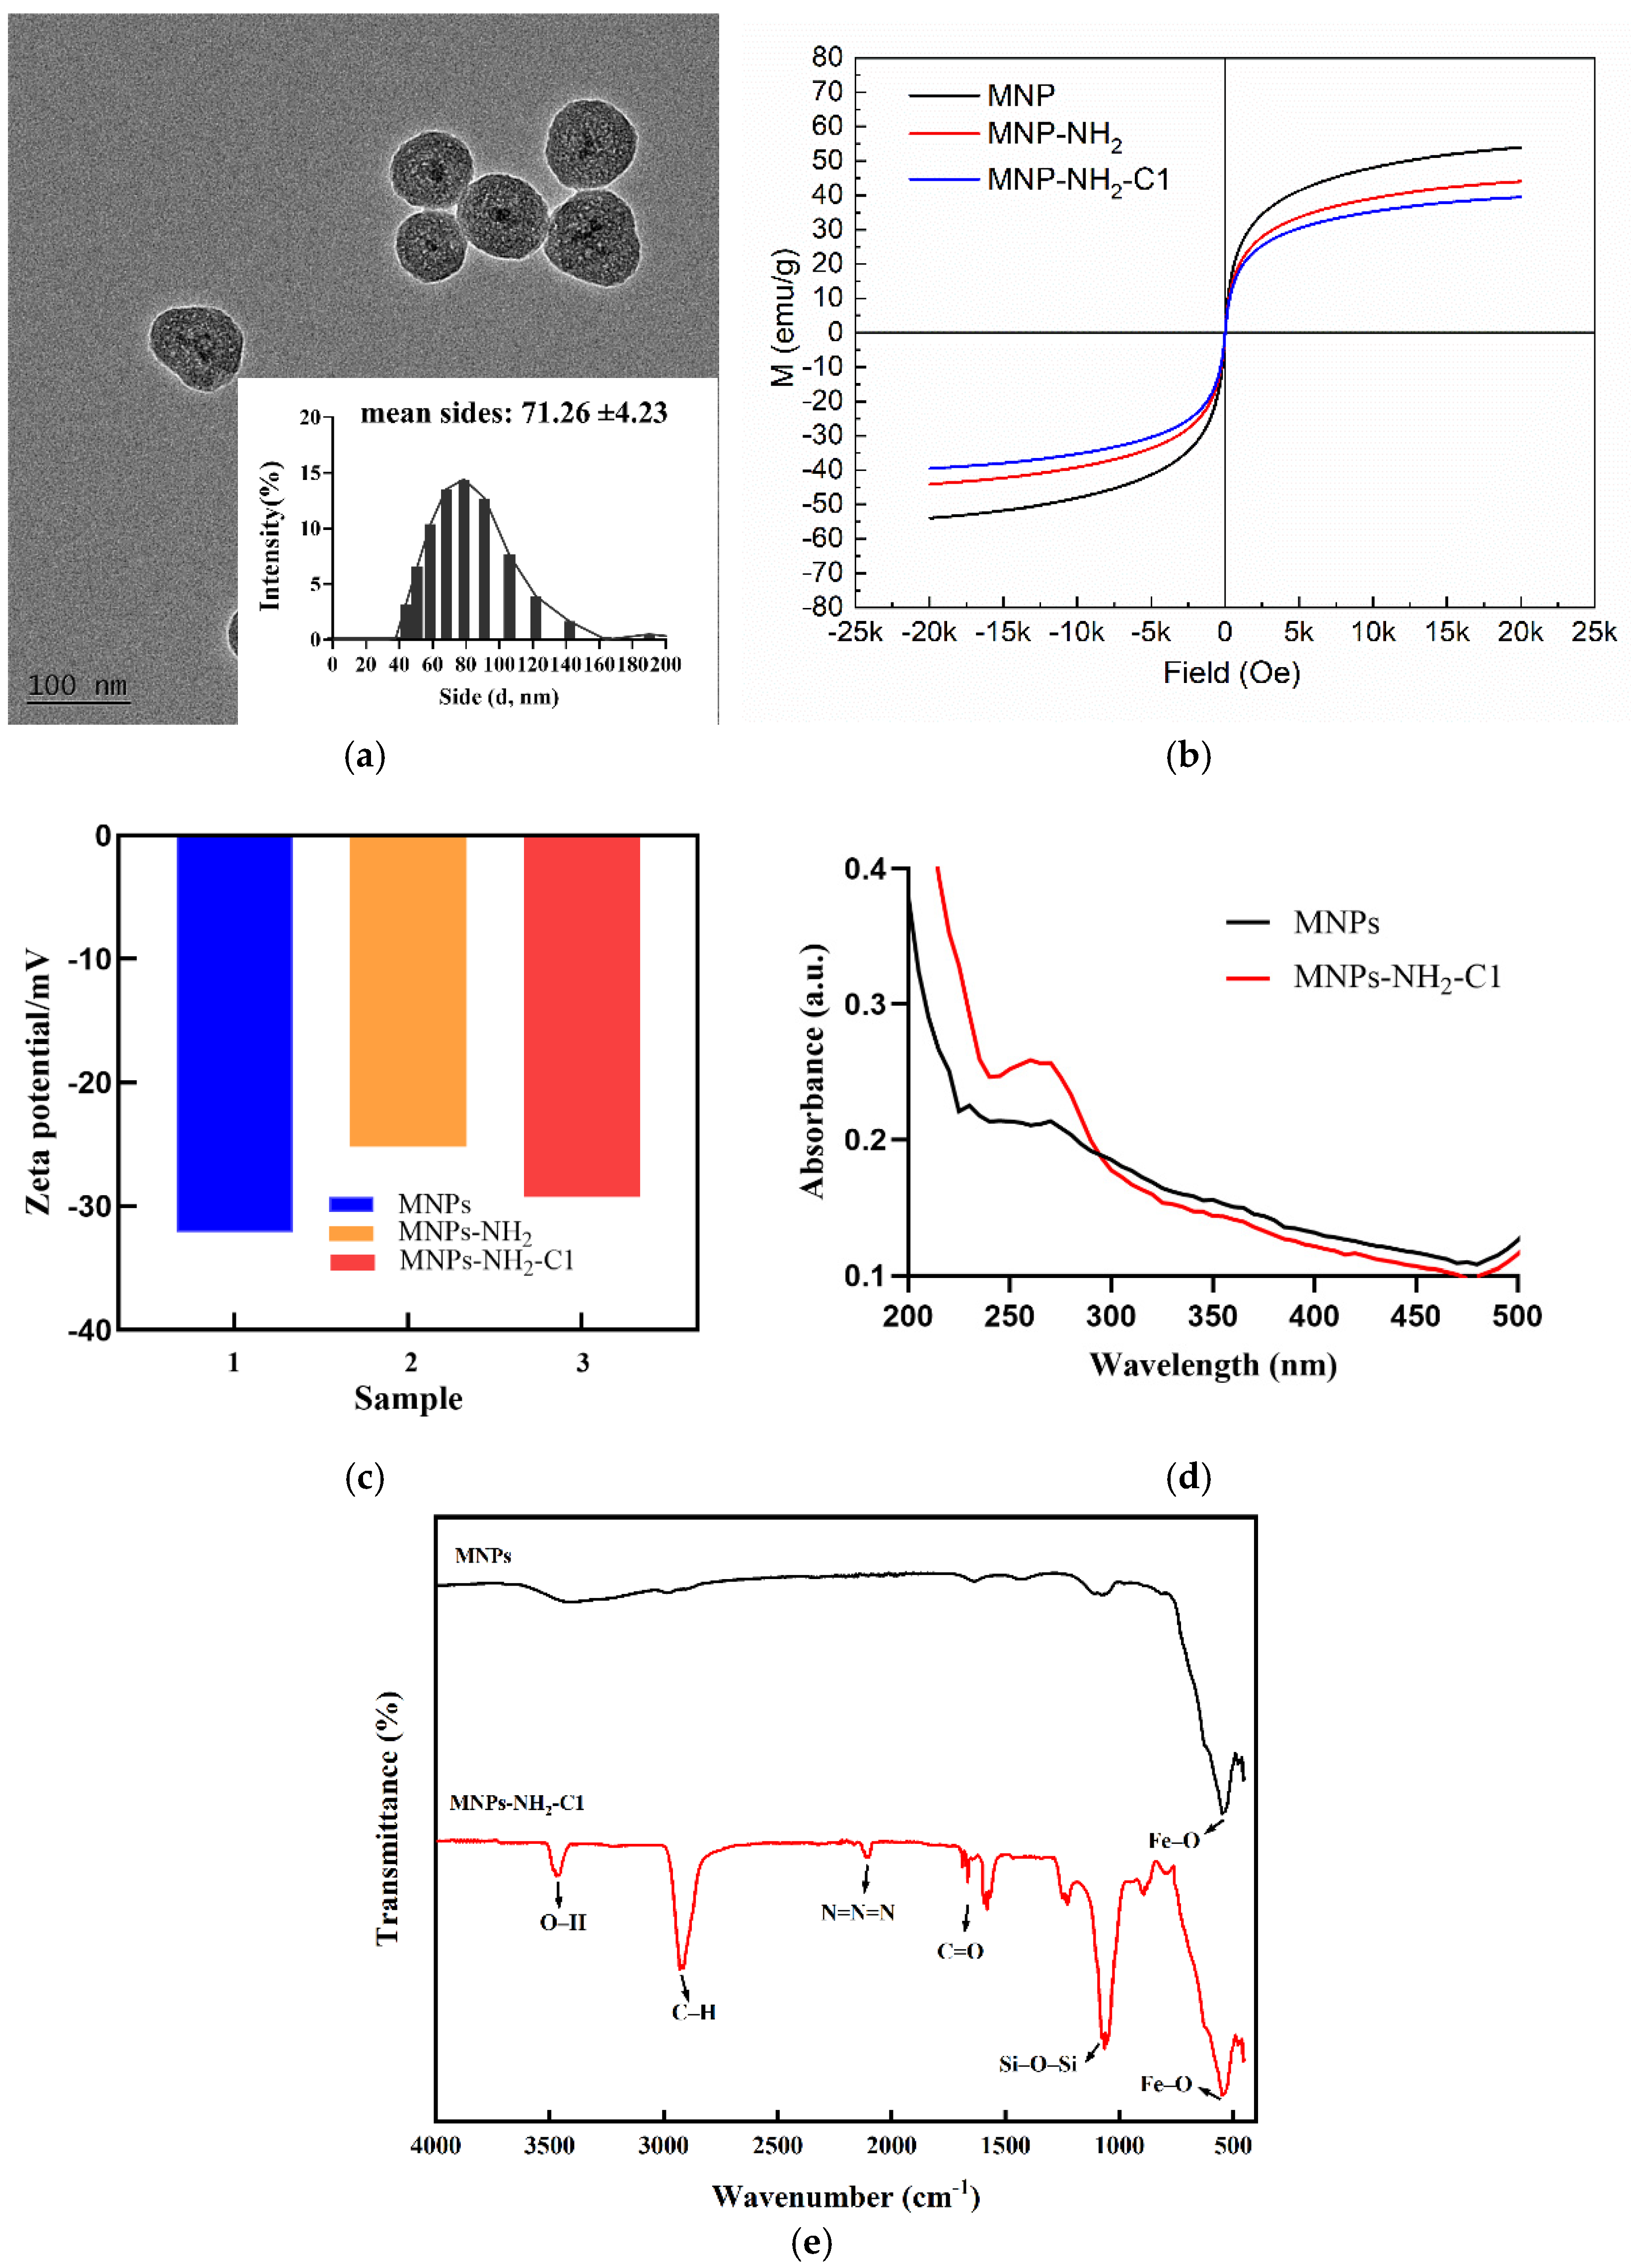
Figure 3.
(a) TEM image of AuNPs-GOx-C2, (b) Size distribution of AuNPs and AuNPs-GOx-C2, (c) Zeta potentials of AuNPs and AuNPs-GOx-C2 and (d) UV-Vis absorbance spectroscopy of AuNPs and AuNPs-GOx-C2.
Figure 3.
(a) TEM image of AuNPs-GOx-C2, (b) Size distribution of AuNPs and AuNPs-GOx-C2, (c) Zeta potentials of AuNPs and AuNPs-GOx-C2 and (d) UV-Vis absorbance spectroscopy of AuNPs and AuNPs-GOx-C2.
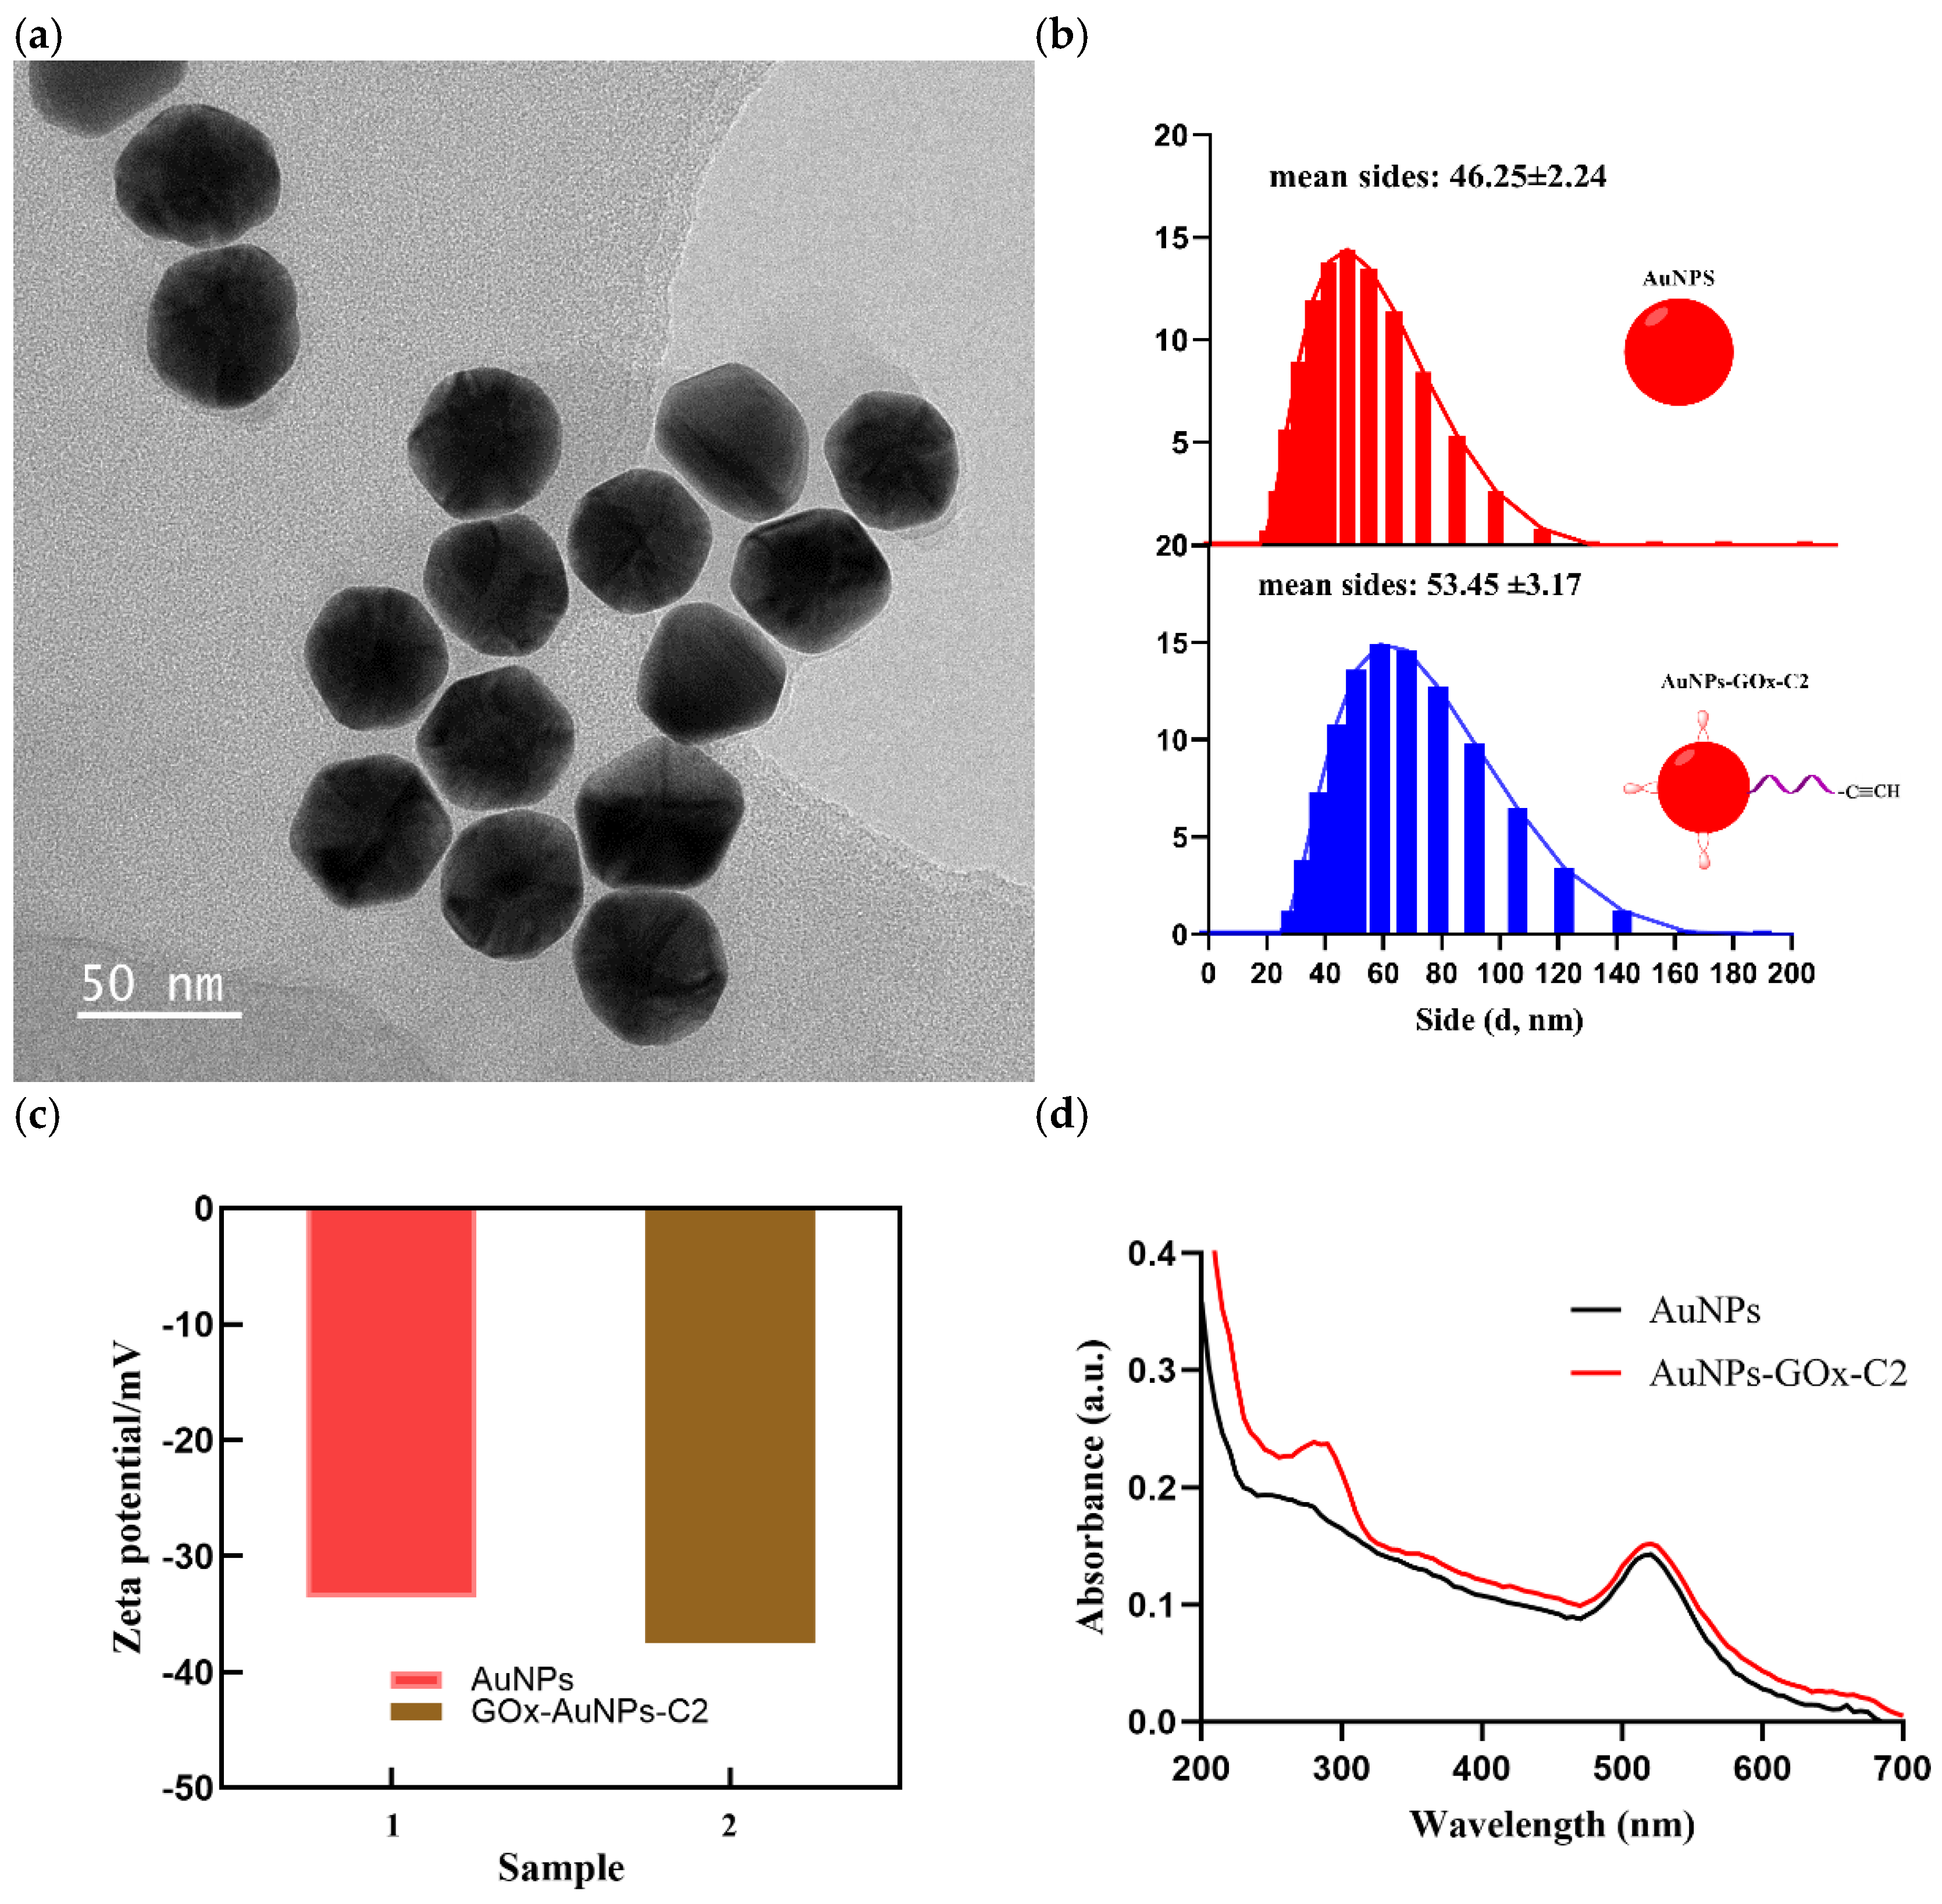
Figure 4.
PGM readout signals toward different components: (a) Glu, (b) MNPs-NH2-C1+Glu, (c) MNPs-NH2-C1+ AuNPs-GOx-C2+Glu, (d) MNPs-NH2-C1+ AuNPs-GOx-C2+Cu2+ (0.1 μmol /L) +Glu, (e) MNPs-NH2-C1+ AuNPs-GOx-C2+ Cu2+ (1 μmol /L) +Glu.
Figure 4.
PGM readout signals toward different components: (a) Glu, (b) MNPs-NH2-C1+Glu, (c) MNPs-NH2-C1+ AuNPs-GOx-C2+Glu, (d) MNPs-NH2-C1+ AuNPs-GOx-C2+Cu2+ (0.1 μmol /L) +Glu, (e) MNPs-NH2-C1+ AuNPs-GOx-C2+ Cu2+ (1 μmol /L) +Glu.
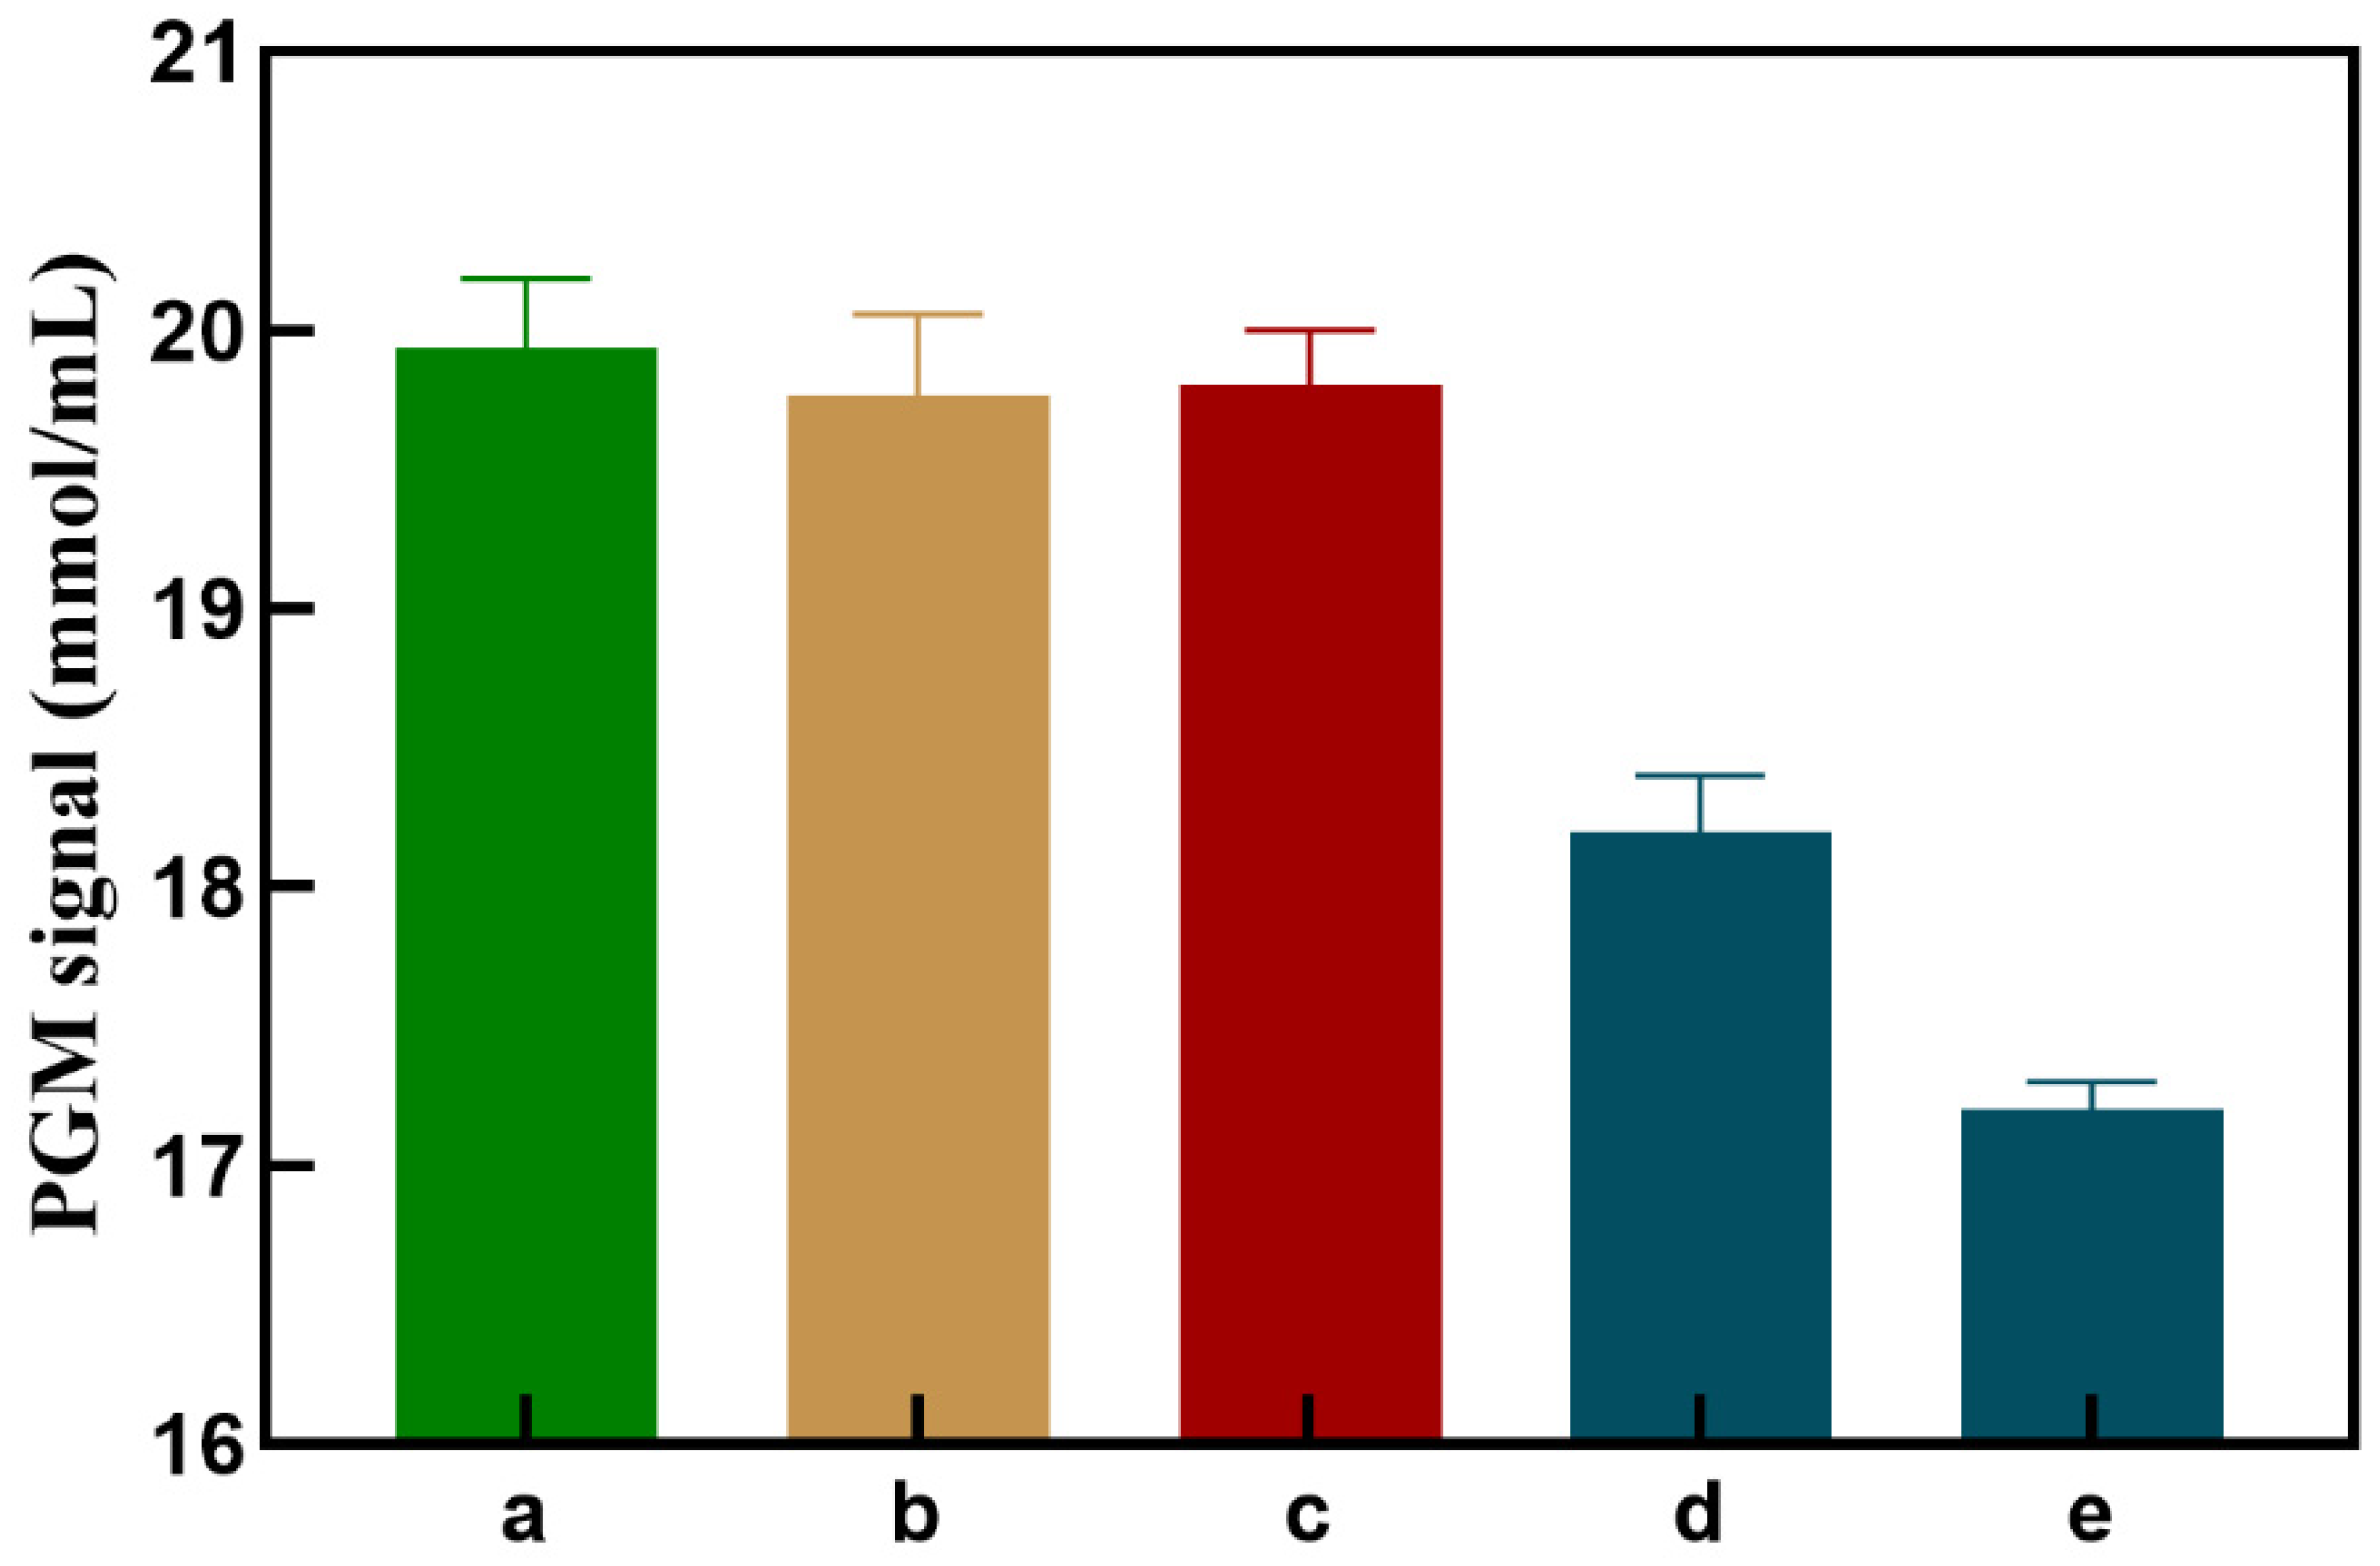
Figure 5.
Effect of (a) volume ratio of C2 and GOx, (b) concentration of sodium ascorbate, (c) concentration of THPTA, (d) pH value, (e) click reaction time, and (f) Glu hydrolytic time. The error bar shows the standard deviation (n = 3).
Figure 5.
Effect of (a) volume ratio of C2 and GOx, (b) concentration of sodium ascorbate, (c) concentration of THPTA, (d) pH value, (e) click reaction time, and (f) Glu hydrolytic time. The error bar shows the standard deviation (n = 3).
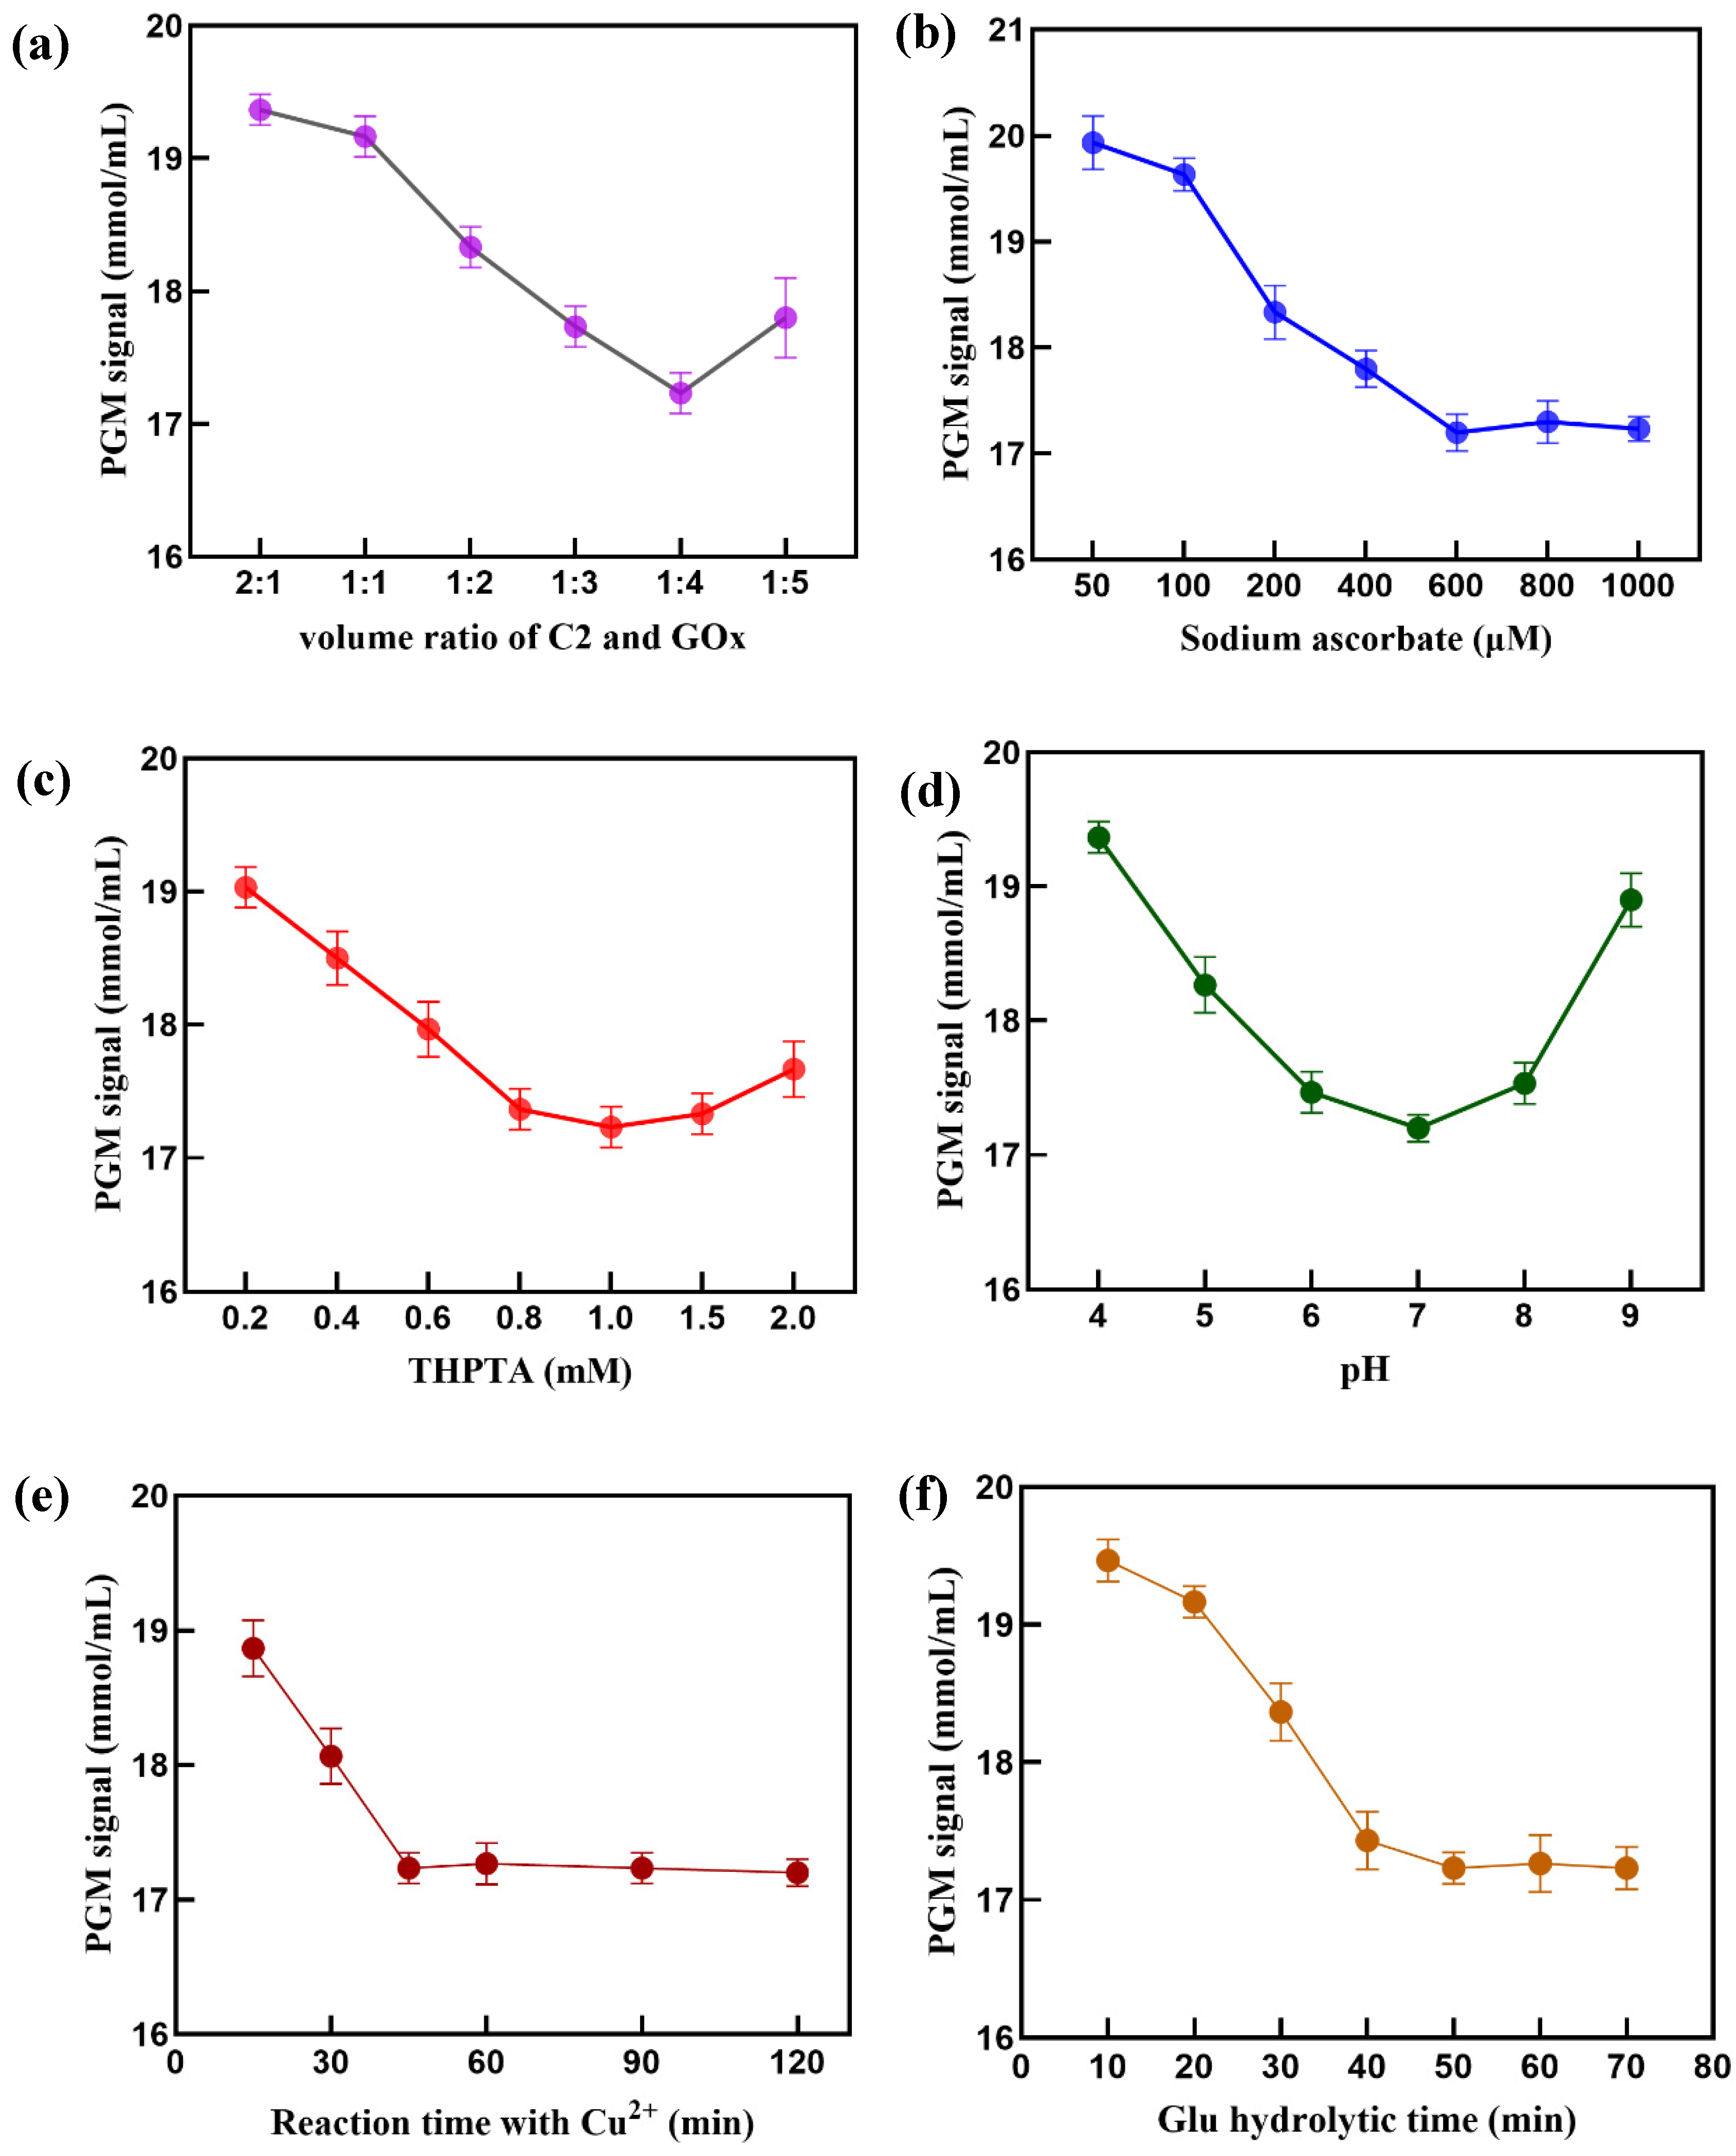
Figure 6.
(a) Linear calibration curve for detection of Cu2+; (b) Specificity test result, 1 μmol /L Cu2+, 1 μmol /L of Zn²⁺, Pb²⁺, Fe²⁺, Mg²⁺, Ca²⁺, Ba²⁺ and Cd²⁺ respectively.
Figure 6.
(a) Linear calibration curve for detection of Cu2+; (b) Specificity test result, 1 μmol /L Cu2+, 1 μmol /L of Zn²⁺, Pb²⁺, Fe²⁺, Mg²⁺, Ca²⁺, Ba²⁺ and Cd²⁺ respectively.
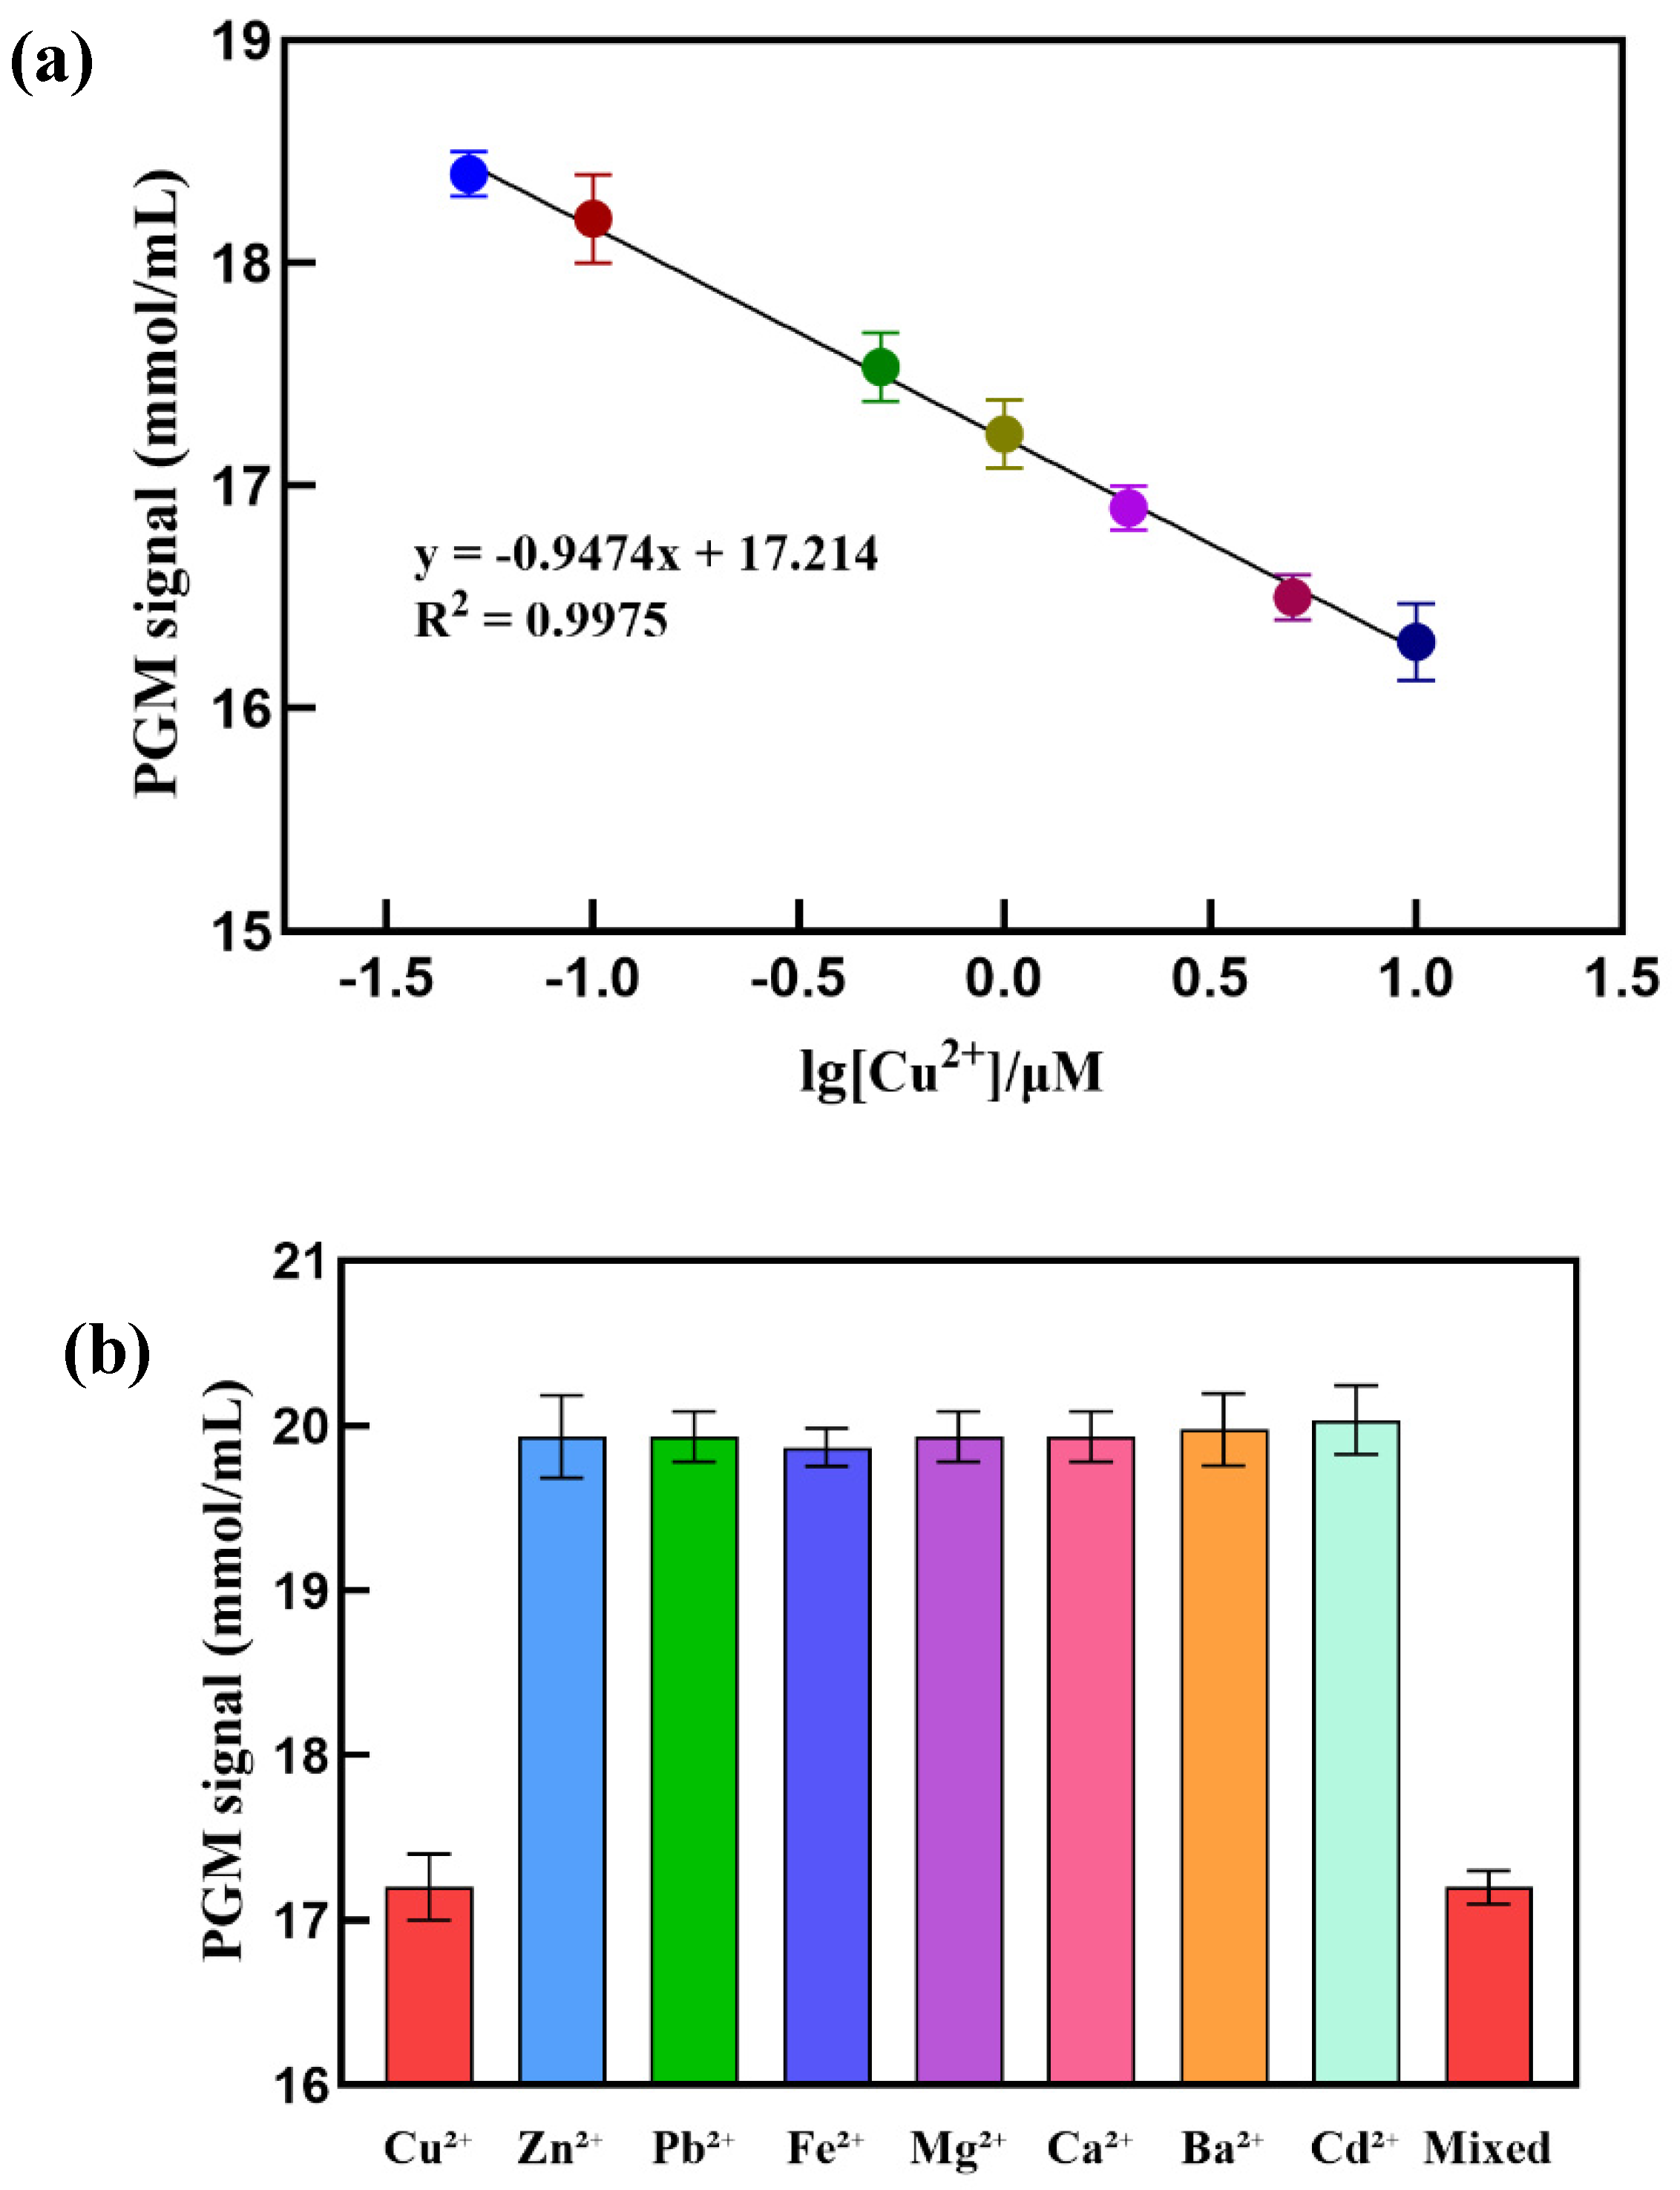

Table 1.
Comparison of different sensing methods for detection of Cu2+.
| Method | Linear range | Detection limit | Ref. |
|---|---|---|---|
| Colorimetric | 0.5–10 μmol/L | 0.25 μmol/L | [34] |
| Colorimetric | 20–60 μmol/L | 0.43 μmol/L | [37] |
| Fluorescent | 0.1–10 μmol/L | 0.058 μmol/L | [38] |
| Fluorescence | 1-100 μmol/L | 0.329 μmol/L | [39] |
| Chemiluminescence | 1–50 μmol/L | 0.619 μmol/L | [40] |
| Chemiluminescence | 0.15–7.8 μmol/L | 31.5 μmol/L | [41] |
| Chemiluminescence | 0.12–900 μmol/L | 100 μmol/L | [42] |
| Glycemic analysis | 0.05 – 10.00 μmol/L | 0.03 μmol/L | This work |
Table 2.
Determination results of Cu²⁺ in tap water samples.
| Sample No. | Added/123456(μmol /L) | Found/123456(μmol /L) | Recovery (%) | RSD (%) |
|---|---|---|---|---|
| 1 | 0 | 0 | — | — |
| 2 | 0.1 | 0.09 | 92.30 | 0.24 |
| 3 | 1 | 1.06 | 105.51 | 0.24 |
| 4 | 5 | 4.86 | 97.10 | 0.14 |
| 5 | 10 | 11.33 | 113.33 | 0.34 |
Disclaimer/Publisher’s Note: The statements, opinions and data contained in all publications are solely those of the individual author(s) and contributor(s) and not of MDPI and/or the editor(s). MDPI and/or the editor(s) disclaim responsibility for any injury to people or property resulting from any ideas, methods, instructions or products referred to in the content. |
© 2024 by the authors. Licensee MDPI, Basel, Switzerland. This article is an open access article distributed under the terms and conditions of the Creative Commons Attribution (CC BY) license (http://creativecommons.org/licenses/by/4.0/).
Copyright: This open access article is published under a Creative Commons CC BY 4.0 license, which permit the free download, distribution, and reuse, provided that the author and preprint are cited in any reuse.


